caste, ethnicity and exclusion in south asia: the...
TRANSCRIPT

United Nations Development Programme Human Development Report Office OCCASIONAL PAPER Background paper for HDR 2004
Caste, Ethnicity and Exclusion in South Asia: The Role of
Affirmative Action Policies in Building Inclusive Societies DL Sheth
2004/13
1
UN/HDR 2004: Final Draft [Regional Paper]
Caste, Ethnicity and Exclusion in South Asia: The Role of Affirmative Action Policies in Building Inclusive Societies
Contents Page No.
I: The Caste-ethnic Dimension of Exclusion 1-13
II: Nation-building as a Model of Social Inclusion 14-32
III: Affirmative Action: The South Asian Context 32-35
IV: Affirmative Action in India 36-45
V: Performance and Outcomes of the Policy 46-53
TABLES: PART I: (Tables 1 to 6) GENERAL TABLES: CONTEXT FOR THE
POLICY
54-59
PART II: (Tables 1 to 15) RECORD OF PERFORMANCE OF AFFIRMATIVE ACTION POLICY: GOVERNMENT SERVICES, PUBLIC SECTOR UNDERTAKINGS, DEFENCE SERVICES, EDUCATIONAL INSTITUTIONS etc.
60-70
PART III: (Tables 1 to 9) IMPACT ON EDUCATION 71-76
Part IV: (Tables 1 to 2) Impact ON UNEMPLOYMENT 77PART V: (Tables 1 to 9) IMPACT ON POVERTY
78-84
PART VI (1 to 10) CRIME AND VIOLENCE (ATROCITIES) AGAINST SCs & STs
85-94
PART VI—Table 11: Summary of Digest of Newspaper-reported Atrocities against Dalits (July-December 2002)
95-98
PART VII: (Tables 1 to 2) IMPACT: SOCIAL-STRUCTURAL CHANGE 99-101
PART VIII: (Table 1 to 6) AFFIRMATIVE ACTION IN PAKISTAN 102-104
Bibliography 105-109

2
UN/HDR 2004: Final Draft [Regional Paper]
Caste, Ethnicity and Exclusion in South Asia: The Role of Affirmative Action Policies in Building Inclusive Societies
D.L. Sheth
The kind of social inequality and exclusion that exists in different South Asian societies,
exhibits some common cultural and social structural characteristics, in some respects
quite distinct from many other societies in the world. The distinctiveness is on account of
the stratificatory system of caste that prevailed, in one form or the other, in these societies
for centuries. Despite some basic differences in the political and religious organization of
these societies, caste or caste-like institutional practices survive in them even today—in
diluted or even transmuted form in some, while manifesting greater continuity in
others—with their corresponding structures of social exclusion.
I
The Caste-ethnic Dimension of Exclusion
Caste is the most intensively and widely studied South Asian institution and there
is no need to reiterate the established wisdom here. I however wish to focus on, rather
attempt to reformulate, some propositions on caste in terms that can facilitate a more
direct and precise understanding of the contemporary structures of social exclusion in
South Asia, the structures which indeed have emerged from the core of the caste system.

3
First, from the perspective of social exclusion caste can be seen, more
appropriately, as the institution that has been structuring and maintaining for centuries
relations of power among different communities, and seeks to legitimise these power
relations: (a) through systematically dispensing various mixes of economic and cultural
assets/opportunities and deprivations to different communities and (b) through endowing
religious/ideological sanctification of such dispensations. Second, the hierarchical
structures based on a sacrilized system dispensing economic/cultural rewards and
punishments, however, did not/could not permanently and fully incorporate or recast the
cultural and historical identities of different communities in terms of hierarchical
relations. In sum, if we were to grasp the special nature of exclusion in the South Asian
societies, it is appropriate that caste is seen in terms of its historical-empirical character:
i.e. sacralized power structure—rather than just a hierarchy of statuses—that has been
reproducing itself in different contexts and times in the various South Asian societies.
Caste: A Self-reproducing Power Structure
Evolved over centuries, caste sustained communitarian identities of innumerable groups
ethnically, culturally and socially distinct from each other and at the same time, held
these communities together in a vast network of local hierarchies. Communities in
different local hierarchies were arranged, normatively uniformly, in an ascriptively
unequal macro-system of graded exclusion, which was politically, economically and
epistemically dominated by a few, select communities through ages. The graded structure
of exclusion was never a permanently fixed arrangement, and a fairly frequent upward
and downward movement of communities took place within and across local hierarchies.

4
However, a large divide always existed between communities in the small ruling sector
(the dvijas or the twice born) which among themselves held virtual monopoly of different
types of power (intellectual, political and economic) and a vast sector of the numerous
other communities ascriptively expected to engage directly in production and service
related activities (the sudras). A third and a relatively smaller sector of communities (of
the excluded others: a varna) developed over time at system’s periphery as a
consequence of persistent enforcement of the principle of graded exclusion by the ruling
communities. For these communities of the third sector, the system functioning on the
principle of graded exclusion produced a situation of an all round, permanent exclusion.
They were never formally recognized as a part of the system. As such, they were not
assigned any specifically defined role or work in the system’s production and service
domains nor in any other domain—thus depriving them of any means of
livelihood.[Ambedkar] This systemic deprivation of livelihood accompanied by the
social, cultural and moral exclusion of these communities forced them to live in a
perpetual situation of economic and moral compulsion and ‘adopt’ means of livelihood
involving work that was discarded as ‘unclean’ and degrading by the communities whom
the system granted one or the other entitlement, ensuring them some kind of a right to
work.[Ref] These communities of the third sector being ousted even from graded
exclusion, remained permanently degraded, leaving them, unlike the other communities,
little or no scope for upward mobility.[Srinivas]
The intriguing question is how the caste character of exclusion—a hegemony of a
few traditionally empowered communities based on graded exclusion, over the rest of the
society—has survived in the South Asian societies in one form or the other, despite the
5
fundamental ideological and structural changes that have occurred over a long period
through the spread of religions like Islam and Christianity as well as of modern secular
and egalitarian ideologies, all opposed to the very idea of hierarchy based on inherited
statuses. Even more intriguing is the fact that such hegemony survived for so long with
consent and collaboration of the subjugated communities. It is therefore not possible to
problematize contemporary situations of inequality and exclusion in South Asian
societies and evolve any agenda (policies and politics) for making these societies
progressively inclusive, unless we take account of these long surviving, highly adaptive
and hence resilient structures of exclusion.
Two Faces of Caste
Two commonly misconceived notions of caste held by policy-makers and often even by
the analysts, come in the way of understanding its resilient and adaptive nature: first, that
caste is a permanently fixed hierarchy of hereditary groups, second that a caste derives its
identity almost exclusively from the status it has in the hierarchy. In fact caste has
another face which is often shrouded in theory, i.e. of a community. It is important to
elaborate and clarify here these two rather different existences of caste—the hierarchical
and communitarian—in order that we understand why caste has remained the most
resilient among the stratificatory structures.
1. Caste as a hierarchy of statuses
Seen in a historical perspective caste, or a caste-like structure, is a hierarchy of
social forms within which concretely existing groups hold statuses, but from which they
may move out and occupy other statuses. Thus the actual groups to which statuses are

6
attached have always moved up and down in the hierarchies, in which process a group
could detach itself from a given (born in) status and credibly adopt another higher status
or may get pushed to a lower one. Thus when a group moves in the hierarchy, from one
status to another, it inheres the power and privilege (or lack of it) of the status it enters. In
this sense power and privileges are structurally tied to a status and not necessarily to a
specific hereditary group. It is by resolutely sticking to certain statuses that historically a
few groups traditionally representing epistemic, political/military and economic power
have been able to dominate the entire system and maintain a degree of legitimacy of their
power. This relationship between the group/community and status is although sustained
by the ideology of hereditary virtues fixing permanent ritual distances among groups,
historically there have been continuous countervailing movements to caste, which
periodically resulted in several groups moving out of their born-in statuses and getting
into new statuses. In the past the movements like Jainism, Buddhism, Tantricism and
Bhakti caused such reshuffling of groups across statuses, in the ongoing hierarchal
system. Yet, despite formidable ideological challenges and some structural impacts they
made on it, by and large, traditionally dominating groups retained power in the system,
usually by redefining, often relaxing the rules which maintained ritual distances and
prevented choices. But it is only in the modern times that both ideological and structural
challenges have converged, with implications for imploding the old hierarchical structure.
These changes have, however, yet not appreciably reduced the power of the old status
groups in the society. They have only made it unnecessary for the ruling status-groups to
sustain and justify their claims to power in ritual or ascriptive terms; insofar as the
7
intrinsic value of status survives in the society, the traditional status-groups can discard
the old ideological terms and use new ones for validating their continuing status-power.
2. Caste as a network of ethnic communities
It is important to note that even in the traditional hierarchy-determined system of
social hegemony the included and excluded communities did not exist in a bi-polar
structure of power. The graded structure of exclusion also linked communities to each
other in such a manner that caste could also be seen as a graded structure of inclusion in
which power percolated to every community irrespective of its location in the hierarchy.
This caused each community experience a sense of social salience in the system. Put in
more concrete terms, despite being tied in a structure of hierarchy a community at each
level, except probably at the bottom most level, enjoyed a degree of dominance over
some others below it. The dominance was however maintained not just through exercise
of power but also by a system of mutual obligation and dependence among the
communities. While this system never pretended to establish one, culturally homogenized
political community it did sustain a common symbolic meaning system making
communications possible across types of communities (representing denominational,
ethnic, linguistic, and occupational-cultural differences) and levels of hierarchy. No
community had a cultural identity autonomous of the other, it was always expressed in
relational terms, where a particular identity could not be self-perceived or perceived by
others in terms independent and underivable from those defining the systemic whole.
It will thus be an overly simplified view of the traditional caste system, if it holds
that in it the distinct and hierarchically ordered communities lived a completely localized
existence and had their identities constituted by statuses they occupied. In the system of

8
graded dominance no community, not even the one at the top, enjoyed absolute power.
Each dominating group was entitled to only one type (intellectual or political or
economic) power, which again percolated downward to other similar communities. This
allowed many communities, despite hierarchical differences, to interact with each other
in horizontal spaces marked by a degree of mutuality and cooperation among them. In
this system of hierarchy each community was simultaneously a status group and an
autonomous community in its own right. A community also developed some kind of a
social capital for itself, ironically, through performing specific roles and developing
specialized skills and crafts assigned to it in the hierarchy. But this contributed also to the
growth of social assets for the community and imparted it with some specially
identifiable psycho-cultural characteristics. These characteristics and assets cumulatively
formed a basis of a cultural recognition of the community—often in terms independent of
its status in the social hierarchy—and of its social mobility. All this allowed/encouraged
every community, irrespective of its location in the hierarchy, to construct its special
‘history’ and build legends justifying its autonomous existence in a non-hierarchical,
horizontal space and the place of pride it held in the society.
A community also maintained a degree of political and social governance for
itself, and evolved mechanisms and procedures for settlements of disputes within it and
of resolving conflicts vis-à-vis the other communities. The political authority of the state
wherever and in whatever form it existed (King, an oligarchy, ruling council, a
panchayat) was usually negatively defined as the one charged with preventing major
transgressions or defiance of the generally and conventionally recognized social and
economic codes of the system as a whole. It also sought to prevent the use of raw power

9
or unsanctioned dominance by one community over the other. In short, operating within
the rules of an ascriptively ordered hierarchy, (rather by constantly bending these rules)
the communities were able to find large social and economic spaces, and acquire
distinctive cultural identities for themselves.
To conclude, in this hierarchically ordered world of communities, contrary to
common belief, no community was expected to live, or really lived, with a hierarchically
defined (caste) unidimensional identity. Probably that made it possible for the system to
constantly accommodate immigrant and invading ethnic groups as well as the ever arising
new occupational groups, in the system’s flexible hierarchy. It even made possible for
some of them to move vertically upward in the hierarchy and be structurally a part of the
ruling status groups. To put it differently, the communities did not live in a prison house
of identities; just as they detached and reattached themselves with statuses, they also
discarded the old and donned new identities, through their movements in time and space.
The Colonial Caste
Along with being simultaneously caste-hierarchical and multi-ethnic, the South Asian
societies shared in common two other historically interrelated conditions: the colonial
past and the modernity sponsored by the colonial regime and processed through the
ideological and institutional structures of colonialism.
This dialectic between the hierarchically ordered multi-ethnic society and colonial
modernity sustained and even further developed the caste-like features of exclusion in
these societies, which were only partially blunted or mitigated by the ongoing processes
of urbanization and industrialization.[Susan Bayly] Even the religious and political
10
differences which eventually led to formation of different types of states in these
societies, did not affect the nature of exclusion they shared among them.
The structure of exclusion that developed during the colonial rule in the South
Asian societies had the following common features.
1. A small middle class whose members were almost exclusively drawn from
communities occupying higher statuses (the dvijas) in the traditional caste/feudal
hierarchies, but had acquired (mainly by virtue of their inherited statuses) modern
(English) education and “family traditions” of serving in (colonial) Government
administration, the military, or of owning large businesses and/or lands or
following modern professions.[B.B. Misra] They usually, but not necessarily,
belonged to a homogenous and empowered linguistic group but invariably had
English as their second, if not first, language. The class remained culturally
exclusionary and socially stagnant; the members of the erstwhile non-dvija
communities could rarely enter it.[A.R. Desai]
2. A vast majority of the socially and culturally subordinated population of the
ethnically diverse agricultural and artisan communities occupying lower and
subaltern statuses in the traditional caste/feudal hierarchies and whose members
were engaged in agricultural labour, in skilled and semi-skilled jobs and some at
lower-level jobs in military and Government administration.[Galanter] They
remained systematically unexposed to modern English education and usually
belonged to a majority language group in the society. The colonial regime
enumerated, classified and characterized these communities in a variety of ways,
affording them a self-perception of an “oppressed majority”.[G. Omvett]

11
3. A demographically dispersed minority consisting of numerically smaller
communities of the excluded and culturally deprived people. They belonged to
communities that were traditionally confined to the peripheries of these societies
and were now officially enumerated and classified by the colonial regime as
nomadic tribes, criminal tribes, the hill tribes, the untouchable communities of
scavengers, leather workers and groups of weavers etc. Members of these
communities remained far removed from modern education and were generally
denied any cultural opportunity to access modernity and its institutional
advantages. Members of these communities were engaged in different types of
low paid or sometimes even unpaid (forced labour) works, such as scavenging,
skinning and tanning of leather, landless labour, manual and unskilled jobs. In
short, members of these communities remained systematically confined to such
works when the society as a whole was experiencing significant degrees of
modernization and industrialization, all on account of their traditional social and
cultural exclusion.[Ambedkar]
This aspect of the exclusionary structures in South Asia has lent a distinct
character to poverty in the region: where social segregation and cultural
deprivation is a cause of poverty and not its consequence, with the result that
poverty has remained systematically confined for centuries to certain social
groups. Its occurrence is not random.

12
The in Post-Colonial Caste: Emergence of Ethno-Political Dimensions
Decolonisation radically changed the context in which the above structure of exclusion
had survived in the South Asian societies. It created such moral, ideological and
structural compulsions for the traditionally dominant groups that they could not have
maintained their power in the society and the political hold they had acquired over the
new independent states by insisting on maintaining the social-cultural status quo and not
address conditions of social inequality and cultural divisiveness in their societies. In fact,
decolonisation that came after decades of modernization and social and political
movements of the oppressed had already caused pervasive refutation of the ideology of
(caste) exclusion and loosening of the hierarchical structures. The changes produced
some direct consequences for the caste-colonial structures of exclusion.[Omvett, Gail.]
First, the ruling elites still consisting of the traditionally dominant communities
but now also wielding the state power, could no longer depend or take for granted their
inherited statuses, as a permanent resource for legitimating their rule. The continuation of
rule by these elites in the modern, independent state required that they monopolize the
means of accessing modernity (esp. through designing for this purpose the educational
and language policies) and receive at the same time support from a large number of
people (the ‘oppressed majority’) in the society; irrespective of the fact whether that state
was democratic or not. Of course, if it were a democratic state—where peoples’ consent
to their rule was mandatory and required to be regularly obtained—it became necessary
for the ruling elites to incorporate/co-opt in significant numbers members of the hitherto
subordinated communities into the power structure. In any event the logic of the modern
state, democratic or otherwise, required that the rulers practised such politics and devised

13
the policies that kept the people on their side, at the least checked the resentment and
dissatisfaction that inevitably grew on account of the rising aspirations among them.
Second, the vast number of agricultural and artisan communities traditionally
occupying subaltern statuses had not just become aware but were keen to assert their
new, collective political identity of “oppressed people” consisting a numerical majority.
Released from the acuteness of hierarchical pressures they, on the one hand, had
recovered and begun to assert their separate caste-community based identities (often
competing and conflicting among themselves in the social and economic realms) and, on
the other, find or create any occasion to forging larger multi-caste, ethno-political
conglomerations (e.g., the ‘dalits’, the ‘backward castes’ etc.) and assert their numerical
power in politics. In any event, this large mass of people, acutely aware of its new
political value, became the most coveted political object of appeasement as well as of
manipulation even as it became available for all manners of campaigns for social and
political mobilization. It became increasingly difficult for the ruling elites to act in pure
self-interest in politics. They could not formulate any new social and cultural policies or
launch mobilizational campaigns to demonstrate a majority support to such policies or a
‘cause’, without taking interest of these various conglomerations of communities into
account, even if such acts sometimes went against the ruling elites’ own perceived
interests. In short, after decolonisation the erstwhile subordinated communities in a South
Asian society although remained economically poor, became politically empowered
people, without whose support the ruling elite (even a dictatorship) could not feel
confident about its power.

14
Third, although constituting a substantial mass of multi-caste conglomerate the
socially excluded and culturally deprived communities of the third sector (the dalits) did
not really experience the moment of decolonisation. Their dispersed demography made
that all the more difficult for them. With the withdrawal of the colonial regime they now
came under direct pressure of the ruling elites and other dominant communities, and were
induced to accept their leadership in politics. Besides their traditional exclusion their
smaller numbers and dispersed demography prevented them from organizing themselves
politically effectively. They could participate in politics under patronage of the upper-
status groups, and their representation in power became possible usually by proxy—
assumed by or given to the rulers.
In some South Asian societies where the state was not democratic and had itself
donned a religious-nationalist identity, either suppressed or made invisible the cultural
identities of excluded communities. In the democratic states, although these communities
were enumerated and classified for receiving benefits of policies like affirmative action,
they for a long time, i.e. until they acquired political salience of their own through
aggressive and organized participation in politics, had to remain reconciled to the politics
of proxy and patronage. Even when they acquired political salience and began to assert
their rights and cultural identities, they often got into conflicts and met with violence
from dominant communities.

15
II
Nation-building as a Model of Social Inclusion
It was in response to this radically changed social and political context that the new
ruling elites in the South Asian societies were virtually compelled to create a much wider
base for renewal and acceptance of their rule in the society. Even a more compelling
reason was the challenge, rather an impending crisis,[Ref. Huntington] that the new states
faced soon after decolonisation, threatening stability, and for some even their existence.
This was the crisis created by relentless, violent conflicts among the various ethno-
religious and ethno-linguistic communities that, released from the hierarchical pressures
and the colonial political management, were now competing for power. Faced with this
situation the leadership of the new states now increasingly ceased to see diversity as a
way of life to be celebrated; they rather saw it as a source of religious, linguistic and
ethnic strife.
Seen in the above context it is not surprising that the leadership of different South
Asian societies saw in the model of ‘nation-building’ a panacea for all their problems. It
provided a modern ideological basis for unification of their population into a national
society and for their new states to acquire a national identity—an identity overriding all
other identities in the society.
There, obviously was no question of choosing this model; it was a model given to
all new, decolonised societies. For, as the then prevailing global political wisdom had it:
a post-colonial modern state was incomplete, both in its nationhood and modernity, until
it became a national state, in the European mould.[Sheth] The idea of building a nation,
was also upheld as an ultimate goal to be achieved by the freedom movements in the
16
South Asian societies. It had become an object of popular aspiration whose realisation
was seen as synonymous with achieving Independence. But after Independence the ruling
elites in these societies needed this idea even more desperately than they probably did
during their Independence movements; they saw in it a great potential for eliciting
support of the new majority of the subalterns, to their rule.
The leadership of the new states, thus posited nation-building as an overall goal of
the state policies and of making their societies egalitarian and inclusive. It was seen as a
‘continuous process’ of mobilization that would keep a majority of the people politically
involved, hopefully, without threatening the stability of their own rule—even in a
democracy. At a more general level, the model was seen as a paradigm of social
transformation. It was expected to detach vast populations of these ‘traditional’ societies
from their segmented, parochial milieus and induce them, through process of massive
political and social mobilization, to enter as ‘one people’ the new world of modern
governance (of a democratic nation-state), and technologically empowered
economy.[Karl Deutsch, et. al.] This process was visualized to be initiated through
policies of the state, and sustained through mobilizational politics in the society. It held
special attraction for the ascriptively iniquitous and now ‘conflict-ridden’ South Asian
societies, for it was expected to demolish the barriers dividing the communities, and
include them all in the new homogenous whole of a national society. It was further
expected that through this process their unstable states will acquire a unified cultural
basis for their rule in the society.[Gellner]

17
South Asian Nation-building: A Model of Inclusion or Exclusion?
Working under historical and cultural conditions radically different from those which
gave rise to nation-states in Europe, the South Asian countries found the task of building
an inclusive national society and retain at the same time the autonomy and neutrality of
the state—crucial, among other things, for protecting cultural identities and rights of
minorities—not just difficult but almost an insurmountable task. In the course of coping
with this dilemma two different approaches to nation-building emerged: Nation-building
through (a) ethno-majoritarian state or (b) through ethno-neutral state.
Pakistan and Bangladesh: Following the first approach the leadership of some countries soon yielded to the
temptation of seeking popular support to their newly created regimes by politically
catering to the majoritarian ethno-religious sentiments and ended up by aligning their
states with an ethno-religious identity. This became evident in Pakistan, when the ruling
elites ignoring the wishes and advice of its founder, kept on with the old politics of ethno-
religious mass mobilization and ended up making Pakistan an Islamic nation-state. Such
politics of building an ethno-religiously inclusive and homogenous national society, in
fact, produced negative, exclusionary consequences. First, it resulted in severe
discrimination of the miniscule religious minorities, especially of Hindus and Christians
(whatever numbers that survived after the Partition) resulting into suppression of their
political rights and cultural identities. [Ref.] Second, perhaps because of negligible
presence of the non-Muslim minorities in the country new minorities began to be
identified and targeted from the old, and original majority in whose name the homeland
of Pakistan was created. [Nandy, A] The Ahmedis and the Mohajirs. This has unleashed

18
what looks like a continuous process of minoritization [Gupta] of sections of people who
initially belonged to the majority. The provincial majorities now began to emerge as new
minorities on the basis of ethno-linguistic identification (e.g. the Sindhis) as also the
denominational divisions (e.g. the Shias). Decades latter, East Pakistan whose population
constituted a majority of the Pakistanis at the national level, but was ethno-linguistically
different (Bengali), territorially separated and politically dominated, began to defy its
Islamic (religious) nationhood and assert its Bangla national (linguistic) identity. The
result was creation of another Muslim-majority state in the region, but founded on the
principle of ethno-linguistic nationhood.
Soon after its separation from Pakistan, the leadership that had led the ethno-
linguistic national movement for Independence of Bangla Desh was brutally removed
from power by a militant Islamist faction of the movement, claiming to represent the
‘oppressed majority’ of the Muslim Bangladeshis.[Ref.] This unleashed a high-intensity
politics of mass mobilization resulting in Islam becoming formally and constitutionally
the religion of the state and the defining feature of its national identity. The result has
been suppression of political rights and cultural identities of the Hindu, Chakma and Garo
minorities of Bangla Desh.[Mohsin] In sum, the state in these countries could not retain
its autonomy and neutrality in the process of creating a ‘nation’ as it was increasingly
seen in majoritarian cultural or religious terms. The consequence of all this has been
severe social and cultural exclusion of minorities.
The lesson to draw from the nation-building experience of Pakistan and
Bangladesh: once the state aligned itself to either a cultural or religious majority it could
sustain itself only by subjugation, even disenfranchisement and expulsion of the cultural

19
minorities however defined—in religious, linguistic or ethnic terms. Pursuit of such
policies and politics, by the ethno-cultural state could even lead to its own decapitation
when a territorially based and numerically strong ethnicity suffering exclusion asserts its
‘nationhood’ and eventually demand a separate state for itself. [I shall not elaborate any
further on the kind of policies and politics the ethno-religious states in these countries
have promoted, and their impact for the cultural and political survival of the minorities,
as this theme is to be dealt in another HDR paper.] With respect to the role of policies, it
is sufficient at this point to make a broad inference: the policies of affirmative action
designed to enable equal participation and cultural identities of the minorities are not
integral to the nation-building design of an ethno-majoritarian state. Whenever they
promulgate affirmative action kind of policies, which they indeed do in some specific
contexts, the policies almost invariably result in benefiting members of the ethno-
religious majority. Occasionally, when genuine efforts are made to reach out to the non-
religiously defined communities (linguistic of regional minorities) the policies meet with
stiff, often even violent opposition from members of the elite (themselves the ideologues
of the ethno-religious state) making them (the policies) virtually defunct and unworkable
in practice.
Sri Lanka and India:
The countries that adopted the second approach to nation-building in South Asia,
i.e. of establishing and maintaining an ethno-neutral state as an agency for national
integration and economic development, found the task even more challenging. The first
and foremost challenge, rather a nightmare, the leadership of these countries faced was to
cope with the ever present possibility of the politically awakened, but culturally insecure

20
and marginalized ethnic communities organizing themselves into an ethno-political
majority through movements of mass mobilization.
Second, the ethno-neutral identity the leadership of these countries gave to their
new states was conceived as being integral to the democratic state. This meant that the
mobilizational politics would proceed, and in fact it did, on pre-existing lines of ethnicity
in these societies. In fact collective pursuits of power by the politically organized
caste/ethnic communities became a permanent feature of competitive-representative
politics, especially of the party system in these countries. At one level, such caste/ethnic
politics are eminently manageable in a democracy but that requires a sustained process of
democratisation. By politicising the traditional caste/ethnic identities and organizations
democracy could transform (and, in fact, to a considerable extent it has) their socially and
culturally opaque character by making them responsive to growing secular aspirations of
their members. In this process, many such entities have forged in these countries larger
political-social coalitions with other castes and ethnicities, all together assuming broader
political-cultural identities. The result has been that the claim to power by these broad-
based caste-ethnic formations has become more credible and effective in larger politics.
At another level, however, the ethno-neutral democratic state in these countries lives with
a permanent threat that the process of forming larger, broad-based caste/ethnic political
organizations may give rise to ethno-religious nationalist backlash to what is perceived as
permissive minoritism, resulting into formation of an ethno-majoritarian state. (India, in
fact, is currently undergoing through such a phase of democratic politics.)
Third, the ruling elites of these newly independent countries (usually bearing the
caste-colonial character: traditionally upper-status, westernised—English educated and

21
politically liberal) faced a complex situation for themselves: balancing the need for
retaining their own power over the state and keeping their commitment to liberal
democratic values which involved progressive inclusion of the hitherto excluded
populous sections of the society into the power-structure of the independent democratic
state. In practice it meant keeping the ascendant subaltern ethnic majority (a potential
support for ethno-religious majoritarianism) politically constantly involved, but not
allowing it to become a serious contender to the state power which could happen if they
acquire ethno-religious identity. To put it differently, the success or failure of the ethno-
neutral democratic state for nation-building, as we shall see presently with the examples
of Sri Lanka and India, depended on the kind of policies and politics the ruling elites in
these countries initiated and sustained after Independence.
Sri Lanka: The Sri Lankan leadership (a small, top-level social coalition of the
upper status, urban, English educated and modernist Sinhalese and Tamil elites) whom
the power was transferred at Independence was committed to secular, democratic values
and had significant experience of democratic governance.[M.K. de-Silva] The colonial
regime, since as early as in 1931, had delegated administrative powers to the leaders
elected by universal suffrage. This leadership had by and large dispensed governance,
with considerable pragmatism and a sense of accommodation vis-à-vis different ethnic
communities, through several elections till Independence. It was itself committed to
liberal, democratic values and was constitutionally bound, not to allow any ethno-
religious considerations in the functioning of the government. Soon after independence
when the electorate became widely and nationally expanded, the political parties began to
mobilize their prospective supporters by appealing to the ethnic-majoritarian sentiments
22
and aspirations of the Buddhist-Sinhalese majority, which so far had remained dormant
but were now brought to the fore of Sri Lankan politics.
The ruling elite, divided in two major political parties (UNP & SLFP)[FN]
alternated in power from election to election. In this process they began to make what
then appeared to be symbolic, but “necessary” concessions to the emergent cultural
majority of the Sinhalese-Buddhists. Fortunately, this politics of symbolic appeasement
of the cultural majority[FN P. deSouze] did not come in their way of pursuing the social and
welfare policies they had initiated when they worked in colonial government in their
capacity of elected representatives or as bureaucrats. They not only remained committed
to these policies, but effectively implemented them by dispensing free universal
education, extensive health care, subsidies on food and public transport and so on. All
this brought about remarkable increases in literacy rates, reduction in infant mortality,
substantial improvement in life expectancy (the famous Physical Quality of Life (PQL)
index). The figures compared reasonably well with many European countries. The
policies embraced the entire population, even as the country registered a low level of per
capita income. This constitutionally established ethno-neutral welfare state functioning in
a multi-party system survived a military coup (in 1962) and a Leftist insurrection (in
1971).[Manor]
But all along, during this process, an undercurrent of ethnic-majoritarian
aspiration to acquire state power also survived. The Sinhalese-Buddhist masses saw
coming of Independence and of democracy, as the power of the state coming to them.
Thanks to increased material needs and aspirations—caused largely by the welfare and
other economic-distributive policies of the state—not backed by requisite economic

23
growth, seem to have contributed to an acute sense of relative deprivation among the
majority, which now saw itself as constituting ‘the nation’. They attributed their
condition of deprivation to not having the state-power that, they believed, was due to
them. They saw the Tamil-Sinhalese ruling coalition not only as a bunch of manipulators
of power but people who denied the (Sinhalese-Buddhist) national culture a place of
pride in their ‘own country’.[Ref.]
Although six parliamentary elections took place between 1956 and 1977, the
competing parties, the UNP and SLFP, led by the same class of elites divided on party
lines, now became increasingly inclined to respond to populist majoritarian demands. In
this process a kind of inter-party competitive majoritarianism took over the old self-
perceived politics of ‘responsible elitism’. In the absence of a well thought out positive
affirmative action policy, the political system could not gradualize, let alone diffuse,
what came as a sudden and massive incursion of raw majoritarian power into the
institutions of democratic governance, upsetting the normal democratic ethos of parties.
The social coalition of the Sinhalese-Tamil elites began to collapse with a section of
Sinhalese political elite shifting their allegiance, through successive elections, to the
growing Sinhalese-Buddhist majoritarian movement. This movement had begun in form
of pro-vernacular, anti-western protests against the use of English language in public
institutions and for restoration of indigenous Sri Lankan cultural values and
organizations, and, ironically, was then joined by some Tamil elites.[Manor] But during
the 1980’s the movement became a basis for cultural and political mobilization against
the Tamil minority, resulting in massive violent attacks on the Tamils. One such riot took

24
place even as back as in 1958, the ‘normal phase’ of electoral politics, but that was seen
more as an aberration than representing a trend.
Since the late 1970’s, however, periodic mass scale violence against the Tamil
minority almost became a means of expanding and consolidating the Sinhalese-Buddhist
majoritarian movement culminating in the most barbarous attacks of 1983, during which
elements within the state appeared to collaborate, more openly and directly than before,
with the perpetrators of violence, sabotaging all efforts and initiatives of the moderate
sections of the ruling Sinhalese elite keen to address the Tamil hurt and evolve a durable
accommodative political arrangement.[Manor] The formally and constitutionally
established state of Independent Sri Lanka which had its identity as a multi-ethnic secular
state, was altered by the successive constitutions of 1972 and 1978 which enjoined the
State to give prominence to Buddhism and to “protect and foster” the religion. But after
1983 anti-Tamil violence, Sri Lankan state seems to have become irreversibly an ethnic-
majoritarian state, where the Tamil minority will have to find its own political
arrangement within, more likely outside, the existing Sri Lankan state. In short, the
constitutionally altered state promulgated many educational, language and cultural
policies causing almost total alienation of the Tamils and severe exclusionary
consequences for the other smaller minorities. The worst outcome of this process has
been adoption of terrorism by the Tamil Elam movement as a means of establishing a
Tamil national state (the Tamil Elam). The inexorable logic of building ethno-national
state is least likely to end this mutually destructive ‘politics’ of ethnocide, even if the
Sinhalese and Tamils are separated in two different states; for in each state there still will

25
be significant numbers of the minority of the ‘others’, i.e. Sinhalese in the Tamil state and
vice versa.
To conclude, the Sri Lankan state which was constitutionally established as a
secular democratic state and whose leadership was committed to maintain the institution
of representative democracy and was oriented to human development kind of thinking in
devising its welfare policies could not withhold for long against the ethno-majoritarian
mobilizational pressures in politics. (Lessons for India?) This severe attenuation of ethno-
neutrality and autonomy of the Sri Lankan state took place, in my view, largely because
of the ruling elite’s inability to expand the power by devising social and cultural policies
of diffusion and inclusion of the rising subaltern majority. The consequences were: the
removal from power of the upper-status caste-colonial coalition of the ruling elite;
mobilizational inclusion of the upper as well as lower caste/classes as well as cooptation
of some smaller minorities in the expanding Sinhalese-Buddhist majority; ruthless
suppression of leftist insurrections and almost total alienation of the Tamil minority
taking recourse to violent means for having a separate state for itself, and severe neglect
of rights of some other minorities. Strange though it may seem, all this happened in the
process of the democratic welfarist state, building a nation for itself. The lesson to draw
from this experience: Even for a secular democratic state, with a territorially based ethno-
linguistic/religious minority, building of an inclusive national society requires that
special policies and programmes are evolved ensuring autonomy to such an ethnicity at
the regional level through federal arrangements of sharing power at the national level.
Even a more important lesson, as we shall see presently, the state must view the policy of
Affirmative Action as an anticipatory measure and implement it proactively in order to

26
ensure participation and share in the political and bureaucratic power by the culturally
deprived and socially excluded communities—these be the minorities or even a majority.
India: Unlike some other countries in the region, India chose not to adopt,
constitutionally and politically, a religion-based, majoritarian-ethnic state of the Hindus
(82 per cent), a Hindu rashtra, as a means of nation-building. The leadership of
independent India to whom the power was transferred (the upper-caste English educated,
liberal-modernist) rejected religion as the basis of either state formation or nation-
building. Instead, it chose to have a liberal, secular state governed by a democratic
Constitution and a nation conceived as a territorial-political community of citizens. In
effect, it legitimised and charged the agency of the state to build the nation premised on
political unity within which communities with diverse cultural identities could survive,
even flourish. It is in this context that the Constitution, departing from the textbook
definition of a uni-cultural nation-state, established both, the collective rights of
communities to maintaining cultural identities and to pursue religious freedoms and
individual rights of civil liberty to all citizens, as fundamental rights.
The Constitution thus not only explicitly rejected religion, language, or any other
ethnic criterion for creating and maintaining a political majority to ensure the stability
and legitimacy of the new state, it even ruled out federalism as a means of distributing
power among the ethno-linguistically-based territorial provinces. Instead, it mapped out
large multiethnic and multilingual provincial states as constituting political-
administrative units of a quasi-federal state, called the Union of India. Such non-
recognition of ethno-linguistic identities in governance, only five years after the
Constitution came in force, gave rise to strong and widespread movements demanding re-
27
organization of provincial states into ethno-linguistic states. The movements compelled
the central Government—despite the opposition of the ruling Congress party and
particularly of the Prime Minister Jawaharlal Nehru to this demand—to reorganize
provincial states on linguistic basis in the late 1950s and early 1960s. The ethno-linguistic
movements which were then seen as a threat to the idea of India as a homogenous nation-
state, were thus effectively dealt with, thanks to the open, competitive politics through
which the linguistic identities could articulate themselves and even change the ruling
elite’s idea of a unitary nation-state for India. By using a rather long-drawn democratic
institutional procedure of forming the commission for state reorganization, holding public
hearings and the ruling elites themselves taking electoral sense of the ‘popular mood’ the
policy of forming ethno-linguistic provincial states was adopted and implemented over a
decade.
Similarly, the problems of persistent social inequality and exclusion arising from
divisions based on caste hierarchy and ethnic identifications were redefined by the state,
in new non-ritual terms, i.e. such were seen divisions as constituting a problem for the
state of achieving political equality and social justice. This new discourse sustained by
democratic politics had many outcomes: (a) it prevented the emergent majority of the
populous, subaltern communities from aggregating and acquiring majoritarian political-
religious identity; (b) it brought the emergent caste and ethnic conflicts within the ambit
of social policies of the state and; (c) it encouraged and induced diverse and conflicting
communities to process their social and cultural problems through the open, competitive
politics of elections and parties. Thus, over time, thanks to the functioning of the ethno-
religiously autonomous and democratic state, the conflictual relations among
28
communities based on caste, ethnicity and language became integral to the normal
politics of multi-party, competitively representative democracy.
Thus, the Indian ruling elites conceived nation-building as a state-driven process,
through which it sought to bring about economic development, social transformation and
cultural integration of the country as a whole. In this pro-active process the leadership
saw the multi-ethnic character of the society as a passive cultural ‘context’; rather than it
representing any active principle that could interrogate even raise protest against the
ruling elite preference for the homogenizing model of national unity. The expectation
was that the universalization of citizenship rights and the induction of the cultural
pluralities into the democratic process of open and competitive politics would evolve
new, civic equations among ethnic communities and between them and the state. At the
same time, it was also expected that the cultural communities would, in the process of
nation-building, maintain their distinctive identities, even as their individual members
exercised their rights as citizens and, often even of exit from communitarian pressures.
This approach to nation-building has served India so far, reasonably well. Firstly,
it helped the Indian state in maintaining its integrity and the nation its inclusive, multi-
ethnic character. It on the whole, helped the state in managing ethnic conflicts arising
from conflicting claims to political power, made by various regional, linguistic, religious
and caste-oriented groups. And, at the same time, such pressures arising from democratic
politics has restrained the built-in tendency of the state to centralize power and
homogenize cultures. In responding to these pressures the Indian state has shown or has
been compelled to show, considerable flexibility; for example, by forming newer and
smaller states as well as autonomous state-councils in some tribal regions, by devising the
29
policy of affirmative action for communities of ex-untouchables, the tribals and the socially
and educationally backward classes (the political and social impacts of which we shall
discuss later), and lately by initiating the process of devolution of power to the provincial
states and, more importantly, to the village panchatyats. Thus, in practice, the state-centred
project of nation-building has all along been subjected to the dialectics of democratic
politics and social movements. It is through this process of nation-building that the
democratic and secular state has been linked to the idea of India as a multi-ethnic nation.
The model, however, has not been able to address effectively to the issue of ensuring
equal access to means of achieving social equality. Primarily because the ruling elite
(English-educated upper-caste) while found the promulgation of affirmative action
cognitively necessary and morally self-appeasing for inclusive nation-building, its
implementation, as we shall see later, always remained tardy and often even dishonest. This
bias showed in the elites not connecting affirmative action with other policies that were
theoretically conceived by them as a part of the larger vision of inclusive nation-building;
they responded by improvising such policy connections only when democratic pressures
threatening their rule were mounted through movements. For example the education
policies, despite laudable recommendations of many commissions has all along favoured the
urban, upper-caste English-educated sections of the population, enabling their social and
physical (international) mobility, but resulting in massive illiteracy for the members of the
poor, lower status communities. Massive financial allocations were made for higher
education, to which the poor did not have much access. This prevented them from
effectively availing the benefits of affirmative action. Similarly, it took decades and virulent
protests from linguistic minorities to achieve a degree of stability and consensus to evolve a

30
language policy that has now found a degree of consensus and stability. Yet, many problems
remain, which by and large are being dealt with through the process of democratic politics
and evolving federalism. (For data on language policy see Sheth, also Sumi Krishna.)
The model has also produced some negative consequences for national integration.
More specifically, it has all along failed to cope with the territorially based ethnic and ethno-
religious movements for political autonomy and separate nation-statehood in the border
regions of the North East and in the Kashmir valley. People in these regions have seen
mainly the coercive face of the Indian nation-state. Over time this has produced violent
ethnic conflicts and insurgencies often leading to expulsion, and even annihilation of
minorities from these areas by the militant ethnic movements. Unless radical modifications
and innovations are made by the ruling elites in the structure of governance (through
innovative federal arrangements) for these regions, making it responsive simultaneously to
ethnic and developmental aspirations of the people, the model’s claim to success (i.e.
inclusive nation-building) would remain suspect.
A more serious threat to this model has emerged in recent years, from the ethno-
religious majoritarian movement of Hindutva, a movement that has been kept at bay for
over half a century, among other things, by the affirmative action policies accompanied by
the social movements of dalits and the backward classes for social justice. But now the
movement of Hindutva is threatening to create a rupture in the ongoing, even if slow and
piecemeal process of political and cultural inclusion of the historically deprived and
excluded communities. The model of inclusive nation-building of which affirmative action
policies constituted a centrepiece, indeed established a rather firm, constitutionally
institutionalised structural linkage between the secular, liberal-democratic state and the idea

31
of India as a plural, multi-ethnic society. This linkage is now sought to be disrupted by the
Hindutva movement.
The Hindutva movement was launched in unison by various Hindu nationalist
organizations in the early 1980s. Although the ideology of Hindutva was propounded by
V.D. Savarkar during the Independence Movement, it all along lay dormant and failed to
attract any significant support from the Hindus. Even today, despite their strong missionary
zeal the Hindu nationalists find it difficult to sale the idea of Hindutva to a majority of
Hindus. They rely more on the politics of discourse and of electoral alignments in the hope
that someday in the future they can make Hindutva the ideology of the Indian state.
Accordingly, The politics of Hindutva is addressed to detaching the idea of India as a
pluralist ‘nation’ from the state, and redefining India as representing a unitary nation of the
Hindus—a Hindu Rashtra. The movement’s long-term objective is, thus, to make the Indian
state dependent for its legitimacy, on the idea of unitary nationalism symbolized in Hindu
Rashtra. Put simply, Hindutva seeks to legitimise ethno-religious majoritarianism, in the
name of cultural nationalism, and re-shape the Indian state in majority-ethnic terms. In my
view this project of Hindu nationalists is unlikely to succeed nationally, despite their
political party—the Bharatiya Janata Party (BJP) leading a multi-party coalition centrally
and is a ruling party in some states at the provincial level. Even the recent savage attacks by
the activists of the Hindutva movement on the Muslim minority in Gujarat aided and abetted
by the provincial state, is not likely to help it to achieve its cynical objective. Firstly, because
Hindutva ideology is against the grain of all that Hinduism and modern India is about.
Second, the heterogeneity of interests and identities among Hindus would not allow their
political mobilization on a sustained basis on the issue like Hindutva. In the competitive

32
politics of representative democracy these identities and interests are difficult to be
aggregated and patterned in any single, ideological direction. Thirdly, and most importantly,
the emergence of strong, countervailing political forces as a consequence of fifty years of
affirmative action policies. Among other things these have given rise to several regional
political parties, many of them led by the aggressive anti-Hindutva leadership of the
subaltern majorities, stubbornly preventing the political consolidation of the Hindus.[Sheth]
If, however, for some reason this established model of nation-building, allowing for
democratically processed incremental inclusion fails, and the Hindutva movement succeeds
in cultivating a long-term political support of the majority of Hindus, the Indian nation-state
would acquire, without doubt, the character of a majoritarian-ethnic state which would then
treat its minorities like other such states in the sub-continent. In that event, the Indian
enterprise of building a politically inclusive and culturally plural modern nation-state would
be shown as having failed.
New threats, besides Hindutva, have also emerged. The state driven model of nation-
building is now itself undergoing radical changes as it faces the newly emergent forces of
globalism from above, and regionalism (in form of ethnic and political-religious assertions)
from below. In this process of change entirely a new set of issues—such as of ‘national
sovereignty’ and preservation of indigenous cultures and lifestyles—have been inserted in
the old discourse of nation-building, creating far-reaching implications for the concept of
nation-building itself. I shall not elaborate this point here, as it falls outside the scope of this
paper. I however would wish to suggest that this change is likely to produce, in fact is in the
process of producing, qualitatively different forms of exclusion by introducing a new
dimension of cultural division globally, and in every national society: the metropolitan
33
world of globalised elites and its vast peripheries of the vernacular masses. In this process
the poor are increasingly becoming ‘invisible’ and poverty being seen as the poor peoples’
own failure, rather than a moral issue.[Sheth]
III
Affirmative Action: The South Asian Context
Only few countries in South Asia adopted Affirmative Action policies, each in response
to some special situations/problems it faced in the course of nation-building.
Accordingly, the policy has produced different consequences in different countries. As
we shall see presently, the countries where the policy was explicitly conceived as a
means of removing persistent conditions of structural exclusion that caused injustice and
deprivation to people of certain communities and regions and was administered by ethno-
neutral and democratic state, it has enormously contributed to making the society more
inclusive, even equitous. On the other hand, in countries where the policy was adopted
and implemented by an ethno-majoritarian state (democratic or otherwise), even for the
good reason of uplifting and accommodating the deprived and backward communities
within the country, it almost invariably ended up as an instrument for appeasing the
ethno-religious majority and discrimination of the minorities.
In Pakistan [M. Waseem] the policy was conceived, firstly as a means of
correcting the prevailing, sharp inter-regional economic and cultural imbalances, and
secondly, to alleviate depressed economic and cultural conditions in which a majority
within a particular region lived, e.g. the rural areas of Sindh. The policy provided for a
modest (i.e. proportionally much less than the population size) degree of representation in

34
government services to residents of backward regions (in reality the territorially based
ethno-linguistic minorities) and the populous community of Bengalis in East Pakistan
where a majority of Pakistanis lived in conditions of physical and cultural separation. The
distinctive nature of this policy lay in the ethno-majoritarian state not recognizing, in fact
suppressing, the ethno-cultural differences within the country, resulting in the policy
makers’ unwillingness to identify beneficiaries of the policy in ethnic or cultural terms,
and its insistence to use geographical criteria for their identification. In reality, however,
both the backwardness and discrimination in the Pakistani society were based on ethno-
cultural and feudal-hierarchical identities of communities within the larger Islamic fold.
The result was a half-hearted and intermittent implementation of the policy. It produced
deep resentment among the beneficiary groups who felt they did not receive benefits in
any appreciable measure. These included: people from the Northern (tribal) areas,
Sindhis, Baluch, the Bengalis and the Kashmiris in Pakistan. Of these, the Bengalis most
acutely felt that they, despite being a majority, were kept away from the centre of power
in Pakistan and eventually got themselves a separate nation-state. The policy was
vociferously opposed by the dominant Punjabi community and the Mohajir minority
(migrants from India who had led Pakistan movement for a separate homeland for
Muslims in undivided India). The dominant groups, not only opposed the affirmative
action policy, however infirm it was, they, being in power, sabotaged it from within in
various ways, one of them being issuing fake domicile certificates to un-entitled, non-
backward residents of a backward province. Ironically, the non-recognition of the cultural
and ethnic identities of communities within Islam, the religion of the Pakistani state, led
to strong ethnic identification by members of the communities who felt being
35
discriminated by the policy. The policy’s use of administrative euphemisms for ethnic
minorities enabled the cornering of advantages by the economically advanced dominant
groups who were formally opposed to the policy. In short the policy, the way in which it
was conceived and has been implemented, instead of maintaining national unity,
contributed, on the one hand, to the rise of the militant (Mohajir) and separatist (Bengali)
movements, and to diversionary counter-mobilizational and violent movements by the
sectarian and denominational organizations, on the other.
It, however, will not be entirely correct to conclude from the above that the policy
has not worked at all in Pakistan. In fact the phase during its phase of its effective
implementation after the separation of Bangladesh, particularly between 1973 and 1993,
the policy achieved its intended objective. It tamed the separatist movements in the
provinces (especially in Sindh) and gave representation to educated elites of different
ethno-linguistic provinces in the structure of political and bureaucratic power. [Data-
Table from Waseem] This function is performed even today, insofar as the policy still
allows such representations, although if in a smaller measure. But this new post-1973
policy caused an intense feeling of loss of power among the Mohajirs, making their
movement much more militant. It also could not appreciably reduce the performance of
the dominant Punjabi community in governance.[Data, Waseem] On the whole, it seems,
the ethno-religious majoritarian approach to nation-building did not allow the ruling
elites of Pakistan to draw the right lesson about the policy: its role in making the state
more stable and the nation a culturally and politically inclusive society.
In Sri Lanka the affirmative action policy came as late as in 1970, in the wake of
the ethno-religious (Sinhalese-Buddhist) majoritarian movement. At one level, it was

36
aimed at correcting severe rural-urban and ethnic imbalances in utilization of educational
opportunities and bureaucratic power which for historical reasons had remained tilted in
the favour of Tamil minority even as it favoured a section of upper status (Goyigami)
urban Sinhalese. But, at the level of implementation, the policy appeared as a set of too
swift and sweeping measures, deliberately and viciously targeting interests of the ethno-
lingual minority of the Tamils. This aggravated the ethnic-conflicts, making the policy a
means of cultivating and consolidating majoritarian support for the competing political
parties and for the government of the day. Thus the affirmative action policy, the way in
which it was conceived and the manner in which it was implemented, by the ethno-
majoritarian, democratic state of Sri Lanka, instead of addressing the real need of
correcting the ethnic imbalance of opportunities and power in the society, contributed to
the growing ethnic polarization in the society (for details M.K. de-Silva).
Recently, the Hindu state of Nepal, controlled by its traditional, upper-status elites
consisting of Bahuns, Chhetris and the Newars, facing Maoist insurrections, has
awakened to the need for affirmative action policies for the country’s hitherto suppressed
and made-invisible ethnic minorities and the untouchable communities.[Ref. I. Exp.] It is
premature to comment on what kind of impact it will have in terms of making the Nepali
society more or less inclusive, even on whether the policy will at all take off from the
ground.

37
IV
Affirmative Action in India The policy of Affirmative Action in India (hereafter to be referred to also by the Indian
nomenclature: Reservations) is by now an established social policy addressing issues of
social inequality and marginalization of the numerous communities which, taken
together, make up a majority of Indians.
Provisions and Rationale of the Policy:
The policy provides for reservations of seats in legislative bodies at all levels
(local, provincial and national), of jobs in government services and seats in educational
institutions for the socially marginalized and culturally peripheralized sections of the
population. Reservations is a part of a comprehensive policy package that has evolved in
India over half a century. The package comprises a series of legislations, ameliorative
programmes and preferential schemes, explicitly designed to socially and politically
empower the weaker sections of the society as well as to increase economic opportunities
for them. The package has been administered by the central as well as the state
(provincial) governments. Although the history of affirmative action in India dates back
to the first decade of the Twentieth century,[FN, Mysore State] the present set of policies,
including Reservations, derive their legal status and legitimacy from the Indian
constitution.
The overall package, now in operation, addresses three sets of policy goals:
1. ending of social and religious disabilities suffered by certain specified groups by
virtue of their social segregation and ritual exclusion (the communities of ex-
untouchables, officially characterized as Scheduled Castes, the SCs) and spatial

38
and cultural isolation; (the tribals, officially categories as Scheduled Tribes, the
STs).
2. to facilitating and promoting equal participation of all socially disabled and
disadvantaged groups (which besides the SCs and STs, in this context include
communities classified as Other Backward Classes, OBCs comprising a vast
number of ritually discriminated and culturally deprived agrarian and artisan
communities) by means of provisions for preferential treatment in education, in
government employment, and representation in legislative bodies.
3. to protect, if necessary through legislative action and executive orders, all these
groups, also described in the constitution as socially disadvantaged and weaker
sections of society—generally identified as the backward classes—from all forms
of social injustice and exploitation.
The overall, long-term goal, as was repeatedly expressed by the policy makers in
the course of the Constituent Assembly debates, was: building a political community of
all Indians, based on the principle of social equality.[Ref.]
In articulating these goals, the policy has over the years widened its scope and
enlarged its content. Reservations (Affirmative Action) is one of the many avenues that
have opened up in the pursuit of an equitable social policy. A series of laws (e.g. the
Untouchability Offences Act of 1955, the Protection of Civil Rights Act of 1976, the
Prevention of Atrocities Act of 1989—a legislation prescribing severe punitive provisions
against practice of untouchability—the amended Criminal Tribes Act of 1952 removing
the legal disabilities suffered by the so-called criminal tribes and legislation to end forced
labour) have been passed to further the cause of social justice. Protective laws also have
39
been passed preventing alienation of land owned by a tribal to any one belonging to a
non-tribal community, regulating money-lending, and providing debt-relief and legal aid
to the weaker sections of society. Besides, there are many other promotional schemes and
programmes for backward classes concerning land allotments, housing, scholarships,
subsidies and credits aimed at providing physical security as well as promoting
occupational mobility of these groups. Special laws have also been made providing for
self-rule arrangements to tribals populating specified territories.
The most controversial aspect of this overall policy is, however, the provision of
reservations. Although these provisions are based on the same values and rationale that
inform other parts of the policy package listed above, their impact is felt adversely and
directly by those outside the beneficiary groups and that too in the vital area of
competition for political/bureaucratic power and social mobility where the means are
always scarce and competition intense.
The Beneficiaries and the Benefits
The beneficiaries of Reservations comprise three types of communities: (a) ex-
untouchables, (b) tribals and (c) Other Backward Classes; all, together, making about 65
per cent of the Indian population. In the beneficiary categories are also included the
deprived and marginalized sections of the religious minorities: Sikhs, Buddhists,
Christians and the Muslims.
(a) Communities of the ex-untouchables: Specific castes/communities who
traditionally suffered almost total ritual prohibition resulting in their continuing social
discrimination have been identified, enumerated and listed in every provincial state of

40
India and the lists have been consolidated and incorporated in the schedule of the
Constitution. These communities hence are officially designated as Scheduled Castes
(SCs). The implicit criterion for inclusion in the SC list is the social and religious
disability suffered by a caste on account of untouchability, i.e. being at the pollution end
of the social hierarchy. Formally, however, any group considered to be eligible for
inclusion by the President of India (i.e. by an executive order of the Central Government)
can be included in the list. However, only the Parliament has the power to de-list an SC
community.
Included in the SC category are communities from three different religions,
Hinduism, Sikhism and Buddhism, all having within them communities traditionally
suffering the odium of untouchability. They together constitute 16 per cent (160 million)
of the Indian population.
The term SC has by now become a term of common usage in the public sphere for
referring to an ex-untouchable community or its member. This administrative
nomenclature has by now become an established social category and is also a preferred
term of self-identification for members of these communities themselves. This is
probably because it has a secular, non-ritual and stigma-free connotation. The other such
preferred term is dalit, which literally means oppressed (crushed, broken) people. The
term emerged from the movement of untouchables for social justice and political rights
led by Dr B.R. Ambedkar and has replaced the old terms (one of them being harijan)
which sounded ritualistic, having religious connotations. The term dalit is also meant to
remind everyone about social injustice and discrimination the communities still suffer
and to inspire the dalits themselves to continue to fight for their social and cultural rights.

41
It has by now become a common symbol of political-cultural identity for all ex-
untouchable communities, a singular term for their ethnic identification.
The policy entitles the SCs to receive three types of benefit. (a) Political
reservations: Seats in the national Parliament, state-legislatures and local-government
bodies, reserved in proportion to their size (percentage) in the population. (b) Job
reservations: Seats are reserved for SCs in all Government and Public Sector jobs, in
proportion to their size (percentage) in the population. (c) Educational reservations: Seats
are reserved in educational institutions, especially where there is intense competition for
entrance. Here also the quantum of reservation is in proportion to their size (percentage)
in the population.
(b) Communities of tribal and indigenous people: Specific tribal communities are
identified and listed in the constitutional schedules and are officially categorized as
Scheduled Tribes (STs). They receive similar benefits of Reservations as the SCs, i.e.
seats in legislatures and local government bodies, in government employment and in
educational institutions. The number of seats reserved for them in each of the three
sectors is in proportion to their size (per cent) in the population. They constitute about 8
per cent (80 millions) of Indian population. The implicit principle of inclusion in the
scheduled category of the tribals (STs) is their physical and cultural isolation, their
habitat being conventionally in and around hills and forests. Formally, however, like in
the case of SCs, inclusion in the lists is by executive order and exclusion only through a
decision of the Parliament. Included in the ST lists are communities from different
religions: Hinduism, Christianity and Islam as well as a large number of communities
practising their indigenous tribal faiths.
42
Over the years the communities belonging to the category ST have become
internally highly differentiated, at one end there are the communities living in relative
conditions suggesting a high degree of physical and cultural isolation and almost totally
unexposed to literacy and at the other end are those communities, with high literacy rates
and a significant number of their members being university educated, leading middle and
upper-class lifestyles. In some states of the North-East they have been the traditional
ruling elites.[FN] But taken as a whole the tribal communities have been lagging behind
the SCs in the extent of benefits they have been able to receive from the educational and
job reservations.[Ref: Xaxa]
There has been a permanent, independent commission, to monitor the working of
social policies relating to SCs and STs, and report their findings, and recommendations
for improvement of their conditions to the Parliament.
(c) Communities of the socially and educationally ‘backward’ people: The
category Other Backward Classes (OBCs) is the most numerous and heterogeneous of all.
Obviously, they are in no need of legislative reservations, as they constitute numerical
majority in many states of India. Over the years their representation in legislatures has
vastly increased through the normal processes of competitive politics.[FN Data: CSDS,
Jeffrelot] In India’s representative democracy, political reservation is not their problem.
In fact it is by converting their numerical strength into political power that the OBCs
whose entitlement to Reservations was ambiguously articulated in the Constitution, re-
entered the Reservations system after Independence and have managed to stay there.[FN
on re-entry] The story of reservations for the OBCs is the one of prolonged struggles,
agitations and counter-agitations that has made Indian politics quite volatile and often

43
even tumultuous. At another level it is an account of democratic politics managing
inclusion of members of the socially deprived and discriminated majority through
progressive expansion of affirmative action policies and, thus, preventing the Indian state
(so far?) from acquiring ethno-majoritarian character. We shall return to this account
later. At this point it is sufficient to note that it was only in 1991 that an uniform central
policy was adopted, institutionalising the OBC reservations at the national and state
levels, when the report of the Second Backward Class Commission (the Mandal Report)
was accepted by the Central Government for implementation, which was subsequently
endorsed by the Supreme Court of India.
The quantum of reservations for the OBCs has since been fixed at 27 per cent at
the national as well as state levels which is a little over half to their proportion in the
population. Until 1991 several states did not have any provision of reservations for them.
The states were: West Bengal, Orissa, Assam, Rajasthan and the territories administered
by the Central Government (Union Territories). The states in which the provision was
made the quantum of reservations was arbitrarily fixed at much lower level, i.e. between
2 to 15 per cent. For entrance in prized educational institutions standards were only
marginally lowered for them. For example, all the OBC students admitted between 1979-
80 and 1983-84 under the reservation provisions in a medical college in Ahmedabad had
obtained between 76 and 79 per cent marks at the Std XII examination.[M. Dave]
The situation, however, has all along been different in the south Indian states,
where reservations for the other backward classes have existed, in one form or the other,
containing for over half a century. The extent of reservations there has reached the point
of saturation, covering almost their proportional strength in the population.

44
Unlike the SCs and STs, the communities identified under the OBC category are
not identified and enumerated in India’s decennial censuses. A community can enter the
OBC category and receive benefits of Reservation only on the recommendation of the
statutorily appointed commission. The Second Backward Class Commission listed such
communities and estimated their population at 52 per cent which seems too liberal on the
higher side. My estimates of OBCs entitled to receive Reservations benefits, based on
CSDS sample surveys, is between 38 to 40 per cent.
The OBCs comprise, by and large, the lower rungs of the Sudras who, in the past,
suffered from varying degrees of ritual prohibitions applied to the a-dvijas (literally,
those not ‘twice born) and remain till today socially and occupationally disadvantaged. A
substantial number of the erstwhile non-dvijas (Sudras), however, had achieved to a
considerable extent social mobility and a degree of political and economic advancement,
in the late medieval period, and especially during the colonial regime. These
communities, e.g. the Reddies, Kammas, Marathas, Patidars etc. have been kept out of
the OBC lists. But a vast majority of the Sudras officially included in the OBC category
belong to communities that have been ritually and socially discriminated and were
backward. Accordingly, a number of such Sudra communities, along with many such
other similar Muslim and Christian and Buddhist groups have been included in the lists of
beneficiaries of the Reservation policy.
Even so, a few such communities in the southern States, which by the policy’s
own criteria would not qualify today for Reservations benefits, continue to be on the list
of beneficiaries. Although their inclusion in the reservation list was justified when the
scheme was started, their social and educational conditions have since improved to such a

45
degree that they can no longer be considered as socially and educationally disadvantaged.
In the northern and western States, although there are some communities identified by
sociologists as ‘dominant castes’ and have acquired political clout by virtue of their
numerical strength, they by and large, they continue to remain backward in social and
educational terms. In these States (unlike the southern States), reservation for OBCs is of
recent origin and till yesterday the quantum of reservation for them remained much
smaller in proportion to their numbers.
Viewed from the national or the State levels, the OBCs today constitute a far
more (economically and educationally) heterogeneous category by comparison with the
SCs and Sts. On the one hand, the OBCs include some of the dominant castes of
agriculturists who at the local levels are often locked in conflicts with the SCs, both in the
north and in the south. Some of them have entered, and few more have been forcing their
entry, in the list of beneficiary communities making use of electoral clout rather than
their eligibility. Yet, on the other, the category includes a wide array of socially and
economically deprived groups which suffer at least as much (if not more than) as the SCs
and STs. These include the so-called ‘criminal’ tribes (stigmatised as such during the
colonial period), nomadic communities, lower-status and ex-untouchable communities
converted to Islam, and Christianity from the SCs, as well as a whole range of minor
castes subjected to a condition of ‘relative untouchablity’ and engaged in caste-bound
marginal occupations. On the whole the OBC is an open category of ‘inclusion’ to which
claims of entry could be made by any community, at any time by representing its case to
the permanent commissions specially set up in the states and at the national level
specially for this purpose. The commissions are also charged with the responsibility of
46
exclusion of those communities from the lists whom it finds, after due investigation,
being wrongly included or having ceased to be backward. As the category comprises the
country’s largest section of the electorate this official open-endedness is found politically
useful by the political parties cultivating vote banks and by the leaders of the majoritarian
ethno-religious movement (Hindutva) as their potential supporters. All this has resulted in
intense competition for seeking OBC support in politics, generating trends threatening to
bring into question the established policy of making India an inclusive society, among
other things, through affirmative action. Two processes are at work which may decide the
direction in which the question of inclusion and exclusion may be settled:
1. political-ethnicization of castes, i.e. the numerous lower status castes organizing
themselves into larger ethno-political formations in competitive politics, for
asserting their rights and maintaining cultural identities, and in the process
achieve social justice and prevent any distortions of the policy as a part of their
larger democratic politics;
2. political ethno-majoritization of lower-status communities, through their
cooptation in the Hindutva movement, suppressing ethno-cultural interests and
identities of communities through their emotional-communal mobilization for
‘Hindu unity’ and against the non-Hindu minorities. I shall highlight some
aspects of this politics, in the next section, in the course of examining the
outcomes and impacts of the affirmative action policy for different groups, and
generally for the whole system.

47
V
Performance and Outcomes of the Policy
Despite tardy and often even dishonest implementation for over fifty years the policy of
Reservations has worked reasonably well. It in fact can claim some significant
achievements, not only for the beneficiary groups of SCs, STs and OBCs, but for the
whole nation.
First, Reservations have changed the nature and composition of the Indian
middle-class, making it more inclusive. At Independence, it was a small caste-like social
formation. Its membership almost entirely consisted of the English-educated, urban
sections of the dvija castes.[A.R. Desai] Today, thanks to Reservations, members of
‘lower castes’ have been able to enter the middle-class in significant numbers. A recent
CSDS study shows that a sizeable section of India’s middle-class consists of the second
and third generation beneficiaries of Reservations. [Table]
Second, fifty years ago dalits, tribals and OBCs could aspire only to a limited
degree of upward mobility and that too as collectivities functioning within the caste
structure. Today, with Reservations opening for them gates of the middle-class, not only
the incidence of their upward mobility has increased, but for achieving it they have not to
depend on ritualistic modes sanctioned by the caste system, such as sanskritization. This
changed pattern of social mobility—a larger number of individual members of ‘lower
castes’ acquiring middle-class identity—has deeply shaken the economic and cultural
roots of the caste system. For, ‘middle-class’ identity is no longer perceived in ritual
status terms; consumerization rather than sanskritization has become a middle-class
marker.

48
Third, working for over fifty years Reservations have made cumulative and
lasting impact on India’s political system. With educational and occupational
opportunities provided by Reservations a new political leadership has emerged from
among the SCs, STs and OBCs. For example, the very origin and growth of the powerful
dalit-based party in the north of India, the Bahujan Samaj Party (BSP) lay in the
formation of a trade-union like association of the dalit and the backward class
Government employees. In the course of about five decades of Reservations the entire
structure of political power in almost all the states and lately at the national level has
changed. The established pattern of the upper caste English educated elite rule has
changed. In almost all provincial states of India the OBCs and members of the other
beneficiary categories of affirmative action are now occupying important power positions
in Government and, of course, at a relatively much less important levels in the
bureaucracy. In this process several political parties supported by subaltern groups have
appeared on the political scene. They bitterly resent and fight reproduction of the
traditional, caste-hierarchical (jajmani type) client-patron relationship in politics, which
had for long characterized Indian politics: the vertical political relationship between the
leadership of the lower-status, rural groups and the English-educated, upper caste elite.
Leaders of these communities now aggressively assert their interests and identities in the
electoral arena. Put differently, this new political class, empowered by Reservations,
worked for ending the upper-caste, elite-oriented Congress monopoly of power. In this
process, it gave a material basis to its own power in the rural economy. In short,
Reservations have contributed to changing the old balance of power in the society.
Viewed from a long-term perspective, the political inclusion of the hitherto excluded

49
groups, initiated by the social policy but realized through competitive democratic politics,
has resulted in disruption of the the reproductive process of caste being periodically
incarnated into ideologically sanctified power structure that assigned political power to
hereditary groups.
Reservations has made a significant impact for individuals of the beneficiary
categories. The most crucial impact is that education has become a social and cultural
value for the members of all the beneficiary categories. They now see education as an
accessible means for them to individually attaining modernity and social mobility. Some
of them having entered the middle class now, unlike their parents, go great lengths to
educate their children so that they can receive benefits of reservation and are able to stay
in the growing, competitive Indian middle class. Having entered the middle class not only
has their lifestyle changed, they now redefine the conventional, caste-like culture of the
middle class, increasingly in non-ritual status terms. Even for many non-educated, but of
the aspirant generation, alcoholism is on the wane and savings are increasing. This
expansion of opportunities has enabled members of these communities to attain, in
greater numbers than before, high professional stature and positions of power. (Such
achievements are however rare in business and industry.) As in the case of every other
upwardly mobile community, this has created an upper crust whose members are
expected not only to serve as a role model but also provide a protective device, a ‘spear-
head’ for their people to enter the system.
Successful individuals always had a role model impact, but now with large
enough number from among these groups having entered the power structure, they have
been able to install protective mechanisms within the bureaucracy and political parties,
50
facilitating entry of their compatriots in the power structure. For example, in Surat
District of Gujarat, as back as in the sixties about 40% of primary school teachers were
tribals. This opened up, on a long-term basis, for the tribals of the district the doors of
political power in Gujarat. In the course of twenty years few of them became not just
MLAs and MPs (which was mechanically possible through quotas) but Ministers and
even Chief Ministers of the state. Once they became a critical mass in power, it became
easy to build other linkages. By using their political influence they acquired a say in
decision-making, including in recruitment matters expanding the linkages further. Let me
conclude this part on impact of the policy by reproducing from a field report published in
a reputed national daily, a day after the Chief Minister of Uttar Pradesh (UP) Ms.
Mayawati stepped down from power. It aptly illustrates how political power acquired by
the socially excluded people through affirmative action policy and democratic politics
can have revolutionary impact for opening up the system.
In Lucknow and Delhi, politicians may scoff at Mayawati’s Dalit ki beti (daughter of a dalit) histrionics, but spend a day in some of these Ambedkar villages—settlements with more than 50 per cent Dalit populace were declared as such and promised special development schemes—and you realise why she, in many a home, finds place on a pedestal. No, she hasn’t transformed hovels into bungalows. Nor has expelled the woes of the most wretched. To a first time visitor, there’s little to rejoice: flies crawl over half-naked children, debris and dung raise a stink in the lanes and even the pucca homes show signs of abject poverty. So what’s new? Check with the Dalits of these villages. They will tell you this was God’s forsaken country. They tilled the land of the upper castes, looked after their animals, washed their clothes, shaped their pots, made their shoes and cleaned their mess. In turn, they were declared untouchable and unclean—and forced to live in the dirtiest quarters of the village. They cleaned toilets but never dreamed of a toilet of their own. This is why the dismal brick homes with “latrines’ that have come up in the last year or two under

51
the Indira Awas Yojana means so much to Bisesar and his brethren. And it is not just the latrines. “You want to know how things have changed?” asks Ram Ratan. “When I was young, no Dalit could wear a shirt. We didn’t have shoes. We would be beaten up if we tried. If we went to town or to a wedding far away, we would take them off before we returned to the village.” Today, our children go to school. And they have to comb their hair, wear clean clothes, put covers on their books. Those who don’t send their children to school look at the others and make sure their children too don’t look dirty,” says Babhooti. That obsession with cleanliness, it’s easy to see why. They had lived so long in squalor that it was accepted as unchanging fate. In the Indira Gandhi years came the first hint of change. Many schemes were announced but they remained largely on paper. Mayawati, they insist, changed all that. “Badlav ki gati tezi se badh gayi (The momentum of change picked up rapidly),” says Ram Rattan. Others nod their heads and point to the brick-paved lanes in the village, the tube-wells and hand pumps, the Indira Awas homes (for the poorest Below Poverty Line (BPL) families) and, of course, the latrines. They had been promised all this and much more by previous regimes but the work started only after Mayawai assumed power for the first time in 1995. But real change cannot be measured in brick and steel. It lies in the loss of fear. Now that Mayawati is gone, do they fear the return of the old days? “There was a time when we were scared to speak out, even look up. Now we go and meet the tehsildar, the thanedar and they listen to our complaints.” Everyone concedes that there can be no comparison between the old days and the present. The most visible sign of change is the enthusiasm for education. In the cluster of four villages in this area—Abbasganj, Hasanpur, Kaneri, Chatauni—there are four primary schools, two junior schools and one high school. Almost every Dalit parents send their sons—and daughters—to school. Outside the Kaneri gram pradhan’s home, a group of women talk of their joys and sorrows. They never went to school—there was no school around in their time and no one thought of sending them to one. But as Phuljara talks of her wasted life, her daughter Kes Kumari comes down the lane after a day in school. We meet another bunch of Dalit girls cycling home from a distant high school. And 14-year-old Kanti in Hasanpur is too busy doing her homework to gaze at passing strangers. Education may not give them jobs or make them rich, but Kes Kumari and Kanti already exude a sense of hope and a quiet dignity worth more than all the diamonds on Mayawati’s ring.
— The Indian Express, 1.9.2003

52
All this when the policy is far from achieving some crucial physical targets. The
scheduled quotas still remain unfilled at higher levels of Government jobs. [Table] The
capacity to receive benefits of the policy, e.g. attainment of minimum educational levels,
remains abysmally low among several smaller communities comprising the SC, ST and
OBC categories which has kept them out of the policy’s reach. The other enabling
measures envisaged to compliment Reservations, remain by and large inadequate. Yet, it
cannot be denied that Reservations have helped the SCs, STs and the OBCs. By
providing a concrete basis to their mobility aspirations, it has induced them to achieve
higher levels of literacy and living standards. For example in the south and west Indian
states where the policy has been more efficiently implemented, educational and
occupational profiles of SCs and OBCs have shown much greater improvement. [Table]
The need to continue and strengthen the policy of affirmative action is greater
today than ever before. As the economy is freed from the state control, government have
to see that the weaker and vulnerable sections in the society are not only protected from
predatory market practices, but that they are enabled to participate in it and derive
benefits of the expanding economy. No economic reforms can work unless a vast
majority of a country’s population—who in India go by such names as SCs, STs and
OBCs—acquire a stake in them. Liberalization does not mean, not even in the most
liberalized economies of the world, that government cease to rule and surrender the fate
of the country’s poor and deprived to the ‘market forces’.
For the market to really become an equalizing force the state has to perform more
astutely its role of maintaining—and creating where they do not exist—level-playing
fields. Affirmative action is the most potent instrument for achieving this state. For such a

53
policy, to be effective the state has to proactively dispense social justice to those of its
citizens who still exist on the peripheries of both, the market economy and the civil
society. Even a minimalist state cannot escape this responsibility. If it does, not just
economic reforms but its very existence as an ethno-neutral and democratic state may
come in danger.
New Policy Initiatives:
It is in this light that there is a need to re-invent the affirmative action policies:
1. An exit policy from Reservations for members of those beneficiary communities
who may be found, after careful investigations, having ceased to be socially and
educationally backward. This will enable those extremely backward communities
who are technically entitled to Reservation benefits but do not receive them in
reality. A lion’s share of such benefits go to a small elite-minority that has
emerged among them. The exit policy, however, should not apply to dalits, at
least until their discrimination in public sphere totally ceases and incidence of
‘atrocity’ on them completely stops. Same will apply to a section of tribals still
living in conditions of physical isolation.
2. Special developmental and promotional measures need to be thought of and
implemented for reaching directly the poor and ‘backward’ households among the
upper-caste communities, usually due to their disadvantageous physical locations
and parental background: rural residence, i.e. residence in small villages poorly
connected by road or rail and ill served by education and health services; rural-
schooling, parent (mother) uneducated. This developmental and promotional
measures should not be confused or tied with the Reservations made for the

54
socially deprived under affirmative action policies, which are founded on an
entirely different value premise and rationale.
3. The recruitment policy of the corporate (private) sector needs to be modified and
adapted to the principle of diversity. It is now being increasingly recognized that
having culturally diverse personnel working at any workplace is not just healthy
management but, beneficial to the company. The policy of diversity should
particularly be conceived as special promotional measure for the routinely
unrepresented cultural groups in business and organized economy, but it should
not be equated or confused with existing affirmative action policies, which aims
at, among other things, inclusion of the traditionally and systematically excluded
groups in the power-structure of the state and its institutions.

2
PART I: (Tables 1 to 6) GENERAL TABLES: CONTEXT FOR THE POLICY
Part I—Table 1: Scheduled Castes and Scheduled Tribes Population 1991 Census—India & States
S. No.
States/Union Territories
Scheduled Castes (SC)
(Lakh)
% SC Population to total
Population
Scheduled Tribes (ST)
(Lakh)
% ST Population to total
Population 1 2 3 4 5 6 INDIA(*) 1382.23 16.48 677.58 8.08
States: 1. Andhra Pradesh 105.92 15.93 41.99 6.312. Arunachal Pradesh 0.04 0.47 5.50 63.663. Assam 16.59 7.40 28.74 12.834. Bihar 125.72 14.56 66.17 7.665. Goa 0.24 2.08 N 0.036. Gujarat 30.60 7.41 61.62 14.927. Haryana 32.51 19.75 – 0.008. Himachal Pradesh 13.10 25.34 2.18 4.229. Karnataka 73.69 16.38 19.16 4.26
10. Kerala 28.87 9.92 3.21 1.1011. Madhtya Pradesh 96.27 14.54 153.99 23.2712. Maharashtra 87.58 11.10 73.18 9.2713. Manipur 0.37 2.02 6.32 34.4114. Meghalaya 0.09 0.51 15.18 85.5315. Mizoram 0.01 0.10 6.54 94.7516. Nagaland – 0.00 10.61 87.7017. Orissa 51.29 16.20 70.32 22.2118. Punjab 57.43 28.31 – 0.0019. Rajasthan 76.08 17.29 54.75 12.4420. Sikkim 0.24 5.93 0.91 22.3621. Tamil Nadu 107.12 19.18 5.74 1.0322. Tripura 4.51 16.36 8.53 30.9523. Uttar Pradesh 292.76 21.04 2.88 0.2124. West Bengal 160.81 23.52 38.09 5.60
Union Territories 1. A&N Islands – 0.00 0.27 9.542. Chandigarh 1.06 16.51 – 0.003. D&N Haveli 0.03 1.97 1.09 78.994. Daman and Diu 0.04 3.83 0.12 11.545. Delhi 17.95 19.05 – 0.006. Lakshadweep – 0.00 0.48 93.157. Pondicherry 1.31 16.25 – 0.00
N = Negligible. Lakh = 100,000 (*) = Excludes Jammu & Kashmir as the 1991 Census was not conducted
Source: Census of India, 1991, Series – 1 Final Population Totals, Paper–1 of 1992, Vol. 1,
Registrar General & Census Commissioner of India.

3
Part I—Table 2: Some Indicators of Social Development (1991-92 and 1996-97),
Projections for 2006-7 1991-92 1996-97 2006-2007(1) (2) (3) (4) (5)
Male 57.7 60.10 66.10 1 Life Expectancy (years) Female 58.7 61.10 67.10
2. Infant Mortality Rate (per 1000 births)
78(a) 68(b) 48
3. Death Rate (b) (per thousand) 10.0 8.7 7.4 4. Birth Rate (b) (per thousand) 28.9 25.72 21.7 5. Fertility Rate (per thousand) 130.3 113.0 91.4
15-35 years 56.0* 90.0 100.0 6. Literacy Rate (%) 7 years and above 52.0 75.0 90.0
7. Per Capita Consumption of food grains (kg)
182.0 193.6 225.0
(a) Villages without drinking water (thousands)
3.0@ 0 0 8.
(b) Villages partially covered (less than 40 lpcd)
150.0 negligible 0
Rural 27© 50 80 9. Electricity as a source of Lighting (per cent of Dwellings
Urban 75© 80 95
Notes: (a) Estimate based on SRS Data
(b) Based on assumption implicit in the population projections made by the Standing Committee of Experts on Population Projection (1989)
© Estimate for 1988-89 based on NSS 44th Round @ The figure indicates the number of villages not having any source of drinking water
by end of March 1992 (Source: Ministry of Rural Development) lpcd: Litres per capita per day
* Estimates for 1986-87 based on NSS 42nd Round Source: Eighth Five Year Plan: 1992-1997, Vo.1, P. 29, Planning Commission, Government
of India.
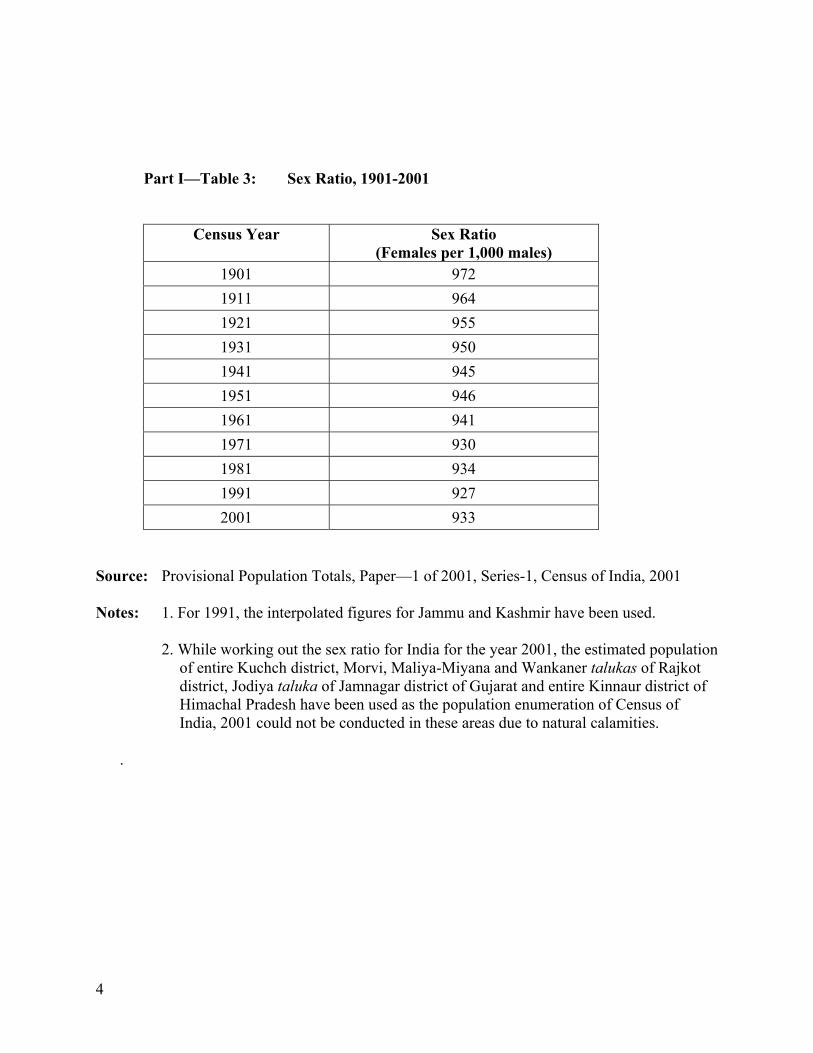
4
Part I—Table 3: Sex Ratio, 1901-2001
Census Year Sex Ratio
(Females per 1,000 males) 1901 972 1911 964 1921 955 1931 950 1941 945 1951 946 1961 941 1971 930 1981 934 1991 927 2001 933
Source: Provisional Population Totals, Paper—1 of 2001, Series-1, Census of India, 2001 Notes: 1. For 1991, the interpolated figures for Jammu and Kashmir have been used. 2. While working out the sex ratio for India for the year 2001, the estimated population
of entire Kuchch district, Morvi, Maliya-Miyana and Wankaner talukas of Rajkot district, Jodiya taluka of Jamnagar district of Gujarat and entire Kinnaur district of Himachal Pradesh have been used as the population enumeration of Census of India, 2001 could not be conducted in these areas due to natural calamities.
.

5
Part I—Table 4: Literacy Rate, 1951-2001
Census Year Persons Males Females
1951 18.33 27.16 8.86 1961 28.30 40.40 15.35 1971 34.45 45.96 21.97 1981 43.57 56.38 29.76 1991 52.21 64.13 39.29 2001 65.38 75.85 54.16
Source: Provisional Population Totals, Paper—1 of 2001, Series-1, Census of India, 2001. Note: Literacy rates for 1951, 1961 and 1971 Census relate to population aged five years and
above. The rates for the 1981, 1991 and 2001 Census relate to the population aged seven years and above.
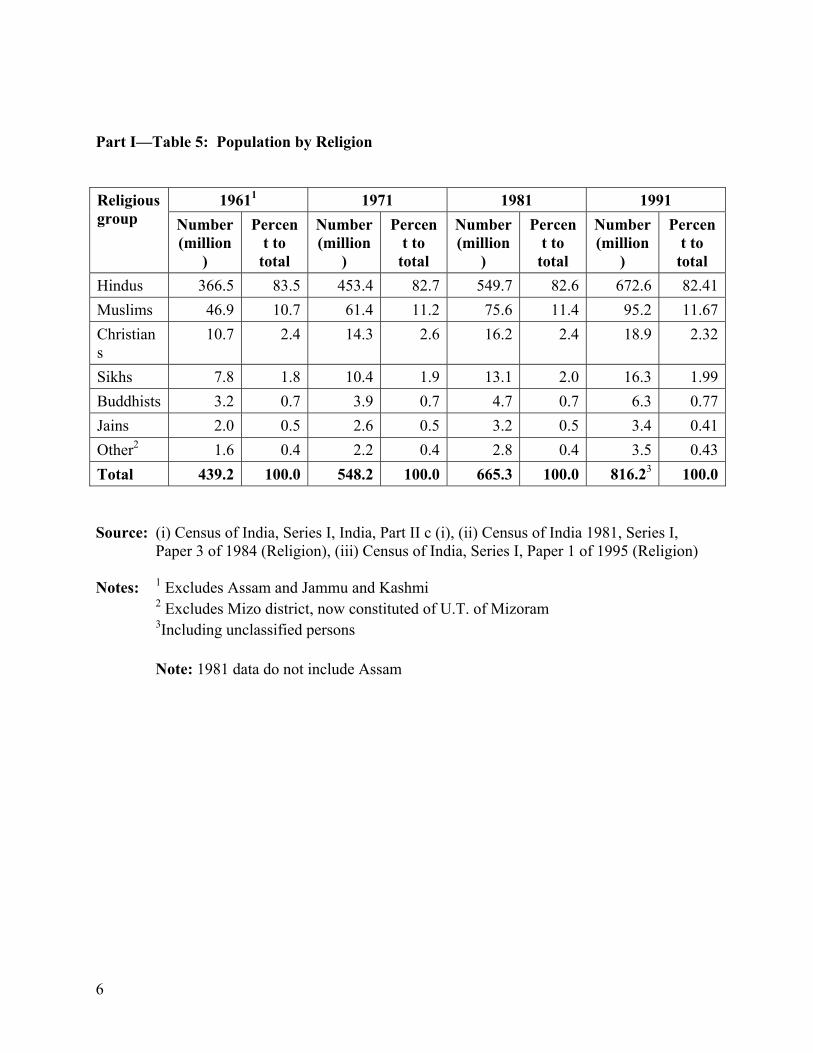
6
Part I—Table 5: Population by Religion
19611 1971 1981 1991 Religious group Number
(million)
Percent to
total
Number (million
)
Percent to
total
Number (million
)
Percent to
total
Number (million
)
Percent to
total Hindus 366.5 83.5 453.4 82.7 549.7 82.6 672.6 82.41Muslims 46.9 10.7 61.4 11.2 75.6 11.4 95.2 11.67Christians
10.7 2.4 14.3 2.6 16.2 2.4 18.9 2.32
Sikhs 7.8 1.8 10.4 1.9 13.1 2.0 16.3 1.99Buddhists 3.2 0.7 3.9 0.7 4.7 0.7 6.3 0.77Jains 2.0 0.5 2.6 0.5 3.2 0.5 3.4 0.41Other2 1.6 0.4 2.2 0.4 2.8 0.4 3.5 0.43Total 439.2 100.0 548.2 100.0 665.3 100.0 816.23 100.0 Source: (i) Census of India, Series I, India, Part II c (i), (ii) Census of India 1981, Series I,
Paper 3 of 1984 (Religion), (iii) Census of India, Series I, Paper 1 of 1995 (Religion) Notes: 1 Excludes Assam and Jammu and Kashmi 2 Excludes Mizo district, now constituted of U.T. of Mizoram 3Including unclassified persons
Note: 1981 data do not include Assam

7
Part I—Table 6: Comparative Strengths of Scheduled Languages Persons who have written the language
as their mother tongue Percentage to total
population
Language 1971 1981 1991 1971 19811 1991
1. Hindi 20,85,14,005 26,45,14,117 33,72,72,114 38.04 38.71 33.852. Bengali 4,47,92,312 5,12,98,319 6,95,95,738 8.17 7.51 8.223. Telugu 4,47,56,923 5,06,24,611 6,60,17,615 8.16 7.41 7.804. Marathi 4,17,65,190 4,94,52,922 6,24,81,681 7.62 7.24 7.385. Tamil 3,76,90.106 N.A.2 5,30,06,368 6.88 N.A.2 6.266. Urdu 2,86,20,895 3,49,41,435 4,34,06,932 5.22 5.11 5.137. Gujarati 2,58,65,012 3,30,63,267 4,06,73,814 4.72 4.84 4.818. Kannada 2,17,10,649 2,56,97,146 3,27,53,676 3.96 3.76 3.879. Malayalam 2,19,38,760 2,57,00,705 3,03,77,176 4.00 3.76 3.5910. Oriya 1,98,63,198 2,30,21,528 2,80,61,313 3.62 3.37 3.3211. Punjabi 1,41,08,443 1,96,11,199 2,33,78,744 2.57 2.87 2.7612. Assamese 89,59,558 N.A.3 1,30,79,696 1.63 N.A.3 1.5513. Sindhi 16,76,875 20,44,389 21,22,848 0.31 0.30 0.2514. Nepali 14,19,835 13,60,636 20,76,645 0.26 0.20 0.2515. Konkani 15,08,432 15,70,108 17,60,607 0.28 0.23 0.2116. Manipuri 7,91,714 9,01,407 12,70,216 0.14 0.13 0.1517. Kashmiri 24,95,487 31,76,975 N.A.4 0.46 0.46 N.A.4
18. Sanskrit 2,212 6,106 49,736 N N 0.01 Source: Census of India, 1971, 1981, 1991. Reproduced from India: 2004, pp. 19-20, Ministry of Information, Government of
India, New Delhi (2004). Notes: 1 The percentage of speakers of each language for 1981 have been worked out on the
total population of India including the estimated population of Assam where the 1981 Census was not conducted due to disturbed conditions.
2 Full figures for Tamil and Assamese for 1981 are not available as the Census records for Tamil Nadu were lost in floods and the 1981 Census could not be conducted in Assam due to disturbances then in the State. Therefore, percentage to total population for Tamil and Assamese is not given.
3 The percentage of speakers of each language for 1991 has been worked out on the total population of India including the projected population for Jammu and Kashmir where the 1991 Census could not be conducted due to disturbances.
4 Full figures for Kashmiri language for 1991 are not available as the 1991 Census was not conducted in Jammu and Kashmir for reasons explained above.
N.A. : Not available
N : Negligible
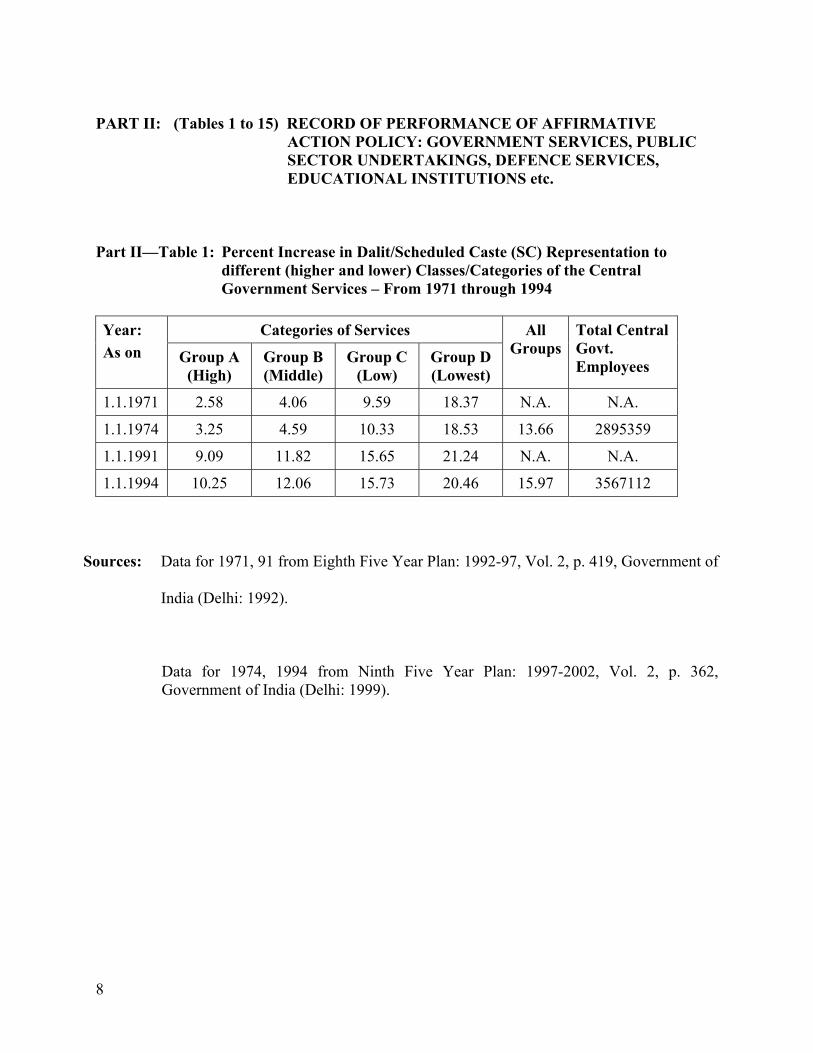
8
PART II: (Tables 1 to 15) RECORD OF PERFORMANCE OF AFFIRMATIVE
ACTION POLICY: GOVERNMENT SERVICES, PUBLIC SECTOR UNDERTAKINGS, DEFENCE SERVICES, EDUCATIONAL INSTITUTIONS etc.
Part II—Table 1: Percent Increase in Dalit/Scheduled Caste (SC) Representation to
different (higher and lower) Classes/Categories of the Central Government Services – From 1971 through 1994
Categories of Services Year:
As on Group A (High)
Group B (Middle)
Group C (Low)
Group D (Lowest)
All Groups
Total Central Govt. Employees
1.1.1971 2.58 4.06 9.59 18.37 N.A. N.A.
1.1.1974 3.25 4.59 10.33 18.53 13.66 2895359
1.1.1991 9.09 11.82 15.65 21.24 N.A. N.A.
1.1.1994 10.25 12.06 15.73 20.46 15.97 3567112
Sources: Data for 1971, 91 from Eighth Five Year Plan: 1992-97, Vol. 2, p. 419, Government of
India (Delhi: 1992).
Data for 1974, 1994 from Ninth Five Year Plan: 1997-2002, Vol. 2, p. 362, Government of India (Delhi: 1999).

9
Part II—Table 2: Percent Increase in Tribal/Scheduled Tribes (ST) Representation to
different (higher & Lower) Classes/Categories of the Central Government Services from 1971 through 1994
Categories of Services Year: As on Group A
(High) Group B (Middle)
Group C (Low)
Group D (Lowest)
All Groups
Total Central Govt. Employees
1.1.1971 0.41 0.43 1.70 3.65 N.A. N.A.
1.1.1974 0.57 0.49 2.13 3.84 2.81 2895359
1.1.1991 2.53 2.35 4.89 6.82 N.A. N.A.
1.1.1994 2.92 2.81 5.38 6.15 5.48 3567112
Sources: Data for 1971; 91 from Eighth Five Year Plan: 1992-97, Vol. 2, p. 419, Government
of India (Delhi: 1992).
Data for 1974, 1994 from Ninth Five Year Plan: 1997-2002, Vol. 2, p. 362, Government of India (Delhi: 1999).

10
Part II—Table 3: Representation of SCs and STs in Central Government Services as on 1.1.2000
GROUP TOTAL SC % ST %
A 88567 9535 10.77 2940 3.32
B 127148 15424 12.13 3631 2.86
C 2290323 362799 15.84 145202 6.34
D (Excluding Sweepers) 1002694 183004 18.25 66608 6.64
Sweepers 130285 74285 57.02 6096 4.68
Total (Excluding Sweepers)* 3508732 570762 16.27 218381 6.22
Total (Including Sweepers) 3639017 645047 17.73 224477 6.17
Note: Information in respect of Department of Revenue is not included. *Sweepers are excluded as their recruitment is unrelated to working of the policy; SCs
have been traditionally recruited as sweepers by the Government.
Source: Ministry of Personnel, Public Grievances & Pensions Annual Report 2001-02 (Para 5.2).

11
Part II—Table 4: Percent Representation of Brahmins and other Upper Caste Members to the elite all-India Services: Indian Administrative Service (IAS),
Indian Foreign Service (IFS), Indian Police Service (IPS) during the period when Reservations Policy did not make an impact: 1947–56
Name of the Service Brahmins Higher (Dwija Castes: non-Sc, non-ST, non-OBC)
1947–56 1957–63 1947–56 1957–63
IAS 34 36 94 81
IFS 22 22 82 89
IPS 31 21 81 77
Other Services 38 29 84 79
Source: V. Subramaniam, ‘Social Background of India’s Administrators’. Reproduced from H. Mehta and H. Patel (eds.), Dynamics of Reservations Policy (New Delhi, 1985), p. 99.

12
Part II—Table 5: Representation of SC and ST Members to the elite all-India Services during the period when the impact of Reservations Policy began to be
felt: from 1994 to 2000
Year of Examination
Total vacancies filled
Vacancies filled by SC candidates % SC in 1991 population = 14.48
Vacancies filled by ST candidates % ST in 1991 population = 8.08
IAS 1994 80 12 (15.0) 6 (7.5) 1995 80 12 (15.0) 6 (7.5) 1996 76 12 (15.8) 6 (7.9) 1997 55 8 (14.5) 4 (7.3) 1998 55 7 (12.7) 3 (5.5) 2000 59 9 (15.3) 5 (8.5)
IFS 1994 14 2 (14.3) 1 (7.1) 1995 16 2 (12.5) 1 (6.3) 1996 14 3 (21.4) 1 (7.1) 1997 16 3 (18.8) 1 (6.3) 1998 10 1 (10.0) 1 (10.0) 2000 18 0 2 (11.1)
IPS 1994 98 15 (15.3) 7 (7.1) 1995 98 15 (15.3) 7 (7.1) 1996 96 15 (15.6) 8 (8.3) 1997 84 12 (14.3) 7 (8.3) 1998 36 2 (5.6) 3 (8.3) 2000 36 6 (16.7) 4 (11.1)
Source: Ministry of Personnel Annual Reports: 1999-2000 and 2000-2001

13
Part II—Table 6: Percentage of Scheduled Caste/Scheduled Tribe Representation in
Public Sector Undertakings: 1971 to 1984
Scheduled Castes Scheduled Tribes Category 1971 1989 1971 1989
Class I (Group A) 0.52 5.76 0.17 1.29 Class II (Group B) 1.54 8.41 0.16 2.31 All categories 8.17 20.36 2.24 9.68 (Separately for CI.III & IVB not available) Source: Eighth Five-Year Plan, Vol. 2, p. 419. Part II—Table 7: Representation of SCs & STs in different job categories in Central
Public Enterprises (PSUs) as on 1.1.2002
Job Category Total No. of Employees
SCs No. Percentage STs No. Percentage
High Level : Group ‘A’ 1,95,027 21,848 11.20 6,545 3.36
Middle Level: Group ‘B’ 1,89,089 22,707 12.00 9,275 4.90
Lower Level: Group ‘C’ 8,89,379 1,69,401 19.04 78,271 8.80
Lowest Level: Group ‘D’ (Excluding Sweepers)
3,63,267 78,721 21.67 39,457 10.85
Total 16,36,762 2,92,667 17.88 1,33,548 8.16 Note: Sweepers have been excluded from this category as these jobs are traditionally held
by the SCs and as such it does not reflect on the working of the policy. Source: Department of Public Enterprises, official web: http://www.dpe.nic.in/anrch5.htm

14
Part II—Table 8: Table Showing Castewise Representation in Managerial Cadre (non-Government Sector)—1971
Caste Percentage in the cadre of manager
Brahmins 41.4 Business castes: Bania, Arora, etc. 43.2
Cultivators: Jat, Patels, etc. 24.3 Other low castes (OBCs) 0.8
Untouchables (SC) 0.4
Note: The principle of affirmative action is not practised in any form in the private/corporate sector in India. The debate initiated recently by some civil society groups on the issue of ‘equal opportunity’ and ‘diversity’ in recruitment has not found any resonance in the corporate sector.
Source: Jain Sagar C., Indian Manager: His social origin and career, 1971. Reproduced
from H. Mehta and H. Patel (eds.), Dynamics of Reservations Policy (New Delhi, 1985), p. 98.
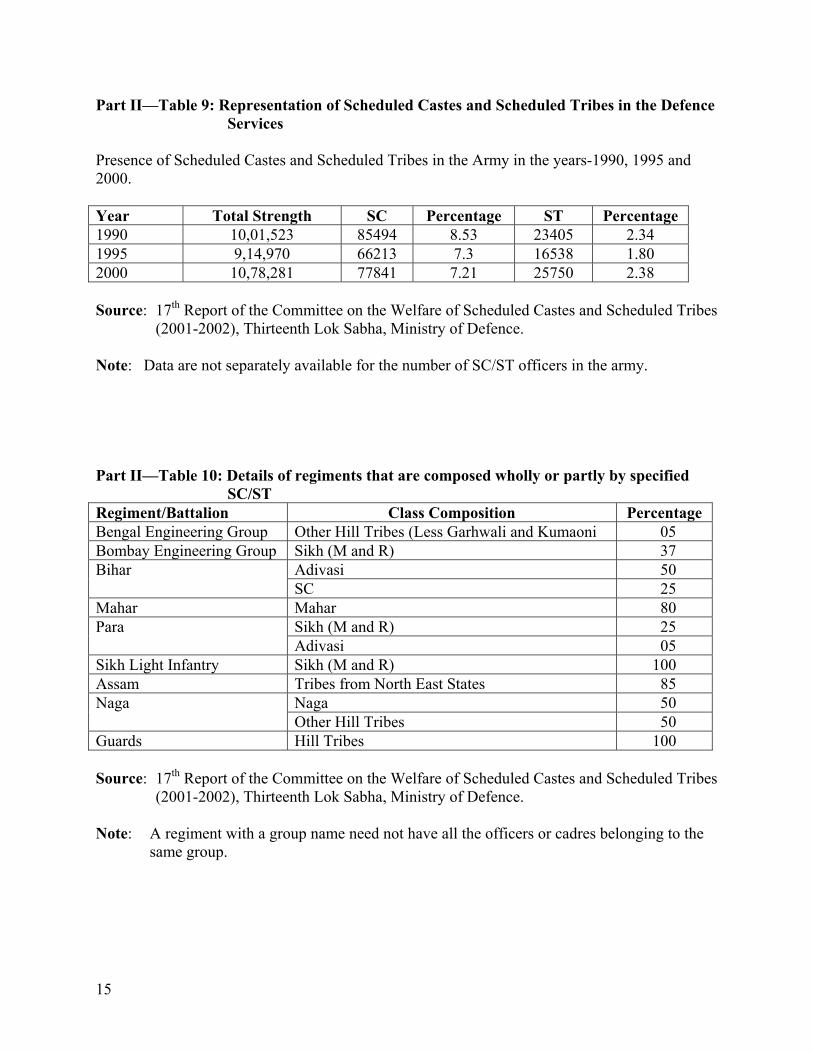
15
Part II—Table 9: Representation of Scheduled Castes and Scheduled Tribes in the Defence Services
Presence of Scheduled Castes and Scheduled Tribes in the Army in the years-1990, 1995 and 2000. Year Total Strength SC Percentage ST Percentage 1990 10,01,523 85494 8.53 23405 2.34 1995 9,14,970 66213 7.3 16538 1.80 2000 10,78,281 77841 7.21 25750 2.38 Source: 17th Report of the Committee on the Welfare of Scheduled Castes and Scheduled Tribes
(2001-2002), Thirteenth Lok Sabha, Ministry of Defence. Note: Data are not separately available for the number of SC/ST officers in the army. Part II—Table 10: Details of regiments that are composed wholly or partly by specified
SC/ST Regiment/Battalion Class Composition Percentage Bengal Engineering Group Other Hill Tribes (Less Garhwali and Kumaoni 05 Bombay Engineering Group Sikh (M and R) 37
Adivasi 50 Bihar SC 25
Mahar Mahar 80 Sikh (M and R) 25 Para Adivasi 05
Sikh Light Infantry Sikh (M and R) 100 Assam Tribes from North East States 85
Naga 50 Naga Other Hill Tribes 50
Guards Hill Tribes 100 Source: 17th Report of the Committee on the Welfare of Scheduled Castes and Scheduled Tribes
(2001-2002), Thirteenth Lok Sabha, Ministry of Defence. Note: A regiment with a group name need not have all the officers or cadres belonging to the
same group.

16
Part II—Table 11: Number of Scheduled Caste and Scheduled Tribe Personnel in the
Indian Army as of 31st Dec 1999
Scheduled Castes Scheduled Tribes Officers Others Total Officers Others Total
82 70330 70412 34 25913 25947 Source: 17th Report of the Committee on the Welfare of Scheduled Castes and
Scheduled Tribes (2001-2002), Thirteenth Lok Sabha, Ministry of Defence. Part II—Table 12: Designationwise Position of SC/ST Teachers in University Teaching
Departments/University Colleges (1992-93) Designation Total SC Percentage ST Percentage Professor 3338 32 0.96 11 0.33 Reader 5837 104 1.78 31 0.53 Lecturer 10191 328 3.22 81 0.79 Source: UGC, ‘Representation of Scheduled Castes and Scheduled Tribes in Enrolment,
Teaching and Non-Teaching Staff in University Teaching epartments/University Colleges’, p. 55. Reproduced from Virginius Xaxa, “Protective Discrimination: Why Scheduled Tribes Lag Behing Scheduled Castes”, Economic and Political Weekly, July 21, 2001, p. 2769.

17
Table 13: The OBCs (and SC/ST) in the Central Government Services: 1989*
Class I Class II Class III & IV All Classes Depts/Bodies
Total SC/ST OBC Total SC/ST OBC Total SC/ST OBC Total SC/ST OBC
1. Ministries/ Departments 11707
840 (7.18)*
303
(2.59) 43803
5985
(13.66)
1742 (3.98)
17829
5518 (30.95)
1500 (8.41)
73330
12343 (16.83)
3545 (4.83)
2. Autonomous Bodies/ Attached & Subordinate Offices
81325
5399 (6.64)
4147 (5.09)
503337
91431 (18.16)
59079 (11.74)
322948
67118 (20.78)
67786 (20.98)
907610
163948 (18.06)
131012 (14.43)
3. Public Sector Undertakings 80994
3652 (4.51)
3719 (4.59)
365785
68566 (18.74)
36242 (9.91)
143910
45646 (31.72)
22689 (15.77)
590689
117864 (19.95)
62650 (10.61)
Total 174026
9891 (5.68)
8169 (4.69)
912925
165982 (18.18)
97063 (10.63)
484687
118282 (24.40)
91975 (18.98)
151638
294155 (18.72)
197207 (12.55)
*Figures in parenthesis represent percentages Source: Report of the Backward Classes (Mandal) Commission, 1980, Vol. II, p. 92.

18
Part II—Table 14: The OBCs in the Central Government Services: 1999
GROUP Total Employees
Reserved for OBCs
% OBCs Recruited
%
A 82129 988 1.2 432 0.53 B 107622 632 0.59 263 0.24 C 2313481 17975 0.78 8834 0.38 D 1102262 9460 0.86 3833 0.35
TOTAL 3605494 29055 0.81 13362 0.37 Note: Reservations for OBCs in Central Government jobs came into force for the first
time by the Government order providing for 27% reservations in only 1991. However, OBC representation in the provincial states services has been there since many states has reached allocated proportions.
Source: Ministry of Personnel Annual Report: 2000-2001.
Part II--Table 15: Amenities Available to Dalits (Percentages)
All Dalits Amenities Rural Urban Rural Urban
Safe Drinking Water 55.5 81.4 59.84 80.59 Electricity 30.5 75.8 21.84 56.32 Toilet 9.3 65.5 5.15 38.28 Safe Water, Electricity and Toilet 3.9 50.5 3.35 32.34 None of the above facilities 31.3 5.4 32.14 9.62
Source: Census of India 1991 for columns 2 and 3; Advocacy Update: National Centre for
Advocacy Studies, No 15, January-March 2001 for columns 4 and 5.

19
PART III: (Tables 1 to 9) IMPACT ON EDUCATION Part III—Table 1: Literacy Rates for Scheduled Caste/Scheduled Tribe Population
by Sex-1991
Scheduled Caste Scheduled Tribe State/Union Territory
Person Male Female Person Male Female INDIA* 37.41 49.91 23.76 29.60 40.65 18.19
1. Andhra Pradesh 31.59 41.88 20.92 17.16 25.25 8.68 2. Arunachal Pradesh 57.27 66.25 41.42 34.45 44.00 24.94 3. Assam 53.94 63.88 42.99 49.16 58.93 38.98 4. Bihar 19.49 30.64 7.07 26.78 38.40 14.75 5. Delhi 57.60 68.44 43.82 — — — 6. Goa 58.73 69.55 47.51 42.91 54.43 29.01 7. Gujarat 61.07 75.47 45.54 36.45 48.25 24.20 8. Haryana 39.22 52.06 24.15 — — — 9. Himachal Pradesh 53.20 64.98 41.02 47.09 62.74 31.18 10. Karnataka 38.06 49.69 25.95 36.01 47.95 23.57 11. Kerala 79.66 85.22 74.31 57.22 63.38 51.07 12. Madhya Pradesh 35.08 50.51 18.11 21.54 32.16 10.73 13. Maharashtra 56.46 70.45 41.59 36.79 49.09 24.03 14. Manipur 56.44 65.28 47.41 53.63 62.39 44.48 15. Meghalaya 44.27 54.56 31.19 46.71 49.78 43.63 16. Mizoram 77.92 77.54 81.25 82.73 86.67 78.74 17. Nagaland — — — 60.59 66.27 54.51 18. Orissa 36.78 52.42 20.74 22.31 34.44 10.21 19. Punjab 41.09 49.82 31.03 — — — 20. Rajasthan 26.29 42.38 8.31 19.44 33.29 4.42 21. Sikkim 51.03 58.69 42.77 59.01 66.80 50.37 22. Tamil Nadu 46.74 58.36 34.89 27.89 35.25 20.23 23. Triupura 56.66 67.25 45.45 40.37 52.88 27.34 24. Uttar Pradesh 26.85 40.80 10.69 35.70 49.95 19.86 25. West Bengal 42.21 54.55 28.87 27.78 40.07 14.98
Union Territories 1. Andaman and Nicobar
Islands — — — 56.62 64.16 48.74 2. Chandigarh 55.44 64.74 43.54 — — — 3. Dadra and Nagar Haveli 77.64 88.03 66.61 28.21 40.75 15.94 4. Daman and Diu 79.18 91.85 67.62 52.91 63.58 41.49 5. Lakshadweep — — — 80.58 89.50 71.72 6. Pondicherry 56.26 66.10 46.28 — — —
*Excludes Jammu and Kashmir.
Source: Registrar General of India, Decennial Census 1991, Series 1 Paper 1 of 1993, Primary Census Abstract for SC and ST. Reports.

20
Part III—Table 2: Increase In Literacy rate of Total Population SC/ST During 1961–1991
Scheduled Caste (% Increase)
Scheduled Tribe (% Increase)
Total SC & ST Population (% Increase)
Year
Total SCs Male Female Total
STs Male Female Total Male Female
All India Literacy
Rates
1961 10.27 16.96 3.29 8.53 13.83 3.16 28.31 40.40 15.34 24.02
1971 14.67 22.36 6.44 11.30 17.63 4.85 34.45 45.95 21.97 29.46 (42.84%) (31.83%) (95.75%) (32.47%) (27.48%) (53.48%) (21.69%) (13.74%) (43.22%)
1981 21.38 31.12 10.93 16.35 24.52 8.04 43.56 56.37 29.75 43.67 (45.74%) (39.18%) (69.72%) (44.69%) (39.08%) (65.77%) (26.44%) (22.67%) (35.41%)
1991 37.41 49.91 23.76 29.60 40.65 18.19 52.21 64.13 39.29 52.21 (74.98%) (60.38%) (117.38%) (81.04%) (65.78%) (126.24%) (19.86%) (13.77%) (32.07%)
Source: Census of India 1961-91 and National Literacy Mission: Literacy Scenario in India, Government of India Web: http:/www.nlm.nic.in/tables/f_scst.htm

21
Part III—Table 3: Literacy Rates of SCs and STs—The Gains and the Gaps Category 1971 1981 1991* % Increase of
1991 over 1971 General Population including SC/ST) 29.45 36.23 52.21 77.28 Scheduled Castes 14.67 21.38 37.41 155.01 Scheduled Tribes 11.30 16.35 29.60 161.95 Gap between SCs and the General Populations 14.78 14.85 14.80 0.14 Gap between STs and the General Population 18.15 19.88 22.61 24.57 *Excludes 0-6 age group Source: Educational Development of SCs and STs, Department of Education, 1995.
Reproduced from Ninth Plan: 1999-2002, p. 358. Part III—Table 4: Female Literacy Rates of SCs, STs and General Population Category 1971 1981 1991*
Female Literacy Rates All Communities including SC/ST 21.97 29.85 39.29Scheduled Castes 6.44 10.93 23.76Scheduled Tribes 4.85 8.04 18.19
GAP Gap between female literacy rate of SCs and of All communities 15.53 18.92 15.53Gap between female literacy rate of STs and of All communities 17.12 21.81 21.10
*Excludes 0-6 age group Source: Educational Development of SCs and STs, Department of Education, 1995.
Reproduced from Ninth Plan: 1999-2002, p. 358.

22
Part III—Table 5: Gross Enrolment Ratios of SCs & STs and General Population Level/Years General Population Scheduled Castes Scheduled Tribes Boys Girls Total Boys Girls Total Boys Girls Total1980-81
I-V (Primary) (6-11 yrs.)
95.8 64.1 80.5 105.4 57.8
82.2
94.2 45.9 70.0
VI-III (Middle) (11-14 yrs)
54.3 28.6 41.9 41.4 16.2
29.1
28.2 10.8 19.5
1990-91 I-V (Primary) (6-11 yrs)
114.0 85.5 100.1 122.7 80.6
102.2
126.8 78.6 103.4
VI-III (Middle) (11-14 yrs)
76.6 47.0 62.1 61.4 33.3
47.7
51.3 27.5 39.7
1995-96 I-V (Primary) (6-11 yrs)
114.5 93.3 104.3 127.6 95.1
111.9
130.0 94.9
113.0
VI-III (Middle) (11-14 yrs)
79.5 54.9 67.6 74.9 46.8
61.3
61.6 37.6
50.0
Pace of Progress
I-V (Primary level) 18.7 29.2 23.8 22.2 37.3 29.7 35.8 49.0 43.0VI-III (Middle level) 25.2 26.3 25.7 33.5 30.6 32.2 33.4 26.8 30.5
Source: Selected Education Statistics, 1995-96, Department of Education, New Delhi. Reproduced from Ninth Plan 1997-2002, p. 359.

23
Part III—Table 6: Drop-out Rates amongst SCs and STs at various stages of Education Category Classes I-V Classes I-VIII Classes I-X
1980-81 1989-90 1980-81 1990-91 1980-81 199-91 General 58.70 48.08 72.70 63.40 82.46 71.34
SC 60.16 49.03 76.84 72.09 86.91 80.58 ST 75.66 63.81 86.71 80.10 91.18 86.00
Source: Educational Development of SCs and STs (1995) and Unpublished Data of the
Department of Education. Note: 1. Since the latest data on the drop-out rates of SCs and Sts is available only for 1990-91,
data for General Population was also used for the same year for effective comparison.
2. Figures for 1990-91 in respect of SCs and STs are not available for primary level. Reproduced from Ninth Plan: 1997-2002, Government of India, p.360. Table 7: Enrolment by Stages of Dalit Children, 1994–95 (in millions)
Dalits Tribals Others Stages
Boys Girls Total Boys Girls Total Boys Girls TotalPrimary 1.00 0.75 1.80 0.54 0.36 0.90 6.20 4.70 10.90Middle 0.35 0.21 0.56 0.15 0.08 0.23 2.50 1.50 4.00Secondary 0.20 0.08 0.29 0.07 0.04 0.11 1.60 0.08 2.40Hr. Education 0.031 0.01 0.042 0.01 0.004 0.01 0.31 0.16 0.47 Source: Report of the Ministry of Human Resource Development, 1995 Reproduced from Advocacy Update, January-March, No. 15, p. 5, published by National Centre for Advocacy Studies, Pune, India.

24
Table 8: Percent SC and ST Students Enrolled in Different Faculties of Higher Education in 1992-1993 Faculty SC ST SC and ST Arts 8.0 3.9 11.9 Science 5.8 2.1 7.9 Engg./Tech 8.1 2.1 10.2 Medicine 11.9 4.4 16.3 Agriculture 10.7 5.4 16.1 Law 11.7 2.7 14.4 Note: Enrolment facultywise includes levels ranging from undergraduate to research plus
diploma/certificate course. Source: UGC, ‘Representation of Scheduled Castes and Scheduled Tribes in Enrolment,
Teaching and Non-Teaching Staff/University Colleges’, p. 5. Reproduced from Verginius Xaxa, “Protective Discrimination: Why Scheduled Tribes Lag Behind Scheduled Castes”, Economic and Political Weekly, July 21, 2001.
Table 9: Admission of Scheduled Caste/Tribe Students in IIT-Kanpur (1967-78)
No. of Candidates Applied for JEE
No. of Candidates in Merit and Called for
Interview
No. of Candidates Offered
Admissions
No. of Candidates Actually Admitted
Year
Total SC ST SC ST SC ST SC ST Total
1967-68 62 47 15 - - - - - - -
1968-69 47 - - 2 - - - - - -
1969-79 35 29 6 7 1 7 1 7 1 3
1970-71 28 - - 6 1 6 1 6 1 7
1971-72 35 - - 1 - 1 - 1 - 1
1972-73 79 - - 1 - 1 - 1 - 1
1973-74 98 86 12 42 6 42 6 - - 46
Source: K.N. Sharma, et. al. (1974): ‘Educational Arithmetic of Social Inequality’, A Study of
Admission and Adjustment of IIT, Kanpur Students (Mimeographed).

25
PART IV: (Tables 1 to 2) IMPACT ON UNEMPLOYMENT Part IV—Table 1: Total and SC, ST Job Seekers (Unemployed) from 1995 to 2000 as
shown on the Live Register of Employment Exchange (In Thousand)
Scheduled Castes Scheduled Tribes Year Number Percentage Number Percentage
Total Number
1995 5095.0 13.9 1409.4 3.8 36742.2 1996 5208.9 13.9 1467.3 3.9 37429.6 1997 5626.0 14.4 1586.7 4.1 39139.9 1998 5799.4 14.5 1694.6 4.2 40089.6 1999 5948.0 14.7 1762.4 4.4 40371.4 2000 6135.3 14.8 1860.1 4.5 41343.6
Source: “Employment Exchange Statistics”, Directorate General of Employment and Training,
Ministry of Labour, Government of India, New Delhi. Part IV—Table 2: Total and SC, ST Educated Job Seekers (Unemployed) from 1995 to
2000 as shown on Live Register of Employment Exchanges (In Thousands)
Scheduled Castes
Unemployed Scheduled Tribes
Unemployed Year
Number Percentage Number Percentage
Total Educated Unemployed
1996 3134.4 12.4 876.1 3.4 25265.3 1997 3539.7 13.0 958.1 3.5 27282.0 1998 3858.5 13.9 1005.4 3.6 27788.9 1999 3961.6 13.8 1209.7 4.2 28660.3 2000 4068.6 13.8 1455.3 4.9 29548.8
Note: Definition of Educated – a job seeker who is having qualification of the level of
Matriculation and above. Source: “Employment Exchange Statistics”, Directorate General of Employment and Training,
Ministry of Labour, Government of India, New Delhi.

26
PART V: (Tables 1 to 9) IMPACT ON POVERTY
Part V—Table 1: Percentage of Population Living Below Poverty Line
Category 1984-84 1993-94 Percentage Decrease
General 44.48 35.97 (-) 8.51 SCs 57.60 48.37 (-) 9.23STs 63.14 51.14 (-) 12.00
Source: Perspective Planning Division, Planning Commission, New Delhi Note: The aggregate poverty ratio of SC and ST population 1983-84 has been worked out as a
weighted average of rural and urban poverty ratio using 1981 Census population of the respective Groups in rural and urban areas as weights. In a similar way, 1991 Census population is used to obtain aggregate poverty ratio for these two groups in 1993-94
Reproduced from Ninth Five Year Plan, 1997-2002, Planning Commission, Government
of India (p. 361).

27
[Part V- Tables 2 to 9: The following section presents tables showing extent of poverty reduction among Dalits (SCs) and Tribals (STs), using three poverty measures, between 1993-94 and 1999-2000 as well as the findings based on these and other data (not presented here). The tables and findings at the end of the tables are excerpted from K. Sundaram and Suresh D. Tendulkar, “Poverty among Social and Economic Groups”, Economic and Political Weekly, December 13, 2003, pp. 5263-76.] Part V—Table 2: Composition of Total and Poor Population Located in Households
Classified by Social–Group Affiliation: All India Rural 1993–94— 1999–2000
1993–94 1999–2000 Percentage Share of the Household Type in Percentage Share of the Household Type in
Category
Total Rural Population
Rural Poor Population
HCR Total Rural Population
Rural Poor Population
HCR*
Social Groups Scheduled castes 21.10 28.19 45.69 20.43 27.10 38.38 Scheduled tribes 10.83 15.46 48.81 10.49 17.41 48.02 Others 68.07 56.35 28.30 69.08 55.49 23.23 All households 100.00
(659,025) 100.00
(225,392) 34.20 100.00
(727,611) 100.00
(210,498) 28.93
* Notes: HCR: (Head Count Ratio) is the commonly used measure of poverty estimating size (proportion) of poor in a population.
Part V—Table 3: Composition of Total and Poor Population Located in Households
Classified by Social–Group Affiliation: All India Urban 1993–94— 1999–2000
1993–94 1999–2000 Percentage Share of the Household Type in Percentage Share of the Household Type in
Category
Total Urban Population
Urban Poor Population
HCR Total Urban Population
Urban Poor Population
HCR*
Social Groups Scheduled castes 13.85 22.48 42.85 14.38 23.57 37.84 Scheduled tribes 3.21 4.09 33.63 3.40 5.18 35.15 Others 82.94 73.43 23.39 82.22 71.26 20.01 All households 100.00
(234,981) 100.00
(67,675) 26.41 100.00
(276,425) 100.00
(63,827) 23.09
* Notes: HCR: (Head Count Ratio) is the commonly used measure of poverty estimating size (proportion) of poor in a population.

28
Part V—Table 4: Poverty Measures for Population Located in Households Classified by Social Groups,
All–India: Rural: 1993–94—1999–2000
1993–94 1999–2000 Category HCR
(Per Cent) No. of Poor
(000) PGI FGT HCR
(Per Cent) No. of Poor
(000) PGI* FGT+
Scheduled castes 45.69 63,558 0.10369 0.033435 38.38 57,036 0.07920 0.02407
Scheduled tribes 48.81 34,883 0.11780 0.044072 48.02 36,651 0.11451 0.03842
Others 28.30 126,941 0.05603 0.01692 23.23 116,762 0.04298 0.01211
OBCs in others) (NA) (NA) (NA) (NA) (29.04) (66,369) (0.05475) (0.01560)
Note: *PGI (Poverty Gap Index), is constructed and used as indicator of the depth of poverty.
+ FGT (Square Poverty Gap) is constructed and used as a measure reflecting severity of poverty. For explication and discussion of the measures see Sundaram and Tendulkar, cited at the beginning of these tables.
Part V—Table 5: Poverty Measures for Population Located in Households Classified by Social Groups,
All–India: Urban: 1993–94—1999–2000
1993–94 1999–2000 Category
HCR (Per Cent)
No. of Poor (000)
PGI FGT HCR (Per Cent)
No. of Poor (000)
PGI FGT
Scheduled castes 42.85 13,956 0.10778 0.03876 37.84 15,041 0.08766 0.02894
Scheduled tribes 33.63 2,537 0.08353 0.02975 35.15 3,304 0.08980 0.03350
Others 23.39 45,580 0.05110 0.01673 20.01 45,482 0.04209 0.01298
Note: *PGI (Poverty Gap Index), is constructed and used as indicator of the depth of poverty.
+ FGT (Square Poverty Gap) is constructed and used as a measure reflecting severity of poverty. For detailed explication and discussion of the measures see Sundaram and Tendulkar, cited at the beginning of these tables.

Part V—Table 6: Percentage Change (1993-94 and 1999-2000) in Poverty Indicators by Socio-Economic Categories of All-India Rural Population
Socio-Economic Category HCR PGI FGT* Scheduled castes
1. Self-employed agricultural -14.80 -25.97 -35.09 2. Self-employed non-agricultural -7.95 -11.78 -16.72 3. Agricultural labour -18.98 -27.50 -34.04 4. Other labour -14.40 -5.89 -3.20 5. Others -31.93 -44.90 -50.68
All scheduled castes -16.00 -23.62 -29.93 Scheduled tribes
1. Self-employed agricultural -7.69 -10.95 -15.48 2. Self-employed non-agricultural -10.80 -12.62 -21.92 3. Agricultural labour 1.98 0.94 -1.56 4. Other labour -4.39 -6.73 -11.66 5. Others -30.49 -30.74 -22.72
All scheduled tribes -1.62 -2.79 -5.64 Others
1. Self-employed agricultural -19.78 -26.13 -32.37 2. Self-employed non-agricultural -20.74 -22.85 -28.97 3. Agricultural labour -18.26 -26.43 -32.41 4. Other labour -29.38 -27.86 -30.45 5. Others -26.20 -35.29 -36.91 Social groups others -17.92 -23.29 -28.42
MoL category, all social groups MoL category, all social groups -17.10 -22.98 -28.77 Self-employed agricultural -17.44 -20.01 -26.25 Agricultural labour -15.73 -22.66 -28.00 Other labour -22.42 -19.54 -20.92 Others -31.17 -40.49 -42.33 All households -15.38 -20.47 -25.43

Part V—Table 7: Percentage Change (1993-94—1999-2000) in Poverty Indicators by Socio-Economic Categories of All-India Urban Population
Socio-Economic Category HCR PGI FGT Scheduled castes
Self-employed -2.50 -11.99 -15.83 Wage/salaried earner -33.16 -37.75 -46.09 Casual labour -9.23 -16.96 -23.83 Others -11.14 -32.80 -48.46 All scheduled castes -11.69 -13.67 -25.34
Scheduled tribes Self-employed -6.95 -9.51 -9.15 Wage/salary earner -8.65 -6.46 6.81 Casual labour 12.38 7.67 -0.60 Others -3.22 47.25 158.53 All scheduled tribes 4.52 7.51 12.61
Others Self-employed -10.30 -12.52 -18.91 Wage/salary earner -26.86 -28.55 -35.21 Casual labour -16.84 -20.94 -23.86 Others -22.71 -31.23 -42.50 Social groups others -14.45 -17.63 -22.41
MoL category, all social groups Self-employed -8.39 -12.94 -17.36 Wage/salary earner -27.27 -29.43 -35.33 Casual labour -12.75 -17.94 -22.18 Others -19.95 -28.89 -38.94 All households -12.57 -16.00 -20.79

Part V—Table 8: Percentage Change between 1994 and 2000 in Total Population, Poor Population and Other Poverty Indicators: All–India Rural Population Located in Households Classified by Social Groups (Percentage Change between 1993–94 and 1999–2000) Household Category Total Rural
Population Rural Poor Population
HCR PGI FGT
Social Groups Scheduled castes 6.83 –10.26 –16.07 –23.62 –29.93Scheduled tribes 6.99 5.06 –1.68 –2.79 –5.65Others 12.05 –7.98 –17.92 –23.29 –28.43All households 10.41 –6.57 –15.38 –20.47 –25.43
Part V—Table 9: Percentage Change between 1994 and 2000 in Total Population, Poor Population and Other Poverty Indicators: All–India Urban Population by Household Type and Social Group (Percentage Change between 1993–94 and 1999–2000) Household Category Total Rural
Population Rural Poor Population
HCR PGI FGT
Social Groups Scheduled castes 22.12 7.77 –11.69 –18.67 –25.34Scheduled tribes 24.59 30.23 4.52 7.51 12.61Others 16.62 –0.22 –14.45 –17.63 –22.41All households 17.64 2.85 –12.57 –16.00 –20.79

Findings/Comments Among the social groups, the scheduled castes and scheduled tribes population report levels of poverty well above average on all three indicators of prevalence, depth and severity of poverty in both years and in both rural and urban areas of the country. The other backward castes too suffer from above average levels of poverty, which are, nevertheless, much lower than the poverty levels among the SC and the ST population. The double disadvantage, of being an assetless casual wage labour household in the socially disadvantaged social groups of the scheduled castes or the scheduled tribes, accentuates the prevalence, depth and severity of poverty. Thus, agricultural labour households in the ST population have the highest headcount ratio (close to or above 60 per cent) in both years studied in rural India. Similarly, casual labour households in the SC population in 1993-94 and in the ST population in 1999-2000 reported the highest HCR of 64 per cent in urban India. Given rural and urban poverty lines, rural poverty rates are, in general, higher than their comparable urban counterparts. Exceptions to this pattern are provided by casual labour households in all the social groups and by the self-employed among scheduled castes and in the (residual non-SC/ST) social group of others. In terms of the rates of reduction of poverty indicators between 1993-94 and 1999-2000, among social groups, they were the lowest for the scheduled tribe population in rural India. In urban India however, this social group experienced a rise in all three poverty indicators. Our more disaggregated analysis by MoL categories, within each social group, helped us pinpoint the rise in poverty in the assetless (casual) wage-labour dependent households among the scheduled tribe population as the principal factor underlying a clearly worse-than-average performance in terms of poverty-reduction. It therefore also indicated a clear worsening of the relative poverty situation of the scheduled tribe population in rural India, and even more so, in urban India. In contrast to the ST population, scheduled caste households generally matched or even bettered the average rural/urban household in terms of percentage reduction in all three poverty indicators between 1993-94 and 1999-2000. In a large measure, this was facilitated by a better-than-average performance of agricultural labour households among them in rural India, and of the regular wage/salary earner households in the groups in urban India. (K. Sundaram & S. Tendulkar)
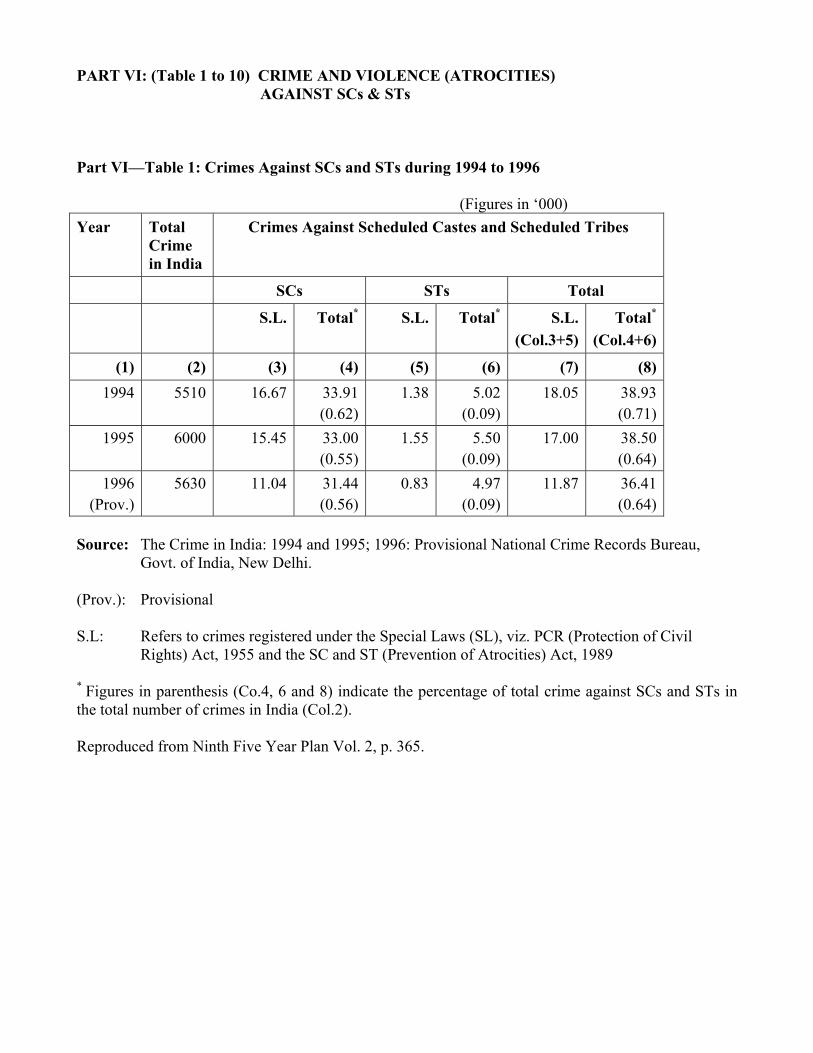
PART VI: (Table 1 to 10) CRIME AND VIOLENCE (ATROCITIES) AGAINST SCs & STs Part VI—Table 1: Crimes Against SCs and STs during 1994 to 1996 (Figures in ‘000) Year Total
Crime in India
Crimes Against Scheduled Castes and Scheduled Tribes
SCs STs Total S.L. Total* S.L. Total* S.L.
(Col.3+5) Total*
(Col.4+6)
(1) (2) (3) (4) (5) (6) (7) (8)1994 5510 16.67 33.91
(0.62)1.38 5.02
(0.09)18.05 38.93
(0.71)1995 6000 15.45 33.00
(0.55)1.55 5.50
(0.09)17.00 38.50
(0.64)1996
(Prov.) 5630 11.04 31.44
(0.56)0.83 4.97
(0.09)11.87 36.41
(0.64) Source: The Crime in India: 1994 and 1995; 1996: Provisional National Crime Records Bureau,
Govt. of India, New Delhi. (Prov.): Provisional S.L: Refers to crimes registered under the Special Laws (SL), viz. PCR (Protection of Civil
Rights) Act, 1955 and the SC and ST (Prevention of Atrocities) Act, 1989 * Figures in parenthesis (Co.4, 6 and 8) indicate the percentage of total crime against SCs and STs in the total number of crimes in India (Col.2). Reproduced from Ninth Five Year Plan Vol. 2, p. 365.

Part VI—Table 2: Atrocities against Scheduled Castes and Scheduled Tribes Crime-Wise Classification of the number of atrocity cases during 1990, 1991 and 1992
Number of cases reported during 1990 1991 1992
Type of cases
SC ST Total SC ST Total SC ST TotalMurder 584 124 708 610 146 756 693 118 811Grievous Hurt 1691 259 1950 1706 320 2026 1619 232 1851Rape 885 339 1224 784 334 1118 835 383 1218Arson 599 59 658 602 70 672 619 61 680Other IPC Offences
13908
2797 16705 13994 3908 17852 14574
2915 17489
Total 17667 3578 21245 17646 4778 22424 18340 3709 22049 Source: Official Website of the Ministry of Human Resource Development, Government of India at
http://shikshanic.nic.in/cd50years/g/S/I6/toc.htm)

Part VI—Table 3: Crime and Violence Against Dalits, 1993–95
No. Crime–heads 1993 1994 19951 Murder 510 546 5712 Dacoity 102 78 703 Robbery 197 258 2184 Arson 369 533 5005 Kidnapping and
Abduction 246 251 276
6 Rape 798 992 8737 Violation of PCR Act* 2,531 1,731 1,5288 Hurt/Injuiries – 4,542 4,5449 Violation of SC/ST
Atrocities Act 1989 – 14,938 13,925
10 Others 20,220 10,038 10,492 Total 24,973 33,908 32,997
*PCR: Protection of Civil Rights Act of 1955. Source: Government of India: 1997, Crime in India 1995, National Crime Records Bureau, Ministry
of Home Affairs, p. 260.

Part VI—Table 4
Cases registered with the police of crimes and atrocities against Dalits: 1996, 1997
Nature of crime 1996 1997 TotalMurder 543 503 1617Injuries 4585 3462 12591Rape 949 1002 2824Kidnaping and Abduction 281 242 799Robbery 213 157 588Arson 464 384 1348Other Offences 13278 11693 35463Total 20313 17443 55230
Source : ‘Racism, Racial Discrimination, Xenophobia and all Forms of Discrimination’, Written Statement submitted by the Robert F Kennedy Memorial to the Commission on Human Rights, Economic and Social Council, United Nations

Part VI—Table 5: State-wise Incidence of Crime and Violence against Dalits (SCs): 1989
State/Union Territories Andhra Pradesh 465 (Barring October) Arunachal Pradesh – Assam 17 Bihar 997 (till November 1989) Goa 2 Gujarat 593 Haryana 77 Himachal Pradesh 70 (till Barring June) Jammu & Kashmir 155 Karnataka 490 (till August 1989) Kerala 456 (till September 1989) Madhtya Pradesh 3878 (till November 1989) Maharashtra 329 (till November 1989) Manipur – Meghalaya – Mizoram – Nagaland – Orissa 318 (till November 1989) Punjab 21 Rajasthan 1588 Sikkim 3 Tamil Nadu 409 (till October 1989) Uttar Pradesh 3945 (till September 1989) West Bengal 12 Andaman & Nicobar Islands – Chandigarh – Dadra & Nagar Haveli – Delhi 5 Goa, Daman & Diu – Lakshadweep – Pondicherry 1 Total: 13031
Source: Home Ministry Report, 1989-90. Reproduced from Mohandas Nemishrai (ed.), Lokayan
Bulletin, No. 4 (Special Number), Delhi: 1989-90.

Part VI—Table 6: State-wise number of atrocities reported against SC and STs during 1992
Number of cases of atrocities State/Union Territory SC ST Total
Andhra Pradesh 724 123 847 Bihar 926 5 931 Goa 3 - 3 Gujarat 1560 304 1864 Haryana 86 - 86 Himachal Pradesh 39 - 39 Jammu and Kashmir 25 - 25 Karnataka 720 27 747 Kerala 703 157 860 Madhya Pradesh 4571 1957 6528 Maharashtra 751 331 1082 Manipur - 1 1 Orissa 383 129 512 Punjab 18 - 18 Rajasthan 2204 636 2840 Sikkim 21 20 41 Tamil Nadu 677 - 677 Uttar Pradesh 4891 - 4891 West Bengal 15 14 29 Chandigarh 20 - 20 Dadra & Nagar Haveli - 5 5 Delhi 2 - 2 Pondicherry 1 1 1 Total 18340 3709 22049 Source: Official Website of the Ministry of Human Resource Development, Government of India at
http://shikshanic.nic.in/cd50years/g/S/I6/toc.htm)
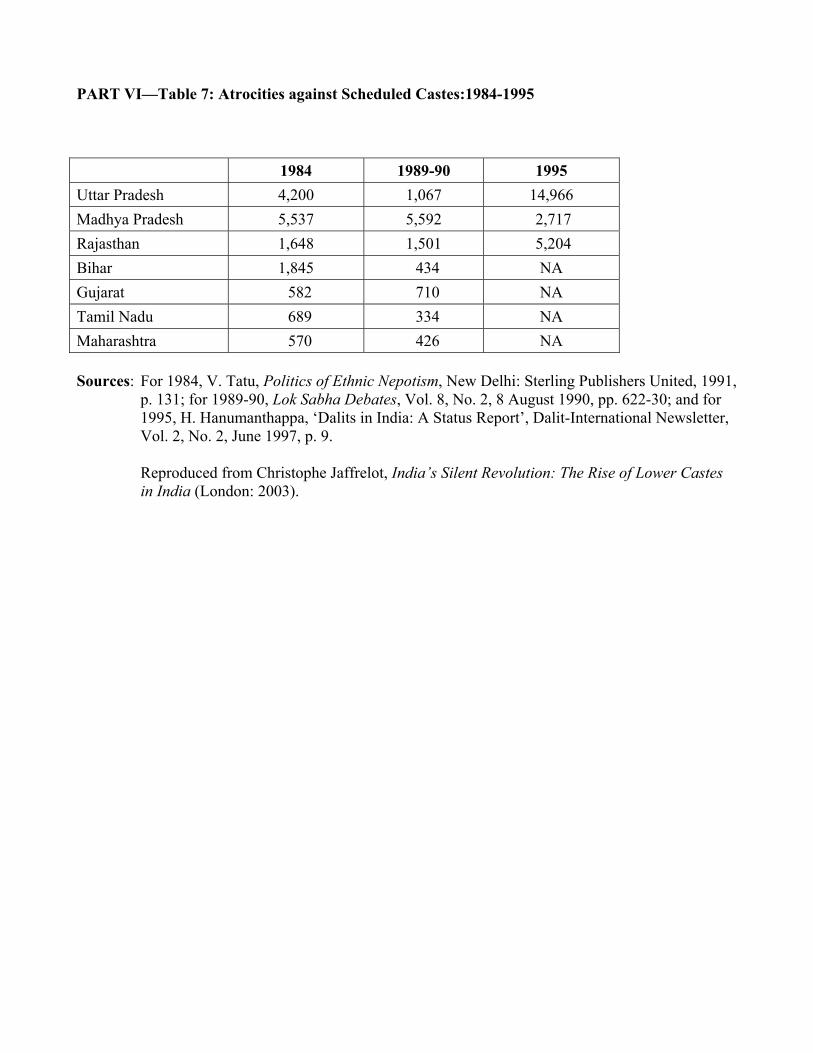
PART VI—Table 7: Atrocities against Scheduled Castes:1984-1995
1984 1989-90 1995 Uttar Pradesh 4,200 1,067 14,966 Madhya Pradesh 5,537 5,592 2,717 Rajasthan 1,648 1,501 5,204 Bihar 1,845 434 NA Gujarat 582 710 NA Tamil Nadu 689 334 NA Maharashtra 570 426 NA Sources: For 1984, V. Tatu, Politics of Ethnic Nepotism, New Delhi: Sterling Publishers United, 1991,
p. 131; for 1989-90, Lok Sabha Debates, Vol. 8, No. 2, 8 August 1990, pp. 622-30; and for 1995, H. Hanumanthappa, ‘Dalits in India: A Status Report’, Dalit-International Newsletter, Vol. 2, No. 2, June 1997, p. 9.
Reproduced from Christophe Jaffrelot, India’s Silent Revolution: The Rise of Lower Castes
in India (London: 2003).

Part VI—Table 8: Ranking of states in terms of incidence of crimes against Scheduled Castes
persons during 1992 Serial Number
State/Union Territory Number of cases per one lakh SC population
1 Sikkim 87.19 2 Gujarat 50.97 3 Madhya Pradesh 47.48 4 Rajasthan 28.97 5 Kerala 24.35 6 Chandigarh 18.87 7 Uttar Pradesh 16.71
All India 13.27 8 Goa 12.31 9 Karnataka 9.77 10 Maharashtra 8.58 11 Orissa 7.47 12 Bihar 7.37 13 Andhra Pradesh 6.84 14 Tamil Nadu 6.32 15 Himachal Pradesh 2.98 16 Haryana 2.65 17 Pondicherry 0.76 18 Punjab 0.31 19 Delhi 0.11 20 West Bengal 0.09 Source: Official Website of the Ministry of Human Resource Development, Government of India at
http://shikshanic.nic.in/cd50years/g/S/I6/toc.htm)
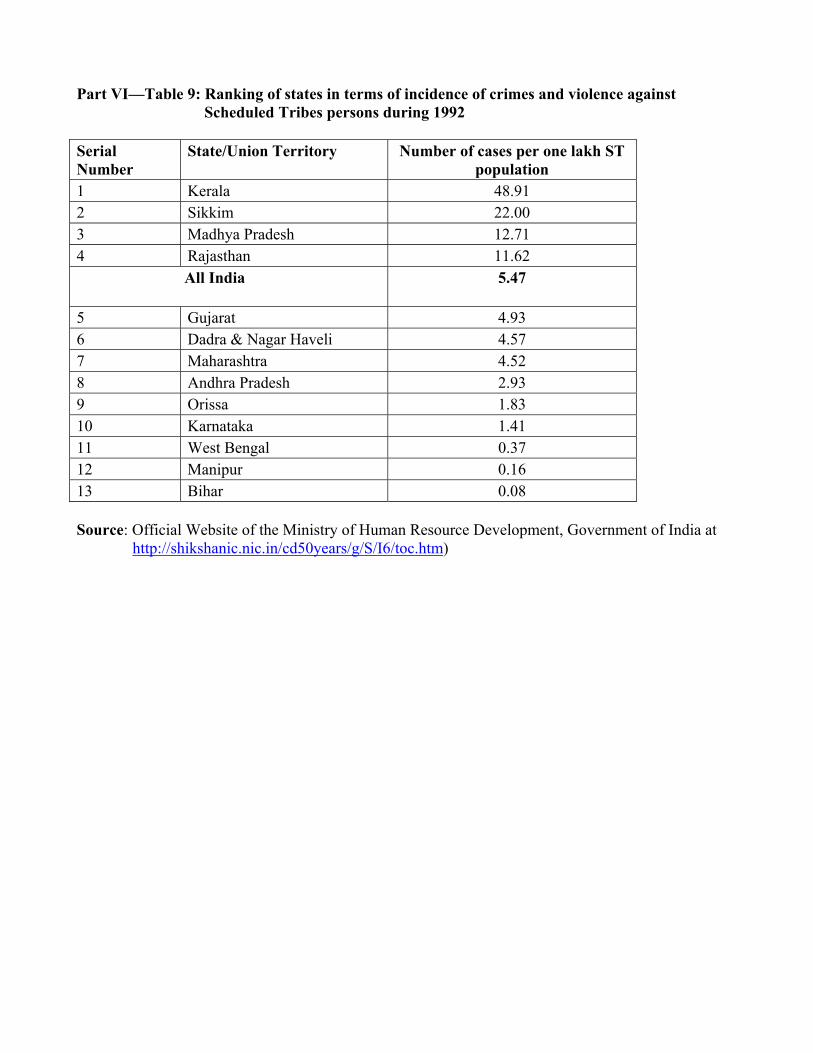
Part VI—Table 9: Ranking of states in terms of incidence of crimes and violence against
Scheduled Tribes persons during 1992 Serial Number
State/Union Territory Number of cases per one lakh ST population
1 Kerala 48.91 2 Sikkim 22.00 3 Madhya Pradesh 12.71 4 Rajasthan 11.62 All India 5.47
5 Gujarat 4.93 6 Dadra & Nagar Haveli 4.57 7 Maharashtra 4.52 8 Andhra Pradesh 2.93 9 Orissa 1.83 10 Karnataka 1.41 11 West Bengal 0.37 12 Manipur 0.16 13 Bihar 0.08 Source: Official Website of the Ministry of Human Resource Development, Government of India at
http://shikshanic.nic.in/cd50years/g/S/I6/toc.htm)

Part VI—Table 10: Statement showing offence-wise distribution of cases of atrocities on the
Scheduled Castes during 1992
Nature of crime and number of cases reported State/Union Territory Murder Grievous
HurtRape Arson Other IPC
Offences Total
Andhra Pradesh
39 225 49 8 403 724
Bihar 36 49 48 44 749 926Goa 1 - - - - 1Gujarat 29 72 10 17 1432 1560Haryana 5 5 24 - 52 86Himachal Pradesh 1 7 5 - 26 39Jammu and Kashmir - 3 2 4 16 25Karnataka 21 25 17 26 631 720Kerala 10 19 39 21 614 703Madhya Pradesh 97 236 287 70 3881 4571Maharashtra 15 35 36 22 643 751Orissa 11 16 17 25 314 383Punjab 7 5 4 - 2 18Rajasthan 63 148 114 79 1800 2204Sikkim - - - - 21 21Tamil Nadu 12 9 2 14 640 677Uttar Pradesh 343 762 174 289 3323 4891West Bengal 1 1 3 - 10 15Chandigarh 1 2 4 - 13 20Delhi 1 - - - 1 2Pondicherry - - - - 1 1Total 693 1619 835 619 14574 18340 Source: Official Website of the Ministry of Human Resource Development, Government of India at
http://shikshanic.nic.in/cd50years/g/S/I6/toc.htm)

Part VI—Table 11: Summary of Digest of Newspaper-reported Atrocities against Dalits July-December 2002
Atrocity Date Place No. Dalits affected Information on Incident
8 August Arora, Bhojpur dist, Bihar
3 dalits from 1 family shot dead
Unknown killers
12 August Meerut one Higher caste suspected of murder - Dalits block highway with body in protest
22 August Balsingh Khera, Nagram, UP
3 fishermen killed incl. a 12 yr-old boy
Killed with sharp-edged weapons
27 August Heend, Muzaffarnagar, UP
a 19 year-old Dalit gang-raped and killed
Woman gang-raped and hacked to death while collecting animal fodder
3 September Ramnagar in Satna district, Bhopal
a dalit youth found hanging Government doctor refused to conduct post-mortem for 2 days
5 October Bhawaniapur Banghusari, Bahraich
a Dalit lynched Villagers killed the leather-worker for poisoning a buffalo
15 October Jhajjar dist, Haryana
5 Dalit men lynched Police mistakenly arrested the leather-workers for killing a cow. The cow was already dead, but the news spread from the police to surrounding villages, the youths were pulled out of the police station and beaten to death outside the police post. Two were torched.
19 October Dongra village, Narnaul, Haryana
a six-year old girl raped and killed
She was abducted while sleeping with her grandmother by unidentified persons, raped and died before being taken to hospital
5 November Burgijoi, Jehanabad
2 women killed, 2 more missing from same family
Bodies of two Dalit women from among four abducted on November 1 were found packed in gunny sacks in a pond.
15 November Aatgaon, UP 3 beaten (young couple and a friend) and burnt alive
After an upper caste young woman eloped with a young Dalit man, the two of them and the man's friend who helped them marry were beaten then burnt alive by the bride's family. Their charred remains were recovered from a nearby pond.
1 December Bhilai, Raipur a 17 year-old Dalit lynched The boy was lynched because of his affair with a Muslim girl - his body was found hanging in an externally locked cattle shed.
Lynching / Murder
21 December Doddathagalli, Bangalore
Dalit farmer burnt alive Returning home after selling potatoes, the assailants poured kerosene on the Dalit and set him on fire, robbing him of 30 Rupees.
15 July Hazaribagh, Jharkhand
2 dalit women Gang-raped, stripped naked, paraded, faces smeared with lime and cow dung
23 August Behta Bujurg, Kanpur
a 14 year-old dalit girl Gang-raped by four persons - police refused to register case
27 August Heend, Muzaffarnagar, UP
a 19 year-old Dalit gang-raped and killed
Woman gang-raped and hacked to death while collecting animal fodder
12 September Aujula village, Kapurthala
a Dalit girl raped repeatedly Editor of a monthly journal repeatedly raped the girl after convincing her to go to his house in order to secure a govt job for her parents
19 October Dongra village, Narnaul, Haryana
a six-year old girl raped and killed
She was abducted while sleeping with her grandmother by unidentified persons, raped and died before being taken to hospital
Rape
31 October Chaia, Ghatampur, UP
a Dalit midwife gang-raped She was brought by a man to assist in his wife's delivery, and was gang-raped by the man and two associates in the fields on the way to the birth
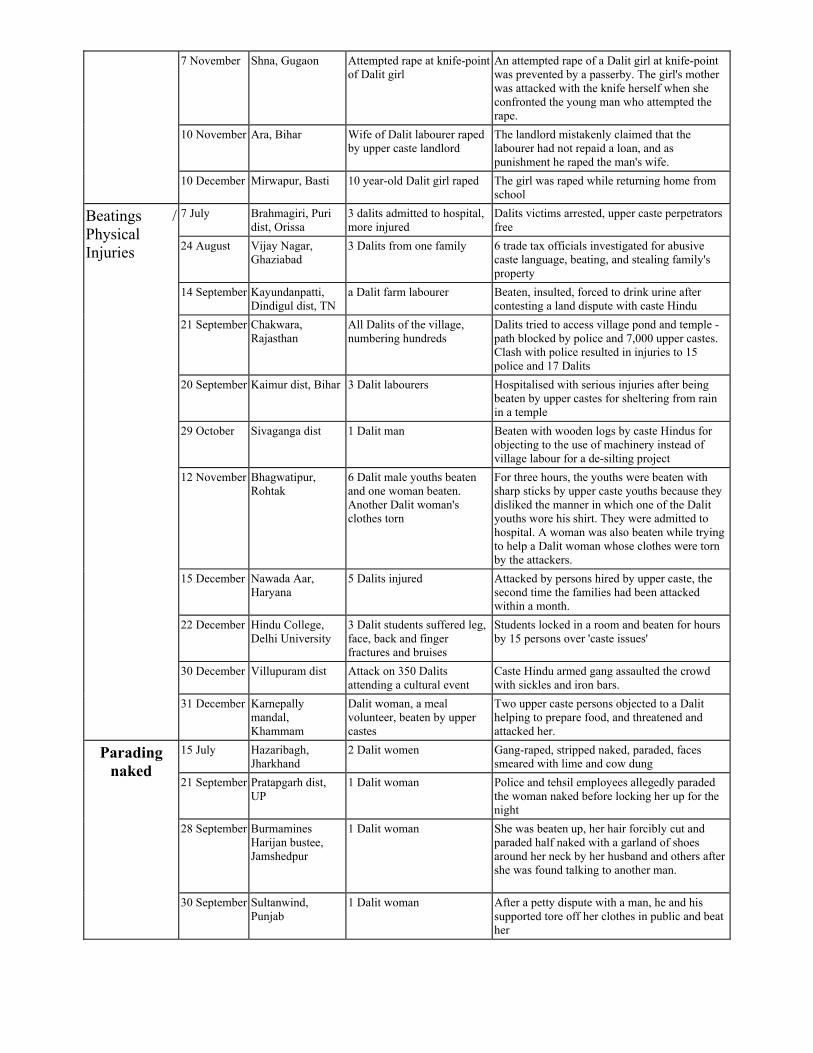
7 November Shna, Gugaon Attempted rape at knife-point of Dalit girl
An attempted rape of a Dalit girl at knife-point was prevented by a passerby. The girl's mother was attacked with the knife herself when she confronted the young man who attempted the rape.
10 November Ara, Bihar Wife of Dalit labourer raped by upper caste landlord
The landlord mistakenly claimed that the labourer had not repaid a loan, and as punishment he raped the man's wife.
10 December Mirwapur, Basti 10 year-old Dalit girl raped The girl was raped while returning home from school
7 July Brahmagiri, Puri dist, Orissa
3 dalits admitted to hospital, more injured
Dalits victims arrested, upper caste perpetrators free
24 August Vijay Nagar, Ghaziabad
3 Dalits from one family 6 trade tax officials investigated for abusive caste language, beating, and stealing family's property
14 September Kayundanpatti, Dindigul dist, TN
a Dalit farm labourer Beaten, insulted, forced to drink urine after contesting a land dispute with caste Hindu
21 September Chakwara, Rajasthan
All Dalits of the village, numbering hundreds
Dalits tried to access village pond and temple - path blocked by police and 7,000 upper castes. Clash with police resulted in injuries to 15 police and 17 Dalits
20 September Kaimur dist, Bihar 3 Dalit labourers Hospitalised with serious injuries after being beaten by upper castes for sheltering from rain in a temple
29 October Sivaganga dist 1 Dalit man Beaten with wooden logs by caste Hindus for objecting to the use of machinery instead of village labour for a de-silting project
12 November Bhagwatipur, Rohtak
6 Dalit male youths beaten and one woman beaten. Another Dalit woman's clothes torn
For three hours, the youths were beaten with sharp sticks by upper caste youths because they disliked the manner in which one of the Dalit youths wore his shirt. They were admitted to hospital. A woman was also beaten while trying to help a Dalit woman whose clothes were torn by the attackers.
15 December Nawada Aar, Haryana
5 Dalits injured Attacked by persons hired by upper caste, the second time the families had been attacked within a month.
22 December Hindu College, Delhi University
3 Dalit students suffered leg, face, back and finger fractures and bruises
Students locked in a room and beaten for hours by 15 persons over 'caste issues'
30 December Villupuram dist Attack on 350 Dalits attending a cultural event
Caste Hindu armed gang assaulted the crowd with sickles and iron bars.
Beatings / Physical Injuries
31 December Karnepally mandal, Khammam
Dalit woman, a meal volunteer, beaten by upper castes
Two upper caste persons objected to a Dalit helping to prepare food, and threatened and attacked her.
15 July Hazaribagh, Jharkhand
2 Dalit women Gang-raped, stripped naked, paraded, faces smeared with lime and cow dung
21 September Pratapgarh dist, UP
1 Dalit woman Police and tehsil employees allegedly paraded the woman naked before locking her up for the night
28 September Burmamines Harijan bustee, Jamshedpur
1 Dalit woman She was beaten up, her hair forcibly cut and paraded half naked with a garland of shoes around her neck by her husband and others after she was found talking to another man.
Parading naked
30 September Sultanwind, Punjab
1 Dalit woman After a petty dispute with a man, he and his supported tore off her clothes in public and beat her
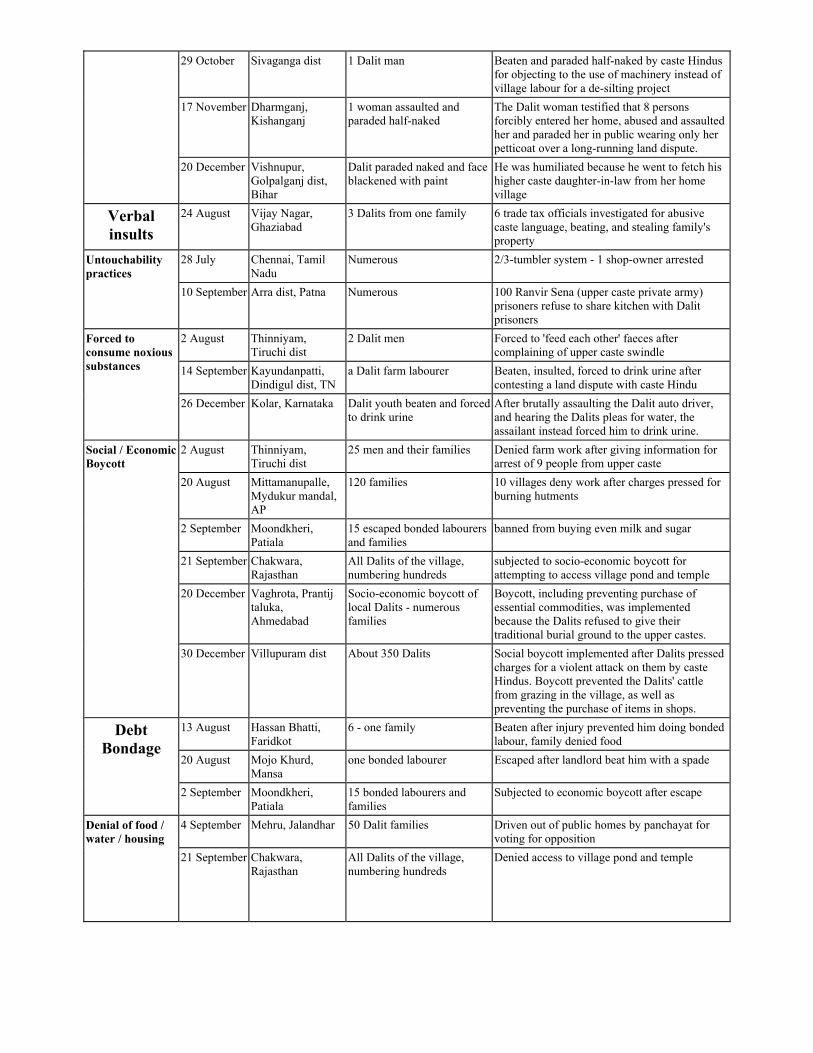
29 October Sivaganga dist 1 Dalit man Beaten and paraded half-naked by caste Hindus for objecting to the use of machinery instead of village labour for a de-silting project
17 November Dharmganj, Kishanganj
1 woman assaulted and paraded half-naked
The Dalit woman testified that 8 persons forcibly entered her home, abused and assaulted her and paraded her in public wearing only her petticoat over a long-running land dispute.
20 December Vishnupur, Golpalganj dist, Bihar
Dalit paraded naked and face blackened with paint
He was humiliated because he went to fetch his higher caste daughter-in-law from her home village
Verbal insults
24 August Vijay Nagar, Ghaziabad
3 Dalits from one family 6 trade tax officials investigated for abusive caste language, beating, and stealing family's property
28 July Chennai, Tamil Nadu
Numerous 2/3-tumbler system - 1 shop-owner arrested Untouchability practices
10 September Arra dist, Patna Numerous 100 Ranvir Sena (upper caste private army) prisoners refuse to share kitchen with Dalit prisoners
2 August Thinniyam, Tiruchi dist
2 Dalit men Forced to 'feed each other' faeces after complaining of upper caste swindle
14 September Kayundanpatti, Dindigul dist, TN
a Dalit farm labourer Beaten, insulted, forced to drink urine after contesting a land dispute with caste Hindu
Forced to consume noxious substances
26 December Kolar, Karnataka Dalit youth beaten and forced to drink urine
After brutally assaulting the Dalit auto driver, and hearing the Dalits pleas for water, the assailant instead forced him to drink urine.
2 August Thinniyam, Tiruchi dist
25 men and their families Denied farm work after giving information for arrest of 9 people from upper caste
20 August Mittamanupalle, Mydukur mandal, AP
120 families 10 villages deny work after charges pressed for burning hutments
2 September Moondkheri, Patiala
15 escaped bonded labourers and families
banned from buying even milk and sugar
21 September Chakwara, Rajasthan
All Dalits of the village, numbering hundreds
subjected to socio-economic boycott for attempting to access village pond and temple
20 December Vaghrota, Prantij taluka, Ahmedabad
Socio-economic boycott of local Dalits - numerous families
Boycott, including preventing purchase of essential commodities, was implemented because the Dalits refused to give their traditional burial ground to the upper castes.
Social / Economic Boycott
30 December Villupuram dist About 350 Dalits Social boycott implemented after Dalits pressed charges for a violent attack on them by caste Hindus. Boycott prevented the Dalits' cattle from grazing in the village, as well as preventing the purchase of items in shops.
13 August Hassan Bhatti, Faridkot
6 - one family Beaten after injury prevented him doing bonded labour, family denied food
20 August Mojo Khurd, Mansa
one bonded labourer Escaped after landlord beat him with a spade
Debt Bondage
2 September Moondkheri, Patiala
15 bonded labourers and families
Subjected to economic boycott after escape
4 September Mehru, Jalandhar 50 Dalit families Driven out of public homes by panchayat for voting for opposition
Denial of food / water / housing
21 September Chakwara, Rajasthan
All Dalits of the village, numbering hundreds
Denied access to village pond and temple

17 October Baran, Rajasthan At least 12, most children of babies die of starvation / malnutrition
Panchayat corruption diverted emergency food away from lowest caste, who were then forced to eat grass and other inedible plants, resulting in starvation, malnutrition and digestive sickness
12 July Bhagalpur, Banka dist.
Six families Six Dalit houses burnt by 20 armed upper caste persons
16 July Raigopalpur, Kanpur
2 - Dalit woman and daughter
House and property burnt by woman's 'opponent's
Destruction of houses / property
23 July Mittamanupalle, Mydukur mandal, AP
Numerous families Hutments burnt by upper caste persons
Land-grabbing
7 July Brahmagiri, Puri dist, Orissa
Whole village of prawn-farmers
Resentment of dalit economic success
16 July Kodagu dist, Bangalore
2 - young cricketer (admitted to hospital; assaulted on genitalia) and his brother
Sub-Insp. Police suspended for torture Torture
7 July Ulagampatti, Sivaganga
a 27 year old Dalit woman She was beaten inside the house by 4 plainclothes police, dragged outside and beaten with a log till she lost consciousness. She awoke in Ulagampatti police station. Sustained multiple thigh and back injuries.
Some Totals:
63 Atrocities 23 murders 9 rapes including at least 3 Dalit minors, one attempted rape 26 Dalits assaulted, plus large sections of 2 Dalit villages 8 Dalits paraded naked or semi-naked 4 Dalits forced to consume urine or faeces 6 cases of socio-economic boycott, affecting over a thousand Dalits Hundreds of Dalits excluded from food, water or housing 3 Dalits tortured by the police 1368 individuals plus 8 whole villages immediately affected
Source: Digest of Atrocities/Violence/Killings against Dalits, India Committee of the
Netherlands—April 2, 2003. http:/www.india.net.nl/atroc1.htm
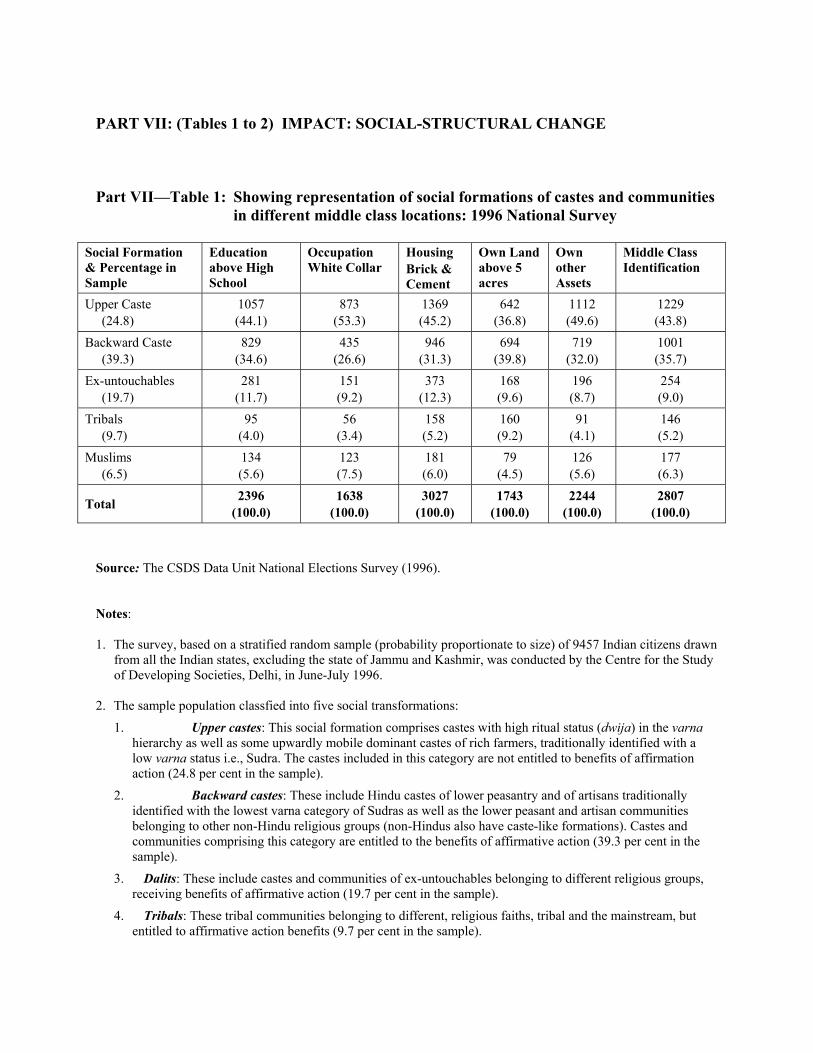
PART VII: (Tables 1 to 2) IMPACT: SOCIAL-STRUCTURAL CHANGE Part VII—Table 1: Showing representation of social formations of castes and communities
in different middle class locations: 1996 National Survey
Social Formation & Percentage in Sample
Education above High School
Occupation White Collar
Housing Brick & Cement
Own Land above 5 acres
Own other Assets
Middle Class Identification
Upper Caste (24.8)
1057 (44.1)
873 (53.3)
1369 (45.2)
642 (36.8)
1112 (49.6)
1229 (43.8)
Backward Caste (39.3)
829 (34.6)
435 (26.6)
946 (31.3)
694 (39.8)
719 (32.0)
1001 (35.7)
Ex-untouchables (19.7)
281 (11.7)
151 (9.2)
373 (12.3)
168 (9.6)
196 (8.7)
254 (9.0)
Tribals (9.7)
95 (4.0)
56 (3.4)
158 (5.2)
160 (9.2)
91 (4.1)
146 (5.2)
Muslims (6.5)
134 (5.6)
123 (7.5)
181 (6.0)
79 (4.5)
126 (5.6)
177 (6.3)
Total 2396 (100.0)
1638 (100.0)
3027 (100.0)
1743 (100.0)
2244 (100.0)
2807 (100.0)
Source: The CSDS Data Unit National Elections Survey (1996). Notes: 1. The survey, based on a stratified random sample (probability proportionate to size) of 9457 Indian citizens drawn
from all the Indian states, excluding the state of Jammu and Kashmir, was conducted by the Centre for the Study of Developing Societies, Delhi, in June-July 1996.
2. The sample population classfied into five social transformations:
1. Upper castes: This social formation comprises castes with high ritual status (dwija) in the varna hierarchy as well as some upwardly mobile dominant castes of rich farmers, traditionally identified with a low varna status i.e., Sudra. The castes included in this category are not entitled to benefits of affirmation action (24.8 per cent in the sample).
2. Backward castes: These include Hindu castes of lower peasantry and of artisans traditionally identified with the lowest varna category of Sudras as well as the lower peasant and artisan communities belonging to other non-Hindu religious groups (non-Hindus also have caste-like formations). Castes and communities comprising this category are entitled to the benefits of affirmative action (39.3 per cent in the sample).
3. Dalits: These include castes and communities of ex-untouchables belonging to different religious groups, receiving benefits of affirmative action (19.7 per cent in the sample).
4. Tribals: These tribal communities belonging to different, religious faiths, tribal and the mainstream, but entitled to affirmative action benefits (9.7 per cent in the sample).

5. Muslims: This category excludes those Muslim communities that are classified as backward and as such are included among backward castes. This category only includes the upper strata of Muslims not entitled to affirmative action benefits (6.5 per cent in the sample).
3. The table shows distribution of the above five social formations in different middle class
positions. Five separate indicators are used for identifying middle class positions: (a) education: those with education above the high-school level; (b) ownership of assets: those owning three or more assets among the following: (i) a car/jeep/tractor, (ii) a scooter/motorbike, (iii) water-pumping set, (iv) house/flat, (v) television; (5) self-identification as members of the ‘middle class’: i.e., respondents who reject working class identity and choose for themselves the middle class identity.
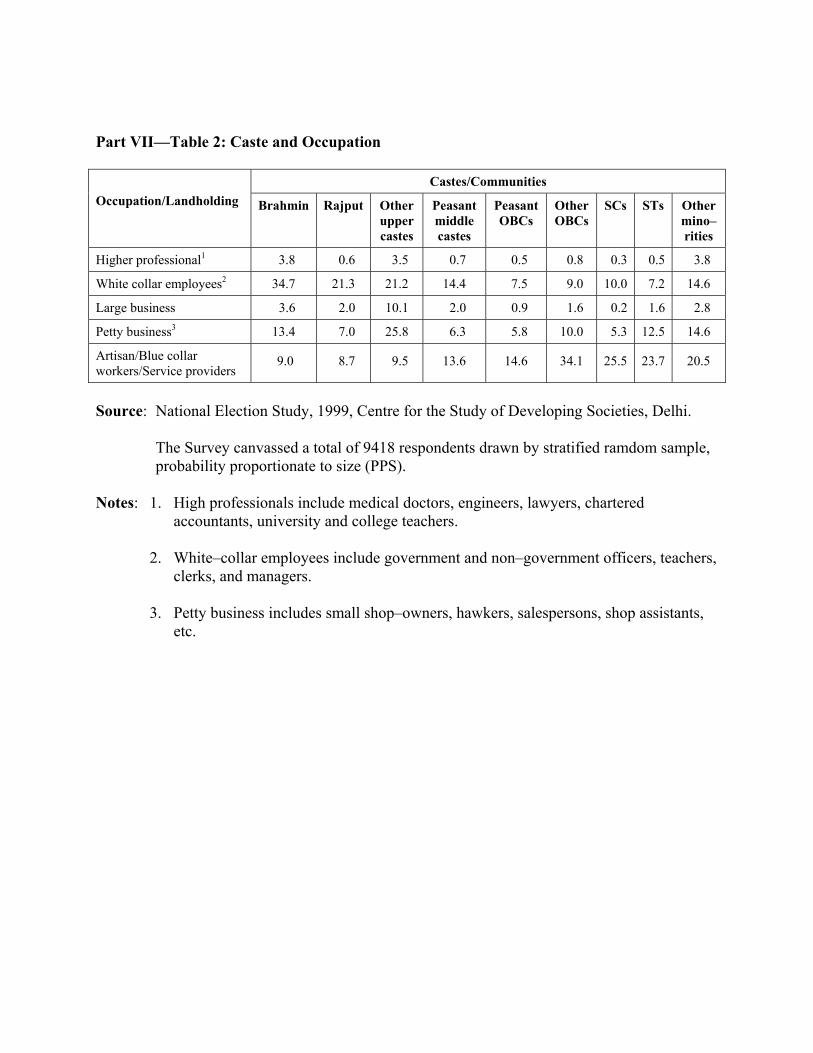
Part VII—Table 2: Caste and Occupation
Castes/Communities Occupation/Landholding Brahmin Rajput Other
upper castes
Peasant middle castes
Peasant OBCs
Other OBCs
SCs STs Other mino–rities
Higher professional1 3.8 0.6 3.5 0.7 0.5 0.8 0.3 0.5 3.8
White collar employees2 34.7 21.3 21.2 14.4 7.5 9.0 10.0 7.2 14.6
Large business 3.6 2.0 10.1 2.0 0.9 1.6 0.2 1.6 2.8
Petty business3 13.4 7.0 25.8 6.3 5.8 10.0 5.3 12.5 14.6
Artisan/Blue collar workers/Service providers
9.0 8.7 9.5 13.6 14.6 34.1 25.5 23.7 20.5
Source: National Election Study, 1999, Centre for the Study of Developing Societies, Delhi. The Survey canvassed a total of 9418 respondents drawn by stratified ramdom sample,
probability proportionate to size (PPS). Notes: 1. High professionals include medical doctors, engineers, lawyers, chartered
accountants, university and college teachers. 2. White–collar employees include government and non–government officers, teachers,
clerks, and managers.
3. Petty business includes small shop–owners, hawkers, salespersons, shop assistants, etc.

PART VIII: (Table 1 to 6) AFFIRMATIVE ACTION IN PAKISTAN
Part VIII—Table 1: Quota System—1948
Quota Population % Region / Province
% East Bengal 42 56.75 (West) Punjab 24 28.00 Karachi 2 1.50 All other provinces and princely states of West Pakistan 17 13.75 Potential migrants from India 15 (9.80)
(Included in the above)
Part VIII—Table 2: Quota System—1949 Category Quota %
Merit 20 East Bengal 40 Punjab (including Bahawalpur) 23 Karachi 2 All other provinces and princely states 15

Part VIII—Table 3: Quota: The 1973 Constitution
Category Quota %
Merit 10 Punjab 50 Sindh 19 (Rural 11.4, Urban 7.6) NWFP 11.5 Baluchistan 3.5 Northern Areas and FATA 4 Azad Kashmir 2
Part VIII—Table 4: Pakistan: Ethnic Representation in Federal Bureaucracy, 1973 – 86
Ethnic Group 1973 1983 1986 All Senior All Senior All Senior Punjabi 49.3 53.5 54.9 55.8 55.3 57.7 Pathan 10.5 7.0 13.4 11.6 12.6 12.1 Sindhi 3.1 2.7 5.4 5.1 7.2 6.7 Mohajir 30.1 33.5 17.4 20.2 18.2 18.3 NA 2.6 1.3 3.6 3.4 1.4 1.5 AJK 1.8 0.5 1.9 0.9 1.7 0.7 Total 100.0 100.0 100.0 100.0 100.0 100.0
Source: Charles H. Kennedy, ‘Managing Ethnic Conflict: The Case of Pakistan’, Regional
Politics and Policy, Spring 1993, No. 1, p 138.

Part VIII—Table 5: Regional Representation in Officer Grades: 1993
Region Ratio of Jobs (%)
Quota (%)
Punjab 62.36 50.0 Sindh (Urban) 9.51 7.5 Sindh (Rural) 7.63 11.4 NWFP 12.41 11.5 Baluchistan 3.01 3.5 NA/FATA 3.69 4.0 AJK 1.29 2.0
Source: Establishment Division, Federal Secretariat, Government of Pakistan, Islamabad, Civil
Servants (BPS 1 to BPS 22), Regional/Provincial Representation: as on 1 January 1993. Part VIII—Table 6: Representation in Autonomous Bodies/Public Corporations: 1993
Province Number Percentage Prescribed Quota Punjab 25,772 49.94 50.0 Sindh (Urban) 13,815 26.77 7.6 Sindh (Rural) 4,213 8.16 11.4 NWFP 5,249 10.17 11.5 Baluchistan 1,255 2.43 3.5 NA – – – FATA 638 1.24 4.0 AJK 664 1.29 2.0
Source: Establishment Division, Government of Pakistan, Islamabad, Statement showing
Number of Employees, Province and Grade–wise, in BPS 17 and above working in the Autonomous/Semi–Autonomous Bodies/Corporations of the Federal Government, 1 January 1993.
The tables are reproduced from Ethnic Studies Report, Vol. XV, No. 2, July 1997.

Bibliography
Ahmed, Imtiaz, (1973), Stratification Among the Muslims, Manohar, Delhi.
Ali Anwar (2001), Masavat ki Jung: Pasemander Bihar ke Pasmanda Musalman (in Hindi), Vani Prakashan, New Delhi.
Ambedkar, B.R., (1946), Who Were the Sudras?: How they came to be the Fourth Varna in the Indo-Aryan Society, Thacker & Company, Bombay.
Bayly, Susan (1999), The New Cambridge History of India (IV-3): Caste, Society and Politics in India from the Eighteenth Century to the Modern Age, Cambridge University Press.
Betelle, Andre, (1996), ‘Varna and Jati’, Sociological Bulletin, Vol. 45, No. 1, pp. 15-27.
Chatterjee, Partha (2001), On Civil and Political Society in Post-Colonial Democracy”, in S. Kaviraj and S. Khilnani (eds), Civil Society, Cambridge University Press, Cambridge, pp. 165-178.
Cox, Oliver C., (1948), Caste Class, & Race: A Study in Social Dynamics, Modern Reader Paperbacks, New York and London.
D’Souza, Victor, (1981), Inequality and its Perception: A Theory of Social Stratification, Manohar, New Delhi.
de Silva, K.M. (ed.) (1993), Sri Lanka: Problems of Governance, Konark Publishers Private Ltd., Delhi, India.
Desai, A.R., social Background of Indian Nationalism.
Desai, I.P., (1984), ‘Should ‘Caste’ be the Basis for Recognising Backwardness?’, Economic and Political Weekly, Vol. 19, No. 28, pp. 1106-16.
Desai, I.P., (1988), ‘A Critique of Division and Hierarchy’ in Division and Hierarchy, Hindustan Publishing Corporation, Delhi, pp. 40-49,
Deshpande, Satish (2004), Contemporary India: A Sociological View, Penguin Books, New Delhi, Include (i) p. 135, Table 1: Estimated Class Composition of the Indian Population: NSS Data, 1999-2000; (ii) p. 137, Table 2: Possession of Consumer Durables 1996; (iii) p. 119, Table 6: Class Composition of Top Corporate Offices; (iv) p. 118, Table 5: Mandal Report data on SC, ST and OBC represented in CGS, 1979-80; (v) pp. 112-113: Rural-Urban Caste Class, 1999-2000.
Deshpande, Vasant, (1978), Towards Social Integration, Shubhada-Saraswat, Pune.
Dirks, Nicholas B. (2001), Castes of Mind: Colonialism and the Making of Modern India, Permanent Black, Delhi.
Duncan, B. Forrester, (1980), Caste and Christianity: Attitudes and Politics on Caste of Anglo-Saxon Protestant Missions in India, Curzon Press, London.
Dutt, N.K. (1931), Origin and Growth of Caste in India, Vol. 1, Kegan Paul, London.
Fuller, C.J. (ed.) (1997), Caste Today, Oxford University Press, New Delhi.
Galanter, Marc (1997), Law and Society in Modern India, Oxford University Press, New Delhi.
Galanter, Marc, (1984), ‘Reform Mobility, and Politics Under British Rule’ in his Competing Equalities: Law and Backward Classes in India, Oxford University Press, Delhi, pp. 18-40.
Galanter, Marc, (1984), Competing Equalities: Law and the Backward Classes in India, Oxford University Press, New Delhi.
Ghosh, Sagarika (2003), “The Dalit in India”, in Social Research: Pariah Minorities, Vol. 70, No. 1, Spring, (pp. 83-109).
Ghurey, G.S., (1962), ‘Caste During the British Rule’ in his Caste and Race in India, Papular Prakashan, Bombay, pp. 270-305.
Gould, Harold A, (1987), The Hindu Caste System, Chanakya Publications, Delhi.
Goyal, Santosh (1992), Social Background of Top Corporate Officials in the Private and Public Sectors, in Francies Frankel and MSA Rao (eds), Dominance and State Power in Modern India: Decline of A Social Order, Appendix IV, Vol. 2, Oxford University Press, Delhi, (p. 540 table IV 5).
Gupta, Dipankar (2000), Interrogating Caste: Understanding Hierarchy and Difference in Indian Society, Penguin Books, New Delhi.
Gupta, Dipankar (2000), Interrogating Caste: Understanding Hierarchy and Difference in India Society, Penguin Books, New Delhi.
Habermas, Jürgen (ed.), The Inclusion of the Other: Studies in Political Theory, Ciaran Cronin and Pablo De Greiff.
Hamilton, William B. (ed.) (1964), The Transfer of Institutions, Duke University Press, Durham.
Havanur, L.G. (1991), Backward Classes: Juridical Meaning, Socio-Legal Services Centre, Bangalore.
Herbst, Ph. G., (1976), Alternatives to Hierarchies, Martinus Nijhoff Social Sciences Division, Leiden.
HSU, F.L.K, (1963), Clan Caste, and Club, D. Van Nostrand Company, INC., Princeton, New Jersey.
Irshick, Eugene F., (1969), Politics and Social Conflict in South India: The Non-Brahman Movements and Tamil Separatism 1916-1929, University of California Press, Berkeley.
Ishwari Prasad (1986), Reservation: Action for Social Equality, Criterion Publications, New Delhi.

Jadeja, Y.D. (1970), Primary Education in Surat District, Centre for Social Studies Publication, Surat.
Jaffrelot, Christopher (2003), India’s Silent Revolution: The Rise of the Lower Castes in North India, C. Hurst & Co., London.
Jaiswal, Suvira (1998), Caste: Origin, Function and Dimensions of Change, Manohar, Delhi. (Ch. 2 Historiography)
Jordan, Bill, (1996), A Theory of Poverty and Social Exclusion, Polity Press, U.K.
Joshi, Barbara R. (1982), Democracy in Search of Equality: Untouchable Politics and Indian Social Change, Hindustan Publishing Corporation, Delhi.
Joshi, Hemant and Sanjay Kumar (eds) (2002), Asserting Voices: Changing Culture, Identity and Livelihood of the Musahars in the Gangetic Plains, Deshkal, Delhi, Articles by K. Suresh Singh, R. Manglpuri, Philip Manthara.
Karanth, G.K., ‘Caste in Contemporary Rural India’ in M.N. Srinivas (ed.), Caste: Its Twentieth Century Avatar (note 7), pp. 87-109.
Ketkar, S.V. (1979), History of Caste in India, Rawat Publications, Jaipur.
Kothari, Rajni, (1970), Caste in Indian Politics, Orient Longman Ltd., New Delhi.
Krishna, Sumi (1991), India’s Living Languages, Allied Publishers Limited, New Delhi.
Lal, A.K. (2002), Protective Discrimination: Ideology and Praxis, Concept Publishing Company, New Delhi, India.
Lohia, Ram Manohar, (1964), The Caste System, Ram Manohar Lohia Samata Vidyalaya Nyas, Hyderabad.
M.N. Srinivas (ed.) (1996), Caste: Its Twentieth Century Avatar, Viking, (Penguin Books), India.
Manor, James (ed.), Sri Lanka in Change and Crisis, Croom Helm, London and Sydney.
Mehta, Haroobhai & Hasmukh Patel (1985), Dynamics of Reservations Policy, Patriot Publishers, New Delhi (a) D.L. Sheth “Great Debate”, pp. 129-138; (b) Mahesh Dave “Backward Classes and Reservations, pp. 59-108.
Milner Murray Jr., (1994), Status and Sacredness: A General Theory of Status Relations and Analysis of Indian Culture, Oxford University Press, New York.
Misra, B.B., Indian Middle Class.
Morton, Klass (1980), Caste: The Emergence of the South Asian Social System, Institute for the Study of Human Issues, Philadelphia, XI, 2RP.
Nemishrai, Mohandas ed. (1990), Dalit Vipidan, Lokayan Samksha Visheshank (Hindi) 1989-90, No. 4, Atrocities on Dalits, p. 141.
Nesiah, Devanesan, (1999), Discrimination with Reason?, Oxford University Press, New Delhi.

Om, Prakash and Arun K. Sen (1985), Caste Hindu and Scheduled Caste Children in Rural India, ESS Publications, New Delhi.
Omvedt, Gail, (1976), Cultural Revolt in a Colonial Society: The Non-Brahman Movements in Western India—1987 to 1930, Scientific Socialist Education Trust, Bombay.
P.G. Jogdand (2003), Reservation: The Issues and Facts, Workshop: The Monthly Seminar Special Issue on Reservations and Private Sector, pp. 63-70.
Prakasam, Gnana (1998), Social Separatism: Scheduled Castes and the Caste System, Rawat Publications, Jaipur, India.
Quadri, Safdar Imam and Sanjay Kumar (2003), Marginalizaion of Dalit Muslims, Deshkal, Delhi. (a) Imtiaz Ahmed, “Caste in the History of Muslim Communities”, (ibid.) pp. 11-30 (on Caste and Dalit ID among Muslims); (b) Ali Anwar “Finely Woven is the Basket of Caste” (ibid) pp. 36-51; Md. Ezaz Ali, Dalit Muslims in Eyes of Constitution (ibid)) pp. 59-71.
Quigley, Declan (1999), The Interpretation of Caste, Oxford University Press, New Delhi.
Roy Burman, B.K. (1992), Beyond Mandal and After: Backwad Classes in Perspective, Mittal Publications, New Delhi.
S.S. Narwade (2003), Reservation Policy and it Impact on Economic Development of Dalits, Workshop (ibid), pp. 71-76;
Sakshi Team (2001), Dalit Human Rights Monitor, 2000, Andhra Pradesh, Sakshi Human Rights Watch, A.P., Secunderabad, pp. 137-154.
Sandanshiv, D.N. (2003), “Dr. Ambedkar and Reservations” in Workshop (ibid), pp. 1-24. The Monthly Seminar, Reservations in Private Sector, March, Vol. 1, 2003.
Sara Joseph (2002), “State, Democracy and the Problem of Exclusions” in The Indian Journal of Political Science, vol. 63, No. 2 & 3, June-September, 2002, pp. 137-154.
Shah, A.M., (1988), ‘A Response to the Critique on Division and Hierarchy’ in A.M. Shah and I.P. Desai, Division and Hierarchy: An Overview of Caste in Gujarat, Hindustan Publishing Corporation, Delhi, pp. 92-133.
Shah, Ghanshyam (ed.) (2002), Caste and Democratic Politics in India, Permanent Black, New Delhi.
Sharma, O.P., Scheduled Castes Population and Literates, Kar Kripa Publishers, New Delhi.
Sharma, R.S. (1958), Sudras in Ancient India: A social history of the lower order down to circa A.D. 600, Motilal Banarsidass Publishers Pvt. Ltd., Delhi.
Sharma, Rajendra Nath, (1977), Brahmins Through the Ages: Their Social, Religious, Cultural Political and Economic Life, Ajanta Publications, Delhi, India.
Sheth, D.L. (1995), The Great Language Debate: Politics of Metropolitan Versus Vernacular India in Upendra Baxi, Bhikhu Parekh (eds), Crisis and Change in Contemporary India, Sage Publications, New Delhi, pp. 187-215.

Sheth, D.L. and Gurpreet Mahajan (ed.) (1999), Minority Identities and the Nation State, Oxford University Press, New Delhi.
Sinha, Sachidanand, (1982), Caste System: Myth Reality Challenge, Intellectual Publishing House, New Delhi.
Srinivas, M.N., (1962), ‘Varna and Caste’ in Caste in Modern India and Other Essays, Asia Publishing House, Bombay.
V.A. Pai Panandikar (ed.) (1997), The Politics of Backwardness: Reservation Policy in India, Konark Publishers, New Delhi. (a) Reservations Policy for other Backward Classes Problems and Perspectives, Shri Prakash, pp. 29-87; (b) Definition of Terms Scheduled Castes and Scheduled Tribes: A Crisis of Ambivalence, Sunia Chitnis, pp. 88-107; (c) Reservations Policy Revisited, D.L. Sheth, pp. 121-239 (d) Consequences of Reservations: Ghanshyam Shah, pp. 240-255.
Vidal, Denis (1997), Violence and Truth: A Rajasthani Kingdom Confronts Colonial Authority, Oxford University Press.
Vidal, Denis and Gille Tarabout, Eric Meyor (2003) Violence/Non-violence: Some Hindu Perspectives, Manohar, Delhi. (a) “Ancient Brahminism, or Impossible Non-violence”, Madeleine Biardeau, pp. 85-1004; (b) “The So-called ‘Criminal Tribes’ of British India, Colonial Violence and Traditional Violence”, Marie Fourcade, pp. 143-173; (c) “The End of a Feud”, Denis Vidal, pp. 225-278.
Wilson, John, (1985), Indian Caste, Vol. One, K.K. Book Distributors, Delhi.
Yadav, K.C. (1994), India’s Unequal Citizens: A Study of Other Backward Classes, Manohar, Delhi.