cassie cordell trueblood, et al., v. washington state ... 2018 monthly report 1 | p a g e cassie...
TRANSCRIPT

FEBRUARY 2018 MONTHLY REPORT
1 | P a g e
Cassie Cordell Trueblood, et al., v. Washington State Department
of Social and Health Services, et al. Case No. C14-1178 MJP
FINAL Monthly Report to the Court Appointed Monitor
February 28, 2018
Behavioral Health Administration Office of Forensic Mental Health Services
PO Box 45050 Olympia, WA 98504-5050
(360) 725-2260 Fax: (360) 407-0304
Washington State Department of Social & Health Services
FEBRUARY 2018 MONTHLY REPORT
2 | P a g e
TABLE OF CONTENTS Background Page 3 Class Member Status Summary Information Page 4 Class Member Status Data Tables Page 6 Class Member Status Data Graphs Page 12 Table 4: Total Completed Jail Evaluations by Court Order Signed Page 15 Tables 5a-5c: Number and Percentage of Orders Page 18 Resources Required to Provide Timely Competency Services Page 21 Key Accomplishments- January 2018 Page 22 Trueblood Implementation Steps Taken and Planned— January 2018 Page 24 February 8, 2016 Court Order Status Report/Updates Page 36 July 7, 2016 Contempt Court Order Status Updates Page 40 August 15, 2016 Order Modifying the Permanent Injunction Page 40 Appendices Page 42
A. December 2017 Mature Data Tables Page 42 B. Class Member—Evaluation Information for December 2017 Page 42 C. Class Member—Restoration Information for December 2017 Page 42 D. Class Member—Restoration Information for December 2017 Maple Lane Page 42 E. Class Member—Restoration Information for December 2017 Yakima Page 42 F. Outliers and Delay Comments Page 42 G. Percent of Court Orders Received Within 3 Days of Court Order Page 42 H. January 2018 First Look Data Tables Page 42 I. Class Member—Evaluation Information for January 2018 Page 42 J. Class Member—Restoration Information for January 2018 Page 42 K. Class Member—Restoration Information for January 2018 Maple Lane Page 42 L. Class Member—Restoration Information for January 2018 Yakima Page 42 M. Calculation of Contempt Fines Page 42 N. Good Cause Exceptions Page 42
FEBRUARY 2018 MONTHLY REPORT
3 | P a g e
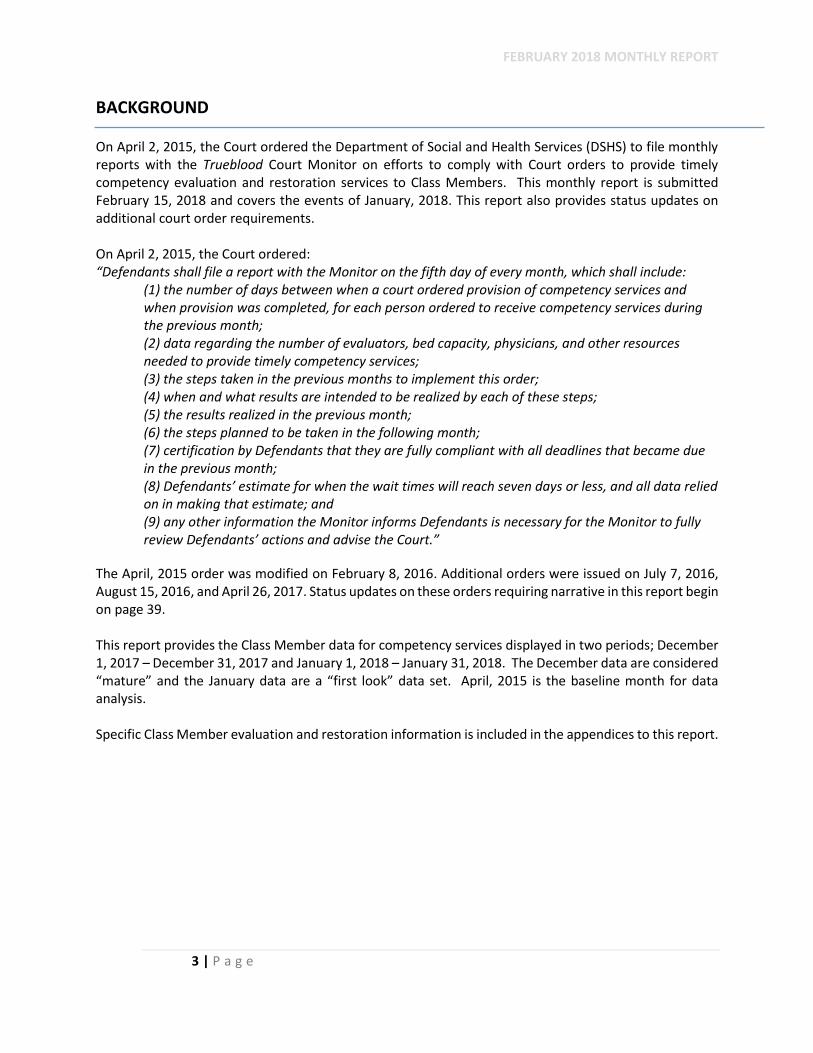
BACKGROUND On April 2, 2015, the Court ordered the Department of Social and Health Services (DSHS) to file monthly reports with the Trueblood Court Monitor on efforts to comply with Court orders to provide timely competency evaluation and restoration services to Class Members. This monthly report is submitted February 15, 2018 and covers the events of January, 2018. This report also provides status updates on additional court order requirements. On April 2, 2015, the Court ordered: “Defendants shall file a report with the Monitor on the fifth day of every month, which shall include:
(1) the number of days between when a court ordered provision of competency services and when provision was completed, for each person ordered to receive competency services during the previous month; (2) data regarding the number of evaluators, bed capacity, physicians, and other resources needed to provide timely competency services; (3) the steps taken in the previous months to implement this order; (4) when and what results are intended to be realized by each of these steps; (5) the results realized in the previous month; (6) the steps planned to be taken in the following month; (7) certification by Defendants that they are fully compliant with all deadlines that became due in the previous month; (8) Defendants’ estimate for when the wait times will reach seven days or less, and all data relied on in making that estimate; and (9) any other information the Monitor informs Defendants is necessary for the Monitor to fully review Defendants’ actions and advise the Court.”
The April, 2015 order was modified on February 8, 2016. Additional orders were issued on July 7, 2016, August 15, 2016, and April 26, 2017. Status updates on these orders requiring narrative in this report begin on page 39. This report provides the Class Member data for competency services displayed in two periods; December 1, 2017 – December 31, 2017 and January 1, 2018 – January 31, 2018. The December data are considered “mature” and the January data are a “first look” data set. April, 2015 is the baseline month for data analysis. Specific Class Member evaluation and restoration information is included in the appendices to this report.

FEBRUARY 2018 MONTHLY REPORT
4 | P a g e
CLASS MEMBER STATUS SUMMARY INFORMATION
Analysis of Mature Data: April 1, 2015 through December 31, 2017 (see appendix A-G) Note: These data are based on number of days from signature and not the new timeframes as described in the April 26, 2017 Court Order. The average monthly referrals for each type of service are as follows:
o Average monthly jail-based evaluation orders signed for April 2015-December 2017 WSH: 214.9 ESH: 49.9 Both hospitals: 264.9
o Average monthly inpatient evaluation orders signed for April 2015-December 2017 WSH: 18.8 ESH: 7.4 Both hospitals: 26.2
o Average monthly restoration orders signed for April 2015-December 2017 WSH: 82.3 ESH: 14.2 Both hospitals: 96.5
Summary Points Related to Orders and Timeliness Based on Mature December Data (A-G appendix)
Orders:
The number of jail-based evaluation orders at WSH fell to 179 in December from 262 the previous month, which is well below the 214.9 average, but is similar to the year-over-year number. ESH also saw a decrease to 52 orders from 64 the previous month, which is still above the 49.9 average. Combined, the hospitals received 231 orders in December, which is below the 264.9 average, but appears to be a seasonal dip.
WSH received 16 inpatient evaluation orders which is below the 18.8 average. ESH had 12 inpatient evaluation orders, which is well above the 7.4 average. Orders at both sites totaled 28 which is also above the 26.2 average.
WSH received 93 restoration orders which remains significantly higher than the 82.3 average. ESH had 22 orders which is well above the 14.2 average, and is the second highest total yet recorded. There were 115 restoration orders across both hospitals which is significantly higher than the 96.5 average.
Wait Times:
Regarding jail-based 14 day evaluation completion times, WSH is at 9.7 days on average from order to completion and ESH is averaging 13.5 days. The combined average is 10.6 days.
The average inpatient evaluation admission wait times at WSH is 43.5 days. ESH average is at 5.6 days. The combined average is 26.7 days.
Restoration admission wait times at WSH is 37.7 days on average. The ESH average is 9.2 days. The combined average is 31.4 days.
FEBRUARY 2018 MONTHLY REPORT
5 | P a g e
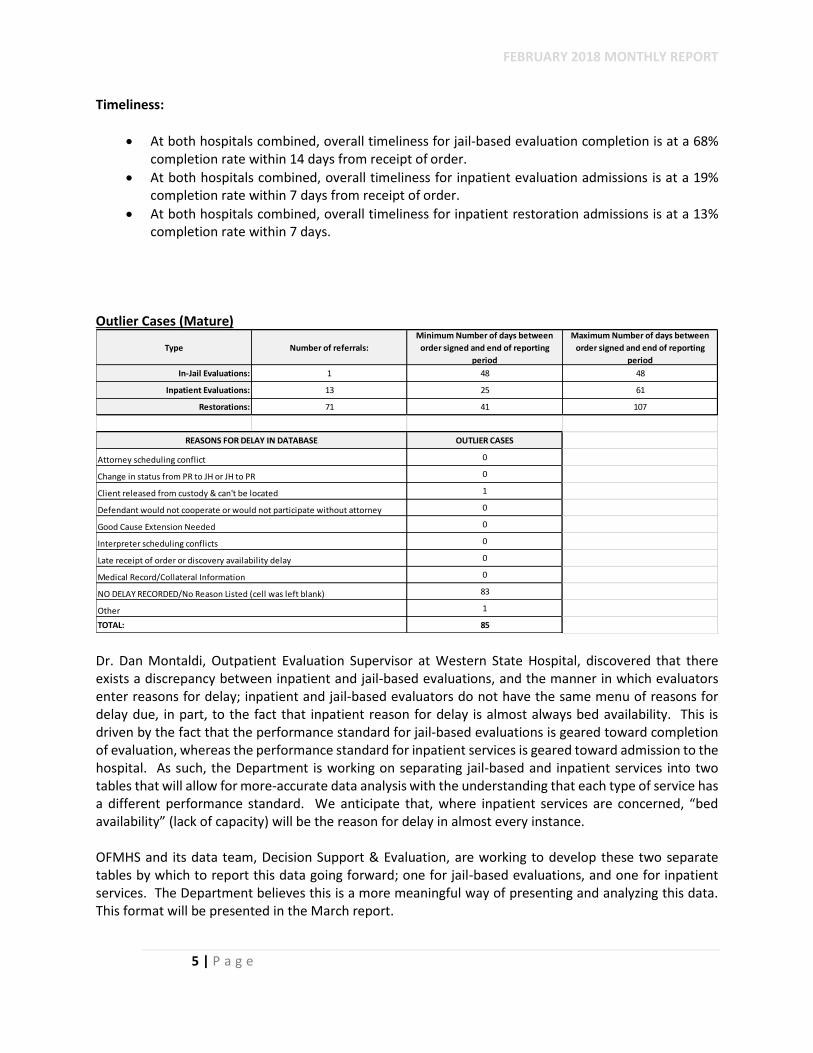
Timeliness:
At both hospitals combined, overall timeliness for jail-based evaluation completion is at a 68% completion rate within 14 days from receipt of order.
At both hospitals combined, overall timeliness for inpatient evaluation admissions is at a 19% completion rate within 7 days from receipt of order.
At both hospitals combined, overall timeliness for inpatient restoration admissions is at a 13% completion rate within 7 days.
Outlier Cases (Mature)
Dr. Dan Montaldi, Outpatient Evaluation Supervisor at Western State Hospital, discovered that there exists a discrepancy between inpatient and jail-based evaluations, and the manner in which evaluators enter reasons for delay; inpatient and jail-based evaluators do not have the same menu of reasons for delay due, in part, to the fact that inpatient reason for delay is almost always bed availability. This is driven by the fact that the performance standard for jail-based evaluations is geared toward completion of evaluation, whereas the performance standard for inpatient services is geared toward admission to the hospital. As such, the Department is working on separating jail-based and inpatient services into two tables that will allow for more-accurate data analysis with the understanding that each type of service has a different performance standard. We anticipate that, where inpatient services are concerned, “bed availability” (lack of capacity) will be the reason for delay in almost every instance. OFMHS and its data team, Decision Support & Evaluation, are working to develop these two separate tables by which to report this data going forward; one for jail-based evaluations, and one for inpatient services. The Department believes this is a more meaningful way of presenting and analyzing this data. This format will be presented in the March report.
Type Number of referrals:
Minimum Number of days between
order signed and end of reporting
period
Maximum Number of days between
order signed and end of reporting
period
In-Jail Evaluations: 1 48 48
Inpatient Evaluations: 13 25 61
Restorations: 71 41 107
OUTLIER CASES
0
0
1
0
0
0
0
0
83
1
85
REASONS FOR DELAY IN DATABASE
Attorney scheduling conflict
Change in status from PR to JH or JH to PR
Client released from custody & can't be located
Defendant would not cooperate or would not participate without attorney
TOTAL:
Good Cause Extension Needed
Interpreter scheduling conflicts
Late receipt of order or discovery availability delay
Medical Record/Collateral Information
NO DELAY RECORDED/No Reason Listed (cell was left blank)
Other

FEBRUARY 2018 MONTHLY REPORT
6 | P a g e
CLASS MEMBER STATUS DATA TABLES (See APPENDICES H-L “First Look” January) TABLE 1a. Class Member Status Western State Hospital – Jail-based Competency Evaluations
Table1 Title: Competency Outpatient (Jail) Evaluations and Data Summary1
Average Median Average Median Average Median Average Median
Apr-15 177 1.3 0.0 1.9 1.0 9.5 6.0 14.6 14.0 14%
May-15 182 1.3 0.0 1.6 0.0 11.4 9.0 13.0 11.0 16%
Jun-15 210 1.7 0.0 2.1 1.0 10.9 8.0 17.8 15.0 10%
Jul-15 228 1.4 0.0 1.8 0.0 12.3 9.0 18.4 17.0 6%
Aug-15 170 1.9 0.0 2.2 0.0 13.4 11.0 20.7 20.0 7%
Sep-15 193 1.6 0.0 1.7 0.0 11.7 8.0 17.6 16.0 10%
Oct-15 189 1.9 0.0 2.0 0.0 16.7 15.0 16.4 15.0 19%
Nov-15 160 1.8 0.0 1.9 0.0 18.0 13.0 16.0 14.0 28%
Dec-15 194 1.6 0.0 1.7 0.0 13.7 8.5 15.5 14.0 14%
Jan-16 179 1.3 0.0 1.2 0.0 15.6 9.0 13.3 12.0 28%
Feb-16 205 0.6 0.0 0.6 0.0 6.6 5.0 10.0 8.0 45%
Mar-16 222 0.7 0.0 0.8 0.0 6.1 3.0 8.9 7.0 59%
Apr-16 201 0.8 0.0 0.8 0.0 6.1 5.0 9.0 7.0 57%
May-16 212 0.7 0.0 0.8 0.0 6.4 5.0 9.6 7.5 50%
Jun-16 219 0.9 0.0 0.9 0.0 7.5 6.5 10.8 8.0 31%
Average Median Average Median Average Median Average Median
within 14 days
from order
signature date2
within 14 days
from receipt of
order2,3
within 14 days from
receipt of order or 21
days from order
signature date2,3
Jul-16 227 0.7 0.0 0.8 0.0 9.4 6.0 12.2 9.0 47%
Aug-16 231 0.8 0.0 0.9 0.0 7.6 6.0 13.1 11.0 51%
Sep-16 256 0.6 0.0 0.8 0.0 6.7 7.0 12.5 11.0 45%
Oct-16 236 0.5 0.0 0.9 0.0 8.1 6.0 13.0 12.0 50%
Nov-16 207 1.3 0.0 1.9 0.0 10.1 8.5 13.3 13.0 47%
Dec-16 190 1.2 0.0 1.7 0.0 8.8 9.0 13.3 13.0 56%
Jan-17 199 0.8 0.0 1.1 0.0 8.4 7.0 13.0 12.0 47%
Feb-17 181 1.2 0.0 1.6 0.0 7.4 5.0 12.1 12.0 56%
Mar-17 253 1.1 0.0 1.4 0.0 5.7 3.0 10.7 9.0 62%
Apr-17 213 0.6 0.0 0.8 0.0 8.2 5.0 10.8 9.5 63%
May-17 259 0.3 0.0 0.5 0.0 8.5 8.0 11.3 10.0 57% 58% 58%
Jun-17 274 0.2 0.0 0.6 0.0 6.3 4.0 13.7 13.0 40% 40% 40%
Jul-17 220 0.3 0.0 0.5 0.0 8.9 7.0 13.8 14.0 48% 49% 49%
Aug-17 272 0.6 0.0 0.9 0.0 5.6 3.0 12.6 11.0 54% 55% 56%
Sep-17 236 0.4 0.0 0.8 0.0 7.2 5.0 11.9 11.0 54% 54% 55%
Oct-17 256 0.5 0.0 0.9 0.0 7.9 6.0 12.6 11.0 52% 53% 53%
Nov-17 262 0.6 0.0 0.9 0.0 5.3 3.0 10.6 10.0 69% 69% 70%
Dec-17 180 0.5 0.0 0.8 0.0 5.8 4.0 9.7 9.0 70% 70% 71%
Jan-18 201 0.4 0.0 0.5 0.0 5.7 5.5 9.1 9.0 76% 76% 77%
Data Notes: 1This data was pulled on 02/01/2018.
2Number of court orders signed is based on the number of orders signed in the specified month. These data are updated from the previous monthly report reflecting updates in the dynamic data system.
Averages, medians, and "percent completed" are based on the orders completed and/or not completed in the specified month regardless of when the court orders were signed (i.e., orders could be signed
in a previous month) and are snapshots of the final look data for that month.
3As of May 2017, DSHS compliance data are calculated and summarized in this table based on the modified deadline for in-jail competency evaluations outlined in the order DSHS received on 4/26/2017
adopting the Mediated Settlement Agreement, Dkt. # 389, stating: “DSHS shall complete in-jail competency evaluations within the shorter of either a) 14 days from receipt of order or b) 21 days from
signature of order”. To comply with the new requirements, this report captures two additional sets of compliance information beginning in May, 2017. The first is percentage of orders completed within
14 days from receipt of order as long as this is the shorter of the two compliance deadlines, or the order was received within 0 and 7 days from order signature date. The second is percentage of all
orders completed within either of the two compliance deadlines: 14 days from receipt of order (if the order was received within 0 and 7 days from order signature date) or 21 days from order signature
date (if the order was received after 7 days from order signature date).
completion
Jail-based
Evaluation -
7 day
compliance
Not Applicable Not Applicable
Jail-based
Evaluation -
14 day
compliance
Not Applicable Not Applicable
WESTERN STATE HOSPITAL
Court
Orders
Signed
Days from order signature to2:Percent complete
within 7 days from
order signature
date2
Percent completed
within 14 days
from receipt of
order2,3
Percent completed within
14 days from receipt of
order or within 21 days
from order signature
date2,3
hospital receipt of
order
hospital receipt of
discovery
end of reporting
month for incomplete
referrals

FEBRUARY 2018 MONTHLY REPORT
7 | P a g e
TABLE 1b. Class Member Status Western State Hospital – Inpatient Competency Services
Table2 Title: Competency Inpatient Evaluations and Restorations with Data Summary1
Average Median Average Median Average Median Average Median
Apr-15 10 5.8 1.0 5.8 1.0 10.7 7.0 22.2 18.0 22%
May-15 9 2.9 2.0 2.9 2.0 11.4 13.0 18.9 20.0 8%
Jun-15 9 3.0 1.0 3.0 1.0 14.0 12.0 12.3 15.0 25%
Jul-15 14 3.5 1.0 3.5 1.0 16.6 9.0 14.8 15.0 20%
Aug-15 14 4.5 1.0 4.5 1.0 10.0 11.0 25.5 17.0 7%
Sep-15 14 2.6 1.0 2.6 1.0 15.1 16.0 19.7 20.0 11%
Oct-15 15 1.5 1.0 1.5 1.0 19.0 19.0 23.6 22.0 0%
Nov-15 15 1.7 1.0 1.7 1.0 14.1 12.0 23.9 22.0 6%
Dec-15 11 4.1 1.0 4.1 1.0 13.1 12.0 22.2 27.0 10%
Jan-16 13 4.0 1.0 3.8 1.0 12.2 11.0 24.7 23.0 0%
Feb-16 21 4.4 1.0 4.4 1.0 10.7 8.5 17.1 15.5 8%
Mar-16 25 3.1 1.0 3.1 1.0 6.8 7.0 15.5 14.0 10%
Apr-16 20 1.1 0.0 1.1 0.0 8.6 8.5 18.6 17.5 6%
May-16 18 1.7 1.0 1.7 1.0 9.5 6.0 18.9 21.0 16%
Jun-16 16 3.4 1.0 3.4 1.0 11.8 7.5 25.0 26.0 0%
Jul-16 21 4.7 2.0 4.7 2.0 7.5 4.0 17.3 14.5 6%
Aug-16 33 2.8 1.0 2.8 1.0 13.1 13.0 14.1 13.5 13%
Sep-16 23 2.5 1.0 2.5 1.0 14.0 14.0 15.2 14.0 11%
Oct-16 25 1.4 0.0 1.4 0.0 18.0 18.0 23.4 22.0 5%
Nov-16 22 1.2 0.0 1.2 0.0 22.0 22.5 29.9 32.0 5%
Dec-16 20 2.9 0.0 2.8 0.0 16.9 19.5 26.5 30.0 14%
Jan-17 15 2.5 0.0 2.5 0.0 17.3 20.0 22.2 14.0 22%
Feb-17 21 2.4 0.0 2.4 0.0 16.3 13.0 15.0 11.5 13%
Mar-17 26 1.6 0.0 2.0 0.0 11.5 15.0 23.6 27.0 6%
Apr-17 28 0.7 0.0 1.0 0.0 13.2 11.0 26.1 27.5 0%
May-17 28 2.1 0.0 2.1 0.0 22.6 20.0 27.6 34.0 7% 7% 7%
Jun-17 21 2.1 0.0 2.1 0.0 30.1 31.0 36.6 42.0 6% 6% 6%
Jul-17 16 0.9 0.0 0.9 0.0 32.9 30.0 42.4 48.0 10% 10% 10%
Aug-17 28 0.7 0.0 0.7 0.0 16.5 11.5 40.6 51.0 9% 9% 9%
Sep-17 22 0.3 0.0 0.3 0.0 27.8 31.0 32.3 36.0 7% 7% 7%
Oct-17 16 2.3 0.0 2.5 0.0 33.0 34.0 38.4 49.0 10% 10% 10%
Nov-17 15 1.4 0.0 1.6 0.0 31.8 27.0 50.5 48.0 0% 0% 0%
Dec-17 16 4.2 0.5 4.2 0.5 31.4 32.0 43.5 50.0 8% 8% 8%
Jan-18 15 3.2 0.5 3.2 0.0 33.2 31.0 48.4 60.5 5% 5% 5%
Apr-15 60 1.8 1.0 1.8 1.0 37.2 16.0 38.6 44.0 24%
May-15 59 1.8 1.0 2.1 1.0 35.9 19.0 26.2 15.0 25%
Jun-15 62 1.7 1.0 2.1 1.0 16.8 8.0 34.2 25.0 7%
Jul-15 77 1.7 1.0 2.1 1.0 16.1 10.0 20.8 15.0 25%
Aug-15 61 2.1 1.0 2.1 1.0 22.5 19.0 23.6 33.0 24%
Sep-15 95 1.7 1.0 2.0 1.0 24.3 15.0 23.0 14.0 26%
Oct-15 73 1.8 1.0 2.1 1.0 21.2 23.0 32.1 45.0 20%
Nov-15 55 1.2 1.0 1.4 1.0 31.9 28.0 33.5 47.0 24%
Dec-15 65 1.5 1.0 2.0 1.0 27.3 22.0 39.0 48.0 19%
Jan-16 61 2.7 0.0 2.9 0.0 29.2 18.5 33.6 44.0 23%
Feb-16 66 2.7 1.0 3.3 1.0 24.2 21.0 33.1 41.0 14%
Mar-16 81 2.0 0.0 2.5 0.0 25.9 27.0 28.3 21.0 30%
Apr-16 68 1.9 0.0 2.2 0.0 23.5 20.5 37.4 46.0 13%
May-16 68 1.7 0.0 2.0 0.0 23.1 21.5 29.0 24.5 25%
Jun-16 71 1.4 0.0 1.5 0.0 22.1 17.0 26.6 22.0 11%
Jul-16 67 1.7 0.0 1.7 0.0 11.8 6.0 21.8 18.0 14%
Aug-16 95 1.5 0.0 1.7 0.0 12.3 13.0 13.1 10.0 24%
Sep-16 104 1.6 0.0 1.7 0.0 14.4 11.0 16.8 14.0 13%
Oct-16 76 1.3 0.0 1.3 0.0 25.2 25.0 21.5 17.5 10%
Nov-16 81 1.5 0.0 1.5 0.0 24.3 20.5 28.1 16.5 13%
Dec-16 98 1.5 0.0 1.6 0.0 26.8 23.0 24.3 15.0 11%
Jan-17 87 1.9 0.0 1.9 0.0 25.5 21.0 28.8 19.0 16%
Feb-17 95 1.7 1.0 1.7 1.0 21.8 19.0 28.5 17.0 16%
Mar-17 109 1.5 0.0 1.5 0.0 23.9 21.0 33.2 20.0 13%
Apr-17 80 1.1 0.0 1.1 0.0 26.7 23.0 34.2 27.0 5%
May-17 103 1.4 0.0 1.4 0.0 27.0 22.0 31.8 26.0 11% 11% 11%
Jun-17 98 1.9 0.0 1.9 0.0 27.9 22.0 27.8 21.0 11% 12% 12%
Jul-17 102 1.5 0.0 1.5 0.0 24.2 18.0 35.3 19.0 9% 9% 10%
Aug-17 108 0.8 0.0 0.8 0.0 28.4 27.0 26.1 15.0 13% 14% 14%
Sep-17 98 0.8 0.0 0.8 0.0 29.1 23.0 35.3 25.0 10% 10% 10%
Oct-17 108 0.8 0.0 0.8 0.0 34.3 28.5 32.2 24.0 13% 13% 13%
Nov-17 92 1.6 0.0 1.6 0.0 38.1 34.5 38.8 39.0 13% 13% 13%
Dec-17 87 1.6 0.0 1.6 0.0 43.8 34.0 37.7 35.0 12% 12% 12%
Jan-18 77 1.0 0.0 0.9 0.0 47.3 43.0 51.7 43.5 6% 6% 6%
Data Notes: 1This data was pulled on 02/01/2018.
2Number of court orders signed is based on the number of orders signed in the specified month. These data are updated from the previous monthly report reflecting updates in the dynamic data system.
Averages, medians, and "percent completed" are based on the orders completed and/or not completed in the specified month regardless of when the court orders were signed (i.e., orders could be signed
in a previous month) and are snapshots of the final look data for that month.
3As of May 2017, DSHS compliance data are calculated and summarized in this table based on the modified deadline for inpatient evaluation and restoration services outlined in the order DSHS received
on 4/26/2017 adopting the Mediated Settlement Agreement, Dkt. # 389, stating: “DSHS shall admit class members for either inpatient competency evaluation or restoration within the shorter of either a) 7
days from receipt of order or b) 14 days from signature of order”. To comply with the new requirements, this report captures two additional sets of compliance information beginning in May, 2017. The
first is percentage of orders completed within 7 days from receipt of order as long as this is the shorter of the two compliance deadlines, or the order was received within 0 and 7 days from signature of
order. The second is percentage of all orders completed within either of the two compliance deadlines: 7 days from receipt of order (if the order was received within 0 and 7 days from order signature
date) or 14 days from order signature date (if the order was received after 7 days from order signature date).
4The inpatient restoration data for WSH includes those referrals that are admitted to Maple Lane and Yakima.
WESTERN STATE HOSPITAL
Court
Orders
Signed
Days from order signature to2:Percent complete
within 7 days from
order signature
date2
Percent completed
within 7 days
from receipt of
order2,3
Percent completed within
7 days from receipt of
order or within 14 days
from order signature
date2,3
hospital receipt of
order
Inpatient
Restoration4
Not Applicable Not Applicable
hospital receipt of
discovery
end of reporting
month for incomplete
referrals
completion
Inpatient
Evaluation
Not Applicable Not Applicable

FEBRUARY 2018 MONTHLY REPORT
8 | P a g e
TABLE 2a. Class Member Status Eastern State Hospital – Jail-based Competency Evaluations
Table1 Title: Competency Outpatient (Jail) Evaluations and Data Summary1
Average Median Average Median Average Median Average Median
Apr-15 32 4.6 1.0 8.6 5.0 28.1 28.0 61.3 57.0 0%
May-15 27 4.3 1.0 8.8 6.0 37.0 33.0 56.9 57.0 0%
Jun-15 30 4.1 1.0 8.3 6.0 38.0 39.0 65.6 64.0 0%
Jul-15 31 4.2 1.0 8.9 6.0 32.6 30.0 66.5 64.0 0%
Aug-15 22 2.4 1.0 6.4 5.0 33.4 32.0 57.7 56.0 3%
Sep-15 48 2.3 1.0 4.9 4.0 29.1 14.0 53.5 55.0 3%
Oct-15 30 1.9 0.0 4.9 4.0 16.4 10.0 39.5 40.0 3%
Nov-15 36 1.8 0.0 5.9 5.0 28.3 26.0 47.4 49.0 0%
Dec-15 42 1.7 0.0 3.2 1.0 21.7 18.0 38.7 35.0 3%
Jan-16 42 4.7 0.0 7.4 1.0 13.4 9.0 36.6 27.5 10%
Feb-16 39 1.4 0.0 2.0 1.0 10.4 6.0 15.5 12.0 25%
Mar-16 67 1.4 0.0 1.3 1.0 11.8 8.0 12.6 10.0 16%
Apr-16 39 1.4 0.0 1.7 0.0 11.0 6.5 14.5 12.0 11%
May-16 51 2.0 0.0 2.3 0.0 13.7 8.0 15.0 11.5 16%
Jun-16 63 1.4 0.0 1.6 0.0 8.2 7.0 14.1 13.0 7%
Average Median Average Median Average Median Average Median
within 14 days
from order
signature date2
within 14 days
from receipt of
order2,3
within 14 days from
receipt of order or 21
days from order
signature date2,3
Jul-16 54 2.0 0.5 2.2 1.0 11.3 9.0 16.0 14.0 32%
Aug-16 73 0.9 0.0 1.1 0.0 6.3 6.0 14.4 14.0 38%
Sep-16 56 0.9 0.0 0.9 0.0 9.6 7.5 14.2 14.0 58%
Oct-16 59 1.0 0.0 1.3 0.0 9.1 10.0 14.9 14.0 42%
Nov-16 33 1.3 0.0 1.5 0.0 11.0 9.0 12.6 12.0 58%
Dec-16 62 0.6 0.0 0.9 0.0 7.3 9.0 10.2 10.0 64%
Jan-17 58 1.0 0.0 1.0 0.0 6.6 5.5 11.5 10.5 41%
Feb-17 52 1.1 0.0 1.7 1.0 9.3 6.0 14.0 14.0 32%
Mar-17 60 0.6 0.0 0.9 0.0 6.0 4.0 11.4 10.0 67%
Apr-17 48 0.4 0.0 0.6 0.0 7.6 5.5 10.7 9.0 61%
May-17 68 0.7 0.0 1.1 0.0 11.0 7.0 11.5 11.0 60% 62% 62%
Jun-17 70 1.6 0.0 1.6 0.0 7.6 4.0 12.7 10.0 49% 55% 55%
Jul-17 54 2.0 0.0 2.3 0.0 11.8 6.0 13.1 12.0 56% 60% 62%
Aug-17 73 0.7 0.0 0.9 0.0 4.6 2.0 12.2 9.0 56% 59% 59%
Sep-17 50 1.4 0.0 1.9 1.0 9.9 8.5 12.3 10.0 53% 55% 55%
Oct-17 62 1.4 0.0 2.0 1.0 7.4 5.0 11.1 10.0 60% 61% 61%
Nov-17 64 1.3 0.0 2.0 1.0 6.9 8.0 11.8 11.0 58% 59% 59%
Dec-17 52 1.3 0.0 2.3 1.0 11.7 10.0 13.5 10.0 65% 66% 70%
Jan-18 67 1.0 0.0 1.8 1.0 6.8 7.0 12.8 13.0 63% 66% 66%
Data Notes: 1This data was pulled on 02/01/2018.
2Number of court orders signed is based on the number of orders signed in the specified month. These data are updated from the previous monthly report reflecting updates in the dynamic data system.
Averages, medians, and "percent completed" are based on the orders completed and/or not completed in the specified month regardless of when the court orders were signed (i.e., orders could be signed
in a previous month) and are snapshots of the final look data for that month.
3As of May 2017, DSHS compliance data are calculated and summarized in this table based on the modified deadB132:O175line for in-jail competency evaluations outlined in the order DSHS received on
4/26/2017 adopting the Mediated Settlement Agreement, Dkt. # 389, stating: “DSHS shall complete in-jail competency evaluations within the shorter of either a) 14 days from receipt of order or b) 21 days
from signature of order”. To comply with the new requirements, this report captures two additional sets of compliance information beginning in May, 2017. The first is percentage of orders completed
within 14 days from receipt of order as long as this is the shorter of the two compliance deadlines, or the order was received within 0 and 7 days from order signature date. The second is percentage of
all orders completed within either of the two compliance deadlines: 14 days from receipt of order (if the order was received within 0 and 7 days from order signature date) or 21 days from order
signature date (if the order was received after 7 days from order signature date).
completion
Jail-based
Evaluation -
7 day
compliance
Not Applicable Not Applicable
Jail-based
Evaluation -
14 day
compliance
Not Applicable Not Applicable
EASTERN STATE HOSPITAL
Court
Orders
Signed
Days from order signature to2:Percent complete
within 7 days from
order signature
date2
Percent completed
within 14 days
from receipt of
order2,3
Percent completed within
14 days from receipt of
order or within 21 days
from order signature
date2,3
hospital receipt of
order
hospital receipt of
discovery
end of reporting
month for incomplete
referrals

FEBRUARY 2018 MONTHLY REPORT
9 | P a g e
TABLE 2b. Class Member Status Eastern State Hospital – Inpatient Competency Services
Table2 Title: Competency Inpatient Evaluations and Restorations with Data Summary1
Average Median Average Median Average Median Average Median
Apr-15 5 8.9 1.0 13.9 5.0 47.9 43.0 56.3 59.0 0%
May-15 4 10.1 1.0 14.2 5.0 65.8 61.0 69.5 69.5 0%
Jun-15 3 7.7 1.0 11.1 5.0 75.2 68.0 89.9 102.0 0%
Jul-15 5 7.5 1.0 11.4 5.0 50.9 14.0 91.8 81.0 0%
Aug-15 3 10.2 1.0 19.6 5.0 44.5 31.0 78.2 80.0 0%
Sep-15 8 6.7 1.0 10.2 4.0 42.6 47.0 32.0 32.0 0%
Oct-15 7 2.0 1.0 7.9 6.0 28.9 16.0 61.1 70.0 0%
Nov-15 6 2.8 0.0 9.6 7.0 44.2 46.0 49.0 49.0 0%
Dec-15 11 2.4 1.0 4.2 2.0 21.1 20.5 83.6 84.0 0%
Jan-16 4 5.4 1.0 8.9 2.0 30.9 31.0 52.9 51.0 0%
Feb-16 10 12.9 1.0 16.3 2.0 47.5 31.0 50.9 56.0 0%
Mar-16 5 15.5 1.0 16.3 1.0 19.2 15.5 69.2 45.0 0%
Apr-16 2 4.9 0.5 5.6 1.0 7.5 7.5 44.0 39.0 0%
May-16 4 0.3 0.0 0.3 0.0 0.0 0.0 12.5 11.5 50%
Jun-16 9 2.5 0.0 2.5 0.0 10.0 9.0 11.4 11.0 13%
Jul-16 3 3.1 1.0 3.5 1.0 4.0 4.0 20.2 20.5 14%
Aug-16 12 1.2 0.0 1.3 0.0 1.3 1.0 4.9 6.0 100%
Sep-16 11 1.6 0.5 1.6 1.0 3.0 3.0 6.5 6.0 73%
Oct-16 12 0.7 0.0 0.8 0.0 4.3 4.0 5.6 6.0 69%
Nov-16 8 2.0 0.0 1.0 0.0 4.5 4.5 8.1 6.5 60%
Dec-16 9 1.7 2.0 1.3 1.0 0.0 0.0 6.6 6.0 64%
Jan-17 10 0.4 0.0 0.2 0.0 0.5 0.5 6.9 5.5 50%
Feb-17 11 1.3 0.0 1.9 1.0 0.0 0.0 5.8 7.0 42%
Mar-17 6 2.0 1.0 2.4 1.0 0.0 0.0 4.8 5.0 83%
Apr-17 10 1.1 0.0 1.5 1.0 0.0 0.0 5.2 6.0 82%
May-17 6 0.2 0.0 3.0 1.0 0.0 0.0 9.2 9.0 17% 17% 17%
Jun-17 10 0.3 0.0 2.3 1.0 7.3 7.5 6.5 6.5 40% 40% 40%
Jul-17 7 3.3 0.0 4.6 2.5 5.0 5.0 11.2 10.0 27% 27% 27%
Aug-17 9 0.8 0.0 0.9 0.0 9.3 7.0 7.2 7.5 30% 30% 30%
Sep-17 8 1.3 1.0 3.3 1.0 6.0 3.0 11.8 13.5 25% 25% 25%
Oct-17 9 0.6 0.0 0.8 1.0 12.0 12.0 13.8 13.0 0% 0% 0%
Nov-17 5 2.8 0.0 3.8 0.5 1.5 1.5 11.7 8.0 20% 20% 20%
Dec-17 12 0.2 0.0 1.3 1.0 6.5 6.5 6.5 8.0 42% 42% 42%
Jan-18 7 0.8 0.5 0.9 0.5 0.0 0.0 5.3 5.0 80% 80% 80%
Apr-15 7 6.8 1.0 8.1 1.0 25.3 22.0 0.0 0.0 100%
May-15 1 6.3 1.0 7.9 2.0 35.0 41.0 54.7 62.0 0%
Jun-15 4 0.6 1.0 1.8 1.0 45.3 39.0 46.0 56.0 20%
Jul-15 11 1.3 0.0 4.5 2.0 16.2 11.0 45.3 56.0 33%
Aug-15 11 1.6 0.0 5.7 3.0 26.4 27.0 35.5 35.5 50%
Sep-15 17 1.5 0.0 4.6 1.0 37.2 35.0 20.4 1.0 57%
Oct-15 6 3.2 0.0 6.4 4.0 45.6 37.0 87.4 93.0 0%
Nov-15 10 2.4 0.0 4.1 2.0 51.7 48.0 90.8 92.0 0%
Dec-15 6 3.8 0.0 4.2 0.5 26.3 20.0 84.7 86.5 0%
Jan-16 15 2.3 0.0 2.7 0.0 31.1 19.0 53.8 58.0 25%
Feb-16 14 2.0 0.0 2.3 0.0 24.2 24.0 55.8 43.5 0%
Mar-16 18 1.1 0.0 1.1 0.0 27.7 23.0 45.2 46.5 0%
Apr-16 11 1.5 0.0 1.7 1.0 16.3 11.5 30.4 31.0 0%
May-16 19 1.5 0.0 1.6 0.0 10.2 13.0 9.9 7.0 53%
Jun-16 19 0.4 0.0 0.4 0.0 7.8 10.0 9.5 9.5 22%
Jul-16 11 0.7 0.0 0.7 0.0 2.0 2.0 7.2 5.0 60%
Aug-16 7 0.4 0.0 0.4 0.0 0.0 0.0 4.6 5.5 100%
Sep-16 21 0.2 0.0 0.2 0.0 1.5 1.5 4.1 5.0 86%
Oct-16 19 0.9 0.0 0.9 0.0 4.4 5.0 5.5 5.5 48%
Nov-16 18 0.7 0.0 0.7 0.0 13.5 13.5 6.3 7.0 48%
Dec-16 12 0.3 0.0 0.3 0.0 15.0 15.0 2.7 2.0 92%
Jan-17 19 1.3 0.0 1.3 0.0 1.0 1.0 7.5 7.0 65%
Feb-17 23 0.7 0.0 0.5 0.0 4.3 6.0 5.4 5.0 48%
Mar-17 18 1.3 0.0 1.4 0.0 5.2 3.0 5.3 7.0 58%
Apr-17 18 2.1 0.0 2.1 0.0 8.6 6.0 6.9 6.5 48%
May-17 20 1.4 0.0 1.8 0.0 5.9 5.5 8.1 7.0 35% 35% 35%
Jun-17 14 2.0 0.0 2.4 0.0 7.5 2.5 8.6 8.0 33% 43% 43%
Jul-17 13 2.2 1.0 2.2 1.0 15.8 10.0 10.3 8.5 28% 33% 33%
Aug-17 23 0.6 0.0 1.7 0.0 6.4 4.0 11.6 9.0 29% 29% 29%
Sep-17 18 1.5 0.0 1.9 1.0 12.8 11.0 15.2 15.0 4% 4% 4%
Oct-17 11 0.8 0.0 1.2 1.0 5.0 6.0 15.9 15.5 13% 13% 13%
Nov-17 12 1.1 0.0 2.4 1.0 5.8 5.5 5.9 6.5 44% 44% 44%
Dec-17 20 1.3 0.0 2.3 0.0 10.2 10.0 9.2 9.0 25% 29% 29%
Jan-18 13 0.3 0.0 0.3 0.0 2.0 2.0 5.4 6.0 81% 81% 81%
Data Notes: 1This data was pulled on 02/01/2018.
2Number of court orders signed is based on the number of orders signed in the specified month. These data are updated from the previous monthly report reflecting updates in the dynamic data system.
Averages, medians, and "percent completed" are based on the orders completed and/or not completed in the specified month regardless of when the court orders were signed (i.e., orders could be signed
in a previous month) and are snapshots of the final look data for that month.
3As of May 2017, DSHS compliance data are calculated and summarized in this table based on the modified deadline for inpatient evaluation and restoration services outlined in the order DSHS received
on 4/26/2017 adopting the Mediated Settlement Agreement, Dkt. # 389, stating: “DSHS shall admit class members for either inpatient competency evaluation or restoration within the shorter of either a) 7
days from receipt of order or b) 14 days from signature of order”. To comply with the new requirements, this report captures two additional sets of compliance information beginning in May, 2017. The
first is percentage of orders completed within 7 days from receipt of order as long as this is the shorter of the two compliance deadlines, or the order was received within 0 and 7 days from signature of
order. The second is percentage of all orders completed within either of the two compliance deadlines: 7 days from receipt of order (if the order was received within 0 and 7 days from order signature
date) or 14 days from order signature date (if the order was received after 7 days from order signature date).
EASTERN STATE HOSPITAL
Court
Orders
Signed
Days from order signature to2:Percent complete
within 7 days from
order signature
date2
Percent completed
within 7 days
from receipt of
order2,3
Percent completed within
7 days from receipt of
order or within 14 days
from order signature
date2,3
hospital receipt of
order
Inpatient
Restoration
Not Applicable Not Applicable
hospital receipt of
discovery
end of reporting
month for incomplete
referrals
completion
Inpatient
Evaluation
Not Applicable Not Applicable
FEBRUARY 2018 MONTHLY REPORT
10 | P a g e
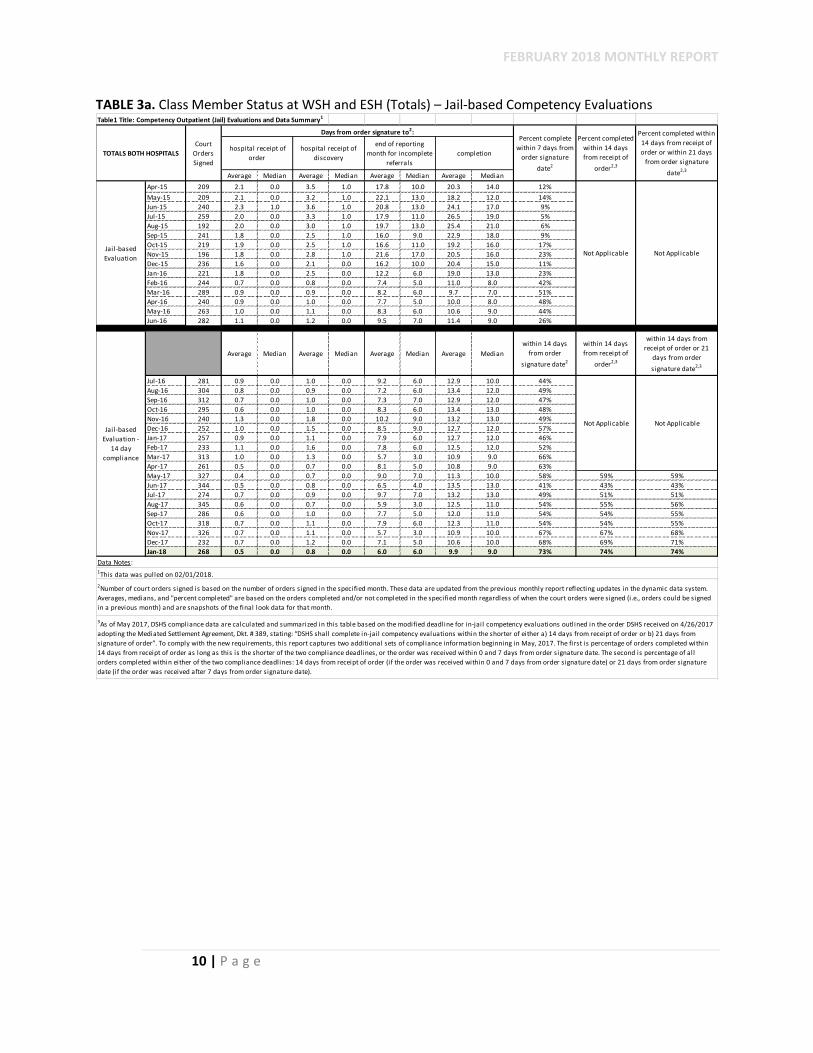
TABLE 3a. Class Member Status at WSH and ESH (Totals) – Jail-based Competency Evaluations
Table1 Title: Competency Outpatient (Jail) Evaluations and Data Summary1
Average Median Average Median Average Median Average Median
Apr-15 209 2.1 0.0 3.5 1.0 17.8 10.0 20.3 14.0 12%
May-15 209 2.1 0.0 3.2 1.0 22.1 13.0 18.2 12.0 14%
Jun-15 240 2.3 1.0 3.6 1.0 20.8 13.0 24.1 17.0 9%
Jul-15 259 2.0 0.0 3.3 1.0 17.9 11.0 26.5 19.0 5%
Aug-15 192 2.0 0.0 3.0 1.0 19.7 13.0 25.4 21.0 6%
Sep-15 241 1.8 0.0 2.5 1.0 16.0 9.0 22.9 18.0 9%
Oct-15 219 1.9 0.0 2.5 1.0 16.6 11.0 19.2 16.0 17%
Nov-15 196 1.8 0.0 2.8 1.0 21.6 17.0 20.5 16.0 23%
Dec-15 236 1.6 0.0 2.1 0.0 16.2 10.0 20.4 15.0 11%
Jan-16 221 1.8 0.0 2.5 0.0 12.2 6.0 19.0 13.0 23%
Feb-16 244 0.7 0.0 0.8 0.0 7.4 5.0 11.0 8.0 42%
Mar-16 289 0.9 0.0 0.9 0.0 8.2 6.0 9.7 7.0 51%
Apr-16 240 0.9 0.0 1.0 0.0 7.7 5.0 10.0 8.0 48%
May-16 263 1.0 0.0 1.1 0.0 8.3 6.0 10.6 9.0 44%
Jun-16 282 1.1 0.0 1.2 0.0 9.5 7.0 11.4 9.0 26%
Average Median Average Median Average Median Average Median
within 14 days
from order
signature date2
within 14 days
from receipt of
order2,3
within 14 days from
receipt of order or 21
days from order
signature date2,3
Jul-16 281 0.9 0.0 1.0 0.0 9.2 6.0 12.9 10.0 44%
Aug-16 304 0.8 0.0 0.9 0.0 7.2 6.0 13.4 12.0 49%
Sep-16 312 0.7 0.0 1.0 0.0 7.3 7.0 12.9 12.0 47%
Oct-16 295 0.6 0.0 1.0 0.0 8.3 6.0 13.4 13.0 48%
Nov-16 240 1.3 0.0 1.8 0.0 10.2 9.0 13.2 13.0 49%
Dec-16 252 1.0 0.0 1.5 0.0 8.5 9.0 12.7 12.0 57%
Jan-17 257 0.9 0.0 1.1 0.0 7.9 6.0 12.7 12.0 46%
Feb-17 233 1.1 0.0 1.6 0.0 7.8 6.0 12.5 12.0 52%
Mar-17 313 1.0 0.0 1.3 0.0 5.7 3.0 10.9 9.0 66%
Apr-17 261 0.5 0.0 0.7 0.0 8.1 5.0 10.8 9.0 63%
May-17 327 0.4 0.0 0.7 0.0 9.0 7.0 11.3 10.0 58% 59% 59%
Jun-17 344 0.5 0.0 0.8 0.0 6.5 4.0 13.5 13.0 41% 43% 43%
Jul-17 274 0.7 0.0 0.9 0.0 9.7 7.0 13.2 13.0 49% 51% 51%
Aug-17 345 0.6 0.0 0.7 0.0 5.9 3.0 12.5 11.0 54% 55% 56%
Sep-17 286 0.6 0.0 1.0 0.0 7.7 5.0 12.0 11.0 54% 54% 55%
Oct-17 318 0.7 0.0 1.1 0.0 7.9 6.0 12.3 11.0 54% 54% 55%
Nov-17 326 0.7 0.0 1.1 0.0 5.7 3.0 10.9 10.0 67% 67% 68%
Dec-17 232 0.7 0.0 1.2 0.0 7.1 5.0 10.6 10.0 68% 69% 71%
Jan-18 268 0.5 0.0 0.8 0.0 6.0 6.0 9.9 9.0 73% 74% 74%
Data Notes:
TOTALS BOTH HOSPITALS
Court
Orders
Signed
Days from order signature to2:Percent complete
within 7 days from
order signature
date2
Percent completed
within 14 days
from receipt of
order2,3
Percent completed within
14 days from receipt of
order or within 21 days
from order signature
date2,3
hospital receipt of
order
hospital receipt of
discovery
end of reporting
month for incomplete
referrals
completion
Jail-based
EvaluationNot Applicable Not Applicable
Jail-based
Evaluation -
14 day
compliance
Not Applicable Not Applicable
1This data was pulled on 02/01/2018.
2Number of court orders signed is based on the number of orders signed in the specified month. These data are updated from the previous monthly report reflecting updates in the dynamic data system.
Averages, medians, and "percent completed" are based on the orders completed and/or not completed in the specified month regardless of when the court orders were signed (i.e., orders could be signed
in a previous month) and are snapshots of the final look data for that month.
3As of May 2017, DSHS compliance data are calculated and summarized in this table based on the modified deadline for in-jail competency evaluations outlined in the order DSHS received on 4/26/2017
adopting the Mediated Settlement Agreement, Dkt. # 389, stating: “DSHS shall complete in-jail competency evaluations within the shorter of either a) 14 days from receipt of order or b) 21 days from
signature of order”. To comply with the new requirements, this report captures two additional sets of compliance information beginning in May, 2017. The first is percentage of orders completed within
14 days from receipt of order as long as this is the shorter of the two compliance deadlines, or the order was received within 0 and 7 days from order signature date. The second is percentage of all
orders completed within either of the two compliance deadlines: 14 days from receipt of order (if the order was received within 0 and 7 days from order signature date) or 21 days from order signature
date (if the order was received after 7 days from order signature date).

FEBRUARY 2018 MONTHLY REPORT
11 | P a g e
TABLE 3b. Class Member Status at WSH and ESH State Hospital (Totals) – Inpatient Services
Table2 Title: Competency Inpatient Evaluations and Restorations with Data Summary1
Average Median Average Median Average Median Average Median
Apr-15 15 7.8 1.0 11.0 3.0 39.9 33.0 45.1 48.5 9%
May-15 13 7.3 1.0 9.7 3.0 55.3 47.0 50.9 25.0 5%
Jun-15 12 5.9 1.0 8.0 3.0 65.0 54.0 44.4 18.0 15%
Jul-15 19 5.7 1.0 7.8 3.0 49.9 15.0 14.8 15.0 20%
Aug-15 17 6.9 1.0 8.4 2.0 33.0 17.0 53.9 29.0 5%
Sep-15 22 4.3 1.0 5.7 1.0 39.4 22.0 20.4 20.0 10%
Oct-15 22 2.4 1.0 4.3 1.0 27.6 19.0 30.8 24.0 0%
Nov-15 21 2.0 1.0 3.9 1.0 30.8 18.0 26.4 22.0 5%
Dec-15 22 3.3 1.0 4.1 1.0 17.8 14.0 47.5 29.0 6%
Jan-16 17 4.8 1.0 6.6 1.0 27.0 23.0 33.7 29.0 0%
Feb-16 31 7.7 1.0 9.0 1.0 24.5 12.0 30.6 22.0 5%
Mar-16 30 6.7 1.0 6.9 1.0 12.6 9.0 26.6 16.0 8%
Apr-16 22 1.7 0.0 1.8 0.0 11.2 9.0 24.2 21.0 4%
May-16 22 1.5 0.0 1.5 0.0 9.5 6.0 17.8 20.0 22%
Jun-16 25 3.2 1.0 3.2 1.0 11.4 8.0 21.9 23.0 3%
Jul-16 24 4.3 1.0 4.3 1.0 7.2 4.0 16.6 14.0 8%
Aug-16 45 2.5 0.5 2.5 0.5 10.6 9.0 11.8 11.5 29%
Sep-16 34 2.1 1.0 2.2 1.0 12.8 14.0 11.7 8.0 29%
Oct-16 37 1.2 0.0 1.2 0.0 16.0 18.0 17.3 21.0 22%
Nov-16 30 1.4 0.0 1.2 0.0 20.5 21.5 23.2 29.5 16%
Dec-16 29 2.6 0.0 2.6 0.0 16.9 19.5 21.1 21.0 22%
Jan-17 25 1.9 0.0 2.0 0.0 10.6 12.0 18.0 14.0 29%
Feb-17 33 2.0 0.0 2.3 0.0 14.0 12.0 10.8 7.5 31%
Mar-17 32 1.6 0.0 2.0 0.0 10.8 11.0 19.9 25.0 21%
Apr-17 38 0.7 0.0 1.1 0.0 13.6 11.0 17.6 21.0 17%
May-17 34 1.9 0.0 2.2 0.0 22.6 20.0 24.3 28.0 8% 8% 8%
Jun-17 31 1.9 0.0 2.2 0.0 27.6 28.5 29.4 39.0 11% 11% 11%
Jul-17 23 1.3 0.0 1.5 0.0 31.7 28.0 33.7 45.0 14% 14% 14%
Aug-17 37 0.7 0.0 0.8 0.0 15.6 9.0 31.9 43.0 12% 12% 12%
Sep-17 30 0.5 0.0 0.8 0.0 25.6 23.5 26.0 28.0 11% 11% 11%
Oct-17 25 2.0 0.0 2.1 0.0 32.3 34.0 30.5 23.0 8% 8% 8%
Nov-17 20 1.6 0.0 1.8 0.0 29.1 27.0 45.2 44.5 2% 2% 2%
Dec-17 28 3.2 0.0 3.5 1.0 29.4 25.0 28.7 11.0 16% 16% 16%
Jan-18 22 2.7 0.5 2.7 0.0 31.9 28.0 31.6 22.0 21% 21% 21%
Apr-15 67 1.5 0.0 2.2 1.0 35.3 16.0 37.6 43.0 26%
May-15 60 1.5 0.0 1.9 0.0 35.8 20.0 27.8 18.0 24%
Jun-15 66 1.6 0.0 2.0 1.0 20.6 13.0 34.9 25.0 20%
Jul-15 88 1.4 0.0 1.9 0.0 16.1 10.0 24.5 20.0 26%
Aug-15 72 1.9 0.0 2.4 0.0 23.5 20.0 24.0 33.0 25%
Sep-15 112 1.6 0.0 2.1 0.0 27.6 21.0 22.7 13.0 29%
Oct-15 79 2.1 1.0 2.9 1.0 26.9 25.0 32.1 45.0 20%
Nov-15 65 1.5 1.0 2.0 1.0 37.2 34.0 42.1 49.0 21%
Dec-15 71 1.8 1.0 2.3 1.0 27.5 23.0 47.4 52.0 15%
Jan-16 76 2.6 0.0 2.8 0.0 29.6 19.0 37.5 46.0 23%
Feb-16 80 3.3 0.0 3.8 1.0 24.2 21.0 37.1 41.0 12%
Mar-16 99 1.3 0.0 2.2 0.0 26.5 24.0 31.8 39 24%
Apr-16 79 1.7 0.0 2 0.0 22.9 22.0 35.5 41 10%
May-16 87 1.7 0.0 1.9 0.0 22.1 20.0 25.2 19 31%
Jun-16 90 1.2 0.0 1.3 0.0 21 15.0 23 14.5 13%
Jul-16 78 1.6 0.0 1.8 0.0 11.4 6.0 20.4 13.0 19%
Aug-16 102 1.4 0.0 1.6 0.0 12.6 13.0 11.8 11.5 28%
Sep-16 125 1.4 0.0 1.5 0.0 14.0 10.0 14.3 12.0 22%
Oct-16 95 1.2 0.0 1.3 0.0 23.9 25.0 18.6 14.0 14%
Nov-16 99 1.4 0.0 1.4 0.0 24.0 20.5 23.6 13.0 18%
Dec-16 110 1.5 0.0 1.5 0.0 26.6 23.0 21.4 13.0 17%
Jan-17 106 1.8 0.0 1.8 0.0 25.1 20.5 25.4 15.5 21%
Feb-17 118 1.5 1.0 1.5 1.0 20.7 18.0 24.4 10.5 20%
Mar-17 127 1.4 0.0 1.4 0.0 23.0 19.5 22.6 12.0 18%
Apr-17 98 1.2 0.0 1.2 0.0 25.5 20.0 29.4 21.0 10%
May-17 123 1.5 0.0 1.5 0.0 27.4 22.0 28.7 20.0 13% 14% 14%
Jun-17 112 1.9 0.0 1.9 0.0 27.1 21.5 24.7 15.0 13% 15% 15%
Jul-17 115 1.5 0.0 1.5 0.0 24.2 18.0 32.5 18.0 11% 11% 12%
Aug-17 131 0.7 0.0 0.9 0.0 26.6 22.0 23.9 14.0 15% 16% 16%
Sep-17 116 0.9 0.0 0.9 0.0 27.6 19.0 32.7 19.0 9% 9% 9%
Oct-17 119 0.8 0.0 0.8 0.0 33.5 27.5 29.4 18.0 13% 13% 13%
Nov-17 104 1.5 0.0 1.6 0.0 37.2 31.0 35.1 30.5 15% 15% 15%
Dec-17 113 1.6 0.0 1.6 0.0 42.8 34.0 31.4 12.0 13% 13% 13%
Jan-18 90 0.9 0.0 0.9 0.0 46.7 43.0 45.9 38.0 10% 11% 11%
hospital receipt of
discovery
end of reporting
month for incomplete
referrals
completion
Data Notes: 1This data was pulled on 02/01/2018.
2Number of court orders signed is based on the number of orders signed in the specified month. These data are updated from the previous monthly report reflecting updates in the dynamic data system.
Averages, medians, and "percent completed" are based on the orders completed and/or not completed in the specified month regardless of when the court orders were signed (i.e., orders could be signed
in a previous month) and are snapshots of the final look data for that month.
3As of May 2017, DSHS compliance data are calculated and summarized in this table based on the modified deadline for inpatient evaluation and restoration services outlined in the order DSHS received
on 4/26/2017 adopting the Mediated Settlement Agreement, Dkt. # 389, stating: “DSHS shall admit class members for either inpatient competency evaluation or restoration within the shorter of either a) 7
days from receipt of order or b) 14 days from signature of order”. To comply with the new requirements, this report captures two additional sets of compliance information beginning in May, 2017. The
first is percentage of orders completed within 7 days from receipt of order as long as this is the shorter of the two compliance deadlines, or the order was received within 0 and 7 days from signature of
order. The second is percentage of all orders completed within either of the two compliance deadlines: 7 days from receipt of order (if the order was received within 0 and 7 days from order signature
date) or 14 days from order signature date (if the order was received after 7 days from order signature date).
4The inpatient restoration data for WSH includes those referrals that are admitted to Maple Lane and Yakima.
Inpatient
Restoration4
Not Applicable Not Applicable
Percent completed
within 7 days
from receipt of
order2,3
Percent completed within
7 days from receipt of
order or within 14 days
from order signature
date2,3
hospital receipt of
order
Inpatient
Evaluation
Not Applicable Not Applicable
TOTALS BOTH HOSPITALS
Court
Orders
Signed
Days from order signature to2:Percent complete
within 7 days from
order signature
date2
FEBRUARY 2018 MONTHLY REPORT
12 | P a g e
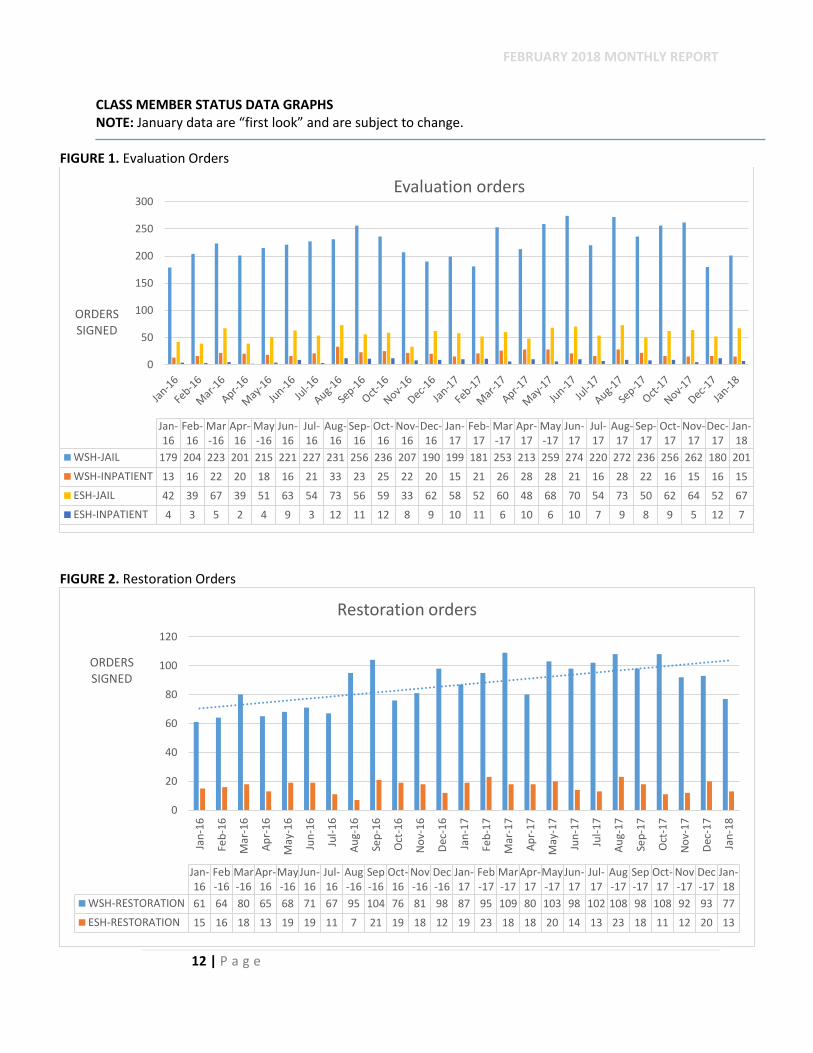
CLASS MEMBER STATUS DATA GRAPHS NOTE: January data are “first look” and are subject to change.
FIGURE 1. Evaluation Orders
FIGURE 2. Restoration Orders
0
50
100
150
200
250
300
ORDERS SIGNED
Jan-16
Feb-16
Mar-16
Apr-16
May-16
Jun-16
Jul-16
Aug-16
Sep-16
Oct-16
Nov-16
Dec-16
Jan-17
Feb-17
Mar-17
Apr-17
May-17
Jun-17
Jul-17
Aug-17
Sep-17
Oct-17
Nov-17
Dec-17
Jan-18
WSH-JAIL 179 204 223 201 215 221 227 231 256 236 207 190 199 181 253 213 259 274 220 272 236 256 262 180 201
WSH-INPATIENT 13 16 22 20 18 16 21 33 23 25 22 20 15 21 26 28 28 21 16 28 22 16 15 16 15
ESH-JAIL 42 39 67 39 51 63 54 73 56 59 33 62 58 52 60 48 68 70 54 73 50 62 64 52 67
ESH-INPATIENT 4 3 5 2 4 9 3 12 11 12 8 9 10 11 6 10 6 10 7 9 8 9 5 12 7
Evaluation orders
0
20
40
60
80
100
120
Jan
-16
Feb
-16
Mar
-16
Ap
r-1
6
May
-16
Jun
-16
Jul-
16
Au
g-1
6
Sep
-16
Oct
-16
No
v-1
6
Dec
-16
Jan
-17
Feb
-17
Mar
-17
Ap
r-1
7
May
-17
Jun
-17
Jul-
17
Au
g-1
7
Sep
-17
Oct
-17
No
v-1
7
Dec
-17
Jan
-18
ORDERS SIGNED
Jan-16
Feb-16
Mar-16
Apr-16
May-16
Jun-16
Jul-16
Aug-16
Sep-16
Oct-16
Nov-16
Dec-16
Jan-17
Feb-17
Mar-17
Apr-17
May-17
Jun-17
Jul-17
Aug-17
Sep-17
Oct-17
Nov-17
Dec-17
Jan-18
WSH-RESTORATION 61 64 80 65 68 71 67 95 104 76 81 98 87 95 109 80 103 98 102 108 98 108 92 93 77
ESH-RESTORATION 15 16 18 13 19 19 11 7 21 19 18 12 19 23 18 18 20 14 13 23 18 11 12 20 13
Restoration orders
FEBRUARY 2018 MONTHLY REPORT
13 | P a g e
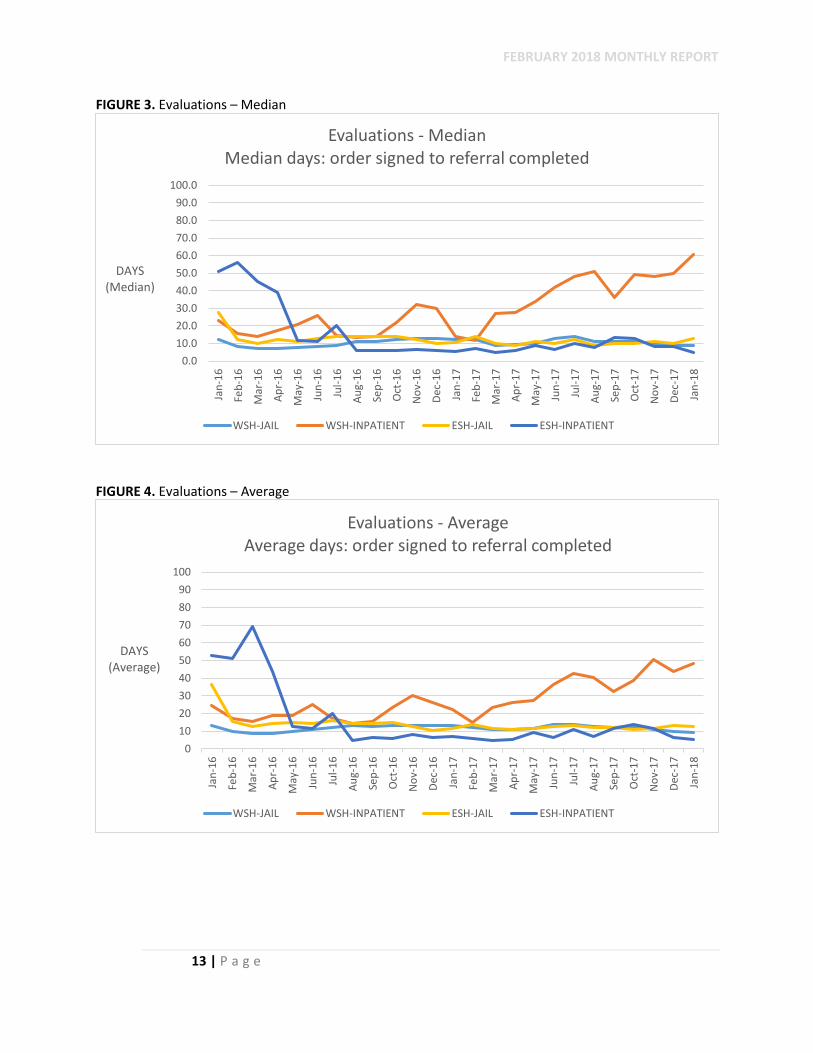
FIGURE 3. Evaluations – Median
FIGURE 4. Evaluations – Average
0.0
10.0
20.0
30.0
40.0
50.0
60.0
70.0
80.0
90.0
100.0
Jan
-16
Feb
-16
Mar
-16
Ap
r-1
6
May
-16
Jun
-16
Jul-
16
Au
g-1
6
Sep
-16
Oct
-16
No
v-1
6
Dec
-16
Jan
-17
Feb
-17
Mar
-17
Ap
r-1
7
May
-17
Jun
-17
Jul-
17
Au
g-1
7
Sep
-17
Oct
-17
No
v-1
7
Dec
-17
Jan
-18
DAYS(Median)
Evaluations - MedianMedian days: order signed to referral completed
WSH-JAIL WSH-INPATIENT ESH-JAIL ESH-INPATIENT
0
10
20
30
40
50
60
70
80
90
100
Jan
-16
Feb
-16
Mar
-16
Ap
r-1
6
May
-16
Jun
-16
Jul-
16
Au
g-1
6
Sep
-16
Oct
-16
No
v-1
6
Dec
-16
Jan
-17
Feb
-17
Mar
-17
Ap
r-1
7
May
-17
Jun
-17
Jul-
17
Au
g-1
7
Sep
-17
Oct
-17
No
v-1
7
Dec
-17
Jan
-18
DAYS(Average)
Evaluations - AverageAverage days: order signed to referral completed
WSH-JAIL WSH-INPATIENT ESH-JAIL ESH-INPATIENT
FEBRUARY 2018 MONTHLY REPORT
14 | P a g e
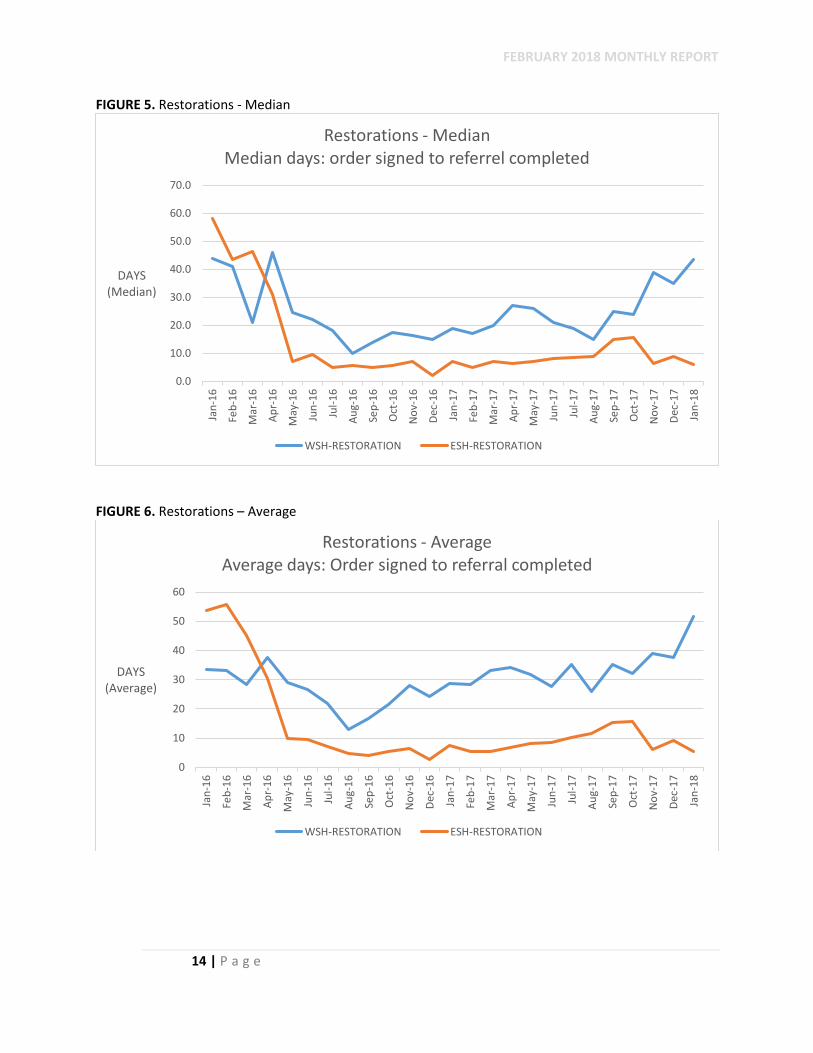
FIGURE 5. Restorations - Median
FIGURE 6. Restorations – Average
0.0
10.0
20.0
30.0
40.0
50.0
60.0
70.0
Jan
-16
Feb
-16
Mar
-16
Ap
r-1
6
May
-16
Jun
-16
Jul-
16
Au
g-1
6
Sep
-16
Oct
-16
No
v-1
6
Dec
-16
Jan
-17
Feb
-17
Mar
-17
Ap
r-1
7
May
-17
Jun
-17
Jul-
17
Au
g-1
7
Sep
-17
Oct
-17
No
v-1
7
Dec
-17
Jan
-18
DAYS(Median)
Restorations - MedianMedian days: order signed to referrel completed
WSH-RESTORATION ESH-RESTORATION
0
10
20
30
40
50
60
Jan
-16
Feb
-16
Mar
-16
Ap
r-1
6
May
-16
Jun
-16
Jul-
16
Au
g-1
6
Sep
-16
Oct
-16
No
v-1
6
Dec
-16
Jan
-17
Feb
-17
Mar
-17
Ap
r-1
7
May
-17
Jun
-17
Jul-
17
Au
g-1
7
Sep
-17
Oct
-17
No
v-1
7
Dec
-17
Jan
-18
DAYS (Average)
Restorations - AverageAverage days: Order signed to referral completed
WSH-RESTORATION ESH-RESTORATION
FEBRUARY 2018 MONTHLY REPORT
15 | P a g e
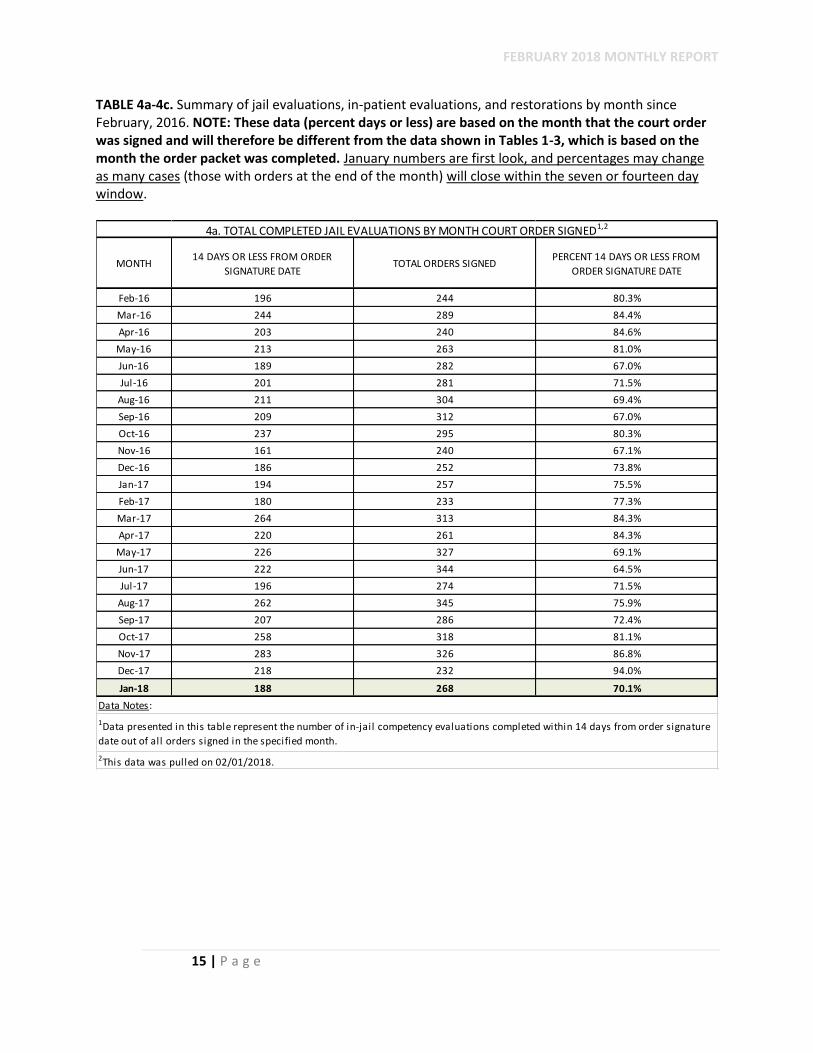
TABLE 4a-4c. Summary of jail evaluations, in-patient evaluations, and restorations by month since February, 2016. NOTE: These data (percent days or less) are based on the month that the court order was signed and will therefore be different from the data shown in Tables 1-3, which is based on the month the order packet was completed. January numbers are first look, and percentages may change as many cases (those with orders at the end of the month) will close within the seven or fourteen day window.
MONTH14 DAYS OR LESS FROM ORDER
SIGNATURE DATETOTAL ORDERS SIGNED
PERCENT 14 DAYS OR LESS FROM
ORDER SIGNATURE DATE
Feb-16 196 244 80.3%
Mar-16 244 289 84.4%
Apr-16 203 240 84.6%
May-16 213 263 81.0%
Jun-16 189 282 67.0%
Jul-16 201 281 71.5%
Aug-16 211 304 69.4%
Sep-16 209 312 67.0%
Oct-16 237 295 80.3%
Nov-16 161 240 67.1%
Dec-16 186 252 73.8%
Jan-17 194 257 75.5%
Feb-17 180 233 77.3%
Mar-17 264 313 84.3%
Apr-17 220 261 84.3%
May-17 226 327 69.1%
Jun-17 222 344 64.5%
Jul-17 196 274 71.5%
Aug-17 262 345 75.9%
Sep-17 207 286 72.4%
Oct-17 258 318 81.1%
Nov-17 283 326 86.8%
Dec-17 218 232 94.0%
Jan-18 188 268 70.1%
4a. TOTAL COMPLETED JAIL EVALUATIONS BY MONTH COURT ORDER SIGNED1,2
Data Notes:
1Data presented in this table represent the number of in-jail competency evaluations completed within 14 days from order signature
date out of all orders signed in the specified month.
2This data was pulled on 02/01/2018.
FEBRUARY 2018 MONTHLY REPORT
16 | P a g e
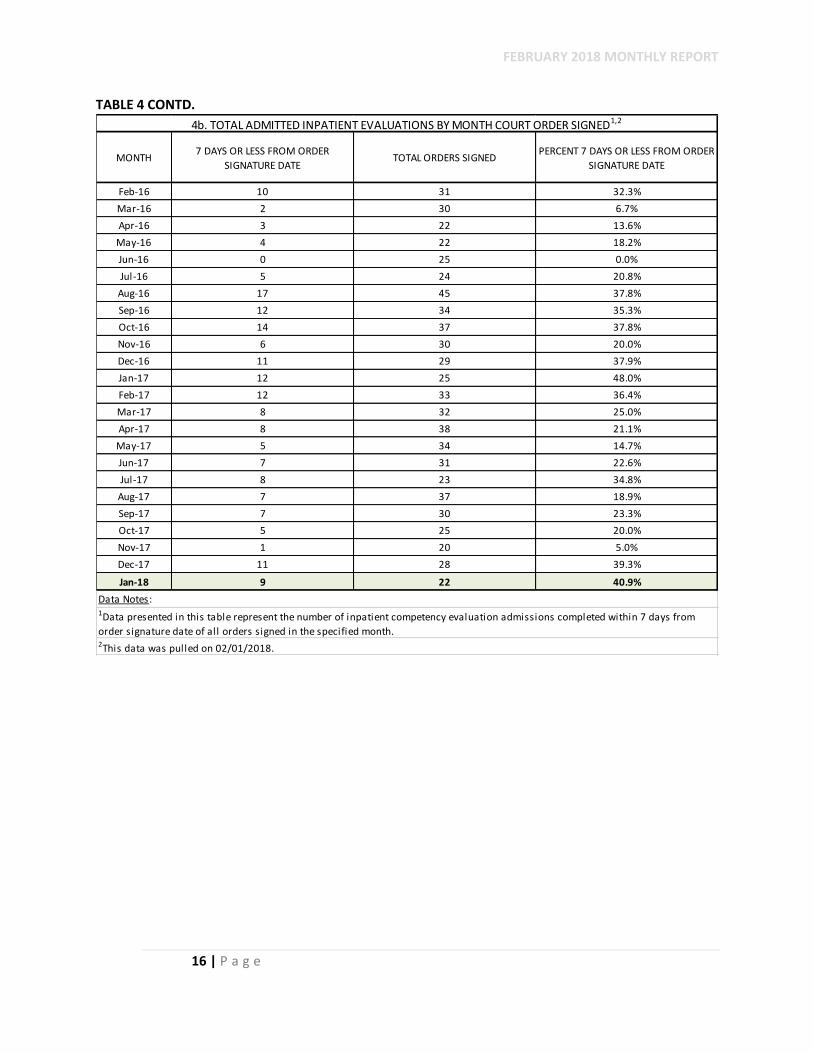
TABLE 4 CONTD.
MONTH7 DAYS OR LESS FROM ORDER
SIGNATURE DATETOTAL ORDERS SIGNED
PERCENT 7 DAYS OR LESS FROM ORDER
SIGNATURE DATE
Feb-16 10 31 32.3%
Mar-16 2 30 6.7%
Apr-16 3 22 13.6%
May-16 4 22 18.2%
Jun-16 0 25 0.0%
Jul-16 5 24 20.8%
Aug-16 17 45 37.8%
Sep-16 12 34 35.3%
Oct-16 14 37 37.8%
Nov-16 6 30 20.0%
Dec-16 11 29 37.9%
Jan-17 12 25 48.0%
Feb-17 12 33 36.4%
Mar-17 8 32 25.0%
Apr-17 8 38 21.1%
May-17 5 34 14.7%
Jun-17 7 31 22.6%
Jul-17 8 23 34.8%
Aug-17 7 37 18.9%
Sep-17 7 30 23.3%
Oct-17 5 25 20.0%
Nov-17 1 20 5.0%
Dec-17 11 28 39.3%
Jan-18 9 22 40.9%
4b. TOTAL ADMITTED INPATIENT EVALUATIONS BY MONTH COURT ORDER SIGNED1,2
Data Notes: 1Data presented in this table represent the number of inpatient competency evaluation admissions completed within 7 days from
order signature date of all orders signed in the specified month. 2This data was pulled on 02/01/2018.
FEBRUARY 2018 MONTHLY REPORT
17 | P a g e
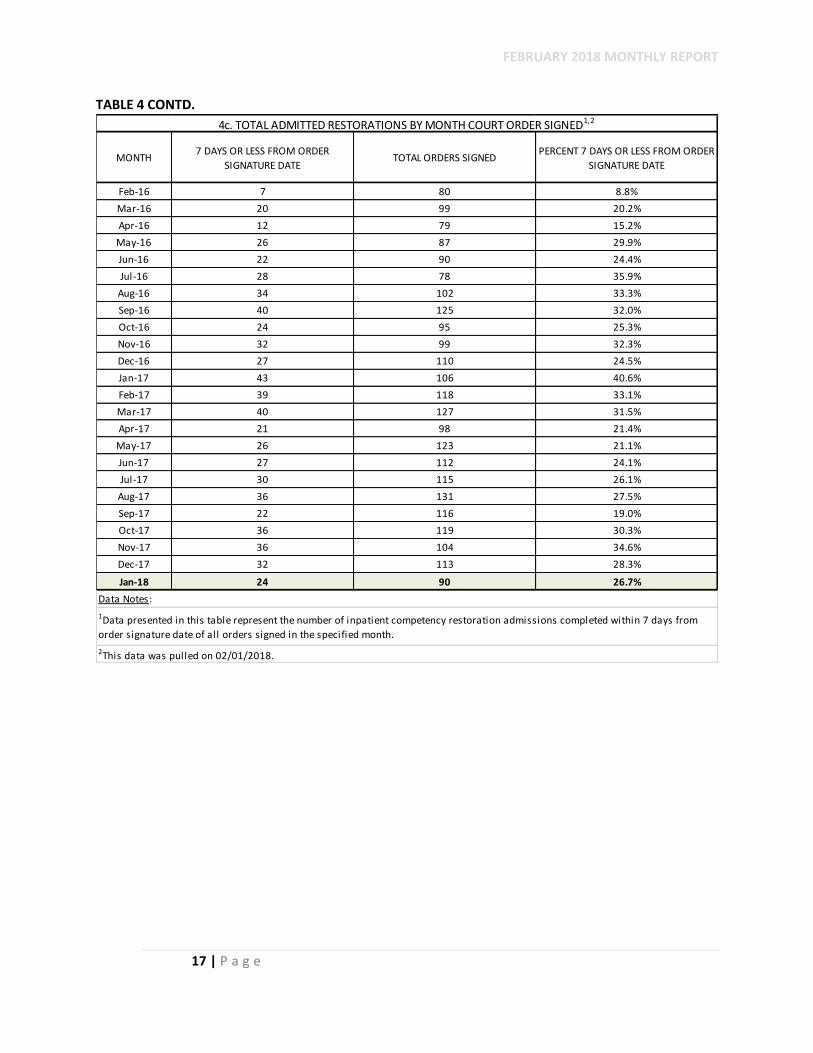
TABLE 4 CONTD.
MONTH7 DAYS OR LESS FROM ORDER
SIGNATURE DATETOTAL ORDERS SIGNED
PERCENT 7 DAYS OR LESS FROM ORDER
SIGNATURE DATE
Feb-16 7 80 8.8%
Mar-16 20 99 20.2%
Apr-16 12 79 15.2%
May-16 26 87 29.9%
Jun-16 22 90 24.4%
Jul-16 28 78 35.9%
Aug-16 34 102 33.3%
Sep-16 40 125 32.0%
Oct-16 24 95 25.3%
Nov-16 32 99 32.3%
Dec-16 27 110 24.5%
Jan-17 43 106 40.6%
Feb-17 39 118 33.1%
Mar-17 40 127 31.5%
Apr-17 21 98 21.4%
May-17 26 123 21.1%
Jun-17 27 112 24.1%
Jul-17 30 115 26.1%
Aug-17 36 131 27.5%
Sep-17 22 116 19.0%
Oct-17 36 119 30.3%
Nov-17 36 104 34.6%
Dec-17 32 113 28.3%
Jan-18 24 90 26.7%
Data Notes:
1Data presented in this table represent the number of inpatient competency restoration admissions completed within 7 days from
order signature date of all orders signed in the specified month.
2This data was pulled on 02/01/2018.
4c. TOTAL ADMITTED RESTORATIONS BY MONTH COURT ORDER SIGNED1,2
FEBRUARY 2018 MONTHLY REPORT
18 | P a g e
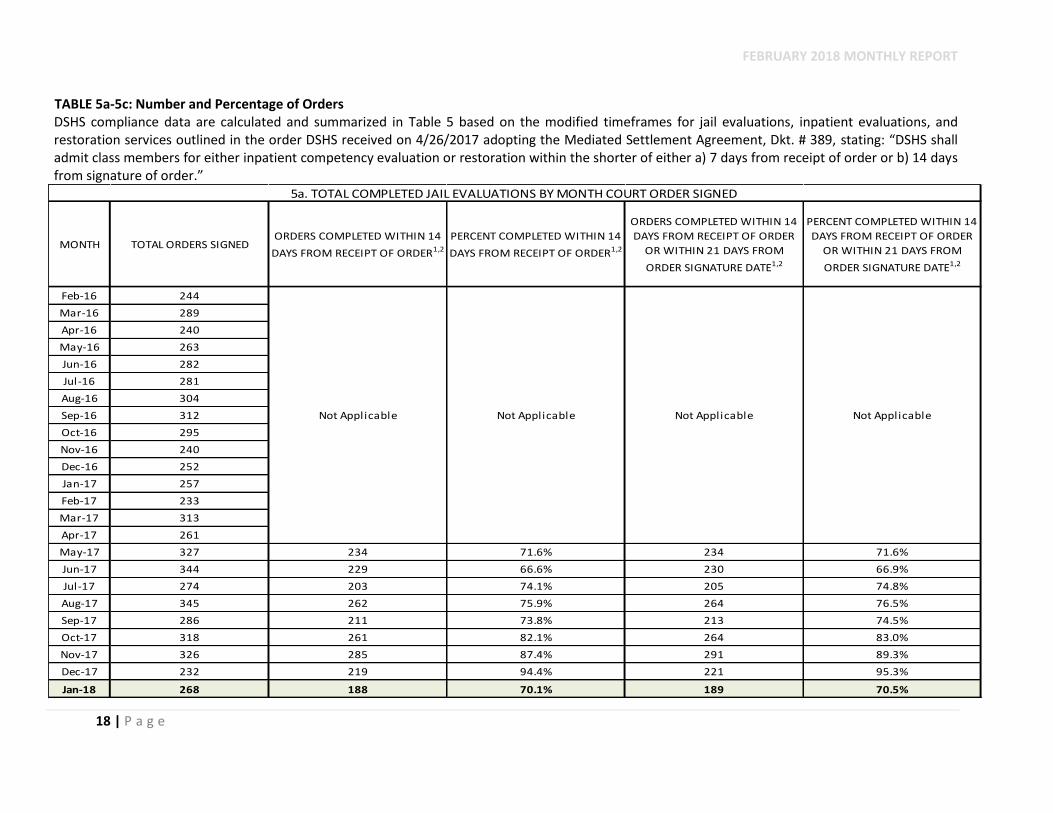
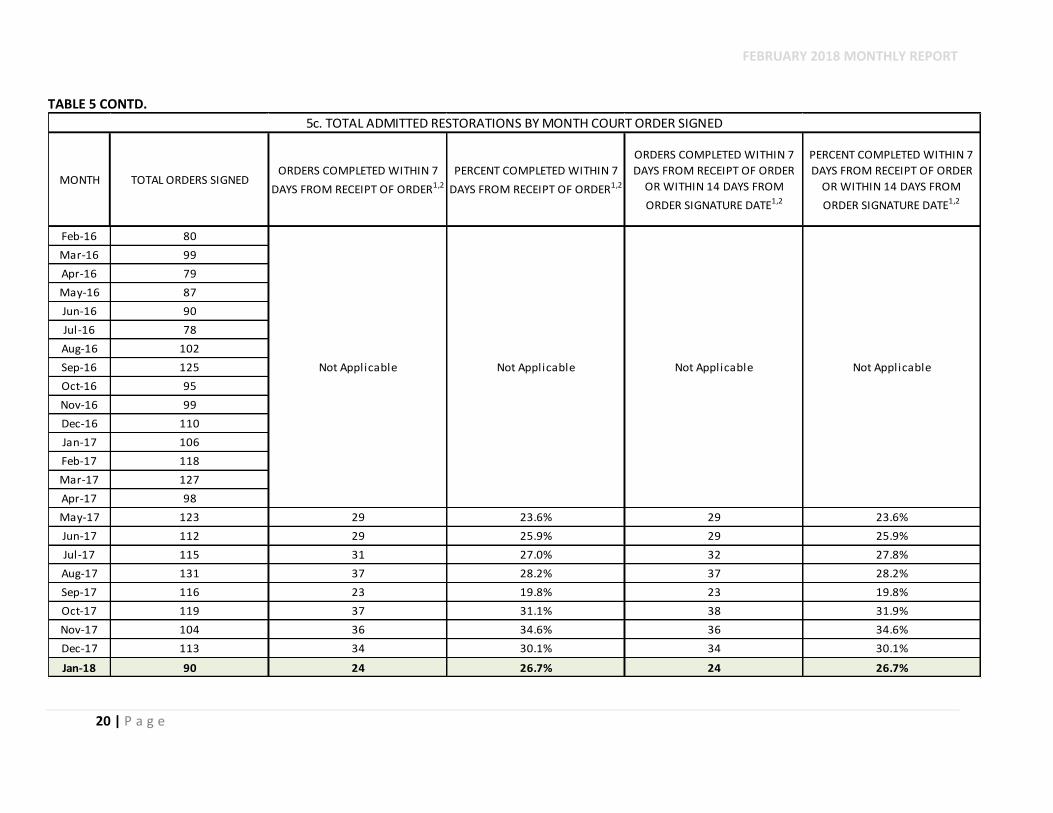
TABLE 5a-5c: Number and Percentage of Orders DSHS compliance data are calculated and summarized in Table 5 based on the modified timeframes for jail evaluations, inpatient evaluations, and restoration services outlined in the order DSHS received on 4/26/2017 adopting the Mediated Settlement Agreement, Dkt. # 389, stating: “DSHS shall admit class members for either inpatient competency evaluation or restoration within the shorter of either a) 7 days from receipt of order or b) 14 days from signature of order.”
MONTH TOTAL ORDERS SIGNEDORDERS COMPLETED WITHIN 14
DAYS FROM RECEIPT OF ORDER1,2
PERCENT COMPLETED WITHIN 14
DAYS FROM RECEIPT OF ORDER1,2
ORDERS COMPLETED WITHIN 14
DAYS FROM RECEIPT OF ORDER
OR WITHIN 21 DAYS FROM
ORDER SIGNATURE DATE1,2
PERCENT COMPLETED WITHIN 14
DAYS FROM RECEIPT OF ORDER
OR WITHIN 21 DAYS FROM
ORDER SIGNATURE DATE1,2
Feb-16 244
Mar-16 289
Apr-16 240
May-16 263
Jun-16 282
Jul-16 281
Aug-16 304
Sep-16 312
Oct-16 295
Nov-16 240
Dec-16 252
Jan-17 257
Feb-17 233
Mar-17 313
Apr-17 261
May-17 327 234 71.6% 234 71.6%
Jun-17 344 229 66.6% 230 66.9%
Jul-17 274 203 74.1% 205 74.8%
Aug-17 345 262 75.9% 264 76.5%
Sep-17 286 211 73.8% 213 74.5%
Oct-17 318 261 82.1% 264 83.0%
Nov-17 326 285 87.4% 291 89.3%
Dec-17 232 219 94.4% 221 95.3%
Jan-18 268 188 70.1% 189 70.5%
Not Applicable Not Applicable Not Applicable
5a. TOTAL COMPLETED JAIL EVALUATIONS BY MONTH COURT ORDER SIGNED
Not Applicable
FEBRUARY 2018 MONTHLY REPORT
19 | P a g e
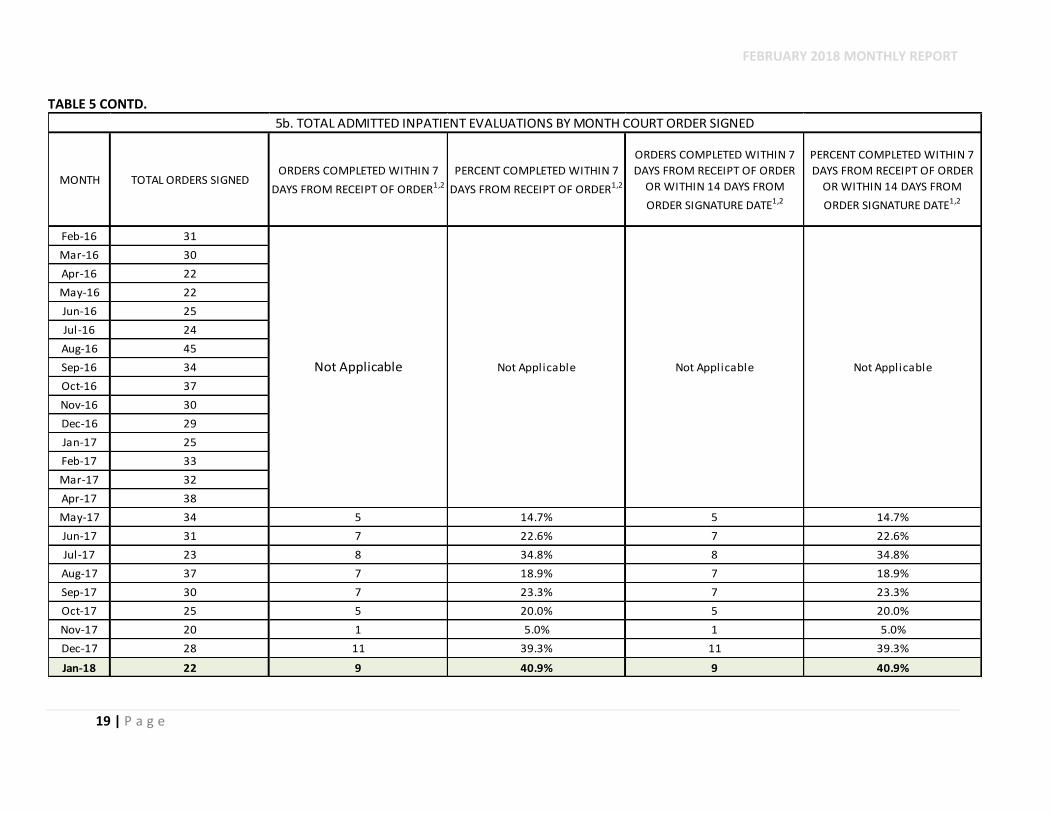
TABLE 5 CONTD.
MONTH TOTAL ORDERS SIGNEDORDERS COMPLETED WITHIN 7
DAYS FROM RECEIPT OF ORDER1,2
PERCENT COMPLETED WITHIN 7
DAYS FROM RECEIPT OF ORDER1,2
ORDERS COMPLETED WITHIN 7
DAYS FROM RECEIPT OF ORDER
OR WITHIN 14 DAYS FROM
ORDER SIGNATURE DATE1,2
PERCENT COMPLETED WITHIN 7
DAYS FROM RECEIPT OF ORDER
OR WITHIN 14 DAYS FROM
ORDER SIGNATURE DATE1,2
Feb-16 31
Mar-16 30
Apr-16 22
May-16 22
Jun-16 25
Jul-16 24
Aug-16 45
Sep-16 34
Oct-16 37
Nov-16 30
Dec-16 29
Jan-17 25
Feb-17 33
Mar-17 32
Apr-17 38
May-17 34 5 14.7% 5 14.7%
Jun-17 31 7 22.6% 7 22.6%
Jul-17 23 8 34.8% 8 34.8%
Aug-17 37 7 18.9% 7 18.9%
Sep-17 30 7 23.3% 7 23.3%
Oct-17 25 5 20.0% 5 20.0%
Nov-17 20 1 5.0% 1 5.0%
Dec-17 28 11 39.3% 11 39.3%
Jan-18 22 9 40.9% 9 40.9%
5b. TOTAL ADMITTED INPATIENT EVALUATIONS BY MONTH COURT ORDER SIGNED
Not Applicable Not Applicable Not Applicable Not Applicable
FEBRUARY 2018 MONTHLY REPORT
20 | P a g e
TABLE 5 CONTD.
MONTH TOTAL ORDERS SIGNEDORDERS COMPLETED WITHIN 7
DAYS FROM RECEIPT OF ORDER1,2
PERCENT COMPLETED WITHIN 7
DAYS FROM RECEIPT OF ORDER1,2
ORDERS COMPLETED WITHIN 7
DAYS FROM RECEIPT OF ORDER
OR WITHIN 14 DAYS FROM
ORDER SIGNATURE DATE1,2
PERCENT COMPLETED WITHIN 7
DAYS FROM RECEIPT OF ORDER
OR WITHIN 14 DAYS FROM
ORDER SIGNATURE DATE1,2
Feb-16 80
Mar-16 99
Apr-16 79
May-16 87
Jun-16 90
Jul-16 78
Aug-16 102
Sep-16 125
Oct-16 95
Nov-16 99
Dec-16 110
Jan-17 106
Feb-17 118
Mar-17 127
Apr-17 98
May-17 123 29 23.6% 29 23.6%
Jun-17 112 29 25.9% 29 25.9%
Jul-17 115 31 27.0% 32 27.8%
Aug-17 131 37 28.2% 37 28.2%
Sep-17 116 23 19.8% 23 19.8%
Oct-17 119 37 31.1% 38 31.9%
Nov-17 104 36 34.6% 36 34.6%
Dec-17 113 34 30.1% 34 30.1%
Jan-18 90 24 26.7% 24 26.7%
5c. TOTAL ADMITTED RESTORATIONS BY MONTH COURT ORDER SIGNED
Not Applicable Not Applicable Not Applicable Not Applicable

FEBRUARY 2018 MONTHLY REPORT
21 | P a g e
RESOURCES REQUIRED TO PROVIDE TIMELY COMPETENCY SERVICES Funding and Resources The Washington State Legislature convened one regular and three consecutive special sessions between January 9, 2017 and July 20, 2017. The Legislature passed a 2017-19 operating budget in Substitute Senate Bill 5883 (SSB 5883) on June 30, 2017. Section 204 (2)(e) of the bill references $25,053,000 in Fiscal Year 2018 (July 1, 2017 to June 30, 2018) and $25,847,000 in Fiscal Year 2019 (July 1, 2018 to June 30, 2019) for implementation of efforts to improve the timeliness of competency restoration services pursuant to Chapter 5, Laws of 2015 (SSB 5889). The budget provides funding to operate an additional thirty bed forensic ward in Fiscal Year 2019 (July 1, 2018 to June 30, 2019), assuming the closure of one thirty bed civil ward and subsequent conversion to a forensic unit. The Aging and Long Term Services Administration, the Developmental Disabilities Administration, and Western State Hospital are already collaborating on targeted efforts to successfully discharge patients into the community to reduce the population of one civil ward by thirty patients, as contemplated by the Legislature. The Legislature also funded a twenty-four bed expansion at Yakima Residential Treatment Facility. The Department intended to move forward with this expansion to provide relief to class members. On November 1, 2017, Plaintiffs and the Department submitted a proposal to the court that would transition the operations planned for Yakima expansion to Building 27 at WSH. On November 21, 2017, at a status hearing in the Federal District Court, the Department with the Governor’s office reiterated the plan to shift the expansion money from Yakima to Building 27 at WSH for operations if the court would release fine money to pay for the capital improvements. On January 25, 2018, Judge Pechman heard a motion to use contempt fine funds for the remodel of Building 27 and agreed, in principal, once a few minor changes were made to the plan. The FY 2018 Supplemental Capital Budget, passed on January 19, 2018, includes $2,800,000 for renovation of Eastern State Hospital 1N3 to provide twenty-five beds to serve class members and $1,560,000 for renovation of Western State Hospital Building 29 to support additional forensic wards. However, the FY 2018 Budget did not include funding for the construction of two new thirty-bed forensic wards at Western State Hospital as originally requested. Need Projections and Bed Capacity During the June, 2017 Trueblood Status Hearing, Judge Pechman directed Dr. Danna Mauch to hire a contractor to conduct a Competency Services Bed Need Study to illustrate patient demand and bed need, and ultimately to determine the feasibility of, and timeframe for, compliance with Court orders. The impact of community based competency evaluation on the demand for inpatient CE/CR beds will also be measured. The TriWest Group was selected as the contractor to complete this work within a 60- 90 day timeframe. DSHS met with TriWest to discuss their model and the data needed. DSHS then provided TriWest with a list of data elements that would be provided to them to ensure TriWest and DSHS are using the same terminology and data sets. TriWest then sent DSHS their Institutional Review Board (IRB) proposal and data elements for review and edits, and DSHS responded with edits. On October 13, TriWest requested and received aggregate level referral data from DSHS. DSHS provided TriWest the daily aggregate data on November 28, 2017 and sought status update regarding the IRB application as client-level data cannot be provided without the IRB approval. TriWest informed DSHS that they received word of conditional approval by the IRB on November 30, 2017. On February 1, 2018, TriWest informed DSHS that they just received an email notification from the WSIRB acknowledging receipt of their response to conditional approval and revised application. The response has been entered into the WSIRB queue, and they will contact TriWest upon approval or with questions, as applicable. A data sharing meeting is scheduled for February 12, 2018.
FEBRUARY 2018 MONTHLY REPORT
22 | P a g e
TRUEBLOOD KEY ACCOMPLISHMENTS – JANUARY 2018
RECRUITMENT
Talent Acquisition staff at DSHS HQ continue to recruit for all positions at Western State Hospital including those for SIA projects. Final numbers of staff and data associated with placement is controlled by HR operations staff at WSH.
Recruitment for additional forensic evaluators and a supervisor at the Office of Forensic Mental Health Services has begun. Applications have been given to Dr. Kinlen and his team. Interviews for evaluators began in the last two weeks of January. To date, six applicants have been identified as well-qualified. All six were asked to submit to reference and background checks. Two applicants declined and withdrew from consideration for personal reasons. Recruitment continues for additional evaluators and a supervisor.
A recruitment has been established by the Talent Acquisition Team at DSHS HQ to support personnel needs associated with the Building 27 project at WSH. A team of three senior recruiters will be working with Tim Hunter and others from BHA to identify positions and begin recruitment efforts.
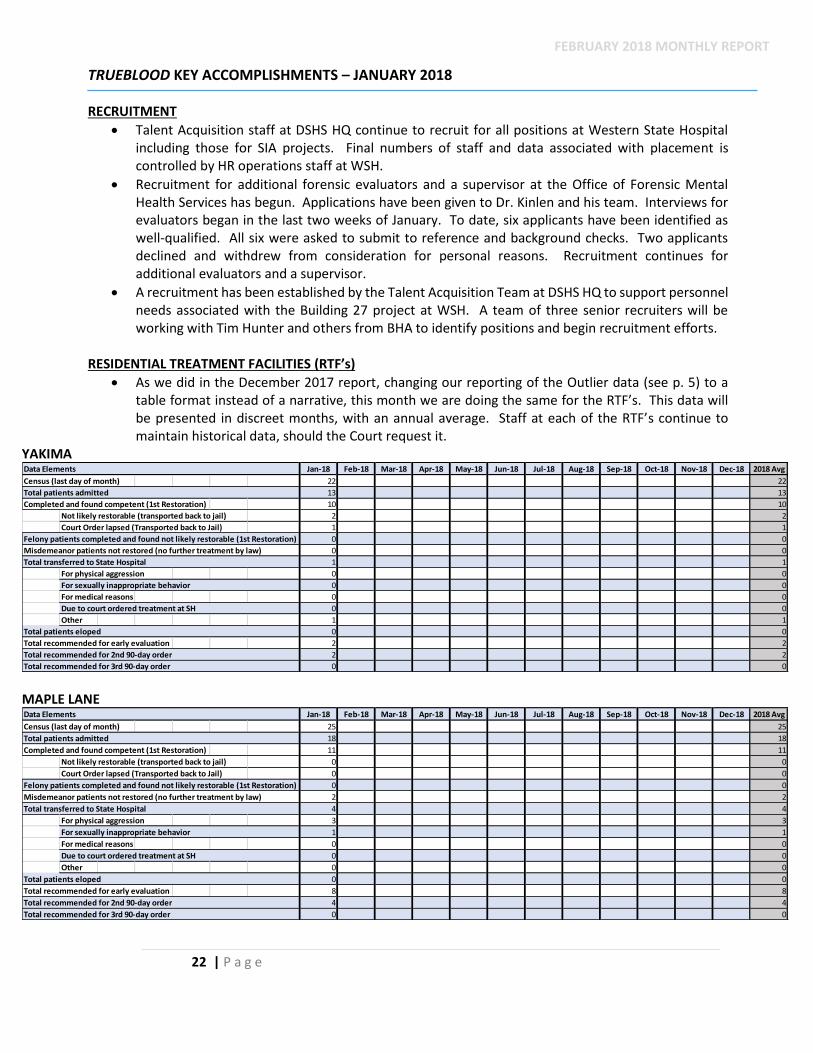
RESIDENTIAL TREATMENT FACILITIES (RTF’s)
As we did in the December 2017 report, changing our reporting of the Outlier data (see p. 5) to a table format instead of a narrative, this month we are doing the same for the RTF’s. This data will be presented in discreet months, with an annual average. Staff at each of the RTF’s continue to maintain historical data, should the Court request it.
YAKIMA
MAPLE LANE
Data Elements Jan-18 Feb-18 Mar-18 Apr-18 May-18 Jun-18 Jul-18 Aug-18 Sep-18 Oct-18 Nov-18 Dec-18 2018 Avg
Census (last day of month) 22 22
Total patients admitted 13 13
Completed and found competent (1st Restoration) 10 10
Not likely restorable (transported back to jail) 2 2
Court Order lapsed (Transported back to Jail) 1 1
Felony patients completed and found not likely restorable (1st Restoration) 0 0
Misdemeanor patients not restored (no further treatment by law) 0 0
Total transferred to State Hospital 1 1
For physical aggression 0 0
For sexually inappropriate behavior 0 0
For medical reasons 0 0
Due to court ordered treatment at SH 0 0
Other 1 1
Total patients eloped 0 0
Total recommended for early evaluation 2 2
Total recommended for 2nd 90-day order 2 2
Total recommended for 3rd 90-day order 0 0
Data Elements Jan-18 Feb-18 Mar-18 Apr-18 May-18 Jun-18 Jul-18 Aug-18 Sep-18 Oct-18 Nov-18 Dec-18 2018 Avg
Census (last day of month) 25 25
Total patients admitted 18 18
Completed and found competent (1st Restoration) 11 11
Not likely restorable (transported back to jail) 0 0
Court Order lapsed (Transported back to Jail) 0 0
Felony patients completed and found not likely restorable (1st Restoration) 0 0
Misdemeanor patients not restored (no further treatment by law) 2 2
Total transferred to State Hospital 4 4
For physical aggression 3 3
For sexually inappropriate behavior 1 1
For medical reasons 0 0
Due to court ordered treatment at SH 0 0
Other 0 0
Total patients eloped 0 0
Total recommended for early evaluation 8 8
Total recommended for 2nd 90-day order 4 4
Total recommended for 3rd 90-day order 0 0
FEBRUARY 2018 MONTHLY REPORT
23 | P a g e
REQUESTS FOR INFORMATION (RFI) RELEASES
Two Request for Information releases were completed during the months of February and August, 2017. Additionally, the plaintiffs provided a list of prospective interested individuals to conduct Competency to Stand Trial evaluations as possible contractors in the November 21, 2017 status hearing. The Department is reaching out to the names provided by the plaintiffs in gathering information about logistical and financial needs to complete such evaluations. Contact was started in November and was completed in December 2017. A total of thirty-one potential contractors were contacted with 17 agreeing to speak with the Director of OFMHS. Data was shared in the status hearing on January 25, 2018 and the Court Monitor provided the recommendation of completing a third Request for Information with modifications to the deadline requirements and target individuals who responded positively during the outreach to apply. In February, the third Request for Information will be completed and distributed.
FEBRUARY 2018 MONTHLY REPORT
24 | P a g e
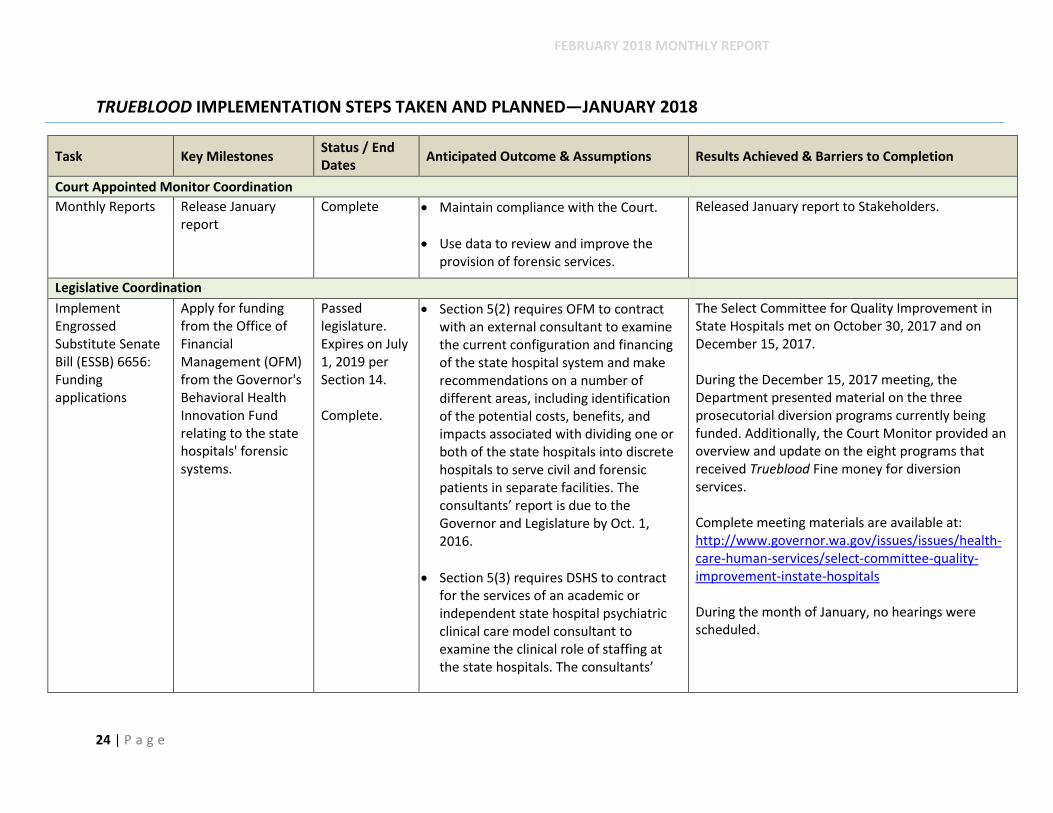
TRUEBLOOD IMPLEMENTATION STEPS TAKEN AND PLANNED—JANUARY 2018
Task Key Milestones Status / End Dates
Anticipated Outcome & Assumptions Results Achieved & Barriers to Completion
Court Appointed Monitor Coordination
Monthly Reports Release January report
Complete
Maintain compliance with the Court.
Use data to review and improve the provision of forensic services.
Released January report to Stakeholders.
Legislative Coordination
Implement Engrossed Substitute Senate Bill (ESSB) 6656: Funding applications
Apply for funding from the Office of Financial Management (OFM) from the Governor's Behavioral Health Innovation Fund relating to the state hospitals' forensic systems.
Passed legislature. Expires on July 1, 2019 per Section 14. Complete.
Section 5(2) requires OFM to contract with an external consultant to examine the current configuration and financing of the state hospital system and make recommendations on a number of different areas, including identification of the potential costs, benefits, and impacts associated with dividing one or both of the state hospitals into discrete hospitals to serve civil and forensic patients in separate facilities. The consultants’ report is due to the Governor and Legislature by Oct. 1, 2016.
Section 5(3) requires DSHS to contract for the services of an academic or independent state hospital psychiatric clinical care model consultant to examine the clinical role of staffing at the state hospitals. The consultants’
The Select Committee for Quality Improvement in State Hospitals met on October 30, 2017 and on December 15, 2017. During the December 15, 2017 meeting, the Department presented material on the three prosecutorial diversion programs currently being funded. Additionally, the Court Monitor provided an overview and update on the eight programs that received Trueblood Fine money for diversion services.
Complete meeting materials are available at: http://www.governor.wa.gov/issues/issues/health- care-human-services/select-committee-quality- improvement-instate-hospitals During the month of January, no hearings were scheduled.
FEBRUARY 2018 MONTHLY REPORT
25 | P a g e
Task Key Milestones Status / End Dates
Anticipated Outcome & Assumptions Results Achieved & Barriers to Completion
report is due to the Governor and Legislature by Oct. 1, 2016.
Section 6 creates the Governor's Behavioral Health Innovation Fund in the state treasury. Only the director of financial management or designee may authorize expenditures from that Fund, which are provided solely to improve quality of care, patient outcomes, patient and staff safety, and the efficiency of operations at the state hospitals.
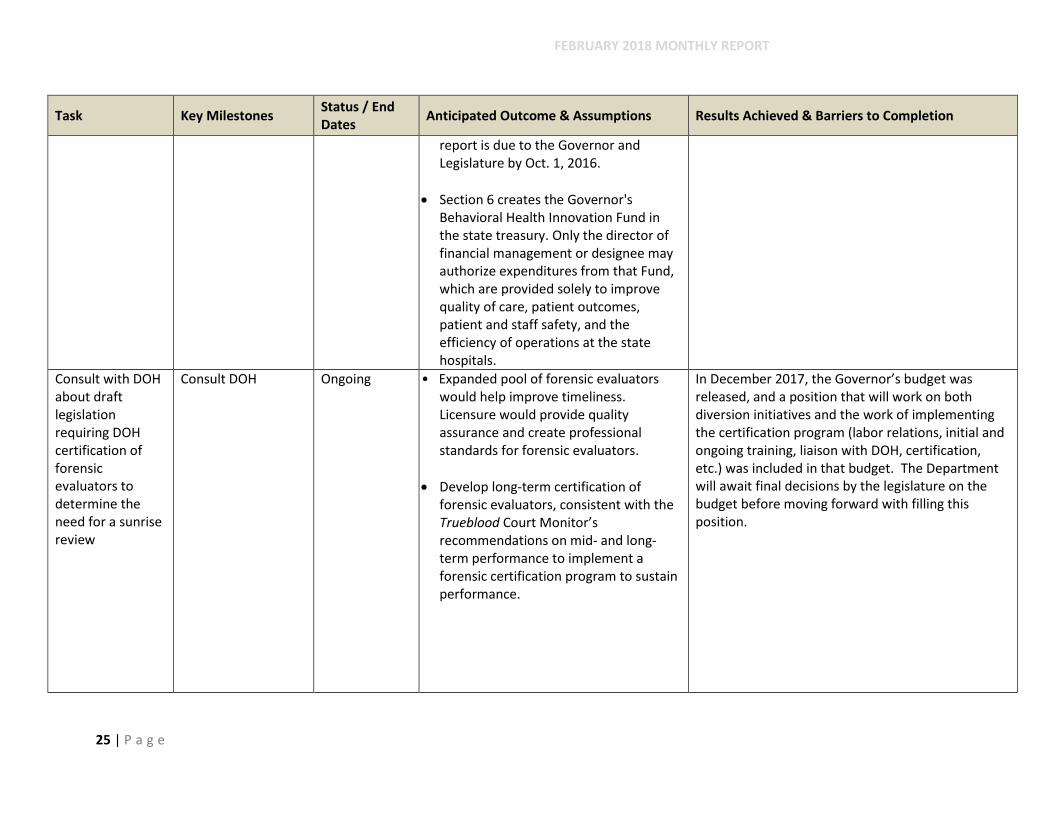
Consult with DOH about draft legislation requiring DOH certification of forensic evaluators to determine the need for a sunrise review
Consult DOH Ongoing • Expanded pool of forensic evaluators would help improve timeliness. Licensure would provide quality assurance and create professional standards for forensic evaluators.
Develop long-term certification of forensic evaluators, consistent with the Trueblood Court Monitor’s recommendations on mid- and long-term performance to implement a forensic certification program to sustain performance.
In December 2017, the Governor’s budget was released, and a position that will work on both diversion initiatives and the work of implementing the certification program (labor relations, initial and ongoing training, liaison with DOH, certification, etc.) was included in that budget. The Department will await final decisions by the legislature on the budget before moving forward with filling this position.
FEBRUARY 2018 MONTHLY REPORT
26 | P a g e
Task Key Milestones Status / End Dates
Anticipated Outcome & Assumptions Results Achieved & Barriers to Completion
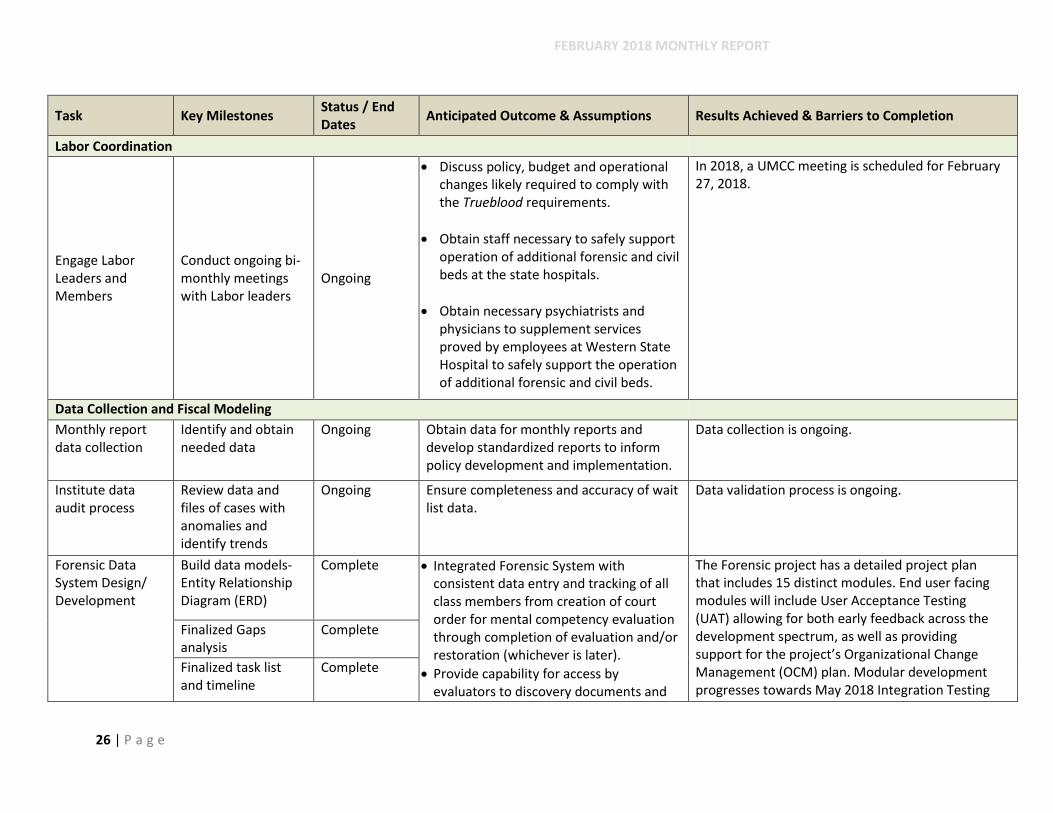
Labor Coordination
Engage Labor Leaders and Members
Conduct ongoing bi-monthly meetings with Labor leaders
Ongoing
Discuss policy, budget and operational changes likely required to comply with the Trueblood requirements.
Obtain staff necessary to safely support operation of additional forensic and civil beds at the state hospitals.
Obtain necessary psychiatrists and physicians to supplement services proved by employees at Western State Hospital to safely support the operation of additional forensic and civil beds.
In 2018, a UMCC meeting is scheduled for February 27, 2018.
Data Collection and Fiscal Modeling
Monthly report data collection
Identify and obtain needed data
Ongoing Obtain data for monthly reports and develop standardized reports to inform policy development and implementation.
Data collection is ongoing.
Institute data audit process
Review data and files of cases with anomalies and identify trends
Ongoing
Ensure completeness and accuracy of wait list data.
Data validation process is ongoing.
Forensic Data System Design/ Development
Build data models-Entity Relationship Diagram (ERD)
Complete Integrated Forensic System with consistent data entry and tracking of all class members from creation of court order for mental competency evaluation through completion of evaluation and/or restoration (whichever is later).
Provide capability for access by evaluators to discovery documents and
The Forensic project has a detailed project plan that includes 15 distinct modules. End user facing modules will include User Acceptance Testing (UAT) allowing for both early feedback across the development spectrum, as well as providing support for the project’s Organizational Change Management (OCM) plan. Modular development progresses towards May 2018 Integration Testing
Finalized Gaps analysis
Complete
Finalized task list and timeline
Complete

FEBRUARY 2018 MONTHLY REPORT
27 | P a g e
Task Key Milestones Status / End Dates
Anticipated Outcome & Assumptions Results Achieved & Barriers to Completion
Establish Project Governance
Complete any status changes, regardless of location, to reduce delays. Provide platform for quality reporting from single system, eliminating the variability currently inherent in leveraging legacy applications not meant for this purpose.
events and culminates with a July 2018 go-live. The progress this month is as follows:
Project Team has completed the Reporting Environment. Reports inventory is being prioritized for delivery.
Project Governance has approved the Data Migration Plan.
Data extracts from the current state have been created and the process documented.
Data load into the new system is in process and will be documented.
Analyze Legacy Applications Data Quality for potential data migration
In progress
Complete Technical Design for all Modules
May 2018
Complete training June 2018
Implement new system
July 2018
Human Resources
Hire Office of Forensic Services HQ positions
Hire and Onboard Complete Provide infrastructure for forensic services system and improve effective and timely provision of competency services.
In January 2018, no interviews were scheduled for the supervisor position. Applications were received for forensic evaluator staff and five interviews were scheduled in January. One offer was made and accepted for a forensic evaluator position during the month of January.
Hire additional hospital ward staff
Conduct targeted hiring events
In progress Obtain required staff of all classes to safely and appropriately operate additional civil and forensic beds and to meet data collection, analysis and reporting needs.
Recruitment efforts continue on the third System Improvement Agreement (SIA) at Western State Hospital. Final numbers of staff and data associated with placement is controlled by HR operations staff at WSH.
The Talent Acquisition staff at DSHS HQ continue to recruit for positions at WSH in support of the SIA project.
Recruitment for positions vacated by natural attrition at Maple Lane continues. Talent
Pursue contracting

FEBRUARY 2018 MONTHLY REPORT
28 | P a g e
Task Key Milestones Status / End Dates
Anticipated Outcome & Assumptions Results Achieved & Barriers to Completion
Acquisition are in charge of Residential Rehabilitation Counselor and Security Guard positions. Job announcements have been updated to reflect extension of the program into 2018 which should increase applicant interest.
Competency Evaluation
Build capacity for out-station sites
Site agreements N/A Increased capacity at out-station sites will reduce wait time for evaluation.
During the month of January, the outstation supervisor traveled to our outstation sites and met with our partners at Kitsap, Snohomish, and SCORE jails. All were very positive about our involvement at their facilities, and volunteered extra work space as we expand the number of evaluators at each site as well as telehealth equipment and space. At Snohomish, a process of the mental health team triaging cases for referral for either diversion or competency to stand trial evaluation is moving forward. The outstation supervisor will meet, in coming weeks, with partners in the legal and judicial community to put forward this effort. In Clark County, partners have agreed to include the outstation supervisor in their monthly network meetings around issues of diversion and restoration; the outstation supervisor will attend by telephone link.
Out-station sites operational
Completed
Coordinate with forensic mental health system partners
Regular meetings with County Stakeholders
Ongoing Stakeholder meetings will focus on topics where collaborative work is required to meet the requirements of the Trueblood Decision.
In January 2018 a committee made up of OFMHS staff, the AG’s office, the court monitor, and plaintiff’s attorneys met with bidders from Pierce, King, Clark, Yakima, and Benton-Franklin counties for the Trueblood Phase III grant. Each county has proposed plans for Intercept 1 and 5 diversion

FEBRUARY 2018 MONTHLY REPORT
29 | P a g e
Task Key Milestones Status / End Dates
Anticipated Outcome & Assumptions Results Achieved & Barriers to Completion
programs. Following the presentations, the committee had several follow-up questions and asked for clarification on matters such as the program budgets, number of class members served, and program staffing.
In the coming months the OFMHS Liaison/Diversion Specialist plans to meet with courts, defense attorneys, law enforcement, behavioral health providers, and other stakeholders to discuss gaps in services which may contribute to increased criminal justice involvement, and strategies for more effective collaboration.
Continue current county-conducted evaluation system until 2018
Establish quality criteria for evaluation reports
Ongoing Obtain data needed from counties in order to meet court ordered reporting requirements.
The Quality Assurance program for competency reports began November 1, 2017.
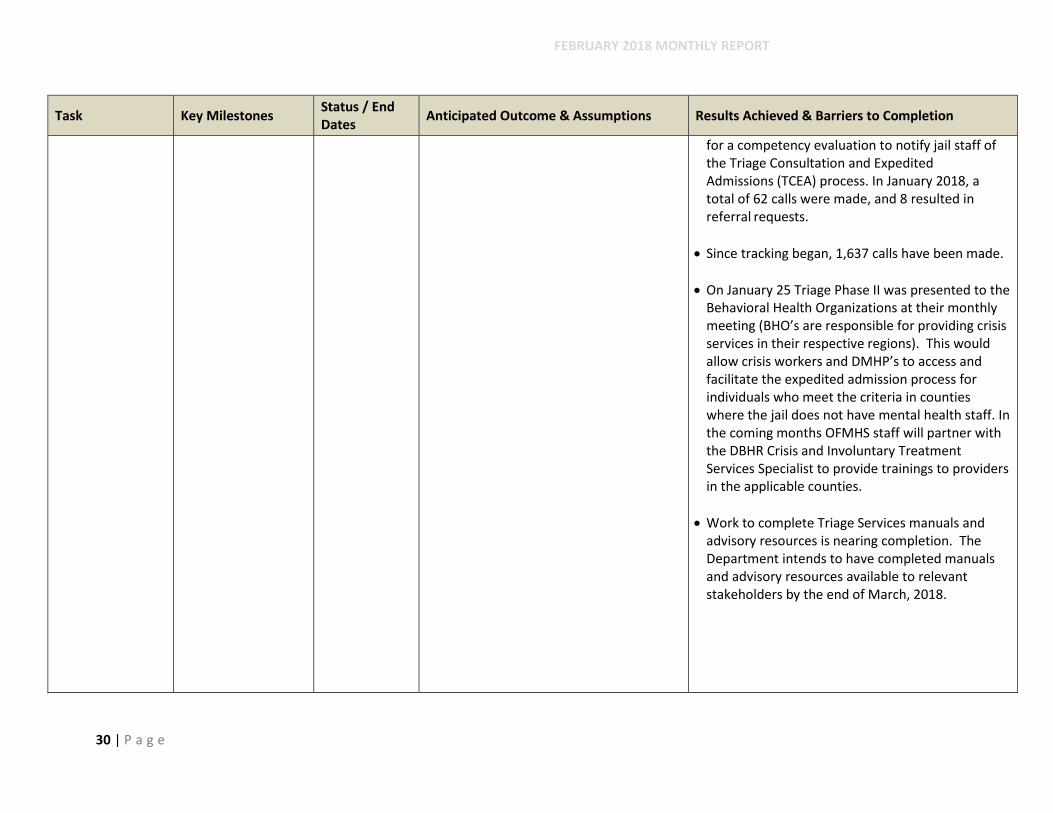
Explore and pursue triage system possibilities
Roll out Phase II In progress Establish an efficient evaluation to identify individuals who: need inpatient services due to serious mental health condition; clearly do not require inpatient evaluation services; or are clearly competent due to changes in their condition since the issuance of an order for evaluation (such as no longer drug affected).
As of January 31, 2018, OFMHS has received 170 triage referrals from jail staff/defense. Of those referrals, 117 were approved. 34 of the referrals were denied, and 19 of these referrals were withdrawn before placement could be made. Of the seven referrals approved for expedited admission in January 2018, all seven were admitted within four days of the initial request.
On November 2, 2016 OFMHS began calling jails holding in-custody defendants waiting 14 days
FEBRUARY 2018 MONTHLY REPORT
30 | P a g e
Task Key Milestones Status / End Dates
Anticipated Outcome & Assumptions Results Achieved & Barriers to Completion
for a competency evaluation to notify jail staff of the Triage Consultation and Expedited Admissions (TCEA) process. In January 2018, a total of 62 calls were made, and 8 resulted in referral requests.
Since tracking began, 1,637 calls have been made.
On January 25 Triage Phase II was presented to the Behavioral Health Organizations at their monthly meeting (BHO’s are responsible for providing crisis services in their respective regions). This would allow crisis workers and DMHP’s to access and facilitate the expedited admission process for individuals who meet the criteria in counties where the jail does not have mental health staff. In the coming months OFMHS staff will partner with the DBHR Crisis and Involuntary Treatment Services Specialist to provide trainings to providers in the applicable counties.
Work to complete Triage Services manuals and advisory resources is nearing completion. The Department intends to have completed manuals and advisory resources available to relevant stakeholders by the end of March, 2018.
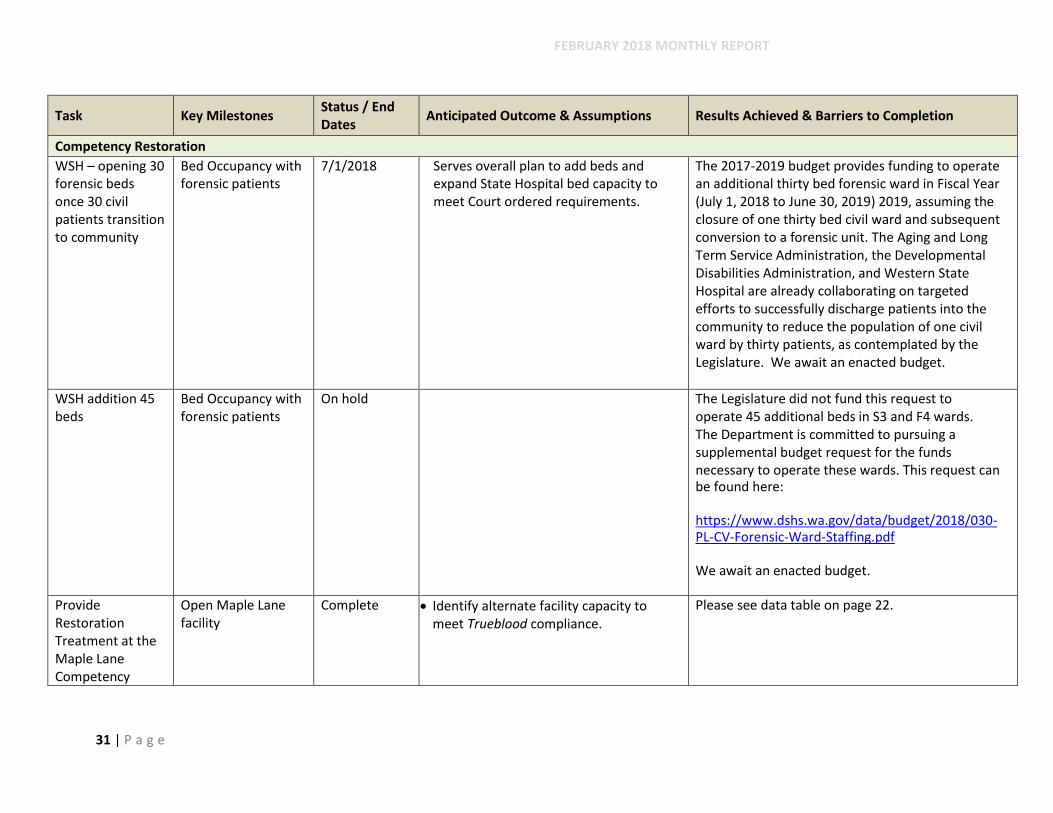
FEBRUARY 2018 MONTHLY REPORT
31 | P a g e
Task Key Milestones Status / End Dates
Anticipated Outcome & Assumptions Results Achieved & Barriers to Completion
Competency Restoration
WSH – opening 30 forensic beds once 30 civil patients transition to community
Bed Occupancy with forensic patients
7/1/2018 Serves overall plan to add beds and expand State Hospital bed capacity to meet Court ordered requirements.
The 2017-2019 budget provides funding to operate an additional thirty bed forensic ward in Fiscal Year (July 1, 2018 to June 30, 2019) 2019, assuming the closure of one thirty bed civil ward and subsequent conversion to a forensic unit. The Aging and Long Term Service Administration, the Developmental Disabilities Administration, and Western State Hospital are already collaborating on targeted efforts to successfully discharge patients into the community to reduce the population of one civil ward by thirty patients, as contemplated by the Legislature. We await an enacted budget.
WSH addition 45 beds
Bed Occupancy with forensic patients
On hold The Legislature did not fund this request to operate 45 additional beds in S3 and F4 wards. The Department is committed to pursuing a supplemental budget request for the funds necessary to operate these wards. This request can be found here: https://www.dshs.wa.gov/data/budget/2018/030-PL-CV-Forensic-Ward-Staffing.pdf We await an enacted budget.
Provide Restoration Treatment at the Maple Lane Competency
Open Maple Lane facility
Complete
Identify alternate facility capacity to meet Trueblood compliance.
Please see data table on page 22.
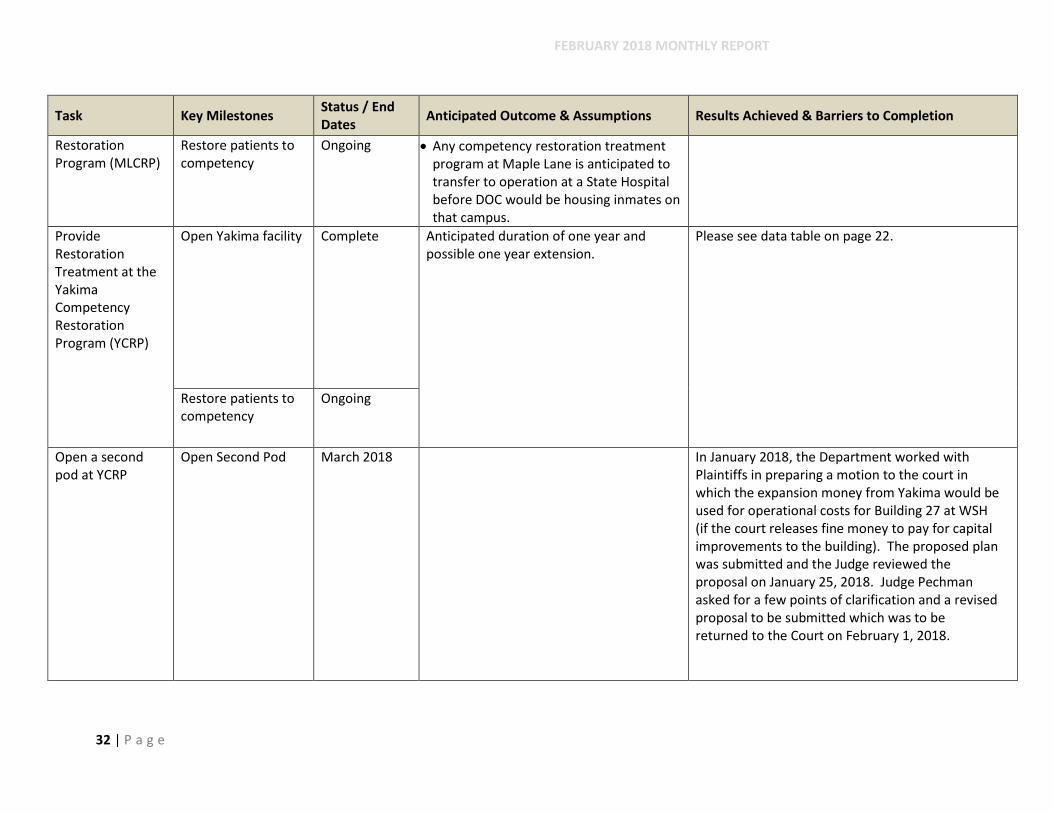
FEBRUARY 2018 MONTHLY REPORT
32 | P a g e
Task Key Milestones Status / End Dates
Anticipated Outcome & Assumptions Results Achieved & Barriers to Completion
Restoration Program (MLCRP)
Restore patients to competency
Ongoing Any competency restoration treatment program at Maple Lane is anticipated to transfer to operation at a State Hospital before DOC would be housing inmates on that campus.
Provide Restoration Treatment at the Yakima Competency Restoration Program (YCRP)
Open Yakima facility Complete Anticipated duration of one year and possible one year extension.
Please see data table on page 22.
Restore patients to competency
Ongoing
Open a second pod at YCRP
Open Second Pod March 2018 In January 2018, the Department worked with Plaintiffs in preparing a motion to the court in which the expansion money from Yakima would be used for operational costs for Building 27 at WSH (if the court releases fine money to pay for capital improvements to the building). The proposed plan was submitted and the Judge reviewed the proposal on January 25, 2018. Judge Pechman asked for a few points of clarification and a revised proposal to be submitted which was to be returned to the Court on February 1, 2018.
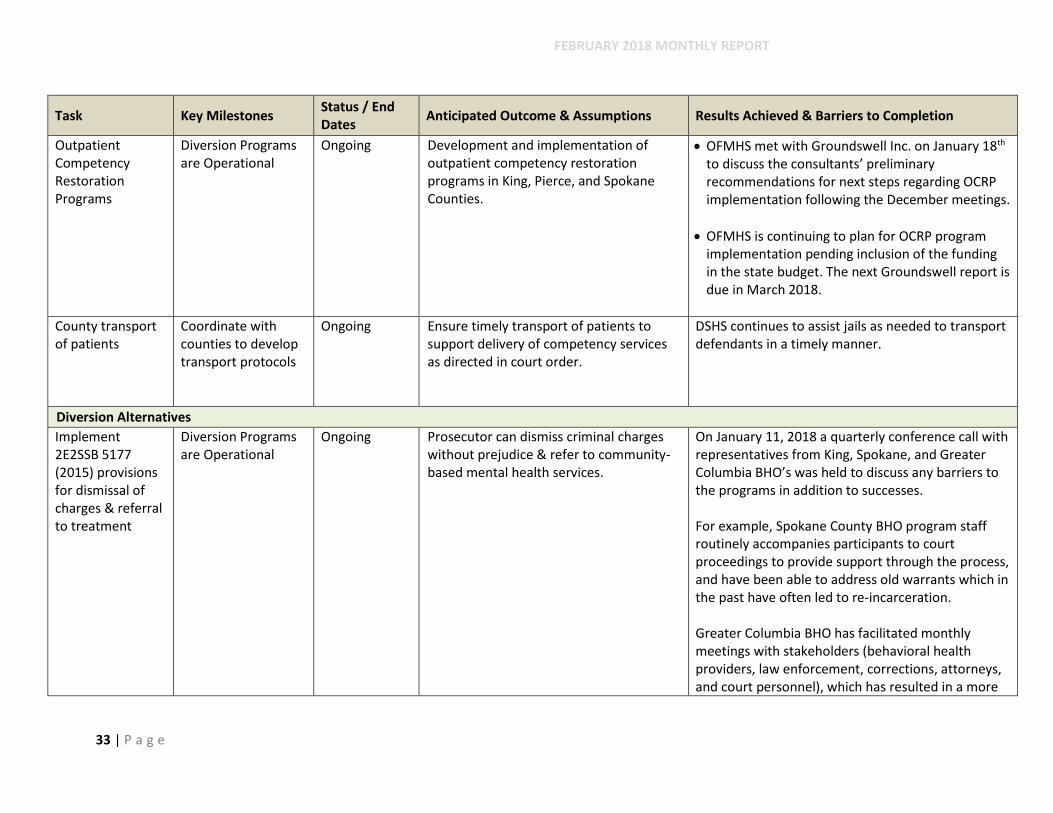
FEBRUARY 2018 MONTHLY REPORT
33 | P a g e
Task Key Milestones Status / End Dates
Anticipated Outcome & Assumptions Results Achieved & Barriers to Completion
Outpatient Competency Restoration Programs
Diversion Programs are Operational
Ongoing Development and implementation of outpatient competency restoration programs in King, Pierce, and Spokane Counties.
OFMHS met with Groundswell Inc. on January 18th to discuss the consultants’ preliminary recommendations for next steps regarding OCRP implementation following the December meetings.
OFMHS is continuing to plan for OCRP program implementation pending inclusion of the funding in the state budget. The next Groundswell report is due in March 2018.
County transport of patients
Coordinate with counties to develop transport protocols
Ongoing Ensure timely transport of patients to support delivery of competency services as directed in court order.
DSHS continues to assist jails as needed to transport defendants in a timely manner.
Diversion Alternatives
Implement 2E2SSB 5177 (2015) provisions for dismissal of charges & referral to treatment
Diversion Programs are Operational
Ongoing Prosecutor can dismiss criminal charges without prejudice & refer to community-based mental health services.
On January 11, 2018 a quarterly conference call with representatives from King, Spokane, and Greater Columbia BHO’s was held to discuss any barriers to the programs in addition to successes. For example, Spokane County BHO program staff routinely accompanies participants to court proceedings to provide support through the process, and have been able to address old warrants which in the past have often led to re-incarceration. Greater Columbia BHO has facilitated monthly meetings with stakeholders (behavioral health providers, law enforcement, corrections, attorneys, and court personnel), which has resulted in a more
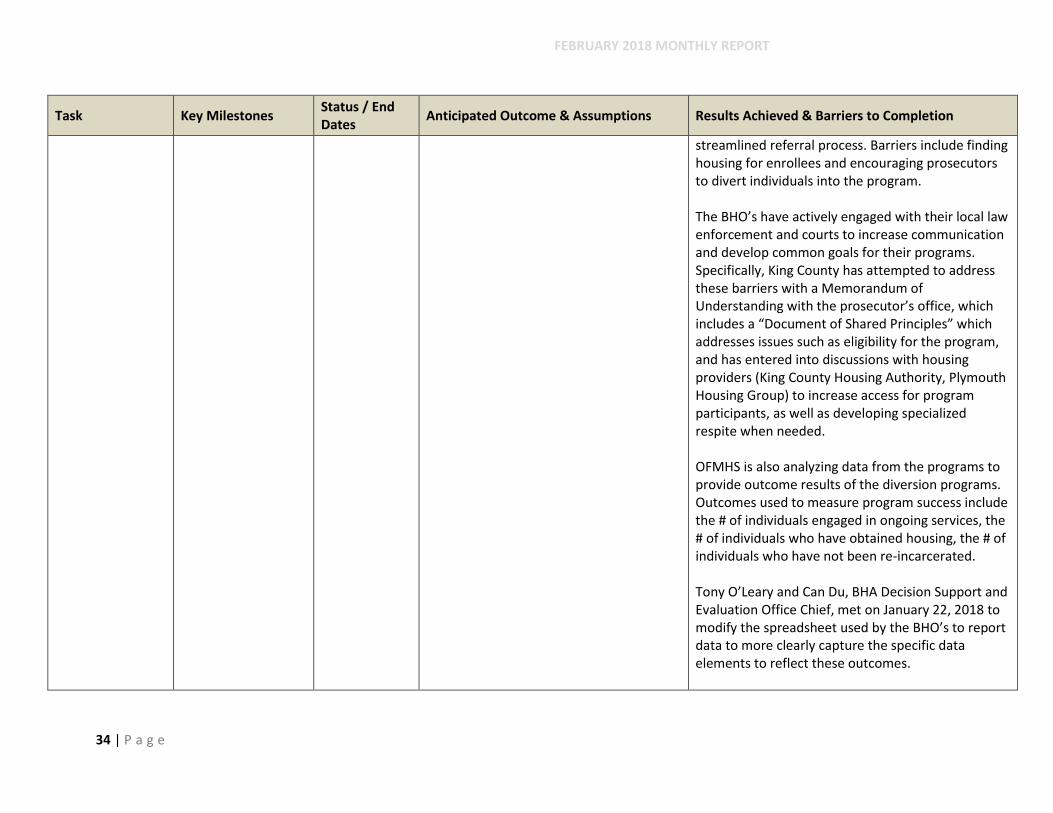
FEBRUARY 2018 MONTHLY REPORT
34 | P a g e
Task Key Milestones Status / End Dates
Anticipated Outcome & Assumptions Results Achieved & Barriers to Completion
streamlined referral process. Barriers include finding housing for enrollees and encouraging prosecutors to divert individuals into the program. The BHO’s have actively engaged with their local law enforcement and courts to increase communication and develop common goals for their programs. Specifically, King County has attempted to address these barriers with a Memorandum of Understanding with the prosecutor’s office, which includes a “Document of Shared Principles” which addresses issues such as eligibility for the program, and has entered into discussions with housing providers (King County Housing Authority, Plymouth Housing Group) to increase access for program participants, as well as developing specialized respite when needed. OFMHS is also analyzing data from the programs to provide outcome results of the diversion programs. Outcomes used to measure program success include the # of individuals engaged in ongoing services, the # of individuals who have obtained housing, the # of individuals who have not been re-incarcerated. Tony O’Leary and Can Du, BHA Decision Support and Evaluation Office Chief, met on January 22, 2018 to modify the spreadsheet used by the BHO’s to report data to more clearly capture the specific data elements to reflect these outcomes.

FEBRUARY 2018 MONTHLY REPORT
35 | P a g e
Task Key Milestones Status / End Dates
Anticipated Outcome & Assumptions Results Achieved & Barriers to Completion
OFMHS Liaison and Diversion Specialist will continue to monitor the programs and provide technical assistance as needed to address any barriers. Technical assistance offered to date includes defining contract terms, working to resolve legal issues with providing names of class members, and developing strategies on how to best work with prosecutors in increasing referrals. For example, it was recommended that the diversion programs work with prosecutors at the county rather than the district level to facilitate broader policy direction, as opposed to different protocols for each jurisdiction; and that each program report data using a common template so that all of the data elements are captured.
Increase diversion opportunities
Governor’s Office to contract with diversion consultant
In Process Hire a consultant to identify how best to divert persons with mental illness from the criminal justice system and identify appropriate funding mechanisms with appropriate stakeholders.
DSHS is participating in an HCA/DOC/DSHS Re- entry Workgroup to discuss reinstatement of Medicaid benefits for individuals transitioning from jail/prison to the community. The primary DSHS contact is the Offender Re-Entry Community Safety (ORCS) program administrator, and OFMHS will participate as appropriate.
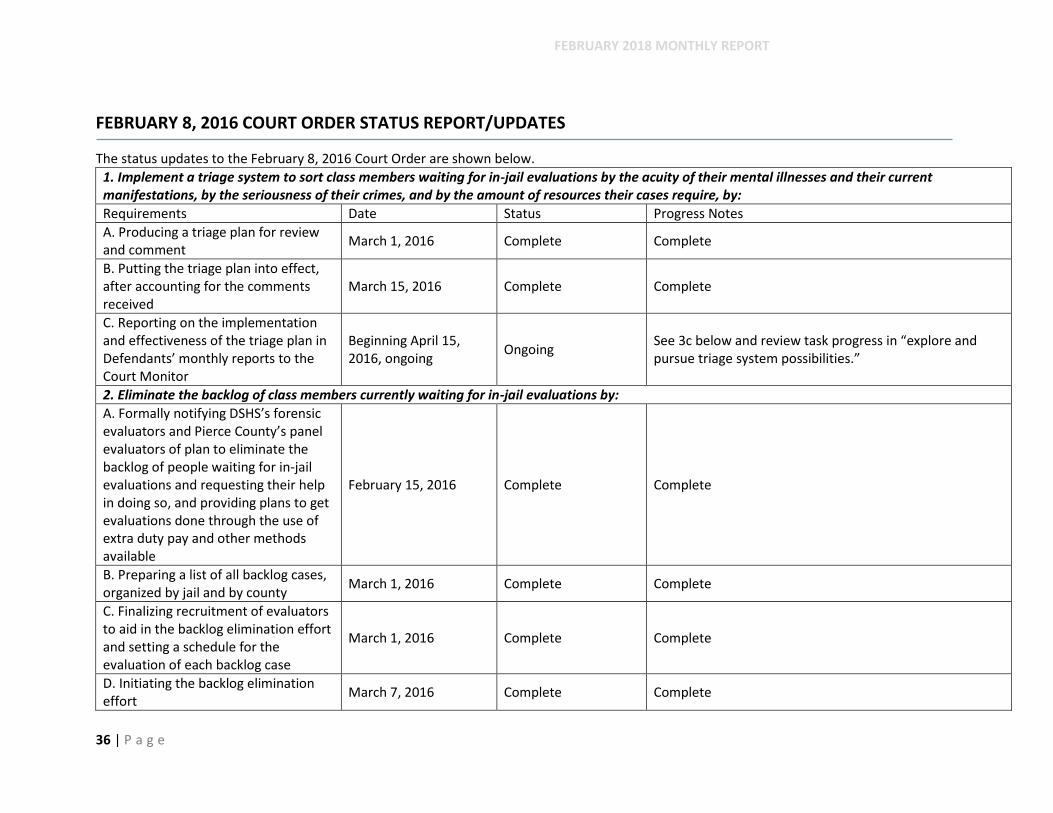
FEBRUARY 2018 MONTHLY REPORT
36 | P a g e
FEBRUARY 8, 2016 COURT ORDER STATUS REPORT/UPDATES
The status updates to the February 8, 2016 Court Order are shown below.
1. Implement a triage system to sort class members waiting for in-jail evaluations by the acuity of their mental illnesses and their current manifestations, by the seriousness of their crimes, and by the amount of resources their cases require, by:
Requirements Date Status Progress Notes
A. Producing a triage plan for review and comment
March 1, 2016 Complete Complete
B. Putting the triage plan into effect, after accounting for the comments received
March 15, 2016 Complete Complete
C. Reporting on the implementation and effectiveness of the triage plan in Defendants’ monthly reports to the Court Monitor
Beginning April 15, 2016, ongoing
Ongoing See 3c below and review task progress in “explore and pursue triage system possibilities.”
2. Eliminate the backlog of class members currently waiting for in-jail evaluations by:
A. Formally notifying DSHS’s forensic evaluators and Pierce County’s panel evaluators of plan to eliminate the backlog of people waiting for in-jail evaluations and requesting their help in doing so, and providing plans to get evaluations done through the use of extra duty pay and other methods available
February 15, 2016 Complete Complete
B. Preparing a list of all backlog cases, organized by jail and by county
March 1, 2016 Complete Complete
C. Finalizing recruitment of evaluators to aid in the backlog elimination effort and setting a schedule for the evaluation of each backlog case
March 1, 2016 Complete Complete
D. Initiating the backlog elimination effort
March 7, 2016 Complete Complete
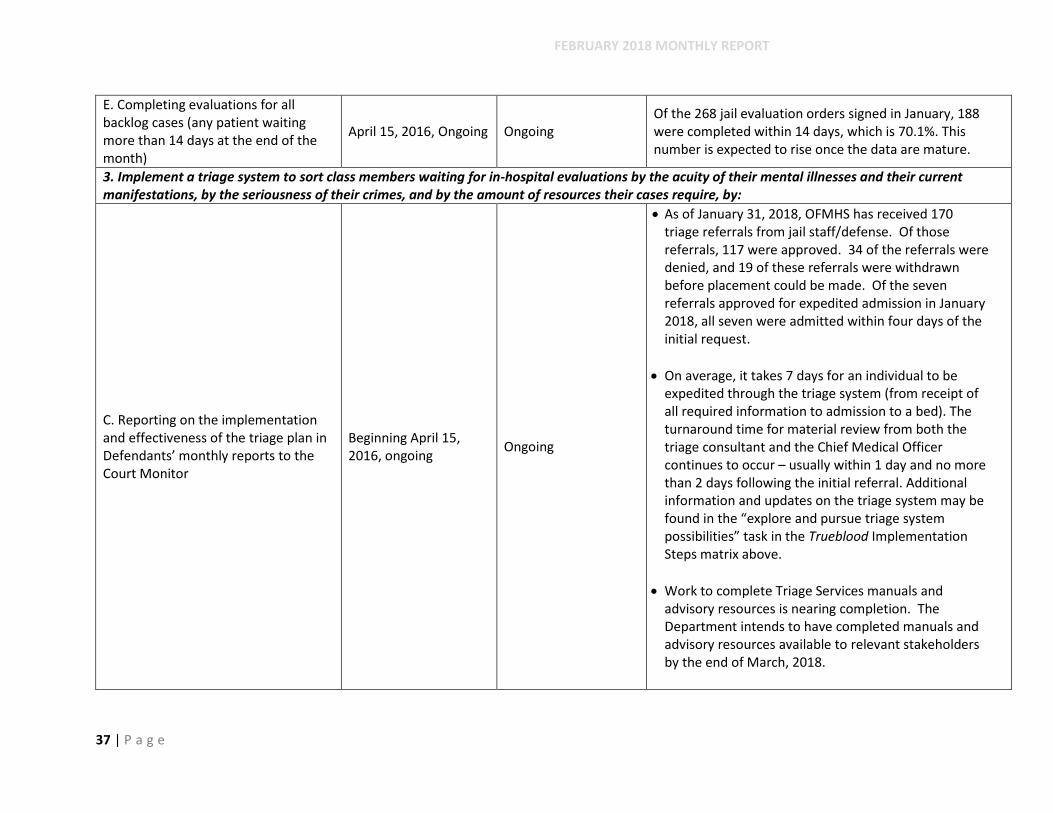
FEBRUARY 2018 MONTHLY REPORT
37 | P a g e
E. Completing evaluations for all backlog cases (any patient waiting more than 14 days at the end of the month)
April 15, 2016, Ongoing Ongoing Of the 268 jail evaluation orders signed in January, 188 were completed within 14 days, which is 70.1%. This number is expected to rise once the data are mature.
3. Implement a triage system to sort class members waiting for in-hospital evaluations by the acuity of their mental illnesses and their current manifestations, by the seriousness of their crimes, and by the amount of resources their cases require, by:
C. Reporting on the implementation and effectiveness of the triage plan in Defendants’ monthly reports to the Court Monitor
Beginning April 15, 2016, ongoing
Ongoing
As of January 31, 2018, OFMHS has received 170 triage referrals from jail staff/defense. Of those referrals, 117 were approved. 34 of the referrals were denied, and 19 of these referrals were withdrawn before placement could be made. Of the seven referrals approved for expedited admission in January 2018, all seven were admitted within four days of the initial request.
On average, it takes 7 days for an individual to be expedited through the triage system (from receipt of all required information to admission to a bed). The turnaround time for material review from both the triage consultant and the Chief Medical Officer continues to occur – usually within 1 day and no more than 2 days following the initial referral. Additional information and updates on the triage system may be found in the “explore and pursue triage system possibilities” task in the Trueblood Implementation Steps matrix above.
Work to complete Triage Services manuals and advisory resources is nearing completion. The Department intends to have completed manuals and advisory resources available to relevant stakeholders by the end of March, 2018.
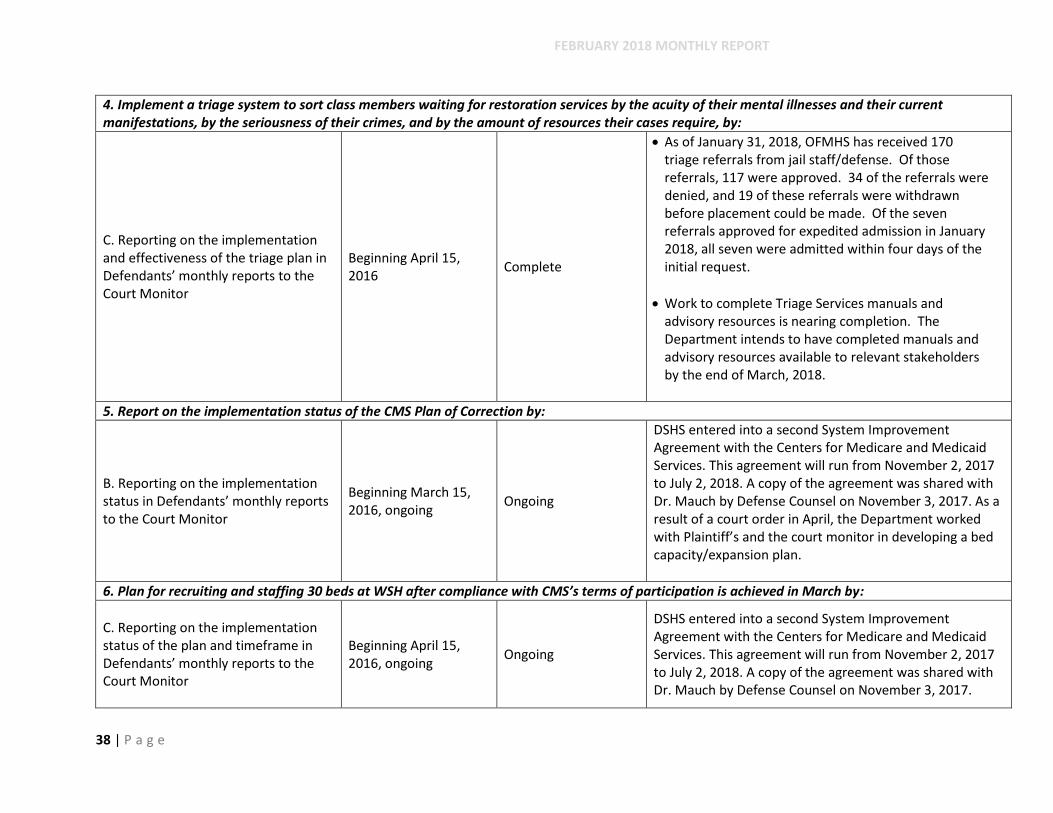
FEBRUARY 2018 MONTHLY REPORT
38 | P a g e
4. Implement a triage system to sort class members waiting for restoration services by the acuity of their mental illnesses and their current manifestations, by the seriousness of their crimes, and by the amount of resources their cases require, by:
C. Reporting on the implementation and effectiveness of the triage plan in Defendants’ monthly reports to the Court Monitor
Beginning April 15, 2016
Complete
As of January 31, 2018, OFMHS has received 170 triage referrals from jail staff/defense. Of those referrals, 117 were approved. 34 of the referrals were denied, and 19 of these referrals were withdrawn before placement could be made. Of the seven referrals approved for expedited admission in January 2018, all seven were admitted within four days of the initial request.
Work to complete Triage Services manuals and advisory resources is nearing completion. The Department intends to have completed manuals and advisory resources available to relevant stakeholders by the end of March, 2018.
5. Report on the implementation status of the CMS Plan of Correction by:
B. Reporting on the implementation status in Defendants’ monthly reports to the Court Monitor
Beginning March 15, 2016, ongoing
Ongoing
DSHS entered into a second System Improvement Agreement with the Centers for Medicare and Medicaid Services. This agreement will run from November 2, 2017 to July 2, 2018. A copy of the agreement was shared with Dr. Mauch by Defense Counsel on November 3, 2017. As a result of a court order in April, the Department worked with Plaintiff’s and the court monitor in developing a bed capacity/expansion plan.
6. Plan for recruiting and staffing 30 beds at WSH after compliance with CMS’s terms of participation is achieved in March by:
C. Reporting on the implementation status of the plan and timeframe in Defendants’ monthly reports to the Court Monitor
Beginning April 15, 2016, ongoing
Ongoing
DSHS entered into a second System Improvement Agreement with the Centers for Medicare and Medicaid Services. This agreement will run from November 2, 2017 to July 2, 2018. A copy of the agreement was shared with Dr. Mauch by Defense Counsel on November 3, 2017.

FEBRUARY 2018 MONTHLY REPORT
39 | P a g e
8. Remove barriers to the expenditure of the $4.8 million in currently allocated diversion funds by:
D. Executing contracts for implementation by the selected providers
April 15, 2016 Complete Prosecutorial diversion was funded for fiscal year 2018.
10. Develop a reliable and valid client-level data system to support better management and accountability of the forensic services system by:
E. Implementing revisions to the existing system or initiating development of a new forensic data and management information system
To initiate new system development efforts-May 27, 2016
Ongoing development and project underway.
Project Team has completed the Reporting Environment. Reports inventory is being prioritized for delivery.
Project Governance has approved the Data Migration Plan.
Data extracts from the current state have been created and the process documented.
Data load into the new system is in process and will be documented.

FEBRUARY 2018 MONTHLY REPORT
40 | P a g e
JULY 7, 2016 CONTEMPT ORDER STATUS UPDATES
The three status updates required in the July 7, 2016 Court Order are below. 1. Monetary sanctions – fines are imposed on a per class member, per day basis. On the 15th of every
month, DSHS is required to submit contempt fines data to the court. These data will be submitted to the court on August 15, 2016 and will be included in this report when finalized as Appendix M.
2. Diversion plans – DSHS is ordered to develop, in consultation with the Court Monitor, plans for the expenditure of the contempt fines.
3. Wait time data – DSHS shall submit to the Court wait time data in a manner identical to the data submitted on June 17, 2016 in the declaration of Bryan Zolnikov. These data are included in this report in Table 4.
AUGUST 15, 2016 ORDER MODIFYING PERMANENT INJUCTION AS TO IN JAIL COMPETENCY EVALUATIONS
Pursuant to the August 15, 2016 court order, DSHS must provide in-jail competency evaluations within 14 days of a signed court order. When an in-jail evaluation cannot be completed within 14 days and good cause applies (i.e., delay due to clinical reasons, attorney, interpreter, or defense expert), an extension from the ordering court must be secured or DSHS must immediately admit the individual to a state hospital to finish conducting the evaluation. In order to comply with the reporting requirements of the Court’s order, DSHS identified a need to revise both the current process used for seeking extensions from the criminal court, as well as the data collected during that process. Since the August 15th court order, DSHS identified a series of necessary changes that will enable DSHS to comply with the order, to include the following:
1. Develop a list of data elements needed to comply with the court order to include additional delay data;
2. Develop a data dictionary to define the data elements needed; 3. Develop a process of reporting the information to the courts for the exception requests; 4. Identify the cutoff date for seeking an exception; 5. Develop a standardized form that can be used for seeking good cause exceptions; 6. Develop an operating procedure to guide evaluators through the new good cause process; 7. Coordinate with the Attorney General’s Office to ensure adequate representation; 8. Develop a process for collecting the data to report to the courts for the exceptions and to
maintain for monthly reporting; 9. Develop a model for the delays and the data pertaining to the delays; 10. Modify the current IT systems or develop a new database in which to maintain the information
once all above steps are completed.
To date, DSHS has completed identification of the data elements, developed a process for the evaluators
to collect the data that will be entered and reported to the courts, and developed the data dictionary. The
process of reporting the information to the courts and identifying a cutoff date for seeking an extension,
and the standardized forms, operating procedure, and coordination for Assistant Attorney General (AAG)
representation have been completed. Interim steps for maintaining the data for monthly reporting were
identified and implemented while the current IT system is modified.

FEBRUARY 2018 MONTHLY REPORT
41 | P a g e
Through use of the interim solution, DSHS is collecting data on use of the good cause exception. The data
required to be reported can be found in Appendix N in the final report. The IT system has been modified
to include fields for data on the use of the good cause data exception and is currently going through
testing. The Forensic Advisory Committee (FAC) is a regularly scheduled (twice a month) committee that
provides business process clarification / recommendations to the technical team as the system is being
built. FAC is a recurring meeting that is meeting with regularity.

FEBRUARY 2018 MONTHLY REPORT
42 | P a g e
APPENDICES
Appendices A – G: This file is submitted with the DRAFT report and includes mature data tables for December, 2017 as well as outliers and order received data. Appendices H – L: This file is submitted with the DRAFT report and includes first look data tables for January, 2018. Appendix M: Calculation of Inpatient Contempt Fines This file is submitted with the FINAL report. Appendix N: Calculation of Jail-Based Contempt Fines This file is submitted with the FINAL report. Appendix O: Good Cause Exceptions This file is submitted with the FINAL report.