cash, paper-based and electronic payments: a...
TRANSCRIPT
Cash, Paper-based and Electronic Payments: A TheoreticalApproach�
Francisco Calladoy, Jana Hromcováz and Natalia Utrero
Abstract
In this paper we provide a general equilibrium model that helps explaining payment choiceat the retail level: cash, electronic and paper-based instruments. In particular, it providestheoretical foundations to reconcile previous empirical evidence on the matter. Payment patternof a given country can be shaped by the payment infrastructure, the cost of each paymentinstrument, the degree of technology development and the interest rate. We show that theintroduction of a cheaper payment instrument, in this case electronic payments, may be welfareimproving. The calibration exercise for Norway illustrates that the policy of correct pricingof checks promoted by the Norwegian authorities may imply 4% increase in the welfare of thecountry.
Keywords: cash; payments; human capital; cash-in-advance;JEL classi�cation: E42, E41, O42
�This paper has bene�ted from suggestions and comments from Rolf Campos, participants in the Finance Forumin Madrid, Symposium of the Spanish Economic Association in Valencia and the seminar at Universidad de Mur-cia. Financial support from the Spanish Ministry of Education and Science through grants SEJ2007-60671/ECON,SEJ2007-62500, SEJ2007-67895-C04-02, Generalitat de Catalunya through the Barcelona GSE research network andInstituto Valenciano de Investigaciones Económicas are gratefully acknowledged.
yUniversitat de Girona, Departament d�Economia i Empresa, Campus de Montilivi, 17071 Girona, Spain; Tel: +3497 241 9883; Fax: +34 97 241 8032; [email protected].
zCorresponding author. Universitat Autònoma de Barcelona, Departament d�Economia Aplicada, Edi�ci B, 08193Bellaterra, Barcelona, Spain; Tel: +34-93 581 4579; Fax: +34-93 581 22 92; [email protected]
1

1 Introduction
There is a large empirical literature on payment systems, yet few theoretical papers analyze paymentinstrument choice. This paper develops a model to analyze the dynamics of the payment instrumentschoice, in particular the behavior of cash, paper-based and electronic payments. The variables thatcan explain di¤erences between countries are the payment infrastructure, relative cost of the availablepayment instruments, degree of technology development and monetary policy.The way in which payments are made in a given country happens to be a relevant issue at least
in two respects. On one side, the cost of the complete payment system, that could account up to 3%of GDP, Humphrey, Pulley and Vesala (1996 and 2000), is clearly a¤ected by agents�choice sincethe cost of each payment instrument di¤ers.1 On the other hand, payment choice could in�uence thefunctioning of the �nancial system and therefore facilitate trade in the real economy.2 In fact thesedecisions could have important economic consequences since a relevant part of the GDP (around2/3 in the US) comes from consumer transactions and these are completed with some method ofpayment, Schreft (2006).The continuos evolution of information technology (IT) has led to a signi�cant transformation of
payments industry, Evans and Schmalensse (2009). However, the development of new payment in-struments does not imply the elimination of traditional paper-based methods. Consumers ultimatelydetermine which of these instruments they actually use. Moreover, once consumers and merchantsget comfortable with a particular technology, they need a compelling reason to switch to another.First of all, for a new method of payment to be successful, it must attract substantial number ofusers, o¤er signi�cant cost savings or added convenience relative to existing payments technologiesor methods. Second, whatever its cost or convenience, a payment system must be trustworthy andsecure, or people will not use it, Litan and Baily (2009). National regulations can provide comfort tousers and thereby, accelerate the acceptance of a particular payment instrument. Therefore, there isa case for active public policy with regard to payment system design and security, Stojanovic (2001).The distribution and evolution of payment instruments use is usually very di¤erent across coun-
tries, even within developed countries, see Callado and Utrero (2004). There is a growing body ofempirical literature focusing on the characteristics of this distribution and analyzing the possibledeterminants of these di¤erences. Starting with Humphrey et al. (1996) who examine the paymentsystems of 14 developed countries and �nd that the use of electronic means of payment is clearlyincreasing in all countries. Besides, they try to explain the possible factors behind the di¤erentstructures across countries. Among these they �nd as the most important the degree of paymentavailability (number of users, terminals, etc.) and institutional and cultural di¤erences (income,new payment instruments, etc.). Similarly, Callado and Utrero (2007) analyze the case of Europeanemerging economies and �nd that the use of cash, although reducing, is still persistent. Hancock andHumphrey (1998) provide evidence of how electronic means of payment (credit and debit cards) gainimportance with respect to checks and cash in many developed countries between 1987 and 1993. InFigure 1 we show similar behavior in the data in more recent period, between 1996 and 20013.
1Humphrey et al. (1996) claim that the cost of electronic payments ranges from 1/2 to 1/3 to that of paper-basedones. Estimates set this proportion equal to 28.77% in Norway (bank cost) for 1994 and 44.71% (total cost) in theUS for 1993, Humphrey, Kim and Vale (2001).
2Stojanovic (2001) argues that the adoption of new payment instruments, and e-money in particular, contributesto cash substitution and the development of more e¢ cient payment and banking systems.
3Data on payment systems comes from Norges Bank, Bank of International Settlements and European CentralBank.
2

Figure 1: Transformation of the payment methods in some European countries and the US between 1996and 2001.
An interesting �nding is that the payment choice behavior of consumers in the US is a bit di¤erentthan that of the rest of developed countries. Although cash use is small, the relevance of electronicpayments is clearly lower.4 Humphrey (2004) deepens the analysis of the US by analyzing thesubstitution of cash by cards. Data presented in his study again show how the relative importanceof electronic means of payments (credit and debit cards) increases over time.Humphrey et al. (2001) include price in trying to explain di¤erent consumer choices observed.
Using data from Norway, they �nd empirical evidence that technology development and relativeprices, together with the relationship between cost and technology, could have a word to say inexplaining these di¤erences. Accordingly, although not empirically analyzed, di¤erences in technologyadoption and di¤usion may a¤ect consumer choices as well.Despite the relevance of payment systems and the empirical interest on the matter, there is a
lack of theoretical literature concerning wider choice of payment instruments, see Schreft (2006) forexample.5 There is a need to develop sound theoretical foundations for consumer decision makingin order to better analyze their payment choice behavior, Crowe, Schuh and Stavins (2006). Thispaper tries to �ll this gap by focusing on how and why consumers choose which payment instrument
4High usage of paper-based payments in the US may be rooted in the fact that checks were generally accepted andused as a default payment method since the 16th century, see the historical survey in Quinn and Roberds (2008).
5Many theoretical models which consider two payment instruments were developed. For example, Schreft (1992),Gillman (1993), Aiagari, Braun and Eckstain (1998) show that the choice between cash and a payment via intermediarydepends on the mix of the cost of the alternative mean of payment and the monetary policy. Ireland (1994a) pointsout that the decrease in the use of cash and its substitution by cards is caused by an increase in income. Markose andLoke (2003) show that this substitution is also due to the availability of payment terminals at the point of sale. Ireland(1994b), Marquis and Re¤ett (1994), English (1999) and Hromcová (2008) relate the choice of payment instrumentsalso to the technological progress.
3

they use. We let our consumers use cash, paper-based or electronic payments. The main pointis that a consumer facing a decision on the mean of payment will take into account the relativecost of each instrument. We adapt for our purpose the model of Hromcová (2008). In this model,technology improvement happens via accumulation of human capital through studying and the costof each payment instrument depends on the place and time of the transaction. We consider thata necessary infrastructure for electronic payments is available before it is actually used. However,electronic transactions do not emerge until the economy is ready to use them (apart from beingtrustworthy they must be cheap enough). We study how a monetary policy or an authority�s actionthat favors some of the available means of payments alters agents payment instrument choice andwelfare. The model is calibrated using data from the US and Norway economies between 1991 and2007. We compare the dynamics of the payment choice in the model and the data for both countries.The model can generate very similar behavior to the one found in the data and explain changesin the payment behavior due to variations in the payment infrastructure, relative cost of paymentinstruments, degree of technology development and monetary policy.We evaluate welfare e¤ects of changes in various factors that in�uence the choice of the payment
methods. We �nd that a policy which promotes the usage of electronic instruments may lead toimportant welfare gains. For the case of Norway we obtain that by pursuing a policy of direct pricingof checks according to their costs about 4% increase in the stream of consumption can be achieved.A recommendation implied by our results is to price payment instruments based on their costs, sothat cheap instruments are chosen and resources are allocated more e¢ ciently.The remainder of the paper is organized as follows. In section 2 we use data of payment patterns
of US and Norway to illustrate di¤erences in the recent evolution of the payment instrument choice.The model and its main properties are stated in section 3. In section 4 we describe the balancedgrowth path behavior. In section 5 we discuss the behavior in the transition and the reaction of theeconomy to changes in di¤erent parameters. Welfare e¤ects of earlier or later arrival of the electronicera are studied in section 6. Final conclusions are summarized in section 7.
2 Payment Patterns in the US and Norway
The main point of our model is that the relative cost of alternative means of payment is of relevance tomake payments decisions, and therefore could a¤ect a country�s economic outcome. Pricing paymentservices along their true cost would make consumers choose the most e¢ cient payment instrument.However, traditionally, consumers do not face directly payment costs, making their decisions on lostinterest on transaction balances. Interestingly, some countries have started to directly price paymentinstruments according to their costs. This is the case of Norway. This pricing policy makes veryappealing the use of Norwegian data for our analysis. Figure 2 shows the evolution of prices ofalternative payment instruments in Norway between 1991 and 2007.
4

Figure 2: Prices in NOK for payment transactions and cash withdrawals. Weighted averages for all banks.
Following the changes in Norwegian pricing policy in 1995, checks have increased their relativecost from three times to nearly �ve times more than the second more expensive instrument, cash.Accordingly, this pricing policy have impacted consumers�behavior very rapidly, consumers havereduced their use of checks. Norway switched radically from checks and cash towards electronicpayments, mostly after 1995. The growth in the relative usage of electronic payments is very high.In 17 years Norway transformed from an economy that practically did not use electronic paymentsat all to a one where electronic transactions represent 75% of all payments, see Figure 3.The case of the US is also interesting but for di¤erent reasons. Data on prices are lacking but
as stated above, the distribution of payment instruments is slightly di¤erent from other developedcountries. The relative usage of checks employed in the US presents a slightly negative trend althoughremains quite stable until 2001. Later on the decrease is faster. Despite of this decrease, the use ofchecks in the US is still relevant for the US economy since the US checking system is �even withthe recent Check 21 Act modi�cation �the oldest, the slowest, the most expensive and easily themost complex of the payment devices in use, Felsenfeld and Bilali (2005).6 The usage of electronicpayments exhibits a steady increase except between 2001-2003. Cash share decreases steadily until2001 when a slight increase in its relative usage is observed. An interesting insight of the comparisonbetween Norway and the US is that Norwegian usage of electronic payment instruments quicklysurpasses that of the US, even if in 1991 it lagged far behind. As for checks, after 17 years Norwaypractically does not use any paper-based payments while in the US checks remain one of the mostimportant means of payments. One possible explanation is the direct pricing of checks in Norwayand the neglecting of pricing according to their true cost in the US. Therefore, the introduction ofcosts and prices is crucial for the analysis and can explain recent payment trends.
6For instance, in 1993 an electronic payment (ACH) had a cost $1.31, which is only 45% of the $2.93 total expensefor an analogous paper-based payment (check) in the US, Wells (1996). For Norway, in 1994 the average bank cost ofa check payment was $2.15, 3.4 times greater than the $0.69 for cards, Humphrey et. al. (2001).
5

Figure 3: Evolution of the share of cash, checks and cards (credit and debit) in consumer payments in theUSA and Norway for the interval 1991-2007.
3 Model
3.1 The household problem
We follow closely the speci�cation of the economy in Hromcová (2008). The economy consists of alarge number of in�nitely lived households. All households have identical preferences, productionand trade opportunities.Households inhabit the following environment: they face continuum of spatially separated mar-
kets, which are indexed by i 2 [0; 1]. All households live in market 0, and the index i indicatesthe distance from home. In each market i a distinct perishable good is produced and sold in everyperiod. Goods are thus indexed by i; which corresponds to the market of both production and trade.The economy has a representative household with preferences given by the utility function
1Xt=1
�tZ 1
0
ct(i)1�� � 11� � di (1)
where ct(i) is de�ned as the consumption at period t of the good produced in market i and � > 0 isthe inverse of the elasticity of intertemporal substitution. The production and trade is like in Lucasand Stokey (1983). Each household is composed of a worker-shopper pair.Prior to any trading, government �xes the gross nominal interest rate R to be constant in all
periods. We will assume that R � 1. Agents enter the period t with certain amount of monetarybalances Mt and debt Bt; carried over from the previous period, and human capital stock ht. Arepresentative worker decides to produce on any of the markets i via the net production function
yt = whtlt (2)
6

where w denotes the marginal product of human capital in goods production, and lt is the amount oftime spent working. Human capital accumulation depends on the time spent studying, on the levelof human capital and on the depreciation rate according to
ht+1 = � (1� lt)ht + (1� �)ht (3)
where � is the e¢ ciency of learning parameter and � is the depreciation rate.First, the goods market opens and consumption takes place. Worker stays at the market i during
the whole period. Shopper visits various markets to acquire consumption goods carrying all themonetary balances of the household.To acquire consumption goods agents can use government issued money or alternative means of
payment. When using non-cash payments, they can choose from paper-based or electronic instru-ments. All goods purchased with government issued money will be referred to as cash goods. Goodspurchased via paper-based payments will be referred to as paper-based goods and goods purchasedvia electronic payments will be referred to as electronic goods. Goods only di¤er in the way they areacquired.Nominal monetary balances Mt can be used to buy goods in some of the markets indexed by i.
Cash purchases are subject to the liquidity constraintZ 1
0
[1� �t(i)] ct(i)di �Mt
pt; (4)
where pt is the level of prices and �t(i) = 0 if a good is purchased on market i with cash, or �t(i) = 1if a good is purchased on market i via a non-cash payment. The �nancial intermediary enablespaper-based and electronic payments at a cost that is given for each market i and period t.After the consumption takes place, the monetary holdings of agents are augmented by a lump
sum transfer Xt from the government. The amount Xt is endogenously determined in the systemaccording to the given nominal interest rate, so that the money demand is totally satis�ed. Asthe next step the securities market opens. During the securities trading session households choosetheir currency holdings Mt+1: They also purchase (or issue) one-period nominally denominated pure
discount bonds paying Bt+1 units of money at period t + 1 while they costBt+1R
units of money at
period t: Bonds are in zero net supply. The budget constraint agents are facing can be writtenZ 1
0
ct(i)di+
Z 1
0
�t(i)��t(i)
't (i) + [1� �t(i)] et(i)
di+ (5)
Mt+1
pt+Bt+1Rpt
� whtlt +Mt
pt+Btpt+Xt
pt:
where �t(i) = 1 for a non-cash purchase at market i, �t(i) = 0 if the good is purchased on market ivia an electronic payment and �t(i) = 1 if the good is bought using a paper-based private security.The real cost of the non-cash transaction at time t on market i is 't (i) and
et(i) for paper-based
and electronic payments, respectively.
7

3.2 Cost of alternative means of payments
As stated above, the relative cost of alternative means of payment could be of relevance to a country�seconomic outcome. Pricing payment services according to their cost would make consumers choosethe lowest cost payment instrument. This has not been the case, consumers traditionally pay theirpayment services through lost interest on transaction balances although there are few exceptionswith appealing results like Norway. In this model we will follow this option and assume that theintermediation cost must be paid by the buyer, Ireland (1994b). This allows us to evaluate di¤erente¤ects of alternative pricing policies found across countries and to link the characteristics of theeconomy and the �nancial system to consumer payments�decision making.The existence of this intermediation cost comes from the fact that, to be able to purchase without
cash, some resources must be devoted to making the non-cash payment itself available and reliable,to checking the identity of the buyer and his ability to pay. This cost is going to be proportionalto the distance to home market and to the value of purchase. When the shopper is far away fromhome (market zero) the communication becomes more di¢ cult, and therefore the payment to theintermediary increases with i.7
Besides, higher purchase means that more importance will be given to checking the ability ofthe buyer to pay and again the cost would be greater. In fact, banking infrastructure and valueof transaction have been identi�ed as relevant variables for the choice of the type of instrument,Humphrey et al. (1996), Humphrey et al. (2001), Callado and Utrero (2004). Technology andeconomic development are also important issues in this choice.The real payment made to the intermediary is characterized by a function that ful�lls these
and other properties found in some empirical studies, see Hromcová (2008): the intermediation costis lower in richer countries, the cost of intermediated payment diminishes over time, and the costelasticity is close to zero (which also motivates the proportional intermediation cost). The processof human capital accumulation gives a potential for the development of new technologies. Thisdevelopment will decrease the processing cost of both paper-based and electronic payments.We specify the intermediation costs for electronic and paper-based payments in the following way
et (i) = [ (i) + F ]1
(ht)�e ct(i); (6)
't (i) = (i)1
(ht)�' ct(i): (7)
Both paper-based and electronic payments have a time independent cost (i) that is increasing withthe distance from home, similarly as in Gillman (1993), Ireland (1994a) or Hromcová (2003), forexample. That is, payment availability and reliability will decrease with distance and this is similarboth in paper and electronic payments. For the sake of tractability we assign it the functional formused previously in the literature, introduced in Ireland (1994a)
(i) =i
1� i : (8)
The �xed cost F is market and time independent and it is attributed to the necessary investmentfor a system to be capable of operating the electronic transactions. We can think of di¤erent aspects
7In similar terms, the US Monetary Control Act of 1980 explains the need to develop a nationwide payment servicesfor all depository institutions on grounds of size and location: services should include smaller institutions in remotelocations, where volumes are typically low and costs are high, Chakravorti et al. (2005).
8
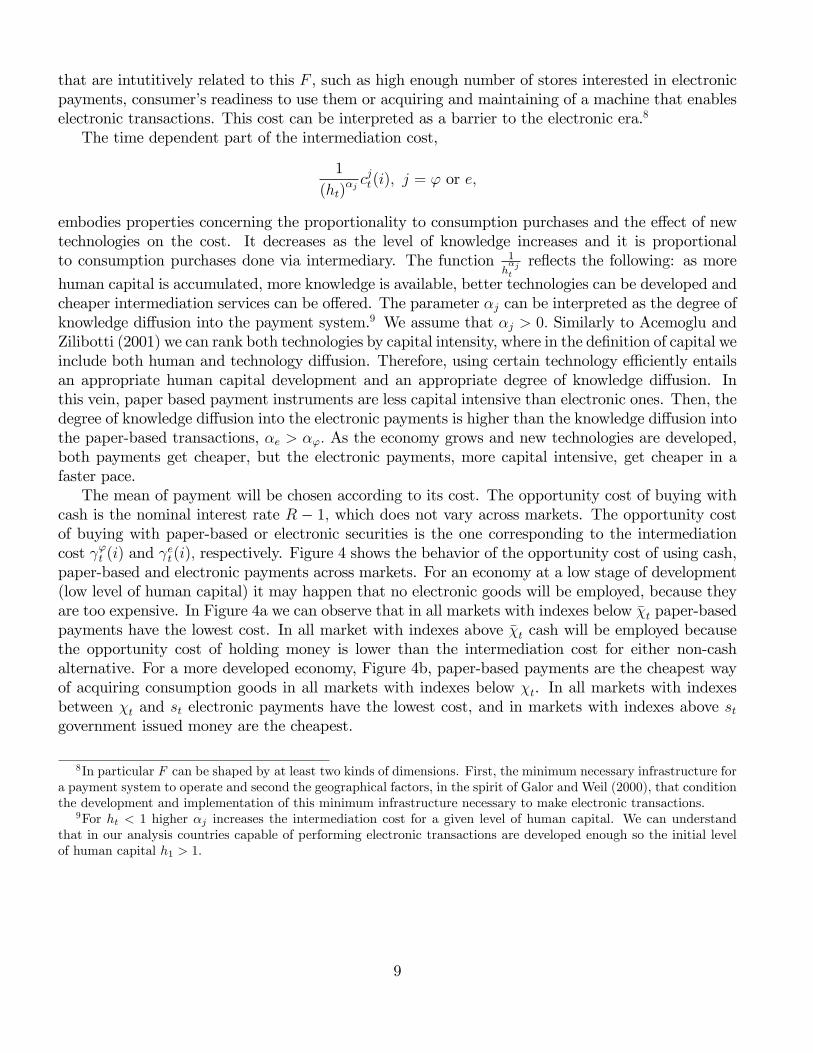
that are intutitively related to this F , such as high enough number of stores interested in electronicpayments, consumer�s readiness to use them or acquiring and maintaining of a machine that enableselectronic transactions. This cost can be interpreted as a barrier to the electronic era.8
The time dependent part of the intermediation cost,
1
(ht)�j c
jt(i); j = ' or e;
embodies properties concerning the proportionality to consumption purchases and the e¤ect of newtechnologies on the cost. It decreases as the level of knowledge increases and it is proportionalto consumption purchases done via intermediary. The function 1
h�jt
re�ects the following: as more
human capital is accumulated, more knowledge is available, better technologies can be developed andcheaper intermediation services can be o¤ered. The parameter �j can be interpreted as the degree ofknowledge di¤usion into the payment system.9 We assume that �j > 0: Similarly to Acemoglu andZilibotti (2001) we can rank both technologies by capital intensity, where in the de�nition of capital weinclude both human and technology di¤usion. Therefore, using certain technology e¢ ciently entailsan appropriate human capital development and an appropriate degree of knowledge di¤usion. Inthis vein, paper based payment instruments are less capital intensive than electronic ones. Then, thedegree of knowledge di¤usion into the electronic payments is higher than the knowledge di¤usion intothe paper-based transactions, �e > �': As the economy grows and new technologies are developed,both payments get cheaper, but the electronic payments, more capital intensive, get cheaper in afaster pace.The mean of payment will be chosen according to its cost. The opportunity cost of buying with
cash is the nominal interest rate R � 1; which does not vary across markets. The opportunity costof buying with paper-based or electronic securities is the one corresponding to the intermediationcost 't (i) and
et (i); respectively. Figure 4 shows the behavior of the opportunity cost of using cash,
paper-based and electronic payments across markets. For an economy at a low stage of development(low level of human capital) it may happen that no electronic goods will be employed, because theyare too expensive. In Figure 4a we can observe that in all markets with indexes below ��t paper-basedpayments have the lowest cost. In all market with indexes above ��t cash will be employed becausethe opportunity cost of holding money is lower than the intermediation cost for either non-cashalternative. For a more developed economy, Figure 4b, paper-based payments are the cheapest wayof acquiring consumption goods in all markets with indexes below �t. In all markets with indexesbetween �t and st electronic payments have the lowest cost, and in markets with indexes above stgovernment issued money are the cheapest.
8In particular F can be shaped by at least two kinds of dimensions. First, the minimum necessary infrastructure fora payment system to operate and second the geographical factors, in the spirit of Galor and Weil (2000), that conditionthe development and implementation of this minimum infrastructure necessary to make electronic transactions.
9For ht < 1 higher �j increases the intermediation cost for a given level of human capital. We can understandthat in our analysis countries capable of performing electronic transactions are developed enough so the initial levelof human capital h1 > 1:
9

(a) (b)
Figure 4: Determination of the marginal markets: when i = ��t; agents are indi¤erent between buyingwith cash or paper-based securities; when i = �t agents are indi¤erent between buying via electronic orpaper-based transactions; when i = st agents are indi¤erent between buying with cash or via electronicpayments. (a) Low development: only cash and paper-based payments are used; (b) Middle development:all three payment instruments are used.
We arbitrarily assume that cash will be used on the marginal markets ��t and st; and electronicpayment on the cuto¤ market �t: There will exist a moment in time for which all three marginalmarkets coincide st = ��t = �t. Thus by checking the relationship between st and �t we can recognizethe mentioned two stages of development. One in which no electronic goods will be employed,st < �t; and the stage of the coexistence of all three types of considered means of payments. Thebasic characteristic of the second stage is that in the course of time the electronic private securitieswill drive out of the markets cash and paper-based payments.De�ne
ct(i) =
8>>>><>>>>:c0t (i) when �t(i) = 0;
c't (i) when �t(i) = 1 and �t(i) = 0;
cet (i) when �t(i) = 1 and �t(i) = 1:
The functions c0t (i); c't (i) and c
et (i) characterize the cash, paper-based and electronic consumption
per market i; respectively. Recognizing the two stages of development, we can rewrite the utilityfunction
1Xt=1
�t
264 minf��t;�tgZ0
c't (i)1�� � 11� � di+
maxf��t; stgZminf��t;�tg
cet (i)1�� � 11� � di+
1Zmaxf��t; stg
c0t (i)1�� � 11� � di
375 ; (9)
10

the budget constraint
minf��t;�tgZ0
[c't (i) + 't (i)] di+
maxf��t; stgZminf��t;�tg
[cet(i) + et (i)] di+
1Zmaxf��t; stg
c0t (i)di+
+Mt+1
pt+Bt+1Rpt
� whtlt +Mt
pt+Btpt+Xt
pt(10)
and the cash-in-advance constraint
1Zmaxf��t; stg
c0t (i)di �Mt
pt: (11)
3.3 Equilibrium
De�nition: Given the set of initial conditions h1; M1; B1 and the nominal interest rate R; theequilibrium consists of sequences fc0t (i); c
't (i); c
et (i); lt; ht+1; Mt+1; Bt+1; �t; ��t; st; Xt; ptg1t=1 such
that(a) a representative household is maximizing the discounted utility (9) subject to the budget
constraint (10), the cash-in-advance constraint (11) and the condition for accumulation of humancapital (3), choosing the sequences fc0t (i); c
't (i); c
et(i); lt; ht+1; Mt+1; Bt+1; �t; ��t; stg1t=1;
(b) markets for goods, money and bonds clear in every period,
minf��t;�tgZ0
c't (i)di+
maxf��t; stgZminf��t;�tg
cet(i)di+
1Zmaxf��t; stg
c0t (i)di+
+
minf��t;�tgZ0
't (i)di+
maxf��t; stgZminf��t;�tg
et(i)di = whtlt; (12)
Mt+1 = Mt +Xt; (13)
Bt+1 = 0: (14)
Let �t; �t; and � t be the non-negative Lagrange multipliers associated with the budget constraint(10), the cash-in-advance constraint (11), and the condition for accumulation of human capital(3), respectively. The equations that characterize the equilibrium are the above mentioned marketclearing conditions (12), (13), (14) and the �rst order conditions on all types of consumptions, labor,
11

capital, nominal balances, nominal bonds and marginal markets indexes, respectively,
c0t (i)�� = �t + �t; (15)
c't (i)�� = �t; (16)
cet (i)�� = �t; (17)
�tw = � t�; (18)
� t = ��t+1wlt+1 + �� t+1 f� (1� lt+1) + (1� �)g ; (19)�tpt
= ��t+1 + �t+1
pt+1; (20)
�tpt
= �R�t+1pt+1
; (21)
c0t (��t)1�� � 1
1� � � c't (��t)
1�� � 11� � = ��t [c't (��t) + t(��t)] + (�t + �t) c0t (��t); (22)
cet (st)1�� � 11� � �c
0t (st)
1�� � 11� � = �(�t + �t)c0t (st) + �t [cet (st) + et(st)] (23)
c't (�t)1�� � 1
1� � � cet (�t)
1�� � 11� � = ��t [cet (�t) + et(�t)] + �t [c
't (�t) +
't (�t)] (24)
Using (15), (20) and (21), we can rewrite the �rst order condition on cash consumption as
c0t (i)�� = R�t: (25)
From the �rst order conditions on the marginal markets between paper-based and cash goods (22),electronic and cash goods (23) and between paper-based and electronic goods (24) we get 10
't (��t) =1
�t
hc'(�t)
1���11�� � c0(R;�t)
1���11��
i+Rc0 (R; �t)� c' (�t) ; (26)
et (st) =1
�t
hce(�t)
1���11�� � c0(R;�t)
1���11��
i+Rc0 (R; �t)� ce (�t) ; (27)
et (�t) = 't (�t) : (28)
Using the given forms of the cost functions (6) and (7), we get for the respective cuto¤ markets
��t = ��(R; ht) =� (R)
1
(ht)�' +�(R)
; (29)
st = s(R; ht) =
� (R)� 1
(ht)�eF
1
(ht)�e +�(R)�
1
(ht)�eF
; (30)
�t = �(ht) =F
(ht)�e��' + F � 1
(31)
10Note that the initial level of the Lagrange multiplier on the budget constraint depends on the monetary policy, soin fact �t = �t(R): We write just �t in order to keep the notation as simple as possible.
12
where
�(R) =
8>>><>>>:lnR for � = 1;
�
1� �
1� 1
R1���
!for � 6= 1:
(32)
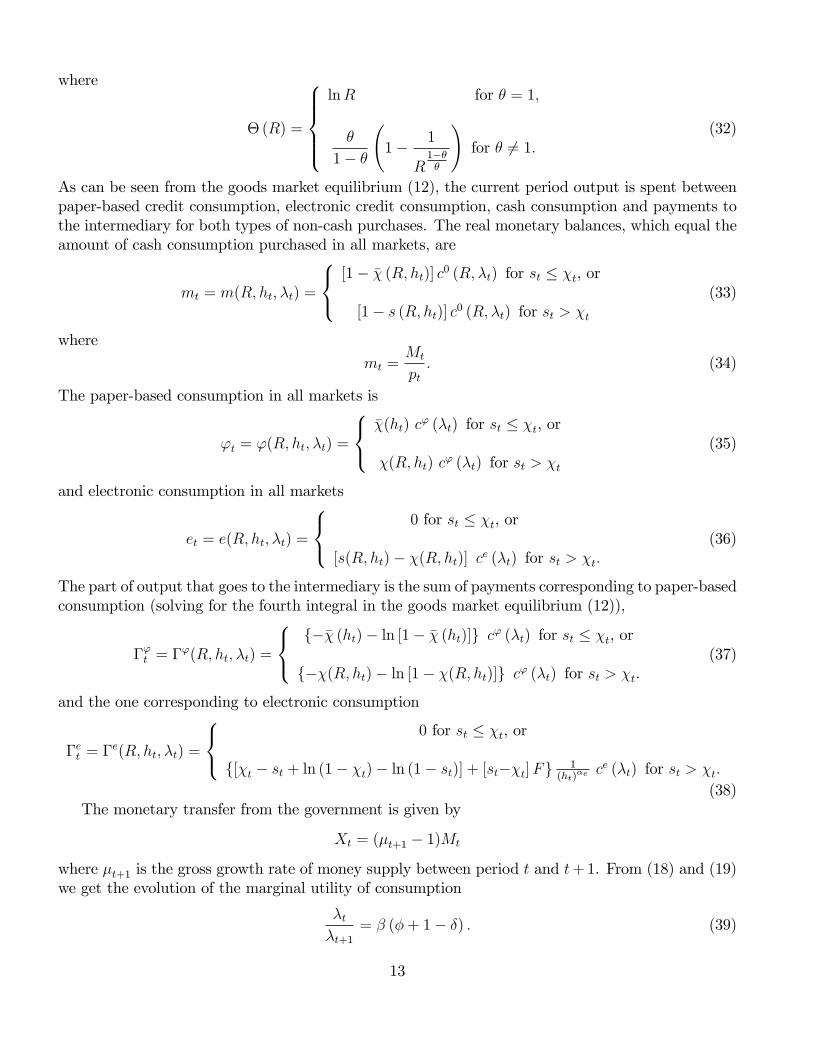
As can be seen from the goods market equilibrium (12), the current period output is spent betweenpaper-based credit consumption, electronic credit consumption, cash consumption and payments tothe intermediary for both types of non-cash purchases. The real monetary balances, which equal theamount of cash consumption purchased in all markets, are
mt = m(R; ht; �t) =
8<:[1� �� (R; ht)] c0 (R; �t) for st � �t, or
[1� s (R; ht)] c0 (R; �t) for st > �t(33)
where
mt =Mt
pt: (34)
The paper-based consumption in all markets is
't = '(R; ht; �t) =
8<:��(ht) c
' (�t) for st � �t, or
�(R; ht) c' (�t) for st > �t
(35)
and electronic consumption in all markets
et = e(R; ht; �t) =
8<:0 for st � �t, or
[s(R; ht)� �(R; ht)] ce (�t) for st > �t:(36)
The part of output that goes to the intermediary is the sum of payments corresponding to paper-basedconsumption (solving for the fourth integral in the goods market equilibrium (12)),
�'t = �'(R; ht; �t) =
8<:f��� (ht)� ln [1� �� (ht)]g c' (�t) for st � �t, or
f��(R; ht)� ln [1� �(R; ht)]g c' (�t) for st > �t.(37)
and the one corresponding to electronic consumption
�et = �e(R; ht; �t) =
8<:0 for st � �t, or
f[�t � st + ln (1� �t)� ln (1� st)] + [st��t]Fg 1(ht)
�e ce (�t) for st > �t:(38)
The monetary transfer from the government is given by
Xt = (�t+1 � 1)Mt
where �t+1 is the gross growth rate of money supply between period t and t+1. From (18) and (19)we get the evolution of the marginal utility of consumption
�t�t+1
= � (�+ 1� �) : (39)
13

Combining expressions (21), (34) and (39) we can write for the growth rate of money supply
�t+1 =R
(�+ 1� �)mt+1
mt
: (40)
Notice that the constant in (40) is the gross in�ation rate
�t+1 =pt+1pt
=R
(�+ 1� �) : (41)
4 Balanced Growth Path
To perform our analysis we will assume that human capital grows at a positive rate, i.e.
ht+1ht
> 1:
To characterize the properties of the economy when it reaches the balanced growth path we lookat the behavior of variables as time goes to in�nity. From (29)-(31) we see that when the humancapital accumulates at a positive rate and ht !1 the cuto¤ index between the electronic and cashgoods and the one between paper-based and cash approach unity, s(R; ht) ! 1 and ��(R; ht) ! 1respectively; while the cuto¤ index between the paper-based and electronic payments is approachingzero, �(ht) ! 0: That means that the electronic payments are used in more and more markets andthe cash and paper-based private securities are less and less employed.Let us look at the long run growth rates of all types of consumption and payments to the inter-
mediary. When taking the limits of the growth rates of these variables as time goes to in�nity weget the following: cash consumption and the payment to the intermediary for electronic transactionsin the long run grow at the rate
limt!1
�mt+1
mt
�= lim
t!1
��et+1�et
�=
��t�t+1
�1��htht+1
��e; (42)
paper-based consumption
limt!1
�'t+1't
�=
��t�t+1
�1��htht+1
��e��';
the intermediation cost for paper-based payments in the long run does not grow
limt!1
��'t+1�'t
�= 1 (43)
and the electronic consumption grows at the rate
limt!1
�et+1et
�=
��t�t+1
�1�
:
14

Goods market equilibrium
wlt =mt
ht+'tht+etht+�'tht+�etht
(44)
implies that electronic consumption in the long run must grow like human capital. That means that
ht+1ht
=
��t�t+1
�1�
: (45)
Plugging (45) into (42) and using (39), (3) and (40) we can summarize the results in the followingproposition.
Proposition 1 On the balanced growth path cash consumption and the payment for electronic trans-actions grow at the rate
[� (�+ 1� �)]1��e� ;
paper-based consumption grows at
[� (�+ 1� �)]1��e+�'
�
electronic-based consumption and human capital grow at the rate
[� (�+ 1� �)]1� ;
labor is given by
(�+ 1� �)� [� (�+ 1� �)]1�
�
and the growth rate of money supply is
R�1��e� (�+ 1� �)
1��e��� :
Proof. The labor on the balanced growth path is obtained by equating the condition for the humancapital accumulation (3) and the long run growth rate of capital.
5 Transitional Dynamics
5.1 Numerical technique
In order to characterize the dynamics we rewrite the equilibrium equations. We de�ne
mt = mt�1�t ; 't = 't�
1�t ; et = et�
1�t (46)
�'t = �'t �1�t ; �
et = �
et�
1�t (47)
andG (R; ht) = mt + 't + et + �
't + �
et : (48)
15

Then the goods market equilibrium (12) can be rewritten as
ht = G (R; ht)1
wlt�1�t
: (49)
Time spent working lt can be written as a function of the growth rate of human capital using theequation (3). Using (48), (49), (3) and (39) we can characterize the entire equilibrium by a secondorder di¤erence equation in human capital
ht+1ht
=G (R; ht+1)
G (R; ht)
�� ht+1
ht+ 1� �
�� ht+2ht+1
+ 1� �
![� (�+ 1� �)]
1� : (50)
Because we know the long run characteristics, we will use backward induction to solve the di¤er-ence equation in human capital (50). We assume that for some high enough level of human capital, say
hT+1 � 1013; the economy is on the balanced growth path, hT+2hT+1= limt!1
�ht+1ht
�= [� (�+ 1� �)]
1� :
Then we apply the Newton-Raphson method to �nd ht knowing ht+1 and ht+2 for all t: In this waywe obtain a numerical policy function ht+1 = H(ht;�e; �'; �; �; �; �; F;R;w): Given the initial levelof human capital and the policy function, the behavior of all other variables in the economy can becalculated from the equations (29)-(38) and (46)-(47).
5.2 Calibration
We concentrate on the US and Norway between 1991 and 2007, the period in which we have thedata available for both countries. We calibrate the model using yearly data.11 One period in themodel corresponds to one year. As illustrated in section 2, the behavior of all payment instrumentsin the US is very regular between 1991 and 2001, but it changes later on. We thus assign commonparameter values for the period 1991-2001, which will be our baseline calibration for the US. Thenwe identify variables responsible for changes after 2001 and change their values. As suggested above,the start of direct pricing of payment instruments in Norway in 1995 originates di¤erences in trendin the usage of paper-based and electronic payment methods. The baseline set of parameters forNorway �ts the period 1991-1995. We then change the value of the parameter responsible for thechange in the price of the paper-based instrument.The discount factor in the utility function is set to � = 0:995: The depreciation of human capital
is set to � = 0:025 as in Gillman, Kejak, Valentinyi (1999). The values for the long run growthrates of the two economies correspond to the growth rate of output per worker found in the data,g�USA = 1:021 and g�NOR = 1:029. We set the e¢ ciency of learning in the US to �USA = 0:055 whichimplies that the inverse of the intertemporal elasticity of substitution is � = 1:32: We consider thatthe value of the elasticity of substitution is the same in both countries. As Norway displays highergrowth rate, it means that the e¢ ciency of learning is higher, �NOR = 0:069: All these previouslymentioned values imply that on the balanced growth path in both economies about 21% of time isdevoted to working and the rest to studying. Average values of the 12 month e¤ective rate imply thatthe baseline monetary policies are RUSA = 1:05 and RNOR = 1:07; respectively. Marginal product of
11For the calibration we use data from the FRED R Economic Data, PennWorld Tables 6.3, World DevelopmentIndicators database and Norges Bank.
16

capital in goods production is set to w = 1: The parameters related to the intermediation functionare set in order to �t the growth rates of cash, checks and cards in the data and re�ect the usageof each payment instrument at the initial year: the barrier for electronic payments FUSA = 1 andFNOR = 2:5; the technology di¤usion coe¢ cients �USA' = 1:47 and �USAe = 1:8; and �NOR' = 0:8 and�NORe = 1:2. Table 1 summarizes the choice of the baseline parameter values for both countries. Inorder to calibrate the model to changes in agents�payment choice we introduce several modi�cations.First, to account for the increase in the price of checks after 1995 in Norway we decrease step bystep the technology di¤usion into the paper-based payments, see the details on values of �NOR' ineach year in Table 2 (all other parameters remain unchanged at their baseline values). Second, toaccount for the changes in the usage of cash and checks in the US after 2001, we relax the monetarypolicy, we decrease R; as observed in the data, and we associate the drop in the usage of checks to animprovement in the relative position of electronic payments, a decrease in the barrier to electronicpayments F:12 This improvement of electronic payments against checks comes �rst from the fact thatthe Federal Reserve has undertaken measures to make electronic retail payments more attractive toconsumers. In particular, the Federal Reserve has reduced prices for electronic payment transactionsin order to promote this method of payment while still improving payment quality, Felsenfeld andBilali (2005). Second, the events of September 11, 2001 broke the traditional characteristics of paperinstruments underlined by Greenspan (2000): they allow the users themselves, within a structuredformat, to have signi�cant control over when, where, and how to make payments. This disruptionmay have helped the decreasing tendency of check use observed since then. Table 2 again shows thevalues given to RUSA and FUSA for each year (as before, all other parameters are kept equal as inthe baseline case).
g� R � w � � � l� F �' �eUSA 1.021 1.05 0.995 1 0.025 1.32 0.055 0.21 1 1.47 1.8NOR 1.029 1.07 0.995 1 0.025 1.32 0.069 0.21 2.5 0.8 1.2
Table 1: Baseline calibration of the model for the US and Norway.
Year 1996 1997 1998 1999 2000 2001 2002 2003 2004 2005 2006 2007
�NOR' 1.07 1.07 1.0 0.9 0.9 0.85 0.75 0.65 0.55 0.45 0.35 0.25RUSA 1.05 1.05 1.05 1.05 1.05 1.05 1.0475 1.045 1.04 1.0375 1.035 1.035FUSA 1 1 1 1 1 1 1 1 0.9 0.85 0.8 0.8
Table 2: Calibration of the parameters responsible for the modi�cation of the agent�s payment choice;�NOR' � technology di¤usion into the paper-based payments in Norway, RUSA� nominal interest factor inthe US, FUSA� barrier to electronic era in the US.
12A decrease in the usage of checks could be also explained via an increase of prices of checks, as for the case ofNorway.
17

5.3 The dynamics of the payment instrument choice
We use the baseline calibration for the US to expose the model behavior. We simulate the evolutionof the economy using the solution of the above mentioned second order di¤erence equation (50). InFigure 5 we plot the relative usage of each instrument over a very long period of time. The initialvalue of human capital in that case is h1 = 1: We begin at a very low stage of development duringwhich only two means of payments coexist, cash and paper-based ones. With the development ofnew technologies paper-based payments become relatively cheaper and the fraction of markets wherethis payment method is chosen increases, meanwhile the fraction of markets where cash is employeddecreases.
Figure 5: Evolution of the fraction of cash, paper-based and electronic payments as a percentage of allkinds of transactions for the baseline parameters for the US; behavior of the economy over 500 years, h1= 1.
Electronic payments emerge at a certain level of technology, in this particular case displayed inFigure 5, h100 = 8. Since that point agents choose between three payment instruments. With thedevelopment of new technologies the cost of electronic payments becomes relatively cheaper thanthe cost of other instruments, paper-based instruments and government money are driven away fromthe economy. However, the process of transformation of the payment system may take many years.In Figure 6 we plot the evolution of cash, paper-based and electronic purchases, as well as theintermediation payments for non-cash consumptions and the evolution of human capital. For �e > 1and �e��' < 1; cash and the intermediation cost of electronic payments grow at negative rates, andpaper-based payments and the intermediation cost of paper-based purchases grow at positive rates,as shown in the Proposition 1. We can also see that the human capital growth rate is very stableover time. Figure 6 helps us to see how the growth rate of electronic consumption converges to the
18

one of human capital, and how the growth rate of cash consumption converges to the growth rate ofintermediation payments for electronic transactions in the course of time (a result found analyticallyfor the balanced growth path).
Figure 6: Evolution of the cash consumption mt; paper-based consumption 't; electronic consumptionet; payments to intermediary for both non-cash transactions, �
't and �
et ; and human capital ht; for the
baseline parameters for the US.
19

5.3.1 E¤ects of the monetary policy
We analyze the e¤ects of changes in the monetary policy. Let us assume that the opportunity costof holding money increases. The �cash line�in Figure 4 moves up. Agents will want to economizeon their money holdings, substituting away from money. In the low stage of development they willsubstitute cash for paper-based payments, i.e. d��t
dR> 0. On the higher level of development they will
substitute cash for electronic payments, dstdR> 0: Paper-based payments will be used on the same
fraction of markets as under a low nominal interest rate, because the cuto¤market �t is not a¤ecteddirectly by the monetary policy, d�t
dR= 0; see also the equation (31). The transformation of the
payment methods under di¤erent monetary policies (and hence di¤erent in�ation rates) is illustratedin Figure 7. In Figure 7a all arrows begin at the same level of human capital, h109 = 9:7 and showthe transformation of the economy over 11 years.13 For a given level of technology, higher nominalinterest rate implies less cash and more electronic transactions (the arrows for higher R begin alwaysmore on the left and higher). We can observe that the transformation of the payment system isslowing down with in�ation (arrows are shorter). For a given initial condition, higher in�ation ratemeans that the economy is closer to its balanced growth path.14
(a) (b) (c)
Figure 7: Substitution of cash and paper-based payments by electronic ones under di¤erent monetarypolicies: R = 1.033, 1.05, 1.15 and 1.35 correspond to the in�ation factor � = 1.0, 1.016, 1.113 and 1.31,respectively.
In Figure 7b we can see that since the moment in which the electronic payments arise, the share ofpaper-based payments is independent of the monetary policy, as the cuto¤market �t is independent
13The point where the arrow begins for the baseline monetary policy, R = 1:05; has the properties of the paymentbehavior in the US in 1991.14It is a kind of convergence behavior. The larger is the initial distance of a country from its balanced growth path,
the more rapid is the convergence towards it. The balanced growth path transformation of the payment system isrepresented by the left top corner where cash and paper-based payments are negligible.
20

of R. The initial dependence of electronic consumption on R tends to disappear in the long run, asthe fraction of markets where electronic transactions are employed increases to 1, limt!1st = 1; andthe Lagrange multiplier converges to zero, see equation (36). Concerning the long run level of cashconsumption, it is a¤ected by the opportunity cost of holding money, as implied by the equation (33)and (25), see Figure 7c.
5.3.2 E¤ects of the growth rate (e¢ ciency of studying)
(a) (b) (c)
Figure 8: Behavior of the model under di¤erent balanced growth path growth rates (e¢ ciency of study-ing), g� = 1.021, 1.03, 1.04, 1.05 (� = 0.058, 0.07, 0.083 and 0.097).
We make the e¢ ciency of studying be responsible of changes in the growth rate of the economy.The growth rate of development of new technologies a¤ects the speed of transformation of the pay-ment system, see Figure 8a. Higher growth rate of human capital lowers faster the intermediationcost and the electronic payments era arises sooner, Figure 8b. The growth rate of electronic paymentsincreases. The growth rate of other payment instruments depends on the values of the coe¢ cientsthat characterize the di¤usion of new technologies into the payment cost. For our calibration, thegrowth rate of cash decreases (1 � �e < 0) and the growth rate of paper-based payments increases(1� �e + �' > 0); as can be observed in Figure 8c.
21

5.3.3 E¤ects of the barrier to the electronic payments era
Let us consider an increase in the �xed cost of electronic payments, for example a lower investment ininfrastructure or more complicated geographical factors. The e¤ect of an increase in F can be againdeduced from Figure 4. Moving the �electronic payments line�upward we can see that dst
dF< 0 and
d�tdF> 0: Electronic payments become relatively more expensive and it will be less pro�table for agents
to choose this instrument at lower level of development. The substitution of cash and paper-basedtransactions by electronic ones will begin later. The behavior of the economy for di¤erent levels of�xed cost is illustrated in Figure 9. We can see that the initial position of a country and the speed oftransformation can be a¤ected in an important way by changes in F , see the arrows in Figure 9a.15
When the barrier to electronic payments is higher, it will slow down the arrival of the electronicpayments era and the process of substitution of cash by paper-based instruments during the lowdevelopment lasts longer. Paper-based instruments are more widespread and we observe higher leveland higher share of paper-based payments at the moment of the emergence of the electronic paymentsera. Once the electronic payments arise they begin to substitute both previously used instruments.We can see that changes in F a¤ect mostly the relative usage of electronic and paper based payments,not much the level of cash transactions, even if both cuto¤ indexes st and �t depend on F .
(a) (b) (c)
Figure 9: Behavior of the model under di¤erent �xed costs in the intermediation function for electronicpayments, F = 0.5, 0.75, 1 and 1.5.
15Again, all arrows begin at the same level of human capital, h109 = 9:7; and show the changes in the paymentchoice decisions over 11 years.
22

5.3.4 E¤ects of the degree of technology di¤usion into the electronic payments
The condition for the existence of electronic payments is �e > �'; as argued in the intermediationcost speci�cation section. We maintain the baseline calibration for the US (�' = 1:47) and change�e: For a given level of development, a higher degree of technology di¤usion into electronic paymentsmakes the electronic transactions cheaper and more widespread across markets. It means that for agiven level of technology the economy is closer to its balanced growth path and the transformationof the payment system is slower, see Figure 10a. The evolution of the share of each payment methodover time depicted in Figure 10b is similar to the case of a decrease in F: The implications of anincrease in the degree of technology di¤usion into electronic payments are however very di¤erentwhen we look at the levels of each kind of consumption. The reason is that the value of �e a¤ects thelong run growth rates of cash and paper-based transactions, Figure 10c. Lower price of electronicgoods makes its usage more widespread and cash and paper-based payments are driven away faster.
(a) (b) (c)
Figure 10: Behavior of the model under di¤erent degrees of technology di¤usion into the electronicpayments, �e= 1.65, 1.8, 2 and 2.5.
23

5.3.5 E¤ects of the degree of technology di¤usion into the paper-based payments
Higher degree of the technology di¤usion into the paper-based payments makes checks cheaper rel-ative to electronic cards. Under low development (era of the coexistence of cash and paper-basedpayments) an increase in �' implies much faster substitution of cash by checks. Once in the electronicpayments era, an increase in �' causes an increase in the growth rate of paper-based transactions.Higher �' represents lower price of checks. When the price is lower, checks are employed in higherfraction of markets, decreasing the share of electronic payments. As can be seen in Figure 11, thee¤ect of a variation in �' on cash payments is rather small. We can see from Figure 11a that allarrows begin and end on the same level of cash share in all payments, and they only di¤er in theshare of electronic transaction as percentage of all non-cash transactions. As �' a¤ects the growthrate of checks, we observe big di¤erences in levels of paper-based consumption.16
(a) (b) (c)
Figure 11: Behavior of the model under di¤erent degrees of technology di¤usion into the paper-basedpayments, �'= 0.5, 1, 1.47 and 1.65.
16This is the kind of behavior we observe in Norway. An increase in the price of checks drives out paper-basedtransactions out of the markets in favor of electronic payments.
24

5.4 Data versus Model
5.4.1 Comparison of the US data with the simulations
As mentioned previously, the behavior of the analyzed payment instruments is very regular in theUS data for the interval between 1991-2001. The baseline calibration is applied to �t this particularinterval. For the period 2001-2007 we have to introduce changes in the calibration of the model. Welink the slowdown in the usage of electronic payments and an increase in the usage of cash after 2001to lower interest rates. The decrease of relative usage of checks can be attributed to improvementsin the electronic payments infrastructure or higher prices of checks. We perform the simulationsassuming that the barrier to electronic payments decreases.17 Decreasing both the nominal interestrate and the barrier to electronic payments, we observe a shift from paper-based payments towardscash as observed in the data. Detail on changes of the parameters can be found in Table 2. In Figure12a we plot the relationship between the share of cash transactions in all types of payments andthe share of electronic transactions in non-cash payments in the model and the data. The arrowsshow the transformation that the payment system undergoes in 16 years in two steps, 1991-2001 and2001-2007. We compare the evolution of the share of all three kinds of payment instruments in themodel and the data in Figure 12b.
(a) (b)
Figure 12: Behavior of the payment methods in the model and the US data between 1991 and 2007.
17The results are essentially the same when we decrease the difusion of technology into paper-based payments.
25

5.4.2 Comparison of the Norwegian data with the simulations
We present now the comparison of the model results with the data for Norway. A decrease in thedegree of technology di¤usion into paper-based transactions mimics the increase in prices of checksafter 1995. We decrease �' from 1.1 to 0.25 between the years 1996 and 2007, see details for eachyear in Table 2. The transformation of the payment system and the relative usage of each paymentinstrument is shown in Figure 13.
(a) (b)
Figure 13: Behavior of the payment methods in the model and the Norwegian data between 1991 and2007.
Results from Norway are quite interesting in terms of the structural change, and its speed, inconsumer payment behavior. Let us recall at this point Figure 5 where the evolution of the economyover many periods is plotted. We can see that without changing any parameters it might take about200 years to transform the payment system of an economy in a way that 75% of all payments areperformed electronically. The example of Norway shows us that this can be achieved in less than20 years by pricing correspondingly the most expensive instrument, checks. Implied welfare gains ofsuch a policy are discussed in the next section.
26

6 Welfare
We want to evaluate welfare e¤ects of changes in parameters that alter the usage of di¤erent paymentinstruments. As in the previous literature, a switch towards non-cash payments means that moreresources are channeled towards �nancial intermediaries, and welfare losses arise. See for the caseof two payment instruments for example Ireland (1994a), Marquis and Re¤ett (1994) or Hromcová(2008). Here we show that the introduction of electronic payments in addition to paper-basedpayments may have a positive e¤ect on welfare.The measure of welfare used is the one generally employed in the literature, as de�ned for example
in Lucas (2003)U [(1 + ") cA] = U (cREF ) :
Number "; in units of a percentage of consumption goods, gives us welfare gain or loss of followinga policy A with respect to a reference case REF: We �nd " that satis�es
1Xt=1
�t
(min f��t; �tg
f(1 + ") c't (�)g1�� � 1
1� � + [max f��t; stg �min f��t; �tg]f(1 + ") cet (�)g
1�� � 11� �
)
+1Xt=1
�t
([1�max f��t; stg]
f(1 + ") c0t (�)g1�� � 1
1� �
)=
=1Xt=1
�t
8><>:min��� REFt ; � REF
t
hc' REFt (�)i1��
� 11� �
9>=>;+
1Xt=1
�t
(�max
��� REFt ; s REFt
�min
��� REFt ; � REF
t
� �ce REFt (�)�1�� � 1
1� �
)
+1Xt=1
�t
(�1�max
��� REFt ; s REFt
� �c0 REFt (�)�1�� � 1
1� �
):
We can see from Figure 6 that the intermediation cost for electronic payments is much lowerthan the one for paper-based transactions. This means that a switch towards electronic paymentsreduces the resources which are unproductively channeled to intermediaries. That is translated intoan increase in welfare.In the �rst step of our analysis we study the welfare e¤ects of advancing or delaying of the arrival
of the electronic era. The reference case is the baseline calibration for the US. We change each of theparameters in the intermediation cost and the monetary policy in a way that the electronic paymentsare employed 20, 10 and 5 years earlier (later) than in the reference case. The results are summarizedin Table 3. The initial value for all cases is h1 = 8: This initial value implies that in the reference casethe electronic era just begins at t = 1: Welfare is evaluated over 1000 periods. Friedman rule is thewelfare maximizing policy. Nevertheless, R = 1 implies an economy where only cash payments areused and no transformation of the payment system occurs, which obviously does not coincide with theobserved empirical facts. For example, according to this exercise, making the paper-based paymentsmore expensive (cheaper) in a way that agents start to use the electronic transactions 5 years earlier(later) implies welfare gain (loss) of 4.3% (5.4%) of the stream of consumption. The same changes in
27

the behavior of agents induced by an analogous change in the price of electronic transactions imply2.3% gain and 2.8% loss, respectively. Changes due to di¤erent barriers to electronic payments causesimilar welfare e¤ects. The behavior of the model is di¤erent when concerning the changes in theopportunity cost of holding money. A higher interest rate implies that electronic payments are usedearlier, but as more resources go to intermediaries, this leads to welfare losses. In Table 3 we cansee that an increase (decrease) in in�ation that makes agents use the electronic payments 5 yearsearlier (later) implies a welfare loss (gain) of 0.2% of the stream of consumption. We can see thatan increase in prices of checks due to direct pricing policy makes the economy better o¤ in a veryfavorable way.In the second step of our welfare analysis we calculate the welfare gain implied by our model for
the changes in prices of paper-based instruments experienced by Norway. We take as a referencethe Norwegian economy under the calibration that �ts the period 1991-1995. We assume that theseparameters do not change over time and we evaluate the welfare obtained. Then we evaluate thewelfare under the calibration that �ts the whole interval analyzed, 1991-2007. We �nd that thewelfare gain reaches 4% of the stream of consumption.
Friedman ru le �20 �10 �5 REF +5 +10 +20
F Friedman ru le 0:4 0:64 0:80 1:00 1:25 1:55 2:35"[%] �8:0 �5:6 �3:5 �2:0 � 2.5 5.2 11.5�e Friedman ru le 2.1 1.92 1.86 1.80 1.75 1.71 1.64"[%] �8:0 �6:1 �3:8 �2:3 � 2:8 5:9 13:9
�' Friedman ru le 0� 1.10 1.33 1.47 1.55 1.62 1.69"[%] �8:0 �7:2 �6:4 �4:3 � 5.4 14.2 31.5R(�)
1:000(0:968)
1:130(1:094)
1:080(1:045)
1:0630(1:029)
1:050(1:016)
1:040(1:007)
1:032(1:00)
1:021(0:988)
"[%] �8:0 0.7 0.3 0.2 � �0:2 �0:7 �1:7
Table 3: Welfare loss (positive)/gain (negative), for di¤erent parameters that a¤ect the choice of paymentmethods with respect to the baseline calibration of the US economy: "� percentage of the stream ofconsumption to be added (positive) or taken (negative) in order to obtain the same welfare as under thereference policy REF , R� nominal interest factor, �� in�ation factor, F� barrier to electronic payments,�e� degree of knowledge di¤usion into electronic payments, �'� degree of knowledge di¤usion into paper-based payments. The initial value corresponds to h1= 8; in the �rst row �20, �10 and �5 (20, 10, and 5)mean that electronic payments are started to be used 20, 10 or 5 years earlier (later) than in the referencecase REF .
�This value advances the em ergence of the electron ic era on ly 17 p eriods. It is not p ossib le to advance it m ore p eriods changing th is param eter.
28

7 Conclusions
We present a general equilibrium model on payment choice at a retail level which provides theoreticalfoundations to reconcile previous empirical evidence on payment choice among cash, electronic andpaper-based instruments. Consumer choice of a particular payment instrument depends on para-meters like the payment infrastructure, the cost of each payment method, the growth rate of theeconomy, the degree of technology development or the interest rate. These variables help to ex-plain why countries with similar payment alternatives end up with very di¤erent usage of alternativepayment methods.Due to the development of new technologies �nancial intermediation is cheaper and new payment
methods may emerge endogenously at a certain degree of development. In our model agents useinitially cash and paper-based payments, and at some point in time they start using also electronicmethods. Electronic payments drive paper-based checks and cash away from the economy andtransform the country payment system. The electronic era arrives earlier if the level of technology,growth rate of the economy, in�ation rate, technology di¤usion into the electronic payments arehigher, if the payment infrastructure is more developed, or if the technology di¤usion into the paper-based payments is lower (checks are more expensive). Similar e¤ects speed up the transformation ofthe payment system.The welfare analysis provides some interesting insights for the design and management of a pay-
ment system. Results show that the introduction of a cheaper payment instrument may induceimportant welfare improvement. The calibration exercise for Norway shows that the policy of directpricing of payment instruments caried out by individual banks and ecouraged by the Norwegian au-thorities may imply 4% increase in the welfare of the country. These results indicate that authoritiesshould pursue policies of direct pricing of payment instruments according to their relative costs. Suchpolicies could diminish the resources allocated to �nancial intermediaries and lead to an increase ofthe well-being of individuals.
29

References
[1] Acemoglu, D. and Zilibotti, F., (2001) Productivity di¤erences. The Quarterly Journal of Eco-nomics 116, 563-606.
[2] Aiyagari, R. S., Braun, A. R. and Eckstein, Z., (1998) Transaction Services, In�ation, andWelfare. Journal of Political Economy 106, 1274-1301.
[3] Callado, F. and Utrero, N., (2004) European Payment Systems and Monetary Union. Journalof Financial Transformation 12, 85-92.
[4] Callado, F. and Utrero, N., (2007) Towards Economic and Monetary Union: Changing Trends inPayment Systems for New European Members. Journal of Financial Transformation 20, 168-174.
[5] Chakravorti, S., Gunther, J. W. and Moore, R. R., (2005) Universal Access, Cost Recovery, andPayment Services. Working paper 2005-21, Federal Reserve Bank of Chicago.
[6] Crowe, M., Schuh, S. and Stavins, J., (2006) Consumer Behavior and Payment Choice: AConference Summary. Federal Reserve Bank of Boston, Public Policy Discussion Paper: 06-1.
[7] English, W. B., (1999) In�ation and Financial Sector Size. Journal of Monetary Economics 44,379-400.
[8] Evans, D. S. and Schmalensee, R., (2009) Innovation and Evolution of the Payments Industry,in Litan, Robert E. and Baily, Martin Neil, Moving Money: The Future of Consumer Payments.Chapter 3, 36-77, Brookings eds.
[9] Felsenfeld, C. and Bilali, G., (2005) The Check Clearing for the 21st Century Act - A WrongTurn in the Road to Improvement of the U.S. Payments System. Research paper 67, FordhamUniversity School of Law
[10] Galor, O. and Weil, D. N., (2000) Population, Technology and Growth: From the MalthusianStagnation to the Demographic Transition and Beyond, American Economic Review 90, 806-828.
[11] Gillman, M., (1993) The Welfare Cost of In�ation in a Cash-in-Advance Economy with CostlyCredit. Journal of Monetary Economics 32, 51-77.
[12] Gillman, M., Kejak, M. and Valentinyi, A., (1999) In�ation, Growth, and Credit Services.Transition Economics Series 13, Institute for Advanced Studies.
[13] Greenspan, A., (2000) Retail Payment Systems. Speech Before the National Automated Clear-inghouse Association Annual Meeting, Los Angeles, California (via videoconference), April 10
[14] Hancock, D. and Humphrey, D. B., (1998) Payment Transactions, Instruments, and Systems:A Survey. Journal of Banking and Finance 21, 1573-1624.
[15] Hromcová, J., (2003) Money and Growth in a Cash-in-Advance Economy with Costly Credit.Economic Modelling 20, 1113-1136.
30

[16] Hromcová, J., (2008) Learning-or-doing in a Cash-in-Advance Economy with Costly Credit.Journal of Economic Dynamics and Control 32, 2826-2853.
[17] Humphrey, D. B., (2004) Replacement of Cash by Cards in U.S. Consumer Payments. Journalof Economics and Business 56, 211-225.
[18] Humphrey, D. B., Kim, M. and Vale, B., (2001) Realizing the Gains from Electronic Payments:Costs, Pricing, and Payment Choice. Journal of Money, Credit, and Banking 33, 216-234.
[19] Humphrey, D. B., Pulley, L. B. and Vesala, J. M., (1996) Cash, Paper, and Electronic Payments:A Cross-Country Analysis. Journal of Money, Credit, and Banking 28, 914-939.
[20] Humphrey, D. B., Pulley, L. B. and Vesala, J. M., (2000) The Check�s in the Mail: Why theUnited States Lags in the Adoption of Cost-Saving Electronic Payments. Journal of FinancialServices Research 17, 17-39.
[21] Ireland, P. N., (1994a) Money and Growth: An Alternative Approach. American EconomicReview 84, 47-65.
[22] Ireland, P. N., (1994b) Economic Growth, Financial Evolution, and the Long-run Behavior ofVelocity. Journal of Economic Dynamics and Control 18, 815-848.
[23] Litan, R. E. and Baily, M. N., (2009) Moving Money: The Future of Consumer Payments.Chapter 1, 1-18, Brookings eds.
[24] Lucas, R. E. Jr., (2003) Macroeconomic Priorities. The American Economic Review 93, 1-14.
[25] Lucas, R. E. Jr. and Stokey, N. L., (1983) Optimal Fiscal and Monetary Policy in an Economywithout Capital. Journal of Monetary Economics 12, 55-93.
[26] Markose, S. M. and Loke, Y. J., (2003) Network E¤ects On Cash-Card Substitution In Trans-actions And Low Interest Rate Regimes, The Economic Journal 113, 456-476.
[27] Marquis, M. H. and Re¤ett, K. L., (1994) New Technology Spillovers into the Payment System.The Economic Journal 104, 1123-1138.
[28] Quinn, S. and Roberds, W., (2008) The Evolution of the Check as a Means of Payment: AHistorical Survey. Federal Reserve Bank of Atlanta Economic Review 93 (4), 1-28.
[29] Schreft, S. L., (1992) Transaction Costs and the Use of Cash and Credit. Economic Theory 2,283-296.
[30] Schreft, S. L., (2006) How and Why do Consumers Choose their Payment Methods? ResearchWorking Paper RWP 06-04, Federal Reserve Bank of Kansas City.
[31] Stojanovic, A., (2001) E-money in Transitional Economies. Comparative Economic Studies 43,101-118.
[32] Wells, K. E., (1996) Are Checks Overused? Federal Reserve Bank of Minneapolis QuarterlyReview 20, 2-12.
31