case study: the implementation of a data-driven industrial ... · pdf fileinternational...
TRANSCRIPT

International Journal of Prognostics and Health Management, ISSN 2153-2648, 2016 026 1
Case study: the implementation of a data-driven industrial analytics
methodology and platform for smart manufacturing
Peter O’Donovan, Ken Bruton, and Dominic T.J. O’Sullivan
IERG, University College Cork, Ireland
Corresponding author: [email protected]
ABSTRACT
Integrated, real-time and open approaches relating to the
development of industrial analytics capabilities are needed
to support smart manufacturing. However, adopting
industrial analytics can be challenging due to its
multidisciplinary and cross-departmental (e.g. Operation
and Information Technology) nature. These challenges stem
from the significant effort needed to coordinate and manage
teams and technologies in a connected enterprise. To
address these challenges, this research presents a formal
industrial analytics methodology that may be used to inform
the development of industrial analytics capabilities. The
methodology classifies operational teams that comprise the
industrial analytics ecosystem, and presents a technology
agnostic reference architecture to facilitate the industrial
analytics lifecycle. Finally, the proposed methodology is
demonstrated in a case study, where an industrial analytics
platform is used to identify an operational issue in a large-
scale Air Handling Unit (AHU).
1. INTRODUCTION
Smart manufacturing refers to a data-driven paradigm that
uses real-time pervasive sensor networks, simulation,
analytics and robotics, to deliver manufacturing intelligence
to every area of the factory (Davis, Edgar, Porter, Bernaden,
& Sarli, 2012; Lee, Lapira, Bagheri, & Kao, 2013; Lee,
2014; Wright, 2014). Facilities that transition to smart
manufacturing operations will be able to address many
contemporary operating challenges, such as increasing
global competition and rising energy costs, while shortening
production cycles and enhancing just-in-time product
customization capabilities (Manufacturing et al., 2011;
Sharma & Sharma, 2014). Other potential performance
benefits include (1) reduction in capital intensity of 30%, (2)
reduction in product cycle times of up to 40%, and (3)
overarching efficiencies across energy, emissions,
throughput, yield, waste, and productivity. Extrapolating
these efficiencies across entire regions may also derive
benefits for the greater economy. Such benefits were
highlighted in research produced by the Fraunhofer
Institute, which estimated the transformation of factories to
Industry 4.0 could be worth up to 267 billion Euros to the
German economy by 2025 (Heng, 2014). Given the
potential benefits that may be derived from smart
manufacturing, several government, academic and industry
initiatives have emerged in recent years to support its
development. Prominent initiatives currently include the
Smart Leadership Coalition (SMLC) (Manufacturing et al.,
2011), Technology Initiative SmartFactory (Zuehlke, 2010),
Industry 4.0 (Lee, Kao, & Yang, 2014), and The Industrial
Internet Consortium (IIC), to name a few.
Modern manufacturing facilities currently employ sensing,
control and automation in day-to-day operations (Chand &
Davis, 2010; Davis et al., 2012; Lee et al., 2014). These
control and automation technologies deliver operational
efficiencies, process innovations, and environmental
benefits (Fosso Wamba, Akter, Edwards, Chopin, &
Gnanzou, 2015; Hazen, Boone, Ezell, & Jones-Farmer,
2014). However, as facilities transition to smart
manufacturing, the number of sensors deployed in the
factory, as well as the resolution at which they are logging
measurements, will inevitably increase (Davis et al., 2012;
Lee, Bagheri, & Kao, 2015; Wright, 2014). These improved
sensing capabilities present opportunities to derive new and
useful insights from operational data, while also presenting
challenges in terms of large-scale data management,
processing and analysis (Fosso Wamba et al., 2015; Kumar,
Dhruv, Rawat, & Rathore, 2014; Lee et al., 2013;
McKinsey, 2011; Philip Chen & Zhang, 2014; Vera-
baquero, Colomo-palacios, & Molloy, 2014).
Industrial analytics is an important aspect of smart
manufacturing, which focuses on the application of data-
driven methods and technologies to inform decision-
making. Some of these data-driven approaches originate
from mainstream information technology, before being
adapted for industrial use cases. Big Data and Internet of
Things (IoT) are good examples of mainstream technologies
that have become synonymous with smart manufacturing
and industrial analytics. While these (and similar)
technologies are central to the development of industrial
analytics capabilities, there is an equal, if not greater,
dependence on the systematic convergence of teams and
_____________________
Peter O’Donovan et al. This is an open-access article distributed under the terms of the Creative Commons Attribution 3.0 United States License,
which permits unrestricted use, distribution, and reproduction in any
medium, provided the original author and source are credited.

INTERNATIONAL JOURNAL OF PROGNOSTICS AND HEALTH MANAGEMENT
2
personnel governing Operation Technology, Information
Technology, Data Analytics and Embedded Analytics.
However, these multi-disciplinary convergences can be
difficult given potential differences in each teams
background knowledge, experience and perspective of
operating technologies, standards and analytics.
This research presents and applies a formal and systematic
methodology to support the development of industrial
analytics capabilities. Some aspects of this methodology
evolved from previously published research focusing on
applications of big data in manufacturing (P. O’Donovan,
Leahy, Bruton, & O’Sullivan, 2015), and factory-to-cloud
data integration (P. O’Donovan, Leahy, Bruton, &
O’Sullivan, 2015). The following points highlight
contributions from this research, and describe relevant
connections with previous research;
Factory-to-cloud architectures presented in previous
research were conceptual. This research extends some
of these concepts, and introduces others, to produce a
methodology for developing end-to-end industrial
analytics capabilities, while also demonstrating and
validating the approach using a real-world case study.
The people and processes needed to implement factory-
to-cloud integration, and apply these technologies to
problem solving in the factory, were not addressed by
previous research. This research places a strong
emphasis on identifying operational teams (e.g.
Operational and Information Technology), usage
scenarios, technical components and systematic
processes for end-to-end industrial analytics.
Low-level details regarding data processing were not
addressed in previous research. This research presents a
formal taxonomy for cleaning and transforming time-
series industrial data, and a multi-stage data processing
workflow pattern for implementation.
Building and operationalizing analytics models was not
addressed in previous research. However, these are
fundamental aspects of the industrial analytics lifecycle
presented in this research, which identifies the teams,
processes, and technologies needed to realize industrial
analytics in the factory.
Finally, ancillary observations from the case study
presented in this research (e.g. differing data transfer
rates) may prove useful to other researchers
implementing industrial analytics. Such observations
are sometimes omitted due to publication bias, where
seemingly insignificant observations are not reported.
Previous research could not report such practical
observations due to their conceptual focus.
The remainder of this article is structured as follows –
Section 2 reviews technologies governing data management
across industrial, enterprise and emerging paradigms,
Section 3 presents a formal methodology for developing
industrial analytics capabilities, Section 4 describes the
application of the methodology to the development of an
industrial analytics platform in a large-scale manufacturing
facility, and Section 5 delivers conclusions from this
research.
2. RELATED WORK
Many disciplines and technologies are involved in the
development of industrial analytics capabilities for smart
manufacturing. Developing these capabilities may be
viewed as the convergence of traditional Operation and
Information Technology, with contemporary data-driven
disciplines, such as Big Data Analytics, Machine Learning,
Internet of Things (IoT), and Cyber Physical Systems
(CPS). The following section reviews prominent technology
protocols and architectures related to data transmission,
management and processing across Operation Technology,
Information Technology and Emerging Technology.
2.1. Operation Technology
Operation Technology encompasses control and automation
technologies in modern manufacturing facilities (Kastner,
Neugschwandtner, Soucek, & Newman, 2005; Nagorny,
Colombo, & Schmidtmann, 2012; Samad & Frank, 2007).
These technologies typically consist of (1) industrial
information systems to inform end-users of operating
conditions, (2) Programmable Logic Controllers (PLC) to
enact process logic, and (3) field sensors to continuously
monitor conditions. The flow of industrial data between
these components follows a hierarchical and sequential
pattern. Firstly, sensors transmit raw measurements (e.g.
room temperature) to PLC’s. Secondly, these measurements
are persisted in-memory at set intervals (e.g. every 15
minutes). Finally, these in-memory measurements are
acquired periodically by industrial information systems to
archive measurements in file-based repositories. This
hierarchical automation topology may also be designed to
comply with control and enterprise standards (e.g. ISA-88,
ISA-95) to promote consistency and interoperability (ISA,
2016a, 2016b; Scholten, 2007).
The flow of industrial data in Operation Technology follows
two distinct paths - (1) real-time data access via PLC’s, and
(2) historical data access via file-based archives. Real-time
data access may be achieved using standard industrial
protocols to interface with PLC’s. The most common
industrial protocols include Modbus, LonWorks, BACnet,
OLE Process Control (OPC), and MT Connect (Alves
Santos, Normey-Rico, Merino Gómez, Acebes Arconada, &
de Prada Moraga, 2005; Hong & Jianhua, 2006; Vincent
Wang & Xu, 2013; Xu, 2012). Historical data access may be
achieved using mainstream database and I/O interfaces to
interrogate disk-based archives (e.g. CSV, SQL), but the
underlying data model (e.g. table structure) of each archive
may be entirely proprietary. Such heterogeneous data

INTERNATIONAL JOURNAL OF PROGNOSTICS AND HEALTH MANAGEMENT
3
models and technologies can increase the complexity of
industrial integration scenarios, given the effort needed to
map and integrate their underlying properties.
2.2. Information Technology
Information Technology supports business processes using
enterprise technologies. Specific applications may include
order processing, supply chain management and inventory
management, to name a few. These systems may include
different architectures and delivery models, ranging from
on-premises software, to managed cloud-based solutions.
However, contemporary systems tend to embrace Internet-
oriented architectures and protocols to support pervasive
cross-platform accessibility.
Service Oriented Architecture (SOA) is a common design
pattern used in modern enterprise systems to support
interactions between distributed components (Al-jaroodi &
Mohamed, 2012; Cardiel, Gil, Somolinos, & Somolinos,
2012; Gligor & Turc, 2012). SOA provides a technology
agnostic means of exposing system functionality as
autonomous services, which may be consumed by
distributed components. These autonomous services are
commonly implemented as Web Services, which use
Internet standards and protocols to invoke actions on remote
machines. The use of such standards can facilitate
interoperability across a wide-range of platforms and
devices, which is of particular importance to modern
enterprise systems, where prescribing the use of platforms
and devices may not be possible due to geographically
distributed users and technology preferences. There are
currently two main approaches used to develop Web
Services, namely Representational State Transfer (REST)
and Simple Object Access Protocol (SOAP). While REST is
an architectural style that employs Hypertext Transfer
Protocol (HTTP) to initiate services across distributed
networks, SOAP is an XML-based message protocol for
exchanging information and invoking services on
distributed computers. Both approaches are technology
neutral, meaning they can be developed using different
programming languages and technologies (e.g. Java, .NET).
2.3. Emerging Technology
In recent years, contemporary technology paradigms closely
related to smart manufacturing have emerged (e.g. cloud
manufacturing and cyber manufacturing). These paradigms
describe connected industrial enterprises, where Operation
Technology and Information Technology have converged.
This convergence is necessary to support the formation of
data-rich production environments with pervasive sensing
and analytics capabilities. These paradigms commonly
embrace mainstream technologies (e.g. Cloud Computing,
Big Data and Internet of Things) to address traditional
industrial engineering challenges and scenarios (e.g. process
improvement, equipment maintenance, and energy
optimization) (O’Donovan et al., 2015).
Manufacturing technology paradigms that employ cloud
computing typically use service-orientation (e.g. SOA) to
share industrial resources and utilities, thereby centralizing
and consolidating efforts across geographically distributed
processes and operations (Vincent Wang & Xu, 2013; Wu,
Greer, Rosen, & Schaefer, 2013; Xu, 2012). These services
typically reside in the cyber world (i.e. cloud), which
embodies the data storage and compute power needed to
process complex models and simulations, while these
analytical results are relayed to the physical world (i.e.
factory) to inform decision-making. Those systems that
facilitate interactions between cyber and physical worlds are
commonly referred to as Cyber Physical Systems (CPS),
which is a multidisciplinary field of research that intersects
Engineering, Big Data, Internet of Things, and Machine
Learning (Bagheri, Yang, Kao, & Lee, 2015; Dworschak &
Zaiser, 2014; Lee, Ardakani, Yang, & Bagheri, 2015; Lee,
Bagheri, et al., 2015; Wright, 2014). The main impediment
facing the adoption of smart manufacturing technologies
relates to legacy issues, such as poor interoperability,
proprietary standards, and inadequate data management.
Those facilities migrating to smart manufacturing must
focus on employing open and consistent standards (Brandl,
2008; Chungoora et al., 2013; Emerson, Kawamura, &
Matthews, 2007; Giovannini, Aubry, Panetto, Dassisti, & El
Haouzi, 2012; Reinisch, Granzer, Praus, & Kastner, 2008;
Scholten, 2007; Weiss & Donmez, 2014).
Although some existing applications and architectures may
support elements of industrial analytics, broader
methodologies are needed to illustrate the roles, components
and processes in the industrial analytics lifecycle. To
address these needs, this research presents and applies an
industrial analytics methodology that describes a closed-
loop industrial analytics lifecycle, beginning with the
classification of operational teams, and culminating in the
operationalization of embedded analytics in real-time
factory operations.
3. INDUSTRIAL ANALYTICS METHODOLOGY
This section presents a methodology to support the
development of industrial analytics capabilities in large-
scale manufacturing facilities. The phases of the
methodology are illustrated in Figure 1. Firstly, the
technology and analytics teams are formed, and assigned
specific roles and responsibilities. Secondly, an information
system architecture is implemented to enable operational
data in the factory to automatically flow between each team.
Finally, operational questions are identified and answered
using a formal analytics process. The following sections
describe the methodology’s theoretical concepts using
technology agnostic, formal and systematic methods.

INTERNATIONAL JOURNAL OF PROGNOSTICS AND HEALTH MANAGEMENT
4
Figure 1. Phases of industrial analytics methodology
3.1. Phase 1 of 3 - Industrial Analytics Teams
Smart manufacturing requires the convergence of Operation
and Information Technology to produce seamless streams of
operational intelligence in the factory. In terms of industrial
analytics, the convergence of contemporary analytics teams
must also be considered. Therefore, four teams are included
in the proposed industrial analytics lifecycle - (1) Operation
Technology, (2) Information Technology, (3) Data
Analytics, and (4) Embedded Analytics. Figure 2 illustrates
the main relationships that exist between teams,
responsibilities and standards. Firstly, all teams must
commit to the adoption of technology standards in their
respective environments (e.g. automation and control, cloud,
analytics etc.). Secondly, teams are broadly classified as
those responsible for data integration, processing and
management, and those responsible for building and
operationalizing analytics. Thirdly, collaborative inter-team
relationships follow a clockwise direction, from Operation
Technology through to Embedded Analytics.
Figure 2. Industrial analytics quadrant
The roles and responsibilities of each team in the industrial
analytics lifecycle methodology are summarized in the
following sections.
3.1.1. Operational Technology Team
Operational Technology teams ensure industrial information
and automation systems are operating as intended. In the
industrial analytics lifecycle, they guide the integration and
management of industrial data from systems and devices in
the factory. Their most important relationship is with
Information Technology, with whom they must collaborate
to construct end-points that connect the factory to the global
information system architecture that supports the industrial
analytics lifecycle.
3.1.2. Information Technology Team
Information Technology teams fulfill a wide-range of roles
across the enterprise, including the provisioning of compute
resources, software development, business intelligence, data
management and integration. In the industrial analytics
lifecycle, they are needed to develop the information system
architecture and tools that facilitate the seamless flow and
processing of operational data. They must communicate
with each team to ensure the appropriate compute resources,
software and tools are available.
3.1.3. Data Analytics Team
Data Analytics teams employ data-driven methods and tools
(e.g. machine learning) to derive insights that can positively
impact operations. In the industrial analytics lifecycle, they
are needed to build accurate data-driven models that support
decision-making processes. Their most important
relationship is with Embedded Analytics, with whom they
must collaborate to (a) elicit and comprehend useful
operational questions, and (b) ensure model outputs are
contextually accurate.
3.1.4. Embedded Analytics Team
Embedded Analytics teams develop applications and tools
that are deployed in the factory to inform real-time decision-
making. In the industrial analytics lifecycle, they use
domain expertise to identify and inform high-impact
analytics questions, as well as operationalizing production-
ready analytics models in factory operations. They have
important relationships with both Data Analytics and
Operation Technology. They utilize knowledge of factory
operations to ensure Data Analytics are investigating
relevant and useful questions, while they collaborate with
Operation Technology to ensure real-time data streams are
accessible to embedded applications.
The teams and roles in the industrial analytics lifecycle were
discussed in this section to provide clear boundaries for
those contributing to the development of industrial analytics
Phase 1
Classify teams
& roles
Phase 2
Implement IT architecture
Phase 3
Apply analytics process

INTERNATIONAL JOURNAL OF PROGNOSTICS AND HEALTH MANAGEMENT
5
capabilities. The next section focuses on technical
responsibilities (e.g. data integration, processing and
modeling) associated with each team.
3.2. Phase 2 of 3 - Industrial Analytics Reference
Architecture
Figure 3 illustrates a technology-agnostic reference
architecture depicting an industrial analytics lifecycle. The
architecture incorporates the technology and analytics teams
described previously, as well as primary technical
components, and industrial data streams, which are needed
to support collaboration, interoperability and computation.
These details provide the theoretical basis for developing an
industrial analytics lifecycle, without being overly
prescriptive or immutable. The architecture should be
considered an open and technology neutral artifact, which
can be extended or modified to meet the needs of particular
facilities. Table 1 summarizes the dimensions of the
reference architecture.
Dimension Description
Data Streams Batch and real-time data streams are shown
at the top of the reference architecture, with
each part of the industrial analytics lifecycle
grouped under one of these streams. The
left side of the reference architecture
illustrates how batch data is propagated to
Data Analytics to build data-driven models,
while the right side illustrates real-time data
being consumed in the factory.
Lifecycle Stage Each stage in the industrial analytics
lifecycle is represented by technology and
analytics teams. They function as containers
for technical components to ingest, prepare,
analyze and operationalize data-driven
models. Stages are linked as per the
industrial analytics quadrant from the
previous phase - (1) Operation Technology,
(2) Information Technology, (3) Data
Analytics, and (4) Embedded Analytics.
Technical
Components
There are two types of technical
components depicted in the reference
architecture. Firstly, endpoints between
stages are used to explicitly declare
associations and interfaces in the lifecycle
(e.g. Operation Technology to Information
Technology). Secondly, each stage contains
specific technical components that are
needed to fulfill their role in the lifecycle
(e.g. data cleaning).
Table 1. Reference architecture dimensions
The technology and analytics teams are deliberately
analogous with each stage in the reference architecture. This
provides a consistent vocabulary to convey classifications
and groupings throughout the methodology. The technical
components and functions in each stage of the reference
architecture are discussed in the following sections.
3.2.1. Operation Technology Components
Technical components in the Operational Technology stage
archive operational data and establish communications with
Information Technology. This is illustrated in the reference
architecture, where operational data from a PLC in the real-
time stream is periodically archived by the Building
Management System. These archives (e.g. log files) are
stored on disk, which enables ingestion components to
access and transmit historic operational data to a centrally
accessible data lake. While systems and storage formats
may change from factor-to-factory, the process of archiving
and accessing operational data should be similar.
Building analytics models that answer operational questions
are largely dependent on the availability of high-quality
training data, therefore, components at the Operation
Technology stage are crucial to the industrial analytics
lifecycle. Of the components depicted in the reference
architecture, industrial information systems and data
archives are almost certain to exist in modern manufacturing
facilities. Where these components do not exist, it is the
responsibility of Operation Technology to implement
solutions that archive operational data from across the
factory. In contrast, data ingestion components and
communication endpoints may not exist given the traditional
separation between Operation and Information Technology.
Where these components do not exist, Operation and
Information Technology must collaborate to agree
specifications and protocols, with Information Technology
taking responsibility for implementation and deployment.

INTERNATIONAL JOURNAL OF PROGNOSTICS AND HEALTH MANAGEMENT
6
3.2.2. Information Technology Components
Technical components in the Information Technology stage
are primarily used to store, process and prepare operational
data transmitted from Operation Technology. These
components collaborate to automate the delivery of
analytics-ready data, which may be consumed by other
stages in the industrial analytics lifecycle. The reference
architecture illustrates the interactions between these
components using the example of data from an Air Handling
Unit (AHU). Initially, AHU data transmitted from Operation
Technology is tagged and stored in the data lake. This
triggers a call to the workflow engine, which searches for
workflows that can clean and process AHU data. Where a
suitable workflow is identified, the workflow engine
constructs and executes a data processing job, and provides
the transmitted AHU data as input. These jobs consist of
multiple modules, where each module performs a single
operation on the AHU data (e.g. sort by timestamp, remove
duplicates etc.) to produce an analytics-ready data set.
The Information Technology stage has three communication
endpoints that connect to Operation Technology and Data
Analytics in the industrial analytics lifecycle. As previously
mentioned, the inbound endpoint for Operation Technology
facilitates the transmission of data from the factory, while a
second inbound endpoint for Data Analytics enables those
undertaking analysis to access the final analytics-ready data
set from workflows (e.g. AHU workflow), or data output
from a particular workflow stage. To illustrate the
usefulness of this design, consider a scenario where the final
output from a particular workflow aggregates a time-series
using daily averages, but analytical questions later arise that
require clean 15-minute resolution data. By following the
multistage approach, the 15-minute data may be obtained
from an earlier stage in the workflow, before daily average
calculations were applied. This illustrates how reusable and
accessible workflows can reduce duplicated effort for data
cleaning and transformation operations.
Information Technology components illustrated in the
reference architecture may exist in facilities where cloud-
based big data infrastructures have been adopted. However,
where these components exist in a business enterprise
context, they may require some amendments to work with
industrial operational data (e.g. time-series). In facilities
Figure 3. Industrial analytics lifecycle and reference architecture

INTERNATIONAL JOURNAL OF PROGNOSTICS AND HEALTH MANAGEMENT
7
where these components do not exist, Information
Technology should be responsible for their design,
development and implementation. These components are
needed to abstract Data Analytics from time-consuming and
complex processing of ad hoc and proprietary operational
data, while also being critical to the scalability and
resilience of the industrial analytics lifecycle.
The workflows depicted in the reference architecture
comprise multiple data processing modules, which are
positioned in a particular order to produce an analytics-
ready dataset. Such datasets are commonly referred to as
tidy data sets, where each column refers to a single
variable/feature/measurement, and each row refers to a
single observation at a point in time. Table 2 describes
different types of processing modules that may be included
in a workflow. These classifications provide a common
vocabulary for common industrial time-series processing
patterns. Each module accepts one or more files as input,
and produces a single file as output. This ensures
consistency in module implementations, while also enabling
modules to be ‘chained’ (i.e. output from one module may
be used as input for the next module). Finally, enforcing an
input/output interface also enables modules to be easily
substituted (e.g. replaced) without breaking workflows.
Name Description
Type 1 (Normalizer) Modules of type Normalizer take
proprietary files from the data lake as
input and wrangle them in to a basic
time-series format consisting of
timestamp and value columns.
Type 2 (Mapper) Modules of type Mapper rename log
files to give them context, as many
raw log files in facilities use arbitrary
or auto-generated names. Although
renaming files only provides a
minimal level of contextualization, it
enables end-users and other processes
to identify data by name.
Type 3 (Aggregator) Modules of type Aggregator merges
individual time-series log files to a
single analytics-ready file.
Type 4 (Mutator) Modules of type Mutator are used to
transform any aspect of an analytics-
ready file. This includes deriving and
appending new data (e.g. columns), or
undertaking fundamental cleaning and
transformation operations on existing
data (e.g. percentage to decimal).
Type 5 (Action) Modules of type Action undertake ad
hoc routines/tasks when a workflow
has been completed. This may include
tasks such as transmitting the output
to another database or system.
Table 2. Classes of workflow processing modules
When constructing a workflow consisting of multiple
processing modules, some guidelines relating to the position
and order of modules must be adhered to. These guidelines
are described below;
The first processing module in a workflow should
be of type Normalizer. Such modules are generally
specific to the information system or repository
from which the data originated. In the reference
architecture example, the first Normalizer module
in the AHU workflow may be responsible for
transforming the BMS data to a generic time-series
representation.
The second processing module in a workflow
should be of type Mapper. This facilitates the
labeling and high-level contextualization of the
data being processed. In the reference architecture
example, the second Mapper module in the AHU
workflow may rename arbitrary log files using the
sensor measurements being monitored in the AHU.
The third processing module in a workflow should
be of type Aggregator. These modules produce a
tidy data set by aggregating data from multiple log
files. In the reference architecture example, the
third Aggregator module in the AHU workflow
may aggregate all measurements for a particular
AHU to present them in a single file.
Processing modules of type Mutator can be
positioned anywhere after the third module. Each
Mutator module implements a single processing
function. Therefore, where several data
transformations must be applied to data in a
workflow, the equivalent number of Mutator
modules should be present. Similar to good
software design principles, singularity and
modularity can be used to promote reuse, while
reducing maintenance.
Finally, modules of type Action can be used to
execute triggers, such as emailing a notification or
building a PDF report. Given these modules do not
output a file that can be used by other modules,
Action modules may only be positioned as the last
module in a workflow.
Given its intermediary role between Operation Technology
and Data Analytics, coupled with the responsibility of
providing data management and processing for the factory’s
operational data, Information Technology may represent the
most complex and time-consuming aspect of the industrial
analytics lifecycle. To reduce this complexity, the reference
architecture illustrates the operation of a prescriptive cloud-
based workflow pattern, which includes a formal taxonomy
that classifies time-series processing routines.

INTERNATIONAL JOURNAL OF PROGNOSTICS AND HEALTH MANAGEMENT
8
3.2.3. Data Analytics Components
Technical components in the Data Analytics stage use data-
driven methods to derive insights that can positively affect
operations. This requires Data Analytics personnel and
components to acquire analytics-ready operational data from
Information Technology, build insightful data-driven
models, and support the deployment of these models in the
factory. The reference architecture illustrates an example of
an R Console accessing and exploring data from an AHU
workflow, before building, standardizing and
operationalizing an AHU model (e.g. issue identification) to
a real-time stream in the factory.
The Data Analytics stage has three communication
endpoints that connect to Information Technology and
Embedded Analytics. These endpoints consist of two
outbound channels, and one inbound channel. The outbound
endpoint to Information Technology facilitates the
acquisition of analytics-ready data from workflows, while
the outbound endpoint to Embedded Analytics supports the
deployment of production-ready models to real-time streams
in the factory. The inbound endpoint from Information
Technology may be used to automatically retrain existing
data-driven models when new training data becomes
available. These components facilitate turnkey data analysis,
model building, standardization and deployment in the
industrial analytics lifecycle, without having to focus on
low-value, complex and time-consuming activities (e.g. data
integration and cleaning).
Some components illustrated in the reference architecture
may already exist in facilities where statistical data analysis
is used for business intelligence or reporting. Examples of
components may include those relating to statistical
software applications, such as R and SAS. The components
relating to building, training and operationalizing data-
driven models are less likely to exist, but may be present in
facilities currently adopting aspects of smart manufacturing
or advanced analytics. Where these components do not
exist, Data Analytics and Information Technology must
collaborate to define requirements and specifications, with
Information Technology leading implementation. Unlike
other stages in the reference architecture, Data Analytics
and Embedded Analytics stages prescribe the use of
Predictive Modeling Markup Language (PMML) (Data
Mining Group, 2016) to encode and standardize data-driven
models. This aspect of the reference architecture may be
abstracted in future iterations when there are well-known
alternatives to PMML.
3.2.4. Embedded Analytics Components
Technical components in the Embedded Analytics stage
facilitate the operationalization of production-ready data-
driven models, which enables outputs from Data Analytics
to positively affect real-time operations. Where analytics
models are not operationalized, the valuable data insights
they provide are inaccessible to decision-making processes
in the factory. The reference architecture illustrates an
example of an embedded application in the factory, which
acquires real-time AHU measurements from a PLC, before
transmitting these measurements to a Scoring Engine for
evaluation. The Scoring Engine passes these measurements
to the PMML encoded AHU model to derive a result (i.e.
issue identification), which is relayed back to the embedded
application to take appropriate action.
The Embedded Analytics has two communication endpoints
that connect to Data Analytics and Operation Technology.
These endpoints consist of one inbound channel, and one
outbound channel. The inbound endpoint from Data
Analytics supports the real-time deployment of data-driven
models, while the outbound endpoint to Operation
Technology provides embedded applications with access to
continuous real-time measurements. While some types of
embedded applications are likely to exist in modern
manufacturing facilities, where closed or proprietary
implementations have been employed, their inclusion in the
industrial analytics lifecycle may not be viable. Generally,
these embedded applications are associated with a particular
aspect of the manufacturing domain (e.g. issue
identification, maintenance, scheduling etc.).
The subject matter experts in Embedded Analytics are
needed to identify areas where analytics may have the
greatest impact on operations. This knowledge should
inform the development of analytics questions, and validate
the accuracy of models before they are used in embedded
analytics applications. Given these applications depend on
PMML and Scoring Engine components to produce data
intelligence, Embedded Analytics must collaborate with
Information Technology to ensure their availability.
The reference architecture presented in this phase of the
methodology provides a formal and consistent view of an
industrial analytics lifecycle. Developing a more
prescriptive architecture is difficult considering the possible
technology permutations that may exist from factory-to-
factory. Hence, the level of abstraction upon which the
reference architecture is modeled aims to balance
technology neutrality and high-level specification. This
provides flexibility around technology selection, but
exposes the risk that misinterpretation of the lifecycle may
lead to inappropriate technology choices. While previous
phases of the methodology described operational and
technical components in the industrial analytics lifecycle,
the next phase presents an analytics process that
demonstrates how the lifecycle may be used to investigate
an industrial engineering problem.
3.3. Phase 3 of 3 - Industrial Analytics Process
This phase of the methodology describes a sequential
process for applying the industrial analytics lifecycle to
operational challenges. Each step in the process prescribes

INTERNATIONAL JOURNAL OF PROGNOSTICS AND HEALTH MANAGEMENT
9
an action to be undertaken, as well as identifying teams
responsible for their execution. This serves to coordinate
workloads across multi-disciplinary teams, while ensuring
efforts are guided by well-defined objectives. Furthermore,
this formal and systematic approach may reduce the risk of
project failure by clearly apportioning responsibilities and
actions, while also facilitating the early identification of
critical issues (e.g. data availability). Figure 4 illustrates
each step in the industrial analytics process.
Figure 4. Industrial analytics process steps
The process does not currently provide conditional paths to
support alternative actions, which may be necessary in
scenarios where a particular step could not be completed.
For example, it would not be possible to complete Step 3
(i.e. data ingestion) without access to historical data. In this
particular example, an alternative action may involve
Operation Technology creating a new data archive. While
future iterations of this process may include conditional
paths, the current process depends on teams encountering
issue(s) using their discretion to either (a) fix the issue(s), or
(b) terminate the process. This industrial analytics process is
used to structure the following case study, which focuses on
the application of the industrial analytics methodology to
identify operating issues in a large-scale industrial AHU.
4. CASE STUDY
This case study applies the industrial analytics methodology
to an issue identification scenario in a large-scale
manufacturing facility in Cork, Ireland. The objective of the
study was to evaluate the methodology, and implement
technology components in the reference architecture to form
an industrial analytics lifecycle. This required the use of
several technologies and platforms, which were chosen at
different points in the process. However, technology
decisions described in this study should not be considered a
prescribed technical implementation. Indeed, changes in the
manufacturing environment, available resources, or
engineering application, may have resulted in completely
different implementation decisions.
4.1. Step 1 – Operational Question
The operational question of this study focuses on issue
identification in large-scale industrial Air Handling Units
(AHU’s). Given the facility used in this study is subject to
regulation and quality control, the analysis did not include
AHU’s subject to quality assessment and validation. The
rationale for choosing AHU issue identification as the
operational question is provided below;
The study’s purpose is to demonstrate and validate
the industrial analytics methodology. Therefore,
operational questions should avoid potential
impediments, such as restricted access stemming
from quality policies or procedures.
Although the potential impact of the question is not
central to this study, it should be a real operating
problem that can be solved within the scope of the
study, while providing the opportunity for further
investigation.
Given the proposed methodology demands diverse
skills and knowledge to execute an industrial
analytics lifecycle, the operational question should
align with the skills and knowledge of the authors.
Once issue identification for AHU’s was agreed as the
guiding operational question, the next step was to identify a
repository of AHU data that could be used to build a data-
driven model.
4.2. Step 2 – Historical Data
Component-level sensors in AHU’s may be used to predict
system health and energy inefficiencies. Examples of such
measurements include mechanical component positions,
temperature, and airflow. These measurements are typically
Step 6 - Operationalize Model Embedded Analytics Team
Operationalize the validated model in the factory to enable real-time data-driven decision-making.
Step 5 - Model Building Data Analytics Team
Access analytics-ready data and begin the process of building a model to answer the question.
Step 4 - Data Preparation Information Technology Team
Process, transform and clean ingested data to produce an analytics-ready dataset.
Step 3 - Data Ingestion Operation and/or Information Technology Team
Setup or amend data ingestion in the factory to acquire historical data from the relevant repository.
Step 2 - Historical Data Operation Technology Team
Check if historical data is available and accessible to answer the questions using data-driven methods.
Step 1 - Operational Question Operation Technology or Embedded Analytics Team
Identify an operational question/objective that may have an impact on a particular aspect of operations
INTERNATIONAL JOURNAL OF PROGNOSTICS AND HEALTH MANAGEMENT
10
transmitted in real-time across automation and control
networks, while they may also be periodically archived as
disk-based repositories. In this study, an on-premises Cylon
Building Management System (BMS) was identified as the
main source of energy data. Automatic archiving of this data
executed at 5AM each day. During the archival process,
CSV log files were appended with data from the previous
24-hour period, with each file containing historical
measurements for a single sensor. Brief investigations of
other on-premises BMS’s confirmed that archival processes
across vendors are similar, but log file formats and data
models output from these processes varied significantly.
The identified Cylon BMS archive was explored to confirm
the availability of AHU data, as well as compiling metadata
to characterize the archive. Firstly, we randomly chose three
AHU’s to investigate. Of those units, we decided to use the
AHU with the most historical data as the subject for analysis
in this study. This unit was labeled AHU9 and provided
access to 4 years of 15-minute measurements. Secondly, the
BMS archive was analyzed to produce metadata from the
archive’s data properties. The archive consumed 1.06 GB of
disk space on the BMS PC. This consisted of 838 log files,
with each storing historical measurements for a single
sensor. The timespan of measurements in each file ranged
from a couple of months to 4 years. The largest file in the
archive measured 13 MB, while the smallest file measured a
mere 1 KB. Approximately 5% of all log files were larger
than 5 MB, which loosely represented files with 4 years of
data. Log files smaller than 1 MB were indicative of (a) new
sensors that recently began archiving, or (b) legacy sensors
where archiving was disabled. However, file size could not
be used to accurately predict the range of measurements in a
log file. For example, two log files measuring 5MB and
12MB may contain the same date ranges and measurement
resolutions, but the latter may contain higher precision
readings, which simply consumes more Bytes on disk.
The identification and verification of historical AHU data to
support issue identification analysis was completed in this
step. The next step focused on the development of a data
ingestion process that integrated this historical data in a
centrally accessible cloud-based repository.
4.3. Step 3 - Data Ingestion
Amazon Web Services (AWS) was chosen as the cloud
platform to host Information Technology components. Of
those components, the data lake was initially required to
support data ingestion. The data lake was implemented
using the Simple Storage Service (S3), which provided
scalable and fault tolerant file storage, while providing an
Application Programming Interface (API) for factory-to-
cloud communication. This API was integrated with a
purpose-built data ingestion application written in C# .NET
to continuously stream energy data to the data lake.
The ingestion process was tested on different computers and
networks to reduce potential technology biases (e.g. high
bandwidth). First, the process was executed on a
development PC with diagnostic tools enabled to monitor
resource usage. The development PC specification included
an Intel Core i5-4380U CPU @ 2.80GHz processor, 4 GB
memory, and 200 GB solid-state hard drive, running on
Windows 8.1 Enterprise. Bandwidth availability was
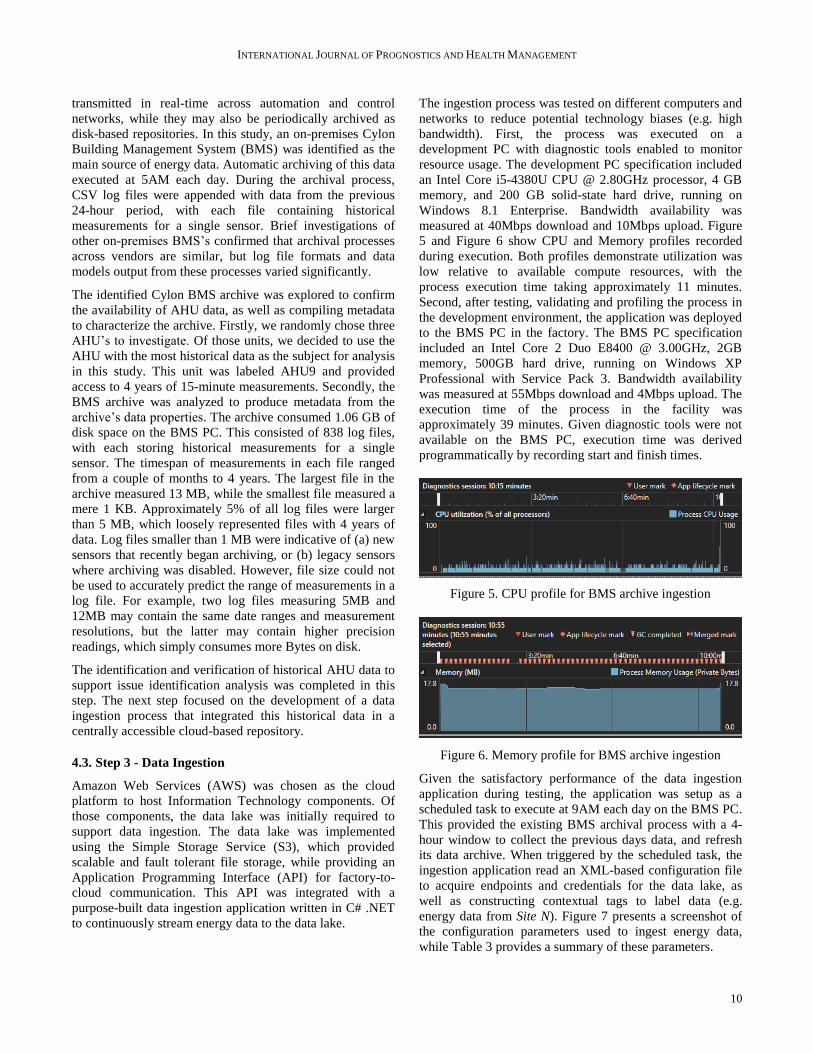
measured at 40Mbps download and 10Mbps upload. Figure
5 and Figure 6 show CPU and Memory profiles recorded
during execution. Both profiles demonstrate utilization was
low relative to available compute resources, with the
process execution time taking approximately 11 minutes.
Second, after testing, validating and profiling the process in
the development environment, the application was deployed
to the BMS PC in the factory. The BMS PC specification
included an Intel Core 2 Duo E8400 @ 3.00GHz, 2GB
memory, 500GB hard drive, running on Windows XP
Professional with Service Pack 3. Bandwidth availability
was measured at 55Mbps download and 4Mbps upload. The
execution time of the process in the facility was
approximately 39 minutes. Given diagnostic tools were not
available on the BMS PC, execution time was derived
programmatically by recording start and finish times.
Figure 5. CPU profile for BMS archive ingestion
Figure 6. Memory profile for BMS archive ingestion
Given the satisfactory performance of the data ingestion
application during testing, the application was setup as a
scheduled task to execute at 9AM each day on the BMS PC.
This provided the existing BMS archival process with a 4-
hour window to collect the previous days data, and refresh
its data archive. When triggered by the scheduled task, the
ingestion application read an XML-based configuration file
to acquire endpoints and credentials for the data lake, as
well as constructing contextual tags to label data (e.g.
energy data from Site N). Figure 7 presents a screenshot of
the configuration parameters used to ingest energy data,
while Table 3 provides a summary of these parameters.
INTERNATIONAL JOURNAL OF PROGNOSTICS AND HEALTH MANAGEMENT
11
Figure 7. Configuration for BMS archive ingestion
Parameter Description
directoryOfLogs Local or network directory path that
contains the log files.
accessKey First part of an AWS credential that
identifies the facility from which data is
being ingested.
secretKey Second part of an AWS credential that
identifies the facility from which data is
being ingested.
bucketName Static label to name the industrial
analytics platform.
siteName Human-readable name of the facility
from which data is being ingested - this
forms part of a contextual tag for
identifying datasets.
datasetName Human-readable name of the dataset
being ingested – this forms part of a
contextual tag for identifying datasets.
parameterList Limits ingestion to the listed files.
fileType Limits ingestion to a particular file type.
queueUrl Specifies the Information Technology
endpoint for transmitting data.
Table 3. Data ingestion configuration parameters
4.4. Step 4 – Data Processing
Given the availability of energy data in the data lake, Simple
Queue Services (SQS) was used to orchestrate data
processing across workflows using a publish/subscribe
pattern, with ElasticBeanstalk used to host individual
processing modules in each workflow. The processing
instructions for each workflow were stored in SQL
Relational Database Service (RDS) to control execution,
while each cloud-based service was configured with auto-
scaling capabilities to support on-demand acquisition of
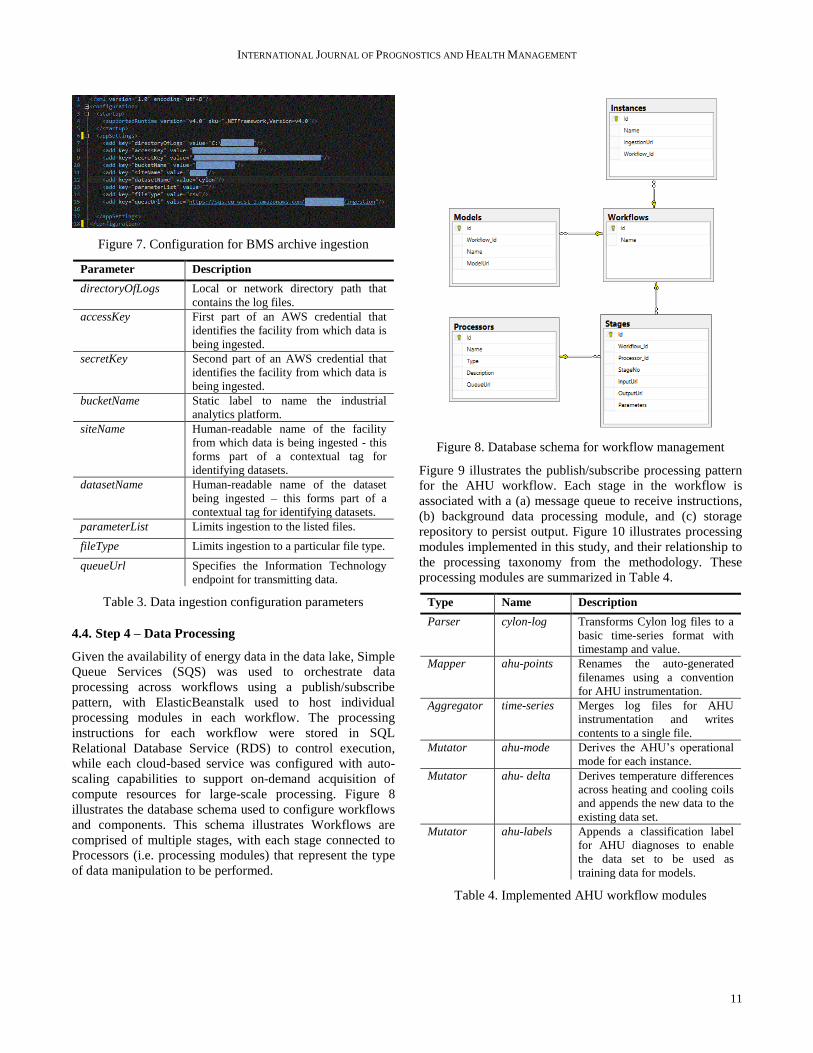
compute resources for large-scale processing. Figure 8
illustrates the database schema used to configure workflows
and components. This schema illustrates Workflows are
comprised of multiple stages, with each stage connected to
Processors (i.e. processing modules) that represent the type
of data manipulation to be performed.
Figure 8. Database schema for workflow management
Figure 9 illustrates the publish/subscribe processing pattern
for the AHU workflow. Each stage in the workflow is
associated with a (a) message queue to receive instructions,
(b) background data processing module, and (c) storage
repository to persist output. Figure 10 illustrates processing
modules implemented in this study, and their relationship to
the processing taxonomy from the methodology. These
processing modules are summarized in Table 4.
Type Name Description
Parser cylon-log Transforms Cylon log files to a
basic time-series format with
timestamp and value.
Mapper ahu-points Renames the auto-generated
filenames using a convention
for AHU instrumentation.
Aggregator time-series Merges log files for AHU
instrumentation and writes
contents to a single file.
Mutator ahu-mode Derives the AHU’s operational
mode for each instance.
Mutator ahu- delta Derives temperature differences
across heating and cooling coils
and appends the new data to the
existing data set.
Mutator ahu-labels Appends a classification label
for AHU diagnoses to enable
the data set to be used as
training data for models.
Table 4. Implemented AHU workflow modules

INTERNATIONAL JOURNAL OF PROGNOSTICS AND HEALTH MANAGEMENT
12
Figure 9. Implemented AHU workflow
Figure 10. Taxonomy of processing modules in workflow

INTERNATIONAL JOURNAL OF PROGNOSTICS AND HEALTH MANAGEMENT
13
Figure 11 shows the native form of BMS energy data
transmitted to the data lake. This format is not analytics-
ready given peculiarities in its structure. Firstly, header
information on the first row provides metadata about the log
file, such as the measurement type and interval (i.e. 900
seconds), rather than variables or features. Secondly, the
structure is primarily designed to provide compact data
redundancy for operational data, with each row containing
data for the previous 10 days. Column A contains
timestamps for the first measurement of each row, which is
contained in Column C. For example, the first value on the
second row has a timestamp of 14/04/12 17:30, with a
corresponding measurement of 23.02. Timestamps for each
measurement after Column C must be manually derived by
incrementally adding 15-minute values to the first
timestamp (i.e. from Column A). Column B specifies the
number of measurements on each row, starting from
Column C (i.e. first value). Although 1024 measurements
are specified for each row in the screenshot, logging issues
or outages can affect the number of measurements archived.
Given a measurement frequency of 900 seconds (i.e. 15
minutes), each row of 1024 measurements should contain 10
days of data, which means adjacent rows overlap with 9
days of redundant data. Each row in the screenshot shows
data logging at the same time every 24 hours (i.e. 5:30pm),
but it was common for this pattern to shift without warning,
which meant several control checks were needed to ensure
timestamps and measurements were parsed correctly.
Figure 11. Ingested log file for AHU return air temperature
The first two stages in the AHU workflow transformed the
Cylon BMS format to a basic time-series. Figure 12 shows
the data output after cylon-log (stage 1 processing module)
and ahu-points (stage 2 processing module) were applied.
This shows data redundancy has been removed, with each
row associated with a single observation (i.e. point-in-time),
and each column representing a single measurement. The
normalization of BMS data provided subsequent processing
modules with a more conventional format upon which to
execute data transformations.
Figure 12. AHU return air temperature after cylon-log
Figure 13 shows the output from stage 3, where individual
sensor logs for AHU9 were merged to a tidy dataset. This
dataset represents a single entity (i.e. AHU9), with each row
containing a single observation (i.e. point-in-time), and each
column containing a single measurement (e.g. return air
temperature). The availability of such formats can greatly
reduce the data wrangling and pre-processing effort
associated with data analytics. Table 5 provides a summary
of the AHU naming convention used to label columns.
Figure 13. AHU log file after time-series merge

INTERNATIONAL JOURNAL OF PROGNOSTICS AND HEALTH MANAGEMENT
14
Section Measurement Convention
Return air Temperature [°C] retT
Return air Humidity [%] retH
Return air Enthalpy [kJ/kg] retE
Return air CO2 [ppm] retC
Return air VSD [%] retVSD
Return air Flow [m3/s] retF
Return air Motor power [kW] retM
Return air Damp. Position [%op] detD
Exhaust air Damp. Position [%op] exhD
Outside air Temperature [°C] out
Outside air Temperature 2[°C] outT2
Outside air Humidity [%] outH
Outside air Humidity 2[%] outH2
Outside air Enthalpy [kJ/kg] outE
Outside air Enthalpy 2 [kJ/kg] outE2
Outside air Damp. Position [%op] outD
Frost coil Supply water [°C] froS
Frost coil Return water [°C] froR
Frost coil Valve position [%op] froV
Frost coil Off coil air [°C] froT
Mixed air Temperature [°C] mixT
Mixed air Humidity [%] mixH
Mixed air Enthalpy [J/kg] mixE
Heating coil Supply water [°C] heaS
Heating coil Return water [°C] hear
Heating coil Valve position.[%op] heaV
Heating coil Off coil air [°C] heaT
Cooling coil Supply water [°C] cooS
Cooling coil Return water [°C] cooR
Cooling coil Valve position.[%op] cooV
Cooling coil Off coil air [°C] cooT
Humidification Temperature [°C] humT
Humidification Humidity [%] humH
Humidification Dew-point [°C] humDew
Humidification Status [1/0] humSta
Humidification Valve position. [%op] humV
Reheat coil Supply water [°C] rehS
Reheat coil Return water [°C] rehR
Reheat coil Valve position. [%op] rehV
Reheat coil Off coil air temperature[°C] rehT
Supply air Temperature [°C] supT
Supply air Humidity [%] supH
Supply air Enthalpy [kJ/kg] supE
Supply air CO2 [ppm] supC
Supply air VSD [%] supVSD
Supply air Flow [m3/s] supF
Supply air Motor power [kW] supM
Supply air Pressure [Pa] Sup
Zone Temperature [°C] zonT
Zone Humidity [%] zonH
Zone CO2 [ppm] zonC
Table 5. AHU conventions (Bruton et al., 2014)
Figure 14 shows new variables appended to the AHU
dataset after the execution of ahu-mode and ahu-delta
processing modules. The mode variable refers to the current
operating mode of the AHU. These operating modes are
classified in Table 5, while Figure 15 illustrates the logical
transition from heating to cooling modes. The appended
delta variables refer to temperature differentials between the
off-coil heating (heaT) and cooling (cooT) temperatures,
and the units mixing box (mixT). While mode may indicate
the system-level state (e.g. heating or cooling), deltaCooT
and deltaHeaT can infer component-level state. Comparing
these measurements for state consistency may indicate
potential operating issues.
Figure 14. AHU log file after ahu-mode and ahu-delta
INTERNATIONAL JOURNAL OF PROGNOSTICS AND HEALTH MANAGEMENT
15
Name Description
Mode 1 Heating with Minimum Outside Air
Mode 2 Modulation of Fresh air with Return
air with no heating or cooling
Mode 3 Maximum outside air with Cooling
Mode 4 Minimum outside air with Cooling
Table 6. AHU modes of operation
Figure 15. AHU control sequence and modes
The data processing logic for deriving operating modes, off-
coil delta temperatures and diagnostic classifications are
based on engineering first principles presented in previous
research (Bruton et al., 2014).
4.5. Step 5 – Model Building
The AHU workflow output an analytics-ready dataset to
support the development of a data-driven model. This
dataset was used to profile heating and cooling operations in
the unit, develop a Support Vector Machine (SVM)
(Jedliński & Jonak, 2015) for heating coil issues, and create
a deployable model using PMML. The RStudio integrated
development environment for statistical analysis, modelling
and visualization, was used for analytics activities. These
activities leveraged several R packages, including GGPlot2
and base R library for time-series visualization, TidyR for
data wrangling, Dplyr for data manipulation, E1071 for
building an SVM model, and PMML for encoding the
model, while data acquisition from the AHU workflow was
implemented using HTTP GET requests, with site, workflow
and stage parameters used to identify the dataset.
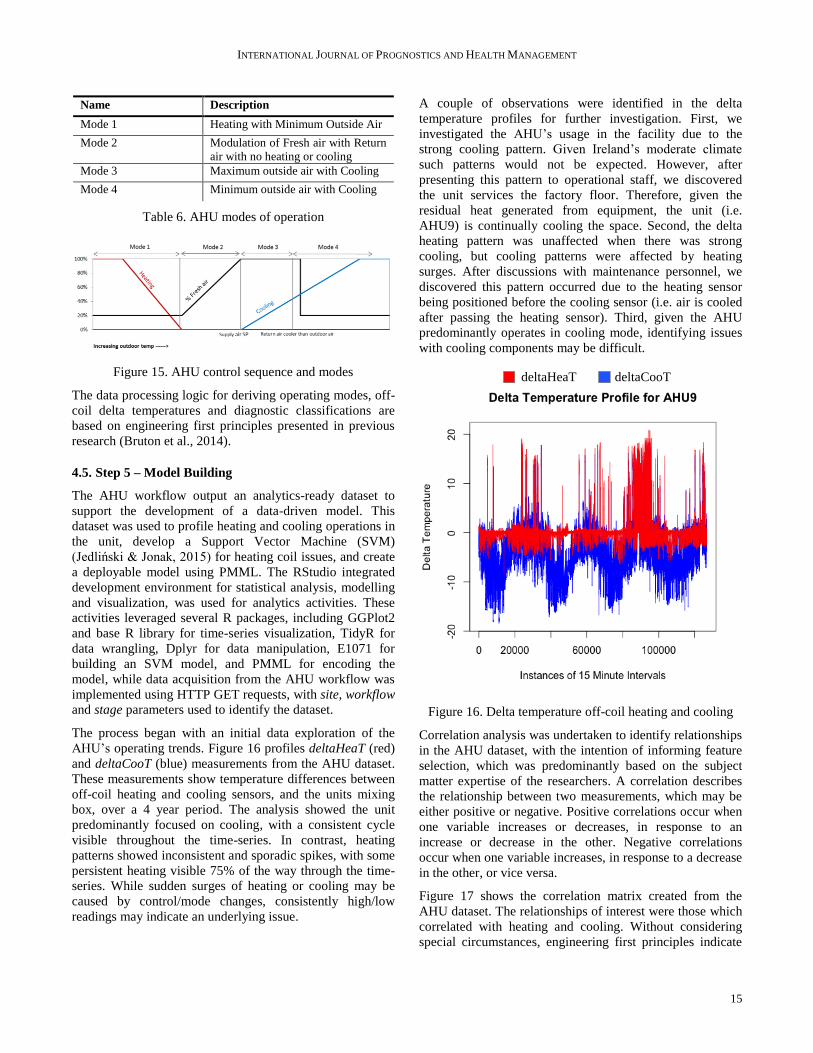
The process began with an initial data exploration of the
AHU’s operating trends. Figure 16 profiles deltaHeaT (red)
and deltaCooT (blue) measurements from the AHU dataset.
These measurements show temperature differences between
off-coil heating and cooling sensors, and the units mixing
box, over a 4 year period. The analysis showed the unit
predominantly focused on cooling, with a consistent cycle
visible throughout the time-series. In contrast, heating
patterns showed inconsistent and sporadic spikes, with some
persistent heating visible 75% of the way through the time-
series. While sudden surges of heating or cooling may be
caused by control/mode changes, consistently high/low
readings may indicate an underlying issue.
A couple of observations were identified in the delta
temperature profiles for further investigation. First, we
investigated the AHU’s usage in the facility due to the
strong cooling pattern. Given Ireland’s moderate climate
such patterns would not be expected. However, after
presenting this pattern to operational staff, we discovered
the unit services the factory floor. Therefore, given the
residual heat generated from equipment, the unit (i.e.
AHU9) is continually cooling the space. Second, the delta
heating pattern was unaffected when there was strong
cooling, but cooling patterns were affected by heating
surges. After discussions with maintenance personnel, we
discovered this pattern occurred due to the heating sensor
being positioned before the cooling sensor (i.e. air is cooled
after passing the heating sensor). Third, given the AHU
predominantly operates in cooling mode, identifying issues
with cooling components may be difficult.
Figure 16. Delta temperature off-coil heating and cooling
Correlation analysis was undertaken to identify relationships
in the AHU dataset, with the intention of informing feature
selection, which was predominantly based on the subject
matter expertise of the researchers. A correlation describes
the relationship between two measurements, which may be
either positive or negative. Positive correlations occur when
one variable increases or decreases, in response to an
increase or decrease in the other. Negative correlations
occur when one variable increases, in response to a decrease
in the other, or vice versa.
Figure 17 shows the correlation matrix created from the
AHU dataset. The relationships of interest were those which
correlated with heating and cooling. Without considering
special circumstances, engineering first principles indicate
deltaHeaT deltaCooT
INTERNATIONAL JOURNAL OF PROGNOSTICS AND HEALTH MANAGEMENT
16
correlations should exist between outside temperature
(outT), heating (deltaHeaT) and cooling (deltaCooT). While
outside temperature (outT) was correlated with deltaCooT, it
had no correlation with deltaHeaT. In this instance, the poor
correlation between outside temperature and heating can be
attributed to the AHU’s role, which is to continually cool
the production space, meaning heating components are less
likely to be engaged in response to outside temperature
changes. Several other negative and positive correlations
were associated with deltaCooT, all of which were assessed
and validated using subject matter expertise.
Figure 17. AHU measurement correlation matrix
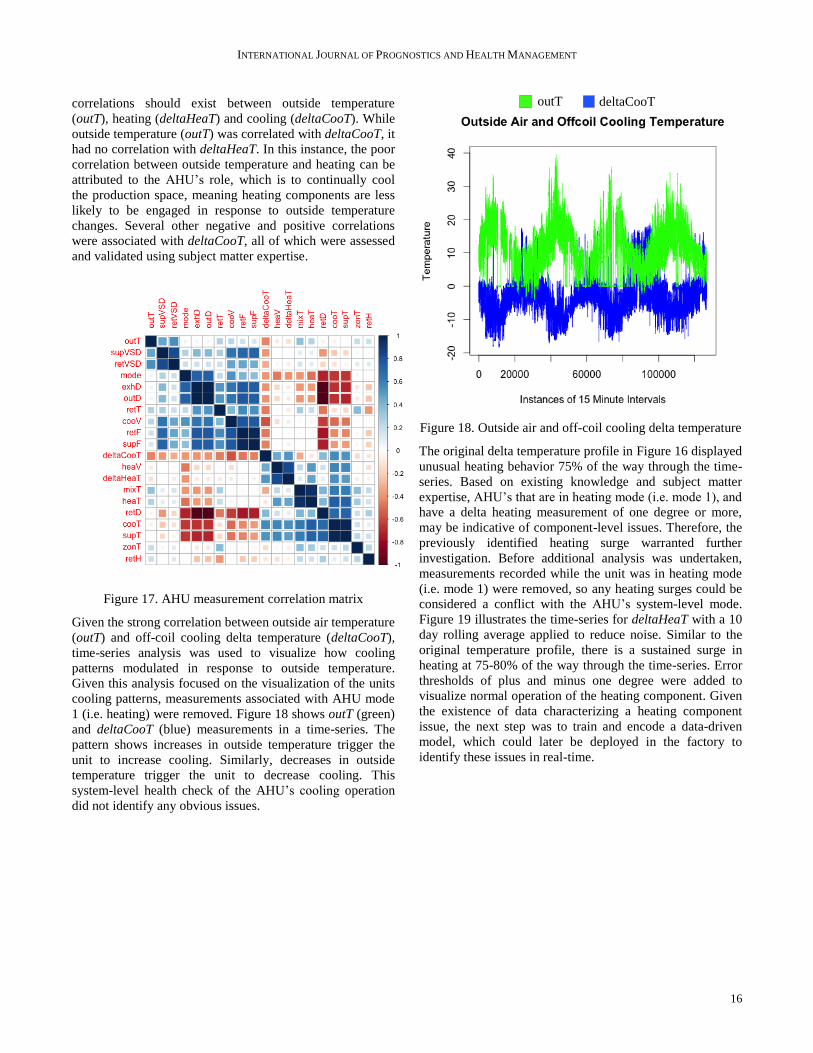
Given the strong correlation between outside air temperature
(outT) and off-coil cooling delta temperature (deltaCooT),
time-series analysis was used to visualize how cooling
patterns modulated in response to outside temperature.
Given this analysis focused on the visualization of the units
cooling patterns, measurements associated with AHU mode
1 (i.e. heating) were removed. Figure 18 shows outT (green)
and deltaCooT (blue) measurements in a time-series. The
pattern shows increases in outside temperature trigger the
unit to increase cooling. Similarly, decreases in outside
temperature trigger the unit to decrease cooling. This
system-level health check of the AHU’s cooling operation
did not identify any obvious issues.
Figure 18. Outside air and off-coil cooling delta temperature
The original delta temperature profile in Figure 16 displayed
unusual heating behavior 75% of the way through the time-
series. Based on existing knowledge and subject matter
expertise, AHU’s that are in heating mode (i.e. mode 1), and
have a delta heating measurement of one degree or more,
may be indicative of component-level issues. Therefore, the
previously identified heating surge warranted further
investigation. Before additional analysis was undertaken,
measurements recorded while the unit was in heating mode
(i.e. mode 1) were removed, so any heating surges could be
considered a conflict with the AHU’s system-level mode.
Figure 19 illustrates the time-series for deltaHeaT with a 10
day rolling average applied to reduce noise. Similar to the
original temperature profile, there is a sustained surge in
heating at 75-80% of the way through the time-series. Error
thresholds of plus and minus one degree were added to
visualize normal operation of the heating component. Given
the existence of data characterizing a heating component
issue, the next step was to train and encode a data-driven
model, which could later be deployed in the factory to
identify these issues in real-time.
outT deltaCooT

INTERNATIONAL JOURNAL OF PROGNOSTICS AND HEALTH MANAGEMENT
17
Figure 19. Delta off-coil heating 10 day moving average
The original dataset of AHU measurements contained
126,487 records at 15 minute resolution. Given most
measurements were not examples of heating component
issues, a random filtering process was applied to produce
18,979 training examples, and 8,135 test examples. Each of
these datasets contained a 70/30 split of examples with and
without heating component issues. This redistribution was
applied to increase the strength of the issue signal, with the
expectation that relevant training data would improve the
prediction performance of the model. Given the prior
experience and skillset of the authors, a Support Vector
Machine (SVM) was chosen to build a binary classification
model for heating component issue identification, which
was implemented using the E1071 package in R. To reduce
the hypothesis search space, dimensionality reduction was
applied to training and test datasets using engineering first
principles, with some verification and validation from the
correlation matrix. This resulted in the final training and test
datasets consisting solely of temperature measurements,
which was consistent with other analysis undertaken during
this study (e.g. using delta temperature measurements for
assessing AHU operation).
Figure 21 shows a screenshot of the confusion matrix
generated for the SVM model. This conveys the predictive
performance of the model, which was determined using the
available test data. The model predicted there were no issues
with 6,019 of the examples. Of these predictions, it correctly
asserted no issue 5,927 times, and incorrectly asserted no
issue 92 times. Therefore, the model correctly predicted
there were no heating issues in 98% of examples. In
addition, the model predicted there were issues in 2,116 of
examples. These predictions were correct for 2,043
examples, and incorrect for 73 examples, which means the
model correctly predicted a heating issue in 97% of
examples. The high prediction accuracy may be attributed to
large quantities of training data containing examples of the
heating issue, while the concept to be learned was simplified
by (a) restricting features to temperature measurements, and
(b) limiting prediction to binary classification.
Figure 20. SVM model performance confusion matrix
Operationalizing data-driven models in real-time enterprise
environments traditionally requires models to be interpreted
and coded using an imperative programming language, such
as C++ or Java. However, PMML is an emerging XML-
based standard that describes predictive models, which may
be interpreted and executed using compliant predictive
scoring engines. This facilitates model development using
different statistical tools and applications, while also
ensuring these models are accessible to embedded
applications in the factory. Figure 21 shows the heating
component issue identification SVM model encoded as
PMML. This markup was generated using the PMML
package in R, which supports the automatic encoding of
models built using the E1071 package. To make this model
accessible to applications in the factory, the PMML file was
published to S3 and assigned a unique URL.
Figure 21. PMML encoded predictive model
deltaHeaT

INTERNATIONAL JOURNAL OF PROGNOSTICS AND HEALTH MANAGEMENT
18
4.6. Step 6 – Operationalize Model
To enable real-time monitoring of heating components, a
PMML compliant predictive scoring engine was setup on
the cloud. This served as an endpoint for embedded
applications in the factory to transmit real-time operational
data using web services, and receive notifications of heating
component issues. The scoring engine used during this
study was OpenScoring (GitHub, 2016), which is a Java-
based engine available under the GNU Affero General
Public License (APGL). This engine was deployed on an
Amazon EC2 compute instance, and configured to use the
PMML-encoded SVM model residing on S3.
Figure 22 illustrates the sequential interactions of the real-
time monitoring process. First, an embedded application on
a networked computer polls the relevant PLC to retrieve the
AHU’s current operating measurements. Second, these
measurements are transmitted to the OpenScoring web
service to serve as input for the issue identification model.
Third, the scoring engine retrieves the PMML-encoded
SVM model from S3, and predicts whether an issue exists
from the input data provided. Finally, the scoring engine
returns a result to the embedded application with zero-or-
more issues (i.e. empty array indicates no issues). These
interactions could be extended to include other systems and
processes, such as the propagation of identified faults to
maintenance and health monitoring systems, but these were
not of primary importance to this study.
Figure 22 Sequence diagram for embedded operations
Given the exploratory nature of this research, an OPC
simulator (MatrikonOPC, 2016) was used as a surrogate for
production PLC’s to avoid any potential interference with
factory operations. The simulator was deployed on the BMS
PC and configured to use the AHU conventions presented in
Table 5. This simulator was polled at 60 second intervals by
a C# .NET background application to acquire current
operating measurements, which were transmitted to the
OpenScoring engine for evaluation. Where the scoring
engine response included an identified issue, the
background application recorded the timestamp and all
sensor measurements for that point in time, as well as the
identified issue (i.e. heating component). The background
application was programmed to terminate after logging 20
issues to enable engineers on-site to manually evaluate the
predictions. This manual evaluation process was undertaken
over a 7 day period, where 140 predictions were logged by
the background application, with 100% of these predictions
determined as correct, based on engineering first principles
relating to AHU diagnostics (Bruton et al., 2014).
5. DISCUSSION
The following section discusses findings from the case
study. These findings are discussed in the context of the
roles and responsibilities from the industrial analytics
methodology. These roles are (1) Data Integration and
Management, and (2) Model Building and Deployment.
5.1. Data Integration and Management
Data ingestion was implemented and tested on two different
computing environments. In both cases, ingesting the BMS
archive of 838 log files, with up to 4 years of data, took
between 10 and 39 minutes. Differences in these execution
times were broadly attributed to differing hardware
specifications (e.g. solid state drive and greater processing
power), active background processes, and available upload
bandwidth. However, these findings demonstrated the
impact technologies and infrastructure may have on factory-
to-cloud data integration.
Enterprise development technologies (e.g. C# .NET, J2EE
etc.) were used for data ingestion. Given the adequate
performance of the ingestion process, there does not appear
to be an immediate need to investigate other tools, such as
those associated with Big Data. Results indicated hardware
specification and bandwidth impacted ingestion execution
time, with a mid-range development PC completing the
process three times faster than an older BMS PC. However,
as facilities progress towards smart manufacturing, an
increase in sensing technologies, coupled with an increase in
measurement resolution, will inevitably place more stress on
ingestion processes. To address these scaling and
performance challenges, ingestion processes may (a)
horizontally scale by deploying processes across multiple
computers, (b) vertically scale by increasing hardware
specification, (c) increase upload bandwidth capacity, or (d)
optimize multithreading to leverage parallelism.
The energy data collected from the factory highlighted
potential peculiarities in proprietary data sources. Such data
is not analytics-ready and requires complex processing to
present it in a useful form. While ad hoc scripts could have
been used to reshape the energy data, without formal
processes to create, share and reuse these workflows, there
is an inherent risk of duplicating time-consuming data
processing tasks. Given data cleaning and transformation
consumes much of the effort in analytics projects, while
providing the lowest immediate value, facilities developing
industrial analytics capabilities for smart manufacturing

INTERNATIONAL JOURNAL OF PROGNOSTICS AND HEALTH MANAGEMENT
19
should develop formal methods and architectures to
standardize and automate these processes.
The implementation of a formal multistage workflow for
preparing industrial time-series data was presented in this
research. This workflow used scalable and interchangeable
cloud-based data processing modules to transform AHU
data to an analytics-ready state. In addition, the multistage
aspect of the workflow demonstrated how exposing outputs
at each processing stage may facilitate reusability, while
potentially reducing duplicated effort. Such an approach
contrasts with input/output workflows, whereby stepwise
transformations are encapsulated and inaccessible post-
execution. To illustrate the reuse potential of the multistage
workflow, consider a scenario where a workflow is designed
to output AHU data as a daily average for an analytics
project. In the future, another analytics project needs access
to the same data but at its original resolution (e.g. 15 minute
intervals). Where outputs from multistage workflows are
accessible, the original data may be acquired from an earlier
stage in the existing workflow, without undertaking
additional data integration and cleaning.
5.2. Model Building and Deployment
Turnkey analytics was demonstrated using a simple issue
identification scenario for AHU heating components. Data
exploration and modeling activities were undertaken using
RStudio, with HTTP used to acquire analytics-ready data
from the AHU workflow, which served to reduce common
data processing overheads. Where similar data management
and governance strategies do not facilitate seamless
analytics pipelines, data processing overheads are likely to
impede analytics outputs and productivity. The analytics-
ready AHU data from the workflow was used to train an
SVM model to identify heating component issues, and
encoded using XML-based PMML markup to promote
interoperability and enable model deployment. While
discussions regarding standards are prevalent in Operation
and Information Technology, this research also highlights
the importance and usefulness of open non-proprietary
standards in analytics pipelines and processes.
Operationalizing and embedding analytics is central to smart
manufacturing. While data analytics and business
intelligence activities can derive useful insights, their true
impact may not be known until they can affect real-time
decision-making in the factory. Therefore, facilities should
appreciate the differences between model development and
deployment, and data architectures that support both use
cases (i.e. industrial analytics lifecycle). Model deployment
in this research used a cloud-based scoring engine, which
linked to the previous created PMML model. This real-time
deployment was demonstrated using a purpose-built
background application, which continuously acquired AHU
measurements from an OPC simulator, and collaborated
with the PMML compliant scoring engine to determine the
AHU state. The issues identified by the embedded analytics
application over a 7 day period were manually evaluated by
engineers to ensure the technical integrity of the
implementation, comprising real-time factory-to-cloud data
exchange, and execution of the issue identification
predictive model.
6. CONCLUSIONS
Data-driven operations for smart manufacturing are highly
dependent on the availability of industrial analytics
capabilities. However, developing these capabilities can be
challenging due to the lack of formal and systematic
approaches that inform their development. While ad hoc
strategies can deliver some benefits, they may also exhibit
duplicated effort and inefficient execution, resulting in less
impact on operational performance. Industrial analytics is a
multi-faceted topic that encompasses aspects of operation
technology, information technology, statistics, engineering,
and informatics. Given the multidisciplinary nature of
industrial analytics, coupled with the diverse technologies
and standards that may exist from factory-to-factory, highly
prescriptive industrial analytics methodologies and
frameworks are not plausible. Instead, facilities should use
formal methodologies to support the development of
industrial analytics lifecycles, which facilitate the
operationalization of analytics models in the factory, while
using technologies and standards aligned with their
resources and environment.
Thus, an industrial analytics methodology for developing
industrial analytics capabilities was presented in this
research. The methodology provides formal heuristics for
developing teams, architectures and processes that form an
industrial analytics lifecycle, while illustrating the
technology convergences that occur. This methodology was
demonstrated and validated using a case study focusing on a
real-world issue identification scenario. The findings and
observations compiled during the study highlighted several
important points. Firstly, while analytics models deliver
operational insights, robust and scalable information and
data architectures are needed to support their development
and deployment. Secondly, given the technology and
analytics convergences that occur in the industrial analytics
lifecycle, there is a significant need to adopt standards that
facilitate interoperability and integration. Finally, industrial
analytics can be delineated from traditional data analytics by
the emphasis placed on affecting real-time decision-making
in the factory. Where analytics outputs are not embedded in
factory operations, the return on investment from analytics
initiatives may be diminished.
ACKNOWLEDGEMENT
The authors would like to thank the Irish Research Council,
DePuy Ireland for their funding of this research as part of
the Enterprise Partnership Scheme (EPSPG/2013/578).

INTERNATIONAL JOURNAL OF PROGNOSTICS AND HEALTH MANAGEMENT
20
REFERENCES
Al-jaroodi, J., & Mohamed, N. (2012). Journal of Network
and Computer Applications Service-oriented
middleware : A survey. Journal of Network and
Computer Applications, 35(1), 211–220.
doi:10.1016/j.jnca.2011.07.013
Alves Santos, R., Normey-Rico, J. E., Merino Gómez, A.,
Acebes Arconada, L. F., & de Prada Moraga, C.
(2005). OPC based distributed real time simulation of
complex continuous processes. Simulation Modelling
Practice and Theory, 13(7), 525–549.
doi:10.1016/j.simpat.2005.01.005
Bagheri, B., Yang, S., Kao, H., & Lee, J. (2015). Cyber-
physical Systems Architecture for Self-Aware
Machines in Industry 4 . 0 Environment. IFAC
PapersOnLine, 1622–1627.
doi:10.1016/j.ifacol.2015.06.318
Brandl, D. (2008). What is ISA-95 ? Industrial Best
Practices of Manufacturing Information Technologies
with ISA-95 Models, 1–32.
Bruton, K., Raftery, P., O’Donovan, P., Aughney, N.,
Keane, M. M., & O’Sullivan, D. T. J. (2014).
Development and alpha testing of a cloud based
automated fault detection and diagnosis tool for Air
Handling Units. Automation in Construction, 39(0),
70–83. doi:10.1016/j.autcon.2013.12.006
Cardiel, I. A., Gil, R. H., Somolinos, C. C., & Somolinos, J.
C. (2012). Expert Systems with Applications A
SCADA oriented middleware for RFID technology.
Expert Systems With Applications, 39(12), 11115–
11124. doi:10.1016/j.eswa.2012.03.045
Chand, S., & Davis, J. (2010). What is Smart
Manufacturing ? Time Magazine.
Chungoora, N., Young, R. I., Gunendran, G., Palmer, C.,
Usman, Z., Anjum, N. a., … Case, K. (2013). A
model-driven ontology approach for manufacturing
system interoperability and knowledge sharing.
Computers in Industry, 64(4), 392–401.
doi:10.1016/j.compind.2013.01.003
Data Mining Group. (2016). PMML 4.3. Data Mining
Group. Retrieved from http://dmg.org/pmml/v4-
3/GeneralStructure.html
Davis, J., Edgar, T., Porter, J., Bernaden, J., & Sarli, M.
(2012). Smart manufacturing, manufacturing
intelligence and demand-dynamic performance.
Computers & Chemical Engineering, 47, 145–156.
doi:10.1016/j.compchemeng.2012.06.037
Dworschak, B., & Zaiser, H. (2014). Competences for
cyber-physical systems in manufacturing – first
findings and scenarios. Procedia CIRP, 25, 345–350.
doi:10.1016/j.procir.2014.10.048
Emerson, D., Kawamura, H., & Matthews, W. (2007).
Plant-to-business interoperability using the ISA-95
standard.
Fosso Wamba, S., Akter, S., Edwards, A., Chopin, G., &
Gnanzou, D. (2015). How “big data” can make big
impact: Findings from a systematic review and a
longitudinal case study. International Journal of
Production Economics, 1–13.
doi:10.1016/j.ijpe.2014.12.031
Giovannini, A., Aubry, A., Panetto, H., Dassisti, M., & El
Haouzi, H. (2012). Ontology-based system for
supporting manufacturing sustainability. Annual
Reviews in Control, 36(2), 309–317.
doi:10.1016/j.arcontrol.2012.09.012
GitHub. (2016). OpenScoring. Retrieved from
https://github.com/jpmml/openscoring
Gligor, A., & Turc, T. (2012). Development of a Service
Oriented SCADA System. Procedia Economics and
Finance, 3(12), 256–261. doi:10.1016/S2212-
5671(12)00149-9
Hazen, B. T., Boone, C. a., Ezell, J. D., & Jones-Farmer, L.
A. (2014). Data quality for data science, predictive
analytics, and big data in supply chain management:
An introduction to the problem and suggestions for
research and applications. International Journal of
Production Economics, 154, 72–80.
doi:10.1016/j.ijpe.2014.04.018
Heng, S. (2014). Industry 4.0: Huge potential for value
creation waiting to be tapped. Deutsche Bank
Research. Retrieved from
http://www.dbresearch.com/servlet/reweb2.ReWEB?r
wsite=DBR_INTERNET_EN-
PROD&rwobj=ReDisplay.Start.class&document=PR
OD0000000000335628
Hong, X., & Jianhua, W. (2006). Using standard
components in automation industry: A study on OPC
Specification. Computer Standards & Interfaces,
28(4), 386–395. doi:10.1016/j.csi.2005.05.001
ISA. (2016a). ISA-88. Retrieved from http://www.isa-
88.com
ISA. (2016b). ISA-95. Retrieved from http://www.isa-
95.com
Jedliński, Ł., & Jonak, J. (2015). Early fault detection in
gearboxes based on support vector machines and
multilayer perceptron with a continuous wavelet
transform. Applied Soft Computing, 30, 636–641.
doi:10.1016/j.asoc.2015.02.015
Kastner, W., Neugschwandtner, G., Soucek, S., & Newman,
H. M. (2005). Communication Systems for Building
Automation and Control, 93(6).
Kumar, P., Dhruv, B., Rawat, S., & Rathore, V. S. (2014).
Present and future access methodologies of big data.
International Journal of Advance Research in Science
and Engineering, 8354(3), 541–547.
Lee, J. (2014). Recent Advances and Transformation
Direction of PHM. NIST. Retrieved August 3, 2015,
from
http://www.nist.gov/el/isd/upload/Keynote_Lee_IMS-
University_of_Cincinnati_updated.pdf
Lee, J., Ardakani, H. D., Yang, S., & Bagheri, B. (2015).

INTERNATIONAL JOURNAL OF PROGNOSTICS AND HEALTH MANAGEMENT
21
Industrial Big Data Analytics and Cyber-physical
Systems for Future Maintenance & Service
Innovation. Procedia CIRP, 38, 3–7.
doi:10.1016/j.procir.2015.08.026
Lee, J., Bagheri, B., & Kao, H. (2015). A Cyber-Physical
Systems architecture for Industry 4.0-based
manufacturing systems. Manufacturing Letters,
3(September 2015), 18–23.
doi:10.1016/j.mfglet.2014.12.001
Lee, J., Kao, H.-A. A., & Yang, S. (2014). Service
Innovation and Smart Analytics for Industry 4.0 and
Big Data Environment. Procedia CIRP, 16, 3–8.
doi:10.1016/j.procir.2014.02.001
Lee, J., Lapira, E., Bagheri, B., & Kao, H. (2013). Recent
advances and trends in predictive manufacturing
systems in big data environment. Manufacturing
Letters, 1(1), 38–41.
doi:10.1016/j.mfglet.2013.09.005
Manufacturing, S., Manufacturing, C. S., Coalition, L.,
Smart, T., Leadership, M., Incorporated, E., … Any,
D. (2011). Implementing 21st Century Smart
Manufacturing.
MatrikonOPC. (2016). MatrikonOPC Simulation Server.
Retrieved from
https://www.matrikonopc.com/products/opc-
drivers/opc-simulation-server.aspx
McKinsey. (2011). Big data : The next frontier for
innovation , competition , and productivity.
Nagorny, K., Colombo, A. W., & Schmidtmann, U. (2012).
A service and multi-agent-oriented manufacturing
automation architecture. Computers in Industry, 63(8),
813–823. doi:10.1016/j.compind.2012.08.003
O’Donovan, P., Leahy, K., Bruton, K., & O’Sullivan, D. T.
J. (2015). An industrial big data pipeline for data-
driven analytics maintenance applications in large-
scale smart manufacturing facilities. Journal of Big
Data, 2(1), 25. doi:10.1186/s40537-015-0034-z
O’Donovan, P., Leahy, K., Bruton, K., & O’Sullivan, D. T.
J. (2015). Big data in manufacturing: a systematic
mapping study. Journal of Big Data, 2(1), 20.
doi:10.1186/s40537-015-0028-x
Philip Chen, C. L., & Zhang, C.-Y. (2014). Data-intensive
applications, challenges, techniques and technologies:
A survey on Big Data. Information Sciences, 275,
314–347. doi:10.1016/j.ins.2014.01.015
Reinisch, C., Granzer, W., Praus, F., & Kastner, W. (2008).
Integration of heterogeneous building automation
systems using ontologies. 2008 34th Annual
Conference of IEEE Industrial Electronics, 2736–
2741. doi:10.1109/IECON.2008.4758391
Samad, T., & Frank, B. (2007). Leveraging the web: a
universal framework for building automation. In
Proceedings of the 2007 American Control
Conference.
Scholten, B. (2007). Integrating ISA-88 and ISA-95. In ISA
Expo (pp. 2–4).
Sharma, P., & Sharma, M. (2014). Artificial Intelligence in
Advance Manufacturing Technology-A Review Paper
on Current Application. International Journal of
Engineering, Management & Sciences, 1(1), 4–7.
Vera-baquero, A., Colomo-palacios, R., & Molloy, O.
(2014). Towards a process to guide Big Data based
Decision Support Systems for Business Processes. In
Conference on ENTERprise Information Systems
Towards (Vol. 00).
Vincent Wang, X., & Xu, X. W. (2013). An interoperable
solution for Cloud manufacturing. Robotics and
Computer-Integrated Manufacturing, 29(4), 232–247.
doi:10.1016/j.rcim.2013.01.005
Weiss, B. A., & Donmez, M. A. (2014). Standards Related
to Prognostics and Health Management (PHM ) for
Manufacturing Standards Related to Prognostics and
Health Management (PHM ) for Manufacturing. In
Annual Conference of the Prognostics and Health
Management Society. doi:10.6028/NIST.IR.8012
Wright, P. (2014). Cyber-physical product manufacturing.
Manufacturing Letters, 2(2), 49–53.
doi:10.1016/j.mfglet.2013.10.001
Wu, D., Greer, M. J., Rosen, D. W., & Schaefer, D. (2013).
Cloud manufacturing: Strategic vision and state-of-
the-art. Journal of Manufacturing Systems, 32(4),
564–579. doi:10.1016/j.jmsy.2013.04.008
Xu, X. (2012). From cloud computing to cloud
manufacturing. Robotics and Computer-Integrated
Manufacturing, 28(1), 75–86.
doi:10.1016/j.rcim.2011.07.002
Zuehlke, D. (2010). SmartFactory—Towards a factory-of-
things. Annual Reviews in Control, 34(1), 129–138.
doi:10.1016/j.arcontrol.2010.02.008

INTERNATIONAL JOURNAL OF PROGNOSTICS AND HEALTH MANAGEMENT
22
APPENDIX A
Abbreviation Description
AHU Air Handling Unit
AWS Amazon Web Services
BMS Building Management System
CPS Cyber Physical Systems
EC2 Elastic Cloud Compute
HTTP Hypertext Transfer Protocol
IT Information Technology
OPC OLE Process Control
OT Operation Technology
PC Personal Computer
PLC Programmable Logic Controller
PMML Predictive Modeling Markup Language
REST Representational State Transfer
S3 Simple Storage Service
SOA Service Oriented Architecture
SOAP Simple Object Access Protocol
SQS Simple Queue Service
SVM Support Vector Machine