case-study on dubai monitoring programme
TRANSCRIPT
A Case Study Documenting the Dubai Coastal Zone Monitoring
Programme – An International Example.
prepared in the framework of the MESSINA project
December 2005
Project part-financed by the European Union (European Regional Development Fund)
within the INTERREG IIIC Programme
2
1. INTRODUCTION A comprehensive coastal monitoring programme has been set up for the Dubai coastal
zone following extensive infra-structural development over the last 20 years. The Dubai
coastal zone, and in particular the Jumeirah frontage, has been identified as a key
element in the expected dramatic expansion of tourism to the region. Considered
together with an expected 300% increase in population within the next 20 years, it is
likely that the coastal resource will be under tremendous pressure (Smit, F. et al, 2003).
The Dubai Municipality has long since recognised that along with the desire to live and
work by the sea comes the difficulties of working with the dynamic forces of nature and,
increasingly, the requirement to consider the natural environment (www.dubaicoast.org).
As such, an Integrated Coastal Zone Management approach has been adopted in order
to provide a good understanding of prevailing coastal processes in order to recommend
optimum development approaches whilst still maintaining protection for vulnerable
areas.
Previous monitoring data has been collected on an ad-hoc or a scheme-by-scheme
basis. However, the need exists to capture coastal data in a more systematic manner to
enable coastal planners and others to develop a full understanding of environmental
conditions and how coastal developments will affect this process (www.dubaicoast.org).
The initial monitoring programme began in 1997 with bathymetric and topographic
baseline surveys being carried out. In addition to this, a directional wave rider buoy was
deployed to provide information on nearshore wave activity. Subsequent surveys were
carried out regularly over the following years up until 2002 when the monitoring
programme was considerably expanded to include whole extent of the Dubai coast, from
Al Mamzar Lagoon in the north to the Jebel Ali coast in the south.
The Dubai Coastal Zone Monitoring Programme utilises leading edge technology to
assist Dubai Municipality with its management role in ICZM. The current initiative by the
Municipality aims to build upon the existing data sets using industry recognised
techniques, and will provide information required for the further development of its
existing coastal zone management capability (www.dubaicoast.org).
3
2. GEOGRAPHICAL OUTLINE
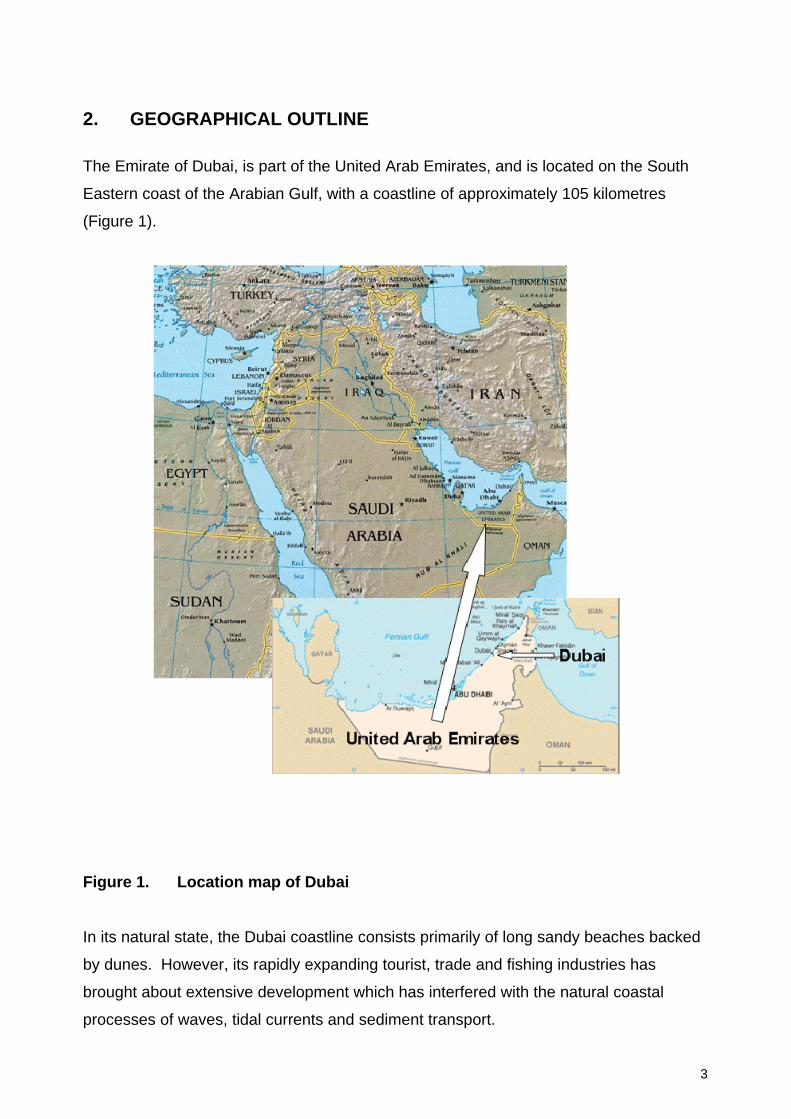
The Emirate of Dubai, is part of the United Arab Emirates, and is located on the South
Eastern coast of the Arabian Gulf, with a coastline of approximately 105 kilometres
(Figure 1).
Figure 1. Location map of Dubai
In its natural state, the Dubai coastline consists primarily of long sandy beaches backed
by dunes. However, its rapidly expanding tourist, trade and fishing industries has
brought about extensive development which has interfered with the natural coastal
processes of waves, tidal currents and sediment transport.
4
3. COASTAL ZONE MONITORING
The Dubai coastal monitoring programme began in 1997 when a baseline bathymetric
and topographic survey of the Jumeirah coastline was undertaken. Additional data is
now collected to supplement the original programme of measurements. Features of the
current monitoring programme include regular topographic and bathymetric surveys,
remote video monitoring of Dubai beaches, sediment sampling and analysis, nearshore
directional wave and current recordings and intensive measurement exercises at
selected locations using Acoustic Doppler Current Profiler (ADCP) equipment.
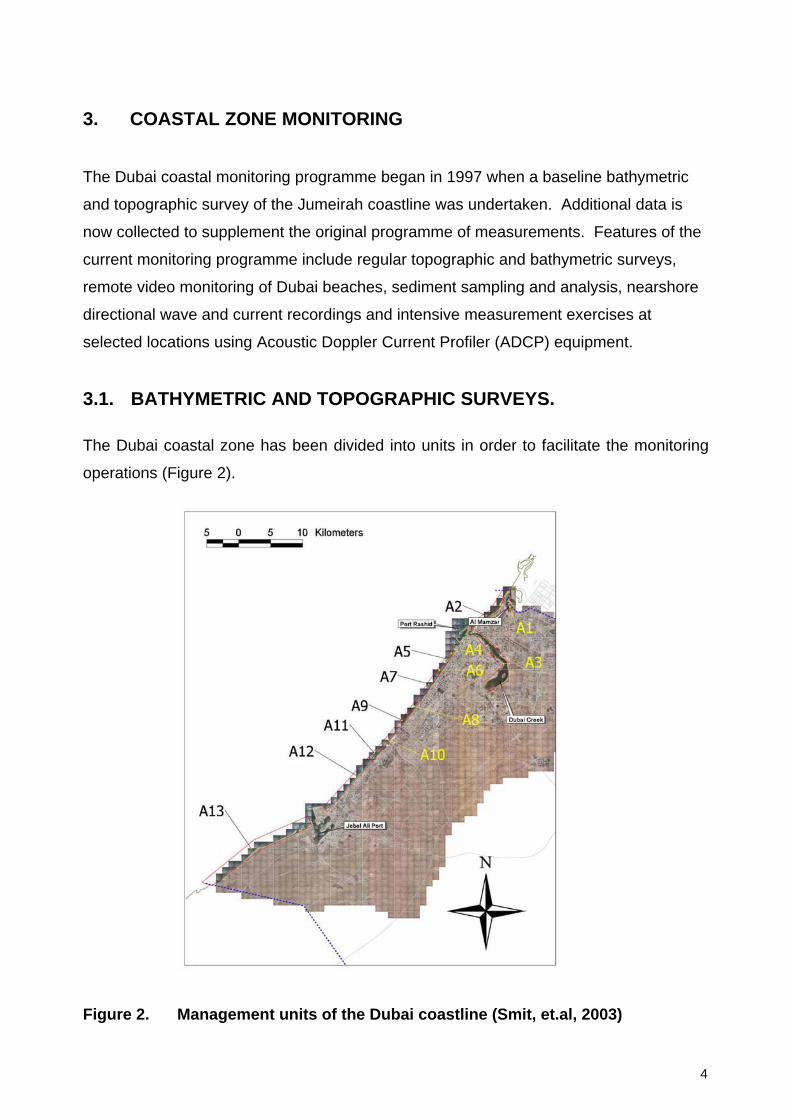
3.1. BATHYMETRIC AND TOPOGRAPHIC SURVEYS. The Dubai coastal zone has been divided into units in order to facilitate the monitoring
operations (Figure 2).
Figure 2. Management units of the Dubai coastline (Smit, et.al, 2003)
5
The frequency of surveys is decided on a risk-based approach, whereby those areas
perceived to be at a greater threat from coastal erosion or inundation, are monitored
more frequently than those seen to be less at risk. This risk assessment is reviewed on
an annual basis in order to ensure the correct level of monitoring is being carried out
within each unit.
The bathymetric survey element of the project involves full coverage of a 500m wide
band along the entire coastline, with survey lines running perpendicular to the coast at
25m line spacings. Data is collected along pre-determined profile lines using a dual
frequency echo sounder combined with the use of differential GPS in order to help
position the survey vessel. Areas of particular interest or concern are resurveyed as
and when necessary to monitor changes over time. Comparisons between survey data
sets assist in substantiating the existing understanding of the sediment budget and
transport processes along the Dubai coastline (www.dubaicoast.org).
Topographic surveys are carried out using a pre-defined set of profiles that run
perpendicular to the shoreline down to mean water level +1.13m DMD (Dubai
Municipality Datum). Scatter point surveys are also undertaken at 10 locations along the
Dubai coast in order to produce a contour map of the beach by entering spot height data
into a digital terrain model (DTM). Data is collected via RTK GPS (Real-Time Kinematic
Geographical Positioning System), which allows for positional accuracies of up to 20mm
to be recorded. A network of ground markers known as control points allows for all RTK
points to be checked against a reference level in order to improve the quality control of
the data.
3.2 NEARSHORE WAVE MEASUREMENTS
The Dubai Municipality has recorded directional wave information from January 1997 to
February 2001 at a nearshore position just north of Jebel Ali Port in about 6 m water
depth. Since 2002 an 1200 kHz ADCP with pressure sensor has been deployed at the
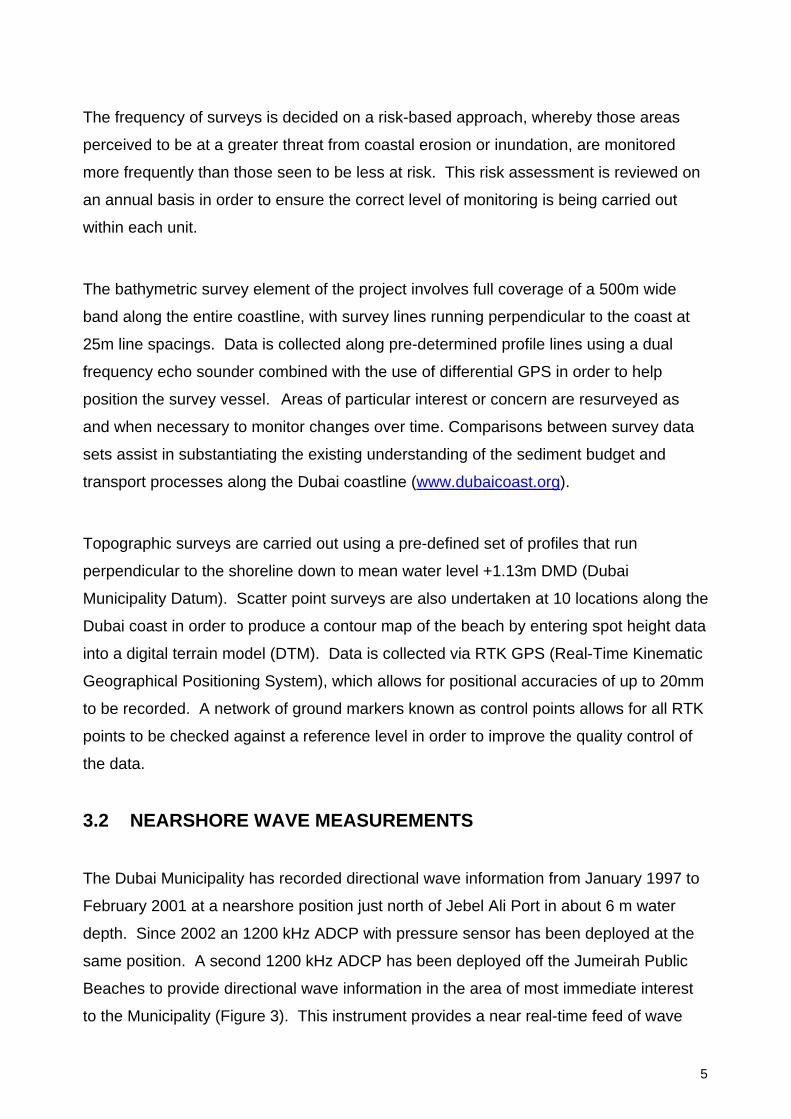
same position. A second 1200 kHz ADCP has been deployed off the Jumeirah Public
Beaches to provide directional wave information in the area of most immediate interest
to the Municipality (Figure 3). This instrument provides a near real-time feed of wave
6
information to the Municipality offices as well as being made available to the general
public on-line. The instrument measures currents throughout the water column using
the return echo of an acoustic signal transmitted by the instrument (Smit, et.al, 2003).
A pressure sensor was also installed behind the northern arm of the T breakwater to
provide information on water levels within the sheltered embayment. Variations in water
depth (pressure head) induce corresponding resistivity readings in a piezo-electric
device in the instrument. The value of resistance measured is proportional to the depth
of water (www.dubaicoast.org). The data is used to gain an understanding of the
hydrodynamic processes occurring along the coast, to calibrate and verify hydrodynamic
models as well as to assess bather safety concerns. Over time, as a longer-term record
is gathered, these will serve to update nearshore design wave and water level conditions
for Dubai (Smit, et.al, 2003).
Figure 3. Location of nearshore wave gauges (Smit, et.al, 2003).
3.3 VIDEO MONITORING
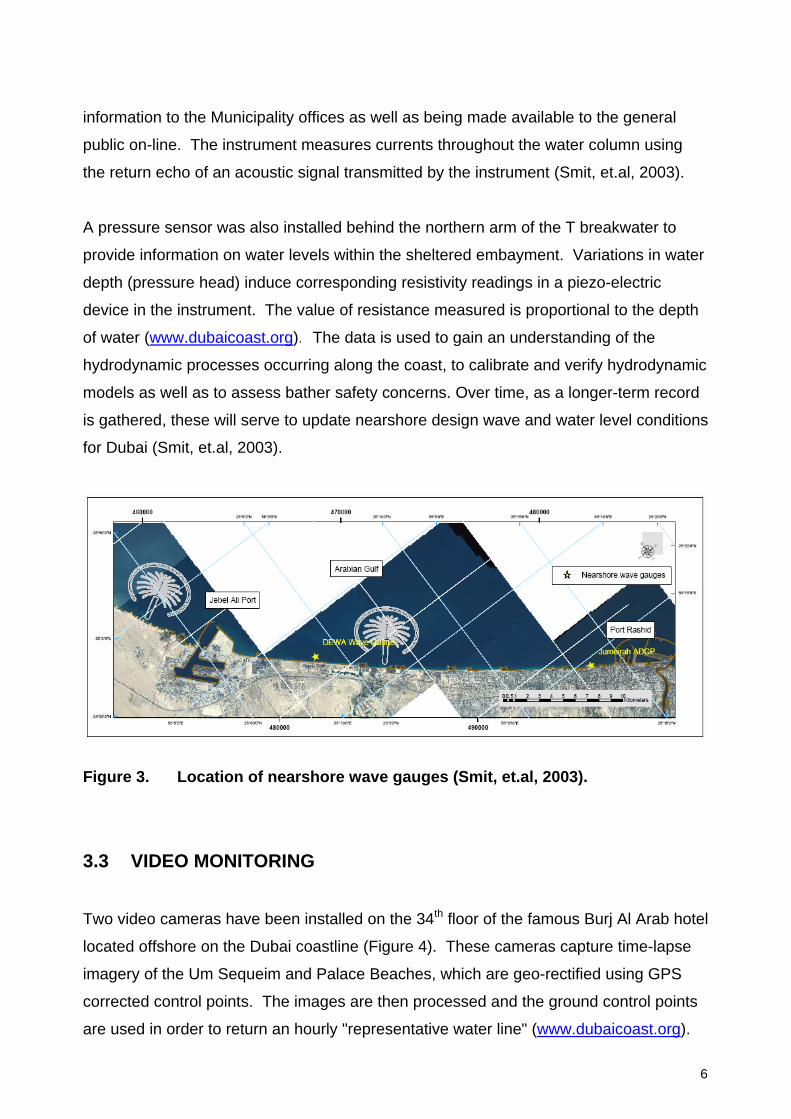
Two video cameras have been installed on the 34th floor of the famous Burj Al Arab hotel
located offshore on the Dubai coastline (Figure 4). These cameras capture time-lapse
imagery of the Um Sequeim and Palace Beaches, which are geo-rectified using GPS
corrected control points. The images are then processed and the ground control points
are used in order to return an hourly "representative water line" (www.dubaicoast.org).
7
Figure 4. Aerial view of the Burj Al Arab Hotel Analysis of data collected by the video camera has, until now, been used simply as a
verification tool to compare extracted water levels from the images against real-time
survey data. With verification complete, focus will now shift towards detailed analysis of
water levels for the year’s worth of images collected, the translation of these into profile
dynamics and an investigation into bar dynamics and the extraction of nearshore current
patterns using cross-image correlation (Smit, et.al, 2003).
3.4 METEOROLOGICAL DATA
A meteorological station has been installed at the Jumeirah Open Beach to provide
additional information on wind speed and direction, barometric pressure and air
temperature (Smit, et.al, 2003). The monitoring station is controlled and managed
automatically by a custom built software package “EDEMS” (EmuDome Dubai
Environmental Monitoring System) (www.dubaicoast.org). EDEMS allows real time data
to be viewed by the client and project team and summary data to be processed and
relayed to the project web site.
8
3.5. SEDIMENT SAMPLING
Sediment samples were collected during the initial data collection exercise in 1997 along
all the Dubai beaches and in the nearshore zone. A limited sample gathering exercise
has been undertaken to update this information. Samples are analyzed with regard to
grain size and fall velocity and provide input to the coastline evolution, sediment
transport and morphological models set up for the region (Smit, et.al, 2003).
9
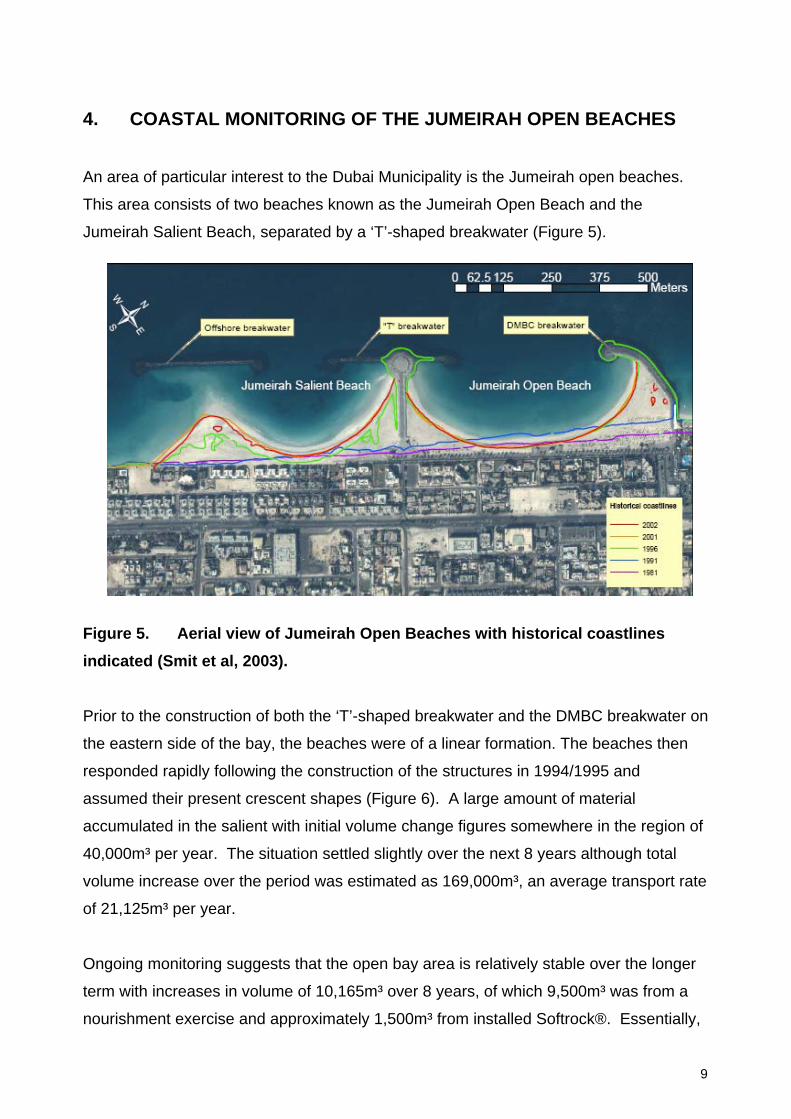
4. COASTAL MONITORING OF THE JUMEIRAH OPEN BEACHES
An area of particular interest to the Dubai Municipality is the Jumeirah open beaches.
This area consists of two beaches known as the Jumeirah Open Beach and the
Jumeirah Salient Beach, separated by a ‘T’-shaped breakwater (Figure 5).
Figure 5. Aerial view of Jumeirah Open Beaches with historical coastlines indicated (Smit et al, 2003). Prior to the construction of both the ‘T’-shaped breakwater and the DMBC breakwater on
the eastern side of the bay, the beaches were of a linear formation. The beaches then
responded rapidly following the construction of the structures in 1994/1995 and
assumed their present crescent shapes (Figure 6). A large amount of material
accumulated in the salient with initial volume change figures somewhere in the region of
40,000m³ per year. The situation settled slightly over the next 8 years although total
volume increase over the period was estimated as 169,000m³, an average transport rate
of 21,125m³ per year.
Ongoing monitoring suggests that the open bay area is relatively stable over the longer
term with increases in volume of 10,165m³ over 8 years, of which 9,500m³ was from a
nourishment exercise and approximately 1,500m³ from installed Softrock®. Essentially,
10
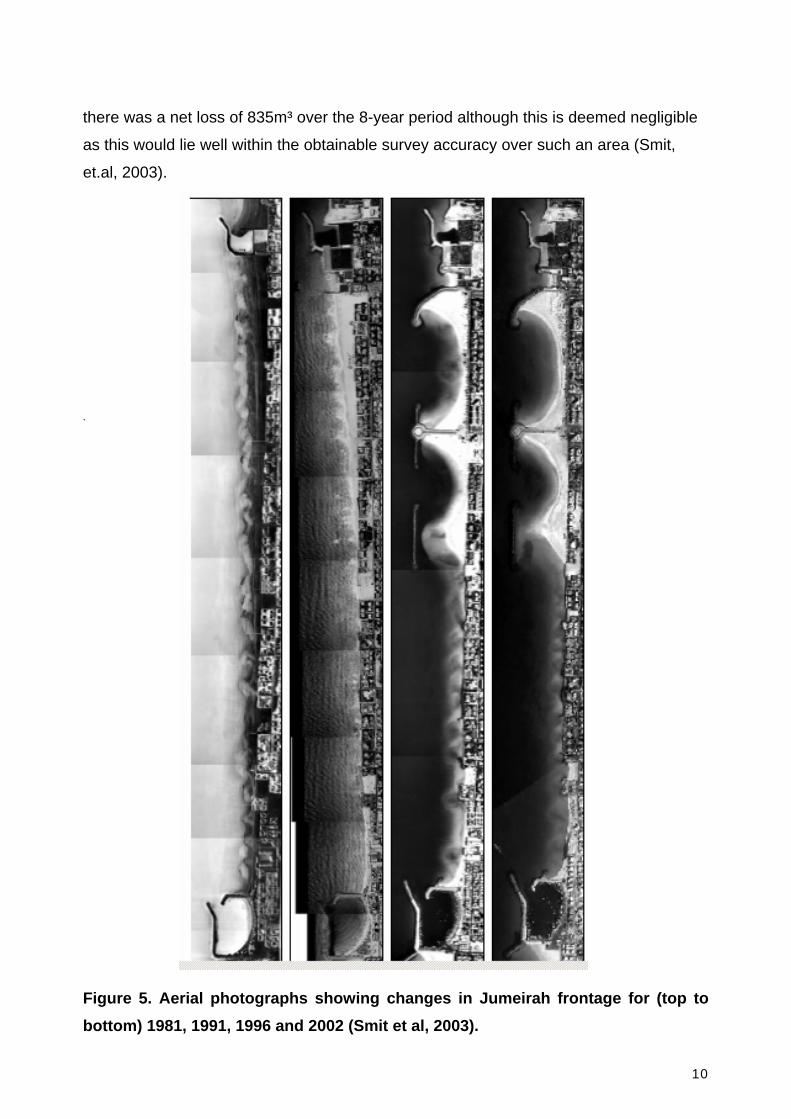
there was a net loss of 835m³ over the 8-year period although this is deemed negligible
as this would lie well within the obtainable survey accuracy over such an area (Smit,
et.al, 2003).
.
Figure 5. Aerial photographs showing changes in Jumeirah frontage for (top to bottom) 1981, 1991, 1996 and 2002 (Smit et al, 2003).
11
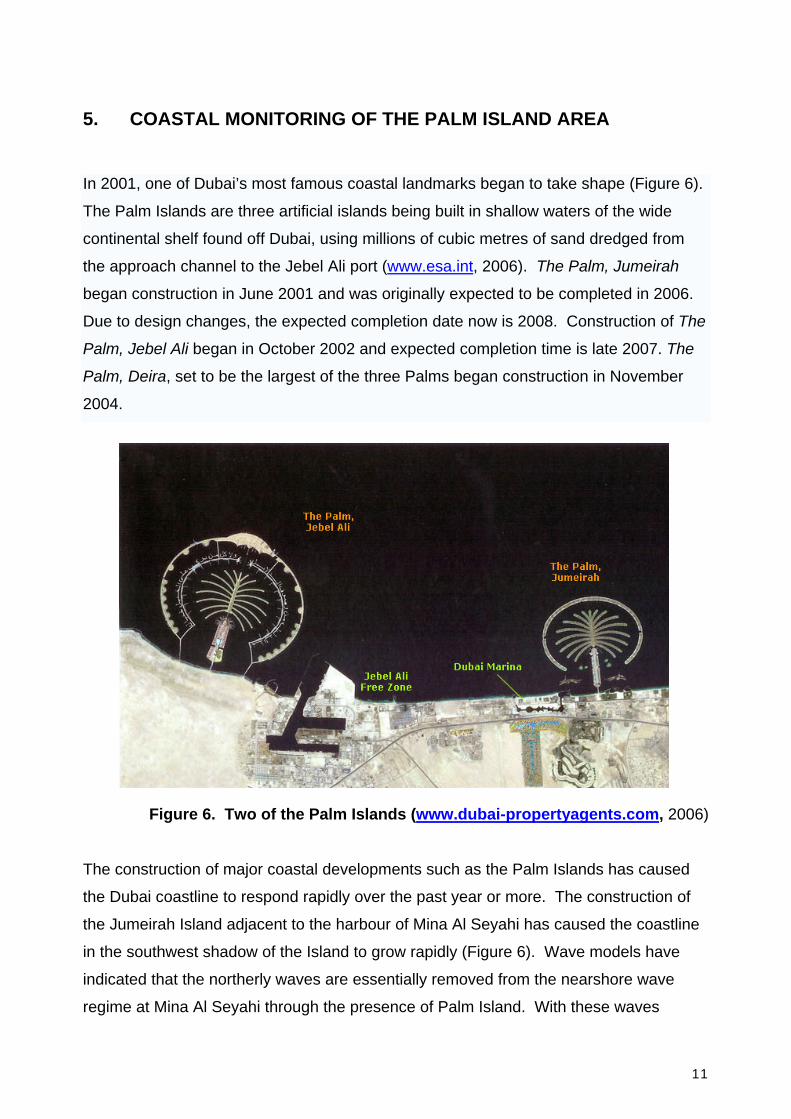
5. COASTAL MONITORING OF THE PALM ISLAND AREA
In 2001, one of Dubai’s most famous coastal landmarks began to take shape (Figure 6).
The Palm Islands are three artificial islands being built in shallow waters of the wide
continental shelf found off Dubai, using millions of cubic metres of sand dredged from
the approach channel to the Jebel Ali port (www.esa.int, 2006). The Palm, Jumeirah
began construction in June 2001 and was originally expected to be completed in 2006.
Due to design changes, the expected completion date now is 2008. Construction of The
Palm, Jebel Ali began in October 2002 and expected completion time is late 2007. The
Palm, Deira, set to be the largest of the three Palms began construction in November
2004.
Figure 6. Two of the Palm Islands (www.dubai-propertyagents.com, 2006)
The construction of major coastal developments such as the Palm Islands has caused
the Dubai coastline to respond rapidly over the past year or more. The construction of
the Jumeirah Island adjacent to the harbour of Mina Al Seyahi has caused the coastline
in the southwest shadow of the Island to grow rapidly (Figure 6). Wave models have
indicated that the northerly waves are essentially removed from the nearshore wave
regime at Mina Al Seyahi through the presence of Palm Island. With these waves
12
removed the north-eastward directed net transport rate increased and the rapid build-up
of the coastline occurred (Smit, et.al, 2003).
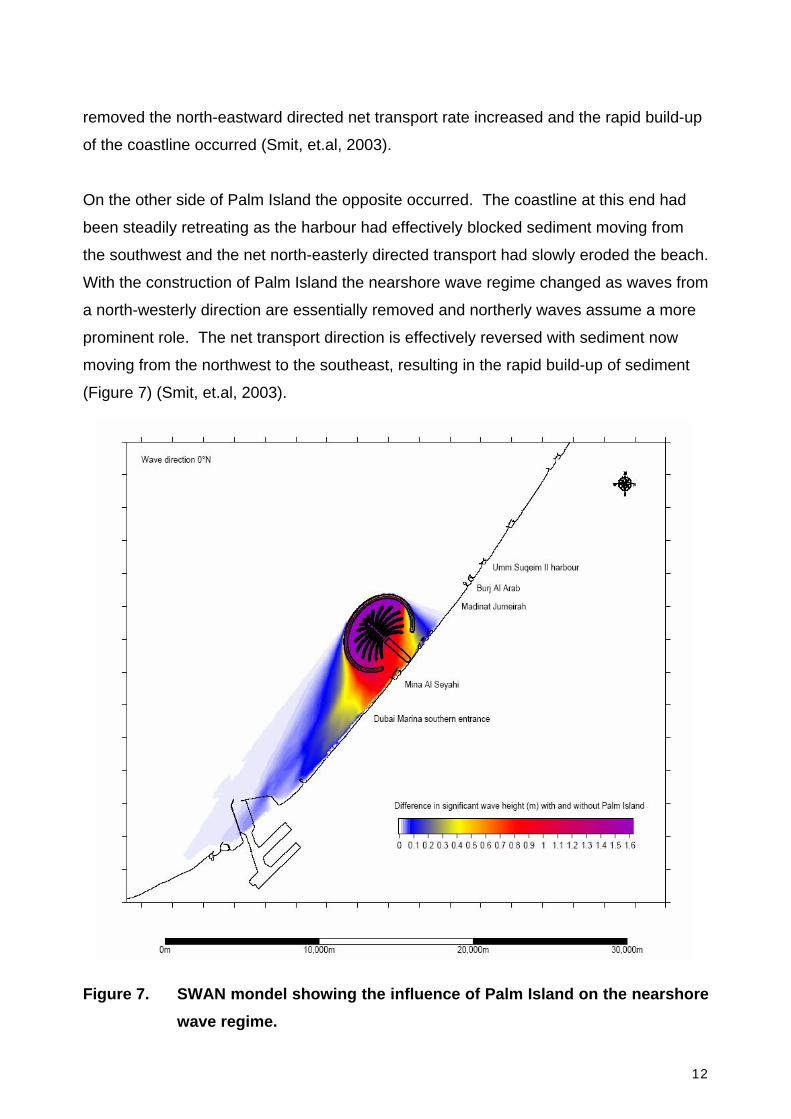
On the other side of Palm Island the opposite occurred. The coastline at this end had
been steadily retreating as the harbour had effectively blocked sediment moving from
the southwest and the net north-easterly directed transport had slowly eroded the beach.
With the construction of Palm Island the nearshore wave regime changed as waves from
a north-westerly direction are essentially removed and northerly waves assume a more
prominent role. The net transport direction is effectively reversed with sediment now
moving from the northwest to the southeast, resulting in the rapid build-up of sediment
(Figure 7) (Smit, et.al, 2003).
Figure 7. SWAN mondel showing the influence of Palm Island on the nearshore wave regime.
13
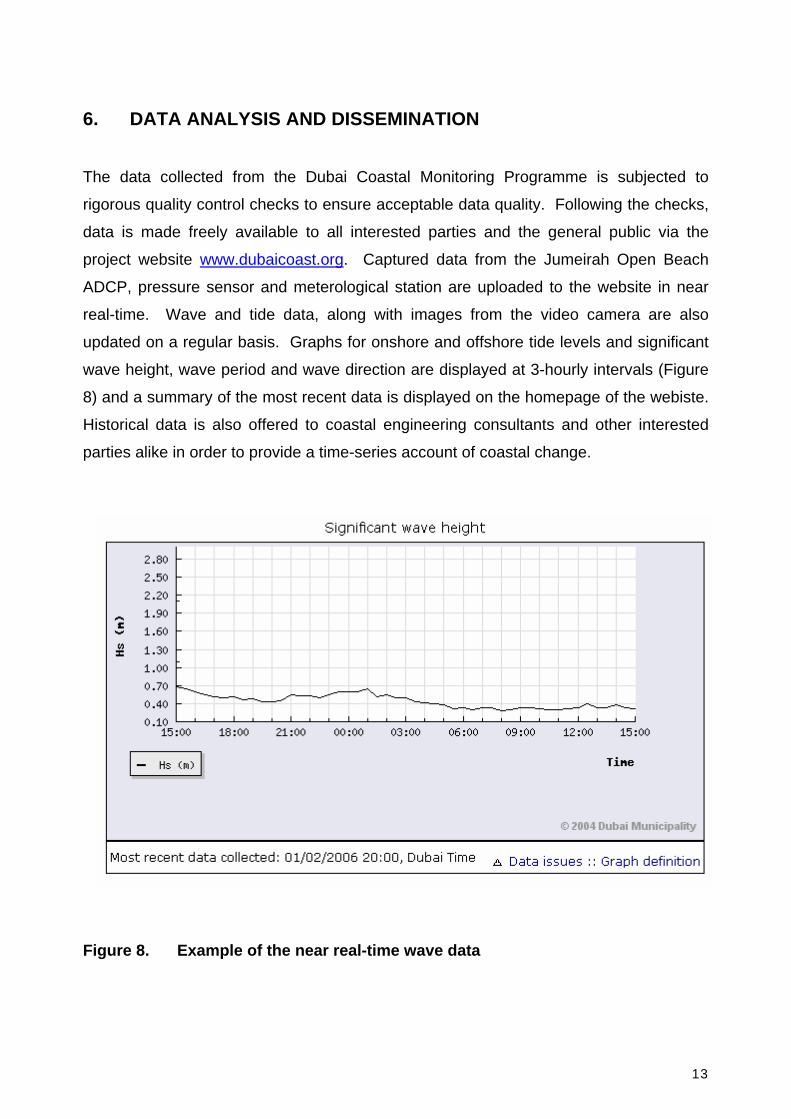
6. DATA ANALYSIS AND DISSEMINATION
The data collected from the Dubai Coastal Monitoring Programme is subjected to
rigorous quality control checks to ensure acceptable data quality. Following the checks,
data is made freely available to all interested parties and the general public via the
project website www.dubaicoast.org. Captured data from the Jumeirah Open Beach
ADCP, pressure sensor and meterological station are uploaded to the website in near
real-time. Wave and tide data, along with images from the video camera are also
updated on a regular basis. Graphs for onshore and offshore tide levels and significant
wave height, wave period and wave direction are displayed at 3-hourly intervals (Figure
8) and a summary of the most recent data is displayed on the homepage of the webiste.
Historical data is also offered to coastal engineering consultants and other interested
parties alike in order to provide a time-series account of coastal change.
Figure 8. Example of the near real-time wave data
14
7. CONCLUSIONS
A comprehensive coastal monitoring programme has been established for the Dubai
coastal zone. With the aid of pioneering technology, accurate and reliable results have
been collected for the coast of Dubai which offer a valuable tool for coastal engineers in
terms of design and understanding the coastal processes occurring along the coast.
The bulk of the work to date has focused on the implementation of the programme and
assuring the accurate and timely gathering of the required information. Focus will
increasingly shift towards more in-depth analysis of data and the feeding of results to
projects initiated by the Municipality (Smit, et.al, 2003). With rapid development and
construction occurring on the Dubai coastline, the need for a sound understanding of
coastal processes is essential. It is hoped that with the data collected as part of the
Dubai Coastal Monitoring Programme, the coastal dynamics of the region can be
understood and predicted for both the short term and for the longer term in response to
potential climate change and sea-level rise.