case study - dover sole range from baja california to the bering sea. on mud or muddy-sand, at 35 to...
Post on 21-Dec-2015
213 views
TRANSCRIPT

Case Study - Dover Sole
• Range from Baja California to the Bering Sea.• On mud or muddy-sand, at 35 to 1400 m depths.• Feed on polychaete worms, shrimp, brittle stars, and
small bivalves.• Winter spawning (December to February).• Planktonic larval stage lasts at least one year.• Gradual movement to deeper waters with growth.
FW599 Winter 2008
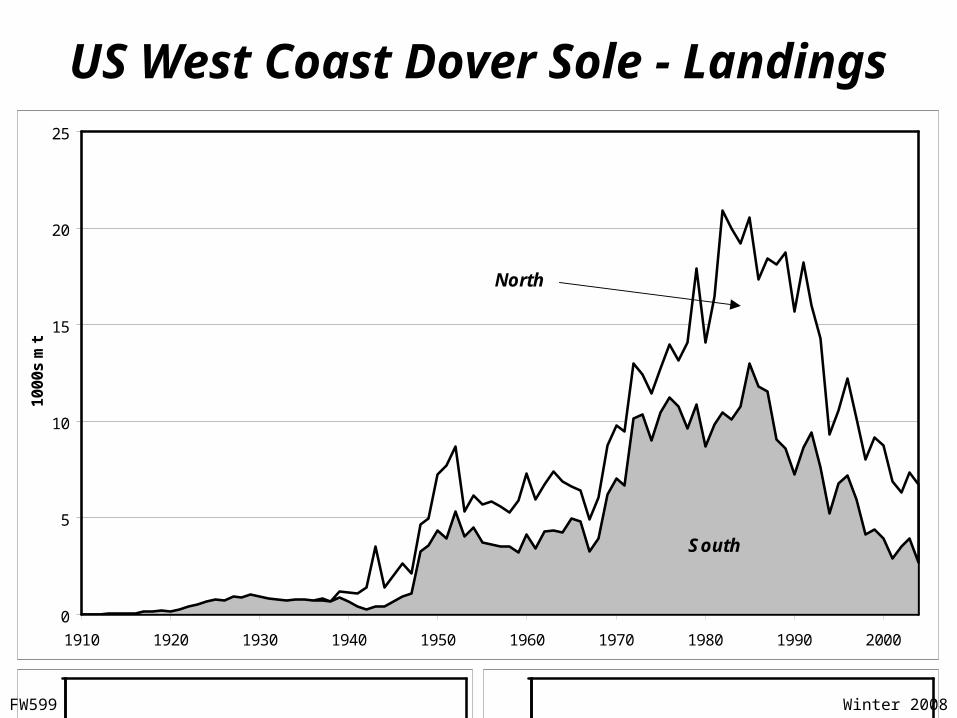
US West Coast Dover Sole - Landings
0
5
10
15
20
25
1910 1920 1930 1940 1950 1960 1970 1980 1990 2000
100
0s m
t
South
North
0.0
0.4
0.8
1.2
1.6
1-60 61-75 76-100 100-150 151-225 226-300 > 300
0.0
0.4
0.8
1.2
1.6
1-60 61-75 76-100 100-150 151-225 226-300 > 300
FW599 Winter 2008

Dover Sole – Sexual Dimorphism
Length Composition by SexNWFSC Slope Survey - 2003
0%
2%
4%
6%
8%
10%
12%
16 18 20 22 24 26 28 30 32 34 36 38 40 42 44 46 48 50 52 54 56 58 60 62 64
Length (cm)
Fem Mal
FW599 Winter 2008

Dover Sole – Fishery Size Composition
North Fishery - 1973
0%
5%
10%
15%
20%
16 20 24 28 32 36 40 44 48 52 56 60 64
Fem Mal
North Fishery - 2003
0%
5%
10%
15%
20%
16 20 24 28 32 36 40 44 48 52 56 60 64
South Fishery - 1973
0%
5%
10%
15%
20%
16 20 24 28 32 36 40 44 48 52 56 60 64
South Fishery - 2003
0%
5%
10%
15%
20%
16 20 24 28 32 36 40 44 48 52 56 60 64
0%
25%
50%
75%
100%
15 20 25 30 35 40 45
Length (cm)
FW599 Winter 2008

Dover Sole – Changes with Depth
Mean Length-at-Age by Depth from Coastwide Slope Survey
25
30
35
40
45
100 200 300 400 500
Depth Zone (fathoms)
Leng
th (
cm)
5 7 9 11Age:
FW599 Winter 2008

Dover Sole – Changes in Mean Weight
Mean Weight (kg) in the Fishery Landings
2.0
2.5
3.0
3.5
4.0
1965 1970 1975 1980 1985 1990 1995 2000 2005
North South
FW599 Winter 2008

Dover Sole – Small Fish are Discarded
0%
25%
50%
75%
100%
15 20 25 30 35 40 45
Length (cm)
Pe
rce
nt
Re
tain
ed
1986 Study
1974 Study
FemaleMale
FW599 Winter 2008

Dover Sole – Recent Discard Data
Van&Col - 2002
0.0
0.4
0.8
1.2
1.6
1-60 61-75 76-100 100-150 151-225 226-300 > 300
Depth (fa)
Mea
n F
ish
Wei
ght (
lb)
retained discarded
Van&Col - 2003
0.0
0.4
0.8
1.2
1.6
1-60 61-75 76-100 100-150 151-225 226-300 > 300
Depth (fa)
Mea
n F
ish
Wei
ght
(lb)
Eureka - 2002
0.0
0.4
0.8
1.2
1.6
2.0
1-60 61-75 76-100 100-150 151-225 226-300 > 300
Depth (fa)
Mea
n F
ish
Wei
ght (
lb)
Eureka - 2003
0.0
0.4
0.8
1.2
1.6
1-60 61-75 76-100 100-150 151-225 226-300 > 300
Depth (fa)
Mea
n F
ish
Wei
ght (
lb)
FW599 Winter 2008

Dover Sole - Assessment Data
• Landings - 1910 to 2004
• Fishery length compositions - 1966 to 2004
• Fishery age compositions - 1981 to 2004
• Trawl logbook CPUE - 1978 to 1995
• Shelf survey biomass - 1980 to 2004
• Slope survey biomass - 1992 to 2004
• Survey length compositions
• Observer Program discards - 2002 & 2003
FW599 Winter 2008

Dover Sole - Assessment Model Structure
• Two fisheries - South (CA+S.OR) & North.
• Separate slope surveys - AFSC (1992 to 2001) and NWFSC (1998 to 2004).
• Fixed size-retention functions - Early (to 1980); Late (1986 to 2004); and Transition. The fisheries now retain smaller fish.
• Fixed maturity-at-size functions - Early (to 1954); Late (1985 to 2004); and Transition. Maturation now occurs at smaller sizes.
• Natural mortality fixed at 0.09/yr.FW599 Winter 2008

Dover Sole - Model Structure (continued)
• Growth parameters estimated, but fixed relative variation (CV) in length-at-age.
• Three periods for fishery selection L50s: Early (to 1979); Middle (to 1995); and Late.
• Recruitment deviations from 1930.
• Beverton & Holt stock-recruit curve with fixed steepness (0.8) and variability (0.35).
• Reduced lambdas on length-at-age (0.1) and age composition (0.2) data.
FW599 Winter 2008

Biomass (1000s mt)
0
100
200
300
400
500
600
700
1910 1920 1930 1940 1950 1960 1970 1980 1990 2000
5+ Biomass Spawning Biomass
Recruitment (millions of age-0 fish)
0
50
100
150
200
250
300
350
400
1910 1920 1930 1940 1950 1960 1970 1980 1990 2000
0
50
100
150
200
250
300
350
0 50 100 150 200 250 300
Spawning Biomass (1000s mt)
Dover Sole – Estimated Stock Trends
Available Data
Fishery LengthsFishery AgesShelf SurveySlope Survey
Trawl Logbook CPUE
FW599 Winter 2008

Dover Sole – Fit to the Tuning IndicesAFSC Slope Survey
0
50
100
150
200
250
1992 1996 1997 1999 2000 2001
Bio
ma
ss (
100
0s m
t)
obs exp
q = 1.05
NWFSC Slope Survey
0
50
100
150
200
1998 1999 2000 2001 2002 2003 2004
Bio
ma
ss (
100
0s m
t)
q = 0.70
`̀
Triennial Shelf Survey
0
10
20
30
40
50
60
70
80
90
1980 1983 1986 1989 1992 1995 1998 2001 2004
Bio
ma
ss (
100
0s m
t) q = 0.26
Logbook CPUE Index
0
100
200
300
400
500
600
1978 1981 1984 1987 1990 1993
Ca
tch
Ra
te (
lbs/
hr)
0%
20%
40%
60%
80%
100%
14 23 31 39 47 55 63
0%
20%
40%
60%
80%
100%
14 23 31 39 47 55 63
FW599 Winter 2008

Dover Sole – Fit to the Length Compositions
Females
Males
Southern Fishery
Pearson Residuals (Black=Neg.)
10
20
30
40
50
60
1965 1970 1975 1980 1985 1990 1995 2000 2005
Le
ng
th
10
20
30
40
50
60
1965 1970 1975 1980 1985 1990 1995 2000 2005
Le
ng
th
FW599 Winter 2008

Dover Sole – Fit to the Age Compositions
0
10
20
30
40
50
1980 1985 1990 1995 2000 2005
Ag
e
0
10
20
30
40
50
1980 1985 1990 1995 2000 2005
Ag
e
Females
Males
Southern Fishery
Pearson Residuals (Black=Neg.)
FW599 Winter 2008

Dover Sole – Estimated Selection CurvesSouthern fishery - 1910 to 1979.
0%
20%
40%
60%
80%
100%
14 23 31 39 47 55 63
Fem Mal
Northern fishery - 1910 to 1979.
0%
20%
40%
60%
80%
100%
14 23 31 39 47 55 63
AFSC Slope Survey.
0%
20%
40%
60%
80%
100%
14 19 23 27 31 35 39 43 47 51 55 59 63
Triennial Shelf Survey.
0%
20%
40%
60%
80%
100%
14 19 23 27 31 35 39 43 47 51 55 59 63
0
50
100
150
200
250
300
1910 1920 1930 1940 1950 1960 1970 1980 1990 2000
FW599 Winter 2008

Dover Sole – Likelihood ProfileNatural Mortality (M) = 0.07 0.08 0.09 0.1 0.11
Total 1335.8 1327.1 1313.5 1327.8 1334.0Based on Obs. Data 1361.5 1360.2 1362.4 1367.1 1373.6
Biomass / CPUE LambdaAFSC Slope 1 -9.9 -9.8 -9.7 -9.7 -9.7NWFSC Slope 1 -15.4 -15.6 -15.7 -15.9 -16.0Triennial Shelf 1 42.1 40.4 39.4 38.9 38.8Trawl CPUE 1 -23.1 -22.4 -21.4 -20.3 -19.0
DiscardsS Fishery 1 4.8 4.7 4.6 4.5 4.4N Fishery 1 -2.1 -2.3 -2.5 -2.7 -2.8
Length CompositionsS Fishery 1 366.5 366.8 367.0 367.2 367.4N Fishery 1 403.5 405.1 407.0 409.4 412.2AFSC Slope 1 46.9 48.1 49.3 50.4 51.3NWFSC Slope 1 88.9 91.1 93.1 95.0 96.5Triennial Shelf 1 94.9 95.5 96.1 97.0 97.8
Age CompositionsS Fishery 0.2 702.2 689.8 683.9 682.3 683.8N Fishery 0.2 479.7 462.0 448.3 437.7 429.5NWFSC Slope 0.2 204.8 207.3 210.1 213.0 215.9
Length-at-AgeAFSC Slope 0.1 460.2 451.8 445.5 440.8 437.6NWFSC Slope 0.1 480.7 485.9 490.9 495.6 499.9
Mean Body Weight 1 -7.0 -7.0 -6.9 -6.9 -6.9
FW599 Winter 2008

Dover Sole – Recruits versus Spawners
0
50
100
150
200
250
300
350
0 50 100 150 200 250 300
Spawning Biomass (1000s mt)
Ag
e-0
Re
cru
its (
mill
ions
)
Mean Recruitment
Median Recruitment
Unexploited
2000
1997
1324.4
1324.5
1324.6
1324.7
1324.8
1324.9
1325.0
1325.1
1325.2
298.4 298.6 298.8 299.0 299.2 299.4 299.6 299.8 300.0 300.2 300.4
Spawning Biomass (1000s mt)
FW599 Winter 2008

Dover Sole – Random Starting Values
1324.4
1324.5
1324.6
1324.7
1324.8
1324.9
1325.0
1325.1
1325.2
298.4 298.6 298.8 299.0 299.2 299.4 299.6 299.8 300.0 300.2 300.4
Spawning Biomass (1000s mt)
Ne
gativ
e Lo
g-L
ikel
iho
od
Preliminary Base
FW599 Winter 2008

Dover Sole – Retrospective Analysis
0
50
100
150
200
250
300
350
1940 1950 1960 1970 1980 1990 2000
Spa
wni
ng B
iom
ass
(100
0s m
t)
Data through 2005
through 2004
through 2003
through 2002
through 2001
FW599 Winter 2008

Dover Sole – Compared to Last AssessmentSpawning Biomass (1000 mt)
0
50
100
150
200
250
300
1910 1920 1930 1940 1950 1960 1970 1980 1990 2000
2001 assessment 2005 assessment
Age-2 Recruitment (millions)
0
50
100
150
200
250
300
1910 1920 1930 1940 1950 1960 1970 1980 1990 2000
0
100
200
300
400
500
600
700
1910 1920 1930 1940 1950 1960 1970 1980 1990 2000
FW599 Winter 2008