case study: building a service catalogue and service cost ... · pdf filecase study: building...
TRANSCRIPT

Case Study: Building a Service Catalogue and Service Cost
Model to demonstrate value
Presented by: Leanne SiveyerDirector ICT Governance & Service Strategy
Business Information & ServicesOffice of Environment and Heritage
Service Catalogue
Service Level Management
Service Asset and
Configuration Management
Event Management
Incident and Problem
Management
Program Management Office (PMO)
Service Reporting & Governance

Agenda
About OEHBIS OverviewWhy bother?Service Models4 Step Approach
Step 1 – ServicesStep 2 – CostsStep 3 – AllocationsStep 4 - Agreements
2

OEH Overview
• Working with the community, OEH cares for and protects NSW’s environment and heritage, which includes the natural environment, Aboriginal country, culture and heritage, and our built heritage.
• OEH also provides services to:
Royal Botanic Gardens and Domain Trust NSW Environmental Trust
Western Sydney Parkland Trust Parramatta Park Trust
Centennial Park and Moore Park Trust Historic Houses Trust
Taronga Conservation Society Australia Environment Protection Authority (EPA ).
3

OEH Overview
4
Corporate Services
Catalogue
Customer Experience Regional Operations Heritage
NPWS – National Parks and Wildlife Service
Science Policy Division
Legal
Corporate Services
• People & Culture
• Finance
• Business Information & Services

Business Information & Services
CIOChris Fechner
Engagement, Portfolio & ArchitectureGlenn Dogao
ICT OperationsDarren Morris
Information Management & Spatial
Krissie Auld
ICT DeliveryMathew Thomas
Governance & Service Strategy
Leanne Siveyer
Solutions Architect
Business Partners:Geoff Mullins
Tim PullenTracey Waters
Strategic Business Planner
ICT Hardware
Database and BASIS
Systems Administration
Information Delivery
Information Management
Spatial Delivery
Project Management Office
Business & Productivity Solutions
Enterprise Solutions
Customer Services
Business Analysis
ICT Procurementand Contract Management
Risk ManagementSecurityPolicyAudit
Service ManagementRelease MgmtProblem Mgmt
Service CatalogueService Costing
1 Division ● 5 Branches ● 111 Staff ● 4600 users 5

Previous state
We cant blame out customers for not valuing our services when then don’t know what they are
• Formal service agreements in place with two customers – EPA and Centennial Park
• No clarity exactly what these agreements cover – high level out of date descriptions
• No clarity around how the agreed levies were calculated and areas of the agreements they cover – combined levy for corporate services – how much for IT?
• No service reporting just regular charging of levy
• Result – credit card amnesia!
6

Define and communicate the value of our services
Establish service ownership and management
Move BIS to a more service based culture – ‘service thinking’ mindset
Understand what our services actually cost to deliver
Provide service and cost transparency
Provide a platform for service based as opposed to support based conversations
Facilitates benchmarking and service forecasting
Why bother?
Value ● Transparency ● Service Maturity ● Professionalism7
Bonus: Focus on data sources - completeness and accuracy
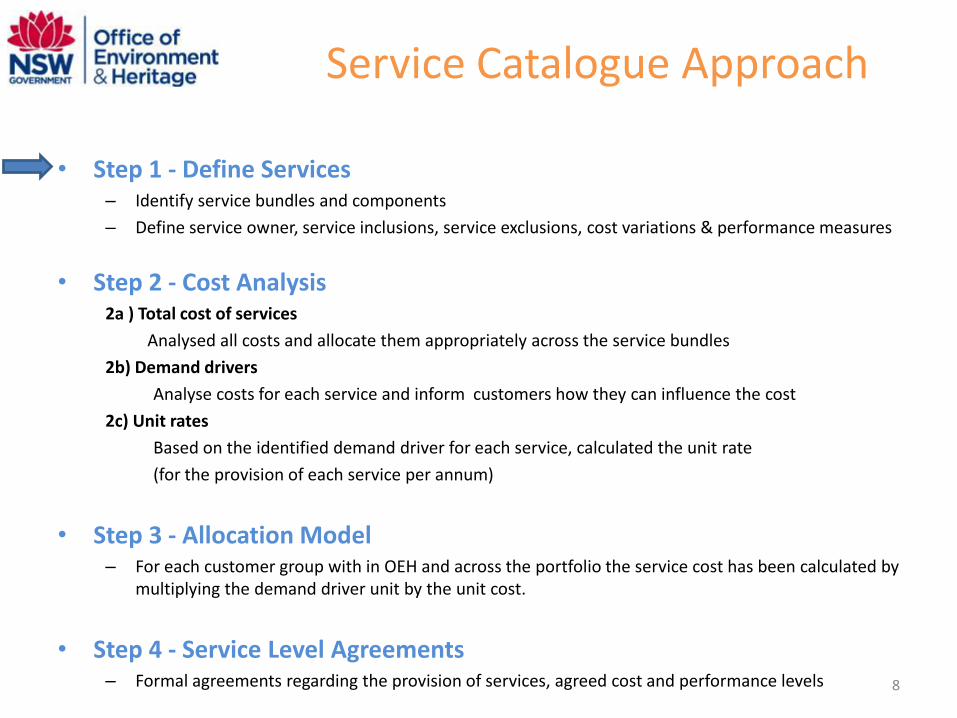
Service Catalogue Approach
• Step 1 - Define Services – Identify service bundles and components
– Define service owner, service inclusions, service exclusions, cost variations & performance measures
• Step 2 - Cost Analysis2a ) Total cost of services
Analysed all costs and allocate them appropriately across the service bundles
2b) Demand drivers
Analyse costs for each service and inform customers how they can influence the cost
2c) Unit rates
Based on the identified demand driver for each service, calculated the unit rate
(for the provision of each service per annum)
• Step 3 - Allocation Model– For each customer group with in OEH and across the portfolio the service cost has been calculated by
multiplying the demand driver unit by the unit cost.
• Step 4 - Service Level Agreements– Formal agreements regarding the provision of services, agreed cost and performance levels 8

Model Schmodel
Service ElementsElements that make up a Component Service may or may not be directly consumed by end customers.
Business CapabilitiesA combination of business process, people & technology elements that together produce outcomes for customers.
Category
Service Component OwnersProvide the building blocks, monitoring and support for customer facing Services
OEH CustomersThe general public and other public and private organisations who use OEH services.
Consumer
Service OwnersRely on component services to deliver end to end offerings to the business
Business OwnersRely on groupings of Component Service/s to deliver their outcomes and do their work
Structure of ‘services’
Business Owner
Service Owner
Service Comp-onentOwner
Service Element Owners
Owner
Business Service Bundle 1
Business Service Bundle 3
Business Service 2
‘Cu
sto
me
r’ F
acin
g ‘I
nte
rnal
’ Fac
ing
Component ServicesRecognisable service offerings consumed day-to-day by customerse.g. systems, processes, support.
BIS Service BundlesA logical grouping of Component Service/s based on demand, common usage & service level targets.
‘Pu
blic
’ Fac
ing
9

Step 1: Service Identification Across? Bottom Up?
Outcome based view – Customers view Technical view
Not based on organisational structure Based on organisational structure
Focus on value provided to customers Great for establishing OLA’s
‘What’ we deliver not how ‘How’ we deliver
Services extended across the Division Services are Branch based
Not everyone is visible…what about me? Yes there I am – that’s what I do.
CIO
Branch1
Team1
TS1
TS2
Team2
TS3
TS4
Branch2 Branch3 Branch4 Branch5
CIO
Branch1
Team1
Team2
Branch2 Branch3 Branch4 Branch5
Service Owners Service Owners
The bottom up approach often results in the services matching your org structure – high effort, low quality result 10

Step 1: Service Bundles
Productivity & Collaboration
•Provision of services that support engagement between staff
•PC’s + software, email, network access, telephony, IT support
Solution Delivery
• Project planning, management & execution for Enterprise, Business & Spatial systems
• Solutions development and delivery
Enterprise Application Services
•Provision of applications used by mandate, policy compliance or legislation
•SAP, Aurion, Ehub, Salesforce and the OEH external web site
Business Application Solutions
•Provision of applications used to support specific business activities
•Application availability, maintenance, administration, hosting
High Performance Compute
•Provision of the application environments used for Geospatial and Scientific functions
•Application availability, maintenance, administration, hosting
Mail, Records and Library Services
•Postage services, internal mail, records management, library services.
Information Management
•Information Governance, Data quality management
•Data warehousing and business intelligence
Planning and Governance
•Risk Management, compliance, enterprise architecture, planning,
•Service Strategy, service catalogue, service costing
Service Owner
Mathew Thomas
Mathew Thomas
Krissie Auld
Darren Morris
Glenn Dogao
Mathew Thomas
Krissie Auld
Krissie Auld
11

12
Service
Bundle
Optional/
Mandatory
Service Components Cost
Type
Charge basis
(Demand
Driver)
KPI
Productivity
and
Collaboration
Service
Mandatory Workplace Service Fixed Head Count Incident/Request
Resolution
Software currency
Mobile workplace Service Variable Usage Incident/Request
Resolution
Workplace Enhancement
Service
Variable SOW % delivered within 5% of
SOW.
Customer SatisfactionWorkplace Establishment
Service
Variable SOW
Optional Products Variable SOW
Business
Application
Service
Optional Business Solution Service Fixed AMU System availability
Software currency
Business Incident and Request
Service
Fixed AMU Incident/Request
Resolution
Step 1: Service Components
8 Service Bundles27 Service Components

Service Catalogue Approach
• Step 1 - Define Services – Identify service bundles and components
– Define service owner, service inclusions, service exclusions, cost variations & performance measures
• Step 2 - Cost Analysis2a ) Total cost of services
Analysed all costs and allocate them appropriately across the service bundles
2b) Demand drivers
Analyse costs for each service and inform customers how they can influence the cost
2c) Unit rates
Based on the identified demand driver for each service, calculated the unit rate
(for the provision of each service per annum)
• Step 3 - Allocation Model– For each customer group with in OEH and across the portfolio the service cost has been calculated by
multiplying the demand driver unit by the unit cost.
• Step 4 – Service Agreements– Formal agreements regarding the provision of services, agreed cost and performance levels 13

Step2a: Establish Service Cost
Cost Item Service 1
Service 2
Service 3
Service 4
Service 5
Service 6
Service 7
Service 8
Total
Salary + Staff On Costs- Resource 1- Resource 2- Resource n
100%50% 50%
20% 20% 20% 20% 20%
100%100%100%
Operating Expenses e.g.- Licencing- Maintenance- Network
100%50%60%
50%20% 20%
100%100%100%
InfrastructureReplacement 100%
100%
Result – total cost of each service.14

Step 2a: Service Cost Analysis
BUSINESS SOLUTIONS SUPPORT SERVICE
4% ENTERPRISE SOLUTIONS SUPPORT
SERVICE10%
PRODUCTIVITY AND COLLABORATION
SERVICE53%
SOLUTIONS DELIVERY SERVICE
4%
GOVERNANCE, ARCHITECTURE AND PLANNING SERVICE
9%
MAIL, RECORDS AND LIBRARY
6%
GEO SPATIAL SERVICE6%
INFORMATION MANAGEMENT
SERVICE3%
CHARGEBACK via SOW5%
BIS Budget by Service
Result – Ability to analyse budget by service 15

Step 2b: Demand Driver Analysis
Result – Identify appropriate demand driver for each service
What predominately drives the costs of each service?What can the business do to influence this cost?
e.g. 1 Productivity and Collaboration Service The highest cost elements are:- licensing (predominantly MS)- Connectivity costs- Resourcing
Demand Driver = headcount
E.g. 2 Business Solutions- Costs are based on resourcing for support and
Development
Demand Driver - # applications and application complexity = AMU’s
Demand Drivers
Headcount
AMU
Division/Agency
# Licences
SOW (Scope of Work)
16

17
Application Measurement Unit (AMU)
AMU Ratings• Size of User Base• Architectural Alignment• Supportability• Business Importance• Frequency of Use• Level of Integration• Infrastructure Utilisation
Source: BIS Application Register
AMU’sEPA 4802ROG & HD 3350NPWS 2675RBGDT 1820Science 1285BIS 712FPPS 210CPMT 175Legal 140Office of the CE
70
CED 0P&C 0Policy 0
15239 Rates application complexity and supportability

Step 2c: Calculate Unit Rates
Service Bundle Demand Driver Unit Rate Productivity & Collaboration Headcount
Enterprise Application Services Headcount
Records & Library Headcount
Mail (CBD and Hurstville) Headcount
Business SolutionsApplication Measurement Unit(min 70 $5110)
Solutions Delivery Headcount
Spatial and High Performance Compute
ESRI Licences
Governance & Planning Division/Agency
Information Management Service Division/Agency
Divide the total service cost by the total demand unitse.g. P&C $xM / 4586 (total headcount) = unit rate
Headcount includes – permanent, contract and volunteers 18

Service Catalogue Approach
• Step 1 - Define Services– Identify service bundles and components
– Define service owner, service inclusions, service exclusions, cost variations & performance measures
• Step 2 - Cost Analysis2a ) Total cost of services
Analysed all costs and allocate them appropriately across the service bundles
2b) Demand drivers
Analyse costs for each service and inform customers how they can influence the cost
2c) Unit rates
Based on the identified demand driver for each service, calculated the unit rate
(for the provision of each service per annum)
• Step 3 - Allocation Model– For each customer group with in OEH and across the portfolio the service cost has been calculated by
multiplying the demand driver unit by the unit cost.
• Step 4 - Service Agreements– Formal agreements regarding the provision of services, agreed cost and performance levels 19

Step 3: Service Cost Allocation- Proposed Charges
Proposed Charges Office of Environment and Heritage Portfolio
Demand Driver
Office Chief Exec
People &
CultureFinance Policy NPWS CED
Regional Ops
BIS Science LegalRBG& DT
CP&
MPTEPA
Productivity & Collaboration
Headcount
Enterprise Application Services
Headcount
Mail, Records & Library Headcount
Business Solutions AMU's
Solutions Delivery Headcount
Geospatial & Scientific Services
% Application accounts
Governance, Enterprise Architecture & Planning
Agency/Division
Information Management
Agency/Division
ChargebackAgency/Division
Total
Transparency has been key to successful service catalogue discussions. Allows customers to assess fairness and equity.
20

Step 3: Service Cost Allocation
NPWS, 35%
Regional Ops, 14%
EPA, 12%
CED, 9%
RBG& DT, 7%
Science, 6%
SOW, 5%
Office Chief Executive, 3%
BIS, 2%
CP&
MPT, 2%
People & Culture, 2%Policy, 1%Legal,
1%
Finance, Proc, Perf
& Services, 1%
NPWS
Regional Ops
EPA
CED
RBG& DT
Science
SOW
Office Chief Executive
BIS
CP&MPTPeople & Culture
Policy
Legal
Finance, Proc, Perf& Services
The ability to compare costs is very important to customers 21

Service Catalogue Approach
• Step 1 - Define Services– Identify service bundles and components
– Define service owner, service inclusions, service exclusions, cost variations & performance measures
• Step 2 - Cost Analysis2a ) Total cost of services
Analysed all costs and allocate them appropriately across the service bundles
2b) Demand drivers
Analyse costs for each service and inform customers how they can influence the cost
2c) Unit rates
Based on the identified demand driver for each service, calculated the unit rate
(for the provision of each service per annum)
• Step 3 - Allocation Model– For each customer group with in OEH and across the portfolio the service cost has been calculated by
multiplying the demand driver unit by the unit cost.
• Step 4 - Service Agreements– Formal agreements regarding the provision of services, agreed cost and performance levels 22

23
Service
Bundle
Optional/
Mandatory
Service Components Cost Type Charge basis
(Demand
Driver)
KPI
Planning and
Governance
Mandatory Enterprise Architecture Service Fixed Division/Agency % aligned with target architecture
Solution Architecture Service Variable SOW % delivered within 5% of SOW.Customer Satisfaction
Business Partner Service Fixed Division/Agency Customer Satisfaction
ICT Planning Service Fixed Division/Agency % of projects captured within ICT
Strategic Plan
ICT Governance Service Fixed Division/Agency # outstanding high risk audit items
ICT Procurement Service Fixed Division/Agency Request Response time – speed of
order placement
Productivity and
Collaboration
Service
Mandatory Workplace Service Fixed Head Count Incident/Request Resolution
Software currency
Mobile workplace Service Variable Usage Incident/Request Resolution
Workplace Enhancement Service Variable SOW % delivered within 5% of SOW.
Customer SatisfactionWorkplace Establishment Service Variable SOW
Optional Products Variable SOW
Enterprise
Application Service
Mandatory Enterprise Solution Service Fixed Headcount System availability
Software currency
Enterprise Incident and Request Service Fixed Headcount Incident/Request Resolution
Business,
Application Service
Optional Business Solution Service Fixed AMU System availability
Software currency
Business Incident and Request Service Fixed AMU Incident/Request Resolution
Spatial and High
Performance
Compute
Optional.Note:
Mandatory
commitment (for 5
years from 2014)
Spatial Service Variable % Application accounts System availability
Software currency
High Performance Compute Service Fixed % Application accounts System availability
BIS Service Details

Service
Bundle
Optional/
Mandatory
Service Components Cost Type Charge basis
(Demand Driver
KPI
Solutions Delivery
Service
Optional Project Management Office Service Fixed Headcount % Projects delivered – on
time on budgetProject Management Service Variable SOW
Business Analysis Service Variable SOW
Organisational Change Management
Service
Variable SOW
Enterprise Systems Delivery and
Enhancement Service
Variable SOW
Business Systems Delivery and
Enhancement Service
Variable SOW
Spatial Systems Delivery and Enhancement
Service
Variable SOW
Information Delivery and Enhancement
Service
Variable SOW
Mail, Records, and
Library Service
Mandatory Mail Service Variable Headcount (Hurstville and
Goulburn St)
Service AvailabilityService UtilisationCustomer Satisfaction
Library Service Fixed Headcount
Electronic Records Fixed Headcount
Physical Records Variable Headcount
Information
Management
Service
Mandatory Information Governance Service Fixed Division/Agency % of data managed under
the Info Mgt Framework
Data Quality Service Variable SOW % of data with meta data
defined
Information Brokerage and Publishing
Service
Fixed Division/Agency % of datasets under
Creative Commons
BIS Service Details cont.
24
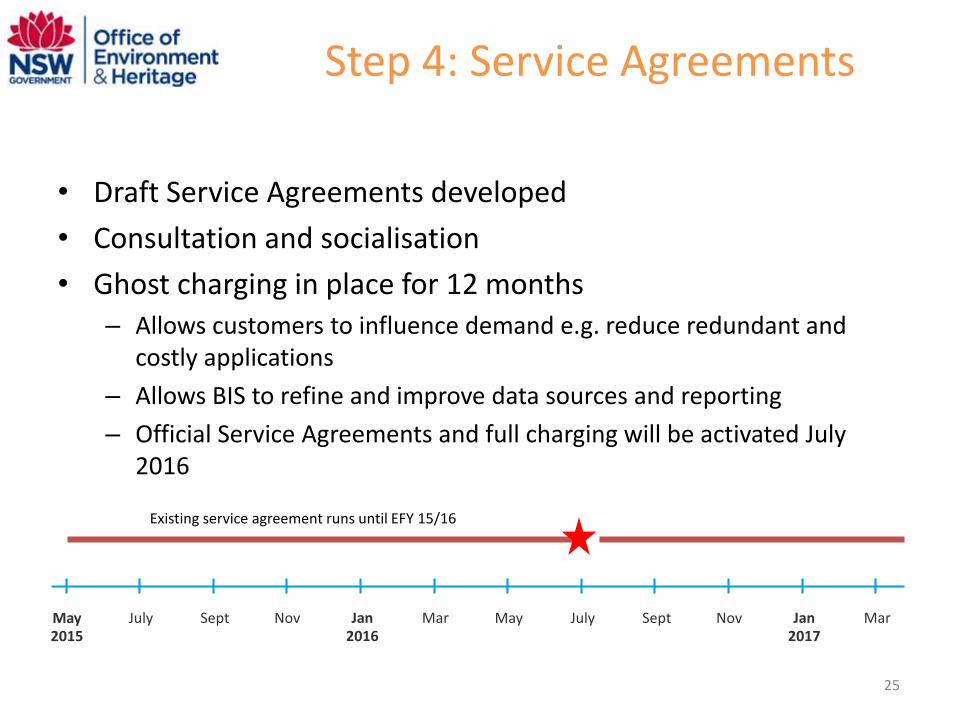
Step 4: Service Agreements
• Draft Service Agreements developed
• Consultation and socialisation
• Ghost charging in place for 12 months– Allows customers to influence demand e.g. reduce redundant and
costly applications
– Allows BIS to refine and improve data sources and reporting
– Official Service Agreements and full charging will be activated July 2016
May2015
July Sept Nov Jan2016
Mar May July Sept Nov Jan2017
Mar
Existing service agreement runs until EFY 15/16
25

Final Notes
OEH has developed service catalogues for HR and Finance as well
The same methodology has been used however…
BIS had a head start due to:- Senior management having a service mindset- Understanding of ITIL principles and the concept of services- Disciplined use of a Service Management toolset- Defined engagement model- Maintaining an Application Register- Large percentage of costs that are non-resource based- Strong IT Financial Management
Don’t overthink it!Kept it simple to start withFocus on CSI – don’t get stuck
Service Catalogue
Service Level Management
Service Asset and
Configuration Management
Event Management
Incident and Problem
Management
Program Management Office (PMO)
Service Reporting & Governance
26

Questions?
27