case study 3m corporate headquarters 2014 · the promoss™ treated tower was 3, 3a and 4 – the...
TRANSCRIPT

Industrial Water Division Case Study 3M Corporate Headquarters 2014
Distributed by:

V1.0
Introduction
Creative Water Solutions LLC and 3M conducted a 2 year trial of ProMoss™ treatment at their corporate campus cooling towers. The purpose of the study was to determine the effect of ProMoss™ on water chemistry, bacterial load, organic contamination, water use, scaling, corrosion, turbidity and conductivity.
The 2 towers selected for the trial were 7000 ton structures made from wood and galvanized steel. The ProMoss™ treated tower was 3, 3A and 4 – the control tower was 5, 6 and 6E. Due to the cool summer, the control tower was not running approximately 80% of the trial, while the ProMoss™ tower was running all summer.
The ProMoss™ tower required 93 ProMoss™3 bags per month delivered in 13 submersible contact chambers.


V1.0
Trial Protocol 2014
• Month 1 – baseline data collection ProMoss™ and control towers • Months 2-4 – ProMoss™ added to tower 3, 3A and 4 • Cycles of concentration increased by 100% after two months of ProMoss™
treatment • Water treatment by Nalco • No biocide added to ProMoss™ tower, control tower received biocide • Weekly measurements in both towers
o Corrosion § Linear polarization probes for copper and mild steel § Coupons for copper and mild steel
o Water chemistry § pH § Total dissolved solids (TDS) § Alkalinity § Calcium hardness § Iron § LSI
o Microbiology § Quantitative bacterial serial dilution § Organic contamination coupons
o Nalco reports

V1.0
Test cage for each tower
1. Organic contamination coupon
2. Mild steel corrosion coupon
3. Copper corrosion coupon
Results
• Photos of the coupons
• Photos of the towers
• Bacteriologic data
• Water data
• Chiller photos
Mild steel
Corrosion
Probe
Copper
Corrosion
Probe
1
1 2
3
3
2

The difference between the two towers is visibly evident for the mild steel coupons on the top and the organic contamination coupons on the bottom.
Coupon Pictures
Aug 1, 2014
Tower 3 Treated with ProMoss™
Tower 5
Control Tower
Aug 1, 2014

V1.0
Photos from the towers
Midway through the summer the thick layers of organic contamination and algae started to peel off the cedar wood structure of the tower with ProMoss™. The wood was totally intact.
Results from the ProMoss™ Treated Tower
Tower 3 - Aug 8, 2015 Tower 3 - Sept 12, 2014
Sloughed off organic contamination film from the wood

By the end of the trial, almost all the organic contamination and algae had peeled off the tower structure. You can see the normal appearing wood on the left of the picture.
ResultsfromtheProMoss™TreatedTower
Tower 3 - Oct 17, 2014

V1.0
The photo on the left shows organic contamination and algae coming off an upright in the ProMoss™ treated tower while the control tower continued to accumulate more material. After the trial both towers were drained and power-washed. All the timbers in the treated tower were clear of contamination, while the control tower continued to have significant contamination.
Results from the ProMoss™ Treated Tower
ProMoss™ Treated
Control
Organiccontamina,onsloughingofffromthewood

Bacteriologic data
The ProMoss™ treated tower did not have biocide and the control tower did receive biocide. The quantitative bacterial counts from both towers were similar even after the ProMoss™ tower had the cycles of concentration doubled and the control tower remained at the previous years settings.
1.5
2
2.5
3
3.5
4
4.5
5
5.5
6/19/14
6/26/14
7/3/14
7/10/14
7/17/14
7/24/14
7/31/14
8/7/14
8/14/14
8/21/14
8/28/14
9/4/14
9/11/14
9/18/14
9/25/14
10/2/14
10/9/14
10/16/14
10/23/14
10/30/14
11/6/14
ColonieslogX
Quantitative Bacterial Colony Counts ProMoss™ Tower yellow
Control Tower Violet
ProMoss™Started
ProMoss™Changed
CyclesofConcentraAonDoubledinT3
ProMoss™Changed
ProMoss™Changed
V1.0
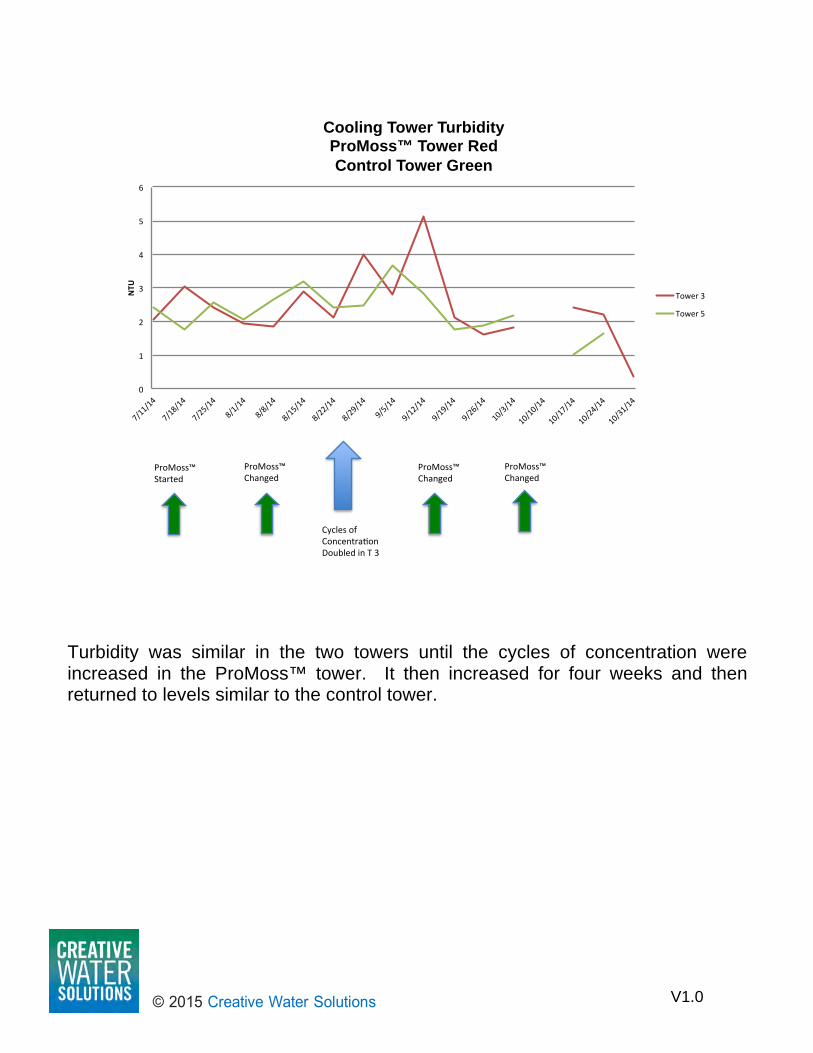
Turbidity was similar in the two towers until the cycles of concentration were increased in the ProMoss™ tower. It then increased for four weeks and then returned to levels similar to the control tower.
ProMoss™Started
ProMoss™Changed
CyclesofConcentra5onDoubledinT3
ProMoss™Changed
ProMoss™Changed
0
1
2
3
4
5
6
7/11/14
7/18/14
7/25/14
8/1/14
8/8/14
8/15/14
8/22/14
8/29/14
9/5/14
9/12/14
9/19/14
9/26/14
10/3/14
10/10/14
10/17/14
10/24/14
10/31/14
NTU
Cooling Tower Turbidity ProMoss™ Tower Red Control Tower Green
Tower3
Tower5

pH measurements were similar in both towers even with the increase in cycles of concentration in the ProMoss™ treated tower.
7.5
8
8.5
9
9.5
10
6/19/14
6/26/14
7/3/14
7/10/14
7/17/14
7/24/14
7/31/14
8/7/14
8/14/14
8/21/14
8/28/14
9/4/14
9/11/14
9/18/14
9/25/14
10/2/14
10/9/14
10/16/14
10/23/14
10/30/14
pH
Cooling Tower pH ProMoss™ Tower Red Control Tower Green
Tower3
Tower5
ProMoss™Started
ProMoss™Changed
ProMoss™Changed
CyclesofConcentraConDoubledinT3
ProMoss™Changed

V1.0
Total dissolved solids (TDS) were similar until the cycles of concentration were doubled in the ProMoss™ treated tower. It then increased in the ProMoss™ treated tower.
ProMoss™Started
ProMoss™Changed
CyclesofConcentra5onDoubledinT3
ProMoss™Changed
ProMoss™Changed
0
500
1000
1500
2000
2500
3000
7/11/1
4
7/18/1
4
7/25/1
4
8/1/14
8/8/14
8/15/1
4
8/22/1
4
8/29/1
4
9/5/14
9/12/1
4
9/19/1
4
9/26/1
4
10/3/14
10/10
/14
10/17
/14
10/24
/14
TDS(pp
m)
Cooling Towers – TDS ProMoss™ Red Control Green
Tower3
Tower5
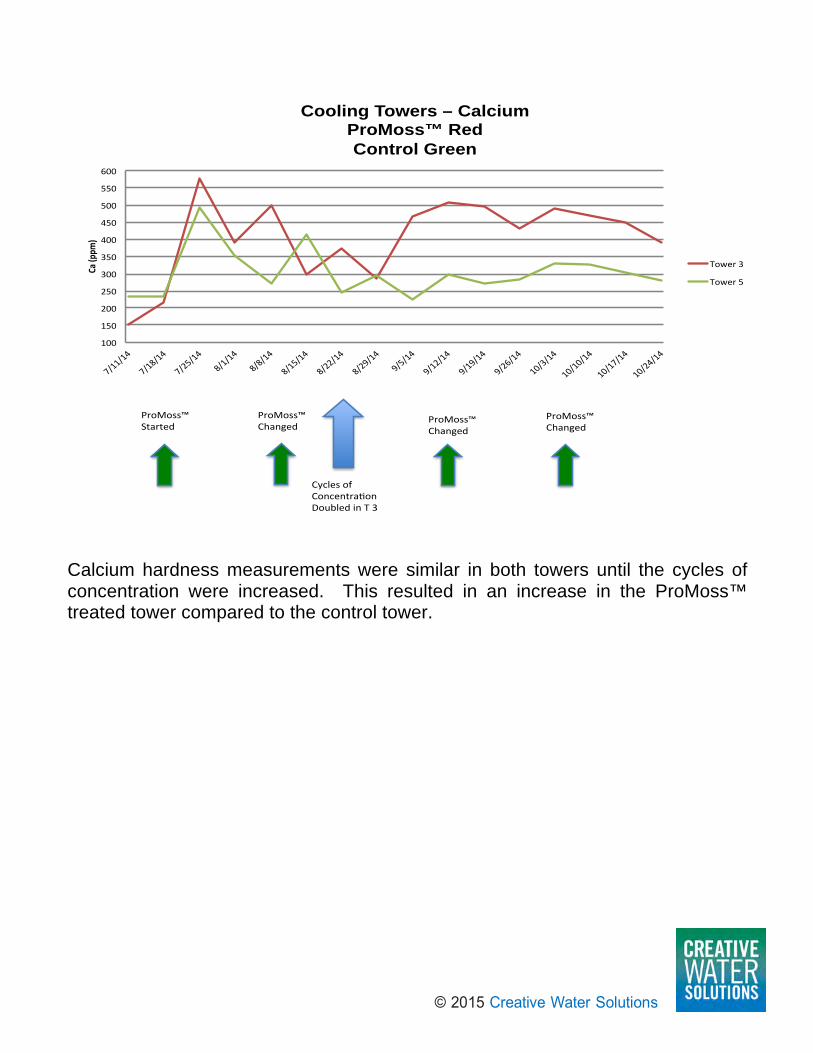
Calcium hardness measurements were similar in both towers until the cycles of concentration were increased. This resulted in an increase in the ProMoss™ treated tower compared to the control tower.
ProMoss™Started
ProMoss™Changed
CyclesofConcentra5onDoubledinT3
ProMoss™Changed
ProMoss™Changed
100
150
200
250
300
350
400
450
500
550
600
7/11/1
4
7/18/1
4
7/25/1
4
8/1/14
8/8/14
8/15/1
4
8/22/1
4
8/29/1
4
9/5/14
9/12/1
4
9/19/1
4
9/26/1
4
10/3/14
10/10
/14
10/17
/14
10/24
/14
Ca(p
pm)
Cooling Towers – Calcium ProMoss™ Red Control Green
Tower3
Tower5

V1.0
The Langlier Saturation Index (LSI) was calculated for both towers. Nalco was concerned with the +2 level in the ProMoss™ treated tower and predicted that the chiller would be significantly scaled. After the cooling season was over, the chiller was opened for cleaning and the only scaling was on the zinc anodes.
0
0.5
1
1.5
2
2.5
3
7/11/1
4
7/18/1
4
7/25/1
4
8/1/14
8/8/14
8/15/1
4
8/22/1
4
8/29/1
4
9/5/14
9/12/1
4
9/19/1
4
9/26/1
4
10/3/14
10/10
/14
10/17
/14
10/24
/14
LSI
LSICalcula*onProMoss™BlueControlRed
Tower3
Tower5

Corrosivity for mild steel measured with the linear polarization probe was significantly lower in the ProMoss™ treated tower compared with the control tower even after the cycles of concentration was doubled.
0
1
2
3
4
5
6
7
8
7/11/1
4
7/18/1
4
7/25/1
4
8/1/14
8/8/14
8/15/1
4
8/22/1
4
8/29/1
4
9/5/14
9/12/1
4
9/19/1
4
9/26/1
4
10/3/14
10/10
/14
mmpy
Mild Steel Corrosivity ProMoss™ Red Control Green
Tower3N
Tower5
ProMoss™Started
ProMoss™Changed
CyclesofConcentraConDoubledinT3 ProMoss™
ChangedProMoss™Changed

V1.0
Iron levels in the water were significantly lower in the ProMoss™ treated tower and continued to decrease throughout the cooling season reflecting the ability of Sphagnum moss to absorb iron ions.
ProMoss™Started
ProMoss™Changed
CyclesofConcentra5onDoubledinT3
ProMoss™Changed
ProMoss™Changed
00.050.10.150.20.250.30.350.40.450.5
7/11/1
4
7/18/1
4
7/25/1
4
8/1/14
8/8/14
8/15/1
4
8/22/1
4
8/29/1
4
9/5/14
9/12/1
4
9/19/1
4
9/26/1
4
10/3/14
10/10
/14
10/17
/14
10/24
/14
Fe(p
pm)
Cooling Towers – Fe ProMoss™ Red Control Green
Tower3
Tower5

After the cooling season in 2014 was completed the chiller for the ProMoss™ tower was opened for cleaning. There was no corrosion in the tower and the only scale formation was on the zinc anodes. That scale was analyzed and found to be zinc and oxygen. The +2 LSI predicted that the chiller would be scaled, but no calcium scale was found. The calcium was being absorbed into the Sphagnum moss leaves and removed from the circulating water. Using a scope to inspect the chiller tubes, there was no visible corrosion or scale formation.
Chiller from Treated Tower
Zinc Anodes
Inside Chiller tubes

V1.0
Conclusions for 2014 trial
• ProMoss™ treatment resulted in o Removal of years accumulated organic contamination and algae growth
from the structure of the tower o Clarified the tower water o Controlled levels of Ca and Fe o Resulted in an increase in LSI with no evidence of scale formation o Maintained pH, TDS, Ca, Fe, corrosion for mild steel and copper after
doubling the cycles of concentration during the peak of the cooling season. o Chiller had no corrosion or scale formation on the surface or down the
tubes. o Resulted in a second year of use to test ProMoss™ with an onsite chlorine
generation system for water treatment without delivered chemicals.
Contact Information
PO Box 10189 Goldsboro, NC 27532-0189
Telephone: (919) 751-1001 Fax: (919) 751-5145 [email protected] www.selaboratories.com