case studies report - en...
TRANSCRIPT
i
DRAFT FINAL REPORT
INVESTMENT IN AGRICULTURAL WATER MANAGEMENT IN SUB-SAHARAN AFRICA: DIAGNOSIS OF TRENDS AND OPPORTUNITIES
A Collaborative Program between
The New Partnership for Africa’s Development (NEPAD), The African Development Bank (ADB),
The Food and Agriculture Organization of the United Nations (FAO), The International Fund for Agricultural Development (IFAD),
The International Water Management Institute (IWMI), and
The World Bank (WB)
CASE STUDIES REPORT
VOLUME 2 – HIGHLIGHTS OF FINDINGS OF VARIOUS
COMPONENTS
SUBMITTED TO The African Development Bank
By
The International Water Management Institute November 2004

i
ii
Table of Contents…………………………………………………………...Page LIST OF ACRONYMS ii FOREWORD x Irrigation Project Planning and Implementation Process…………………………………..…….3 Opportunities for Private Sector Participation in Agricultural Water Development and Management………………………………………………………………………………..….290 Evaluation of the Environment and Health Impacts of Informal Agricultural Water Development in Sub-Saharan Africa….………………………………….………………..…..292 Agriculture Water and Livestock Production Case Studies in Sub-Saharan Africa…….….…407 Agricultural Water Investments and Poverty Reduction Impacts in West Africa…………….466 Regional Demandd for Products of Irrigated Agriculture……………………………………..508 Assessment of Potential for Improving Agriculture Water Management in Sub-Saharan Africa: Updates……………………………………………………………….…513 Irrigation Investment Costs in Sub-Saharan Africa: Synthesis of Case Studies………………517 Agricultural Water Development for Poverty Reduction in East and Southern Africa……….526

iii
LIST OF ACRONYMS AATF - African Agricultural Technology Foundation ADB-PEO - Asian Development Bank - Post Evaluation Office ADB - African Development Bank ADD - Agricultural Development ADF - African Development Fund ADLI - Agricultural Development Led Industrialization ADP - Area Development Project AED - Agricultural Extension Department (AED) AGRIN - Agricultural Investments AHFDD - Animal Husbandry and Feed Development Department AIDB - Agricultural and Industrial Development Bank Al - Aluminium ANPIP - Agence Nigerienne de Promotion de e’ Irrigation Privée APIPAC - Association des Professionnels de e’irrigation Privée et Activitées Connexe APPROTEC - Appropriate Technologies for Enterprise Creation AQUASTAT - FAO’s Information System on Water and Agriculture ARC - Agricultural Research Council ARPON - Amelioration de la Riziculture Paysanne à l’Office du Niger or Improvement of
Peasant Rice Cltivation at the Office du Niger As - Arsenic AT2030 - FAO Agricultural Trends up to 2030 AU - African Union B - Boron BDS -Business Development Services BNWPP -Bank-Netherlands Water Partnership Program BoA - Bureau of Agriculture BOT - Build-Operate-Transfer BP - Bank Procedures CA -Comprehensive Assessment of Water Management CAADP - NEPAD Comprehensive Africa Agriculture Development Program CADU - Chilalo Agriculture development Unit CAS - Country Assistance Strategy CBO - Community Based Organisation CCG - Collaborative Program Core Consultative Group Cd - Cadmium CDFs - Comprehensive Development Frameworks CFSCDD - Community Forest and Soil Conservation Development Department CGIAR - Consultative Group for International Agricultural Research CIDA - Canadian International Development Agency CLUSA - Cooperative League for the USA Co -Cobalt COMESA - Common Market for Eastern and Southern Africa CO-SAERAR - Commission for Sustainable Agriculture and Environmental
Rehabilitation for Amhara Region COSOP - Country Strategy Opportunities CP - Challenge Program CPM -Country Portfolio Managers Cr - Chromium

iv
CSA - Central Statistical Authority CTA - Technical Centre for Agricultural and Rural Cooperation DA - Development Agent DALY - Disability-Adjusted Life Year DANIDA - Danish International Development Agency DBL - Danish Bilharzia Laboratory DFID - Department for International Development DIHM - Department of Irrigation, Hydrology, and Meteorology DPPD - Disaster Prevention and Preparedness Department EA - Environmental Assessment EAP - East Asian and the Pacific countries E&CA - European and Central Asian countries ECA - United Nations Economic Commission for Africa ECOWAS - The Economic Community of West African States ECZ - Environmental Council of Zambia EHIA - Environmental Health Impact Assessment EIA - Environmental Impact Assessment EMP - Environmental Management Plan ERR - Economic Rate of Return ESRDF - Ethiopian Social Rehabilitation and Developemnt Fund ETB - Ethiopian Birr (currency 1USD = 8.2 ETB) EU - European Union EVSDA - Ethiopian Valleys Development Authority EW - Enterprise Works F - Fluoride FAO - Food and Agriculture Organization of the United Nations FAO-AGLW - Water Resources, Development and Management Service of FAO FAO-IC - Food and Agriculture Organisation Investment Center FARA - Forum for Agricultural Research in Africa FFH - Food for the Hungry FHH - Female Headed Household FIWUD - Farm irrigation and Water Utilisation Division FMIS - Farmer-Managed Irrigation System FO - Farmer Organisations FPEAK - Fresh Produce Exporters Association of Kenya FPU - Food Producing Unit FUA - Fadama Users’ Association GART - Golden Valley Agricultural Research Trust GDP - Gross Domestic Product GEF - Global Environmental Facility GIDA - Ghana Irrigation Development Authority GIEWS - Global Information and Early Warning System on Food and Agriculture GIWA - Global International Water Assessment GIS - Geographic Information System GMP - Motor Pump Groups GNP - Gross National Product GO - Government Organisation GTZ - Gessllschaft fur Technische Zusammenarbeit GWP - Global Water Partnership HCDA - Horticultural Crops Development Authority
v
Hg - Mercury HH - House Holds HIA - Health Impact Assessment HIV/AIDS - Human Immunodeficiency Virus / Acquired Immunodeficiency
Syndrome H & E - Health and Environment component of the Collaborative Program ICB -International Competitive Bidding ICOLD - International Commission on Large Dams ICRISAT - International Crops Research Institute for the Semi-Arid Tropics IDA - International Development Agency IDD - Irrigation Development Department IDE - International Development Enterprises IDO - International Development Organisations IFAD - International Fund for Agricultural Development IFC - International Finance Corporation IFPRI - International Food Policy Research Institute IFSP - Integrated Food Security Program ILRI - International Livestock Research Institute IILRI - International Institute for Land Reclamation and Improvement IMT - Irrigation Management Transfer INFDC - International Nutrition Foundation for Developing Countries INRM - Integrated Natural Resource Management InWEnt - Capacity Building International, Germany IPTRID - International Program for Technology & Research in Irrigation and Drainage IRR - Internal Rate of Return IRRI -International Rice Research Institute ISC - Interim Science Council IUCN - World Conservation Union IWMI - International Water Management Institute IWMISA - International Water Management Institute, South Africa Office IWRM - Integrated Water Resource Management IWRMS - Integrated Water Resource Management Strategy JICA - Japanese International Cooperation Agency KESSFA - Kenya Small Scale Farmers Association KRA - Kenya Rainwater Association LAC - Latin American and Caribbean countries LD - Line Department LLRS - Landless Livestock Ruminant Production Systems LMB - Livestock and Meat Board LUSIP - Lower Usuthu Smallholder Irrigation Project MC - Management Committe M&E - Monitoring and Evaluation MENA - Middle East and North African countries MFM - Menchn fur Menchn MoA - Ministry of Agriculture MoU - Memorandum of Understanding MoWR - Ministry of Water Resources MRFIP - Mara Region Farmers’ Initiative Project of Tanzania MSMEs - Micro Small and Medium Enterprises MUWSS (or MUS) - Multiple Use Water Supply Systems

vi
NDA - National Department of Agriculture NEPAD - New Partnership for Africa’s Development NGO - Non-Government Organization NIB - National Irrigation Board NIDMP - National irrigational development Master Plan NIS - National Irrigation Projects NTAE - Non-Traditional Agricultural Exports ODA - Overseas Development Administration OE - Office of Evaluation OED - Operations Evaluation Department OEH - Occupational and Environmental Health OIDA - Oromia Irrigation Authority O&M - Operation and Maintenance OoA - Office of Agriculture OP - Operational Policies OPEV - Operations Evaluation ORDA - Organization for Relief and Development for Amhara PA - Peasant Association PANAF - Pan Africa Pb - Lead PC - Producers Cooperatives PCR - Project Completion Report PCU - Project Coordinating Unit PEEM - Panel on Environmental Management for Vector Control PEO - Post Evaluation Office PER - Performance Evaluation Report PFU - Project Facilitation Unit PIDS -Philippine Institute for Development Studies PIDP - Participatory Irrigation Development Program of Tanzania PIP - Project Inception Paper PHBM - Upper Mandrare Basin Development Project of Madagascar PHI - Public Health International P & I - Planning and Implementation Process component of Collaborative Program PMU - Project Management Unit PODIUM - Policy Dialogue Model POP - Persistent Organic Pollutants PPD - Planning and Programming Department PPM -Part Per Million PPP - Public-Private Partnership PRA - Participatory Rural Appraisal PRSP - Poverty Reduction Strategy programmes PSC - Project Steering Committee PSD - Private sector Development PSI - Collaborative Program Private Sector component R&D -Research and Development RBDA - River Basin Development Authority REAP - Rural Enterprise Agri-Business Promotion Project of Kenya RPO - Rural Producer Organisation RTPCU - Regional Technical Sub-Programme Co-ordination Unit RWH - Rainwater Harvesting
vii
SA - South Asian countries SADC - Southern African Development Community SC - Collaborative Program Steering Committee SCP - Special Country Program SDARMP - Smallholder Dry Areas Resource Management Project of Zimbabwe SDC - Swiss Development Cooperation SDPRP - Sustainable Development and Poverty Reduction Program Se - Selenium SEDAP - South Eastern Dry Areas Project of Zimbabwe SHF - Smallholder Farmers SIDA - Swedish International Development Agency SIMA - System-wide Initiative on Malaria and Agriculture SIMI - Smallholder irrigation Market Initiatiative SISDO - Smallholder Irrigation Scheme Development Organisation SMEs - Small and Medium Enterprises SMUWC - Sustainable Management of the Usangu Wetlands and its Catchment SNNPR - Southern Nations and Nationalities Peoples Region SOFRECO -Societe Francaise de Realisation, D’Etudes et de Conseil SME - Small and Medium Enterprises SPSS - Statistical Package for the Social Sciences SSA - sub-Saharan Africa SSIP - Small Scale Irrigation Projects SWAPS - Sector Wide Approaches SWCD - Soil and Water Conservation Department SWDD - Surface Water Development Division SWMNET - Soil and Water Management Research Network TA - Technical Assistance TCP - FAO’s Technical Cooperation Program TLU - Tropical Livestock Units TOR - Terms of Reference TPs - Treadle Pumps UA - Units of Account UN - United Nations UNCDF - United Nations Capital Development Fund UNCED - United Nations Conference on Environment and Development UNCHS - United Nations Centre for Human Settlements UNCSD - United Nations Commission on Sustainable Development UNDP - United Nations Development Programme UNECA -United Nations Economic Commission for Africa UNEP - United Nations Environment Program UNESCAP - United Nations Economic and Social Commission for Asia and the Pacific UNIDO - United Nations Industrial Development Organisation UNOPS - United Nations Office for Project Services USAID-IEHA - United States Agency for International Development – Initiative to End Hunger
in Africa V - Vanadium VAT - Value Added Tax VIP - Village Infastructure Project VIS - Village Systems WAICENT - World Agricultural Information Centre
viii
WATERSIM - Water, Agriculture, Technology, Environment and Resources Simulation Model
WB - World Bank WB-OED - World Bank Operation Evaluation Department WDM - Water Demand Management WG - Collaborative Program Working Group WHO - World Health Organisation WI - Winrock International MWEDD - Water, Mine and Energy Development Department WRC - Water Research Commission WRI - World Resources Institute WSDP - Water Sector Development Program WUA - Water Users’ Association WWDSE - Water Works and Supervision Enterprise WVE - World Vision Ethiopia WWF - World Water Forum WWV - World Water Vision Zn - Zinc

ix
x
FOREWORD The Collaborative Program on ‘Agricultural Water Investment Strategies in Sub-Saharan Africa: Trends and Opportunities’ carried out the Component Case Studies following completion of the Review of Literature work in fulfillment of the Executing Agency Agreement between IWMI and the African Development Bank (ADB), which is supporting the implementation of four (plus agricultural water and livestock) of the components of the Collaborative Program (CP). The case studies are meant to complement and reinforce the review of literature findings. It must be noted that while work on the case studies was in progress, some extensions of the literature review were also carried out simultaneously to respond to the feedback from partners. The results of these activities will be included in the final component reports. As in past submissions, we include reports and updates on the other (i.e. non-ADB funded) components where possible, to reflect the larger set of activities being implemented under the Program. The main report (Volume 1) highlights the key findings of the components implemented by IWMI and other partners and should not be interpreted as a Synthesis Volume. As agreed with the Collaborative Program partners, the overall synthesis work will begin after completion of the eight component studies in December 2004. Volume 2 contains the full case study reports for the ADB funded components and executive summaries or updates for the non-ADB funded components. Full reports for the latter can be made available upon request from sponsoring partners. In addition to highlighting case study findings, Volume 1 includes the proceedings and key agreements of the 8-9 October 2004 Collaborative Program Workshop held in Pretoria and attended by all study implementers and all the partners. The NEPAD secretariat expressed regret at their inability to attend but this report and other outputs from the CP are being shared with them. The first day of the workshop was spent on presentations of all CP components which continued until the first part of the second day. Most of the second day was spent on the Synthesis discussions and concluded with the meeting of the Working Group. Among the items agreed in the workshop were: (a) the changes in deadlines for succeeding reports to reflect more realistic time planning; (b) a detailed time plan and process for the production of the final synthesis report in June 2005; and (c) the need to incorporate all comments and suggestions on previous reports in the final outputs. As we near the completion of the component reports by the end of this year, we look forward to producing a product that will lead to greatly enhanced and effective investments in agricultural water development in Africa. Once again, we would like to thank the African Development Bank for its strong commitment and its support for this work. We also wish to thank our other partners (NEPAD, FAO, IFAD, and World Bank) for their commitment and contributions to bring this effort to fruition.
Douglas J. Merrey Director for Africa International Water Management Institute

xi

1
PART I. THE ADB SUPPORTED COMPONENTS

2
Table of Contents………………………………………………………………………Page Irrigation Project Planning and Implementation Process…………………………….……3 Opportunities For Private Sector Participation In Agricultural Water Development and Management…………………………………………………….…..290 Evaluation of the Environment and Health Impacts of Informal Agricultural Water Development in Sub-Saharan Africa………………………………………….….292 Agricultural Water and Livestock Production Case Studies in Sub-Saharan Africa……407 Agricultural Water Investments and Poverty Reduction Impacts in West Africa………466 Regional Demand for Products of Irrigated Agriculture: Analysing the Demand For Water and the Regions Comparative Advantages in Irrigated Agriculture…………508 Assessment of Potential for Improving Agriculture Water Management in Sub-Saharan Africa: Updates……………………………………………………………513 Irrigation Investment Costs in Sub-Saharan Africa: Synthesis of Case Studies for Ghana, Kenya, Madagascar and Mali……………………………………………………517 Agricultural Water Development for Poverty Reduction in East and Southern Africa…………………………………………………………………………..526
3
1
IRRIGATION PROJECT PLANNING AND IMPLEMENTATION PROCESS
Sylvie Morardet, Jetrick Seshoka, Hilmy Sally, Douglas Merrey and
Country Consultants

4

5
Table of Contents …………………………………..………………………….……Page SYNTHESIS………………………………………………………………………………….…6 ETHIOPIA CASE STUDIES…………………………………………………………..19
Case 1.1 Doni Kombe SSI Project Funded by CARE-Ethiopia……………………..56 Case 1.2 Bato Degaga SSIP Funded by World Vision-Ethiopia………………….….59 Case 1.3 Wakie Tiyo SSIP/Smallholder Private Initiatives…………………………..61 Case 1.4 Sheled SSIP/IFAD Funded project…………………………………………64 Case 1.5 Dodicha SSI/Funded by ESRDF……………………………………………67 Case 1.6 Wayu Seriti SSIP/ESRDF Funded Project………………………………….69 Case 1.7 Godino Rehabilitation and Expansion SSI/Government Funded
Project………………………………………………………………………71 MADAGASCAR CASES……………………………………………………………….74 Case 1.8 Projet de réhabilitation des périmètres irrigués Phase 1……………….…….106 Case 1.9 Projet de réhabilitation des périmètres irrigués phase 2……………..……....111 Case 1.10 Projet de développement rizicole de Bas Mangoky (PRBM) ………..….....115 Case 1.11 Projet Haut Bassins de Mandraré phase deux (PHBM) …………….……...116 Case 1.12 Projet Bassin Versant – Périmètre irrigué (BV-PI) ………………………...118 MALI CASES………………………………………………………………………….121 Case 1.13 Projet de Valorisation des Ressources en Eaux de Surface (VRES)……….157 Case 1.14 Project Pilote de Promotion de l’Irrigation Privée (PPIP)………………....185 Case 1.15 Project d’Appui à la Promotion de l’Irrigation dans le secteur de Maninkoura (PAPIM)……………………………………………………..…………...194 Case 1.16 Phase II du Projet de Developpement en Zone Lacuste (PDZL)…………...204
NIGERIA CASE……………………………………………………………………….235 Case 1.17 Fadama Irrigation Projects, Phase I…………………………………………245 Case 1.18 Fadama Irrigation Projects, Phase II…………………………………..……269

6
SYNTHESIS The objective of the case studies was to supplement the desk review, focusing on recently implemented, not necessarily completed, projects, to assess to what extent the new trends in donors’ policies and procedures are implemented on the ground, to identify the constraints faced and the innovative ways of overcoming them. Five countries have been selected to conduct field case studies: Mali, Nigeria, Ethiopia, Madagascar and Zambia. A consultant (or team of consultants) has been hired in each country to conduct a three-part study: (1) a review of available literature on irrigation policy and projects in the country, in particular on planning and implementation processes; (2) lessons from key informants interviews, and (3) analyses of several case projects. Due to the poor quality of the report for Zambia, only the key findings were included and integrated in the synthesis based from the full report. The key informants included different government agencies; local and foreign contractors/consultants involved in irrigation projects; representatives of main multilateral and bilateral donors in irrigation sector; national research institutes; and NGOs implementing irrigation projects. The questionnaire covers the following issues: (a) description of the specific role of the interviewee in the project cycle; (b) identification of the other actors, with whom the interviewee interacts, personal view on these relationships; (c) identification by the interviewee of the most critical phases of the project cycle, examples of successes and failures of past project in the country, identification of the reasons of these successes and failures and of the actors who are responsible for them; and (d) suggestion for improving P&I process: in funding agencies, at country level, at local level. The analysis of specific project cases was based on an analysis of available project documents complemented by key informants’ shared information and knowledge to enrich the case analyses. Stakeholders involved in project planning and implementation at local level (project implementation unit, beneficiaries) have been interviewed. AN ANALYSIS OF FAILURES AND SUCCESSES
FAILURES It is worthy to note that findings from the case studies reinforced those in the desk review. Specifically, the factors contrbuting to failures and successes of the projects which occur at different stages of the project cycle and can be ascribed to various actors (mainly donors and government) were cited. At planning stage, the most often cited failures are the lack of participation of beneficiaries in identification and design (all countries), and the inadequacy of environmental studies (absence of aquifer studies in some Fadama projects in Nigeria, recurrent problems of erosion in upper catchments and siltation of hydraulic works in Madagascar). The lack of involvement of government agencies in preparation was also mentioned in Mali and Madagascar; related to this is the lack of technical capacities of governmental agencies in Ethiopia. Various weaknesses of preparation studies were highlighted (some non-farmer water users not taken into consideration in the Fadama project in Nigeria leading to conflicts after project completion; contribution of women to agricultural production ignored in Nigeria; not enough attention given to land issues in Mali and Zambia; field constraints not taken into consideration in Madagascar).

7
Some failures are attributed to donors: the rapidity of identification missions (Zambia), the absence of continuity in priorities and in funding (Mali), some inconsistency between donors priorities and government strategies (Mali). Among governmental failures at implementation stage, the most commonly mentioned are the lack or inadequacy of a monitoring and evaluation (M&E) system, which is not given enough attention during preparation (Madagascar) and suffers from the poor capacities of technical staff, and the lack of technical capacities at national or local level (Nigeria, Madagascar). Other government flaws range from untimely release of funds (Nigeria, Madagascar), to lack of incentives given to project staff (low salary, no means to undertake activities) (Mali, Madagascar), to delays in awarding contracts (Nigeria), and delays between project approval by donor and ratification at national level (Madagascar). The continuous structural changes in Ethiopian governmental institutions were cited as a major cause of loss of momentum and staff with consequences for project implementation. Political interference was mentioned in procurement procedures (Nigeria), in the choice of schemes to be rehabilitated and in the management of schemes (Madagascar). Donors are criticized for their inadequate supervision (Nigeria), and limited follow up on some aspects imposed in preparation studies (Ethiopia, Mali). Disbursement aspect is another area of concern: procedures are often considered as too complex with differences from one donor to another (Mali, Madagascar), and the focus on disbursement detrimental to project quality (Madagascar). Irrigation management transfer remains uncompleted in all the countries, especially in Nigeria and Madagascar. The main problem lies in the inadequate capacity building of individual farmers and Water Users Associations (WUAs) in irrigation management, accounting, banking and credit operations (Nigeria, Madagascar, Mali). Finally poor communication among various actors (foreign technical assistants, donors, projects managers, governmental officials in Madagascar, and from PMU to farmers in Zambia) was cited. In all countries, the lack of government (or donor) support after project completion was highlighted: farmers suffer from difficult access to good quality inputs and credit facilities (Ethiopia, Mali, Zambia), lack of extension services (Ethiopia), and poor access to markets (Nigeria, Zambia). Farmers have developed a high level of dependency syndrome, and they lack entrepreneurship and management skills (Zambia). Another area of concern is the frequent difficulties encountered by WUAs in operation and maintenance (O&M) (Ethiopia, Mali, Madagascar, Nigeria), in particular with water fees collection. Shortages of water were reported in Ethiopia, Mali and Madagascar. They are due to various reasons (insufficient pump capacity, dam silted up, upstream-downstream conflicts) that can be related to design flaws (water availability and pump capacity not assessed properly, environmental issues not taken into account). Related to P&I process is the absence of proper poverty impact assessments (Ethiopia). SUCCESSES In spite of these failures, some successes are also reported:
Positive impacts at farmer level are underlined: increased income and improved livelihoods (food security, ability to acquire professional and/or personal assets – cattle, transportation means, access to school, better housing...) (Ethiopia, Mali, Zambia in the case of a privately funded project, Nigeria);
The goals of simplifying drilling technology for shallow tubewells and upgrading of fadama irrigation technology were realized with positive effect on technology adoption (Nigeria).
8
Better access to markets is mentioned in few cases: WUA succeeded in implementing a marketing agreement with a vegetable trader in Addis Ababa in the case of Dodicha Small Scale Irrigation Project (SSIP), funded by the Ethiopian Social Rehabilitaion and Development Fund (ESRDF); association between a suger cane company and smallholders in the case of Kaleya scheme in Zambia (see below).
Among the country case studies, Mali shows the best results in various areas:
- Improved technical capacities of government organisations; - Enhanced participation of beneficiaries in planning and implementation (example of
Bewani in Office du Niger area, and VRES project funded by the European Union); - Integration of agricultural water developments within local development programs
(decentralisation process); - Good coordination of the different donors’ interventions thanks to a Coordination Unit
within the government (see also the Secrétariat multi-bailleur in Madagascar). - Accompanying decentralisation, government initiatives supported by bilateral donors
(USAID, Netherlands, Germany, Canada) to train local government staff in P&I process; - Better analysis of local context prior to project proposal, through early meetings between
staff in charge of preparation studies and beneficiaries (example of Special Program for Food Security funded by FAO);
- Guidelines on irrigation project preparation elaborated by FAO and WB are used, considered as relevant in the national context and incorporated into the national rural development strategy (Mali).
The Kaleya smallholder irrigation company scheme in Zambia (sugar cane project associating a private sugar cane company and smallholders as outgrowers) is an example of a successful private sector investment: the positive economic impacts on smallholders can be attributed to low market risks, reliable water supply and good maintenance of the scheme ensured by the company, prompt provision of inputs, and empowerment of farmers through their association, which is in the process of becoming a trust with shares in the sugar company. However, the role of planning and implementation processes in this succes is not clear. COMPARISON OF APPROACHES OF VARIOUS DONORS
Only in the Madagascar study was there an explicit comparison of approaches by the various donors. For instance, while project identification can be quickly done by the donor (as in AFD and EDF projects) relative to the government (as in World Bank, ADB, and IFAD projects), it often leads to poor ownership by government agencies. When the donor and government jointly identify a project, the process is rapid with good ownership from government, but can suffer from a low capacity to adapt to a new orientation. The WB process in PPI projects differs from ADB (PRBM) and IFAD (PHBM) processes on: (i) the involvement of beneficiaries during preparation (absent in the WB project), (ii) the participation of government in appraisal (absent in WB project), and (iii) the composition of the implementing agencies (government staff in WB project, autonomous Project Management Unit – PMU - in ADB and IFAD projects). In terms of funds release, the flexibility of IFAD funding is appreciated because it helps national and local governmental institutions with limited financial means to undertake on time some activities (acceptance of work done, regional planning, set up of a project advising
9
committee…). On the other hand, the rigidity of EDF funding with its compulsory amendments, and the slowness of ADB lending process due to the absence of a Bank representative in the country are stressed. EVOLUTION OF PLANNING AND IMPLEMENTATION PROCESSES If improving, the quality of preparation studies is still insufficient on environmental, social and economic aspects. Some aspects of preparation studies were undertaken to comply with donors’ requirements, but were not given enough attention and suffered from limited follow up during implementation. Marketing issues are completely absent from preparation studies. Impact assessment on poverty cannot be done due to lack of baseline analysis in preparation studies. However, the most recent projects show signs of improvement regarding environmental aspects (systematic aquifer assessment in Fadama II, catchment-irrigated scheme approach in Madagascar). The participation of beneficiaries remains very poor, even non-existent, in the planning phase, and is often limited to provision of labor and local material during implementation. However, in each country one or two examples of good farmers participation are also mentioned. Even if almost all projects include establishing a formal WUA, the process of irrigation management transfer is not completed: WUAs encounter problems to recover irrigation fees, access credit and repay loans, complete outstanding maintenance and provide farmers with adequate agricultural inputs. In terms of WUAs empowerment, one mentioned the creation of a special fund for the maintenance of irrigation and drainage networks in Madagascar (FERHA), and the long lasting support (20 years) provided by AFD to WUAs in the Lac Alaotra region. Lack of proper monitoring and evaluation system has been cited as a persistent major flaw in all country case studies. The main problems related to M&E are as follows: high variability of performance indicators across projects, lack of capacities of government and project staff in M&E (Mali), inadequacy of economic indicators (Madagascar), disbursement rate being the main performance criteria used by donors (Madagascar), project staff not giving proper attention to M&E (Madagascar, Ethiopia), lack of poverty reduction impact assessment (Fadama I project, Nigeria). In Mali, reform of the P&I process accompanies political decentralisation: implementation by an autonomous PMU, with specifically recruited staff; integration of irrigation projects within rural development programs developed by local government, post-implementation monitoring and support realised by regional or local technical offices. A generalization of projects funded by several better coordinated donors and the systematisation of pilot phases are also observed. In Madagascar, recent projects are characterised by a more integrated approach in terms of development (plateforme riz) and environment (catchment approach), better coordination of various donors’ interventions (secrétariat multi-bailleurs, Task force BV PI), and increasing participation of the government in project preparation. Participatory processes are generalised at all levels: from the formulation of the new irrigation policy to the involvement of farmers in project formulation and design. POINT OF VIEW OF LOCAL ACTORS Failures and successes cited by local actors do not differ from those mentioned in project documents or expressed by donor staff and reported in the desk review report. Of course, each category of actors has a tendency to point out others’ faults, i.e., government officials and project
10
managers complain about slow and complex donors’ procedures to release funds, poor support and communication during implementation, fluctuating priorities, and focus on disbursement achievements rather than on development effectiveness; and donors representatives point to political interference in the choice of project staff and in procurement process, and lack of logistic and financial means of governmental agencies. However, in some countries, local actors acknowledge their own weaknesses: lack of capacities and of financial means, lack of communication between ministerial departments, and between ministerial department and autonomous PMU, lack of motivation of government staff. Farmers seem to be more interested in project achievement and post implementation constraints then in P&I processes, on which they did not express any view, perhaps because they were not involved.
RECOMMENDATIONS Based on the country findings, Mali’s concerns are on ways to enhance the performance of implementing agencies and increase communication among stakeholders while Ethiopia’s felt need is related to providing support to farmers after project completion. In Zambia, the focus is on participation of farmers at various stages of the project cycle. Support to implementing agencies:
- Training of implementing agencies’ staff in monitoring and evaluation and harmonization of M&E procedures across donors and projects (Mali); training of local technicians in project proposal writing (Zambia)
- Setting national staff capacity building activities as a separate program, not included as part of investment projects; better planning of project staff training and better control of training quality; strengthening of local government staff capacities (Mali)
- Favoring the use of national and local capacities (Mali); - Using performance-related bonus and housing allowances to motivate skilled government
staff in charge of project management (Mali) Support to farmers and WUAs
- Supporting farmers’ organizations and individual farmers’ capacity building (Mali) - Markets: providing farmers with market information and access to storage facilities;
encouraging investments in processing plants using the farmers as outgrowers; improving rural transport systems; undertaking detailed market studies as part of project preparation; facilitating marketing arrangements between WUAs and cooperative unions (Ethiopia)
- Extension support: government assigning well trained development agents to irrigation schemes (Ethiopia)
- Operation and maintenance: increasing attention given to O&M during planning; clearly defining the roles of the various actors in this regard; preparing O&M manuals as part of the planning and implementation process (Ethiopia)
- Access to credit: including support for credit facilities in the project proposal to help farmers to cover the costs of their various inputs (Ethiopia)
- Training of beneficiaries in leadership and entrepreneurship (Zambia) - Supporting farmers throughout the project’s life (and even after) (Zambia) - Diversifying monitoring criteria of WUA performance (Madagascar) - Extending support to WUAs (Madagascar).
11
Farmers’ participation - Irrigation scheme designers and planners should learn farmers’ perceptions and rationale
about things like scheme layout, water application, etc. particularly in rehabilitation of traditional schemes. The WUAs should have direct participation in construction planning, management and supervision in order to ensure sustainability (Ethiopia).
- More careful situation analysis of the local context at identification and in-depth community needs assessment are recommended; identification report issued at the end of this phase should be reviewed by all stakeholders including farmers (Zambia).
- Project proposal reviewed by all stakeholders including farmers (Zambia) Donors and government
- Better coordination of donors, continuity in funding and priorities, simplifications of disbursement procedures; strengthening of supervision (Mali)
- Closer collaboration between donors’ staff and national and local project staff during various phases of project cycle, above all during implementation (institution of mutual confidence, quicker problem solving); implementation of a framework for dialogue between donors, national staff and beneficiaries (Mali)
- Providing timely required logistic at implementation, including disbursement (Zambia) - Project documents made available to the public (Zambia).
Private sector
- Support to private investments, especially in micro-schemes and in area with gravity irrigation (Mali)
- Creating a favorable environment for encouraging emerging local contractors to get involved in construction activities and for their participation in bids and assisting them to obtain useful experience (Ethiopia).
CONCLUSION In the next step towards the final Planning and Implementation component report, findings from the literature review and the case studies will be combined. A more systematic comparison of the successes and failures pointed by both literature and case studies will be undertaken allowing prioritization of problems and comparison of successes and failures according to the scale of irrigation development. The relationship between project cycle and elaboration of country strategy and policy dialogue will also be analyzed. Lastly, the challenges of aligning P&I process with the new development architecture will be examined.
12
Annex 1.1: Questionnaire for KeyIinformants
This questionnaire is meant to identify what are the most successful approaches in planning and implementing irrigation projects, the main reasons for their success and whether they can be replicated. Irrigation policy in relation with other sectoral policies
1. Is there an overall strategy regarding irrigation development (or more generally agricultural water development) in the country? If yes, how is it related to agricultural development strategy and water resources management strategy? Who has participated in its elaboration? If not, what can explain the absence of an irrigation strategy?
2. What is the government position regarding the following issues: project scope (irrigation / agricultural development / rural development), scale of irrigation schemes (large / small / individual technologies) and purpose of irrigation (food crops or high value crops for export), rehabilitation versus new schemes, type of design (water supply driven / water demand driven), irrigation management transfer?
3. Are there recent reforms in water policy at national level (regarding management and allocation of water resources, water rights, water pricing…)? If yes, what are their impacts on irrigation investments?
Roles and responsibilities of the different actors at country level 4. What are the roles of the different ministerial departments regarding planning and implementation
of irrigation projects? What are the relationships among them (good/poor communication and coordination, competition for human and financial resources)? What are their respective performances?
5. What are the other actors involved in P&I of irrigation project in the country (i.e., NGOs and private sector)? What are their roles? What are their relationships with the government? How are they performing?
6. What is the composition of project management units (national staff from irrigation agencies of specifically hired for the project, international consultants…)? What are the process and criteria for choosing them? Which degree of political interference in this process? What are their role and tasks? What are their main strength and weakness? Do donors influence the choice of project staff and how? Which degree of autonomy with respect to government? What incentives can be given to government staff that implement projects to ensure their commitment and good performance?
7. Role of consultancy: which type of tasks do they perform and at which phase of the project cycle are they preferably involved? Who decide to hire consultant rather than to use government staff? Perception of borrowers, implementing agencies and PMU on role of consultancy? Do donors influence the choice of consultants and how?
Specific aspects of the project cycle: 8. What are the most critical phases of the project cycle with respect to project performances?
Explain why 9. How are irrigation projects identified? What are the respective roles of donors and governments
in this process? Who takes the lead? Is this process satisfying or not? Why? What are the consequences of the identification on further planning and implementation of projects? What improvements can be suggested? What can be done at implementation stage to increase the probability of the project getting funded? How to increase the quantity and quality of agricultural water development projects?
10. Regarding preparation is it worth increasing donors’ involvement (more staff and more time) or setting capable structures at national or regional levels?
What are the approaches which succeed in benefiting the poorest rural people? What can the government/donor do to ensure the quality of technical design and its adequacy to local needs and capacities?
13
11. Same questions for the implementation phase? 12. What do you think of the idea to integrate more experimentation in projects with more
systematically a pilot phase? Examples of unsatisfying and successful irrigation projects
13. Cite examples of unsatisfying/successful irrigation projects and explain why they were so. What are the criteria used to assess the performances of projects? Are these criteria imposed by donors or specific to the country?
Government initiatives to improve project quality: 14. Are there national or regional initiatives to build capacities in irrigation project P&I? Is it worth
including capacity building component for support staff within the project or having a separated capacity building program?
15. What systems are put in place for monitoring and evaluation? Advantages and drawbacks? 16. Has government defined its needs in term of external assistance or is assistance asked on a case
by case basis? 17. What kind of incentives can be implemented to keep in the country skilled and trained staff? 18. Other initiatives?
Participation of beneficiaries 19. Can you give examples of participatory approaches that succeeded in targeting the poorest and in
getting them participate in the planning? What are the main characteristics of these approaches that explain this success? Do you think they can be replicated in other projects/countries?
Opinion on donors’ performance? 20. Do you think that assistance provided by donors at different stages of the planning and
implementation of irrigation projects is adequate? Why? At what stages is this assistance most critical? What kind of actions are most likely to improve P&I process and then project performances?
21. Are donors (and which ones) taking initiatives to help building capacities at national level? How are these initiatives doing? Are they effective?
22. Do you think that interactions between donors’ staff and national staff at government or local level are sufficient?
23. What incentives can be given to donor staff to ensure they interact sufficiently with local stakeholders during the planning and implementing phases?
How are new initiatives from donors taken into consideration? 24. Do national participants use the FAO guidelines and/or tools proposed by WB? If not why? If yes
what do they think of them? Do they need any improvements? On what aspects? 25. How new guidelines and policies regarding health and environmental impacts, poverty impacts,
gender issues, IWRM, participation of beneficiaries, land tenure are implemented on the ground? What are the main successes and difficulties?
26. What are the impacts of new instruments of development assistance such as Poverty Reduction Strategy Paper (PRSP), Sector Wide Approach (SWAp), Comprehensive Development Framework (CDF), Water Resource Management Plan (WRMP) on agricultural water investments?
27. To what extent are the Quality at Entry principles applied on the ground? 28. what are the method used to assess the government’s ownership of the project?
14
Annex 1.2: List of projects analysed in each country Mali Pilot Private Irrigation Promotion Project (funded by the World Bank) Maninkoura Irrigation Scheme (funded by the African Development Bank) Zone lacustre Development Project Phase II (funded by IFAD) Valorisation des Ressources en Eau de Surface (in the framework of the Programme d'appui à la filière riz, funded by EU) Nigeria National Fadama Development Project funded by World Bank (Fadama I) Second National Fadama Development Project, co-funded by World Bank and African Development Bank (Fadama II) Ethiopia Sheled project (IFAD Special Country Program Phases I & II) Weyu Seriti Pump scheme (OIDA/ESRDF Scheme) Dodicha Pump irrigation (ESRDF/OIDA scheme) Bato Degaga pump irrigation (World Vision Ethiopia scheme) Doni Kombe gravity irrigation scheme (CARE scheme) Godino Rehabilitation and Expansion SSI (Government Funded Project) Wakie Teyo small pumps ( Private/farmers initiated) Koga irrigation and watershed management project (ADB funded project). As this project is still in its early phase, its analysis was only based on project documents. Madagascar Projet de réhabilitation des petits périmètres irrigués phase 1 (co-funded by World Bank, European Union and Agence Française de Développement) Second irrigation rehabilitation project (World Bank funded project) Projet de réhabilitation du périmètre de bas Mangoki (ADB funded project) Projet de mise en valeur et de protection des bassins versants du Lac Alaotra (AFD funded project) Zambia Small-scale Irrigation Project (ADB funded project) The Kaleya outgrowers scheme (smallholders scheme supported by Zambia Sugar company) Smallholder Irrigation and water Use Program (IFAD funded project)

15
Annex 1.3 : Fact sheet on project Name of the project Size of scheme (ha) or Average annual volume of water abstracted (m3) Total cost of the project Location of the scheme (lat /long) Type of scheme Agro- Production System Brief description of the scheme – including the way it is operated What was the justification or reason for implementing the scheme? What was the phasing of the project? Are some steps missing compared to a standard project lifecycle? How long did it take to achieve each stage, compared to the timeframe that was planned? Who are the main actors involved in each steps (in particular intervention of consultants)? What are the management tools used if any? Were they developed specifically for the project or standardized one supplied by the donor or the government?
Identification and preparation How was the project identified? Was it a donor, country or local initiative? Who are the different stakeholders? How were they involved at different stages of the project? What types of pre-feasibility studies have been done? Who did them? Did the government receive any financial support to carry on the studies? Who defined the TORs of the studies? How this project fit into strategic frameworks (PRSP, Water management master plan…)? Definition of the beneficiaries and situation assessment How was the project location chosen? What was the balance between technical, social, economical and political arguments? What are the beneficiaries of the project? Did they participate in the project objectives definition? What means have been taken to insure that the project will benefit the poorest? What kind of participatory approach was undertaken? Did it work? Give reason for success or failure. Was the heterogeneity of beneficiaries assessed and taken into account (for example, has a farm typology been built?)? Were the differences of situation and potential benefits between men and women assessed? Have the diversity of sources of livelihood of the potential beneficiaries and the competition with non-irrigation activities, in terms of manpower and credit resources, been taken into account? What is the origin of data used for the economic appraisal (standardized data or local surveys?) Have land issues and market aspects been covered? Definition of the objectives What were the objectives of the project? How were they defined? Is the national investment strategy clearly stated? Does the project fit these priorities? Participation process What is the degree of involvement of the public (PP as a way to empower stakeholders or as a mean to enrich the decision making process)? What was the level of participation: information supply, consultation, discussion, co-designing, co-deciding)? Who was involved in the participation process (users, representatives, how were they designated?)? What was undertaken to make the poorest population participate in the planning process? When? At what stage of the planning process was the public involved (from the outset, only at the end)? How long did take the whole process?

16
How? What information was given to the public? At what geographical scale (whole scheme, tributaries, communities) was the participation organized? What were the main subjects of consultation/discussion? Have engineers and technicians enough capacity to undertake a participation process? What were the outputs of the public participation? How did the planning team use these results? Has a Water Users Association been created? When? Who is involved in it? Who took the initiative? (government, local community, planning team) Technical design What are the main technical characteristics of the project? Do they fit the technical capacity and credit resources of the users? How was this checked? Are the technical choices relevant in terms of costs and adaptation to the local context? How were addressed O&M and water fees issues? Were the risks associated with the different technical options assessed? Who did take the technical decisions? (Finance Department, agency in charge of the management, agency in charge of the development). Have the users taken part in the decision regarding technical choice? What was the composition of the appraisal team? Was the capacity of the government agency sufficient? Did the technical assistants interact with the local stakeholders during the planning process and after? Assessment of external impacts and integration of the project in a river basin perspective Have the consequences of the project on the others water uses been measured? How? Have the different categories of users been involved in this assessment? Which ministerial departments were involved in this assessment? Has a water resource allocation plan been set up for normal and dry hydrological years? Have the impacts on environment been assessed? Was there some training for the project implementing unit before the project started or during implementation? If yes what? Was it effective and sufficient? What were the incentives given to the PMU to ensure that they perform well? Were these incentives adequate? How can they be improved? Implementation and supervision Delays What was the forecasted timeframe for implementation? Was it respected? Where did the delays take place? What are the main cause of these delays? Did the donor impose any conditionality to transfer funds? Which ones? What were the consequences on the time and cost of implementation? Supervision by donors How often did the project receive supervision, what is the composition of the supervision team? How long did they last? What are the TORs for these missions? How and by whom are they defined? Who are the persons interviewed during these missions? Is there a field visit? What are the other opportunities of exchanges between donors’ staff and national staff (PMU and government)? Is the donor’s supervision judged sufficient by the government and by the beneficiaries? Relationships between the PMU and the government What is the degree of autonomy of the project team towards the governmental departments? Was there any hierarchical relation between them? Were the responsibilities of each actor well defined?

17
What was the composition of the project team? Monitoring and evaluation What kind of indicators has been set up to monitor the project? Who is in charge of the monitoring? How is the information about the project disseminated? What was the composition of the evaluation team? What are their relationships with the government departments and agencies? Water Users Association When has it been set up? Who took the initiative of creating this WUA? Did the WUA receive some help from the government or the irrigation agency for its creation and/or its functioning? What is the composition of the management committee? Did the members of the MC receive training? What are the roles and functions of the WUA? Does the WUA succeed in fulfilling these roles? Is the WUA involved into O&M? Do the governmental agencies and the water users recognize the MC decisions? Private sector Is the private sector involved in the implementation of the project? What kind of private sector is involved (large commercial enterprises, small scale enterprises, users themselves)? What is the role (if any) of NGOs? Functioning What are the relationships between the ministerial department in charge of the development of water projects and the one in charge of their management? How are the responsibilities shared among the different stakeholders? Has the department in charge of management been involved from the outset? How much funds are dedicated to O&M tasks? Is the agency in charge of water projects management autonomous with respect to the ministerial departments? Is the WUA involved in the decision process regarding the functioning of the project?

18
19
IRRIGATION, PLANNING AND IMPLEMENTATION: ETHIOPIA CASE
STUDIES
OCTOBER 2004

22
Table of Contents……………………………......…………………………..Page PART I MAIN REPORT 23 INTRODUCTION 23 RESEARCH METHODOLOGY 23 LITERATURE REVIEW 24 Overview Of Irrigation Development In Ethiopia 24 Irrigation development policy vis á vis the national water resources management policy 25 Linkages with other sectoral policies 26 Sector actors and their roles and responsibilities 27 Aspects of the project cycle 28 EVOLUTION OVER TIME OF PLANNING AND IMPLEMENTATION APPROACHES 28 The River Basin Planning Approach 28 Planning Approach of Small and Medium Scale Irrigation Financed by Donors 29 The IFAD special country program Phase I 30 PLANNING AND IMPLEMENTATION PROCESS EMPLOYED BY ESRDF PROJECT 33 Project Formulation And Implementation Cycle 34 Gaps Identified 39 Planning and Implementation Process employed by IFAD 39 Project Implementation Arrangements 39 Program Midterm Review 40 Supervision mission 40 Summary of the IFAD Phase II Implementation Guideline 40 The Federal Ministry of Water Resources 44 Gaps and efforts made to improve the planning and implementation process 45 Quality of Preparation Studies 45 Participation of beneficiaries, irrigation management transfer 46 Monitoring and Evaluation System 46 Local capacities and international technical assistance 46 Agricultural development and irrigation investment 47 Environment and health aspects 47 Roles sharing among ministerial departments and executing agencies 48 Point of view of local actors (at national and project levels), differences with donors point of view or views expressed in project documents. 49 Views on planning and implementation 49 Views of the ESRDF staff on planning and Implementation 49 HIGHLIGHTS OF KEY FINDINGS, OBSERVATIONS AND RECOMMENDATIONS 51 Issues Related to Production 51 Issues Related to Planning and Implementation 52 General observations 53 Key Recommendations 53 PART II SUMMARY OF CASE STUDIES 56 CASE 1 DONI KOMBE SSI PROJECT/ FUNDED BY CARE ETHIOPIA 56 CASE 2 BATO DEGAGA SSIP/FUNDED BY WORLD VISION ETHIOPIA 59 CASE 3 WAKIE TIYO SSIP/SMALL HOLDER PRIVATE INITIATIVES 61 CASE 4 SHELED SSIP/IFAD FUNDED PROJECT 64 CASE 5 DODICHA SSI/FUNDED BY ESRDF 67 CASE 6 WAYU SERITI SSIP/ESRDF FUNDED PROJECT 69 CASE 7 GODINO REHABILITATION AND EXPANSION SSI/GOVERNMENT FUNDED PROJECT 71
23
PART I MAIN REPORT
INTRODUCTION
1.1 Relative to its neighbors, Ethiopia is endowed with water resources. The country has 12 river basins with an estimated annual flow of about 122 billion m³ of water. The ground water potential is also estimated at 2.6 billion m³1.
1.2 However, over the past three decades recurrent drought is affecting the lives of millions of Ethiopians every year. Although the degrees of the effects of drought vary from year to year, drought has been a recorded phenomenon in Ethiopia since 250 BC2.Notwithstanding; surface water resources are ample though their spatial distribution limits their utilization. However, more than 80% of the country’s water resources are concentrated in the Western part where only a third of the population reside, while the Eastern part with two thirds of the country’s population has 11% of the surface water resources. In fact this portion of the country is the one that suffers most from erratic rainfall pattern3.
1.3 With the exception of the Awash River, an estimated 70% of the total river basins of Ethiopia’s
major rivers are trans-boundary. Ethiopia is contributing 86% of the Nile water compared with the other riparian countries. The country’s rugged topographic feature coupled with the lack of investment and technical capacity, as well as the tans- boundary nature of the major rivers has been a major obstacle to the development of large and medium scale irrigation project in the country. However, small scale irrigation development is generally feasible throughout Ethiopia wherever soils and water are of adequate quantity and quality.
1.4 Rainfall variability is considered to be the major constraint to grow at least one crop per year in the drought affected regions of the country. In such localities, the provision of supplementary irrigation is crucial to ensure at least one crop per year. In spite of the potential and the need, investment in irrigation development is insignificant. To date it is only less than 3% of the country’s fresh water resources that has been used for irrigation development. The country’s Agricultural Development Led Industrialization (ADLI) Strategy considers irrigation development as a key input for increasing agricultural production.
RESEARCH METHODOLOGY
1.5 The overall objective of the study is to assess information available regarding irrigation projects planning and implementation.
1.6 The study approach is divided into three sections as follows:
Part I: Required the carrying out of an extensive survey of existing literature on planning and implementation of irrigation projects in the country; and come up with a summary of findings from the literature review. Part II: Involved key informant interviews including: Concerned government agencies, contractors and consultants involved in irrigation projects, multilateral and bilateral donors involved in irrigation projects, national research institutes, NGOs implementing irrigation projects as well as actual project beneficiaries at field level.
1 MoWR, Water Sector Development Program 2 Famine in Ethiopia: Policy Implications of Coping Failure at National and Household Levels, Patrick Webb et al International Food Policy Research Institute 3 Federal Democratic Republic of Ethiopia; Ministry of Water Resources; Ethiopian Water Resources Management Policy
24
The interview is based on experience on the planning and implementation process of irrigation projects. Classifying reasons for success and failure according to the stage of the project cycle and the actors responsible. Part III: Concerned an in depth analysis of Projects currently being implemented by IFAD, ESRDF, AfDB, OIDA, NGOs and the Private Sector. The study was complemented by a field visit and assessment of seven sample projects on the ground. The clusters of projects were selected based on several factors including among others: Access and proximity to Addis and agro- ecological representation. For data collection and information gathering, several people and organizations were contacted. Their list is presented in Annex 3.
LITERATURE REVIEW
Overview Of Irrigation Development In Ethiopia
1.7 The total irrigation potential of Ethiopia is estimated at 3.7 Million ha. The total net irrigation potential for small scale irrigation is estimated to be 472900 ha4. The total area of irrigation schemes constructed between 1989- 1992 is approximately 41000 ha. (Alwero 10,000 ha; lower Omo 10,000; Meki- Zwai 3000 ha; Alaba Kulito 3,700 ha; Gode West 8000 ha; Jijiga 300 ha; Angellele irrigated pasture 3000 ha; Borkena 3000 ha. 5 According to the official estimate of the MoWR WSDP, out of the total of 197250 ha of land areas currently under irrigation in Ethiopia 98625 ha.is under SSI while the rest 98625 ha. is under large and medium scale irrigation. Until 1991, the area under small scale irrigation was 64000 ha, while that under medium and large scale irrigation was 112,105 ha. The total area under irrigation had increased by 22000 ha from 176,105 in 1991 to 197,250 ha in 1998. Most of the increase is attributed to the expansion of small scale communal irrigation schemes during that period. However, the rate of growth of medium and large scale schemes was literally stagnant during this period owing to lack of major funding sources as well as the emphasis given to small scale water harvesting activities. During the period 1992-1998, 21,000 ha of state farms irrigated in the middle Awash, lower Awash and the Rift Valley were abandoned Several modern small scale irrigation schemes built with government or NGO support have also been abandoned6. The reason for abandonment or suspension of irrigated areas is mainly attributed to the need to reallocate land from the public sector to peasant farmers, problems associated with poor management and inappropriate operation and maintenance. Other reasons are the loss of land due to soil salinity and vulnerability to flooding particularly in the Awash Valley. Currently 18 modern private irrigation projects are operating over a total area of 6000 ha located in Oromia, SNNPR and Afar regions7. In Tigray, Amhara and SNNPR regions most modern irrigation schemes are communal irrigation schemes. In the Oromia region some 30,000 ha (28%) are under state farm management.
1.8 According to the Central Statistical Authority (CSA) of the total irrigated area under temporary crops 22.9% was cultivated by maize followed by sorghum 14.2%, of the total irrigated area of permanent crops 8.3 was covered by chat followed by coffee with 7.8%. The area under traditional irrigation in Ethiopia is estimated in 1992 at 60,000 ha. According to the CSA, the extent of traditional irrigation in Ethiopia was about 63000 ha in 1998/99. According to a World Bank study, since 1972 a total of 82890 ha have been irrigated by modern irrigation schemes (mainly river diversion) the study quotes OIDA figure as total irrigated area in
4 MoWR,Water Sector Development Programme;July 2003 5 MoWR: - Water Sector Dev’t Programme: - Sector Review Report; February 2001. 6 Promotion of Small Scale Irrigation in Food Insecure Woredas of Ethiopia. The World Bank. Chris T Annen 7 MoWR,Water Sector Development Programme;July 2003

25
Oromia region to be in the order of 106128 ha out which a total of 54809 ha is irrigated traditionally8.
1.9 The study also quotes CO-SAERAR in that the organization has brought 6700 ha under irrigation with an additional 3000 ha established by NGOs such as ORDA, MFM, FFH, SOS Sahel and others. Based on a regional survey, the total area irrigated by traditional methods is estimated to be 65000 ha. In Tigray a total of 3888 ha is currently irrigated. Micro dams constructed over the past six years currently irrigate 1170 ha9. Most irrigation schemes use surface water. Ground water irrigation schemes are planned as part of two large scale irrigation development projects. The Raya Valley Integrated Development Project in Tigray region and The Kobo-Girana Valley Integrated Development Project (amhara region). These two ground water resources based irrigation projects are planned to employ mainly drip and sprinkler irrigation system10. According to the Water Sector Development Program, It is targeted to develop 127138 ha of additional small scale irrigation and 147474 ha of large and Medium scale ;in total 274,612 ha during the period 2002-2016.It is envisaged that by the year 2016 the total irrigated area by small and medium and large scale irrigation will be 471862 ha.11The estimated financial requirement is 877.6 Million USD. The share of investment is 74% by the Federal Government while 26 % is by the Regional Governments12
Irrigation development policy vis á vis the national water resources management policy
1.10 The Ethiopian Water Resources Management Policy embodies the whole range of Integrated Water
Resources Management including Irrigation development. The irrigation policy covers policies regarding stakeholders’ issues, economics and finance issues, technical issues, environmental issues and institutional and capacity issues in particular. The general policies on irrigation are13:
• To ensure the full integration of irrigation with the overall framework of the country’s socio-economic development plans, and more particularly with the Agricultural Development Led Industrialization (ADLI) Strategy.
• Promote the development of irrigation based on: strategic planning for achieving socio-economic goals and participatory approach for promoting efficiency and sustainability.
• Develop irrigation within the framework of the overall water resources management policy. • Allocate a reasonable share of the GDP for irrigation development. • Promote decentralization and user-based management with a special emphasis to the needs
of rural women. • Develop a hierarchy of schemes on the basis of achieving food self sufficiency and
production of industrial raw materials. • Support and modernize traditional irrigation by providing inputs that would improve their
efficiency. • Protect and maintain acceptable water quality standards for irrigation. • Develop water allocation and priority setting criteria. • Integrate the provision of appropriate drainage facilities as part and parcel of the irrigation
infrastructure.
8 Promotion of Small Scale Irrigation in Food Insecure Woredas of Ethiopia.The World Bank September 2001.Chris T Annen. 9 Ibid 10 Ibid 11 MoWR,Water Sector Development Programme;July 2003 12 Ibd 13 The Federal Democratic Republic of Ethiopia; Ministry of Water Resources; Ethiopian Water Resources Management Policy 1999.

26
• Enhance the participation of Regional and Federal Governments in the development of large scale irrigation.
The policy also covers issues in regard to: o Full involvement and participation of all stakeholders in all phases of the project
cycle. o Developing various norms, procedures and guidelines in regards to financial
sustainability, promotion of credit and cost recovery mechanisms. o Development of appropriate and affordable designs and technologies, technical
guides, standards and design manuals. o Mitigation of negative environmental impacts. o Institutional capacity building and improvement in productivity.
Linkages with other sectoral policies
1.11 The Ethiopian Government’s Agricultural Development Led Industrialization (ADLI) Strategy
focuses on food self sufficiency at the household level and to develop an agricultural-based industrial development in the long run. This strategy could only be achieved through increasing agricultural productivity by addressing the problem of shortage of water through the introduction of irrigation development. Hence the irrigation policy is directly linked to ADLI. The main focus of the Ethiopia’s Sustainable Development and Poverty Reduction Program (SDPRP) rests on agriculture which is the source of livelihood for the Country’s rural population where the majority of the population resides. Hence the water development Strategy which encompasses Irrigation Development is also linked with SDPRP. Small scale irrigation, water harvesting and agricultural research are considered to play a significant role in ensuring long term food security. The linkages of these sectoral policies are shown below:
Fig.1 Linkage between water Resources Management, Policy, Strategy and legislation14 Water Legislation National environmental Policies and strategies
14 MoWR,Water Sector Development Programme;July 2003
Economic Development (SDPRP)
Water Resources Management Policy
Water Strategy
WSDP
Individual Projects
River Basin Master plan
Projects identified from other resources
27
Sector actors and their roles and responsibilities
1.12 The main Water Sector Actors in Ethiopia could be categorized as follows:
a) Government The Ministry of Water Resources (MoWR) has a mandate for the overall responsibility for all water development issues including the task of developing a coherent national policy and strategy. It is also charged with a task of among others: issuance of directives, standards and guidelines and allocation of water resources among the different uses. The Ministry of Agriculture (MoA) has undergone a recent reform (2004) with a mandate for small scale irrigation and water harvesting schemes. The Ministry is also responsible for Agricultural Extension Service, Irrigation Agronomy, Crop Protection, Soil and Water Conservation, Forestry and agricultural Marketing among others. b) NGOs In the aftermath of the catastrophic drought of 1984 several NGOs got involved in small scale irrigation and water harvesting as a strategy for reducing dependence on the vagaries of nature. Few of the most active NGOs in the irrigation sector are:Lutheran World Federation(LWF),World Vision Ethiopia(WVE),Menchen Fur Menchen(MfM),Relief Society ofTigray(REST),Organization For The Relief and Development of Amhara(ORDA) and Mekane Yesus Church and CARE. c) Multilateral Organizations The main multilateral agencies involved in the irrigation sector in Ethiopia are: The International Fund For Agricultural Development(IFAD) whose intervention in small scale irrigation dates back as far as 1988 through the financing of the Special Country Program with the objective of developing 4400 ha irrigation executed by the Irrigation Development Department of the Ministry of Agriculture. Currently IFAD is financing the Second phase small scale irrigation project covering 7473 ha executed by the Federal Ministry of Water Resources. The African Development Fund’s role in the irrigation sector dates back to the early eighties with the financing of the Small Scale Irrigation Project in The Ethiopian Highlands jointly with The United Nation’s Capital Development Fund (UNCDF).The project was planned to irrigate some 5000 ha of land and executed by MoA IDD.Currently, ADF has agreed to finance the Agriculture Sector Support Project with a total cost of 61 million UA.The sector support project includes small scale irrigation and water harvesting component. The Bank Group is also financing the Koga irrigation and watershed development project at a cost of UA 38 Million. d) Private Sector Initiatives Due to the high investment cost, and the lack of incentives the private sector is not attracted to invest in irrigation development. In the early sixties, the private sector started irrigated cotton farming in the Awash Valley. These were however; nationalized and converted to state farms by the Military Government. Currently small holder private sector investment is rapidly growing in areas where there is market access. e) Bilateral Organizations The following multilateral organizations are said to have some form of activity in the irrigation sector; The Swedish International Development Agency (SIDA),Ireland Aid, USAID, Ethio-Italy Arsi-Bale Integrated Rural Development Program, GTZ and JICA.
28
Aspects of the project cycle
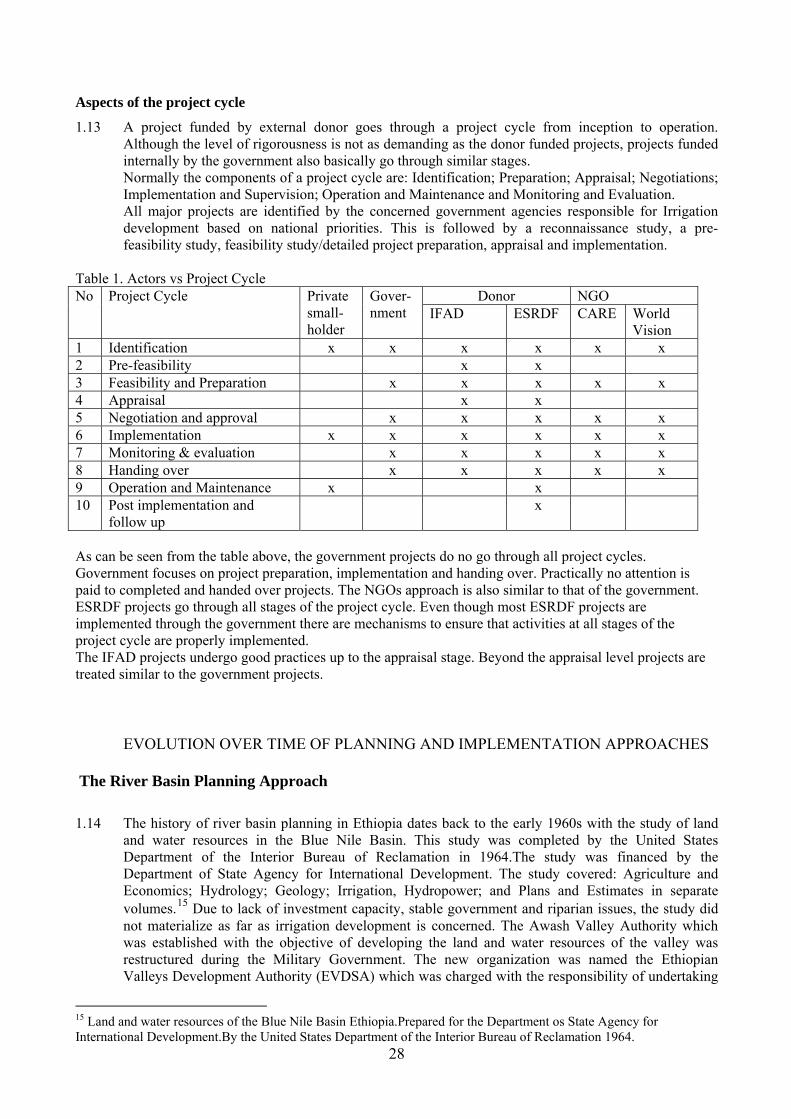
1.13 A project funded by external donor goes through a project cycle from inception to operation. Although the level of rigorousness is not as demanding as the donor funded projects, projects funded internally by the government also basically go through similar stages. Normally the components of a project cycle are: Identification; Preparation; Appraisal; Negotiations; Implementation and Supervision; Operation and Maintenance and Monitoring and Evaluation. All major projects are identified by the concerned government agencies responsible for Irrigation development based on national priorities. This is followed by a reconnaissance study, a pre-feasibility study, feasibility study/detailed project preparation, appraisal and implementation.
Table 1. Actors vs Project Cycle
Donor NGO No Project Cycle Private small-holder
Gover-nment IFAD ESRDF CARE World
Vision 1 Identification x x x x x x 2 Pre-feasibility x x 3 Feasibility and Preparation x x x x x 4 Appraisal x x 5 Negotiation and approval x x x x x 6 Implementation x x x x x x 7 Monitoring & evaluation x x x x x 8 Handing over x x x x x 9 Operation and Maintenance x x 10 Post implementation and
follow up x
As can be seen from the table above, the government projects do no go through all project cycles. Government focuses on project preparation, implementation and handing over. Practically no attention is paid to completed and handed over projects. The NGOs approach is also similar to that of the government. ESRDF projects go through all stages of the project cycle. Even though most ESRDF projects are implemented through the government there are mechanisms to ensure that activities at all stages of the project cycle are properly implemented. The IFAD projects undergo good practices up to the appraisal stage. Beyond the appraisal level projects are treated similar to the government projects.
EVOLUTION OVER TIME OF PLANNING AND IMPLEMENTATION APPROACHES
The River Basin Planning Approach 1.14 The history of river basin planning in Ethiopia dates back to the early 1960s with the study of land
and water resources in the Blue Nile Basin. This study was completed by the United States Department of the Interior Bureau of Reclamation in 1964.The study was financed by the Department of State Agency for International Development. The study covered: Agriculture and Economics; Hydrology; Geology; Irrigation, Hydropower; and Plans and Estimates in separate volumes.15 Due to lack of investment capacity, stable government and riparian issues, the study did not materialize as far as irrigation development is concerned. The Awash Valley Authority which was established with the objective of developing the land and water resources of the valley was restructured during the Military Government. The new organization was named the Ethiopian Valleys Development Authority (EVDSA) which was charged with the responsibility of undertaking
15 Land and water resources of the Blue Nile Basin Ethiopia.Prepared for the Department os State Agency for International Development.By the United States Department of the Interior Bureau of Reclamation 1964.
29
the studies of medium and large scale irrigation schemes. This was replaced by the Water Works Design and Supervision Enterprise (WWDSE) and the Master Plan for Integrated River Basin Development which is responsible for a holistic planning of the major river basins in the country under the auspices of the Federal MoWR has prepared over the past 8 years master plans for integrated basin development of 5 major basins including the Abay, Baro- Akobo, Gibe- Omo and Tekeze basins which have already been completed while those of Genale- Dawa and Wabe- Shebele are under preparation. It is also planned to revise the Awash master plan soon. All these studies were funded from government sources realizing that such studies are imperative for a holistic water resources development as well as form the basis for Country Wide Integrated Water Resources Master Plan.16
Planning Approach of Small and Medium Scale Irrigation Financed by Donors 1.15 The following examples of Donor planning and Implementation Approach were taken from past and
present projects financed by Donors. The FAO Investment Center which was responsible for the Preparation of “Small Scale Irrigation Project in the Ethiopian Highlands” in 1983 proposed the following planning and implementation modality for small scale irrigation project17.
a) Site selection to be based on the identification of expressed local needs or existing irrigation activities requiring assistance.
b) The identification process was envisaged to be based on formal contacts between woreda level DAs and representatives of peasant organizations.
c) The initial screening of project requests to be under taken at central level, by the Soil and Water Conservation Department (SWCD) technical staff on the basis of responses to questionnaires completed by the Development Agents( Das).
d) After screening is conducted reconnaissance surveys will be carried out at the selected schemes by SWCD technicians.
e) Then subsequent short lists of possible projects are reviewed by the Surface Water Development Division(SWDD) design unit in collaboration with the Planning and Programming Department( PPD), Peasant Association and Cooperatives Department (PACD) and other concerned departments.
f) After scheme selection is done, detailed surveys and designs are carried out by central SWDD staff. In regards to project Implementation the following modality was suggested18:
I. SWDD staff assigned to and stationed at either the project site or a near by site, are charged with
the responsibility of supervision of irrigation construction. II. SWDD engineers stationed at the regional centers are responsible for the over all supervision of
scheme development. It is envisaged that each project would require the full time presence of at least one building supervisor during the main construction season.
III. Although it is understood that total reliance on freely-contributed labor can delay project works implementation there by under utilizing scarce technological and supervisory staff; it was agreed that project works would generally be carried out by direct labor methods. However, in some cases its use is inappropriate for works requiring close control (earth works compaction) or as support to skilled inputs (concrete or masonry construction)
IV. It is therefore anticipated that free labor would generally be used for works which are relatively quickly achieved using labor intensive methods that require less supervision.
V. Responsibility for the construction of access roads was left with the engineering services department /MoA who have extensive experience of rural road construction using both self-help and mechanized method.
16 MoWR,Water Sector Development Programme;July 2003 17 Ethiopia Small Scale Irrigation Project Preparation Report; FAO/African Development Bank; Inverstment Center; Food and Agriculture Organization of the United Nations. August 1983 18 Ibid

30
VI. It is envisaged that small earth works (small earth dam or flood protection bund, construction etc) could be under taken using currently available SWCD equipment or by hiring additional necessary plant from local contractors or the High Ways Construction Authority.
VII. Maintenance of irrigation infrastructure works would primarily be the responsibility of the Peasant Associations (PAs) or Producers Cooperatives (PCs) concerned.
VIII. The project would train village-level technicians during construction, in order that they should undertake the organization of scheme operation and maintenance once construction is completed.
1.16 However, along with the restructuring of the MoA in 1984 and the creation of the Irrigation
Development Department (IDD) under the Rural Infrastructure Development Main Department; a change in the above modality was eminent. It was required to set-up a Project Management Unit (PMU) (an autonomous body under the IDD) to be responsible for the execution of the project. The ADF project PMU was responsible for all the planning and implementation activities with the support of a TA team specialized in the areas of: irrigation engineering; irrigation agronomy; and Marketing. For each expatriate TA, a local senior counterpart was assigned for the sake of knowledge transfer and sustaining experience in irrigation development. Manpower and experiences were also shared between the PMU and the Irrigation Projects Study and Design Division of IDD. A small PMU Team was also set-up at the Zonal level to implement the project directly with the support of the Zonal Irrigation Brigades. There were constraints and delays in the procurement of services such as equipment and Technical Assistance mainly due to Donor requirements and government bureaucracies as well as delays in getting no objections from Bank staff assigned for the project. This had a lot of negative impact on the pace of project implementation.
The IFAD special country program Phase I 1.17 The IFAD Special Country Program which was financed by IFAD, IDA and OPEC Fund in 1988 and
executed by the Ministry of Agriculture adopted the following planning and implementation modalities19:
A. Organization and Coordination
I. The irrigation development department (IDD) under the vice Minster for Rural Infrastructure Development Main Department was responsible for the national support component of the small scale irrigation sub programme.
II. The zonal managers were responsible for zonal support and scheme construction components, under the technical guidance of IDD.
III. The Agricultural and Industrial Development Bank (AIDB) would be responsible for the scheme construction component where credit would be utilized.
B. Central Coordination Committee The Government of Ethiopia was required to establish a Central Coordinating Committee, to ensure smooth coordination between the various departments. The members of the committee were the Vice Minister for Rural Infrastructure Development Main Department (chair man), the General Manager of AIDB, the MoA Zonal Mangers and the Department Heads of IDD, Agricultural Extension Department (AED), Agricultural Development Department (ADD), Community Forest and Soil Conservation Development Department ( CFSCDD),Animal Husbandry and Feed Development Department ( AHFDD) and Planning and Programming Department ( PDD).
19 Staff Appraisal Report; Ethiopia Special Country Program .January 14,1987The World Bank Eastern and Southern Africa Region, Northern Agriculture Division

31
The committee was responsible for:
I. review and approval of annual work programs and budgets based on the draft prepared by the implementing department and AIDB, and operational policies;
II. review and approval of semiannual program reports prepared by the implementing departments and AIDB;
III. coordination and cooperation between the implementing departments and AIDB20. Committee Meetings The committee was required to meet twice yearly or as circumstances require.
C. Technical Support Unit The committee was serviced by the Technical Support Unit of the PPD of MoA. The Unit compiles the necessary documentation and budgets prepared by the implementing departments and AIDB as well as prepare minutes of the meetings and maintain basic documents, progress reports and information on budgets and procurement. The Project Coordinator was also responsible for a) Operating the special accounts, b) Coordinating disbursement and withdrawal applications and
c) Assisting project agencies with procurement and in general encourages and helps the different project agencies to overcome difficulties arising during the program start up period.
D. Planning and Implementation of the Small Scale Irrigation Subprogram21
I. reconnaissance and preparation work was carried out by the Project Studies and Preparation II. Division of IDD at headquarters.
III. designs are prepared with the assistance of technical staff from other departments and in IV. consultation with the WRDA and expatriate consultants at the headquarters. V. the Irrigation Development Brigade at the MoA Zonal Offices were charged with the
responsibility of constructing the schemes. VI. maximum commitment and participation of farmers in the development and maintenance of
the schemes was envisaged to be guaranteed by promoting the principle of farmer initiation as a basis of development.
VII. scheme selection was also developed as summarized in the table below:
20 Owing to the very slow disbursement and implementation capacity of AIDB; it was agreed to transfer all implementation responsibilities to IDD to avoid delays in project realization. The move made tremendous improvement in project implementation. 21 Staff Appraisal Report; Ethiopia Special Country Program .January 14,1987The World Bank Eastern and Southern Africa Region, Northern Agriculture Division
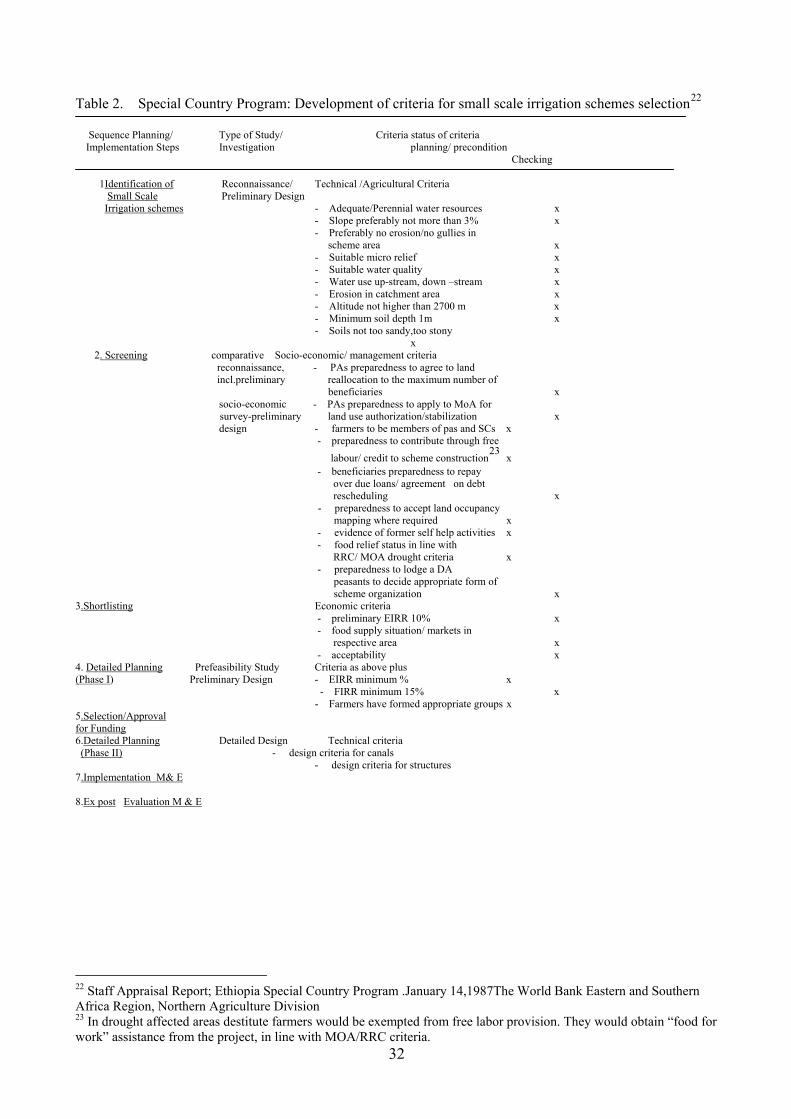
32
Table 2. Special Country Program: Development of criteria for small scale irrigation schemes selection22
Sequence Planning/ Type of Study/ Criteria status of criteria Implementation Steps Investigation planning/ precondition Checking
1Identification of Reconnaissance/ Technical /Agricultural Criteria Small Scale Preliminary Design Irrigation schemes - Adequate/Perennial water resources x
- Slope preferably not more than 3% x - Preferably no erosion/no gullies in scheme area x - Suitable micro relief x - Suitable water quality x - Water use up-stream, down –stream x - Erosion in catchment area x - Altitude not higher than 2700 m x - Minimum soil depth 1m x - Soils not too sandy,too stony
x 2. Screening comparative Socio-economic/ management criteria
reconnaissance, - PAs preparedness to agree to land incl.preliminary reallocation to the maximum number of
beneficiaries x socio-economic - PAs preparedness to apply to MoA for survey-preliminary land use authorization/stabilization x design - farmers to be members of pas and SCs x
- preparedness to contribute through free labour/ credit to scheme construction
23 x
- beneficiaries preparedness to repay over due loans/ agreement on debt rescheduling x - preparedness to accept land occupancy mapping where required x
- evidence of former self help activities x - food relief status in line with RRC/ MOA drought criteria x - preparedness to lodge a DA peasants to decide appropriate form of scheme organization x
3.Shortlisting Economic criteria - preliminary EIRR 10% x - food supply situation/ markets in respective area x - acceptability x
4. Detailed Planning Prefeasibility Study Criteria as above plus (Phase I) Preliminary Design - EIRR minimum % x - FIRR minimum 15% x
- Farmers have formed appropriate groups x 5.Selection/Approval for Funding 6.Detailed Planning Detailed Design Technical criteria (Phase II) - design criteria for canals - design criteria for structures 7.Implementation M& E 8.Ex post Evaluation M & E
22 Staff Appraisal Report; Ethiopia Special Country Program .January 14,1987The World Bank Eastern and Southern Africa Region, Northern Agriculture Division 23 In drought affected areas destitute farmers would be exempted from free labor provision. They would obtain “food for work” assistance from the project, in line with MOA/RRC criteria.
33
PLANNING AND IMPLEMENTATION PROCESS EMPLOYED BY ESRDF PROJECT
1.18 The Ethiopian Social Rehabilitation and Development Fund was established with the objective of rehabilitating and developing infrastructure that was ruined during the civil war and also to develop new social infrastructure where it is found to be lacking. One of the components of the Fund’s activities is the development of rural water supply and irrigation. The primary task of the Fund was to develop various manuals and guidelines for water supply and irrigation development.
1.19 Summary of the ESRDF Project Implementation Guideline ESRDF’s SMALL SCALE IRRIGATION PROJECT(GRAVITY) TECHNICAL HANDBOOK
1.20 This Technical Handbook was Prepared in 1997by: CONTINENTAL CONSULTS P.L.C In
Association with CONSULTING ENGINEERING SERVICES (INDIAL) PVT.LTD November1997.
1.21 The objective of the technical guideline/handbook is to provide technical procedures for formulating,
study, design and implementation of ESRDF sponsored Small Scale Irrigation projects (SSIP). 1.22 The fund finances SSIP, size up to 200 ha, where consent of beneficiaries towards project
implementation in terms of vote is more than 90%. According to the guideline the fund finances projects on demand base. The general principle of the fund is to maximize community’s participation at all levels of the project cycle. The fund appraises and monitors the study, design, implementation and operation, as well as, maintenance of SSIP before and after financing. The institutions involved in developing SSIP with ultimate handing over to beneficiaries are regional bureaus such as Co-SAERT, Co-SAERAR, OIDA and other regional water bureaus
1.23 Final project appraisal by the ESRDF and acceptability of the project for financing is based on
adequacy of design, plan (drawings) and specification. 1.24 The guideline has the following ten components.
COMPONENT I : Guidelines on SSIP Formulation COMPONENT II : Guidelines on SSIP Screening COMPONENT III : Guidelines on SSIP Watershed Management COMPONENT IV : Guidelines on SSIP Headwork and Irrigation System Design COMPONENT V : Guidelines on SSIP Standard Tender Dossier and Contract
Document preparation COMPONENT VI : Guidelines on Construction of SSIP COMPONENT VII : Manual on Construction on Construction Supervision of SSI COMPONENT VIII : Manual on Operation and Maintenance of SSIP COMPONENT IX : Guidelines on SSIP for Institutionalizing WUA COMPONENT X : Outline on SSIP for Applied Research

34
Project Formulation And Implementation Cycle
1.25 SSIP within the frame work of ESRDF should be planned and implemented in the phases of project
cycle as presented below.
1.26 The project cycle illustrated below describes the sequence of events commencing with the generation of an initial project idea, passing through successively more detailed stages of study, design, implementation, monitoring and evaluation. The stages of the project cycle adopted by the manual are:
• Project formulation and identification • Reconnaissance; • Feasibility • Detailed design; • Implementation/construction; and • handing over
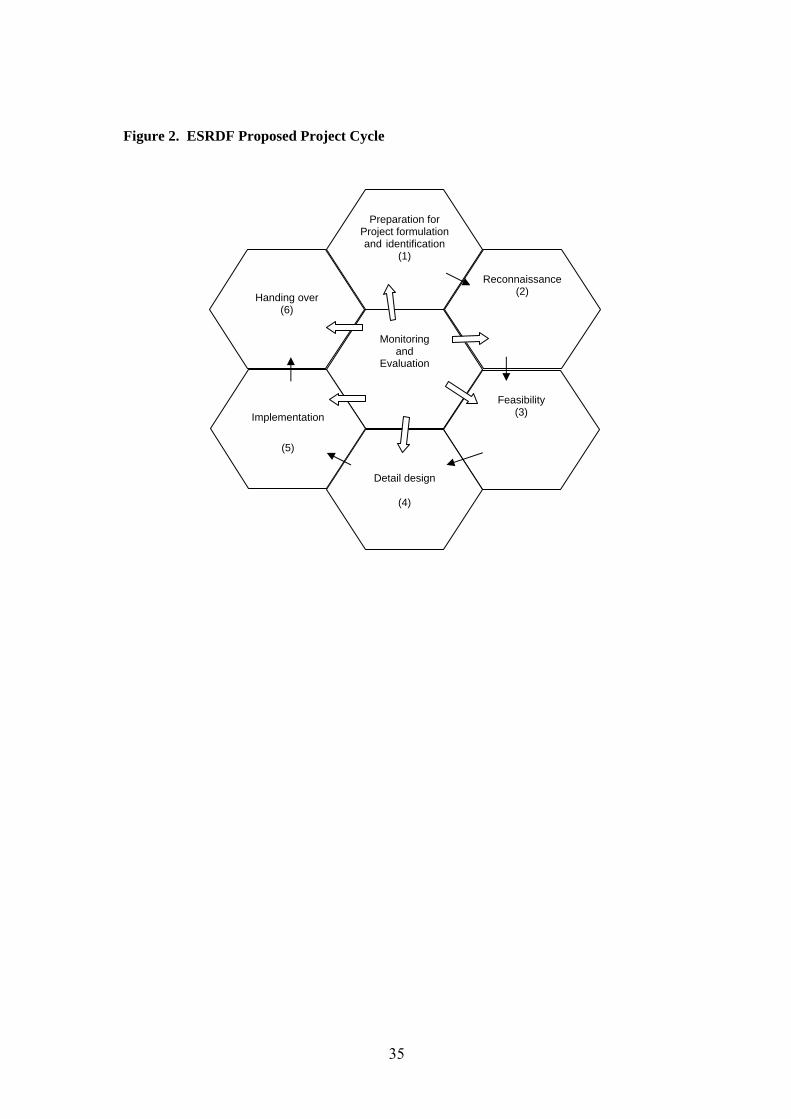
35
Figure 2. ESRDF Proposed Project Cycle
Monitoring and
Evaluation
Preparation for Project formulationand identification
(1)
Reconnaissance (2)
Feasibility (3)
Detail design
(4)
Implementation
(5)
Handing over
(6)

36
Project formulation and Identification
Data
Screen/Review
Maps/Aerial photo
Desk Study
Users Opinion
Reconnaissance Field Assessment
Desk Study
Users Opinion
Watershed Evaluation
Headwork Conceptual Design
Irrigation System Conceptual Design
Social, Environmental, Economic Consideration
Screen/Review
Feasibility
Detailed Field Assessment
Data Collection and Organization
Preliminary Analysis
Selection criteria
Watershed management plan at
preliminary with quantity & specification
Headwork Preliminary design with quantity and
specification
Irrigation System Preliminary design with Quantity and
specification
Social, environmental,
Economic assessment
Project Report
Screen/Review
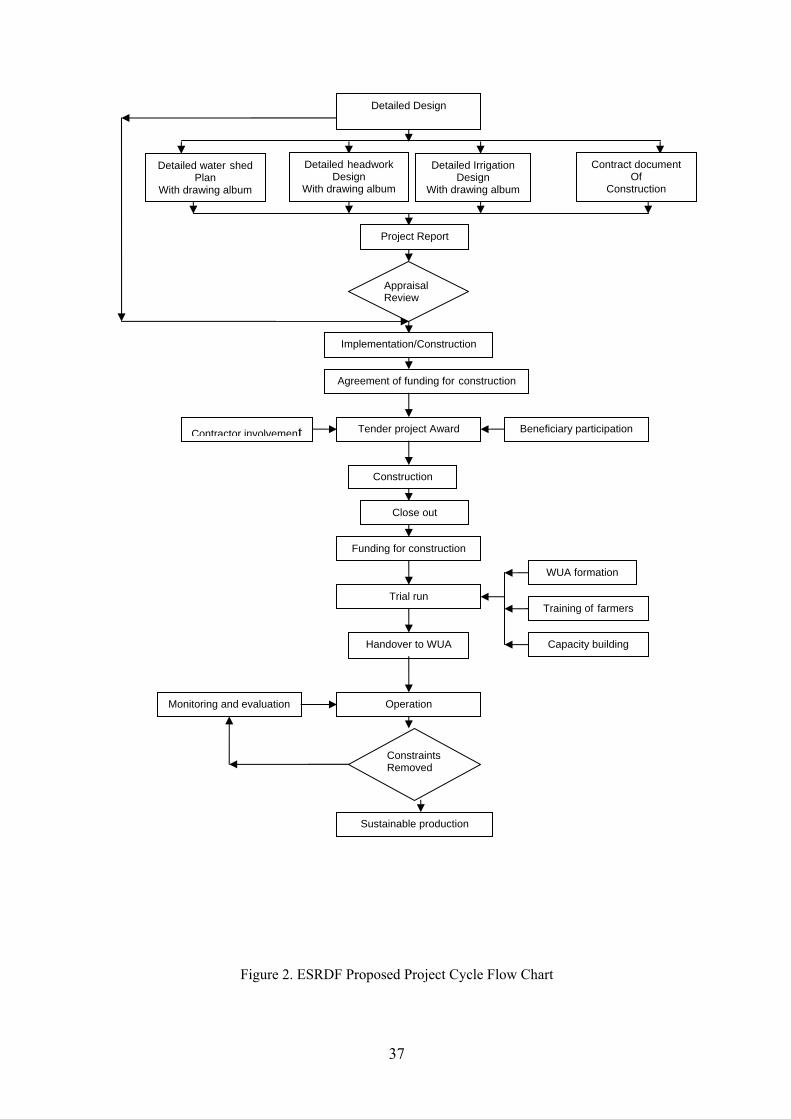
37
Figure 2. ESRDF Proposed Project Cycle Flow Chart
Agreement of funding for construction
Tender project Award
Construction
Close out
Funding for construction
Trial run
Handover to WUA
Operation
ConstraintsRemoved
Monitoring and evaluation
Beneficiary participation Contractor involvement
WUA formation
Training of farmers
Capacity building
Detailed water shed Plan
With drawing album
Appraisal Review
Detailed Design
Contract document Of
Construction
Detailed headwork Design
With drawing album
Project Report
Implementation/Construction
Sustainable production
Detailed Irrigation Design
With drawing album

38
Figure 4. Project Cycle as Discussed with ESRDF Project Beneficaries
Proposal forwarded by the beneficiaries to branch irrigation office/field offices
The branch irrigation institutions request the community to raise fund for the study and design
The community raise fund or request ESRDF to pay for the study and design
The community raise fund or request ESRDF to pay for the study and design
The study and design approved by regional level irrigation offices
Design documents with relevant surveys and assessments reports submitted to the community
Design documents with relevant surveys and assessments reports Handed over to ESRDF
ESRDF revise the design appraise, approve and notify the community
The beneficiaries, ESRDF and all relevant government offices sign implementation agreement
ESRDF releases fund and project implemented
After implementation completed project handed of to the beneficiaries
Project identified by the community
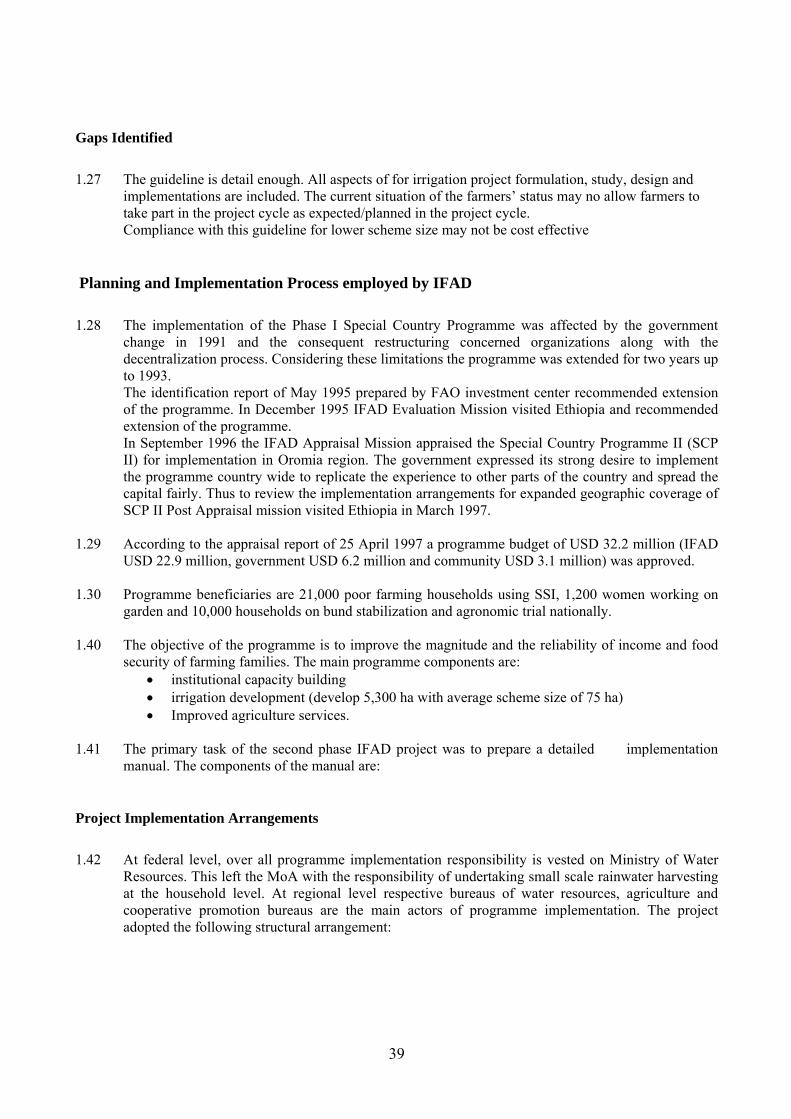
39
Gaps Identified
1.27 The guideline is detail enough. All aspects of for irrigation project formulation, study, design and
implementations are included. The current situation of the farmers’ status may no allow farmers to take part in the project cycle as expected/planned in the project cycle. Compliance with this guideline for lower scheme size may not be cost effective
Planning and Implementation Process employed by IFAD
1.28 The implementation of the Phase I Special Country Programme was affected by the government change in 1991 and the consequent restructuring concerned organizations along with the decentralization process. Considering these limitations the programme was extended for two years up to 1993. The identification report of May 1995 prepared by FAO investment center recommended extension of the programme. In December 1995 IFAD Evaluation Mission visited Ethiopia and recommended extension of the programme. In September 1996 the IFAD Appraisal Mission appraised the Special Country Programme II (SCP II) for implementation in Oromia region. The government expressed its strong desire to implement the programme country wide to replicate the experience to other parts of the country and spread the capital fairly. Thus to review the implementation arrangements for expanded geographic coverage of SCP II Post Appraisal mission visited Ethiopia in March 1997.
1.29 According to the appraisal report of 25 April 1997 a programme budget of USD 32.2 million (IFAD
USD 22.9 million, government USD 6.2 million and community USD 3.1 million) was approved.
1.30 Programme beneficiaries are 21,000 poor farming households using SSI, 1,200 women working on garden and 10,000 households on bund stabilization and agronomic trial nationally.
1.40 The objective of the programme is to improve the magnitude and the reliability of income and food
security of farming families. The main programme components are: • institutional capacity building • irrigation development (develop 5,300 ha with average scheme size of 75 ha) • Improved agriculture services.
1.41 The primary task of the second phase IFAD project was to prepare a detailed implementation
manual. The components of the manual are:
Project Implementation Arrangements
1.42 At federal level, over all programme implementation responsibility is vested on Ministry of Water
Resources. This left the MoA with the responsibility of undertaking small scale rainwater harvesting at the household level. At regional level respective bureaus of water resources, agriculture and cooperative promotion bureaus are the main actors of programme implementation. The project adopted the following structural arrangement:

40
Figure 5. IFAD Projects Implementation Arrangements
Program Midterm Review
1.43 The programme mid-term review was carried out in September 2002. The midterm review
recommended among others that: • Programme implementation strategy and resources that are currently directed towards
hardware, should be redirected to wards more effective planning, coordination, training, M & E • RPSCs should be formalized and meet quarterly • Woreda level participants should assign a focal person • Program reporting system should be standardized.
Supervision mission
1.44 Supervision is carried out once in a year by UNOPS. The recent supervision mission’s (April
2004) finding is that generally the programme implementation has been below expectations due to the fact that most of the recommendations of the midterm review, the last UNOPS mission and the IFAD technical follow up mission were not implemented by the Central and Regional authorities.
The project is expected to phase out by December 2005.
Summary of the IFAD Phase II Implementation Guideline
1.45 The IFAD Special Country Program Phase II also developed mechanism for a demand- led
development, screening and selection criteria for WUAs. Summary of the process is presented in table 2 and 3.
Programme Steering Committee (PSC)
Programme Coordinating Unit (PCU)
Regional Technical Sub-programme Coordination Unit (RTPCU)
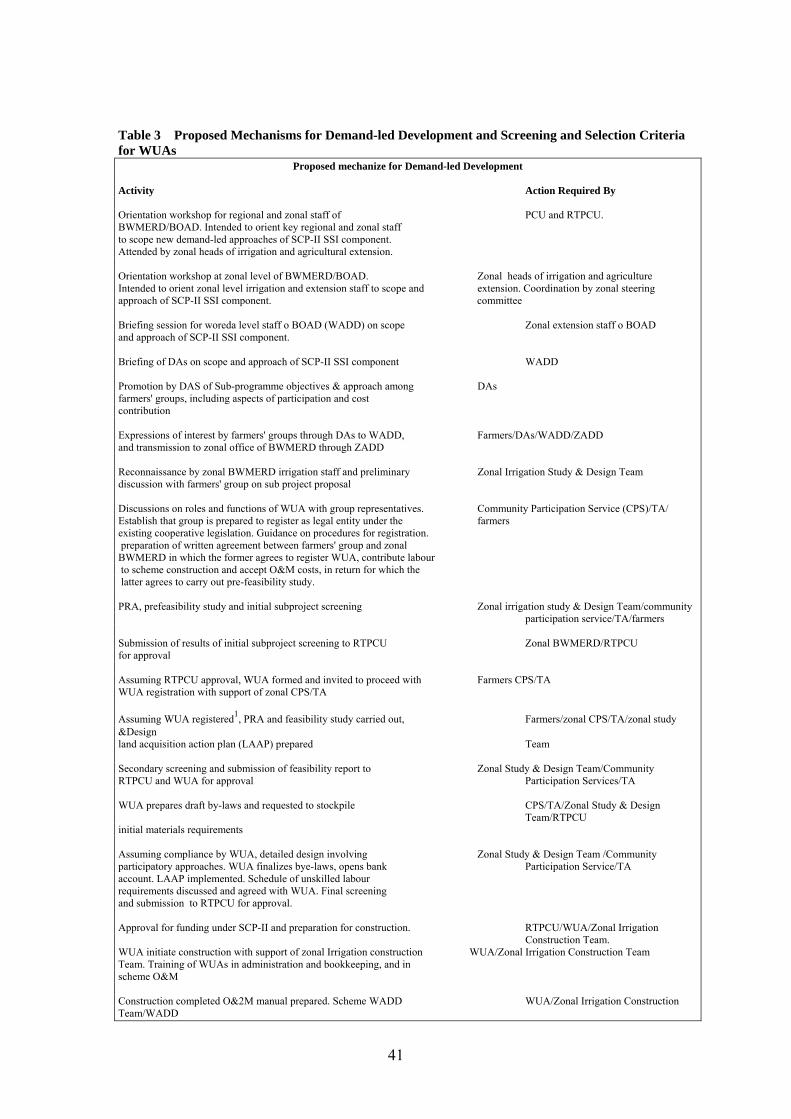
41
Table 3 Proposed Mechanisms for Demand-led Development and Screening and Selection Criteria for WUAs
Proposed mechanize for Demand-led Development Activity Action Required By Orientation workshop for regional and zonal staff of PCU and RTPCU. BWMERD/BOAD. Intended to orient key regional and zonal staff to scope new demand-led approaches of SCP-II SSI component. Attended by zonal heads of irrigation and agricultural extension. Orientation workshop at zonal level of BWMERD/BOAD. Zonal heads of irrigation and agriculture Intended to orient zonal level irrigation and extension staff to scope and extension. Coordination by zonal steering approach of SCP-II SSI component. committee Briefing session for woreda level staff o BOAD (WADD) on scope Zonal extension staff o BOAD and approach of SCP-II SSI component. Briefing of DAs on scope and approach of SCP-II SSI component WADD Promotion by DAS of Sub-programme objectives & approach among DAs farmers' groups, including aspects of participation and cost contribution Expressions of interest by farmers' groups through DAs to WADD, Farmers/DAs/WADD/ZADD and transmission to zonal office of BWMERD through ZADD Reconnaissance by zonal BWMERD irrigation staff and preliminary Zonal Irrigation Study & Design Team discussion with farmers' group on sub project proposal Discussions on roles and functions of WUA with group representatives. Community Participation Service (CPS)/TA/ Establish that group is prepared to register as legal entity under the farmers existing cooperative legislation. Guidance on procedures for registration. preparation of written agreement between farmers' group and zonal BWMERD in which the former agrees to register WUA, contribute labour to scheme construction and accept O&M costs, in return for which the latter agrees to carry out pre-feasibility study. PRA, prefeasibility study and initial subproject screening Zonal irrigation study & Design Team/community participation service/TA/farmers Submission of results of initial subproject screening to RTPCU Zonal BWMERD/RTPCU for approval Assuming RTPCU approval, WUA formed and invited to proceed with Farmers CPS/TA WUA registration with support of zonal CPS/TA Assuming WUA registered1, PRA and feasibility study carried out, Farmers/zonal CPS/TA/zonal study &Design land acquisition action plan (LAAP) prepared Team Secondary screening and submission of feasibility report to Zonal Study & Design Team/Community RTPCU and WUA for approval Participation Services/TA WUA prepares draft by-laws and requested to stockpile CPS/TA/Zonal Study & Design
Team/RTPCU initial materials requirements Assuming compliance by WUA, detailed design involving Zonal Study & Design Team /Community participatory approaches. WUA finalizes bye-laws, opens bank Participation Service/TA account. LAAP implemented. Schedule of unskilled labour requirements discussed and agreed with WUA. Final screening and submission to RTPCU for approval. Approval for funding under SCP-II and preparation for construction. RTPCU/WUA/Zonal Irrigation
Construction Team. WUA initiate construction with support of zonal Irrigation construction WUA/Zonal Irrigation Construction Team Team. Training of WUAs in administration and bookkeeping, and in scheme O&M Construction completed O&2M manual prepared. Scheme WADD WUA/Zonal Irrigation Construction Team/WADD

42
1 This requirement applicable from PY2. In PY1 WUAs should enter into foundation agreement and should submit the appropriate application for its formal organization with BWMERD appropriate application for its formal organization with BWMERD
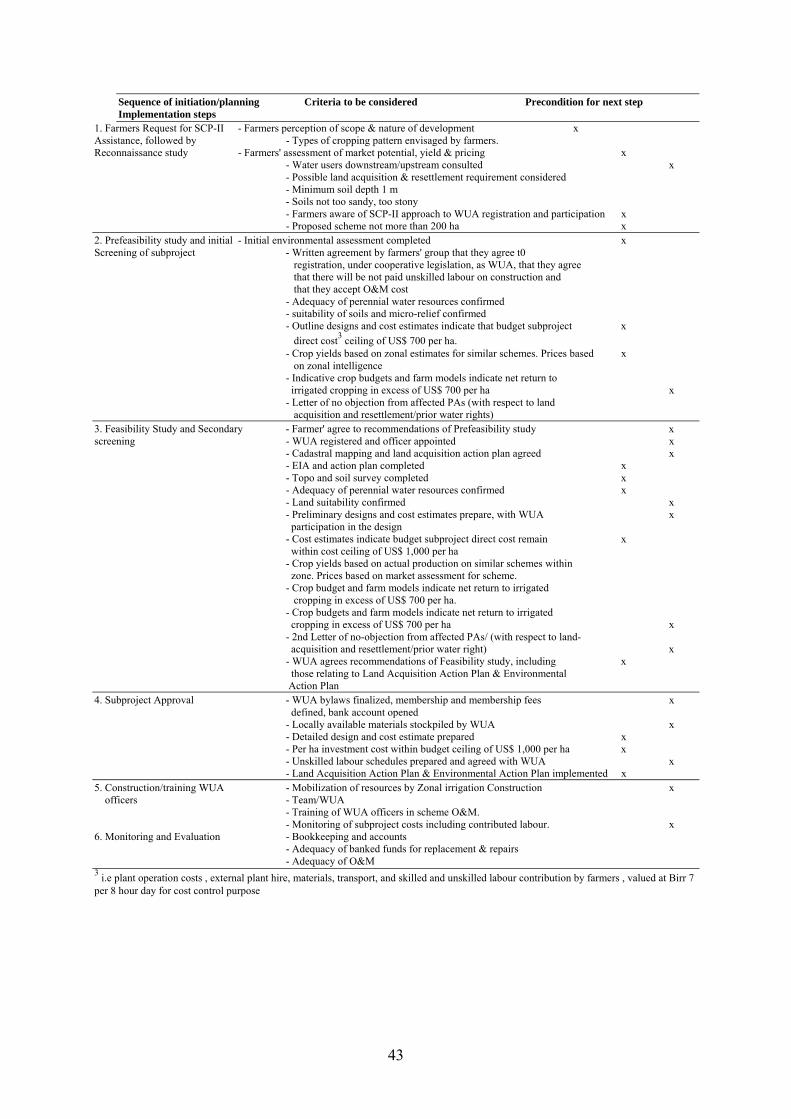
43
Sequence of initiation/planning Criteria to be considered Precondition for next step Implementation steps
1. Farmers Request for SCP-II - Farmers perception of scope & nature of development x Assistance, followed by - Types of cropping pattern envisaged by farmers. Reconnaissance study - Farmers' assessment of market potential, yield & pricing x - Water users downstream/upstream consulted x - Possible land acquisition & resettlement requirement considered - Minimum soil depth 1 m - Soils not too sandy, too stony - Farmers aware of SCP-II approach to WUA registration and participation x - Proposed scheme not more than 200 ha x 2. Prefeasibility study and initial - Initial environmental assessment completed x Screening of subproject - Written agreement by farmers' group that they agree t0 registration, under cooperative legislation, as WUA, that they agree that there will be not paid unskilled labour on construction and that they accept O&M cost - Adequacy of perennial water resources confirmed - suitability of soils and micro-relief confirmed - Outline designs and cost estimates indicate that budget subproject x direct cost3 ceiling of US$ 700 per ha. - Crop yields based on zonal estimates for similar schemes. Prices based x on zonal intelligence - Indicative crop budgets and farm models indicate net return to irrigated cropping in excess of US$ 700 per ha x - Letter of no objection from affected PAs (with respect to land
acquisition and resettlement/prior water rights) 3. Feasibility Study and Secondary - Farmer' agree to recommendations of Prefeasibility study x screening - WUA registered and officer appointed x - Cadastral mapping and land acquisition action plan agreed x - EIA and action plan completed x - Topo and soil survey completed x
- Adequacy of perennial water resources confirmed x - Land suitability confirmed x - Preliminary designs and cost estimates prepare, with WUA x participation in the design - Cost estimates indicate budget subproject direct cost remain x within cost ceiling of US$ 1,000 per ha - Crop yields based on actual production on similar schemes within zone. Prices based on market assessment for scheme. - Crop budget and farm models indicate net return to irrigated cropping in excess of US$ 700 per ha. - Crop budgets and farm models indicate net return to irrigated cropping in excess of US$ 700 per ha x - 2nd Letter of no-objection from affected PAs/ (with respect to land- acquisition and resettlement/prior water right) x
- WUA agrees recommendations of Feasibility study, including x those relating to Land Acquisition Action Plan & Environmental Action Plan 4. Subproject Approval - WUA bylaws finalized, membership and membership fees x defined, bank account opened - Locally available materials stockpiled by WUA x - Detailed design and cost estimate prepared x - Per ha investment cost within budget ceiling of US$ 1,000 per ha x - Unskilled labour schedules prepared and agreed with WUA x - Land Acquisition Action Plan & Environmental Action Plan implemented x 5. Construction/training WUA - Mobilization of resources by Zonal irrigation Construction x officers - Team/WUA - Training of WUA officers in scheme O&M. - Monitoring of subproject costs including contributed labour. x 6. Monitoring and Evaluation - Bookkeeping and accounts - Adequacy of banked funds for replacement & repairs - Adequacy of O&M 3 i.e plant operation costs , external plant hire, materials, transport, and skilled and unskilled labour contribution by farmers , valued at Birr 7 per 8 hour day for cost control purpose
44
The Federal Ministry of Water Resources 1.46 The Federal Ministry of Water Resources employed Continental Consultants and Concert
Engineering and Consulting Enterprise to develop a: Guideline, Manual and Standard Design of Small and Medium-Scale Irrigation projects in Ethiopia.
1.47 The document which was finalized in August 2002 proposed the following project phases to
be adopted for small and medium scale irrigation projects.
• Identification and reconnaissance • Feasibility • Detail design • Construction
1.48 Moreover the guideline acknowledged that the adoption of the conventional project cycle
(preparation for project formulation and identification, reconnaissance, pre-feasibility, feasibility, detailed design and construction) is not ruled out if circumstances warrant its use depending on the nature of, complexity, data collection, funding requirement, and available budget.
1.49 The guideline has two major sections:
I. Procedural guidelines for study of small and medium scale irrigation projects in Ethiopia.
The procedural guideline reviews the methods and techniques used in the study of small and medium scale irrigation projects at different phases of the study, suggests pertinent data required, and where and how to obtain the data. The procedural guideline is divided into the following 10 parts:
• Hydro meteorology (PART A) • Soil survey and Land Evaluation (PART B) • Irrigation Agronomy (PART C) • Engineering Geology (PART D-1) • Geo-technical Engineering (PART D2) • Irrigation (PART E) • Headwork (PART F) • Sociology (PART G) • Environmental Impact Assessment (PART H) • Financial and Economic Analysis (PART I)
II. Guidelines, Manuals and Standards
The purpose of the guidelines, manuals and standard design is to give guidance for the practicing professionals in planning, study, explorations, design, field and laboratory tests, construction materials investigation and geotechnical design and treatments. It covers the following components.
45
Guidelines
• Irrigation System Design (PART I - A) • Irrigation Structures (PART I – B) Hydro meteorology (PART – A • Hydraulic Structures and Gates ( PART I – C) • Drainage System Design (PART I – D) • Dam Design (PART I –E) • Dam Appurtenant Structures (PART I – G) • Diversion Structures (PART I – G) • Geo-techniques (PART I – H)
Manuals
• Surveying and map production (PART II – A) • Pumping facilities (PART II – B)
Standards
• Irrigation Water Management (PART III – A) • Technical Specifications (PART III – B)
Gaps Identified
1.50 The procedures and guidelines prepared by the Federal Ministry of Water Resources are not as
comprehensive as the one prepared earlier by the ESRDF. Therefore most organizations involved in irrigation development such as OIDA are using the ESRDF guideline instead of the one produced by the MoWR. Being the responsible organization for all water related issues in the country, the MoWR should have been in a better position to provide such guidelines and standards for country wide use. The lack of standard procedures and guidelines has been a major bottleneck for better planning and implementation of projects.
Gaps and efforts made to improve the planning and implementation process
QUALITY OF PREPARATION STUDIES 1.51 Majority of those who were interviewed did not respond to questions related to the quality of
project preparation. One person indicated that the process is lengthy and time consuming, hence suggested that prefeasibility and feasibility study should be combined.However, it is felt that high quality project preparation is imperative for the eventual success of a project. The consultants feel that the risk of failure or inefficiency could be minimized by improving the rigor and quality of the study and preparation. For example the issues of water shortage could not occur if the available water resources are studied in detail.
1.52 Design of some projects, for example ESRDF supported projects are very comprehensive and
include all required information. Design guidelines prepared by ESRDF and MoWR s are detailed and consist of all the steps required to prepare a comprehensive design. However, it was observed that the project preparation did not include marketing and environmental considerations. NGO projects are prepared jointly by the NGO staff with the support of the regional irrigation organizations. Usually the projects do not go through the complete project cycle analysis.

46
Projects funded by IFAD are prepared and appraised by international consultants. The quality of projects depends on the experience of the personnel involved in the project preparation. The qualities of Projects prepared by government are influenced by the high staff turnover in the government irrigation organizations as experienced staff are always leaving for better opportunities. This has a significant implication on the quality of project preparation and studies. The other factor that is negatively affecting project preparation capacity is the instability of the organizations responsible for irrigation development.
PARTICIPATION OF BENEFICIARIES, IRRIGATION MANAGEMENT TRANSFER
1.53 From the discussions with staff working in the irrigation sector it was noted that all SSIP are
identified by the beneficiaries Wherever it is possible to develop irrigation using local skills and materials, communities try to engage themselves in irrigation activities to combat the effects of recurrent drought and improve their food security. Where it is beyond their technical and financial capacity, communities request for external support to develop irrigation projects. It is common practice to engage the communities at all stages of the project cycle. However, as most beneficiaries do not have the ability to contribute cash to cover the capital cost, their participation is limited to the contribution of labor and local construction materials. Before the project is handed over to the beneficiaries, they are organized in to irrigation Water Users Association (WUA). The WUA executive committee and its members are trained in some basic irrigation operation and maintenance aspects. Then the beneficiaries are made responsible for the over all management of the project.
1.54 However, after the project management responsibilities are transferred to the beneficiaries, it is usually found out that the performance of the projects decline. Particularly the irrigation water management efficiency is decreased thereby reducing the intended capacity to irrigate. The follow up and extension support is usually the main drawback which failed to provide the required support.
MONITORING AND EVALUATION SYSTEM 1.55 The government staff who were interviewed perceive that there is no M & E system
developed for projects. NGO staff claim that they do not have a project specific one, but they have a program specific M & E. Donors like ESRDF claim that they have a very good M & E already in place while IFAD do not have an M & E system currently; but they have already employed staff to develop their M & E system.
LOCAL CAPACITIES AND INTERNATIONAL TECHNICAL ASSISTANCE 1.56 Literally all of the respondents believe that there is critical capacity gap in the country. For
instance government implemented projects are characterized by poor quality output mainly due to capacity limitations. Although capacity building efforts are undertaken by various actors, it does not meet the country’s huge needs. On the contrary, it is believed that there are skilled staff to undertake irrigation planning and implementation in the country. However, the working environment is not conducive and motivating to retain highly competent and experienced staff. Due to frequent changes in organizational structures technical staff are frequently transferred from one organization to another or from department to department within the organizations. There is also continuous staff turnover at the management level. This has contributed to the loss of highly valued institutional memories and induced the undermining of the local capacity in irrigation planning and design.

47
International technical assistance is limited to few projects like IFAD and ESRDF. The assistance is mainly limited to carry out assessments and project preparations. Nevertheless for major studies and designs, the government relies on international technical assistance. The current expansion of Vocational Schools all over the country, is believed to mitigate the capacity limitations in the future. Some of the respondents indicated that it is imperative to build local capabilities than depending on TAs. Some NGOs claim that they have capacity building components in their programs. ESRDF/World bank is making effort to build the capacity of the regional offices. For example geophysical lab was established for three regional office and surveying equipments were purchased for one regional irrigation office. We believe the facilities have enhanced the implementation capacity of these offices.
AGRICULTURAL DEVELOPMENT AND IRRIGATION INVESTMENT 1.57 One respondent feels that there is no strategy regarding irrigation development. Priorities of
what to do in the irrigation sub sector are influenced by political decisions rather than a strategy. Therefore the country’s food insecurity could be attributed to the lack of a coherent irrigation and agricultural policy. Another respondent indicated that although there is strategy on water resources development, he doesn’t think that the strategy properly addresses the irrigation and agriculture sector. There is also a feeling that Irrigation policy and strategy needs to be seen in light of the country’s agriculture policy. According to this respondent, there is no coherent agricultural development policy and strategy for the country. One should be able to answer the question “irrigation for what?” The water resources management policy looks at irrigation as an infrastructure and not as input required to improve agricultural production and productivity. A comprehensive Agriculture policy covering land use; land tenure; markets and the like needs to be mapped in order to address the gap in this respect. Currently, the Ministry of water resources has employed a consulting firm (Metaferia Consulting Engineers) to develop a policy implementation manual. Respondents claim that there are no reforms which were undertaken by the government. Currently projects are being implemented here and there at a very slow rate. Another respondent however feels that the country has developed a water development strategy. Irrigation is also included in this strategy and there is no stand alone irrigation strategy. The water development strategy complements the agriculture development strategy. There is strong correlation between the two. The World Bank is working on the Country Assistance Strategy (CAS) on the water sector. It is hoped that CAS will give direction on the use of the country’s water resources for potable water and irrigation development.
ENVIRONMENT AND HEALTH ASPECTS
1.58 The country’s environment policy requires that water projects should make initial
environmental assessment before they start implementation. Small projects, less than 500 ha, are not required to carryout initial environmental examination. However, if the projects are located in ecologically sensitive areas, on slope land, near or in national park, where biodiversity is believed to be affected, where population displacement can take place initial environmental examination is required. The environmental and health implications of irrigation projects are considerable. All organizations involved in irrigation consider the environmental and health implication of irrigation projects during the planning phase. Nevertheless there are no properly planned mitigation measures for the likely negative environmental consequences of irrigation development. For purposes of compliance with the environmental regulations of the government, environmental mitigation measures are included at the planning stage. However, during the project implementation the environmental issues are totally left out.
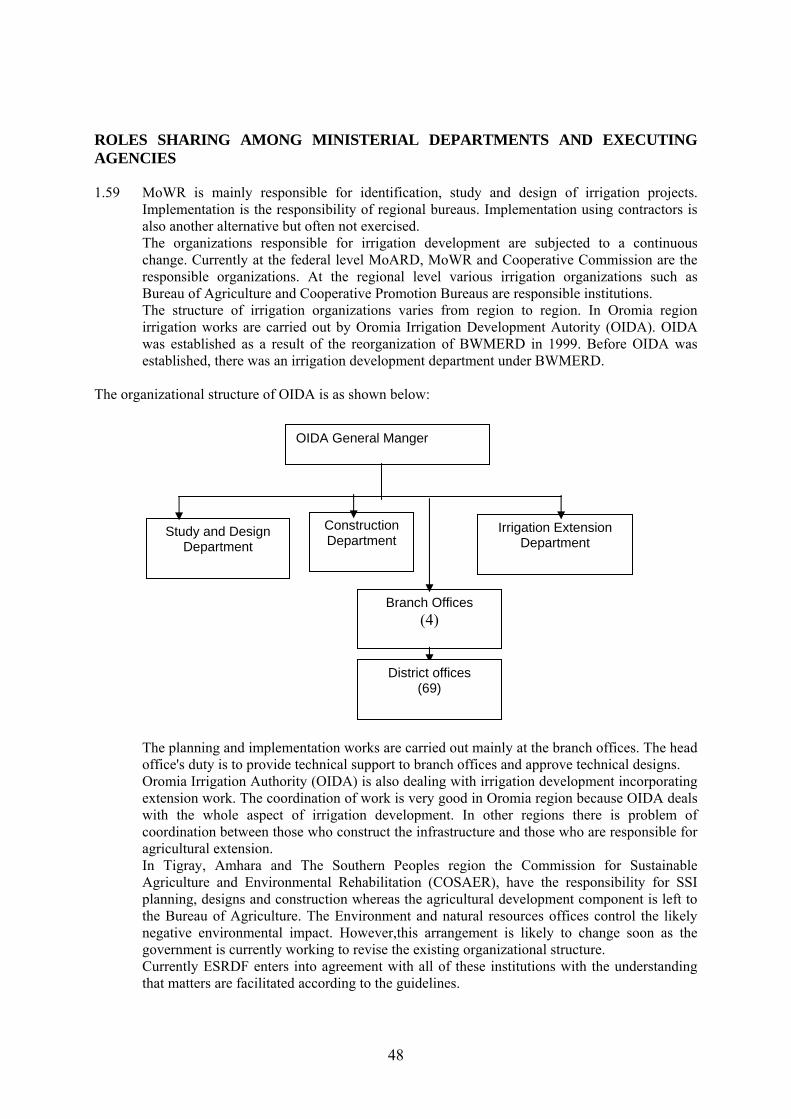
48
ROLES SHARING AMONG MINISTERIAL DEPARTMENTS AND EXECUTING AGENCIES 1.59 MoWR is mainly responsible for identification, study and design of irrigation projects.
Implementation is the responsibility of regional bureaus. Implementation using contractors is also another alternative but often not exercised. The organizations responsible for irrigation development are subjected to a continuous change. Currently at the federal level MoARD, MoWR and Cooperative Commission are the responsible organizations. At the regional level various irrigation organizations such as Bureau of Agriculture and Cooperative Promotion Bureaus are responsible institutions. The structure of irrigation organizations varies from region to region. In Oromia region irrigation works are carried out by Oromia Irrigation Development Autority (OIDA). OIDA was established as a result of the reorganization of BWMERD in 1999. Before OIDA was established, there was an irrigation development department under BWMERD.
The organizational structure of OIDA is as shown below:
The planning and implementation works are carried out mainly at the branch offices. The head office's duty is to provide technical support to branch offices and approve technical designs. Oromia Irrigation Authority (OIDA) is also dealing with irrigation development incorporating extension work. The coordination of work is very good in Oromia region because OIDA deals with the whole aspect of irrigation development. In other regions there is problem of coordination between those who construct the infrastructure and those who are responsible for agricultural extension. In Tigray, Amhara and The Southern Peoples region the Commission for Sustainable Agriculture and Environmental Rehabilitation (COSAER), have the responsibility for SSI planning, designs and construction whereas the agricultural development component is left to the Bureau of Agriculture. The Environment and natural resources offices control the likely negative environmental impact. However,this arrangement is likely to change soon as the government is currently working to revise the existing organizational structure. Currently ESRDF enters into agreement with all of these institutions with the understanding that matters are facilitated according to the guidelines.
OIDA General Manger
Study and Design Department
Construction Department
Irrigation Extension Department
Branch Offices (4)
District offices (69)

49
With regard to IFAD project, the technical staff feels that there is a coordination problem. At the regional level different organizations coordinate the project. For instance In Amhara region the Food Security office coordinates the IFAD project. In Oromia region it is being coordinated by Oromia Irrigation Authority (OIDA). The proposed organizational chart and the information flow are not functional. There is loose relation between the PCU and the regional units. The donors provide the required finance and some times monitor and evaluate the implementation progress. The beneficiaries participate in the implementation through the provision of labor and local construction materials. According to WVE, irrigation development is planned through the involvement of all stakeholders. The role of WVE is to ensure that all the stakeholders are involved. The woreda administration’s role is facilitating the work including community mobilization through the DA. The data collection, planning and design will be done jointly with respective government bureaus, different grass root community organizations and WVE As far as roles and responsibilities are concerned, one respondent indicated that there is no organization which has a clear responsibility to organize, to lead and coordinate the stakeholders involved in irrigation development in the country. There are also bilateral support system through agencies (GTZ, DFID, USAID, CIDA, SIDA, etc.) and multilateral support (UNDP, World Bank, EU, etc) who working through special PCU arrangements e.g.SIDA Amhara Program.
POINT OF VIEW OF LOCAL ACTORS (AT NATIONAL AND PROJECT LEVELS), DIFFERENCES WITH DONORS POINT OF VIEW OR VIEWS EXPRESSED IN PROJECT DOCUMENTS.
1.60 VIEWS ON PLANNING AND IMPLEMENTATION A) VIEWS OF THE ESRDF STAFF ON PLANNING AND IMPLEMENTATION
From the interview made with ESRDF staff, it was learnt that the critical phase of project cycle is planning and operation. Poorly planned projects are inevitable to fail. There are also several projects which failed due to poorly planned operation. Regarding project identification, all ESRDF Financed projects are identified by the beneficiaries. In the identification process, support is sometimes provided by the respective organizations responsible for irrigation development. Project preparation is undertaken by the Regional Irrigation Organizations with support from the communities. Whenever there is a capacity limitation, consultants are hired to prepare the projects. Once the project design is approved, ESRDF informs the relevant irrigation authorities and the community to start implementation. All the relevant bureaus are involved at this stage. Project implementation is generally very slow. The slow implementation is attributed to limited capacity of the irrigation organizations. Therefore enhancing the capacities of the implementing organizations is essential to improve implementation efficiency. Only Government Irrigation Organizations are allowed undertake the construction of projects financed by ESRDF whereas project implementation should have been open to competent contractors and other organizations such as NGOs.
b) Views of the OIDA senior staff on planning and implementation
OIDA staff claim that farmers/beneficiary communities are the ones who identify the project and request for assistance. OIDA carries out the reconnaissance and pre feasibility study whereas the Donor provides financial input. The process is demand
50
driven and participatory, hence it is very good. As far as the importance of the various project cycle phases are concerned, the staff indicated that the planning and study phase is the most critical. Construction is simple although it is capital intensive. During implementation, Donors provide the required finance and some times monitor and evaluate the implementation progress. The beneficiaries participate in the implementation through the provision of labor and local construction materials. Donor participation is most of the time satisfactory with the exception of delays in the release of funds.
c) Views of OIDA General Manager on planning and implementation
According to the OIDA General Manager feasibility study is the critical phase as the core issue is to identify appropriate resource for irrigation development. Once we know the main opportunities and limitations both socially and technically the rest can be easily managed. In regard to project preparation, the responsibility rests with OIDA branch offices. IDA uses the ESRDF guideline for project preparation. The guideline has however its own limitations in that it is lengthy and cumbersome. Delays are caused in the process; for instance it takes a long time to do soil survey and analysis due to capacity limitations. OIDA branch offices are also responsible for project implementation. The branch office has three teams namely design and study, construction and construction supervision. The construction team implements the construction of physical structures. The agriculture development is the responsibility of the woreda office. As far as implementation is concerned the General Manager feels that there is good organizational structure in place except for some capacity gap both in staff capacity and construction equipment.
d) Views of IFAD Project Coordination Office Staff on planning and
implementation
Senior staff of the IFAD Coordination Office feel that the critical phase of the project cycle is implementation. For instance if we take the IFAD project, it is a very good project which has been prepared properly. The main problem lies with implementation which is attributed to poor coordination, and lack of dedication and motivation. Project identification involves the beneficiaries and irrigation organizations working at grass root level. After that the remaining work is done by the professionals in the irrigation organizations. Project preparation is done by outside consultant; projects prepared by consultants are very good. In regards to implementation, once the project study and design document is approved; IFAD informs the regional irrigation organization/project holders to start the construction. Each regional irrigation organization has its own construction team. The team enters into an implementation agreement with the respective community and thereafter construction begins. The construction will be monitored by the Project Coordination Unit (PCU) and the UNOPS supervision mission. Project implementation is the responsibility of regional project coordination unit.
e) Views of World Vision staff on Planning and Implementation
When WVE plans irrigation development it is through the involvement of all stakeholders. The role of WVE is to ensure all stakeholders’ involvement. The woreda administration’s role is facilitating the work including community mobilization through the DA. The data

51
collection, planning and design is done jointly with respective government bureaus, various grass roots community organizations and WVE
Comprehensive survey is carried out in the geographic area where WVE is working. The over all coordination of the survey is done by the woreda administration. All government line departments and different community based organizations will take part in the survey. The focus of the survey is to identify different constraints and development opportunities that exist in the area and scheme identification is based on this survey.
WVE ADP Coordination Office believes that the process is participatory and is very good. Project is prepared jointly by WVE and the government offices. When the project requires the input of consultants it will be contracted out. Following the approval of the design by the relevant technical department; WVE, the community and the local government make agreement on project implementation. Roles and responsibilities of each party are indicated clearly. Project is implemented jointly by the community, WVE and the Government. However the government participation is not satisfactory. Government departments feel that the project is WVE’s project and the do not pay enough attention to the development effort.
f) Views of Metaferia Consulting Engineers on Planning and Implementation
The planning phase is the most critical. A project which is well planned has a high rate of success; implementation is not that difficult. Projects are normally identified by the client with the involvement of the beneficiaries. Most of the time the process is led by the technical staff and the local administration. The problem in this regard is sometimes the beneficiaries are not fully consulted. This culminates in lack of sense of ownership on the part of the beneficiaries Consultants are mainly involved at the study and design stage as well as in supervision and quality control depending on the magnitude of the project. Consultants are also involved during the various evaluation phase’s i.e.-Term and Terminal Evaluations. Small projects are prepared by the technical staff of government/NGOs. Bigger projects are prepared by consultants. Theoretically all stakeholders are involved in the project implementation process. Bureaucratic hurdles and cultural constraints are factors that slow down the pace of project implementation.
g) Differences in the approaches of various donors, advantages and drawbacks.
All NGOs are planning and implementing irrigation projects by their own staff with technical support from the government irrigation organizations. Bilateral and multilateral organizations provide cash resources to the government. ESRDF release fund for projects under very tight control and supervision. ESRDF has very detailed guideline from initial project identification to completion of implementation process.
HIGHLIGHTS OF KEY FINDINGS, OBSERVATIONS AND RECOMMENDATIONS ISSUES RELATED TO PRODUCTION

52
1.61 Irrigation is intensive farming which requires proper planning and well coordinated inputs.
Farmers use traditional skills under irrigated farming unless otherwise they are trained in appropriate skill. Farmers also use locally available inputs if improved inputs are not available to them. Modern inputs are mainly used by state farms and few private investors. Few cooperative unions are supplying modern inputs to their members. Most of the smallholder farmers do not have access to modern inputs, even if they have limited access, they use in small quantities due to problem of affordability. Secondly, there are no sufficient, organized and genuine input distribution systems at the grassroots level. Fraudulence and adulteration of inputs characterize smallholder input distribution. Moreover, Fertilizers are not commonly available outside of the rain fed planting season. Credit availability is also an issue in most sites. Most inputs available from the local traders are very expensive for the farmers to buy. Thus, farmers are forced to use their own local seeds. Extension support is one of the critical gaps in irrigation development. From the discussions made with the relevant government officials there are extension agents assigned to each project. Nevertheless, the team has not met DAs at any of the project sites. Agriculture inputs are also not readily available in the near by towns. Farmers have to travel long distance in search of improved agricultural inputs. The qualities of improved seed from traders, specially improved seeds, are usually inferior.
In Summary: 1. In all the schemes visited; lack of access to market is an acute problem that has
hindered the beneficiaries’ from fully realizing the benefit from the schemes. Although some of them have the opportunity of selling to traders at the farm gate, they claim that the price is being dictated by the traders who are reaping most of the benefits as opposed to the farmers.
2. The lack of permanently assigned Development Agents with better knowledge; skill and experience in irrigated agriculture, particularly the production of horticultural crops is another problem that is challenging irrigation development.
3. Lack of access to improved vegetable seeds has been observed during discussions with farmers in some of the schemes visited.
4. High price of pesticides has been a constraint to use pesticides whenever certain diseases such as onion rust occur.
5. Lack of credit facilities for covering recurrent costs of irrigation development such as costs of seeds, fertilizers, pesticides and labour.
ISSUES RELATED TO PLANNING AND IMPLEMENTATION
a. Shortage of water and the consequent reduction in the planned irrigable area was reported
in some schemes. For example in Doni, during low flows associated with drought; there is shortage of water. From this, one draws the conclusion that studies are lacking in quality and rigorousness in regard to proper identification of available land and water resources.
b. In Sheled scheme, farmers complained that there are major outstanding maintenance tasks which are beyond their capacity. This includes leakage of the weir and over excavation of the canal bottom elevation.
c. In Godino scheme the Wedecha reservoir from which the farmers are abstracting water, was constructed 25 years ago and has already silted up. This has led to a critical shortage of water during the peak irrigation period.
d. In Bato Degaga and Dodicha schemes, the installed pump capacities are not commensurate with the area of land planned for irrigation. In Dodicha there is no standby pump to cater for pump failures.
e. In Bato Degaga the very high costs associated with pumping (operating electric pumps) is discouraging farmers to participate in irrigation development.

53
f. In Doni scheme the planting of sugar by farmers at the head reaches of the canal has created critical shortage of water for the other farmers; as sugar cane has a very high demand for water.
GENERAL OBSERVATIONS • Government irrigation organizations are under continuous structural change. This has
significant negative impact on the continuity of the sector as change in organizational structure usually results in loss of momentum and staff.
• Irrigation study and design is done in a much better quality than its implementation. Some aspects of the study process are undertaken simply to comply with donors and other funding agencies requirement. Once the project is appraised and approved, except for few funding agencies there is limited follow up during implementation and post implementation.
• Operation and maintenance duties are not properly done. This is reflected by inefficient scheme performance resulting from insufficient canal desilting work leading to unavailability of adequate water for the irrigation. For example, in Doni irrigation the initial design capacity was 195 ha. However, the scheme is currently irrigating only 80 ha.
• Large proportions of the resources are directed towards infrastructures construction, hence, the extension and marketing aspects are overlooked. The level of extension service and market accessibility is very limited, thus farmers are not fully benefiting from the investment. In short projects are hardware focused, with limited software components.
• Farmers have developed high level of dependency syndrome. Whereas beneficiaries are benefiting from the irrigation schemes, they are still they seeking support from the government/NGOs for operation and maintenance.
• Farmers have very limited market information while vegetable traders have much better information than the farmers. This creates unequal bargaining power between the two; there are also brokers between farmers and vegetable traders. Thus the benefit from the sale of the produce is divided between the brokers and the traders leaving very marginal benefit for the farmers in most cases.
• There are no quality input supplies and credit facilities available on a regular basis especially for non ESRDF projects.
KEY RECOMMENDATIONS
a. Lack of market Incentives
Currently there is a huge interest to be engaged in the production of vegetables on irrigation schemes. However due to lack of market information system farmers are not producing following a staggered cropping calendar. They all produce the same type of crop at the same time. This causes market congestion at peak harvest time, leading to drop in price and even to the extent of damping these perishable crops with a consequent disappointment or discouragement of the producers. Hence it is imperative: • to provide farmers with market information • provide access to storage facilities at least for crops such as potatoes • Encourage investors to invest in processing plants using the farmers as out
growers. • Improve rural transport system including investment in road network • Undertake a detailed market study as part of the project preparation study. • Establish a system whereby WUAs can make a marketing arrangement with
cooperative unions.
54
b. Lack of Extension Support
During the field trip it was articulated by farmers in almost all the schemes that government support in terms of assigning Development Agents (DAs) is lacking. In Dodicha scheme we were informed that the WUA employed its own DA with a monthly salary of birr 500 to help and guide them in the production of high value crops such as green beans. Even in places where DAs are assigned; they are not competent enough to provide the technical support as irrigated agriculture demands integrated knowledge of water management, proper soils management, good agronomic practices and crop protection against diseases and pests. It is therefore imperative that the government assigns DAs that are well trained and have better knowledge than the farmers to provide farm guidance that differs from that provided by conventional extension service.
c. Beneficiary Participation
Beneficiary participation is a concept that is far beyond the contribution of free labor, local materials and cash. In order to guarantee the sustainability of any irrigation scheme and to instill a sense of ownership, farmers’ participation and involvement from the very inception of a project is crucial. Most irrigation schemes fail to realize their final benefits because beneficiary involvement at the identification and planning stage is either low or nil. Most often scheme designers fail to consult with local people and incorporate indigenous knowledge. Irrigation scheme designers and planners should learn farmers’ perceptions and rationale about things like scheme layout, water application etc. particularly in rehabilitation of traditional schemes. The WUAs should have a direct participation in construction planning, management and supervision in order to ensure sustainability.
d. Participation of local contractors
Apparently the role of local contractors in irrigation infrastructure construction is insignificant. Most construction work is either done by force account or by employing organizations such as WWCE, OIDA, COSAERAR, COSAERT etc. However, as the scope of irrigation construction increases, the government affiliated construction organizations capacity to undertake the construction works will be limited. In order to combat these capacity limitations, it is necessary to create favorable environment for encouraging emerging local contractors to get involved in construction activities and to create conditions favorable for the participation of such contractors in bids and hence assisting them obtain useful experience.
e. Operation and Maintenance
Proper operation and maintenance is key to the success and sustainability of any irrigation scheme. From the field visit it was evident that due attention and preparation in this respect was not considered in the planning of most of the
55
schemes. The roles of the various actors in this regard needs to be clearly defined. Operation and maintenance manuals need to be prepared as part of the planning and implementation process.
f. Access to credit
During the field visit, it was learnt that the ESRDF projects were not planned in a comprehensive manner so as to include support for credit facilities to cover the costs of various inputs. Hence poor farmers were constrained with lack of finance to run the schemes. The IFAD project has substantial provision for agricultural development including credit disbursement.
56
PART II SUMMARY OF CASE STUDIES
CASE 1.1 DONI KOMBE SSI PROJECT/ FUNDED BY CARE ETHIOPIA General characteristics of the project
History 1.74 Doni small scale irrigation scheme is located at148 kilometers south east of Addis Ababa. The
coordinates of the scheme are 90 55’ N and 390 48’ E. The elevation varies from 1240 to1260 meters above sea level. The project was initiated before 40 years by a private entrepreneur during the time of Emperor Hailesellasie. During the Dergue regime, the land was confiscated and handed over to Producers Cooperatives (PC). Under the PC management the project was operational on and off until it was totally abandoned around 1990. After the PC was dissolved the farmers submitted an application to CARE Field Office soliciting support for the rehabilitation and upgrading of the scheme. CARE Field Office undertook an assessment of the potential of the site for irrigation development. The assessment indicated that the site is very conducive for irrigated agricultural development. Subsequently a detailed study and design was commissioned by CARE jointly with the community and the government Line Departments (LD) in 1994. A thorough consultation process was undertaken with all concerned stakeholders to produce the final design document.
Type of project
1.75 This project relies on a gravity fed system. The scheme was built on the Awash River and employs a river intake and a diversion weir built on the side of the river to raise the water level. The water conveyance structures include 7.3 kms of main canal and 11 kms of secondary canals constructed by the community and CARE.
Objectives
1.76 The overall objectives of the project are: i).Attain food self-sufficiency through sustainable small scale irrigation development ii).Raise the levels of nutrition through increased food and cash crop production of farm families. iii) Contribute to the transformation of subsistence agriculture into surplus production for the market (commercialization aspect).
Components
1.77 The scheme was designed to irrigate 195 ha of land in two PAs, however, it was only able to irrigate a total of 80 ha, i.e. 45 ha in Doni Kombe PA and 35 ha in Sefa Dhankie mainly due to shortage of water from the system. The project components are: irrigation infrastructure development; training and capacity building and institutional development.
Donors
1.78 The project was funded by CARE Ethiopia an International NGO working in relief and development.
Actors involved in each phase 1.79 Following the approval of the design by the relevant government office; a tripartite agreement
was signed between the community, the Zonal Irrigation Department and CARE to carry out
57
the implementation. The agreement clearly defined the roles and responsibilities of each party as follows:
Community 1.80 The role of the community was to provide free labor for irrigation infrastructure construction
and collect local materials such as sand and stone. Community contribution is estimated to be about Birr 676,050. The scheme has two registered Water Users Associations. The major duty of the WUAs is the proper allocation of water to individual farmers. CARE
1.81 The role of CARE was to provide all required skilled labor, construction materials and cash for purchase of industrial materials and other project related costs. The scheme has two registered Water Users Associations. The major duty of the WUAs is the proper allocation of water to individual farmers. CARE has invested about Birr 3,188,997 toward the development of this scheme. and the community contribution is estimated to be about Birr 676,050.
Line Department (LD)
1.82 The LDs’ responsibility was to train farmers in crop production, water management and organize the farmers into Water Users Association. More over, the government also agreed to provide extension support and undertake major maintenance of the scheme after the scheme is completed and handed over to the beneficiaries. Synthesis of failures and successes
1.83 Scheme construction started at the beginning of 1995. Some farmers were not fully convinced that the scheme would be handed over to them after completion. Consequently they were reluctant to participate in the construction work. At the initial stage only 42 farmers were registered to take part in the scheme. As a result it was not possible to construct the planned irrigation network as per the plan made. Thus, after conducting a thorough participatory consultation with the farmers the project decided to employ none beneficiary farmers to take part in the construction of the scheme. Food for Work commodities (Wheat and vegetable oil) were paid for the non beneficiary farmers who took part in the irrigation work. Very good progress was made during the first year thus attracting more farmers to join the irrigation group. Hence, 7.3 kilometers of main canal with the required conveyance and control structures was constructed over a period of three years. During this period the number of beneficiary farmers increased to 185 households.
Successes encountered
1.84 Currently the scheme directly benefits 45 households in Doni Kombe and 35 households in Sefa Bate. Average land holdings within the irrigated area are 0.7 of a hectare. Farming households living in the two Peasant Associations perceive that they have benefited from significant increases in agricultural production. Household income has significantly increased since their engagement in irrigation. The 114 smallholder households within the irrigation scheme now produce up to three crops per year. Rain fed production is also supplemented to ensure better crop yield. They cultivate high value crops such as onions, tomatoes, and pepper in addition to cereal crops such as teff, sorghum and maize grown on the rain fed land. According to the farmers interviewed, household revenues have increased from Birr 500 to Birr 2,500 per annum. Farmers who initially experienced difficulty in accessing credit or repaying loans for improved seeds and fertilizers are now able to save not only enough to pay for seed and fertilizer, but are also investing in improvements in their homes (Corrugated sheet metal roofs), bought oxen and other animals and are renting additional lands outside the irrigation scheme.

58
Constraints threatening success 1.85 Lack of improved varieties of seeds, shortage of water as some farmers at the head reaches of
the main canal are growing plants such as sugar cane which has a very high demand for water. During periods of low flow, the amount of water entering the intake is not commensurate with the requirements of the irrigated area.

59
CASE 1.2 BATO DEGAGA SSIP/FUNDED BY WORLD VISION ETHIOPIA General characteristics of the project
History 1.86 Batu Degaga scheme is located at129 kilometers south east of Addis Ababa. The coordinates
of the scheme are 90 31’ N and 390 24’ E .The average elevation is1480 meters above sea level. The area is affected with recurrent drought and the current irrigation beneficiaries were dependent on relief food from World Vision Ethiopia (WVE) .In order to bring a sustainable development and make the people self sufficient in food, WVE opted for irrigation development as an alternative. Then the organization carried out detailed study and design of an irrigation scheme based on the nearby Awash River.
Type of project
1.87 The project is based on pumping water from the Awash River by employing centrifugal pumps that are electrically driven.
Objectives
1.89 The main objective of the project is combat drought and food insecurity and to make the project beneficiaries self reliant.
Components
1.90 Due to the relative position of the river with respect to the farmland technically it was not possible to divert the water by means gravity. Hence, a pump was designed to lift the water to the field. The pumping system consists of three big electric driven pumps, a main canal, secondary canals and various water conveyance and control structures.
Donors
1.91 The Donor of the project is WVE an International NGO engaged in relief and development.
Actors involved in each phase 1.92 The community became reluctant to get involved in the irrigation scheme as they were
suspicious that their land would be confiscated by the government. Hence, from the outset the community was not involved in the planning process. WVE studied and designed the scheme on its own. In spite of all the initial resistance from the community, WVE with the support of the government pushed on to implement the scheme. At the end, the community accepted the implementation of the irrigation scheme. The roles and responsibilities of the different stakeholders in the implementation process were as follows:
Community
1.93 Due to the nature of the topography the first section of the main canal was laid on a fill. The earth work required a lot of labour. Thus, the earth moving activity was accomplished with the help of a bulldozer complemented with farmers’ labor. In the case of canal sections where the volume of work was relatively small, farmers excavated, transported and compacted the soil. For their participation in the work farmers were paid FFW (wheat and vegetable oil) by WVE. Although there was resistance from the farmers during the planning phase the construction was undertaken without a significant problem.
The Role of Different Actors
60
1.94 The role of the government was community mobilization and facilitation of the development effort. WVE carried out study and detail design of the scheme with the support from the government technical departments. Avail all the necessary financial and material resources required for study, design and implementation.
Synthesis of failures and successes
1.95 The scheme was initially designed to irrigate 140 ha of land. Later on it was found out that due to limited pump capacity the whole 140 ha of land could not be irrigated. Consequently, the beneficiaries in consultation with WVE decided to leave out 80 of land and irrigate only 60 ha. The total beneficiaries of the scheme are 127 households with average land holdings of 0.5 ha. From the discussions made with the beneficiaries during the visit, out of the three pumps that were installed, only two are operational and these two pumps lack sufficient capacity to irrigate even the 60 ha of land. As a result, the beneficiaries are forced to irrigate their fields at an interval of 21 days. This has resulted in low production, i.e. 50 quintals of onion per half ha, and consequently low income.
Successes encountered
1.96 Regardless of the constraints they encountered, the beneficiaries claim that they are benefiting a lot from the scheme. From the discussions made the farmers expressed that they are able to feed their family round the year, they have bought oxen, constructed better houses and have bought household furniture like, radio, bed, etc.
Constraints threatening success i). Limited pump capacity
The limited pump capacity has forced them to reduce the area of land to be irrigated, thereby reducing the number of project beneficiaries. Hence, there is tremendous social pressure on the current beneficiaries by those who were left out.
ii) High electric bill
According to the farmers the electric meter is malfunctioning and the bill they are required to pay is too high. Each household is paying up to Birr 510 per production or cropping season. Beneficiary farmers have applied to the respective government organization to change the meter. Not withstanding action has not yet been taken.
iii) Marketing problem
Lack of access to market is another acute problem that has hindered the beneficiaries’ from fully realizing the benefit from the scheme. They are forced to sell all their produce at the farm gate at very low price compared with the adjacent market.
61
CASE 1.3 WAKIE TIYO SSIP/SMALL HOLDER PRIVATE INITIATIVES General characteristics of the project
History 1.97 Wakie Teyo traditional scheme is situated 115 kilometers south east of Addis Ababa. The
coordinates of the scheme are 80 24’ N and 390 19’ E. The average elevation is 1540 meters above sea level. The site is located adjacent to the Ethiopian Agriculture Research Organization (EARO) Awash Malkasa Research center, 117 kilometers from Addis. The climate of the area is generally hot and dry. Various kinds of crops are grown under rain fed condition including Teff, maize and haricot beans. However, the rainfall is characterized by its erratic nature; hence, rain- fed crops are not reliable. Crop production failure or yield reduction due to insufficient rainfall is expected at least in three out of five years. Thus, the community in the surrounding area rely on irrigated crops mainly tomatoes, onion and maize to earn their living.
1.98 During the rainy season the field adjacent to the river bank is covered by the flood from
Awash River. Part of this field is water logged. Farmers dug intake ditch about three kilometers long from Awash River to the farmland. Until recently farmers were using buckets to lift the water manually from the ditch to the field. Since the last four years farmers have started using small centrifugal pumps to lift the water to the farmland. Moreover the use of pumps has allowed the farmers to irrigate fields located far away from the ditches. As a result, the irrigated area is expanding year after year.
Type of project
1.99 Individual small holder plots irrigated with the use of small centrifugal pumps using surface irrigation.
Objectives
1.200 The objective is to grow high value market oriented vegetable crops so as to generate cash and improve household food security and livelihood.
Components
1.201 Supply water to individual plots, on farm water management and vegetable production for market.
Donors
1.202 The schemes are self financed. However, the neighboring agricultural research station provides them with technical advice and limited material support during the start-up period.
Actors involved in each phase
1.203 The farmers in the area are resource poor and could not buy pumps for irrigation. Due to the proximity of the site to the town and market, small investors enter into an agreement with the land owners to work together. There are different arrangements between the land owner/farmers and pump owners/local entrepreneurs. These include renting the land by the pump owners, renting the pump by the land owners and the land owners and pump owners agree on certain terms to equally contribute the inputs and share the harvest. There is no formally established WUA. When there is a need for ditch cleaning all beneficiaries will participate in the work. Mobilization of the beneficiaries is done by any of the individuals who have irrigated field in the in the area. If one fails to participate in the ditch cleaning he/she will not be allowed to pump the water from the ditch.

62
1.204 We were told that there are about 130 households who are directly or indirectly benefiting from irrigation activities. Out of these 60 are farmers who neither own land nor pump, this category of farmers operate by renting land and pump. 50 farmers are renting their land to pump owners, and the rest 20 families are working as laborers on irrigated field.
Synthesis of failures and successes
1.205 With the exception of lack of sustainable market, there was no major problem that could be recorded.
Successes encountered
1.206 We selected two farmers at random and discussed with them regarding the irrigation activity, the management, type of collaboration between the land owners and pump owners and its impact on the livelihood of the surrounding farming community.
Dadi Bedada 1.207 Dadi is 27 years old, and he has three children. He is landless and depends on rented land to
support his family. He started irrigation farming three years ago using bucket system. He rented 0.25 ha of land he is currently cultivating at Birr 500 Birr per annum. He grows onion and tomato on his rented plot of land. Last year he spent all together Bir 1,600 to grow onion on the rented land and sold the produce at Birr 3,080. After harvesting onion he purchased inputs with Birr 150 planted pepper and cabbage on the same land and sold the produce at Birr 1,500. Dadi has no oxen. He borrows oxen from his relatives and friends. The Awash Melkasa Agricultural Research Center adjacent to the scheme provided him with improved Variety of onion seed.
1.208 Dadi said that previously he was producing once a year at a risk of unreliable rainfall pattern.
Now he is producing twice a year and is able to feed his family. According to him the following are some the constraints he is facing with his irrigated farming business.
1.209 He has no market access. Vegetable traders are coming to the site and buy what he produces at
the price the traders decide. He has no bargaining power at all and believes the price is very low compared to the price of vegetables in the adjacent town.
1.210 There is no technical/extension support. He uses his own skill that he acquired from his fellow
farmers. He believes that had there been technical support form the government the yields and the benefits would have been better. He said although there is no major change in his livelihood, he feels that he is food self sufficient all the year round. Most of the income he gets is paid for the land rent and inputs which are expensive.
Girma Bulcha
1.211 Girma is 24 years old single farmer. He has attended formal education up to 4th grade and he is still attending night classes. Girma lives with his parents and has no land. He was unemployed before three years and used to dink alcohol due to frustration and joblessness. The Awash Malkasa Agricultural Research Center (AMARC) has supported and motivated him to start irrigated farming. The support from AMARC included improved seed, fertilizer and pesticides. He started irrigation farming on 800 square meters of rented land.
1.212 The first year he sold the produces at Birr 2,789. The next year he rented 0.25 ha of land and
planted vegetables. From the sale of the vegetables he got an income of Birr 6,286. From this revenue he invested Birr 600 to purchase land for building a house, he also purchased two oxen and increased the size of the land he is cultivating to 0.5 ha. In the third year from this land he sold the produce at Birr 4,200. The reduction in income is attributed to the fall in price of vegetables in comparison with that of the previous year. Girma feels that he is economically comfortable and is planning to get married next year. According to him the major problem of farmers involved in agriculture is market.

63
64
CASE 1.4 SHELED SSIP/IFAD FUNDED PROJECT General characteristics of the project
History 1.213 Sheled irrigation scheme was identified by the community in 1977. Farmers dug two
kilometers of canal to divert the water by gravity from Katar River. The effort made by the farmers was not successful and the water was not diverted to the field because of lack of technical skill. Following the aborted attempt they approached the Chilalo Agriculture Development Unit (CADU) for technical support. A Technical team from CADU, visited the site and made an assessment, and concluded that the water could not be diverted by gravity and recommended the use of pump to lift the water to field. Accordingly, one diesel engine driven centrifugal pump was provided to the Producers Cooperatives (PC) in 1979 by CADU. The pump was used to irrigate 21 ha of land. Considering the high cost associated with pumping in 1982 the farmers once again decided to try diverting the water by gravity. This time they successfully diverted the water by gravity and were able to irrigate19 ha which was owned by the PC.
Type of project
1.214 In 1990 due to government reform the PC was dissolved and individual farmers discussed and agreed to apply to the Irrigation Development Department (IDD) under MoA for support to rehabilitate and up-grade the scheme. Their request was favorably accepted by IDD and a formal agreement was signed between IDD and the farmers group. A joint planning exercise was undertaken to upgrade the scheme. The scheme upgrading and rehabilitation was completed in 1992. This includes construction of permanent diversion headwork, canals and appurtenant structures to irrigate a net area of 50 ha
Objectives
1.215 The main objective is to improve agricultural productivity by reducing dependence on the vagaries of nature and to improve household income by providing opportunity to grow market oriented crops.
Components
1.216 Support for irrigation infrastructure development and provision of agricultural inputs such as improved seeds and fertilizers.
1.217 Donors
The estimated cost of the scheme at that time was Birr 114,000. It was initially agreed that the government covers 50% of the cost while the farmers were supposed to cover 50% of the cost by taking long term loan from the IFAD Special Country Program through the Agricultural and Industrial Development Bank of Ethiopia.
Actors involved in each phase
1.218 During the first phase of the project, the main actors in the planning and implementation phases of the project were, the Irrigation Development Department of MoA, The Agricultural and Industrial Development Bank of Ethiopia, The Agricultural Development Department, The Cooperative Promotion Department and the Zonal Agriculture and Rural Infrastructure Departments as well as the Zonal Irrigation Construction Brigade. IDD was supposed to provide the technical support including scheme construction. After concluding the agreement IDD mobilized equipment, materials and manpower to construct the scheme while beneficiary farmers provided local materials (sand and rock) and unskilled labor. During planning the farmers opted for diversion location upstream of the current location with the objective of putting more land to be commanded. The suggestion was however rejected by
65
MoA/IDD technical team as it was not technically feasible. Thus, the farmers agreed to the location selected/proposed by the technical team. Accordingly construction of the first phase with the capacity to irrigate 50 ha was accomplished successfully in 1992. The second phase construction and expansion was undertaken by the Oromia Irrigation Development Authority (OIDA) with farmers’ labor contribution.
Synthesis of failures and successes
1.219 Since several farmers in the area who were not included in the first phase were not benefiting from the scheme, a request was forwarded to Oromia Irrigation Authority (OIDA) to put additional 25 ha of land under irrigation. Expansion design was made by OIDA which incorporated the construction of a night storage pond and increasing the existing main canal discharge capacity. However, farmers are of the opinion that the required scheme expansion endeavor was not successful due to poor construction workmanship and the failure to use the right materials for fill canals and pond compaction. The night storage floor and side slope was not properly compacted. As a result the night storage did not store water as required. The inflow canal was not properly designed and constructed to carry the desired flow in to the night storage. Hence the anticipated additional 25 ha has not been realized. From the discussion made with the farmers it was learnt that while selecting and using soil for compaction farmers’ indigenous knowledge and recommendation regarding appropriate soils in the locality was not taken into consideration. Given the length of period since it has been operational, the project did not bring a major impact mainly due to lack of access to market.
Successes encountered
1.220 The scheme is managed by a WUA.The executive committee meet regularly. A fine of 5 Birr
is imposed on those who fail to attend a meeting. Those who breach canals are fined Birr 25 whenever they are found guilty. The scheme beneficiaries grow a mix of tomatoes, potatoes, pepper, papaya, onion and beet root. When asked about their expenditure and income Ato Hirpo Ulu who is the chairperson of the PA and member of the WUA indicated that he got revenue of Birr 420 from the sale of cabbages from a plot of 0.25 ha. As a second crop he planted maize and got revenue of Birr 900. He usually plants vegetables entirely for market and sweet potatoes for market and household consumption. Ato Hirpo has two wives and constructed better house with Corrugated Iron Sheet for both of his wives from the income accrued from irrigated crops. He sends all his children to school.
1.221 Sheik Abdulrahiman Gendo is another member of the WUA with whom the study team had a
discussion. When asked about the benefits he accrues from irrigation, He said that he has gained a lot of benefit some of which are: all of his16 children are going to school; He feeds his children round the year; He plants vegetables to generate cash; He uses the plant residue to feed his cattle.; He purchased Corrugated Iron sheet to construct a better house from the sale of sugar cane.
Constraints threatening success
1.222 During the discussion made with the farmers met they expressed some of their constraints as follows: i). Limited market access
Sheled scheme is relatively located far away from major towns. Vegetables that are produced from sheled and surrounding towns are sold at Ogolcho village. The demand of Ogolcho village cannot absorb all the supply from the surrounding irrigated farms. Vegetable traders from major towns are not

66
coming to scheme frequently to buy the produces. As a result farmers are forced to grow maize rather than high value vegetables for market.
ii). Major maintenance of the irrigation system
Farmers complained that there are major outstanding maintenance tasks which are beyond their capacity. This includes leakage of the weir and over excavation of the canals bottom level.

67
CASE 1.5 DODICHA SSI/FUNDED BY ESRDF General characteristics of the project
History 1.223 Dodicha is located close to Lake Ziway on the bank of Bulbula River (a river which flows out
of Lake Ziway). There is frequent food shortage in the area due to uneven distribution of rainfall. However, there is abundant water in Lake Ziway and fertile agriculture land which can be tapped to improve agricultural productivity by changing from rain fed to irrigated agriculture. The main constraint to realize the potential is lack of investment capacity.
Type of project
1.224 The project is based on pumping water for irrigation fro the Bulbula River which is an outlet of Lake Ziway.
Objectives
1.225 The objective of the project is to combat the effects of recurrent drought and also improve family income and general livelihood through the production of high value vegetable crops for market.
Components
1.226 The project components are installation of pumps and delivery pipes, construction of canals and associated structures, provision of credit and horticultural development.
Donors
1.227 The project Donor is the Ethiopian Social Rehabilitation and Development Fund (ESRDF)
Actors involved in each phase 1.228 After learning from other people about the Ethiopian Social Rehabilitation and Development
Fund(ESRDF) support in irrigation development, the farmers submitted application to ESRDF regional office located in Ziway. After receiving their application ESRDF asked the farmers if they have land and water resource which can be used for irrigation. The district Agriculture office wrote support letter to ESRDF that there is good land and enough water resource in the Bulbula River that can be used for irrigation. In 2001a pre-feasibility study and data collection was carried out by the district Agriculture office with support from the farmers. The study document was submitted to branch OIDA office located in Arsi. OIDA requested the farmers to cover the cost of the Feasibility study and the detailed design. The farmers came back and explained to ESRDF what they were requested by OIDA branch office. ESRDF then assisted by investing Birr 25,000 required for the study and design.OIDA then undertook the detailed study and design with active participation of farmers. The pump site and canal route was selected jointly by the design team and the farmers. In the design three pumps were proposed. After completion of the design OIDA handed over the design to the beneficiaries. The study was appraised by ESRDF technical staff and the project was approved. Following the project approval, an implementation agreement was signed between the farmers, ESRDF and OIDA branch office. In the agreement it was indicated that the beneficiaries should contribute 10% of the total cost of the project in cash and in kind. Moreover the agreement stated that beneficiaries should deposit Birr 10,000 in the bank and contribute all the required unskilled labor which was estimated at Birr 101,000. ESRDF contributed the remaining budget in grant and scheme implementation commenced.
Synthesis of failures and successes

68
1.229 Although it was proposed in the design to install three pumps, ESRDF financed the procurement of only two pumps. Taking in to account the capacity of the two pumps 153 farmers were registered to irrigate their field which is 69 ha. Land size owned by individual farmers varies from 0.25 ha to 0.5 ha. As the previous individual land ownership was respected, no effort was made to distribute the land equally to farmers. Except for the delay in the final approval of the project the beneficiaries have reported that there has not been significant problem in the planning and construction process.
Successes encountered
1.230 The scheme beneficiaries grow tomatoes, onion, green beans, pepper and cabbage. The WUA
purchase agricultural inputs for its members from Addis Ababa. Initially there was no Development Agent (DA) assigned by the government thus the WUA has employed skilled practitioner who has hands- on vegetable production with a salary of Birr 500 per month. Unfortunately a nearby private investor attracted and employed this person with a higher salary. Currently the WUA has employed 11 people from the area to support with the day to day operation of the activities. Although the farmers understand the need for saving money for future replacement of the pump set they have not started saving money yet for this purpose. Recently The WUA borrowed Birr 250,000 from Oromiya Saving and Credit Association. This loan is used to cover the running cost of the project which includes purchase of inputs (pump fuel, seeds, fertilizers and pesticides). Currently they have paid back Birr 155,000. From the net profit of the sale of the produce 12% is deducted from each farmer for the WUA. The WUA has made marketing agreement with a vegetable trader in Addis Ababa who takes their produce as a commission agent. They also have agreement with Ethio-Flora (a private company which grows green beans and flowers for export market) to supply green beans as out growers. They are supplying green beans to this company at a rate of Birr 1.85 per kg.The company provides the necessary quality control to the WUA in the production of green beans. Farmers met at the scheme are generally happy with the irrigation scheme. Previously when they were farming under rain fed condition in a good year their annual income was between Birr 500 to Birr 600. After they started using the irrigation scheme on the average their yearly income is Birr 5,000 to Birr 6,000.
1.231 From the discussion made it was learnt that, from 2002 to 2004 12 members of the WUA have constructed corrugated iron sheet houses, eight farmers have bought oxen, 12 farmers have bought cows, six farmers have purchased donkeys with cart and one farmer has opened bank account and started saving money.
1.232 Coming to individual benefits a farmer named Amaya Terfi claimed he is self sufficient and food secured. In addition to that he has bought a bicycle for transport, bought oxen for farming, he has secured land in Adami Tulu (small near by town) to construct a house and he sends his four children to school.
Constraints threatening success
i) Limited pump capacity
The pump capacity is limited and can not irrigate their land sufficiently. Crops such as green beans have high water requirement and are sensitive to water stress. More over the WUA plans to put additional 30 ha of land under irrigation
ii) Marketing of vegetables Farmers believe that the terms of trade with the vegetable merchant in Addis Ababa is in favor of him and their benefit is considerably lower compared with the price of the vegetables in Addis
69
CASE 1.6 WAYU SERITI SSIP/ESRDF FUNDED PROJECT
General characteristics of the project
History 1.233 The Weyu Seritii village is located 145 kilometers south of Addis Ababa on the main Asphalt
road to Kenya via Awassa. The irrigation scheme is located Two kilometers to the east of the village on the Shore of Lake Ziway, which is extensively used for irrigation. Due to the recurrent drought farmers were not able to feed their family under rain fed farming. Although they realize that several private individuals and groups of farmers are depending on irrigation from Lake Ziway they were not able to invest in irrigation development due to capacity limitations.
Type of project
1.234 The project is based on pumping water from Lake Ziway from a supply ditch that draws water from the lake.
Objectives
1.235 The objective is to overcome the loss of production that is associated with recurrent drought in the area, as well as to produce high value vegetable crops for market and thereby increase family income and improve household livelihood.
Components
1.236 The project components are installation of pumps and delivery pipes, construction of canals and horticultural development.
Donors
1.237 The project donor is mainly ESRDF. However, a small assistance was obtained from an individual supporter.
Actors involved in each phase
1.238 When the farmers heard that ESRDF provides support for irrigation development, they submitted application to ESRDF for support. ESRDF referred the farmers to OIDA. When the farmers approached OIDA, OIDA asked them to deposit Birr 6,000 for the study and design. A foreigner working for international NGO donated this initial fund since the farmers are resource poor and could not contribute the money. After OIDA completed the study and the design the document was submitted to the farmers. Subsequently the farmers handed over the design documents to ESRDF. ESRDF technical staff appraised and approved the proposal.
1.239 Following the approval of the proposal ESRDF, OIDA and the farmers signed a tripartite
agreement for scheme implementation. ESRDF agreed to finance the scheme while OIDA agreed to provide technical support for the implementation of the scheme. The role of the beneficiary farmers is to provide unskilled labor and local materials. From the total project cost the framers contributed about Birr 30,000 in cash and in kind. A committee was set up consisting OIDA, ESRDF and the WUA to execute the purchase of the pump. Although the planning process took longer time than anticipated, implementation took shorter time than expected. Except for the lengthy bureaucratic procedure encountered at the planning stage, the whole process of scheme study, design and implementation was very smooth.
70
Synthesis of failures and successes 1.240 After implementation of the scheme was completed there was no operating fund required by
the WUA to run the irrigation scheme. Each individual farmer cultivated his land and planted vegetables using local seed with out of pocket financial input. During the second planting a vegetable trader in Addis Ababa provided them with loan which would be paid from proceeds of the harvest. The cost of input per production varies from Birr 1,500 to Birr 2,000. Realizing the shortage of budget that the WUA is struggling with, ESRDF provided them with a revolving fund amounting to Birr 110,000 to augment their budget. The WUA made agreement with ESRDF on the fund management. Whilst the WUA entered into an agreement with individual farmers to disburse the fund on loan basis according to the established loan procedures. The beneficiaries repay the loan plus 4% interest to WUA. The WUA purchases agricultural inputs in bulk and distributes to individual farmers based on their request. The WUA has both pump set replacement and maintenance plan. According to the plan from each farmer Birr 40 and Birr 229 would be collected for maintenance and replacement respectively. Up to now they have not put this plan in to action. However, as maintenance is a critical issue, they have set aside Birr 10,000 for this purpose from the revolving fund they got from ESRDF. They have also employed one pump operator and two guards Successes encountered
1.241 Since the area is drought prone, the majority of the farmers were dependent on relief aid before the realization of the project. The scheme beneficiaries claim that they are now able to produce 2-3 times a year and able to get a yearly income of Birr 5,000-6,000. The study team discussed with individual farmers regarding the benefits they got from the scheme. A farmer named Kasa claimed that he has constructed corrugated iron sheet house, purchased oxen, sends all his children to school and he is able to feed his family without constraints. He uses household labor to run his irrigated farm and employs up to 30 labors per day during onion planting.
Constraints threatening success i) There is no DA assigned to the site. Thus there is no extension service ii) There is no marketing arrangement which benefits the farmers. The existing market
system is in favor of the vegetables trader. iii) The price of agriculture input, especially pesticides is exorbitant.
71
CASE 1.7 GODINO REHABILITATION AND EXPANSION SSI/GOVERNMENT FUNDED PROJECT
General characteristics of the project
History 1.242 According the discussion made with the group of farmers Godino is a traditional irrigation
scheme which is about 156 years old. Until 1996 the scheme was irrigating only 16 ha of land with water source from a spring. The government constructed a storage dam on the nearby Wedecha River in 1980. The farmers were then motivated to divert it using their own technical skill and resources in 1995. However, they were not successful and could not divert the water to irrigate additional land. Then they organized themselves into a group and submitted a request for assistance to OIDA. OIDA sent a technical team to the site to assess the situation. The technical team recommended the scheme for rehabilitation and expansion.
Type of project
1.243 Godino scheme draws water by means of gravity from the Wedecha reservoir to supply some 140 ha of land.
Objectives
1.244 The main objective of the scheme is to produce high value market crops and thereby improve family income and reduce poverty.
Components
1.245 The scheme components are; construction of a diversion structure, rehabilitation and expansion of the irrigation canals and appurtenant structures, strengthening of the WUA and horticultural development.
Donors
1.246 The donor is the Oromia regional government, whereas the execution was undertaken by OIDA.
Actors involved in each phase
1.247 Following the approval of the project by the government for modernization, the WUA and OIDA made joint planning. After the study and planning of the scheme was completed an agreement was signed between WUA and OIDA. WUA’s responsibility was mobilization of farmers to contribute the required labor for scheme construction.
Synthesis of failures and successes
1.248 Consequently the construction of Godino scheme was completed at the end of 1996. The initial plan was to irrigate 290 ha of land and benefit 216 households. This could no be realized due to water shortage that is release from the dam. Thus currently the scheme is irrigating only 140 ha. Farmers in the scheme grow cereals and vegetable crops. Those farmers who cannot afford to purchase inputs for vegetable crops production plant cereals like check pea and lentils and vetch. Those farmers who have cash to purchase inputs plant vegetable crops and harvest 2-3 times a year.
Successes encountered
1.249 Project beneficiaries’ perceive that with out this irrigation scheme they could have migrated elsewhere in search of jobs. Due to increasing population growth and reduced land holding capacity, harvest from rain fed agriculture cannot satisfy household food needs and generate income. Generally farmers are very happy with the benefit they are getting from the scheme.
72
According to the discussion made with the farmers two farmers have bought cars for public transport, two farmers have bought flour mills, over 70% of the farmers have constructed better houses using corrugated iron sheet , all project beneficiaries have bought oxen to cultivate their land and some farmers have bought milking cows. The scheme beneficiaries have created employment opportunities for over 500 daily laborers. According to their assessment over 50 households have significantly improved their livelihoods.
1.250 One of the scheme beneficiary farmers named Getachew Asfaw said that his living standard
has significantly improved since he started using the irrigation scheme. Getachew is 36 years old. He has a family and has three children. He has completed 12th grade before ten years and came back to farm as he couldn’t manage to pursue university education. As he is landless, in 1994 he rented 0.25 ha of land and planted cereals under rain fed condition for household consumption and planted vegetables under irrigation to generate cash. Gradually he increased the size of land he was cultivating. Over the last ten years he bought land and constructed house in Godino town, he bought a car at Birr 35,000 to transport passengers, he bought eight oxen, two cows, several sheep, donkeys, other domestic animals and TV set. He employs seven daily laborers during peak period to work on his irrigated farm.
1.251 Farmers buy inputs from different places. Godino service cooperatives in which they are
members supply them with fertilizers and pesticides on credit basis. They buy onion seed from Harar, potato from Sashemene. Due to the poor quality of the seeds usually the yield per ha is very low. For example the yield per ha is 120 quintals and 100 quintals for potato and onion respectively.
1.252 Constraints threatening success
i) Although the scheme is close to cities like Debre zeit and Addis Ababa they have marketing problems. The price of their products is determined by the vegetable traders and they have no bargaining power.
ii) Farmers have no adequate extension support in irrigated agriculture. They use their own skill especially in fertilizer and pesticide application. The experience and skill of the DA assigned by the government is limited and no better than the farmers.
iii) The WUA has no credit facility for its members. Thus the members’ investment
capacity in the irrigated agriculture business is limited due to shortage of budget. iv) The scheme is getting water from the Wedecha dam constructed before 25 years. The
dam has almost completed its life and has almost silted up. After few years the dam is anticipated to totally silted up and a critical water shortage is eminent. Unless the government plans for alternative water sources for irrigation the fate of the scheme is in jeopardy.
73
List of References
Abbay River Basin Integrated Development, Phase 3 Master Plan Volume I - Main Report. BCEOM - French Engineering Consultants in Association with ISL & BRGM, April 1999. ADF Small Scale Irrigation Project reformulation Report. Euroconsult Arnhem, The Netherlands, December 1992. Ethiopia - Agriculture Sector Support Project Preparation Report. Main Report. June 2003. Ethiopia Highland Reclamation Study. The Potential for irrigation in the Ethiopia Highlands. RMG Hewett etal. Land use Planning and Regulatory Department Ministry of Agriculture. Food and Agriculture Organization of the United Nations. Ethiopia Small Scale Irrigation Project preparation Report. FAO/African Development Bank Investment Center Food and Agriculture Organization of the United Nations August 1983. Ethiopia Small Irrigation Working paper Volume 2 of 2 , July 1985 Ethiopian Social Rehabilitation and Development SSIP Technical Hand Book, November 1997 IFAD Special Country Program Phase II Appraisal Report, April 1997 IFAD Special Country Program Phase II Midterm Review , September 2002 Ministry of Water Resources, The “Guideline, Manual and Standard Design of Small and Medium-Scale Irrigation Projects in Ethiopia.” August 2002. National Water Strategy, Addis Ababa, November 2001. Oromia Irrigation Development Authority Strategic Planning and Development (2004 - 2006 E.C) 2003. Problems and Constraints in the Study, Construction and & Management of Small Scale irrigation Projects. Habtamu Gessesse October 1990. Promotion of Small Scale Irrigation in food in secured Woredas of Ethiopia. World Bank September 2001. Staff Appraisal Report Ethiopia Special Country Program. January 14, 1987. Staff Appraisal Report Ethiopia Special Country Program (Implementation Volume) June 1987. The World Bank Eastern and Southern Africa Region, Northern Agriculture Division. The Federal Democratic Republic of Ethiopia, Ministry of Water Resources. Ethiopia Water Resources Management Policy 1999. The Federal Democratic Republic of Ethiopia, Ministry of Water Resources. Water Sector Development Programme 2002-2016, July 2003.

74
IRRIGATION, PLANNING AND IMPLEMENTATION: MADAGASCAR
OCTOBRE 2004

75
LISTE DES ABREVIATIONS AMVR: Aires de Mise en Valeur Rural AUE: Association des usagers de l'eau BAfD: Banque Africain pour le Développement BM: Banque Mondiale BV-PI: Bassin versant-Périmètre irrigué CCCE: Caisse centrale de Coopération Économique DAIR: Direction d'Appui aux Investissement ruraux EPP: Equipe Permanent de Pilotage du PADR FAC: Fonds d'Aide à la Coopération FAD: Fonds Africain pour le développement FAO: Food Agricultural Organisation FED: Fonds Européen pour le Développement FERAH: Fonds d'entretien des réseaux hydroagricoles FIDA: Fonds International pour le développement Agricole GPI Grand périmètre irrigué IDA: International Development Association MAEP: Ministère de l'Agriculture, de l'élevage et de la pêche MEADR: Ministère d'Etat chargé de l'Agriculture et du développement rural MPI: Micro-périmètre irrigué OPEP: Organisation des Pays Exportateurs de Pétrole PADANE: Programme de Développement Agricole du Nord Est PADR: Plan d'Action pour le Développement Rural PC: Périmètre Colonial PHBM: Projet de mise en valeur du Haut Bassin de Mandrare PIN: Programme Indicatif National PIR: Programme Indicatif Régional PPI Petit périmètre irrigué PPI 1: Projet de réhabilitation des petits périmètres irrigué phase 1 PPI 2: Projet de Réhabilitation des petits périmètres irrigué phase 2 PRBM: Projet de Réhabilitation du périmètre rizicole du Bas Mangoky SAMANGOKY:Société Malgache du Bas Mangoky SOMALAC: Société Malgache du Lac Alaotra
76
METHODOLOGIE Sur le plan méthodologique, les trois approches suivantes ont été adoptées pour ce travail: i) revue et analyse des donnés bibliographiques et documentaire, ii) entretien avec les personnes ou les entités concernées par les projets touchant le secteur irrigué ou ayant participé à des projets d’irrigation agricole, iii) analyse approfondie de quelques cas de projet d’irrigation agricole.
Revue et analyse bibliographique Cette approche consiste à collecter et compiler les informations disponibles dans les documents relatifs aux projets d’irrigation agricole à Madagascar. Il s’agit de dégager les points forts et les points faibles de ces projets. Ces informations devraient faire apparaître, entre autres, le contexte dans lequel a été réalisée chaque phase des projets, l’environnement qui a cadré les projets sur lequel ils se sont basés, et les différentes approches pour chaque phase ainsi que les appréciations lors de leurs évaluations. Les documents utiles pour ce travail sont principalement les différents rapports concernant le secteur agricole en général et du secteur irrigué en particulier, les documents relatifs à la politique et/ou programme de développement agricole et du secteur irrigué, les rapports de préparation et d’évaluation des projets d’irrigation agricole, les rapports d’évaluation à et de synthèse à la fin du projet, etc.
Entretien auprès des personnes ou entités concernées par les projets hydroagricoles Apres la consultation et l’étude des informations documentaires, des entretiens auprès des organismes ou personnes qui sont concernées par le secteur irrigué ou des personnes qui participent ou ont participé à des projets d’irrigation, sont entrepris. Cette approche permet d’établir des points de vue divers sur le déroulement des différentes phases du projet, les difficultés rencontrés, les solutions entreprises, la façon dont chaque acteur a assumé sa responsabilité, etc. Les organismes ciblés pour l’entretien sont : la Direction au sein du MAEP en charge du développement du secteur irrigué, les responsables du développement rural auprès des représentants des bailleurs de fonds au pays, les cellules d’exécution des projets en cours touchant le secteur irrigué (PHBM, PRBM, PADANE). Les responsables des projets de réhabilitation des petits périmètres irrigués phase 1 et phase 2 ainsi que les responsables du Programme Bassin Versant-Périmètre irrigué (BV-PI) constituent les principales personnes à contacter dans cette approche. Les entretiens comportent d’une part une vue globale sur la planification et l'exécution des projets d'irrigation et d’autre part une appréciation plus détaillée sur un projet spécifique. La

77
méthode de communication adoptée se caractérise par l’exposition de la problématique avant formulation de la question. Les questions sont restées ouvertes et ne sont pas ordonnées mais posées en fonction de la réponse. Cette méthode valorise l’entretien à travers un échange de point de vu qui suscite en même temps l’intérêt de la personne interviewée
Etude de cas Quelques projets d’irrigation agricole sont analysés de façon plus détaillée compte tenu des informations obtenues lors des deux approches précédentes. Le contexte, les cadres juridiques ou institutionnels, l’approche adoptée sont analysés pour chaque phase du projet. Les points forts et les points faibles de chaque phase seront à mettre en évidence ainsi que les relations de cause à effet au niveau des différentes étapes du cycle du projet.
78
EVOLUTION DES INTERVENTIONS POUR L’AMENAGEMENT DES PERIMETRES IRRIGUES A MADAGASCAR
L’un des premiers grands aménagement de périmètre rizicole évoqué par l’histoire à Madagascar remontait vers le 18ème siècle au temps du grand roi Andrianampoinimerina (1710) qui créa le périmètre irrigué de la grande plaine de Betsimitatatra (dans la partie basse de la ville d’Antananarivo). La partie Betsileo (au sud de la province d’Antananarivo sur le haut plateau) s’est aussi distinguée depuis des siècles par le système d’aménagement en gradin des parcelles rizicoles. La production rizicole fait parti d’une culture traditionnelle vieille de plusieurs siècle à Madagascar et la riziculture irriguée tient toujours, jusqu’à présent, une place très importante dans l’économie du pays. L’évolution du secteur irrigué peut être décrite suivant les différents régimes politiques qui ont marqué l’histoire de Madagascar.
Régime colonial (1896 à 1960)
Les autorités coloniales ont porté un intérêt particulier à l’irrigation agricole. Ils ont installé, depuis les années 30 des systèmes d’irrigation plus poussés au niveau des périmètres coloniaux des grandes zones d’aménagement tel que le Lac Alaotra, la plaine de Marovoay, la Plaine de Mahavavy (Exploitation de canne à sucre par une grande industrie sucrière), le Delta de Morondava ou plaine de Dabara. Ces infrastructures étaient gérées par le service des travaux publics avant d’être prise en charge par le service du géni rural en 1950. Elles ont servi uniquement les sociétés et exploitations coloniales.
Après la rébellion des nationalistes en 1947, les petits périmètres exploités par les nationaux ont bénéficié des aménagements hydroagricoles à travers le FIDES (Fonds d’Investissement pour le Développement Economique et Social de la France d’outre mer). Les infrastructures qui ont été installées au niveau de ces périmètres se trouvaient sous la responsabilité des groupements de collectivité24. Le FIDES a, en outre, renforcé les infrastructures au niveau des grands périmètres par la mise en place des barrages en terre (exemple au Lac Alaotra et à Marovoay)
Première république (1960 à 1972)
Au début de cette période, les sociétés d’aménagement chargées de l’exploitation des grandes zones d’aménagement ont vu le jour: SOMALAC avec l’appui financier de la France à travers le Fonds d’Aide à la Coopération (FAC) dans le Lac Alaotra et la SAMANGOKY sur financement FED dans le grand périmètre rizicole et cotonnier du Bas Mangoky. Le régime foncier au niveau de ces zones était régi par l’ordonnance n° 62 6042 du 19 septembre 1962
24 Structure administrative chargé de la gestion des collectivités territoriale.

79
instituant l’Aire de Mise en Valeur Rural (AMVR) qui donnait un droit d’usage transférable par héritage aux paysans exploitants. Les parcelles étaient toujours des propriétés de l’Etat. Les sociétés d’aménagement étaient chargées de collecter les redevances pour l’entretien des infrastructures hydroagricoles à verser à l’Etat. Ce dernier par le biais du service du géni rural assurait toujours la gestion et l’entretien de ces infrastructures.
Après la dissolution des groupements de collectivité en 1963, la gestion et l’entretien des périmètres qu’ils ont géré, ont été transférés à la brigade mobile du géni rural. Deux catégories de périmètres existaient : les périmètres classés qui étaient gérés par le service du géni rural et les périmètres non classés. Ces derniers se trouvaient sous la responsabilité des autorités communales. Les différents investissements en irrigation agricoles ont été financés par le Fonds National de Développement Economique (FNDE) pour les périmètres classés et le FED à travers le projet Micro-hydraulique. La Banque Mondiale (BM) est intervenue au Lac Alaotra en 1970 pour l’aménagement du PC 23. A la fin de cette période, la production rizicole étaient suffisante et Madagascar était même exportateur de cette céréale qui constitue depuis toujours l’aliment de base de la population malagasy.
Deuxième république ou régime socialiste (1975 à 1991)
L’Etat a mis en œuvre à partir de 1975 une politique de subvention à grande échelle au niveau des secteurs de production en particulier le secteur rizicole. Face à l’insuffisance des ressources, l’Etat n’a plus les moyens d’investir dans le secteur irrigué. L’entretien des infrastructures hydroagricoles existantes supporté par le budget général de l’Etat n’était même plus assuré. Quelques projets d’irrigation agricole notamment sur les grands périmètres ont été réalisés sur financement extérieur au cours de cette période: Projet d’aménagement de la plaine d’Andapa (FED), Drainage pour les palmiers à huile à Manakara (FAC), Projet d’aménagement du bas Fiherenana (FED), Projet d’irrigation du Lac Alaotra, Projet de développement rural et d’irrigation à Morondava exécuté par la Société de Développement du Moyen Ouest ou SODEMO (IDA), Projet Basse Betsiboka au GPI de Marovoay. Vers le début des années 80, la Direction du géni rural a classifié les périmètres irrigués en quatre catégories suivant leur superficie : i) les petits périmètres villageois (1ha à 10 ha), ii) les micro-périmètres irrigués ou MPI (10ha à 100ha), iii) les petits périmètres irrigués ou PPI (100ha à 1000 ha) et les Grands périmètres irrigués ou GPI (plus de 1000 ha) Les réseaux d’irrigation officiels et gérés par l’Etat étaient constitués par les GPI et les PPI.

80
Les périmètres anciennement gérés par le groupement de collectivité et de la brigade mobile du géni rural25 (PPI) subissait une détérioration croissante faute d’entretien. L’Etat n’avait plus les ressources pour la prise en charge de l’entretien de ces infrastructures alors que les usagers ont été depuis longtemps exemptés de la participation financière à leur entretien. Au début des années 80, la détérioration des PPI était généralisée. Les GPI n’allaient pas aussi mieux car la mauvaise gestion des sociétés d’aménagement comme la SOMALAC et SAMANGOKY, devenues des sociétés parapubliques chargées de la gestion et de l’entretien de ces périmètres, n’a pas permis de tenir les infrastructures hydroagricole en bon état. La requête de financement du gouvernement Malagasy auprès de la BM pour la réhabilitation de ces périmètres a été conditionnée par les mesures générales de désengagement de l’Etat des activités de production et de commercialisation dans le cadre du Programme d’Ajustement Structurel. Un projet de réhabilitation des petits périmètres irrigués première phase (PPI 1) a été mise en œuvre en 1985 pour une durée de 8 ans. Ce projet a comporté une composante d’appui de la SAMANKOGY pour la réhabilitation du GPI de Bas Mangoky. Le financement de cette composante a été suspendu en 1989 à cause des problèmes politiques. Ce projet a été financé conjointement par l’IDA représentée par la BM, la CCCE26, et le FED. Une approche nouvelle, au niveau du secteur irrigué à Madagascar, a été inaugurée par ce projet: l’auto administration et l’autofinancement de l’entretien des infrastructures hydroagricole par les usagers. Il fera l’objet d’une analyse plus approfondie dans l’étude de cas. Un autre projet d’irrigation au niveau des PPI a été mis en œuvre de 1988 jusqu’en 1994 sur financement BafD : « Projet d’Aménagement hydroagricole de la Tsiribihina phase I Manambolo Les micro-périmètres ont bénéficié du projet Micro-hydraulique financé par le FED de 1978 jusqu’en 1999. Ces périmètres sont toujours gérés et entretenus par les usagers. De conception et de construction traditionnelle, le projet micro-hydraulique a remplacé les ouvrages traditionnels en ouvrages en dur.
Troisième république ou période démocratique (1993 à présent) Après une lutte populaire pour l’instauration de la démocratie, le gouvernement a opté pour une économie libérale. Le désengagement de l’Etat du secteur productif a été renforcé. Ainsi, les sociétés parapubliques ont été dissoutes en 1994. Dans les actions de développement, l’importance de la participation des bénéficiaires et de l’approche décentralisée ont été insistées. Une déclaration de la politique du secteur irrigué a été établie par le Ministère d’Etat chargé de l’Agriculture et du Développement Rural (MEADR)27 en 1994. Tous les projets et actions 25 La brigade mobile du géni rural a été abolie en 1970. Les chefs de réseaux assuraient la gestion des infrastructures hydroagricoles. 26 CCCE ou Caisse centrale de coopération économique s’est transformée d’abord en CFD ou caisse française pour le développement puis en AFD ou Agence Française pour le développement 27 Ex-MPARA

81
en matière d’irrigation agricole ont été réalisés dans le cadre de cette première politique concernant le secteur irrigué Plusieurs projets d’irrigation agricole ont été lancés au cours de cette période :
Projet de réhabilitation des petits périmètres irrigués phase 2 ou PPI 2 (1994 à 2000) financé principalement par l’IDA
Projet de mise en valeur du Haut Bassin de Mandrare (PHBM) phase 1 (1996 à 2001) et
phase 2 (2002 à 2007) sur financement FIDA
Projet de protection contre les crues et l’ensablement (1997 à 2001) financé par l’AFD Projet de Réhabilitation du périmètre rizicole de Bas Mangoky (PRBM) (2000 à 2005)
financé principalement par le FAD et l’OPEP. L’Administration du fonds a été confiée à la BAD.
Programme d’Appui à la Sécurité Alimentaire (PASA) sur financement de la Commission
de l’Union Européenne (2000 à 2004)
Préparation du programme Bassin versant Périmètre irrigué avec l’appui financier de la BM
Projet Mise en valeur et protection de bassins versants au Lac Alaotra lancé en 2003 sur
financement de l’AFD.
82
SITUATIONS DU SOUS SECTEUR IRRIGUE
Importance et potentialité du sous secteur irrigué à Madagascar
En tant qu’aliment de base de la population malagasy, le riz constitue depuis toujours un produit stratégique du fait que la stabilité sociale et l’évolution de l’économie nationale repose sur la production rizicole. La surface rizicole représente depuis ces dix dernières années près de 50% de la superficie cultivée et 30% de la production agricole en volume est constitué par du paddy28. Selon l’étude de l’UPDR/FAO en 2001, la filière riz à Madagascar « contribue à hauteur de 12% au PIB en termes courants et de 43% au PIB agricole » Selon les chiffres officiels, plus de 80 % de la production de paddy proviennent des périmètres irrigués. La superficie irrigable s’élève à 1 200 000 ha soit 40% de la surface cultivable. Les petits périmètres villageois totalisent 500 000 ha environ. La superficie des MPI est estimée à 300 000 ha dans l’ensemble du pays tandis que les PPI, au nombre de 400 totalisent près de 200 000 ha. La superficie des GPI s’élève à 80 000 ha dans l’ensemble de Madagascar. En 1985, le réseau officiel d’irrigation (GPI et PPI) concerne 240 000ha seulement soit 20% de la surface irrigable29. La superficie totale irriguée par le réseau officiel est estimée à 213 000 ha en 1997 d’après l’annuaire de la statistique agricole de 1998.
Politiques du sous secteur irrigué
Cadre politique du sous secteur irrigué avant 1994
Les différents régimes qui se sont succédé à Madagascar ont marqué le développement du sous secteur irrigué. Jusqu’en 1994, les actions entreprises au niveau de ce secteur étaient basées sur la politique et la stratégie agricole mise en œuvre par les gouvernants. Pendant la période coloniale et la première république, les actions entreprises concernant l’irrigation agricole étaient destinées à appuyer la production au niveau des grandes exploitations coloniales (périmètres coloniaux) et à assurer une stabilité sociale en développant une riziculture en grande partie destinée à l’autoconsommation. Pendant la période socialiste, la politique agricole était axée sur l’édification d’une économie nationale indépendante où les rapports de production seraient transformés par une révolution technique. Le développement des GPI était renforcé à travers les sociétés parapubliques d’aménagement en donnant la priorité aux filières riz, sucre et coton. Il n’y a pas eu une stratégie bien claire et cohérente concernant le sous secteur irrigué. L’insuffisance de l’entretien des infrastructures et la mauvaise gestion des sociétés d’aménagement ont conduit à la détérioration généralisée des périmètres irrigués au début des années 80. 28 Statistique Agricole, Ministère de l’Agriculture. 29 Rapport d’évaluation pour le projet de réhabilitation des périmètres irrigués phase 1
83
L’intervention des bailleurs de fonds pour la réhabilitation des PPI était alors conditionnée par la politique de désengagement générale de l’Etat des activités de production. Le gouvernement avait prévu un désengagement progressif par la promulgation d’une loi30 relative à l’exploitation et à l’entretien des périmètres. Cette loi a fait l’objet de critiques de la part des bailleurs de fonds notamment la Banque Mondiale car elle a inclus une subvention de l’Etat et une participation à titre consultatif des usagers. Elle n’a pas donné un réel pouvoir aux collectivités et s’est caractérisée par une approche décentralisée au sein d’un pouvoir fortement centralisé.
Déclaration de politique pour le développement du sous secteur irrigué de 1994
Une première déclaration de politique pour le développement du sous-secteur irrigué a été établie par le MEADR en mai 1994. Cette politique faisait suite aux actions entreprises au cours du projet PPI 1 et au contexte politique et économique de l’époque. Au cours de la mise en œuvre du PPI 1, le principe adopté au niveau du sous secteur irrigué était le désengagement total de l’Etat de la gestion et de l’entretien des infrastructures réhabilitées. Ce principe s’est concrétisé par l’établissement d’une méthodologie de mise en place des Associations des Usagers de l’Eau (AUE) chargée de la gestion et de l’entretien des périmètres réhabilités et la sortie de la loi 90 016 du 20/04/9010 relative à la gestion, l’entretien et la police des réseaux hydroagricoles. Sur le plan politique, le mouvement populaire de 1991, aboutissant au changement de la constitution31, a institué la démocratie et la décentralisation dans la gestion des affaires de l’Etat. Sur le pan économique, plusieurs mesures ont été adoptées par le gouvernement : i) flottement des cours de change par rapport à une devise pivot et accès libre aux marchés de devises ; ii) Tarif douanier non discriminatoire entre les produits, y compris le riz ; iii) une ouverture de plus en plus importante au secteur privé (y compris les paysans) dans la gestion des affaires nationales ; iv) l’intégration de l’environnement dans une optique de développement durable (début du Programme Environnemental phase 1) Les axes principaux de la Déclaration de la politique pour le développement du secteur irrigué sont:
- la prise en compte des aspirations des usagers dans les actions de développement du sous-secteur irrigué
- la réduction des subventions de l’Etat à la gestion et entretien des infrastructures hydroagricoles et plus d’appuis à l’amélioration des autres infrastructures rurales et des services techniques facilitant l’intensification et la diversification agricole
- la prise en charge par les usagers de la gestion et de l’entretien des périmètres réhabilités,
- la prise en compte de l’aspect environnemental dans les schémas d’aménagement
- une meilleure rentabilité des investissements au niveau des bénéficiaires et de l’ensemble du périmètre
30 Ordonnance n° 81 026 et son décret d’application n° 81 353. 31 Après une grève générale de 8 mois en 1991, la constitution socialiste de la 2ème république a été dissoute et une nouvelle constitution (celle de la 3ème république) a été votée par référendum en 1992. Un nouveau régime a été installé en 1993

84
La stratégie de mise en œuvre de cette politique s’articule autour des points suivants :
- concertation entre les services publics et les usagers, notamment sur la programmation et la planification des projets d’aménagement et transfert de gestion des périmètres réhabilités à ces derniers
- une approche décentralisée et une meilleure coordination des services d’appui technique
- renforcement de la formation et de l’information à tous les niveaux Toujours en 1994, les sociétés parapubliques d’aménagement qui ont géré les grands périmètres irrigués ont été dissoutes sans que des mesures alternatives soient prises. La déclaration de politique du sous secteur irrigué ainsi que la loi relative à la gestion, l’entretien et la police des réseaux agricoles ne font pas la distinction entre les PPI et les GPI. Les approches initiées au niveau des PPI ont été alors appliquées au niveau des GPI. Pourtant, les GPI ont une dimension intercommunale. Le nombre d’usagers y est plus élevé ce qui va compliquer la mise en place et l’organisation des AUE.
Tout en reconnaissant le faible performance du sous secteur irrigué à cause entre autre du manque de diversification, des difficultés d’accès au facteur de production, du faible progrès dans le transfert de gérance et le manque d’entretien des infrastructures, la déclaration de politique pour le développement du sous secteur irrigué a entériné les différentes actions entreprises au cours du PPI1 et semblait être conçue en vu de la mise en œuvre du PPI 2. Elle a néanmoins le mérite de mettre en valeur l’importance du sous secteur irrigué pour le développement du secteur agricole et de bien définir les actions à mettre en œuvre pour assurer la pérennité des infrastructures hydroagricoles et réduire la contribution financière de l’Etat.
Résultats des projets de réhabilitation des périmètres irrigués
Méthodologies de la réhabilitation
Au cours du projet de réhabilitation des périmètres irrigués phase 1 (PPI 1), une méthodologie d’approche pour la réhabilitation des périmètres a été établie et a été appliquée dans les projets d’irrigation ultérieurs. Elle concerne en particulier :
- l’inventaire préliminaire des petits périmètres irrigués - la présélection des périmètres à réhabiliter - l’élaboration des termes de référence pour les études et travaux - la mise en place des Associations des Usagers de l’Eau
Cette méthodologie prévoit la participation des usagers dans les travaux de réhabilitation. L’efficacité de l’application de cette méthodologie est pourtant limitée par le faible considération de la capacité des usagers.

85
Réhabilitation physique
Au cours de ces 20 dernières années, les quelques résultats suivants peuvent être évoqués concernant la réhabilitation des périmètres irrigués:
1 971 projets de réhabilitation des MPI couvrant 106 688 ha ont été réalisé dans le cadre du projet Micro-hydraulique.
30 périmètres couvrant 16 670 ha ont fait l’objet de travaux de réhabilitation dans le cadre
du PPI 1
Dans le cadre du PPI 2, les travaux de réhabilitation ont porté sur 40 périmètres totalisant 45 346 ha. 20 périmètres d’une superficie totale de 24 255 ha ont été concernés par les travaux de réparation suite à des dégâts cycloniques et des travaux correctifs ont été apporté aux 8 périmètres d’une superficie totale de 3030 ha. Le FED a réhabilité au cours de ce projet 54 MPI couvrant 3010 ha dans la partie Nord de l’Île (Antsohihy, Befandriana, Mandritsara ou zone AMB)
Le projet d’Aménagement Hydroagricole de Tsiribihina a réhabilité 820 ha
31 MPI d’une superficie totale de 1 307 ha et 6 PPI couvrant 1 353 ha ont été réhabilité au
cours du PHBM phase 1. Ces différents projets ont permis la réhabilitation de 77 périmètres (PPI et quelques GPI32) totalisant 64 200 ha entre 1988 et 2001. Le système d’irrigation adopté dans ces projets est le système gravitaire. Selon les rapports des différentes missions d’évaluation rétrospective du sous secteur irrigué, la conception de la plupart des travaux de réhabilitation des infrastructures hydroagricoles est relativement adaptée à la situation du terrain notamment au niveau des PPI et MPI. Le coût moyen de ces réhabilitations est aussi peu élevé33 (1026 $US par ha en moyenne). Certains faiblesses sont constatées concernant la réhabilitation physique:
Les travaux de réhabilitation ne font que restaurer les périmètres irrigues aménagés pendant la période coloniale ou la première république et améliorer la maîtrise d’eau de façon globale. L’augmentation de nouvelle surface irriguée n’est pas significative.
La maîtrise d’eau au niveau des parcelles n’est pas toujours satisfaisante. Certaines
parcelles bénéficiant d’un bon approvisionnement en eau manque de l’eau après la réhabilitation
32 GPI touchés par les projets de réhabilitation des petits périmètres irrigués (PPI2). 33 Analyse du coût des investissements hydroagricoles à Madagascar réalisé en 2004

86
L’eau manque encore dans les parcelles se trouvant au bout des canaux
Le phénomène d’érosion dans les bassins versants ensable toujours les ouvrages
Le potentiel de conflits des eaux entre les usagers en amont et en aval du réseau persiste au niveau des périmètres réhabilités
Organisation des usagers et entretien des périmètres
Si le résultat des réhabilitations physiques est en général satisfaisant, l’organisation des usagers pour assurer la gestion et l’entretien des périmètres réhabilités est encore fragile. Dans la situation actuelle, sur 700 AUE recensés au niveau de l’Administration, 10% seulement ont officiellement bénéficié d’un transfert de gestion. Les informations relatives aux résultats de la politique de désengagement de l’Etat de la gestion et de l’entretien des périmètres réhabilités mettent en évidence la faiblesse du système de suivi et évaluation des projets et l’échec du transfert de gestion aux AUE. En effet, le nombre d’association créée ou formalisée et le taux de recouvrement des redevances qui traduit la fonctionnalité de l’Association, restent les seuls indicateurs existant. La viabilité de ces AUE à la fin du projet ne peut pas être appréciée de manière rationnelle compte tenu de l’absence d’indicateurs. Dans tous les cas, les différents bailleurs de fonds (Banque Mondiale, FIDA, USAID, AFD, Union Européenne) et le gouvernement, eu égard des évaluations réalisées en 2001-2002, ont reconnu unanimement la faiblesse de l’appropriation de la politique du secteur irrigué par les paysans34. Par conséquent, sans l’intervention du Ministère chargé de l’agriculture, le doute est permis quant à la pérennité des investissements hydroagricoles. Pourtant, le MAEP manque de moyens : matériel (déplacement), financier et humain (les conseillers animateurs qui ont appuyé les AUE étaient des Employés de Courte Durée sont déjà libérés par le Ministère)
Performance du sous secteur irrigué
La performance du sous secteur irrigué reste encore très faible malgré les différentes interventions et investissements pour assurer son développement.
- Le sous secteur irrigué n’arrive pas à assurer l’autosuffisance alimentaire de la population malgache en ce qui concerne la production rizicole. L’importation de riz a été estimée à 186 000 tonnes en 1999 soit 10% de la production35 (une augmentation de 238% par rapport au volume d’importation de 1998 et 1997). La production a presque stagné avec un taux de croissance annuelle de 1% de 1984 à 200236.
34 Introduction du guide d’intervention pour la mise en œuvre des projets (programme BV_PI) 35 sources :enquête UPDR/FAO sur la filière riz 36 Source : comparaison des statistiques agricoles. MEAP

87
- Le rendement de production au niveau national se situe toujours à 2%. Au niveau des périmètres irrigués, ce rendement ne dépasse pas la moyenne de 4%
- l’intensification et la diversification culturale reste faible et se concentrent au
niveau de quelques zones du haut plateau (exemple vakinakaratra pour la culture maraîchère, blé ou orge en contre saison)
En dépit de ces résultats mitigés, la pertinence des projets de réhabilitation n’est pas discutable sur le long terme. Avec un taux de croissance annuelle de la population de 2.8%, la sécurité alimentaire ne peut pas être assurée sans infrastructures hydroagricoles fonctionnelles. Avec une importation de 300 000 tonnes de riz au début des années 80, la situation sans projet serait encore catastrophique pour l’économie nationale.

88
DIFFERENTES APPROCHES DANS LE PROCESSUS DE PLANIFICATION ET DE MISE EN ŒUVRE DES PROJETS D’IRRIGATION
La planification et la mise en oeuvre des projets, bénéficiant du financement des bailleurs de fonds, à Madagascar ont été entreprises suivant le cycle de projet avec ses 6 phases: identification, préparation, instruction ou évaluation, négociation et approbation, exécution et supervision, évaluation ex-post. La planification concerne les phases de préparation, d’évaluation et de négociation après identification du projet. La description qui va suivre essaye de mettre en évidence les différences entre les pratiques des bailleurs de fonds au niveau de chaque phase. Elle s’est basée sur les documents disponibles sur place et les entretiens effectués auprès des responsables des projets.
Cycle du projet
Identification
Depuis ces 20 dernières années, trois approches sont constatées pour l’identification des projets.
- Les bailleurs identifient les projets à partir de leur intervention antérieure et les proposent au gouvernement malagasy. Ce dernier, après avoir discuté le projet, établit une requête de financement pour une mission de préparation, la mission d’identification n’étant plus nécessaire. C’est le cas le plus fréquent avec l’AFD et le FED. Cette approche présente un grand avantage en terme de célérité dans la réalisation des projets. Par contre, la partie Malagasy ne s’approprie pas du projet.
- Le gouvernement Malagasy identifie le projet et fait une requête de
financement aux bailleurs de Fonds pour que ce dernier entreprenne la réalisation de la mission d’identification. C’est l’approche fréquemment rencontrée avec la Banque Mondiale, la BafD et le FIDA. Dans cette approche, la phase d’identification prend toujours plusieurs années (3 à 4 ans). Par contre, l’appropriation du projet par le gouvernement est plus poussée.
- Les bailleurs et le gouvernement identifient ensemble le projet suite à des
recommandations émanant de l’évaluation des projets achevés. Ce dernier cas est rencontré le plus souvent pour les projets à plusieurs phases. Cette approche ne prend pas du temps et facilite l’appropriation du projet par les bénéficiaires du financement. L’inconvénient de ce type d’identification réside dans les difficultés entraînées par l’incapacité à s’adapter à une nouvelle orientation et le risque de la persistance des mauvaises pratiques acquises au cours de la phase précédente.
L’identification d’un projet d’irrigation ou d’autres projets répond à la fois aux stratégies des bailleurs de fonds et à la politique sectorielle du gouvernement. Pour les projets financés par
89
le FED, par exemple, l’identification des projets se fait dans le cadre du PIN37 et suivant la stratégie d’intervention de l’Union Européenne dans le Pays. A Madagascar, cette stratégie est la concentration sectorielle (Développement rural et infrastructure routière) et géographique (Partie sud du Pays). L’intervention de l’AFD est aussi marquée par une préférence géographique : le Lac Alaotra, le Vakinakaratra et le Sud Est.
Préparation
La préparation des projets est toujours dirigée par les bailleurs de fonds. A Madagascar, le Centre d’Investissement de la FAO a toujours réalisé la préparation des projets d’irrigation financés par la BafD, la BM et le FIDA. Pour l’AFD et le FED, la préparation des projets d’irrigation agricole fait l’objet d’une d’offre internationale lancée par ces bailleurs. Les Termes de référence de ces études sont conçus et préparés par les bailleurs de fonds ; le Gouvernement ne fait qu’émettre un avis. L’approche est différente selon la période et les bailleurs de Fonds. La préparation du PPI 1 (1982) et PPI 2 (1993) dirigée principalement par la BM n’incluait pas les usagers ou leurs représentants dans sa démarche. L’équipe de consultants était tous des expatriés. La démarche dans la préparation du PRBM (1997-1998) financé par la BafD et du PHBM (1996) sur financement FIDA a été marquée par la participation des bénéficiaires. Cette participation a été du moins exprimée par l’entretien et discussion entre les consultants et les usagers et/ou leurs représentants, les techniciens locaux, les opérateurs et tous ceux qui sont concernés par la mise en œuvre du projet. Par ailleurs, la différence dans la préparation des projets d’irrigation se trouve dans le fait que les projets financés par le FIDA et la BafD (PHBM, PRBM, Projet d’Aménagement Hydroagricole de la Tsiribihina) sont limités géographiquement tandis que les projets PPI sur financement BM, FED et AFD ont été préparé pour avoir une dimension nationale.
Instruction ou évaluation
Cette phase reste toujours sous la responsabilité des bailleurs de fonds. Le document produit qui se base sur le rapport de préparation est confidentiel et fait l’objet d’une diffusion restreinte et sous autorisation. Le rapport issu de l’instruction comporte, en plus des caractéristiques techniques, institutionnelle, économique et financière du projet, les conditions des bailleurs de fonds pour sa mise en oeuvre. Ces conditions sont à négocier avec le gouvernement bénéficiaire avant que le dossier soit transmis à l’autorité décideur au niveau de l’institution. Les conditions posées par les bailleurs sont le plus souvent de deux natures : la première est des conditions suspensives du premier décaissement ou conditions préalables au déblocage de fonds, et la seconde est relative aux engagements du bénéficiaire du financement pendant la mise en œuvre du projet. Les discussions et négociations entamées entre les bailleurs et le gouvernement au cours de cette phase porte sur la responsabilité des deux parties en ce qui concerne l’exécution et la gestion technique et financière du projet. L’attribution du pouvoir sur le contrôle du projet
37 Pour pouvoir bénéficier du financement de la communauté européenne dans le cadre des accords de Lomé entre l’Union européenne et les Etats Afrique Caraïbe Pacifique(ACP), ces derniers sont tenus à présenter chacun un Programme indicatif national ou PIN pour une durée de 5 ans

90
étant l’enjeu principal. Ce genre de négociation est très limité pour le financement du FED car les sujets de discussion sont presque inclus dans les procédures : « Convention de Lomé », « Journal officiel des communautés européennes », « modalité de gestion comptable et financière », « Guide pratique des devis programmes de développement rural et gestion de leur régies administratives », etc. Contrairement aux autres bailleurs ( FED, l’AFD, et BM), la BafD et le FIDA adoptent une approche participative dans l’instruction des projets d’irrigation. C’est par exemple le cas de l’instruction du PHBM phase 2 et du PRBM. Dans ces deux projets, des confirmations sur terrain ont été effectuées au cours de cette phase.
Négociation
La négociation qui va aboutir à une convention de financement ou accord de prêt ou accord de crédit se déroule le plus souvent au siège de la BM ou de la BafD ou du FIDA pour ces Bailleurs de Fonds après une invitation à négocier. La négociation se fait sur place pour les projets financés par l’Union Européenne (FED) et l’AFD. Un des points de négociation est la contribution du gouvernement dans le financement du projet. A Madagascar, cette contribution se rapporte le plus souvent aux droits et taxes diverses qui doivent être versés à l’Etat au cours de la mise en œuvre du projet. Très souvent, le gouvernement accepte les conditions de prêt proposé par les bailleurs car à Madagascar, près de 80% du budget d’investissement de l’Etat proviennent des financements extérieurs. La convention de financement ou accord de prêt ou accord de crédit doit être ratifié par l’Assemblé Nationale et inséré par la suite au Programme d’Investissement Public (PIP) avant sa mise en vigueur.
Mise en œuvre et supervision
Deux approches différentes sont bien marquées dans la mise en œuvre des projets d’irrigation à Madagascar :
- Pour les projets PPI financés principalement par la BM, AFD et FED, et PASA sur financement FED, l’exécution a été confiée aux structures existantes de l’Administration. Cette approche a l’avantage de renforcer les structures administratives existantes en charge du développement du secteur irrigué pour mieux assurer la pérennisation des acquis du projet. Par contre ces structures très lourdes, rigide et caractérisées par un système hiérarchique très fort et centralisé et un manque de collaboration horizontale compromet l’efficacité du projet. Les agents de l’Administration, habitués à diriger et à se positionner au-dessus des exploitants agricoles s’adaptent mal à une approche participative. Par ailleurs, l’Administration est à la fois chargée de l’exécution des objectifs opérationnels (Objectif spécifique), de l’orientation du projet par rapport à l’objectif stratégique (Objectif global) et de la supervision et du contrôle des activités. En d’autre, il est à la fois juge et parti dans la réalisation du projet. La
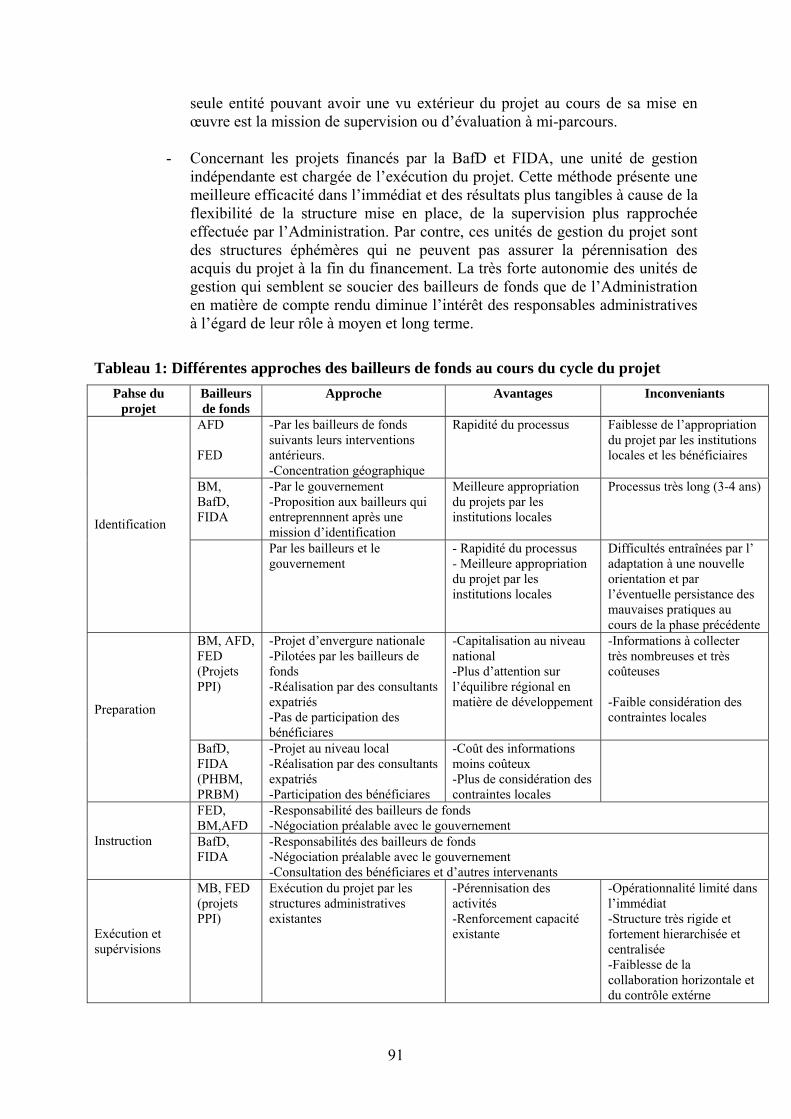
91
seule entité pouvant avoir une vu extérieur du projet au cours de sa mise en œuvre est la mission de supervision ou d’évaluation à mi-parcours.
- Concernant les projets financés par la BafD et FIDA, une unité de gestion
indépendante est chargée de l’exécution du projet. Cette méthode présente une meilleure efficacité dans l’immédiat et des résultats plus tangibles à cause de la flexibilité de la structure mise en place, de la supervision plus rapprochée effectuée par l’Administration. Par contre, ces unités de gestion du projet sont des structures éphémères qui ne peuvent pas assurer la pérennisation des acquis du projet à la fin du financement. La très forte autonomie des unités de gestion qui semblent se soucier des bailleurs de fonds que de l’Administration en matière de compte rendu diminue l’intérêt des responsables administratives à l’égard de leur rôle à moyen et long terme.
Tableau 1: Différentes approches des bailleurs de fonds au cours du cycle du projet Pahse du
projet Bailleurs de fonds
Approche Avantages Inconveniants
AFD FED
-Par les bailleurs de fonds suivants leurs interventions antérieurs. -Concentration géographique
Rapidité du processus Faiblesse de l’appropriation du projet par les institutions locales et les bénéficiaires
BM, BafD, FIDA
-Par le gouvernement -Proposition aux bailleurs qui entreprennnent après une mission d’identification
Meilleure appropriation du projets par les institutions locales
Processus très long (3-4 ans)
Identification
Par les bailleurs et le gouvernement
- Rapidité du processus - Meilleure appropriation du projet par les institutions locales
Difficultés entraînées par l’ adaptation à une nouvelle orientation et par l’éventuelle persistance des mauvaises pratiques au cours de la phase précédente
BM, AFD, FED (Projets PPI)
-Projet d’envergure nationale -Pilotées par les bailleurs de fonds -Réalisation par des consultants expatriés -Pas de participation des bénéficiares
-Capitalisation au niveau national -Plus d’attention sur l’équilibre régional en matière de développement
-Informations à collecter très nombreuses et très coûteuses -Faible considération des contraintes locales
Preparation
BafD, FIDA (PHBM, PRBM)
-Projet au niveau local -Réalisation par des consultants expatriés -Participation des bénéficiares
-Coût des informations moins coûteux -Plus de considération des contraintes locales
FED, BM,AFD
-Responsabilité des bailleurs de fonds -Négociation préalable avec le gouvernement
Instruction BafD, FIDA
-Responsabilités des bailleurs de fonds -Négociation préalable avec le gouvernement -Consultation des bénéficiares et d’autres intervenants
Exécution et supérvisions
MB, FED (projets PPI)
Exécution du projet par les structures administratives existantes
-Pérennisation des activités -Renforcement capacité existante
-Opérationnalité limité dans l’immédiat -Structure très rigide et fortement hierarchisée et centralisée -Faiblesse de la collaboration horizontale et du contrôle extérne
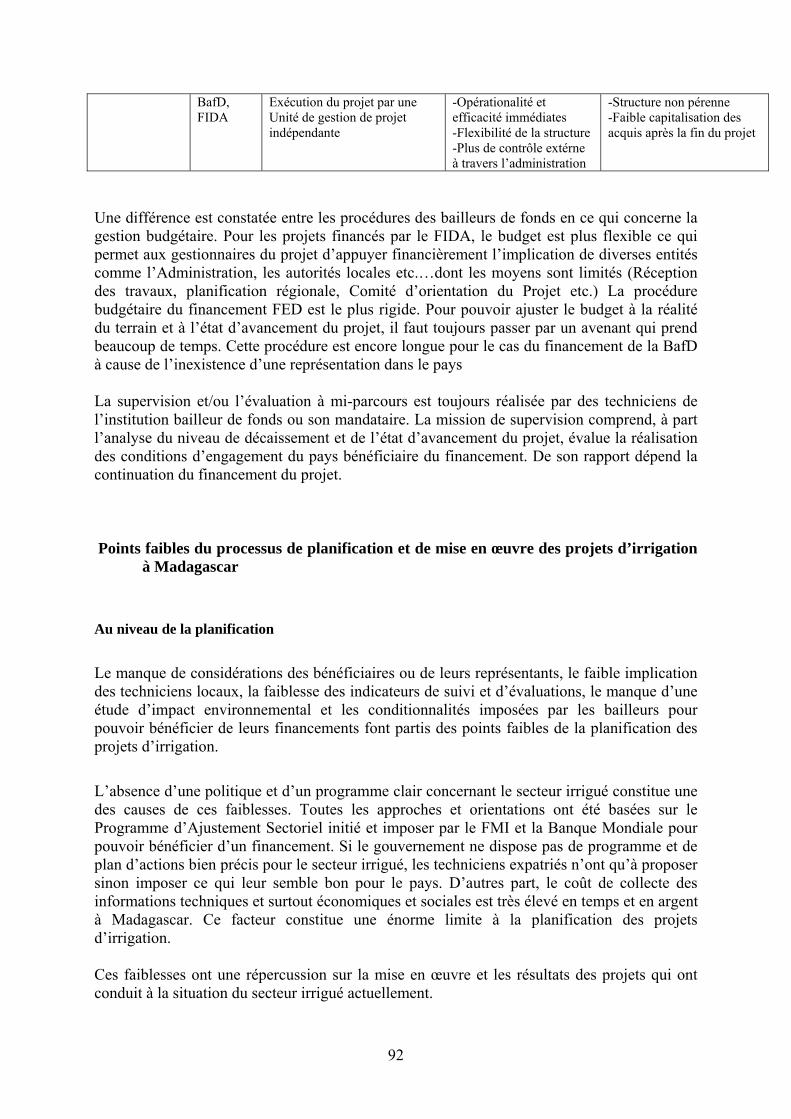
92
BafD, FIDA
Exécution du projet par une Unité de gestion de projet indépendante
-Opérationalité et efficacité immédiates -Flexibilité de la structure -Plus de contrôle extérne à travers l’administration
-Structure non pérenne -Faible capitalisation des acquis après la fin du projet
Une différence est constatée entre les procédures des bailleurs de fonds en ce qui concerne la gestion budgétaire. Pour les projets financés par le FIDA, le budget est plus flexible ce qui permet aux gestionnaires du projet d’appuyer financièrement l’implication de diverses entités comme l’Administration, les autorités locales etc.…dont les moyens sont limités (Réception des travaux, planification régionale, Comité d’orientation du Projet etc.) La procédure budgétaire du financement FED est le plus rigide. Pour pouvoir ajuster le budget à la réalité du terrain et à l’état d’avancement du projet, il faut toujours passer par un avenant qui prend beaucoup de temps. Cette procédure est encore longue pour le cas du financement de la BafD à cause de l’inexistence d’une représentation dans le pays La supervision et/ou l’évaluation à mi-parcours est toujours réalisée par des techniciens de l’institution bailleur de fonds ou son mandataire. La mission de supervision comprend, à part l’analyse du niveau de décaissement et de l’état d’avancement du projet, évalue la réalisation des conditions d’engagement du pays bénéficiaire du financement. De son rapport dépend la continuation du financement du projet.
Points faibles du processus de planification et de mise en œuvre des projets d’irrigation à Madagascar
Au niveau de la planification
Le manque de considérations des bénéficiaires ou de leurs représentants, le faible implication des techniciens locaux, la faiblesse des indicateurs de suivi et d’évaluations, le manque d’une étude d’impact environnemental et les conditionnalités imposées par les bailleurs pour pouvoir bénéficier de leurs financements font partis des points faibles de la planification des projets d’irrigation.
L’absence d’une politique et d’un programme clair concernant le secteur irrigué constitue une des causes de ces faiblesses. Toutes les approches et orientations ont été basées sur le Programme d’Ajustement Sectoriel initié et imposer par le FMI et la Banque Mondiale pour pouvoir bénéficier d’un financement. Si le gouvernement ne dispose pas de programme et de plan d’actions bien précis pour le secteur irrigué, les techniciens expatriés n’ont qu’à proposer sinon imposer ce qui leur semble bon pour le pays. D’autres part, le coût de collecte des informations techniques et surtout économiques et sociales est très élevé en temps et en argent à Madagascar. Ce facteur constitue une énorme limite à la planification des projets d’irrigation. Ces faiblesses ont une répercussion sur la mise en œuvre et les résultats des projets qui ont conduit à la situation du secteur irrigué actuellement.

93
Au niveau de la mise en oeuvre
Une des difficultés dans la mise en œuvre des projets, au début, est le décalage de temps entre l’approbation par l’instance autorisée des bailleurs de fonds et la ratification de la convention de financement par l’Assemblé Nationale. Si l’approbation des bailleurs de fonds ne coïncide pas avec les sessions parlementaires, la mise en œuvre du projet est retardée car la procédure nécessaire pour mobiliser des fonds représentant la contribution du Gouvernement est complexe et très long sans une inscription budgétaire. Un des points faibles de tous les projets d’irrigation est le système de suivi et évaluation. L’insuffisance des indicateurs, notamment économique, permettant de mesurer l’efficacité et l’efficience des actions a contribué au résultat mitigé du sous secteur irrigué. D’une part, la négligence de l’importance du suivi évaluation diminue la pertinence du projet, d’autre part, le critère de performance basé sur le taux de décaissement exigé par les bailleurs crée une distorsion au niveau de la réalisation des objectifs. Le résultat en est la multiplication des réhabilitations physiques qui permet d’augmenter le taux de décaissement, sans que l’objectif de renforcement des compétences locales pour la gestion et l’entretien soit atteint.
Le faible circulation des informations et l’insuffisance de la motivation des agents de l’Etat travaillant dans les projets d’irrigation affaiblissent la productivité du personnel exécutant les actions dans les projets exécutés par la structure administrative existante. L’insuffisance de l’implication des bénéficiaires et des responsables administratifs au niveau des zones de réhabilitation et l’action très faible en matière de protection de l’environnement, notamment les bassins versant, diminue la pertinence et l’efficacité des projets d’irrigation.
Chaque bailleur de fonds a leur manière d’établir les cahiers des charges et les termes de référence pour les études et les travaux. Ce fait complique la gestion du projet et rend difficile la comparaison et l’addition des résultats des activités financées par ces bailleurs.

94
Tableau 2 : Synthèse des faiblesses de la planification et de la mise en œuvre des projets d’irrigation à Madagascar
Phase du cycle de projet
Faiblesse Causes Conséquences Acteurs
- Faible considération des souhaits et besoins des producteurs et des techniciens et responsables administratifs locaux (au niveau des régions)
-Absence ou insuffisance de référence de projets similaires (cas PPI 1)
-Objectifs trop ambitieux
- Imposition par les bailleurs de fonds du désengagement de l’état
-Absence de politique du secteur irrigué adaptée à la réalité sur terrain -Application
-Changement brusque de l’ordre social au niveau du secteur
Identification
- Approche très sectorielle
-Forte focalisation des projets sur la problématique de la production rizicole
-Faiblesse de la performance du secteur irrigué
-Bailleur de fonds -Gouvernement
-Absence ou insuffisance de l’implication des techniciens nationaux
-Confiance aux consultants expatriés qui apporte une vision extérieure
-Objectifs non cohérents -Changement des composantes du projet au cours de sa mise en oeuvre
Manque de participation ou faible participation des bénéficiaires
-Temps très limités des consultants -Niveau d’éducation très faible des bénéficiaires
-Faible appropriation du projet par les bénéficiaires
-Analyse économique non pertinente (prépondérance de l’analyse macroéconomique ou microéconomique)
-Faiblesse des informations économiques disponibles -Coût élevé des informations à caractères économiques
-Difficulté d’apprécier l’impact économique du projet
Préparation
et
instruction
Insuffisance voire absence des indicateurs de suivi et d’évaluation des projets
-Faible insistance sur les indicateurs de suivi et d’évaluation
-Faiblesse du système de suivi et évaluation lors de la mise en œuvre
-Centre d’Investissement de la FAO -Consultants expatriés -Responsable sectoriel au niveau des bailleurs de fonds
Négociation
-Disponibilité de la contribution du gouvernement au projet -Dépendance du budget d’investissement public aux financements extérieurs.
-Insuffisance des ressources de l’Etat -Décalage entre l’approbation des bailleurs de fonds du financement et la session parlementaire pour l’insertion au PIP
-Retard dans la mise en œuvre du projet -Position faible par rapport aux bailleurs de fonds
-MAEP -Ministère des finances -Bailleurs de fonds
-Influence des personnalités politique auprès des responsables de l’exécution du projet et des usagers
-Propagande électorale
-Réhabilitation des périmètres non prioritaires -Incitation des usagers à ne pas cotiser pour les travaux d’entretien
-Faible circulation des informations tant au niveau des staffs de l’organe exécutif que des usagers -Faible participation des bénéficiaires dans la conception et la réalisation des travaux
-Style managerial du responsable du projet -Communication inadéquate entre les techniciens et les usagers -Temps limité pour la conception des travaux
-Faible appropriation des usagers du système à mettre en place pour la gestion des périmètres réhabilités
Mise en œuvre
-Faible motivation du personnel exécutif
-Harmonisation du traitement des agents de l’Etat
-Retard dans la réalisation des objectifs -Pérennisation non assurée des acquis du projet -Faible productivité du personnel exécutif
-Système de suivi et d’évaluation peu considéré en tant qu’outil de gestion
-Insuffisance de compétence locale en matière de suivi et évaluation de projet -Recherche de performance en matière de décaissement du crédit
- Pertinence faible -Efficacité et efficience du projet très faible
Action très faible concernant la protection de l’environnement
-Cloisonnement du secteur de développement rural et de l’environnement
-Infrastructures agricoles toujours menacées par l’ensablement
- Unité de gestion du projet - Assistants techniques expatriés - Responsable MAEP - Bailleurs de fonds - Responsable Ministère des Finances - Entreprise de construction - Bureau d’étude
Différents points de vue sur le secteur irrigué
Point de vu des acteurs locaux
- Le critère de portefeuille du pays au niveau des Bailleurs de fonds (taux de
décaissement des projets financé par les institutions bancaires internationales: BM et BafD) limite la conception et la planification des projets de développement du secteur irrigué en terme de financement. Le faible performance de Madagascar en matière d’absorption de crédit est toujours pris en compte au niveau des bailleurs dans l’identification, la préparation et la négociation des projets. Pourtant, le faible taux de décaissement des projets antérieurs relève de la façon dont la planification et la mise en œuvre de ces projets ont été faites. Les documents de projets, (rapport d’évaluation du projet, accord de prêt) et les procédures deviennent contraignantes dans la mise en œuvre des projets par rapport à la réalité sur le terrain. Le lancement systématique d’un appel d’offre international pour la réalisation des travaux, par exemple, prend beaucoup de temps. Pourtant les soumissionnaires sont toujours des entreprises locales.
- La pertinence des projets sectoriels (exemple PPI 1 et 2) est toujours moindre par
rapport à un projet intégré ( PHBM et PRBM). Le gouvernement doit s’impliquer d’avantage dans la préparation des projets intégrés et d’exiger aux bailleurs de fonds le financement nécessaire sans tenir compte des taux de décaissement des projets antérieurs.
- Le cloisonnement sectoriel dans la conception et mise en œuvre des projets ont
diminué l’impact des projets sur le développement par l’insuffisance de la synergie des actions. En tant qu’autorité chargée de contrôle, le Ministère technique (MAEP) et le Ministère des finances manquent de moyen et surtout d’information sur les projets exécutés par une unité de gestion autonome. L’Administration en particulier la Direction d’Appui aux Investissements Ruraux (DAIR : ex Direction du Géni rural) du MAEP entend jouer actuellement un rôle important dans la conception, le suivi et la supervision des projets de développement rural en général et des projets d’irrigation agricole en particulier. L’identification des projets se fait en fonction des priorités du MAEP qui privilégie une approche intégrée. Dans cette approche, tous les départements ministériels concernés par la branche touchée par le projet sont informés pour assurer la cohérence des actions de développement. Une amélioration de la circulation des informations et un renforcement des actions de supervision sont entreprises par les responsables de la DAIR actuelle avec les responsables des projets en cours.
- La dimension spatiale est importante en matière de planification et de gestion des
projets. L’efficacité et la pertinence diminuent quand la conception et la gestion se font au niveau national. Chaque région a leur spécificité. Une approche homogène est difficilement applicable pour obtenir un meilleur résultat au niveau régional.
101
- Les procédures des bailleurs de fonds dans la mise en œuvre des projets sont parfois contraignantes mais ne constituent nullement un facteur limitant au bon déroulement du projet si chacun assume bien leur responsabilité avec les moyens qu’il faut. Dans tous les cas, tous dépendent de la capacité manageriale du responsable du projet.
- La durée de l’appui aux AUE, pour qu’elles puissent prendre en charge la gestion et
l’entretien des périmètres, est largement insuffisante. L’exemple de la réussite de telles Associations dans le Grand Périmètre Irrigué de la Vallée Marianina (PC 15 Lac Alaotra) peut s’expliquer par un appui soutenu de l’AFD depuis 1982 jusqu’à présent (2004). Le retrait de l’AFD sera enrichissant en terme d’expérience pour la prise en charge de la gestion et l’entretien des Grands Périmètres Irrigués.
- L’exécution des projets par la structure administrative existante présente ces limites.
Les fonctionnaires chargés de l’exécution des projets sont moins motivés et frustrés par rapport aux avantages matériels des assistants techniques. Cette situation provient pourtant du gouvernement Malagasy qui ne veut pas avantager un fonctionnaire par rapport à un autre. Ce faible motivation du personnel local diminue leur productivité et favorise la prépondérance des assistants techniques dans la mise en œuvre du projet. Les assistants techniques accordent, en outre, peu de considération aux techniciens malagasy.
- La coordination des projets d’irrigation est difficile à cause de la prépondérance de la
Banque Mondiale qui a financé la Cellule de Coordination nationale des Projets de réhabilitation des petits périmètres irrigués. Des tensions existent entre les bailleurs à cause de la différence des approches.
- En général du point de vu des acteurs locaux, la phase de planification et la phase de
mise en œuvre sont toutes importantes pour l’efficacité d’un projet de développement. Cependant, la phase de mise en œuvre revêt plus d’importance du fait que malgré les bonnes approches dans la préparation et l’instruction du projet ou les contraintes dues à l’imperfection de la planification, les résultats dépendent de la capacité de la structure d’exécution à s’y adapter.
Point de vu des bailleurs
- Les bailleurs de fonds ne font que ce que le gouvernement souhaite réaliser pour le
développement du pays. Il faut cependant que le gouvernement sache ce qu’il veut faire et avance une proposition concrète et claire suivant une politique et un programme bien définis. Les actions des bailleurs de fonds sont faites toujours en concertation avec le gouvernement dans la planification des projets de développement.
- Concernant l’exécution des projets, la corruption au niveau des responsables
nationaux, notamment sur l’attribution des marchés, est une des causes de la mauvaise performance du secteur. Les mesures de contrôle et les procédures de déblocage de fonds établies par les bailleurs de fonds permettent de prévenir les abus divers tout en assurant la conformité avec les différents documents du projet (documents contractuels) et l’efficacité des actions.

102
- Il manque de techniciens de haut niveau capables de s’insérer dans le milieu rural.
Ces techniciens sont pour la plupart formés loin du milieu rural ce qui ne leurs permettent pas de comprendre les besoins réelles des bénéficiaires des projets.
- Les bailleurs de fonds accordent plus d’importance sur la phase d’identification.
L’accord de financement dépend de la présentation d’un dossier de planification bien élaboré. Il n’est pas rationnel d’exécuter un projet mal préparé.
103
EVOLUTION DU PROCESSUS DE PLANIFICATION ET DE MISE EN ŒUVRE DES PROJETS D’IRRIGATION
Contexte Depuis 2000, des programmes et plans d’action ont été élaborés par le gouvernement pour relancer le développement rural à Madagascar et lutter contre la pauvreté :
- « Plan d’Action pour le Développement rural » (PADR ; 2001) - « Lettre de Politique de Développement rurale » (LPDR ; 2001) - « Document de stratégie de réduction de la pauvreté » (DSRP ;2003) - « Plan directeur quinquennal pour le Développement rural » de 2004 à 2009 (Master
Plan du MAEP 2004) - « Business Plan du MAEP » (2004)
Ces instruments, établis avec l’appui des bailleurs de fonds, cadrent la planification et la mise en œuvre des projets de développement dans le milieu rural. L’élaboration et la mise en œuvre de ces différents outils pour le développement rural à Madagascar repose sur le principe de la participation et de la décentralisation
Mise à jours de la politique du sous secteur irrigué La déclaration de politique pour le développement du sous secteur irrigué dénommé actuellement « Lettre de politique d’irrigation-94 » fait l’objet d’une mise à jour depuis avril 2004. L’objectif de cette mise à jour consiste à fournir une vision plus claire des objectifs poursuivis par le gouvernement dans le secteur de l’irrigation et des moyens à mettre en œuvre face à l’évolution des institutions et des approches et instruments utilisés dans le cadre du développement rural La mise à jours devient nécessaire pour intégrer le changement de la stratégie du MAEP avec la création en 2003 du Fonds d’entretien des réseaux hydroagricoles (FERHA) destiné aux ouvrages non transférés ou non transférables aux usagers, l’intégration géographique (Bassin versant) et sectorielle (plate forme riz…), l’établissement d’une nouvelle typologie des périmètres irrigués. Avec l’appui d’un assistant technique expatrié de la FAO la nouvelle « Lettre de Politique d’Irrigation » sera issue d’un processus participatif et de concertation auquel sont intégrés, à travers l’organisation des ateliers régionaux, les responsables du MAEP, du Ministère des Eaux et Forêts, Ministère des finances et du budget, les représentants des autorités provinciales et communales, les représentants des AUE et des organismes d’appui sur les grands périmètres, les ONG, les partenaires techniques et financiers et les personnes ressources. Une proposition de « Lettre de Politique d’Irrigation » sera présentée à l’Equipe Permanent de Pilotage38 (EPP) qui procédera à son approbation officielle à la fin du mois de septembre 2004.
38 l’EPP, présidée par un représentant du Premier ministre et composée par des Secrétaires Généraux de Ministères et de hauts responsables privés et publics choisis en raison de leurs compétences particulières, est chargée d’assurer la mise en œuvre du PADR
104
Identification, préparation et instruction des projets d’irrigation
Approche intégrée pour le développement du sous secteur irrigation
Les projets concernant l’irrigation agricole identifiés et préparés à la fin des années 90 et au début des années 2000 sont des projets intégrés. Ils incluent à la fois la réhabilitation des infrastructures agricoles, le crédit rural, le développement de l’agriculture, la réhabilitation des routes etc. Ces projets intégrés ont été identifiés par le gouvernement avec la collaboration des bailleurs de fonds.
Implication des usagers dans la conception et formulation du projet
La participation des usagers et des personnes et entités pouvant être concernée par le projet est plus insistée dans la planification des projets touchant l’irrigation agricole. Bien que cette participation ait un caractère consultatif, l’avis de tous les intervenants et les personnes et entités concernées ont été tenu en compte dans la préparation et l’instruction du projet.
Harmonisation des interventions
L’intervention dans le secteur irrigué est harmonisée pour augmenter la chance de succès des interventions sur les périmètres irrigués en définissant les rôles de chaque acteur respectif, par la conception des catégories d’intervention et l’organisation des interaction entre acteurs et en pérennisant les actions au niveau des périmètre irrigué tout en protégeant les ressources des bassins versant. Cette harmonisation des interventions dans le secteur irrigué a été marquée par l’élaboration suivant une approche participatif d’un « Guide d’intervention pour la mise en œuvre des projets dans le cadre du programme de développement des périmètres irrigué et bassin versant » L’élaboration de ce guide a vu la participation des bailleurs de fonds et du gouvernement.
Coordination des interventions des bailleurs de fonds
Une fois que la politique du secteur irrigué et le programme national sont établis, chaque bailleur de fonds peut faire leur choix sur les projets qu’il va appuyer et financé. Les interventions de ces différents bailleurs sont coordonnées au niveau du Secrétariat Multi-Bailleurs (SMB) dont le siège se trouve dans le local de la Banque Mondiale. Le SMB reçoit la proposition de projets du gouvernement (la partie Malagasy) et la présente à l’ensemble des bailleurs de fonds. Le SMB a été initié et mis en place pour l’exécution du
105
Programme Environnemental phase 2 en 1999. Il constitue actuellement une interface entre la partie malagasy et les bailleurs de fonds concernant le développement rural, l’environnement et la sécurité alimentaire.
Préparation du programme Bassin Versant – Périmètres irrigués
Un comité ad hoc appelé « Task Force BV PI » regroupant des fonctionnaires et représentants du Gouvernement d’une part et d’autres part les représentants des partenaires techniques et financiers (Centre de recherches, bailleurs de fonds, FAO, etc.) a été mis en place par le MAEP pour préparer le « Programme National Bassin Versant – Périmètres Irrigués ». La « Task Force » est une plate forme de discussion, de validation et de décision. Elle décidera sur les points suivants :
- choix des zones d’intervention - budget requis pour le PPF - programme de travail dans la mise en œuvre du programme BV-PI - approbation des TDR pour les consultants - diagnostic de la situation actuelle - suivi/évaluation - composante et estimation préliminaire des coûts de la mise en œuvre du BV-PI - analyse économique et financière - étude d’impact sur l’environnement - étude sur la protection de l’environnement - modalités de mise en œuvre du projet - organisation et gestion du projet - assistance à fournir aux missions de préparation et d’évaluation
Avant, toutes ces tâches relèvent principalement de l’attribution des bailleurs de fonds.
106
ETUDE DE CAS
Projet de réhabilitation des périmètres irrigué Phase 1
Description du projet
Le Projet de réhabilitation des Petits périmètres irrigués phase 1 (PPI1) a été exécuté de 1985 à 1993 après une demande du gouvernement Malagasy d’une prolongation de trois ans. Financé principalement par l’IDA (International Development Association) dont le fonds a été géré par la Banque Mondiale, la Commission de l’Union Européenne à travers le FED (Fonds Européen pour le développement) et l’AFD39 (Agence Française pour le Développement), le PPI 1 a comme objectif la mise en place d’une méthode systématique de réhabilitation de 116 périmètres d’irrigation et la création de nouvelles structures d’auto administration ainsi que l’aide aux agriculteurs à auto-financer l’entretien des périmètres réhabilités. Le montant total du financement était de 38 million de $US. Le projet s’est proposé le renforcement des institutions existantes pour sélectionner les périmètres d’irrigation à réhabiliter et de réhabiliter 16 périmètres couvrant environ 17 000 ha Il a été attendu de ce projet une augmentation de la production de riz de 32 000 tonnes par an, une diminution de l’importation de cette céréale et un relèvement du revenu d’un groupe représentant plus de 2% de la population agricole. L’exécution du projet a été confiée aux quatre directions du MPARA40 : Direction de l’Infrastructure Rurale, Direction de la Vulgarisation Agricole, Direction de la Programmation et la Direction des Finances et du Personnel. Un Coordinateur National nommé par le MPARA avec l’accord de la Banque Mondiale a fait office de Directeur général du projet et a été chargé de la planification, de la coordination et de la gestion d’ensemble du projet. Un comité de coordination ad hoc présidé par le Secrétaire Général du MPARA et composé des quatre Directeurs concernés ainsi que des directeurs des Départements de l’Elevage et des Eaux et Forêts a pour rôle d’approuver les programmes de travail, les études, les documents d’appel d’offre et l’attribution des marchés de travaux. Les chefs de service provincial de l’infrastructure rural ou les directeurs des opérations de développement41 ont assuré la coordination du projet au niveau des zones d’intervention.
Identification
L’identification du projet a été initiée dans le cadre de la politique générale du gouvernement. Elle a été entreprise dans un contexte économique marqué par une situation difficile et 39 Ex CCCE : Caisse Centrale de Coopération économique et CFD : Caisse Française pour le Développement 40 Ministère de la production agricole et de la réforme foncière 41 Opération de Développement Rural pour Vakinakaratra et Ambositra, Opération de développement du Sud Est pour Manakara, Opération ABM à l’ouest

107
pressante en matière de production agricole : insuffisance de la production rizicole face au besoin de la population, augmentation considérable de l’importation de riz, insuffisance de devise, détérioration généralisée des infrastructures hydroagricoles. Au niveau des bailleurs de fonds, l’identification du projet se faisait par rapport à leur intervention antérieur et leur stratégie de prêt. Le projet PPI phase 1 a été qualifié, par exemple, par le Groupe de la Banque Mondiale comme un « projet pilote, qui pourrait constituer la première étape d’un programme à long terme de remise en état des petits périmètres et même de certains micro-périmètres »42. Tous les bailleurs de fonds ont reconnu la potentialité et les avantages comparatif de Madagascar dans le domaine de l’agriculture et plus spécifiquement du secteur irrigué. Le Projet de réhabilitation des petits périmètres irrigués dont l’identification remontait vers la fin des années 80, a été focalisée sur la problématique de l’insuffisance de la production rizicole eu égard de la croissance démographique et de l’augmentation de la l’importation de riz dans un contexte de pénurie de devise. Une des conditions préalables de la Banque Mondiale, suite à la requête du Gouvernement Malagasy au financement de la réhabilitation de l’irrigation, était le désengagement de l’Etat de la gestion et de l’entretien des infrastructures d’irrigation. Cette condition traduit par ailleurs la nouvelle orientation de la politique économique de Madagascar négociée avec la Banque Mondiale et le FMI dans le cadre du Plan d’Ajustement Structurel.
Préparation
La phase de préparation du PPI s’est caractérise par le regroupement des initiatives déjà entreprises séparément par la Banque Mondiale et la CCCE. Absence d’un programme national concernant le secteur irrigué La préparation du projet a vu la collaboration de la Banque Mondiale qui semblait prendre le leadership, la CCCE et l’Etat malgache. Une nouvelle stratégie agricole a été mise en place par le gouvernement mais la préparation du projet ne s’appuyait pas sur un programme national bien défini du sous secteur irrigué qui aurait permis une coordination claire des objectifs ainsi que les responsabilités et les attributions de chaque intervenant dans le secteur. Cette carence notable a rendu difficile la mise en cohérence des objectifs et résultats attendus du projet avec la politique de développement en général et du secteur agricole en particulier. Absence de consultants nationaux dans la phase de préparation La situation politique au moment de la préparation du projet a été caractérisée par un Etat puissant, providentiel et fortement centralisé. Ces facteurs ont une grande importance quand on veut responsabiliser et faire participer les usagers dans la gestion et aux travaux d’entretien des infrastructures réhabilitées. L’absence de consultants nationaux lors de la préparation du projet a occulté ces aspects socio-organisationnels, culturelle et politique au niveau des périmètres. La préparation a reflété l’approche top-down dans la conduite des actions de développement. Aucune alternative claire a été prévue après le désengagement de l’Etat même progressif.
42 « Madagascar, Projet de réhabilitation de l’irrigation : rapport d’évaluation », page 17
108
Instruction
Les trois principaux bailleurs de fonds (Banque mondiale, CCCE et FED) ont participé à l’instruction du projet qui allait avoir une dimension nationale du moins en ce qui concerne les objectifs et l’organisation. Le gouvernement a été sollicité pour donner son approbation sur les grandes lignes du projet. L’absence d’une stratégie d’ensemble et d’un plan conforme à cette stratégie pour la mise en œuvre des nombreux investissements de réhabilitation que les bailleurs de fonds pourraient financer ont nécessité la coordination des instructions entreprises par chaque bailleur de fonds. Peu de considération des contraintes locale et des contrainte de l’Administration L’orientation du projet a donné une grande importance à l’intervention physique en laissant de côté les aspects organisation humaine, participation et environnement social et politique. Aucun financement n’était prévu pour la mise en place de la structure d’auto administration et d’autofinancement de l’entretien des périmètres réhabilités spécifié dans l’objectif du projet. Cette structuration était supposée être à la charge du gouvernement qui n’y était pas préparé. L’approche indiquée lors de l’instruction pour réduire le risque lié au désengagement de l’Etat était le paiement anticipé par les utilisateurs et un appui aux Comités de Gestion de l’Eau prévu par la nouvelle loi régissant le secteur irrigué. Cette approche ne garantit pas la réalisation de l’objectif d’auto administration et d’autofinancement eu égard des conditions socio-politique et du poids du passé dans les mentalités des usagers. Un des points faibles du PPI 1 est le peu considération accordée aux contrainte et à la réalité du terrain lors de la préparation Manque de participation des usagers
A part les réhabilitations réalisées au niveau des GPI par les sociétés d’aménagement para-publiques, l’instruction est limitée par l’inexistence d’expériences antérieures sur la réhabilitation des PPI et la responsabilisation des usagers. Le calcul des coûts s’est basé sur l’étude préparatoire des schémas d’aménagement déjà réalisée sur 4 périmètres pilotes dont la réhabilitation était déjà prévue sur financement de l’AFD et du FED. Les données techniques dans ces études ont été satisfaisantes pour l’évaluation des coûts et avantages du projet de réhabilitation de l’irrigation. Cependant, le manque de participation des usagers et/ou de leurs représentants n’a pas permis l’élaboration d’un schéma d’auto administration et d’autofinancement adéquat. Faiblesse des indicateurs pour le suivi et l’évaluation Lors de l’instruction et la préparation du projet PPI, l’analyse économique ne prenait en compte que le niveau macro-économique en délaissant les autres niveaux meso et micro-économique. Les indicateurs pour l’évaluation de l’impact économique du projet restaient insuffisants. Un des points faibles de l’instruction du projet PPI 1 est d’ailleurs la formulation des indicateurs pour le suivi et l’évaluation des objectifs et des résultats. Incapacité du Gouvernement à imposer sa conception du projet
109
Le gouvernement a élaboré une nouvelle loi régissant le secteur irrigué. Malgré les ambiguïtés de cette loi (approche décentralisée et pouvoir centralisé) en raison de l’absence d’une politique et/ou un programme concernant le secteur irrigué à laquelle elle doit se baser, elle a néanmoins le mérite d’appuyer sur le plan juridique un désengagement progressif de l’Etat dans la gestion et l’entretien des réseaux d’irrigation. Les objectifs affichés lors de l’instruction du projet ne fait pas apparaître la considération « projet pilote » qui était bien justifié considération faite d’un désengagement progressive préconisé par le gouvernement. L’incapacité du Gouvernement à imposer un désengagement progressif du secteur a conduit à des objectifs ambitieux et imprécis notamment en ce qui concerne la structure d’auto administration et d’autofinancement.
Négociations de financement
La marge de manœuvre du gouvernement était très faible lors de la négociation en partie à cause des raisons suivantes : i) il n’a pas disposé d’un programme et/ou plan relatif au développement du secteur irrigué, sur lequel doivent se baser les négociations compte tenu de la responsabilité de chacun, ii) le gouvernement ne semblait pas maîtriser le processus de préparation, iii) la situation très précaire du secteur agricole et son impact sur l’économie nationale a placé le gouvernement en position de faiblesse, iv) enfin les bailleurs de fonds ont déjà leur procédure que le gouvernement doit suivre et appliquer.
Mise en œuvre et contrôle
La mise en œuvre du projet a été marquée par une durée très longue (2 ans) consacrée à l’étude agro-socio-économique au niveau des périmètres à réhabiliter et à la mise en place de la méthodologie d’approche et d’intervention concernant :
- la reconnaissance et l’inventaire des périmètres - le calcul des paramètres hydrologiques - le calcul du taux de rentabilité - le lancement des études et des travaux
Cette période a permis l’élaboration d’une démarche rationnelle d’investigation du potentiel de réhabilitation et de sélection des périmètres devant être réhabilités et la conception et définition de la structuration des usagers pour la prise en charge de la gestion et l’entretien des périmètres réhabilités. Toutes ces démarchés n’était pas prévu au cours de la préparation et l’instruction du projet.
Rigidité et lourdeur de la structure d’exécution du projet
110
L’exécution du projet par les structures institutionnelles existantes permettrait le renforcement du rôle de l’Administration dans la viabilisation des acquis du projet à moyen et long terme contrairement à l’approche « projet autonome » doté de sa propre structure mais qui disparaît à la fin du projet. La structure d’exécution était cependant très lourde et compliquée ce qui a rendu difficile la chaîne de commandement. Au sein d’un système fortement hiérarchisé, le pouvoir du Coordinateur National, en tant que premier responsable de l’exécution du projet, est limité au cas ou les directions n’assument pas leur responsabilité. Etant donné que le Coordinateur National a été déjà nommé lors de l’instruction du projet, la nomination de nouveau Ministre et de nouveaux responsables au niveau des Directions concernés par le projet au moment de la mise en œuvre de ce dernier a fait apparaître la faiblesse de la structure d’exécution. Les problèmes engendrés par cette faiblesse débouchaient sur le renforcement de la cellule de Coordination National et le changement du Coordinateur trois ans après la mise en œuvre du projet. Faible participation et implication des techniciens au niveau des zones d’intervention La très forte centralisation de l’appareil administratif a limité la participation et l’implication des techniciens au niveau des régions dans la planification et l’étude de pré-investissement. Par conséquent, ces techniciens n’assuraient pas correctement le suivi de la réalisation des travaux sur le terrain. D’autre part, les ingénieurs en équipement rural ou en géni civil se sont fortement concentrés dans la Capitale ce qui créait un manque de personnel qualifié au niveau des zones d’intervention. Insuffisance de la motivation du personnel Les personnels du MPARA travaillant dans le cadre du projet n’étaient pas suffisamment motivés par souci d’harmonisation des traitements de tous les agents de l’Etat. Ce facteur a affecté leur productivité et a diminué l’efficacité des actions entreprises avec les assistants techniques qui avait bénéficié d’énormes avantages matériels. Insuffisance de cadres supérieurs expérimentés Compte tenu de l’insuffisance de cadres supérieurs expérimentés43, chaque direction a été appuyée par un ou deux assistants techniques expatriés recrutés sur appel d’offre international. Ces assistants techniques dont un chef de mission travaillait auprès de la Coordination Nationale, étaient prise en charge par le financement de la Banque Mondiale. Au niveau des zones d’intervention des autres bailleurs (AFD sur le haut plateau et FED pour les PPI Sud), les coordinateurs régionaux travaillaient avec d’autres assistants techniques expatriés prise en charge par le bailleur de fonds concerné. Cette assistance technique pléthorique était difficile à coordonner d’autant plus que chaque bailleur a leur propre procédure et style d’intervention. Place prépondérante des assistants techniques expatriés dans la gestion du projet Le manque d’initiative et de capacité de persuasion des techniciens nationaux qui étaient censés connaître le terrain a donné une place prépondérante à l’assistance technique expatriée dans la réalisation du projet. L’absence d’échange d’expérience entre les assistants techniques expatriés et les techniciens locaux a réduit l’efficacité des actions. Incohérence des procédures entre bailleurs de fonds
43 Bon nombre de cadres supérieurs du Ministère étaient fraîchement diplômé et manquaient d’expérience

111
La différence des procédures et des modes d’intervention des bailleurs de fonds a rendu compliquer la coordination des activités du projet sur le terrain. L’établissement des Termes de Références et des cahiers de charges ainsi que les contrats n’étaient pas par exemple les mêmes. Il y avait beaucoup de tâtonnement dans la tentation pour l’homogénéisation des approches notamment sur l’établissement des TDR des études. Faible implication des usagers ou de leurs représentants En général, l’implication des usagers ou leur représentant dans la conception et la planification des travaux d’aménagement des périmètres était très faible voire inexistante. La consultation de ces usagers était axée surtout sur le paiement de redevance pour les travaux d’entretien. La durée très longue de la réalisation des travaux pénalisant les exploitations a pourtant relâché la volonté et l’enthousiasme des usagers. L’intervention du projet dans la structuration des usagers pour la prise en charge de la gestion et l’entretien des périmètres était très tardive. La méthodologie pour la mise en place des Associations des Usagers de l’Eau n’était pas expérimentée que vers la fin du projet. Faiblesse du système de suivi et évaluation Tout au long du projet, aucune structure de suivi et d’évaluation des actions et de la réalisation des objectifs n’existait. Cette structure n’était même pas prévue lors de la phase de préparation et de l’instruction du projet. Cette fonction, pourtant très utile, devait être assurée par la Direction de la programmation mais cette dernière ne semblait pas s’y préparer.
Projet de réhabilitation des périmètres irrigués phase 2
Description du projet
La phase 2 du projet de réhabilitation des périmètres irrigué s’est déroulé de 1994 à 2001. Financé à hauteur de 24 million de $US, ce projet vise
- la promotion de la croissance par une augmentation de la production agricole grâce à une meilleure gestion de l’eau sur les périmètres irrigués
- la lutte contre la pauvreté par une amélioration du revenu et de la sécurité alimentaire de la population rurale à travers l’augmentation de la production et de la productivité des périmètres irrigués et de l’intensification agricole
- l’amélioration de l’environnement en intégrant une évaluation environnementale dans la réhabilitation des périmètres
- l’amélioration des capacités locales de mise en œuvre du projet par l’établissement des procédures opérationnelles pour le transfert de la gestion et de l’entretien des périmètres aux usagers de l’eau
Cette deuxième phase du projet PPI comporte 6 composantes :
112
- consolidation de la réhabilitation et transfert de la responsabilité et de l’entretien des 16000 ha de périmètres réhabilités au cours de la première phase
- évaluation et exécution des travaux de protection de l’environnement nécessaires pour assurer la durabilité des périmètres irrigués réhabilités
- réhabilitation de 4000 hectares de nouveaux périmètres irrigués - renforcement des services d’appui au développement agricole du Ministère de l’Agriculture - formation du personnel du projet et des agriculteurs pour assurer la durabilité des activités
du projet - suivi et évaluation de l’impact du projet
Il est attendu de ce projet une amélioration de l’utilisation des infrastructures d’irrigation, un accroissement de la production et des revenus d’environ 40 000 ménages, une réduction à long terme de l’obligation financière du gouvernement vis à vis du sous secteur irrigué. Le projet a été mis en œuvre par le MEADR dont le Secrétaire Général assure la responsabilité globale des activités.
Identification
Le projet n’a pas fait l’objet d’une identification, à proprement parler, compte tenu de son caractère subséquent par rapport à la Phase 1. le PPI 2 était considéré comme la deuxième tranche du programme national de réhabilitation des PPI. La pertinence du projet face aux problèmes de développement du secteur agricole, et du sous-secteur irrigué en particulier, n’est plus remise en question.
Préparation et instruction
Préparation avant l’évaluation de la phase précédente Dans un contexte de bouleversements politiques fondamentaux à Madagascar (changement de régime avec modification de la loi constitutionnelle : Troisième République), la mission de préparation a été assurée par le Centre d’Investissement FAO/Banque Mondiale à la demande du Gouvernement Malagasy en octobre 1992 jusqu’en Janvier 1993. De ce fait, la préparation de la phase 2 du PPI n’a pas pu bénéficier du rapport d’évaluation finale de la Phase 1 (Avril 1993). C’est la mission de préparation qui a capitalisé les expériences de la Phase 1, ceci un peu en remplacement d’une mission d’identification de la Phase 2. Le temps imparti pour la réalisation d’une telle étude est insuffisant pour que la réalité du terrain et les points forts et les points de la phase précédente soient bien exploités. Il s’ensuivit une inadéquation de certaines composantes à la réalité du terrain. Absence de participation des acteurs locaux L’équipe chargée de la préparation de PPI 2 était entièrement composée par des consultants expatriés. Deux orientations stratégiques majeures en matière d’habilitation sociale sont tirées de cette préparation :

113
i) La prise en considération de la faiblesse de la capacité des acteurs face à leurs nouvelles responsabilités a été bien tenue en compte dans le dossier de préparation44. ii) Les procédures de mise en œuvre sont modifiées pour assurer la contribution effective des AUE à la maintenance des infrastructures45.
Le faible évaluation de la capacité des acteurs locaux a conduit à l’établissement d’une hypothèse trop forte de développement accéléré du capital social – adaptation rapide des services publics centraux et décentralisés, des paysans et groupements de paysans, des collecteurs et importateurs, des négociants d’intrants agricoles …- à leurs nouvelles responsabilités – qui va entraîner une réduction des chances de pérennisation des apports du programme. Hypothèse macro-économique trop élevée Les données de calcul sont assez précises tant sur le plan technique qu’économique. Les études socio-économiques et techniques réalisées par les bureaux d’études locaux lors de la première Phase ont été valorisées. Les prix de référence calculés montrent clairement l’intérêt de développer la production locale. La viabilité économique du programme s’appuie sur l’augmentation des cultures de contre-saison (pommes de terre, céréales) ainsi que sur une intensification (emploi de fertilisants) et une diversification (rizipisciculture) de la production au niveau des fermes, dégageant un revenu additionnel capable de supporter la prise en charge des frais d’entretien des réseaux. Par contre, les hypothèses macroéconomiques sont trop optimistes. Un taux d’inflation inférieur à 10%, une dépréciation monétaire ne dépassant pas 10%, un taux de croissance supérieur à la croissance démographique. Les effets des troubles politiques de 1991 et 1992 vont persistés sur quelques années. Par rapport à la préparation de la Phase 1, l’analyse micro-économique est plus pertinente alors que l’approche macro-économique semble insuffisante et se cantonne aux reformes de l’ajustement structurel.
Mise en œuvre
Changement de composante au cours de la mise en œuvre du projet
Le projet a intégré deux composantes qui n’étaient pas prévues lors de la phase de planification : la lutte contre les criquets migratoires survenus en 1999 qui représente 9% du budget du projet et l’inclusion des GPI en plus des PPI sélectionnés. L’intégration de ces composantes a changé l’objectif du projet et les résultats escomptés.
44 Une Assistance Technique de 226 h/mois est prévue pour assurer la formation au niveau des services centraux et 155 h/mois pour les services décentralisés. Des formations académiques locales et à l’étranger sont aussi planifiées. De même, pour les usagers de l’eau, une Assistance Technique en ingénierie sociale de 22 h/mois sont budgétés pour appuyer les organisations des associations des usagers de l’eau (AUE). 45 Si dans la Phase 1 l’engagement écrit de 90% des usagers était exigé avant d’entamer les travaux de réhabilitation, dans la Phase 2, le versement effectif des cotisations des membres de l’association ainsi que le paiement des charges récurrentes de la première campagne agricole est réclamé avant le commencement de tous travaux.

114
Importance du taux de décaissement par rapport à l’objectif du projet
Considération faite des objectifs initiaux du projet, la réhabilitation des infrastructures hydroagricoles devait être subordonnée à l’existence d’une structure autonome capable d’assurer la gestion et l’entretien des ces infrastructures. Cette approche ralentit pourtant le taux de décaissement qui constitue le principal critère de performance du projet auprès des bailleurs de fonds. Deux ans après le lancement du PPI 2, les réhabilitations ont été multipliées sans tenir compte de la capacité des AUE à les gérer et à les entretenir après.
Faible participation des usagers à la conception et à la réalisation des schémas d’aménagement
Au cours de cette deuxième phase du projet de réhabilitation des petits périmètres irrigués, les bureaux d’études ont été contraints de consulter et de tenir compte de l’avis des usagers. Le contrainte temps des Bureaux d’Etude a rendu difficile la mise en œuvre de cette approche participative compte tenu du niveau d’éducation des usagers. Le processus s’est transformé le plus souvent en une séance d’explication du schéma d’aménagement préconisé par les Bureaux d’étude aux usagers.
Faible considération de la composante environnementale
Malgré l’intégration de la dimension environnementale lors de la planification, cette composante destinée à contrôler l’érosion sur les bassins versant a été particulièrement négligée. L’insuffisance de compétence dans ce domaine a en outre contribué à cette situation.
L’incapacité à s’adapter à une nouvelle stratégie Des reformes politiques ont été appliquées lors de la mise en œuvre du PPI 2. Les plus importantes parmi ces reformes sont : i) gestion et entretien des périmètres AUE (16 000 ha réhabilités en Phase 1 + 4000 ha nouveaux) ; ii) accélération de la décentralisation des services publics ; ii) encouragement de la participation locale à la fourniture de services publics (irrigation). Le changement significatif intervient également dans les structures de mise en œuvre du projet. Dorénavant, la coordination (nationale, régionale et locale) est chargée d’une mission de transfert et d’intégration des activités de planification, de mise en œuvre et de suivi-évaluation aux services publics et aux comités de coordination. La pérennisation institutionnelle est poursuivie par une intégration des activités de coordination du projet dans les fonctions de l’administration. Par rapport à ces changements, les usagers et les employés de l’Administration ne sont pas préparés. Les appels d’offre et les sélections des entreprises contractantes sont restés centralisé malgré tous les efforts entrepris pour renforcer les services déconcentrés. Il n’y a pas eu de collaboration entre le projet de vulgarisation (PNVA) et le PPI. La rivalité entre les personnels a emporté sur le travail d’équipe. La vulgarisation agricole, nécessaire pour espérer une augmentation des productions, a également souffert des manques de motivation du personnel non permanent, dont la rémunération a

115
été beaucoup retardée. Cette situation relève en outre de la faiblesse du système de communication au sein des structures d’exécution des projets.
Projet de développement rizicole de Bas Mangoky (PRBM)
Description du projet
Le PRBM est lancé en 2000 pour une durée de 5 ans. Sur le plan sectoriel du projet vise le renforcement de la sécurité alimentaire et la réduction des importations de riz. L’objectif du projet est l’augmentation de la production vivrière (riz) par la valorisation des infrastructures d’irrigation et la restauration de conditions durables dans l’exploitation de ces infrastructures et des aménagements du périmètre de bas Mangoky. Financé par le FAD à travers la BafD, l’OPEP et le Gouvernement Malagasy à hauteur de 16,98 millions d’Unité de Compte ou 23,0561 millions de $US le PRBM comporte quatre principales composantes : i) réhabilitation des infrastructures d’irrigation, ii) Appui à la mise en valeur de périmètres, iii) désenclavement du périmètre (tronçon de 60Km), iv) gestion du projet.
Disposant d’un potentiel de terre irrigable de 100 000ha le périmètre de Bas Mangoky est équipé pour l’irrigation sur 8400 ha qui s’est dégradé par manque d’entretien depuis la liquidation en 1994 de la SAMANGOKY. L’exécution du projet est confiée à une unité de gestion indépendante au personnel limité. Des opérateurs spécialisés assurent la réalisation des objectifs tandis que le MAEP assure la fonction de contrôle.
Planification
Le PRBM a été identifié en 1996 après la dissolution de la société d’aménagement du GPI de Bas Mangoky. Cette identification reposait sur la potentialité de la zones, la dégradation des infrastructures d’irrigation, le faible performance de l’agriculture. La mission d’identification a été entreprise par la FAO suivi d’une étude de pré-investissement en 1997-1998 par le Centre d’Investissement de la FAO en accord avec le Gouvernement malagasy. Après une requête du Gouvernement Malagasy en septembre 1998, la BafD a entrepris une mission d’évaluation en février 1999.
116
Le contexte qui prévalait lors de la planification du PRBM est marqué par :
- Restructuration des ministères chargés du développement rural - Renforcement du désengagement progressif de l’Etat aux activités de production et de
commercialisation
- Développement des Institutions de micro finance - Réalisation du Programme Environnement phase II (PE2) - Réalisation projet de réhabilitation des petits périmètres irrigués phase 2 sur financement
Banque Mondiale - 12 projets dans le secteur du développement agricole sur financement BafD achevés, 2
annulés, 4 en cours - Plan d’Action pour le développement rural en cours d’élaboration
- Existence d’une Fédération des AUE : FAMA
Cette phase s’est caractérisée par i) Visites de terrain ii) Entretien et échange de vue avec les bénéficiaires iii) Entretien et échange de vue avec les opérateurs concernés et pressentis pour la mise en œuvre du projet iv) Investigations et discussions avec les associations paysannes, ONG départements ministériels.
Les points forts de la phase de planification de ce projet sont la disponibilité de données techniques satisfaisantes concernant le périmètre et de données économiques assez fournies au niveau meso et macro. Les paramètres environnementaux sont bine tenu en compte.
Les faiblesses suivantes sont aussi constatées :
- Financement du désenclavement insuffisant - Dynamique de la filière riz dans la région peu étudié permettant une anticipation du marché
et une prudence dans la projection économique
Mise en oeuvre
- Le PRBM se distingue par la responsabilisation du secteur privé à la gestion du périmètre, le
système de contrôle et suivi rigoureux et la responsabilité explicite sur les coûts récurrents du projet. Cependant, il est noté l’ absence d’une cellule de suivi et évaluation technique et économique qui n’était même pas prévu lors de phase de planification
Projet Haut Bassins de Mandraré phase deux (PHBM)

117
Description du projet
Le PHBM phase 2 est prévu pour 5 ans à partir de 2001 pour un montant de 18 102 US$ financé par le FIDA. Il cible la population de neufs Communes d’environ 17 000 ménages. Les objectifs du projet sont de :
- renforcer les capacités locale de planification et de gestion du développement économique et social en ciblant principalement les organisations paysannes
- appuyer les initiatives locales contribuant à l’augmentation et à la sécurisation alimentaire et à la gestion durable des ressources naturelles
- promouvoir le développement de système de production agricole durables - mieux valoriser la production par i)le désenclavement de la zone et un meilleur accès au
marché, à l’information et aux services financiers, ii) la réduction de perte de récolte, le soutient à la transformation et à la commercialisation des produits
Les composantes du projets font apparaître son caractère intégré en terme de développement :
- renforcement de la capacité locale qui consiste en une planification locale participative et animation, une alphabétisation fonctionnelle et un renforcement des capacités des agents du projets, des communautés, des organisations paysannes et des structures locale de concertation
- appui au initiative locale dont le but est de i) mettre en place les mécanismes de sélection, d’approbation et de financement des micro-projet identifiés à la base, ii) de cofinancer les bénéficiaires des micro-projets et iii) de sécuriser la mise en œuvre des micro-projets
- appui aux services financiers dont les activités sont i) l’étude de marketing et d’impact et ii) l’appui aux caisses et opération de microfinance
- désenclavement de la zone - coordination et gestion du projet
Le PHBM est exécuté par un Bureau de Projet Indépendant composé par du personnel de sélectionné sur concours à publicité national et sous la supervision d’un Comité d’Orientation du Projet composé des représentants de diverses entités dont différent ministère, institution privé et publique, agence de coopération et des bailleurs de fonds et des organisations paysannes
Planification
L’identification du projet PHBM a été faite après la famine qui s’est produite dans la cette partie sud de l’île en 1992 –1993. La zone du projet a été déjà identifiée en 1970 comme une zone à haute potentialité économique. Le gouvernement a identifié le projet et a déposé une requête de financement auprès du FIDA. Le PHBM phase 2 ne fait plus l’objet d’une identification. La phase deux du PHBM est une extension prévue dans la planification de la phase 1 dont la délimitation géographique a été diminué de 9 à 4 Communes pour une raison de limitation du financement. La phase deux a intégré tous les 9 communes concernés initialement. La préparation de la phase deux a été réalisé par le Centre d’Investissement de la FAO en 2000. Elle s’est caractérisée par l’implication plus poussée des bénéficiaires et les différents intervenants dans
118
le développement de la zone comme le Comité de Coordination du Développement Communal ou intercommunal. Ces structures ont été mise en place au cours de la première phase du projet avec l’élaboration des Plan Communal de Développement (PCD). Il faut remarquer que depuis 2001, aucun investissement sur financement des bailleurs de fonds classiques ne peut être réalisés au niveau des communes sans un PCD validé par les conseillers communaux. Malgré l’approfondissement de l’approche participative lors de la préparation de la phase 2 du PHBM, la faible implication des autorités communales constitue un point faible. L’écartement de cette entité est une aberration de l’approche participative car si les micro-projet de développement génératrice de revenu peuvent être réalisés au niveau des village, les projets communautaires revêt une dimension communale d’où la nécessité des autorités communales. Cette négligence peut se traduire aussi par une grande méfiance vis à vis des autorités politique dans le planification et la mise en œuvre des projets. Ce point faible de la préparation a été rectifié au cours de l’instruction du projet qui a vu la participation active des responsables du Bureau du Projet de la phase 1 en concertation avec les bénéficiaires du projets PHBM 2
Mise en œuvre du projet
Au cours de la phase 1, l’implication et la participation des bénéficiaires dans la détermination des schémas d’aménagement est plus faible. La phase deux a prévu un renforcement de cette implication et participation. A la différence de la première phase du PHBM où le Directeur du Bureau du projet a établi l’orientation du projet, cette orientation est plus participatif avec la mise en place du Comité d’Orientation du Projet qui se réunit pendant au moins deux jour par ans pour valider le Plan de Travail Annuel du Projet. Lors de cette réunion, les représentants des Communes touchés par le projet y sont intégrés pour défendre leurs projets présentés par le Bureau du projet de la PHBM.
Projet Bassin Versant – Périmètre irrigué (BV-PI)
Le projet BV – PI a été identifié par l’ensemble des bailleurs de fonds notamment l’AFD et le Gouvernement lors de la mise en œuvre des projets de réhabilitation des petits périmètres irrigués (PPI). Après une requête de financement du gouvernement, la BM a entrepris en 2002 une mission d’identification. Cette mission, financé sur don japonais géré par la banque mondiale a nécessité une contribution financière du Gouvernement A la différence des autres projets d’irrigation, la préparation de ce projet est actuellement pris en charge par le gouvernement à travers un comité had hoc appelé « Task Force BV-PI » mise en place par le MAEP. Les points suivants peuvent être évoqués comme des faiblesses de cette phase de préparations :
119
- Les procédures bureaucratique est très lourde au niveau du Gouvernement - Il se présente le plus souvent une incohérence entre le calendrier des bailleurs de fonds et la
disponibilité de la contribution financière du Gouvernement. L’attente de l’inscription de cette contribution à la loi de finance pour pouvoir faire une ouverture de compte retarde et bloque même tous le processus.
- La préparation technique est prise en charge par le « Task force » avec le non objection de la
BM et de la Commission de Marché du Gouvernement pour les études. La démarche exigée par ces deux entités ne sont pourtant pas les même et cohérente ce qui complique énormément la procédures dans un temps déjà limité et difficile à gérer.
- Le changement fréquent de responsables au niveau de l’administration rend difficile la
continuité des actions car les différents problèmes et les solution évoqués au cours du processus ne font pas l’objet d’un suivi permanent.

120
CONCLUSION ET RECOMANDATION
La planification et la mise en œuvre des projets d’irrigation a fortement évolué depuis ces quatre dernières années à Madagascar. Cette évolution s’est développé d’une part avec l’élaboration des différents outils de planification du développement rural en général et du sous secteur irrigué en particulier et d’autre part avec le développement de la compétence locale en matière de planification et de mise en œuvre des projets. La participation de tous les intervenants aux projets, notamment les usagers, dans la phase de planification et de mise en œuvre a connu un progrès mais elle reste encore modeste compte tenu du niveau d’éducation plus faible des bénéficiaires du projets et l’adaptation plus lente des agents et de la structure de l’Administration. Il est constaté au cours de ces 10 dernières années que le désengagement de l’Etat de la gestion et de l’entretien des périmètres réhabilité constitue un des axes principales des projets d’irrigation. Ce point constitue par contre le point faible des projets au niveau de la mise en œuvre compte tenu de l’insuffisance du temps nécessaire pour le transfert de gestion par rapport à la durée du projet et la recherche d’un taux de décaissement plus élevé considéré comme le critère de performance exigé par les bailleurs de fonds. Les recommandations suivantes peuvent être avancées, à partir des analyses des différentes projets d’irrigation à Madagascar :
- le désengagement de l’Etat doit être axé sur une meilleure efficacité des investissements hydroagricoles mais pas seulement sur l’allégement des charges financières de l’Etat vis à vis du secteur irrigué
- les AUE ne sont pas forcement la seule forme de transfert de gestion aux usagers. L’implication plus poussée des autorités administratives et/ou traditionnelles dans la gestion des périmètres irrigués est une voie à explorer pour une meilleurs efficacité du secteur irrigué. Dans tous les cas, il faut une entité qui a de la notoriété pour la prise en charge des infrastructures d’irrigation qui peuvent être considérées comme des biens communautaires.
- Le développement de l’éducation dans tous les domaines (Sociale, politique, environnemental) de manière permanente, à travers les différents support de communication par exemple, est essentiel pour assurer une meilleure efficacité des investissements des investissements hydroagricoles
- Le système de suivi et d’évaluation doit être insisté dès la phase de préparation des projets d’irrigation. Ce système doit prévoir à la fois un suivi et évaluation technique et économique au niveau micro, meso, et macro pour pouvoir mieux apprécier l’impact de l’évolution du secteur irrigué dans la lutte contre la pauvreté
Les problème fonciers n’est pas développé dans les analyses. Pourtant, ils constituent un facteurs limitant dans le développement du secteur irrigué et au transfert de gestion. En fait le foncier est le centre de tous actions de développement dans le milieu rural. Le problème foncier ne doit pas constituer un facteur limitant aux investissements hydroagricole et au transfert de gestion dans la mesure ou la bonne gouvernance existe au niveau local, régional, et central pour assurer la sécurité des exploitants vis à vis des problèmes d’héritage, de transfert de patrimoine foncier et de métayage et de différente forme de location. Encore une fois, il faut trouver la forme juridique la plus adaptée sur le plan de valorisation des parcelles d’exploitation au niveau des périmètres irrigué en vu de l’optimisation de la productivité à moyen et long terme de ce secteur.
121
IRRIGATION, PLANNING AND IMPLEMENTATION: MALI CASE STUDIES
KEITA Manda Sadio, Consultant

122
RESUME Le Mali est de loin le pays du Sahel qui dispose de plus de ressources en irrigation sol et eau avec près de 2 200 000 ha de terres aptes à l’irrigation, dont plus de 1 800 000 ha dans la seule vallée du fleuve Niger. Aussi, le potentiel apte à l’irrigation du Mali appelle une valorisation économique conformément aux orientations en matière de croissance accélérée, de développement agricole et de lutte contre la pauvreté arrêtées par le Gouvernement dans le Schéma Directeur du Développement Rural, la Stratégie Nationale de développement de l'Irrigation, Le Cadre Stratégique de Lutte contre la Pauvreté, etc. Les principaux systèmes d'irrigation (type d'aménagement) existants au Mali sont:
- L'irrigation avec maîtrise totale de l'eau (grands périmètres de type Office du Niger, Office du Périmètre Irrigué de Baguinéda, Office Riz Sélingué);
- L'irrigation par submersion contrôlée (aménagements de type Office Riz Ségou, Office Riz Mopti, Projet de Développement de la Riziculture à San, Projet de Développement en Zone Lacustre à Niafunké, Projet de Développement du cercle d'Ansongo à Gao, Projet de Renforcement Organisationnel, Crédit et Aménagement à Macina - ROCAM de CARE Mali, etc.);
- L'irrigation par submersion libre (plaines riveraines du Bani et du Niger dans les régions du Nord Mali, notamment à Gao et Tombouctou);
- Les périmètres irrigués à maîtrise totale de l'eau de 5 ha ou plus (Projet VRES, PPIP, etc.); - L'irrigation en aménagement de bas-fonds (zone cotonnière Mali-sud); - Les petits et micro-périmètres irrigués privés (1 à 5 ha).
D'un point de vue global, la stratégie nationale d'investissement, de planification et de mise en œuvre de projets d'AHA fait face aux contraintes suivantes:
- l'obligation pour le Gouvernement du Mali d'adopter la philosophie du bailleur de fonds pour pouvoir bénéficier de son financement;
- le manque de présence du bailleur de fonds à toutes les phases du projet, hormis les phases de conception et de finalisation;
- le retard dans le décaissement des fonds octroyés; - la multiplicité des procédures selon les bailleurs de fonds; - la faible collaboration directe entre les bailleurs de fonds et les bénéficiaires; - la faiblesse des capacités techniques des collectivités locales; - le niveau élevé d'analphabétisme des populations bénéficiaires; - la sous-utilisation des compétences techniques des cadres nationaux; - la faiblesse de rémunération des cadres fonctionnaires des projets.
D'un point de spécifique et par type d'aménagement les constats suivants se font :
- En système de maîtrise totale de l'eau avec pompage : l'une des difficultés majeures de ce type d'aménagement est la contrainte liée au choix technique du matériel de pompage. En effet ce choix est le plus souvent opéré par l'équipe de projet sans consultation préalable ni approbation des bénéficiaires. La maintenance et le renouvellement des GMP constituent aussi une des contraintes majeures. Le problème du foncier est un problème clé dans la mesure ou le droit coutumier et le droit républicain s'appliquent tous les deux. Les aspects de suivi-évaluation pendant les projets ne sont généralement pas maîtrisés. Il en est de

123
même pour les formations qui généralement ne sont pas évaluées et ne sont pas suivies de recyclage.
- En systèmes de submersion libre ou contrôlée : pendant les années de "mauvaise pluviométrie", la pluviométrie et la crue étant insuffisantes, l'eau n'arrive pas à entrer dans les aménagements et la production n'est plus assurée. En cas de pluviométrie et de crue trop abondantes, les cultures sont inondées. Cette situation va obliger le pays à adopter une nouvelle stratégie qui va consister à financer de moins de moins d'aménagements en submersion contrôlée et de chercher plutôt à sécuriser les existants. Le recentrage récent des activités de la Compagnie Malienne de Développement des Textiles (CMDT) a favorisé le transfert des activités telles que l'aménagement des bas-fonds au nouveau programme national qu'est le PNIR.
- Le dispositif actuel de référence pour l'aménagement hydro-agricole au Mali est devenu le périmètre irrigué de dimension variant de 0,5 à moins de 100 ha. Ce type d'aménagement bien que plus coûteux à l'ha par rapport à la submersion contrôlée, permet d'assurer la production agricole sur deux campagnes agricoles (hivernage et contre-saison), ce qui permet de rentabiliser les investissements initiaux.
- Le système gravitaire avec maîtrise totale de l'eau (cas de l'ON, du PAPIM et de l'OPIB, etc.) : les aménagements dans ce système sont très coûteux du fait de l'envergure des surfaces à aménager et cet effort en investissement de base doit être fourni par l'Etat malien qui manque de ressources financières. La tendance actuelle est à la forte implication des populations bénéficiaires pour réduire les coûts d'aménagement et accroître leur responsabilité vis-à-vis de ceux-ci.
Tous ces systèmes précités font face à une contrainte commune à savoir la forte précarité financière des bénéficiaires et leur analphabétisme qui, de ce fait, se voient confrontés à des problèmes en termes d'appropriation des infrastructures, en moyens financiers pour leur approvisionnement en intrants et matériels agricoles, en terme d'accès au crédit agricole (systèmes totalement libéralisés actuellement dans le pays) et ne peuvent donc assurer aucun investissement d'envergure.
En terme de perspectives, les initiatives d'appui à la stratégie nationale d'investissement, de planification et d'exécution des projets d'aménagement hydro-agricole au Mali doivent viser à:
- Exiger le concours des populations bénéficiaires de la phase de conception à la phase finale d'appropriation du projet;
- Dissocier l'octroi de financement des projets d'AHA de la conception spécifique d'un ou de plusieurs bailleurs de fonds;
- Aider à renforcer les investissements privés en zones d'irrigation gravitaire; - Promouvoir à la demande les initiatives privées et communautaires de réalisation de micro-
périmètres irrigués avec système de pompage; - Soutenir le renforcement des capacités des organisations paysannes ainsi des producteurs
individuels (formation, micro crédit, aides, etc.); - Renforcer les capacités des cadres et bureaux d'études privés, chargés de la surveillance
technique des infrastructures installées; - Favoriser l'utilisation des compétences techniques nationales et locales; - Développer des cadres de consultation entre l'expertise nationale, les bailleurs de fonds et
les bénéficiaires; - Renforcer les capacités des collectivités locales décentralisées.

124

125
SIGLES ET ABREVIATIONS ACP: - Afrique-Caraïbes-Pacifique AFAR: - - Action pour la Formation et l'Autopromotion Rurale AHA: - Aménagement Hydro-Agricole APROFA: - Agence pour la Promotion des Filières Agricoles AP-SRAD : - Avant-Projet de Schéma Régional d’Aménagement et de Développement ATI: - Projet de Promotion des Pompes à Pédales BEAU: - Besoins en Eau BNDA: - Banque Nationale de Développement Agricole CAM: - Chambre d'Agriculture du Mali CEMA: - Centre d'Etude et d'Expérimentation en Machinisme Agricole CG: - Comité de Gestion CIDR: - Centre International de Développement et de Recherche – système financier
décentralisé CMDT: - Compagnie Malienne de Développement des Textiles CPK: - Caisses Populaires du Korombana CTD: - Comité Technique de Développement DNAER: - Direction Nationale de l'Aménagement et de l'Equipement Rural DNHE: - Direction Nationale de l'Hydraulique et de l'Energie EIE: - Etude d'Impact Environnemental ESAT: - Esquisse de Schéma d'Aménagement du Territoire FAO: - Fonds des Nations Unies pour l'Alimentation et l'Agriculture FCRMD: - Fédération des caisses rurales Mutualistes du Delta – Système Financier
Décentralisé FNAHA: - Fonds National d'Aménagement Hydro-Agricole GEAU: - Gestion de l'Eau GMP: - Groupe Motopompe GRN: - Gestion des ressources Naturelles IEC: - Information, Education, Communication IER: - Institut d'Economie Rurale Inter-PIV: - Structure autonome de coordination inter-PIV Kafo Jiginew: - Système financier décentralisé (réseau) Kondo Jigima: - Système financier décentralisé (réseau) MDRE: - Ministère du Développement Rural et de l'Eau MIG: - Micro-périmètre Irrigué de Groupe NEF: - Near East Foundation Nyeta Mousso:- Système financier décentralisé (pour la promotion des femmes) ODRS: - Office de Développement Rural de Sélingué OGES: - Organisation pour la Gestion de l'Environnement au Sahel OMVS: - Organisation pour la Mise en Valeur du fleuve Sénégal ON: - Office du Niger ORM: - Office Riz Mopti ORS : - Office Riz Ségou PACEEM: - Projet de Commercialisation des Céréales au Mali PAL: - Programme d'Action Local PAPIM: - Projet d'Aménagement du Périmètre Irrigué de Maninkoura PAR: - Programme d'Action Régional PASA: - Programme d'Appui aux Structures Agricoles PAVCOPA: - Projet d'Appui à la Valorisation et à la Commerciales des Produits Agricoles

126
PDIAM: - Projet de Développement Intégré en Aval de Manantali PDZL : - Projet de Développement de la Zone Lacustre PEIF: - Petite Exploitation Irriguée Familiale ou Féminin PGRN: - Projet de Gestion des Ressources Naturelles PIL: - Périmètre irrigué d'Initiative Locale PIRT: - Projet d'Inventaire des Ressources Terrestres PIV/PPIV: - Périmètre Irrigué Villageois/Petit Périmètre Irrigué Villageois PMB: - Projet Moyen Bani PMI/PME: - Petite et Moyenne Industrie/Petite et Moyenne Entreprise PMR-FED: - Projet Micro-Réalisations du Fonds Européen de Développement PNIR: - Programme Nationale d'Infrastructures Rurales PNPE : - Politique Nationale de Protection de l'Environnement PNUD: - Programme des Nations Unies pour le Développement PPIP: - Projet de Promotion de l'Irrigation Privée PRODECA: - Projet de Développement du Cercle d'Ansongo à Gao PSSA: - Programme Spécial de Sécurité Alimentaire ROCAM: - Projet CARE Mali de Renforcement Organisationnel, Crédit et Aménagement à
Macina SEDIMA et SOMIA: Sociétés privées fournisseurs des Groupes Motopompes et de leurs pièces de
rechange SNDI: - Stratégie Nationale de Développement de l'Irrigation UCAMAN: - Union des coopératives Agricoles et Maraîchères de Niafunké UPA/UP: - Unité de Production Agricole VRES: - Projet de Valorisation des Ressources en Eaux de Surface

127
TABLE DES MATIERES INTRODUCTION 129 I. RAPPEL DES TERMES DE REFERENCE 133 II. La Stratégie Nationale d'Irrigation au Mali (SNDI) 134 2.2. Les programmes d’irrigation en cours 137 2.3. Analyse des principales contraintes au développement de l’irrigation 137 2.4. Besoins en superficies aménagées 138 2.5. Objectifs fondamentaux et principes directeurs de la stratégie 138 2.6. Redéfinition du rôle des intervenants dans le sous-secteur de l’irrigation 139 2.7. Appropriation du processus d’identification, de mise en place et de gestion des investissements par les bénéficiaires 139 2.8. Définition d’une politique d’investissement 139 2.9. Plan d’actions pour la mise en œuvre de la stratégie 145 2.10. Articulation de la stratégie sous-sectorielle de l’irrigation avec les politiques sectorielles nationales 146 III. Résultats des interviews 150 3.1. Résultats des entretiens avec les bailleurs de fonds et les services techniques 151 3.2. Résultats des entretiens avec les responsables de projets et certains consultants seniors 152 IV. ETUDE DE CAS 157 4.1. Projet de Valorisation des Ressources en Eaux de Surface (VRES) 157 4.1.1. Présentation et mise en oeuvre du projet 157 4.1.2. Coûts du projet 169 4.1.3. Contraintes au développement du projet 174 4.2. Projet Pilote de Promotion de l'Irrigation Privée (PPIP) 185 4.2.1. Présentation et mise en oeuvre du projet 186 4.2.2. Coûts du projet 192 4.2.3. Contraintes au développement du projet 193 4.2.4. Perspectives 193 4.3. Projet d'Appui à la Promotion de l'Irrigation dans le secteur de Maninkoura (PAPIM) 194 4.3.1. Présentation et mise en oeuvre du projet 194 4.3.2. Coûts du projet 198 4.3.3. Contraintes au développement du projet 200 4.3.4. Perspectives 201 4.4. Phase II du Projet de Développement en Zone Lacuste (PDZL) 204 4.4.1. Présentation et mise en oeuvre du projet 204 4.4.2. Coûts du projet 211 4.4.3. Contraintes au développement du projet 214 4.4.4. Perspectives 218 CONCLUSION GENERALE ET RECOMMANDATIONS 219

128
LISTE DES TABLEAUX
Tableau 1 : Nombre de périmètres réalisés depuis le démarrage du projet ................................ 163 Tableau 2 : Périmètre féminins aménagé par le VRES-2 ........................................................... 164 Tableau 3 : Nombre de villages touchés et population de la zone d'intervention............................................................................................................................... 165 Tableau 4 : décomposition des coûts du projet ........................................................................... 170 Tableau 5 : Coûts des MIG en zone YOUWAROU / AFAR (1998).......................................... 171 Tableau 6 : Coûts des MIG en zone DIALLOUBE /OGES (1998)............................................ 171 Tableau 7 : Montant des amortissements par campagne et type de GMP (en FCFA) ......................................................................................................................... 174 Tableau 8 : Les différent types d'aménagements réalisés dans le cadre du projet VRES ........................................................................................................................... 175 Tableau 9 : Grille de réalisation des objectifs du projet (en%)................................................... 189 Tableau 10 : Nombre de conseils apportés à des irrigants privés ............................................... 189 Tableau 11 : Aides juridiques ..................................................................................................... 189 Tableau 12 : Nombre de prêts traités .......................................................................................... 190 Tableau 13 : Activités de formation réalisées............................................................................. 190 Tableau 14: Tests d'équipements (le test est réalisé sur trois ans selon le cas)................................................................................................................................. 191 Tableau 15 : Superficies couvertes par le projet (ha).................................................................. 191 Tableau 16: Intensité de culture (en%) ....................................................................................... 192 Tableau 17. Nombre d’emplois permanents créés ...................................................................... 192 Tableau 18 : Coût des Investissements (en millions de fCFA)................................................... 192 Tableau 19: Devis quantitatif et estimatif ................................................................................... 198 Tableau20 : Coût des prestations "Appui-Conseil" .................................................................... 199 Tableau 21: Participation aux activités agricoles selon le genre ............................................... 206 Tableau 22 : structure des coûts du projet................................................................................... 211 Tableau 23 : Répartition des coûts par composante.................................................................... 212 Tableau 24 : Echelonnement des dépenses dans le temps (en million Fcfa) .............................. 212 Tableau 25 : Récapitulatif du financement proposé.................................................................... 213 Tableau 26 : Besoin de financement pour l’assistance technique et la formation ................................................................................................................................. 214 Tableau 27: Récapitulatif des systèmes de production et leurs contraintes................................ 216 Tableau 28 : Contraintes au développement de l'irrigation ........................................................ 224

129
INTRODUCTION
Le Mali est de loin le pays du Sahel qui dispose de plus de ressources en irrigation sol et eau.46 Avec près de 2 200 000 ha de terres aptes à l’irrigation, dont plus de 1 800 000 ha dans la seule vallée du fleuve Niger,47 le Mali peut être considéré comme le grenier potentiel de l’Afrique de l’Ouest. Les perspectives du schéma Directeur de l'ON prévoient une extension de 120.000 hectares supplémentaires à l'horizon 2020, ce qui signifierait environ 4.000 hectares par an. Cette perspective paraît très optimiste compte tenu des capacités actuelles d'aménagement qui par expérience, sont limitées à 500 hectares annuels. Cependant le pays offre une large gamme de systèmes d'irrigation liés aux différentes possibilités d'aménagement en fonction de l'hydrographie et de la topographie du pays. Ces systèmes d'irrigation sont généralement caractérisés par l'origine de l'eau, son niveau de maîtrise, le degré d'intensification, les spéculations pratiquées ou encore le mode de faire valoir. Les principaux systèmes d'irrigation (type d'aménagement) couramment utilisés au Mali sont:
- L'irrigation avec maîtrise totale de l'eau (grands périmètres de type Office du Niger, Office du Périmètre Irrigué de Baguinéda, Office Riz Sélingué);
- L'irrigation par submersion contrôlée (aménagements de type Office Riz Ségou, Office Riz Mopti, Projet de Développement de la Riziculture à San, Projet de Développement en Zone Lacustre à Niafunké, Projet de Développement du cercle d'Ansongo à Gao, Projet de Renforcement Organisationnel, Crédit et Aménagement à Macina - ROCAM de CARE Mali, etc.);
- L'irrigation par submersion libre (plaines rivéraines du Bani et du Niger dans les régions du Nord Mali, notamment à Gao et Tombouctou);
- Les périmètres irrigués à maîtrise totale de l'eau (Projet VRES, PPIP, etc.); - L'irrigation en aménagement de bas-fonds (région de Sikasso, Kangaba, etc.); - Les petits et micro-périmètres irrigués privés (1 à 5 ha).
Plusieurs sources d'eau sont utilisées pour l'irrigation au Mali, à savoir l'eau des fleuves Niger et Sénégal et de leurs affluents; l'eau des rivières, marigots et mares; l'eau des lacs (Debo, Korientzé, Fatih, etc.) et oueds ; l'eau des puits et puisards, etc. Cependant, quelque soit la source d'eau utilisée et exceptés le cas des systèmes à irrigation gravitaire, les groupes moto-pompes sont généralement utilisées pour sa répartition dans les parcelles. Dans les conditions actuelles et en année de pluviométrie normale, comme celles des campagnes 1994/95 et 1997/98, la production céréalière du Mali atteint environ 2 500 000 t, cultures pluviales et irriguées combinées. En année de sécheresse sévère, cette production peut tomber à 1 700 000 t.48 Pendant la campagne 1997/98, environ 663 000 t de riz paddy ont été produites sur environ 307 000 ha (soit un rendement moyen de l’ordre de 2 t/ha). Environ trois quarts de cette production totale proviennent de terres ayant fait l’objet d’aménagement.
46 Moris 1987 47 PNUD/GERSAR 1982. 48 Revue du secteur agricole

130
En dépit des difficultés rencontrées dans le sous-secteur de l’irrigation, les cultures irriguées ont joué un rôle prépondérant dans la satisfaction des besoins alimentaires et la diversification de la production agricole, malgré la détérioration croissante des conditions climatiques. Le développement des cultures irriguées a permis ainsi de mieux sécuriser les revenus des producteurs et d’améliorer l’exploitation des ressources dont dispose le pays. Pour les régions du nord notamment, l’irrigation constitue la seule perspective de mise en valeur des terres et de réduction du déficit alimentaire qui les affecte particulièrement. On estime actuellement que 99 % des superficies seraient occupées par des périmètres de taille supérieure à 100 ha, les périmètres de l’Office du Niger représentant à eux seuls un tiers de la superficie totale aménagée. Cette superficie varie cependant considérablement d’année en année, en fonction de la taille des périmètres de submersion contrôlée et des densités de culture pratiquées. Des trois grands types d’irrigation (irrigation de surface, aspersion et goutte-à-goutte), la première est de loin la plus pratiquée au Mali, sous quatre formes : la maîtrise totale, la submersion contrôlée, les bas-fonds et la culture de décrue. La maîtrise totale de l’eau est utilisée avec arrosage par bassins (riz, blé) ou par rigoles (canne à sucre et maraîchage, en partie). La submersion contrôlée et/ou naturelle, sécurisée ou partiellement sécurisée, utilise l’onde de crue du fleuve pour inonder une plaine et cultiver du riz dit de submersion. La culture de décrue, combinée ou non avec la submersion contrôlée, est pratiquée au fur et à mesure que l’eau se retire de la plaine. La maîtrise totale occupe environ 80 000 ha de superficie brute exploitée dont près de 80 % dans la zone de l’Office du Niger, laquelle a un potentiel d’environ 960 000 ha aptes à l’irrigation. L’ON assure actuellement la distribution de l’eau sur environ 65 000 ha, comprenant 55 000 ha aménagés depuis une quarantaine d’années en casiers rizicoles répartis en cinq zones, 4 500 ha de périmètres sucriers dont la gestion est indépendante depuis la réorganisation de l’Office (vers 1984), et des superficies « hors casiers ». La restructuration de l’Office du Niger (intervenue à la fin des années 80) a conduit à la réduction du personnel, à la privatisation de nombreuses activités de l’ON n’ayant pas un caractère de mission de service public et à la mise au point d’instruments juridiques garantissant le développement de la zone de l’ON, notamment, le contrat-plan entre l’Etat, les exploitants et l’ON, ainsi que le décret de gérance fixant les règles d’attribution foncière. Aussi, les nouvelles missions assignées à l’Office du Niger portent sur :
• dans le cadre de la mise en valeur et du développement du delta central du fleuve Niger :
- la gestion de l’eau, - la maintenance des aménagements, - la maîtrise d’ouvrage déléguée pour les études et contrôle des
travaux ;
• dans le cadre du contrat de concession du service public : - la maîtrise d’ouvrage déléguée pour les études et le contrôle des
travaux, - la gérance des terres, - le conseil rural et l’assistance aux exploitants des terres aménagées en
approvisionnement en intrants et matériels agricoles.
131
L’ON représente à lui seul environ 45 % de la production nationale de riz. Son système hydraulique est alimenté à partir du barrage de Markala par rehaussement du plan d’eau du Niger et par dérivation d’un débit de 120 m3/s. La consommation moyenne d’eau atteint 44 800 m3/ha pour la riziculture, 30 000 m3/ha pour les périmètres sucriers et 20 000 m3/ha pour le maraîchage. Avec le programme de réhabilitation en cours49, la consommation d’eau pour le riz d’hivernage pourrait descendre à 15 000 m3/ha. L’esquisse du plan directeur de cette réhabilitation à moyen terme50 prévoit que les ouvrages de base actuels pourraient irriguer une superficie aménagée de 105 000 ha en riz d’hivernage, car le débit pouvant être transmis aux différents systèmes hydrauliques y est estimé à 200 m3/s. Quant aux moyens périmètres à maîtrise totale (100-500 ha) les récentes évaluations ont révélé un coût d’équipement exorbitant (5-7 millions par ha), particulièrement imputable à la digue de protection contre la crue du fleuve. Pour les petits périmètres irrigués villageois (PPIV ou PIV), on ne réalise pas de digue de ceinture ce qui permet de ramener le coût d’aménagement à 2-3 millions de F CFA par ha.51 Les rendements moyens obtenus sur les périmètres à maîtrise totale sont de l’ordre de 3 à 5 t/ha. D’après les estimations faites lors de la Revue du sous-secteur de l’irrigation52, ces périmètres sont localisés :
• dans le haut bassin du fleuve Niger (environ 5 200 ha) ; • dans le Delta Central et la boucle du Niger (environ 76 600 ha) ;
• dans le Mali-Sud (environ 1 000 ha) ;
• dans la vallée du fleuve Sénégal (environ 600 ha).
Selon ces mêmes estimations, il apparaît que la submersion contrôlée et la décrue contrôlée occupent environ 150 000 ha. Il existe différents degrés de sécurisation de la submersion contrôlée, dépendant toujours d’une pluviométrie minimale. La submersion contrôlée sécurisée assure un plan d’eau garanti à 100 % : c’est le cas du casier de Dioro à Ségou avec un plan d’eau assuré à partir du barrage de Markala, où la fréquence de remplissage est évaluée à 0,99. Les aménagements sécurisés avec une fréquence de remplissage inférieure à cette valeur – tels que le casier de Bougoula – Sarantomo près de Djenné – sont des systèmes partiellement ou non sécurisés. La submersion contrôlée est pratiquée dans les plaines annuellement submersibles des régions de Ségou (Opération riz Ségou, ORS, 35 415 ha) et de Mopti (Opération riz Mopti, ORM, 49 190 ha), et dans les mares de la région de Tombouctou. Dans ces casiers, les rendements varient en moyenne de 0,8 à 1,5 t/ha de riz paddy. Comparée à la maîtrise totale, la submersion contrôlée (maîtrise partielle de l’eau) apparaît peu performante, mais comparée à la submersion naturelle, elle représente un progrès en terme de sécurisation de la production. La submersion contrôlée est néanmoins loin d’avoir atteint les
49 En 1998, ce programme a dépassé les 24 500 réhabilités; les travaux de réhabilitation sont réalisés à un rythme de 2 000 ha par an selon des normes techniques homogènes. 50 D’après l’étude réalisée par Sogreah en 1981. 51 Ce résultat peut être ultérieurement amélioré, ainsi que le démontre l’expérience du VRES, où ce coût est descendu à 1,8 millions de FCFA par ha, voire à 600 000 FCFA pour les micro-périmètres . 52 DNGR 1994.
132
performances qu’on en attendait. Les principaux problèmes rencontrés ont été l’appauvrissement des sols et leur envahissement par les adventices et l’irrégularité des crues et des pluies. A partir de 1980, la succession des années de mauvaise pluviométrie et de bas niveaux des crues a aggravé la situation. Cependant, l’abandon généralisé des aménagements de submersion contrôlée à cause du déficit hydrologique et pluviométrique des dernières années serait une erreur, d’autant que les paysans restent toujours attachés à cette technique et qu’elle constitue, par ailleurs, une solution raisonnable à l’amélioration de la production agricole dans certaines zones. Il est à noter, aussi, que l’aménagement en submersion contrôlée est parfois, dans le cas de développement futur des PIV en zone lacustre et dans le delta, une étape intermédiaire pour justifier la construction de la digue de ceinture. La culture de décrue, qui occupe environ 60 000 ha, est pratiquée dans les lacs et mares (lacs Tagadji, Horo, Faguibine, Tanda, mare de Danga, etc.) de la région de Tombouctou. La submersion et la culture de décrue totalisent 65 %, des superficies aménagées. Aussi, ces pratiques sont à réévaluer techniquement et économiquement. Néanmoins, la conversion en maîtrise totale de certains casiers à faible probabilité de remplissage peut être envisagée. Une autre question non moins importante est l’utilisation rationnelle des ressources en sol et eau dans la région de Mopti. Dans cette région, le conflit entre l’élevage et l’agriculture va en grandissant, compte tenu de la croissance démographique, du succès enregistré dans le domaine de la santé animale et de l’augmentation du cheptel liée à l’accroissement de la population dans un système extensif d’élevage. L’irrigation traditionnelle sous forme d’aménagement de bas-fonds, basée sur la culture du riz en variété pluviale ou semi-pluviale, représente environ 2 % de la superficie totale irriguée. Ces bas-fonds sont localisés dans le sud du pays, où la pluviométrie est suffisamment élevée, à savoir : la zone de la CMDT, la zone de la haute vallée du Niger (Koulikoro, Kita) et la région de Kayes (fleuve Sénégal et ses affluents). Pendant la campagne 1993-1994, la CMDT a enregistré une superficie exploitée en riz de 31 000 ha dont 14 000 ha en pluvial et 17 000 ha en bas-fonds. Environ 5 000 ha de bas-fonds ont été aménagés depuis les années 70. Les aménagements ont été appuyés par un grand nombre d’intervenants qui adoptent tous en principe l’approche participative mais avec des règles du jeu pouvant varier considérablement. Ce type d’irrigation est relativement peu coûteux (généralement de l’ordre de 500 000 à 1 000 000 FCFA/ha) mais les rendements restent assez faibles, allant d’environ 1,5 t/ha de paddy en bas-fonds non aménagés à 2,5 t/ha pour les bas-fonds aménagés, du fait d’une mauvaise organisation de la mise en valeur (problèmes d’accès aux facteurs de production). En plus de ces quatre formes principales, de nouvelles techniques émergent, parmi lesquelles on peut citer les petits et micro-périmètres privés périurbains et l’irrigation oasienne. Sur le plan institutionnel, les partenaires au développement et les bailleurs de fonds ont techniquement et financièrement intervenu dans le secteur de l’irrigation, sur la base des différents plans de développement économique qui se sont succédés au Mali. Comme ces plans n’émanaient pas d’une réelle politique nationale de l’irrigation, les différentes interventions au niveau des projets sur le terrain ont été faites de façon autonome et indépendante les unes des autres, tant leurs tutelles changeaient d’un département ministériel à un autre, au gré des bailleurs de fonds ou suivant la façon dont le projet avait été initié.

133
Sur le plan technique, le rythme d’aménagement tenu ces dernières années a été 6 % par an, tandis que les superficies exploitées ont enregistré une baisse annuelle de l’ordre de 3,5 % 53. Deux raisons principales expliquent cette situation :
• l’abandon de certains casiers de submersion contrôlée et de culture de décrue, imputable aux aléas climatiques ;
• une dégradation progressive des réseaux d’irrigation sur les aménagements à maîtrise
totale, notamment sur les PIV, en l’absence d’un entretien courant. Pour ces deux raisons, on estime à plus de 60 000 ha les superficies aménagées et non exploitées présentement. L'étude sur les mécanismes de financement de l'irrigation devra prendre en compte la forte probabilité de voir le Mali excédentaire en riz dans les futures années et se voir contraint à produire de façon plus compétitive pour pouvoir exporter dans la sous-région. I. RAPPEL DES TERMES DE REFERENCE
Selon les Termes de Référence, l'étude sera réalisée dans un délai d'un mois (du 15 Août au 15 Septembre 2004). Le rapport d'étude comprendra trois parties : (1) Une revue de littérature sur le secteur de l'irrigation, la planification et la mise en œuvre de projets d'aménagement hydro-agricole; (2) Leçons apprises des personnes-ressources interviewées et (3) l'analyse de quatre cas d'exemple de projet conformément au plan proposé pour la rédaction du rapport d'étude.
Partie I
Le consultant réalisera une revue de littérature approfondie sur la planification et la mise en œuvre de projets d'aménagement hydro-agricole. Il utilisera pour ce faire la documentation à sa disposition et la complètera, au besoin, par d'autres littératures qu'il pourra trouver. Le rapport comportera le résumé succinct de cette revue de littérature ainsi qu'une liste complète des références. Pour la littérature disponible sur site web, l'adresse du site suffira.
Partie II
Le consultant réalisera des interviews de personnes-ressources expérimentées dans le domaine de la planification et de mise en œuvre de projets d'aménagement hydro-agricole. Il collectera les informations sur les raisons de succès et les causes d'échec, les responsabilités des acteurs et ceci, conformément aux phases et cycles du projet concerné. Il doit faire des recommandations pour amélioration ou proposer des solutions aux cas de succès et d'échec constatés.
Le consultant interrogera les informateurs potentiels suivants (liste non exhaustive) :
(1) les agences gouvernementales (départements de l'agriculture et de l'environnement, les projets et programmes de réalisation des aménagements ainsi que les départements de planification;
(2) les consultants nationaux et internationaux impliqués dans les projets d'aménagement;
53 forte
134
(3) les représentations des principaux donateurs bilatéraux et multilatéraux du sous-secteur de l'aménagement et de l'irrigation;
(4) les institutions nationales de recherche et
(5) les ONG chargées de la mise en œuvre des projets d'aménagement.
Les interviews se feront en deux parties : la première partie sera consacrée à une vue d'ensemble sur la planification et la mise en œuvre des projets d'aménagement, la seconde partie consistera en une description de quelques projets spécifiques. Selon la disponibilité des personnes interviewées, les deux parties de la discussion se feront séparément. Autant que possible, les interrogations se feront sous forme de questions ouvertes afin de pouvoir obtenir des réponses sincères, non pré-formatées. Partie III Le consultant examinera en profondeur quatre cas de projets suivants:
- le Projet Pilote de Promotion de l'irrigation Privée (PPIP), sur financement Banque Mondiale;
- le Projet d'Appui à la Promotion de l'Irrigation à Maninkoura (PAPIM), sur financement de la Banque Africaine de Développement;
- le Projet de Développement de la Zone Lacustre (PDZL), sur financement du Fonds International de Développement de l'Agriculture;
- le Projet Valorisation des ressources en Eaux de Surface (VRES), dans le cadre du Programme d'appui à la filière riz, sur financement de l'Union Européenne.
Cette partie sera traitée à la lumière de la documentation disponible (études de préfaisabilité, documents de projet, rapports d'activités, rapports de supervision, rapports d'évaluation, rapports de mission et rapports de fin de projet). L'analyse sera complétée par des interviews de personnes-ressources. Des interviews seront aussi réalisées avec les acteurs impliqués dans les projets au niveau local (équipes de projet, bénéficiaires). II. LA STRATÉGIE NATIONALE D'IRRIGATION AU MALI (SNDI) Comme l’a dit le Directeur Général de la FAO en 1996, le grand défi du XXIè siècle sera celui de la capacité de chaque nation à nourrir son peuple. Le Mali devra relever ce défi et, mieux, satisfaire une partie des besoins en céréales de la sous-région. Ceci exige une utilisation beaucoup plus efficience des ressources dont le pays est doté. Cependant, les investissements dans le secteur de l’irrigation ont jusqu’ici fait l’objet d’interventions séparées et généralement non concertées et n’ont pas toujours produit les résultats attendus, en termes de viabilité et pérennité. Le grand nombre des structures sous-sectorielles d’appui et la diversité de leurs moyens humains et financiers militent en faveur d’une uniformisation des modalités d’actions, spécialement dans l’optique de la décentralisation administrative et technique, dans le but d’élaborer une stratégie cohérente pouvant aider aux prises de décision dans le cadre d’une politique nationale en irrigation, et même en matière générale d’utilisation de l’eau. Aussi, le potentiel apte à l’irrigation du Mali appelle à une valorisation économique conformément aux orientations en matière de croissance accélérée, de développement agricole et de lutte contre la pauvreté arrêtées par le gouvernement. Selon les études faites à ce jour, le Mali serait relativement bien pourvu en terres cultivables. Une étude du Projet d’inventaire des ressources terrestres (PIRT) permet de dresser le panorama général suivant : superficie totale 124 millions ha, dont 74,8 millions d'ha de déserts ; 5.5 millions ha de
135
forêts ; 43,7 millions ha (35 %) utilisables pour l’agriculture et l’élevage. Les terres aptes à l’irrigation, sous réserve d’aménagement, ont été classées en neuf régions hydrauliques dont le potentiel est estimé à 2 200 000 ha. Le système hydrographique du Mali est constitué par les bassins du Haut Sénégal et du Niger Moyen. Les cours d’eau permanents sont concentrés exclusivement au sud et au centre du pays, alors que le nord se caractérise par la présence de nombreuses vallées fossiles. Le fleuve Niger est l’un des plus grands fleuves d’Afrique ; d’une longueur de 4 200 km, dont 1 700 km au Mali, il draine un bassin de 1,5 millions km², dont plus de 300 000 km² au Mali. La crue saisonnière est alimentée de façon irrégulière par les pluies d’hivernage ; le maximum de cette crue se situe en septembre-octobre à Bamako, fin octobre à Mopti, décembre à Kabara (Tombouctou) et fin janvier à Gao. Les grands aménagements existants sur le fleuve Niger et ses affluents sont : le barrage de Sélingué sur le Sankarani (affluent du fleuve Niger), le barrage de Sotuba et le barrage de Markala sur le Niger. La propagation des débits s’effectue entre Koulikoro et Kirango (Markala) avec d’importants débordements et prélèvement par l’Office riz Ségou en période de crue et par l’ON toute l’année. A la fréquence 0,95 au dépassement, les volumes écoulés par le Niger et le Bani sont de l’ordre de 20-25 milliards de mètres cubes dont un bon tiers est perdu par évaporation dans le delta et la zone lacustre.54 Le fleuve Sénégal est constitué principalement par le Bafing, le Bakoye et la Falémé. Les débits du fleuve sont contrôlés en grande partie par le barrage de Manantali, sur le Bafing. Le volume du barrage de Manantali approche 12 milliards de m3, dont 7,85 milliards de m3 constituent la tranche utile. L’Organisation pour la mise en valeur du fleuve Sénégal (OMVS), qui regroupe le Mali, la Mauritanie et le Sénégal, gère les eaux du bassin de ce fleuve. Dans le cadre des accords OMVS, le barrage de Manantali doit garantir un débit minimum de 300 m3/s, dont 200 m3/s pour l’agriculture, sur lesquels 45 m3/s sont réservés à l’agriculture malienne55. Les ressources du Mali en eaux de surface non pérennes n’ont pas fait l’objet d’inventaire exhaustif. Le nombre d’aménagements existants serait de l’ordre de 300, dont environ 250 ouvrages fonctionnels, en particulier dans le pays Dogon, petits barrages pour la plupart. Par ailleurs, l’ensemble des réserves en eau souterraine représenterait un volume de 2 720 milliards de m3 avec une recharge annuelle de 55 milliards de m3/an,56 dont la plupart en zones sud et sud-ouest du pays où les forages sont difficiles et coûteux et la pluviométrie annuelle supérieure à 700 mm/an. L’exploitation actuelle des eaux souterraines est d’environ 106 millions m3/an, dont les prélèvements sur les forages et les puits modernes représentent près de 21 millions m3/an, soit 20 % de l’exploitation totale, le reste provenant de puits traditionnels. Les consommations actuelles en eau du secteur de l’irrigation sont de l’ordre de 3,5 milliards de mètres cubes (25 000 m3/ha) presque entièrement sur une période de sept mois (du 1er juin au 31 décembre), ce qui semble laisser une grande marge pour des extensions. La situation est cependant moins favorable qu’il n’y paraît. Les contraintes et limitations liées à l’exploitation de ces ressources en eau peuvent être résumées comme suit :
• irrégularité du régime pluviométrique et hydrologique et donc du débit des fleuves et rivières ainsi que de la recharge annuelle des nappes ; il est à noter, en particulier,
54 SCETAGRI-GERSAR 1985 55 De récentes estimations, qui seront confirmées en fin 1999 lors de la finalisation de l’étude de gestion du barrage de Manantali, font apparaître un débit disponible en saison sèche d’au plus 200 m3/sec en saison sèche. 56 DNHE/PNUD 1989
136
que depuis vingt ans environ, la pluviométrie moyenne du Mali a diminué de 15 à 20 % par rapport à la période cinquantenaire précédente ;
• difficultés de localisation des aquifères par rapport aux sites d’utilisation (le taux
d’échec atteint parfois 30 %) et faibles débits unitaires (moins de 5 m3/h pour la plupart des forages) ;
• coût d’exhaure et des ouvrages de retenue d’eau de surface en moyenne très élevé ;
et exploitation coûteuse des eaux souterraines ;
• la consommations en contre-saison, bien que faibles, surviennent à une période où les débits des fleuves et les niveaux dans les barrages de retenue sont faibles ;
• le Niger est une rivière internationale et le Mali est dépendant des barrages envisagés
en Guinée, tout en devant laisser des volumes d’eau suffisants aux pays situés en aval.
Même en construisant les seuils de Talo et Djenné sur le Bani ainsi que le barrage de Tossaye et tout en améliorant l’efficience de l’irrigation pour diminuer la consommation à 19 000 au lieu de 25 000 m3/ha, le potentiel irrigable dans le bassin du Niger serait d’environ 500 000 ha seulement si on ne veut pas diminuer les volumes d’eau arrivant au Niger en aval de plus de 30 %. De cette superficie totale, environ 230 000 ha avaient été aménagés en 1994, sur lesquels 170 000 ha étaient effectivement exploités, 60 000 ha environ ayant été abandonnés du fait de la baisse des crues et du mauvais entretien. Dans la zone soudanienne, l’irrigation ne représente qu’un appoint à l’agriculture pluviale, tandis que dans la zone sahélienne la faiblesse des pluies ne peut être compensée que par une bonne maîtrise des ressources en eau, surtout celles du delta intérieur du Niger. Cette zone constitue l’essentiel du domaine irrigué au Mali.
2.1 Les opportunités de développement
Parmi les opportunités les plus intéressantes de développement des cultures irriguées au Mali, sont à souligner :
• l’existence d’un important potentiel de ressources en eau et en sols non encore exploitées, et la forte demande en aménagements, insatisfaite en particulier dans les régions du nord ;
• la priorité que le gouvernement accorde à la sécurisation de la production agricole
par l’irrigation ;
• l’existence d’une tradition de la pratique des cultures irriguées (maîtrise des techniques de production, notamment la riziculture, par les exploitants des zones irriguées) et l’engouement des producteurs (communautés rurales et secteur privé entrepreneurial) ainsi que l’intérêt des bailleurs de fonds pour le développement du secteur ;
137
• la mise en route de la dynamique de décentralisation administrative autorisant des initiatives autonomes et une responsabilité plus grande au niveau local ;
• un marché local et régional très porteur pour plusieurs spéculations culturales,
compte tenu de la libéralisation des prix et des coûts de production observés ;
• l’existence de gisements de productivité dans les zones où l’eau n’est pas un facteur limitant.
2.2. Les programmes d’irrigation en cours On compte actuellement au Mali plusieurs projets intéressant l’irrigation utilisant l’eau de surface (fleuve Niger, lacs et mares, bas-fonds). Les principaux d’entre eaux sont :
• Programme National des Infrastructures Rurales (PNIR); • Programme Spécial de Sécurité Alimentaire appuyé par la FAO (PSSA) ;
• Projet de Gestion des Ressources Naturelles (PGRN) ;
• Projet de Promotion de l’Irrigation Privée (PPIP) ;
• Projet de Valorisation des Ressources en Eau de Surface (VRES) ;
• Programme d’aménagement de 30 000 ha (1998-2002) ;
• Projet de Développement Intégré en Aval de Manantali (PDIAM) ;
• Projet de Développement du Cercle d'Ansongo dans la région de Gao (PRODECA) ;
• Projet Moyen Bani (PMB).
Une analyse approfondie de certains de ces projets ou programmes est faite dans la partie III du rapport.
2.3. Analyse des principales contraintes au développement de l’irrigation
La première contrainte au développement de l’irrigation au Mali est l’inégale répartition des ressources en eau entre les vallées du Niger et de ses principaux affluents et défluents (et, à un moindre degré, la vallée du Sénégal où les ressources en sols sont cependant limitées) et le reste du pays où l’eau de surface est rare et les eaux souterraines coûteuses à mobiliser. Les solutions adoptées devront tenir compte de cette inégalité et les critères de choix ainsi que d’appui de l’Etat devront être adoucis pour les zones difficiles. Les autres contraintes avec leurs causes ainsi que les moyens d’y remédier sont récapitulées dans le tableau 28 en Annexes du document.
138
2.4. Besoins en superficies aménagées Comme antérieurement mentionné, la situation actuelle donne près de 230 000 ha de superficies aménagées ou en cours d’aménagement, dont 170 000 ha exploités. Pour la riziculture, on a estimé à l’horizon 2010 un besoin additionnel de l’ordre de 260 000 t, soit 400 000 t de paddy. En supposant que 25 % de cette production additionnelle provienne de l’amélioration de la productivité sur les aménagements existants, les besoins en nouveaux aménagements correspondent à une superficie supplémentaire d’environ 75 000 ha (dont 30 000 ha en 200257). En ce qui concerne le blé, pour couvrir entièrement les besoins nationaux estimés à 50 000 t/an soit 90 000 t/an de blé, tout en maintenant le rendement actuel, la superficie à aménager serait de 45 000 ha sur un potentiel d’environ 100 000 ha de terres aptes à la culture du blé en VIè région. Sur cet objectif, 3 000 ha seront aménagés d’ici à l’an 2002 et 10 000 ha d’ici 2005 dans le cercle de Diré.
2.5. Objectifs fondamentaux et principes directeurs de la stratégie
La mise en œuvre des ambitions affichées antérieurement devra se traduire par l’adoption d’une stratégie visant les objectifs fondamentaux suivants :
• la recherche de la sécurité alimentaire, qui passe forcément par une sécurisation durable de la production agricole dont la composante pluviale reste soumise aux aléas climatiques dans les zones méridionales et centrales, alors que, dans les régions du nord, l’irrigation constitue de plus en plus la seule alternative possible de mise en valeur agricole des terres ;
• l’amélioration de la situation nutritionnelle des couches particulièrement fragiles de
la population, en l’occurrence les enfants et les femmes ;
• les économies de devises, par la réduction des importations alimentaires et le développement plus marqué des exportations agricoles ;
• l’accroissement des revenus des populations rurales ;
• la réduction des phénomènes migratoires internes et externes et la non diminution du
peuplement dans les zones arides et semi-arides. Pour atteindre les objectifs énoncés ci-dessus, la mise en œuvre de la SNDI s’inspirera des principes directeurs suivants :
1. Redéfinition du rôle des intervenants dans le sous-secteur de l’irrigation 2. Appropriation du processus d’identification, de mise en place et de gestion des
investissements par les bénéficiaires. 57 D’après le Programme d’aménagement de 30 000 ha en zone ON (1998-2002).

139
3. Définition d’une politique d’investissement. 4. Priorité à la maîtrise totale de l’eau 5. Gestion optimale et durable des aménagements 6. Intensification et diversification de la culture irriguée 7. Valorisation de la riziculture de bas-fonds 8. Promotion de l’irrigation individuelle 9. Formation des formateurs et des paysans dans le domaine de l’irrigation 10. Mise en place d’un programme minimum de recherche et expérimentation en irrigation 11. Réalisation des études de connaissance du sous secteur de l’irrigation
2.6. Redéfinition du rôle des intervenants dans le sous-secteur de l’irrigation Le partage de responsabilité entre les différents intervenants dans le sous-secteur – à savoir, d’une part, les services de l’Etat pour les missions publiques de suivi et de coordination et, d’autre part, l’Etat et les autres partenaires pour les autres aspects – implique une définition claire des rôles. Cette redéfinition devra porter sur les aspects suivants :
• la clarification des attributions des différentes structures publiques impliquées dans le sous-secteur de l’irrigation, notamment les services étatiques déconcentrés et les Comités Techniques de Développement (CTD) ;
• le recentrage des activités des services publics autour des missions de maîtrise d’ouvrage et
de contrôle de conformité des projets aux normes de conception à établir ;
• l’affirmation du rôle de coordination des activités des autres intervenants par la structure centrale de l’Etat chargée de l’irrigation, à savoir la Direction Nationale de l'Aménagement et de l'Equipement Rural (la DNAER).
2.7. Appropriation du processus d’identification, de mise en place et de gestion des investissements par les bénéficiaires
Les interventions appuyées dans le domaine de l’irrigation se feront sur la base de l’expression de la demande des communautés ou groupements bénéficiaires ou des investisseurs privés. Le traitement de cette demande tiendra essentiellement compte de l’existence et de la qualité des ressources physiques (eau et sol), du potentiel agricole et du contexte socio-économique et environnemental local, ainsi que des données relatives au marché, afin de déterminer la faisabilité technique, environnementale et sociale des aménagements et d’en assurer la rentabilité économique et la pérennisation, tout en respectant les choix des producteurs.
2.8. Définition d’une politique d’investissement
Participation des bénéficiaires aux investissements La nouvelle politique d’investissement doit tenir compte des différentes catégories d’infrastructures, de leur caractère collectif ou individuel. Le principe directeur de l’appropriation des interventions
140
par les bénéficiaires exige la nécessité d’une participation significative de ceux-ci aux coûts d’investissement, dans une mesure qui ne saurait néanmoins excéder la réelle capacité financière des communautés. Dans le domaine des investissements collectifs, l’Etat devra soutenir les initiatives de base, en prenant en charge les infrastructures considérées d’intérêt général et dont le coût dépasse manifestement la capacité financière des communautés et organisations paysannes bénéficiaires. Cette participation doit être modulée en fonction des spécificités agro-écologiques, sociales et économiques de chaque zone. On envisage des modalités distinctes de participation des bénéficiaires aux investissements, correspondant essentiellement à trois catégories de périmètres irrigués :
• Les périmètres communautaires: Ceux-ci ne seront réalisés qu’à la demande des communautés ou groupements de producteurs. Ils seront caractérisés par une conception simple et par un système d’exploitation maîtrisable de façon autonome par les bénéficiaires. Une forte participation de ceux-ci à la conception du périmètre et à l’exécution des travaux d’aménagement sera également une condition indispensable. Néanmoins, la plus grande partie des investissements sera à la charge de l’Etat, notamment pour ce qui concerne les aménagements sur le réseau primaire, secondaire et tertiaire, ainsi que certains travaux de dessouchage et nivellement dépassant la capacité physique des bénéficiaires. Ceux-ci prendront en charge tout le travail à la parcelle et, nonobstant cet apport initial, demeureront redevables pour le service d’entretien du réseau, voire pour le remboursement d’une fraction des coûts d’aménagement.
• Les périmètres privés : Ces périmètres seront exploités par des entrepreneurs privés. Les
coûts d’aménagement seront conjointement pris en charge par l’Etat et les entrepreneurs intéressés dans un rapport qui fera l’objet de négociation ultérieure. La politique de l’Etat consistera à subventionner partiellement les investisseurs privés avec des ressources propres.
• Les périmètres en location-vente : il existe actuellement une forte demande de la part de
jeunes, de partants volontaires à la retraite, d’intégrés de la rébellion, etc. pour s’installer dans le secteur de l’exploitation agricole irriguée. La contrainte fondamentale pour ces catégories demeurant le manque de moyens financiers, on envisage que l’Etat aménage entièrement des périmètres irrigués sur lesquels seraient par la suite installés les exploitants. Le recouvrement partiel des investissements consentis se fera moyennant le paiement d’un loyer (fixé suivant des critères à établir). Les recettes correspondantes alimenteront un fonds national qui devra permettre la réalisation de nouveaux aménagements (cf. ci-après).
Création d’un fonds national d’aménagement hydro-agricole (FNAHA) L’une des contraintes majeures au développement accéléré de l’irrigation au Mali étant la difficulté de mobilisation des ressources financières nécessaires, on envisage la mise en place d’un Fonds national d’aménagement hydro-agricole (FNAHA). L’objectif de ce fonds est d’assurer un financement complémentaire du développement de l’irrigation en plus de celui apporté par les bailleurs de fonds. Son statut, sa structuration et sa mise en place feront l’objet d’une étude approfondie dans le cadre de la mise en œuvre du PNIR. Sans

141
anticiper sur les conclusions de cette étude sur le FNAHA, qui s’inspirera des expériences d’autres fonds (p. ex. : fonds routier et forestier), la faisabilité de plusieurs hypothèses d’alimentation pourra être examinée, notamment :
• un emprunt national, ; • une partie des redevances des périmètres communautaires ; • le loyer des périmètres en location-vente ; • une taxe foncière éventuelle dans le cas des périmètres privés.
Autres démarches prioritaires En plus des approches d’investissement ci-dessus évoquées, le relèvement du rythme d’aménagement nécessite la réalisation d’un certain nombre d’actions prioritaires complémentaires, à savoir :
• la constitution d’un portefeuille de projets dans le cadre du PNIR ; • l’allégement des procédures administratives de passation des marchés d’études et de travaux
par la création d’une agence autonome chargée de la maîtrise d’œuvre et d’ouvrage déléguée (AGETIER).
Mesures de réduction du coût des travaux d’aménagement L’implication des PMI/PME nationales dans les travaux d’aménagement, grâce à :
i) un système d’allotissement des travaux (le système actuel exclut pratiquement les entreprises nationales) ;
ii) l’appui à la formation d’entreprises artisanales de creusement de forages et puits à faible
coût ainsi que de construction et d’entretien des petits équipements pour l’irrigation ;
iii) la promotion d’une entreprise de leasing de matériel de travaux publics. Priorité a la maîtrise totale de l’eau L’impératif d’une valorisation intensive du potentiel irrigable impose une orientation prioritaire des investissements vers la maîtrise totale de l’eau, technique qui offre d’amples possibilités de diversification. Dès lors, dans le cadre d’un programme d’investissements axé sur la viabilité économique et la participation d’acteurs que l’Etat aux coûts d’aménagement, il apparaît que l’option de la submersion contrôlée (à plus forte raison celle de la décrue), caractérisée par des résultats agronomiques modestes et tributaires des aléas hydro-climatiques, ne saurait être justifiée que dans des conditions particulières qu’il sera essentiel d’évaluer au cas par cas, en particulier lorsque cette option est hautement sécurisée, lorsqu’il n’y a pas d’alternatives, ou encore lorsqu’elle est un préalable à l’irrigation en maîtrise totale. Gestion optimale et durable des aménagements La politique d’aménagement et de mise en valeur devra être rénovée et les efforts s’orienter vers des techniques d’irrigation à coûts modérés et économiquement rentables, maîtrisables par les bénéficiaires et susceptibles d’être gérées durablement.

142
La gestion rationnelle et durable des ressources sols/eau dans le domaine de l’irrigation est devenue une impérieuse nécessité compte tenu de la croissance démographique très rapide qui se traduit par une très forte pression sur les ressources. Elle passe par une meilleure connaissance du secteur de l’irrigation. A cet effet, des documents normatifs sur la conception et la gestion des périmètres devront être élaborés. De même devront être établis des schémas d’aménagement des terroirs et des bassins fluviaux. Le code de l’eau et le code foncier qui sont des textes indispensables à une gestion rationnelle et équitable des ressources naturelles sol/eau doivent être élaborés ou améliorés pour les adapter aux situations locales. On veillera également à minimiser les impacts négatifs globaux de l’irrigation, en particulier sur la santé, et la pollution diffuse. Valorisation de la riziculture de bas-fonds Ce système d’irrigation représente environ 2 % de la superficie totale irriguée du pays. Les aménagements de bas-fonds sont localisés dans le Sud du pays où la pluviométrie est suffisamment élevée à savoir la zone CMDT, la zone Haute Vallée du Niger (Koulikoro et Kita) et la région de Kayes (fleuve Sénégal et ses affluents). On estime à 300 000 ha ce potentiel. Ces aménagements constituent un véritable espace de diversification culturale où on cultive en priorité le riz, la patate douce, la pomme de terre et le maïs, etc. Cette technique consiste à réduire l’écoulement des eaux de surface et les eaux souterraines par la réalisation d’une digue souterraine (tranchée rebouchée avec l’argile compactée) surmontée d’un barrage de faible hauteur (moins d’un mètre) et percée d’une ou plusieurs vannes. Le but est de favoriser au maximum l’infiltration des eaux en amont afin de faire remontrer la nappe phréatique. La mise en eau du bas-fond en amont de l’ouvrage se trouve ainsi mieux assurée permettant de sécuriser la production rizicole en hivernage et d’engager la production de contre saison du fait du ralentissement de l’eau et de l’assèchement des bas-fonds. Environ 5 000 ha de bas-fonds ont été aménagés depuis les années 1970. Les aménagements ont été appuyés par un grand nombre d’intervenants qui adoptent tous les principes de l’approche participative mais avec les règles du jeu pouvant varier considérablement. Ce type d’irrigation est relativement peu coûteux (généralement de l’ordre de 500 000 à 1 000 000 FCFA à l’hectare) mais les rendements restent assez faibles allant de 1,6 t/ha de paddy en bas-fonds non aménagés à 2,5 t/ha pour les bas-fonds aménagés du fait d’une mauvaise organisation de la mise en valeur (difficulté d’accès aux facteurs de production). Compte tenu des avantages de ce type d’aménagement, on peut espérer que l’aménagement de 10 % du potentiel soit 30 000 ha pourra être inscrit dans les prochains programmes nationaux d’irrigation. Promotion de l’irrigation individuelle Les deux expériences de promotion de l’irrigation privée individuelle ou familiale qui sont en cours au Mali – à savoir le projet ATI de promotion de pompes à pédales s’adressant aux agriculteurs pauvres et aux femmes et le Projet de Promotion de l’Irrigation Privée (PPIP) s’adressant aux agriculteurs aisés – continueront d’être promues. Là où elle est possible techniquement, la pompe à pédales, qui permet d’irriguer presque 0,5 ha de cultures maraîchères si le niveau de l’eau est à moins de 7 m de profondeur, constitue un stade intermédiaire avant de passer à des systèmes plus performants, comme les motopompes, mais aussi plus coûteux. On soutiendra les essais de pompes à pédales pour puits profonds.

143
Le PPIP est un projet pilote d’assistance technique en appui au développement de la petite irrigation privée – notamment en zone périurbaine mais incluant aussi les petits périmètres aménagés par des particuliers, les PPIV et les bas-fonds – dans le district de Bamako et dans les régions de Koulikoro, Ségou et Sikasso et une partie de la région de Mopti. Les objectifs du projet sont d’accroître :
i) les connaissances des petits producteurs privés en matière de techniques d’irrigation et de gestion de micro-entreprises ;
ii) leur capacité à identifier des opportunités rentables d’investissement en infrastructures et
équipement d’irrigation ainsi qu’à préparer des requêtes de financement aux institutions de crédit ;
iii) la compétence de ces institutions à évaluer lesdites requêtes ;
iv) la disponibilité des producteurs à assumer le coût des services fournis par le projet, ainsi
que la capacité du secteur privé de pourvoir régulièrement ces mêmes services après la conclusion du projet.
L’Agence pour la promotion des filières agricoles (APROFA), créée en 1995 par la Chambre d’agriculture du Mali (CAM) afin d’assurer l’exécution du Projet d’appui à la valorisation et à la commercialisation des produits agricoles (PAVCOPA), est agence d’exécution du PPIP. L’APROFA assure les services d’appui-conseil technique et d’assistance légale et administrative aux producteurs. Formation des formateurs et des exploitants dans le domaine de l’irrigation Il est capital d’envisager la formation, d’une part, des cadres chargés de la conception et de la gestion des périmètres irrigués et, d’autre part, celle des exploitants des périmètres. Le projet PPIP a prévu ainsi de former les bureaux d’études, les artisans réparateurs, les commerçants et les irrigants aux techniques de petite irrigation individuelle. Il faudra étendre ce projet aux régions où n’intervient pas le projet PPIP et aux domaines de l’irrigation collective, en particulier à la conception participative des projets et à la gestion collective des aménagements. Le centre d’expérimentation du matériel agricole et des systèmes d’irrigation qui a été créé en vue de tester les équipements modernes performants, pourra constituer un lieu de formation des irrigants et des étudiants intéressés par l’irrigation. La formation doit aussi porter sur la minimisation des risques environnementaux et sociaux liés à l’irrigation. Cette formation doit toucher aussi bien les décideurs, les agents des ministères, les bureaux d’études que les exploitants avec des modules adaptés à chacune de ces catégories. Mise en place d’un programme minimum de recherche et expérimentation en irrigation A part le projet sol/eau/plante conduit par l’IER et qui a déjà pris fin, et les Besoins en eau (BEAU) et Gestion en eau (GEAU) de l’Office du Niger des débuts des années 1980, aucune recherche en irrigation n’a plus été entreprise au Mali. Des recherches sur les matériels adaptés à l’irrigation individuelle ont été entreprises par le PPIP (essais de pompes à pédales pour puits profonds, de forages à faible coût, tests de motopompes) mais ce n’est pas suffisant.
144
Il est impérieux de mettre en place un programme de recherche notamment concernant les aspects suivants :
i) suivi et analyse de performance de certaines normes d’irrigation ; ii) besoins en eau de diverses plantes et dans diverses conditions d’irrigation (sol, ETP et
systèmes d’irrigation différents) ;
iii) coût des aménagements, notamment coût de digues de berges et rationalité du revêtement des canaux d’irrigation ;
iv) analyse économique et financière comparative des systèmes d’irrigation, etc.
Le séminaire régional sur la petite irrigation tenu en décembre 1998 à Ouagadougou, au Burkina Faso, a recommandé la création de centres régionaux d’expérimentation et de démonstration des équipements d’irrigation. La DNAER disposait, à Samanko, d’un centre d’étude et d’expérimentation en machinisme agricole (CEMA)58, avec des terres aménageables pouvant servir à des fins de recherche. Ce centre peut donc être restructuré à cet effet dans le cadre de la mise en œuvre de la SNDI. Il serait également bon de relancer la recherche sur l’élevage irrigué, peut être en activant la station de recherche de Mopti. Réalisation des études de connaissance du sous secteur Les études suivantes sont prévues :
• étude pour l’inventaire des ressources (sol/eau) et l’établissement des schémas directeurs zonaux d’aménagement ;
• étude pour l’inventaire des superficies aménagées (en le mettant sur support informatique
pour permettre un suivi dynamique des réalisations afin de mieux orienter les investissements).
• études socio-économiques approfondies sur les moyens et petits périmètres en fonction des
concepts retenus ;
• étude d’évaluation de la demande potentielle en petits/moyens périmètres irrigués, afin de contribuer à l’identification d’objectifs quantitatifs réalistes ;
• identification, sur la base des résultats des deux activités précédentes, des critères de
sélection des zones d’intervention prioritaires du programme d’investissement ;
• études ciblant l’établissement d’un référentiel technique homogène pour la conception, réalisation et gestion des AHA, développées avec l’appui financier du programme
58 Actuellement transféré à l'IER

145
d’investissement ; ces études ont pour but de dégager les éléments essentiels à retenir pour la rédaction du Manuel d’opérations du PNIR (Composante petite/moyenne irrigation) ;
• étude d’un système centralisé de suivi-évaluation des interventions du programme
d’investissement, visant la capitalisation des expériences progressivement acquises ;
• enquête/recensement des opérateurs potentiellement qualifiés pour exercer le rôle d’organisme d’accompagnement/parrainage dans le cadre de la mise en œuvre de projets collectifs d’AHA selon une démarche participative (ONG, bureaux d’études, entreprises privées, etc.) ; ce recensement devra constituer la base d’un système efficace et permanent de suivi-évaluation des performances de ces opérateurs ;
• étude approfondie sur le foncier avec comme objectif l’appropriation foncière dans le
domaine de l’aménagement hydro-agricole.
• étude sur le code de l’eau (revoir sur la base de l’ancien code la normalisation et la moralisation des prélèvements effectués pour l’irrigation).
• étude sur le coût des AHA en général et des PPIV en particulier, en mettant un accent sur
l’incidence de la digue de protection contre la crue sur le coût de mise en place (dans la vallée du fleuve Niger) ;
• étude sur tous les aspects environnementaux liés aux aménagements hydro-agricoles ;
• étude sur les redevances ;
• études des filières de valorisation des productions des zones inondables ;
• étude et mise au point d’un outil de conseil de gestion des activités de production réalisées
dans les zones inondables ;
• étude sur le système de financement de l’irrigation.
2.9. Plan d’actions pour la mise en œuvre de la stratégie
La réalisation des objectifs fondamentaux de la SNDI, en cohérence avec les principes directeurs retenus, passe par la mise en œuvre d’un plan d’actions dans lequel les objectifs spécifiques suivants sont ciblés :
• Rationaliser la conception des aménagements et réduire les coûts de mise en place • Faciliter l’accès aux financements et encourager l’implication d’acteurs autres que l’Etat
• Améliorer la gestion des aménagements hydro-agricoles
• Accroître la production et la productivité sur les périmètres irrigués
146
• Reformer le cadre législatif et institutionnel sous-sectoriel
• Minimiser les impacts environnementaux négatifs et les conflits sociaux engendrés par le
développement de l’irrigation.
2.10. Articulation de la stratégie sous-sectorielle de l’irrigation avec les politiques sectorielles nationales
Il est essentiel de rappeler que la SNDI doit s’inscrire dans le cadre des autres politiques et stratégies nationales définies par le Gouvernement malien en vue d’assurer un développement socio-économique durable du pays (politique macro-économique, décentralisation, politiques sectorielles de santé, d’éducation, de transport, d’énergie, politique environnementale, schéma directeur des ressources en eau), ou être en conformité avec celles-ci. Stratégie de croissance accélérée En 1997, dans le but de réduire substantiellement, à moyen et long termes, la pauvreté au Mali, le gouvernement a décidé de mettre en œuvre une politique volontariste capable d’accélérer la croissance économique, augmenter les revenus des populations et assurer une meilleure distribution de la richesse créée. Pour ce faire, il est prévu d’entreprendre à la fois des actions globales et d’ordre macro-économique et des mesures de politique sectorielle appropriées pour relancer les secteurs clés de l’économie. La stratégie de croissance accélérée élaborée à cet effet par le gouvernement a retenu des axes d’intervention à moyen terme qui doivent permettre, pour le secteur agricole, de réaliser l’objectif particulier d’assurer largement la sécurité alimentaire du pays à l’horizon 2010 et au-delà, à travers l’accroissement de la production des principaux produits agricoles en vue de satisfaire la demande (besoins humains, industriels et exportation) et l’amélioration de la compétitivité des produits concernés. Les axes de croissance seront orientés dans les directions suivantes :
• amélioration des infrastructures et équipements de base et de production (irrigation, réseaux des pistes rurales et agricoles, mécanisation, électrification rurale, infrastructures et équipements de conservation et de transformation des produits) ;
• augmentation des productions végétales et animales à travers le renforcement des
capacités du monde rural et l’aide à l’émergence d’un secteur productif moderne, orienté essentiellement vers l’approvisionnement des marchés urbains et régionaux en céréales, fruits et légumes, produits de l’élevage, produits sylvicoles, piscicoles, etc.
La SNDI constitue un des principaux instruments de mise en œuvre de la stratégie de croissance accélérée. Stratégie de lutte contre la pauvreté En 1998, le Gouvernement malien a décidé de faire de la lutte contre la pauvreté l’axe central de son approche de promotion du développement humain durable. La stratégie élaborée à cet effet

147
constitue donc le cadre principal de référence pour rendre les programmes sectoriels cohérents entre eux, en se concentrant sur l’objectif clé qui est la lutte contre la pauvreté. En ciblant les groupes vulnérables et leur environnement socio-économique, la stratégie de lutte contre la pauvreté privilégie une approche à la fois sectorielle et transversale pour mieux saisir les dimensions de la pauvreté. Elle propose des actions novatrices qui s’attaquent aux causes profondes de la pauvreté et renforcent les capacités des pauvres à tirer profit des opportunités offertes par l’environnement physique, économique, social et culturel. Les axes stratégiques prioritaires retenus dans la stratégie, concernant particulièrement le secteur agricole, sont les suivants :
• améliorer l’environnement économique, politique, juridique, social et culturel en faveur des pauvres ;
• promouvoir les activités génératrices de revenus et l’auto-emploi à l’intention des pauvres ;
• améliorer l’accès des pauvres aux services financiers et aux autres facteurs de production ;
• promouvoir le développement et améliorer les performances des filières agro-alimentaires dans lesquelles sont concentrés les pauvres.
Les actions retenues et qui intéressent la SNDI sont, entre autres :
• faciliter l’investissement dans les filières agricoles vivrières et d’exportation, notamment en favorisant le développement de l’initiative privée dans les créneaux générateurs d’emplois et de revenus (promotion d’activités à haute intensité de main d’œuvre, programme de soutien à l’investissement privé) et en poursuivant le désengagement de l’Etat des activités de production ;
• améliorer les infrastructures de base des régions à haut potentiel agricole ; • adopter des politiques appropriées permettant une redistribution équitable des
richesses nationales ; • soutenir le développement de la petite irrigation et de l’agriculture de contre-saison
en vue de promouvoir des activités génératrices de revenus et d’emplois à l’intention des pauvres ;
• améliorer l’accès des plus pauvres à la terre, aux intrants, aux autres facteurs de production et aux services financiers ;
• mettre en place un cadre de gestion transparente des terres irriguées ; • promouvoir la petite irrigation villageoise et les aménagements hydro-agricoles
privés dans les zones déficitaires et à forte concentration de pauvres. Politique nationale de protection de l’environnement Le but de la PNPE est d’engager le gouvernement et l’ensemble des intervenants à intégrer la dimension protection de l’environnement dans toute décision touchant la conception, la planification et la mise en œuvre des politiques, programmes et activités de développement. Ses objectifs globaux sont, entre autres :
• assurer la sécurité alimentaire et la fourniture d’autres produits en quantité et qualité suffisantes, à travers une gestion durable des ressources naturelles renouvelables ;

148
• préserver/protéger et améliorer le cadre de vie de l’ensemble des citoyens, notamment en luttant contre toute forme de pollution et de nuisance ;
• développer les capacités nationales d’intervention aux niveaux national, régional et local, et promouvoir la participation de tous à l’œuvre de protection de l’environnement.
Les objectifs spécifiques intéressant le sous-secteur de l’irrigation se résument comme suit :
• dans le domaine de la gestion des ressources naturelles et de la protection de l’environnement en milieu rural :
- développer et appuyer la mise en œuvre d’une gestion décentralisée et
participative des ressources naturelles et renouvelables, - appuyer les différentes collectivités territoriales, les organisations et
associations de producteurs, les ONG et autres partenaires de la société civile afin qu’ils jouent pleinement leur rôle dans la gestion des ressources naturelles et la protection de l’environnement,
- promouvoir des systèmes de production agricole durables et des méthodes d’exploitation respectueuses de l’environnement,
- élaborer et appuyer la mise en œuvre de programmes participatifs de gestion des ressources naturelles, à travers les schémas régionaux d’aménagement du territoire et les plans de gestion des terroirs villageois, en vue de réduire les effets de la dégradation, de la désertification et/ou de la sécheresse.
• dans le domaine des mesures institutionnelles et législatives :
- mettre en place un cadre institutionnel approprié en vue d’assurer la coordination, le contrôle et le suivi de la mise en œuvre de la PNPE,
- harmoniser les lois et règlements en vigueur, élaborer les textes juridiques et réglementaires nécessaires, et définir les normes en matières d’environnement dont les normes de rejet,
- rendre obligatoires les études d’impact environnemental (EIE) et mettre en place une procédure d’EIE comme préalable à tout nouvel investissement.
A cet effet, les articles 6, 7 et 8 du Décret N. 99-189/P-RM du 05 Juillet 1999 portant institution de la procédure d’EIE, stipulent que tout aménagement de plus de 10 hectares en République du Mali doit être précédé au préalable d’une étude d’impact environnemental (EIE) et nul ne peut entreprendre l’exécution d’EIE sans au préalable déposer un projet approuvé par l’administration compétente qui élabore les TDR relatifs à l’étude indiquée.
• dans le cadre de la coopération internationale : - veiller au respect de la mise en œuvre des diverses conventions,
accords et traités internationaux signés et ratifiés par le Mali dans le domaine de la protection de l’environnement,
- développer des programmes de coopération sous-régionale et
internationale en matière de gestion des ressources partagées (eaux, terres, etc.).

149
La mise en œuvre de la PNPE implique nécessairement la prise en compte de la dimension environnementale non seulement lors de la conception de la SNDI, mais aussi et surtout pendant sa phase de mise en œuvre. Pour cela il s’agira de se référer aux différents programmes d’action élaborés suite à l’adoption de cette politique, à savoir :
• au niveau national : les programmes d’action nationaux comme le Programme d’aménagement du territoire, le Programme de gestion des ressources naturelles (PGRN), le Programme national de maîtrise des ressources en eau, le Programme d’amélioration du cadre de vie, le Programme de développement des ressources en énergie nouvelles et renouvelables, le Programme de gestion de l’information sur l’environnement, le Programme IEC en environnement, le Programme de suivi de la mise en œuvre des conventions et le Programme de recherche sur la désertification et la protection de l’environnement ;
• au niveau régional et local : les programmes d’action régionaux (PAR) et locaux
(PAL). Politique de décentralisation Elle a pour objectifs :
• l’approvisionnement du processus démocratique qui repositionne formellement la société civile et l’Etat dans leurs responsabilités et rôles respectifs ;
• la promotion du développement régional et local, en favorisant l’émergence
d’initiatives au niveau des différents acteurs de la société civile et l’avènement d’un développement maîtrisé par les populations elles-mêmes ;
• la refondation de l’administration publique autour de ses missions régaliennes.
Au plan politique, la décentralisation permet la prise en charge par les populations de la gestion de leurs propres affaires. Cela implique un transfert de pouvoir à des organes élus et un redimensionnement de l’appareil d’Etat, la responsabilisation des populations se faisant à travers une définition claire des compétences et des moyens d’action des Collectivités Territoriales Décentralisées (CTD)59. Au plan économique, la décentralisation entraîne une démultiplication des centres de décision et de gestion de la vie économique. D’une situation où l’Etat était le principal agent économique, on passera à celle où il partage ce rôle avec les CTD et les secteurs privé, associatif et communautaire. L’Etat devra donc se désengager progressivement de plusieurs domaines d’intervention qui devront être pris en charge par ces acteurs, tout en facilitant leurs rôles respectifs. Par conséquent, les interventions administratives devront être modulées sur les pratiques économiques et sociales. Outre les compétences, les transferts de l’Etat aux collectivités concerneront les ressources (humaines et financières) et le patrimoine mobilier et immobilier, en vue de responsabiliser
59 Il s’agit des structures décentralisées définies par la Loi 93-12 AN/RM.

150
pleinement ces collectivités dans la conception, la programmation et la mise en œuvre des activités de développement économique, social et culturel de leurs aires géographiques. Tout en veillant à assurer la mission de tutelle et de contrôle, le redimensionnement de l’appareil d’Etat se fera en tenant compte des compétences et des ressources transférés aux collectivités, d’une part, et en déconcentrant ses services, d’autre part, afin de rechercher une meilleure cohérence entre ses interventions et celles des collectivités pour une gestion et un aménagement harmonieux du territoire national.
Conformément aux dispositions du code des collectivités (Loi 95-034)et de la Loi 96- 050, les collectivités sont responsables de la gestion, de l’aménagement, de la conservation et de la sauvegarde de leur territoire. Dans un tel contexte, l’accès aux ressources et leur contrôle constituent l’enjeu primordial. Par ailleurs les populations seront appelées à concilier les prélèvements sur leurs ressources et la capacité de reconstitution des stocks, surtout face à des situations d’urgence qui incitent à intensifier la pression sur ces ressources.
En plus de ces aspects institutionnels de la politique nationale de décentralisation, la SNDI est concernée par le cadre opérationnel de sa mise en œuvre, à savoir l’Esquisse du Schéma d’Aménagement du Territoire (ESAT, 1995) et les Avant-Projets des Schémas Régionaux d’Aménagement et de Développement (AP-SRAD, 1997). Ces outils, après leur finalisation, doivent confèrent à la planification du développement économique une dimension territoriale, dans le cadre d’une organisation de l’espace prenant en compte les exigences qui découlent de la décentralisation. Les éléments fondamentaux de la politique de l’irrigation devront être pris en compte lors de la finalisation de ces outils.
Un autre aspect à considérer dans la politique de décentralisation réside dans la réflexion en
cours sur les pratiques et les outils de planification locale et communale, vus du côté des paysans, des CTD ou des autres intervenants du développement. L’important pour la SNDI sera que la réflexion permette de transformer la planification locale en véritable outil de changement, partant d’abord des dynamiques villageoises ou associatives pour qu’on puisse ensuite examiner comment ces orientations remontantes peuvent rejoindre les orientations nationales ou régionales (descendantes).
La SNDI, en s’inscrivant dans cette logique de décentralisation, se propose d’être au service
des populations en leur donnant des repères qui n’enferment pas leur créativité et leurs initiatives dans un cadre de planification rigide.
III. RESULTATS DES INTERVIEWS
151
3.1. Résultats des entretiens avec les bailleurs de fonds et les services techniques Concernant la vue d'ensemble sur les projets d'aménagement hydro-agricole, il ressort des interviews réalisées qu'il était opportun de les réaliser au moment où ils l'ont été. Cependant, certaines règles de précaution n'ont pas été observées ou ont été tout simplement ignorées. En effet, les études socio-économiques de faisabilité ainsi que les études d'impact environnemental qui devaient précéder la mise en œuvre de grands projets d'aménagement hydro-agricole des années 1970, n'ont pas été effectuées pour la plupart au Mali. Il s'agit entre-autres du cas des grands aménagements de submersion libre ou contrôlée en zones Office Riz Ségou et Office Riz Mopti. De même les populations n'ont nullement été impliquées à aucune des phases de ces projets. On réalisait à l'époque des aménagements "clé-à-main" qu'on livrait aux populations une fois réalisés en supposant que cela suffisait pour résoudre leur problème alimentaire. On mettait ensuite en place une équipe technique composée de fonctionnaires de l'Etat, chargée de la collecte des redevances, de la gestion des périmètres, de la maintenance et du fonctionnement durable des infrastructures. Les populations bénéficiaires étaient organisées, de gré ou malgré elles par l'équipe du projet qui gérait aussi tous les litiges et avait la latitude de désigner les attributaires ou retirer la terre, sans obligatoirement associer les bénéficiaires. Ceux-ci à leur tour se jugeaient comme étant spoliés de leurs terres par l'Etat et ne se considéraient aucunement responsables des terres qu'ils exploitaient. Ils se limitaient tous juste à exploiter la terre et à payer régulièrement la redevance, sans pour autant s'investir entièrement et de façon durable sur les parcelles qui leur ont été attribuées. Les financements se faisaient sur prêts contractés à long terme par le Mali auprès de bailleurs individuels, au plan bilatéral ou multilatéral, en fonction des orientations politiques du moment... Les limites des aménagements "clé-à-main" s'étant révélées au grand jour, la tendance actuelle est à l'association des populations depuis les phases initiales des projets d'aménagement jusqu'à leurs mises en oeuvre. Ainsi on privilégie l'avis des populations depuis le montage des projets. Elles participent à la mise en œuvre des projets en consentant elles aussi des investissements (prise en charge d'un certain pourcentage des financement par la fourniture de main d'œuvre ou même avec la contribution financière directe des collectivités décentralisées, etc.). De cette façon, elles se sentent plus concernées par les investissements et oeuvrent pour leur durabilité. C'est le cas actuel en zones Office Riz Ségou et office Riz Mopti, en zone PDZL, etc. où il existe une franche collaboration avec les producteurs dans les attributions et retraits des terres, le recouvrement et la gestion des redevances et l'entretien des infrastructures hydro-agricoles. Quant au financement, il est assuré dorénavant par des groupes de bailleurs de fonds. Les bailleurs de fonds privilégient de plus en plus cette approche et n'acceptent de s'engager dans la réalisation des investissements de grande envergure que si l'Etat malien, le principal concerné, et d'autres bailleurs acceptent de partager le risque. C'est le cas actuellement pour le FIDA qui n'accepte de financement d'aménagement hydro-agricole que si d'autres bailleurs sont associés. C'est ainsi que pour le financement du PDZL, on note la présence du FIDA, du Mali, de la BOAD et du fonds belge de survie. Actuellement un financement BID est en préparation dans la zone. En ce qui concerne le choix des équipes de projets, il se fait maintenant de commun accord entre l'Etat malien et les bailleurs de fonds. L'approche privilégiée est la mise en place d'équipes légères de pilotage des projets. Ainsi, en plus du coordinateur du projet, on fait appel à un responsable financier (gestionnaire-comptable); un spécialiste en aménagement (génie rural); un responsable de volet formation; un responsable de suivi-évaluation; une secrétaire; un chauffeur et un gardien. Le personnel-cadre est choisi sur appel d'offre ouvert et après approbation des résultats par les bailleurs de fonds. Les coordinateurs de projets et les principaux cadres qui, auparavant étaient fonctionnaires de l'Etat détachés à cet effet et bénéficiant de primes (souvent dérisoires) des projets, sont actuellement recrutés entièrement par les projets. Ils peuvent ainsi démissionner de la fonction publique pour pouvoir travailler dans les projets. Ceci permet de mieux les rémunérer, de les responsabiliser davantage et de les encourager à mieux gérer les deniers des projets. Quant au cas

152
spécifique du choix du coordinateur, certains bailleurs de fonds que nous avons interviewé, soulignent ne pas exercer de pression afin d'influencer la décision de l'Etat. Cependant ils remarquent que le fonctionnaire choisi par l'Etat pour assurer le montage du projet pendant la phase de conception, même s'il est compétent et peut en assurer la coordination future, peut être remplacé au dernier moment au profit d'un autre sans aucune raison officielle valable. C'est la raison pour laquelle les bailleurs de fonds privilégient la procédure d'appel d'offre pour le recrutement des cadres. Quant à l'exécution des activités des projets, elle est généralement confiée à des prestataires de services : ONG, bureaux d'études, consultants indépendants, etc., sur la base d'appels d'offres officiels ouverts à tous. Des contrats sont dûment établis avec les adjudicataires et leurs paiements définitifs ne sont faits qu'après approbation de leurs résultats par la coordination du projet et/ou les bailleurs de fonds. Des contrats ou conventions sont également signés avec les services techniques de l'Etat pour la prestation de services spécifiques dépassant la compétence de privés (surveillance de la conformité des travaux avec les normes en vigueur, recherche et développement, protection de l'environnement, vulgarisation, santé et assainissement, etc.). Pour le cas spécifique des aménagements hydro-agricoles, il faut noter que c'est la Direction Nationale de l'Aménagement et de l'Equipement Rural (DNAER) qui a dans son mandat le contrôle technique des infrastructures et doit être associé par les projets à toutes les phases des travaux d'autant plus que ses démembrements (DRAER, SLACAER60) sont opérationnels sur toute l'étendue du territoire national. Cependant, les projets sont libres d'engager des bureaux privés ayant la compétence technique pour assurer la surveillance des travaux d'exécution des infrastructures, mais cette procédure est aussi soumise à un appel d'offre ouvert. Dans la pratique, il faut remarquer que les services techniques de l'Etat même s'ils possèdent les compétences techniques, sont le plus souvent en manque de moyens logistiques et financiers. De ce fait les projets, afin de respecter les procédures, prennent en charge le déplacement et les perdiems des agents de l'Etat, ce qui peut nous amener à douter de la transparence dans les rapports fournis par ces derniers… A leur tour, les responsables des services techniques interviewés soutiennent que très peu de projets d'aménagement associent directement les directions nationales à leurs activités depuis la phase de montage et préfèrent traiter, une fois le projet fonctionnel, avec les démembrements des services techniques dans les régions ou localités même si les compétences "pointues" peuvent y faire défaut. Les directions nationales ne sont associées, selon elles, que quand les projets rencontrent des difficultés techniques sérieuses qu'ils ne parviennent pas à surmonter ou quand ils sont en situation d'urgence par rapport au planning de leurs activités. Les consultants internationaux sont également choisis par les coordinations des projets pour des études spécifiques, sur appels d'offres internationaux et après approbation par les bailleurs de fonds. Il s'agit là d'études ou de missions faisant appel à la compétence internationale. De l'avis des personnes interviewées, cette procédure se passe généralement bien et dans la transparence.
3.2. Résultats des entretiens avec les responsables de projets et certains consultants seniors De l'avis de la majorité des interviewés, toutes les phases sont critiques dans le cycle d'un projet d'AHA61. Cependant les phases les plus importantes selon eux sont la phase de montage
60 Direction Régionale de l'Aménagement et de l'Equipement Rural; Service Local d'Appui-Conseil, Aménagement et Equipement Rural. 61 Aménagement Hydro-Agricole.
153
(conception) et la phase test du projet. Tout projet d'AHA doit de prime abord émaner des bénéficiaires du projet. Autrement dit la volonté réelle d'aménagement doit venir (sans aucune influence préalable) des bénéficiaires eux-mêmes. La finalité des projets d'AHA est leur appropriation par les bénéficiaires et si ceux-ci n'ont pas été associés à la phase de conception des projets ils ne se sentiront aucunement concernés par les résultats à atteindre et développerons naturellement par la suite un esprit "d'assistés permanents". Malheureusement beaucoup de projets d'AHA ont été implantés au Mali en ignorant l'avis des bénéficiaires. Les concepteurs ont jugé que de toute façon "ces projets ne peuvent être que bénéfiques pour eux". De même la majorité des projets ont été conçus sans phase test préalable. La phase test est celle pendant laquelle on peut juger de l'opportunité d'implantation ou non d'un projet. C'est la phase pendant laquelle des correctifs peuvent être apportés si possible ou envisager l'abandon pur et simple du projet s'il n'est pas pertinent dans l'atteinte des résultats qu'il va générés. Ceci permet d'économiser des ressources qui pourront être utilisés dans des projets plus opportuns et dont les bénéficiaires et le pays peuvent tirer profit. La tendance actuelle des bailleurs de fonds, surtout la Banque Mondiale, est d'instituer obligatoirement une phase test préalable au financement de tout projet d'aménagement. Les projets d'AHA sont donc demandés d'abord par les bénéficiaires qui informent le Gouvernement (à travers les services techniques déconcentrés de l'Etat ou les collectivités locales décentralisées). Ces projets doivent obligatoirement faire partie des plans de développement locaux des collectivités concernées qui réalisent avec l'appui des services déconcentrés une ébauche d'étude de faisabilité. L'étude de pré-faisabilité ainsi réalisée est soumise au Gouvernement qui, s'il juge opportun, commandite des études plus approfondies (études socio-économique, technique, environnementale). Le bailleur de fonds est ensuite saisi par le Gouvernement pour la mise en place du financement du projet. Les projets ayant suivi une telle procédure sont généralement opportuns et donnent de bons résultats. La seule difficulté dans cette procédure est que les collectivités n'ont souvent pas assez de moyens financiers pour financer les premières études ou sont peu compétentes pour réaliser de telles études. Les services techniques devant réaliser ces études sont eux aussi démunis en moyens financiers et logistiques. De ce fait beaucoup de projets restent à cette étape d'ébauche d'idée ou sont très mal montés et n'arrivent pas sur la table du Gouvernement. L'apport qu'on peut faire ici c'est de renforcer les capacités des élus locaux. La décentralisation administrative ayant offert des opportunités de réalisation de recettes fiscales aux collectivités, celles-ci ont besoin pour ce faire de renforcement de leurs capacités techniques. La participation des services techniques déconcentrés à la préparation des projets doit être vivement encouragée. Les compétences techniques existent au sein de ces services mais ce sont les moyens logistiques et financiers qui font le plus souvent défaut. Cette participation des services techniques permettra d'intégrer les cas d'études de projets des collectivités les plus démunies et de réduire en général les coûts de conception des projets d'AHA en milieu rural. Parmi les projets étudiés, le cas de réussite le plus cité est le projet de Valorisation des Ressources en eaux de Surface (VRES) dont la conception a présenté une originalité par rapport aux autres projets. La réussite du projet VRES tient du fait que les populations bénéficiaires ont été au début et à la fin des deux phases du projet. Pendant l'étude bilan/diagnostic des systèmes de crédit en zone VRES et proposition d'actions dans le cadre du 8ème FED62, les consultants notaient la phrase suivante qui, selon les bénéficiaires, traduisait au mieux le bien-être amené dans la zone grâce au projet: "Avec le projet VRES, même les ânesses qui ne mettaient plus bas depuis quelques années ont toutes des rejetons maintenant".
62 Etude réalisée par Coulibaly B. S.; Keita M. S. et Touré S. M. M.
154
Même si le projet VRES a eu des difficultés dans la réalisation de certaines de ses composantes, toutes les études d'évaluation du projet constatent qu'il a conduit à un accroissement substantiel de la production agricole (riz, maraîchers) ainsi que des rendements dans sa zone d'intervention et a permis à plusieurs égard de fixer les populations dans leurs terroirs d'origine. Par contre le cas le plus patent d'échec cité est le cas du Projet de Promotion de l'Irrigation Privée (PPIP). Un des indicateurs de mesure de cet échec est que le projet a connu plus de trois coordinateurs différents de la première à la deuxième phase du projet. Les bailleurs de fonds soutiennent que l'idée du projet était très bonne mais que c'est surtout la mauvaise gestion et l'inefficacité dans la mise en œuvre des composantes qui sont à la base de cet échec. Par contre les coordinations successives soulignent que ce sont plutôt les procédures internes de gestion des projets par la Banque Mondiale qui est à l'origine des échecs63. Tout d'abord ils expliquent que le projet devait être indépendant, au lieu d'être lié comme composante à un à un autre projet financé par l'USAID qu'était l'APROFA64 ayant des objectifs différents. Ce qui rendait les procédures de coordination très compliquées. De même la procédure de décaissement adoptée par la Banque Mondiale était, selon eux, contraignante et peu efficace. En effet, sur un financement de plus de deux milliards cent millions de francs CFA, seuls soixante millions étaient octroyés par décaissement par la Banque Mondiale et il fallait justifier totalement l'utilisation de ces fonds avant de solliciter un autre décaissement. Certains cadres ayant suivis ce projet remettent aussi en cause la petitesse de taille des exploitations financées pendant la première phase, ce qui, selon eux, rendait inefficace les actions et malgré tout, cette taille était exigée par la Banque Mondiale… Malgré cela, les personnes interviewées sont unanimes sur le fait que la promotion de l'AHA au Mali passe obligatoirement par la promotion de la petite irrigation (privée ou communautaire). Dans le cas d'autres projets tels que le PDZL, les résultats sont jugés mitigés. Au début du projet (à sa première phase) la bonne pluviométrie et des crues favorables ont permis pendant les premières années de réaliser de bonnes productions. Dès que les années de déficit pluviométrique ont commencé à alterner avec les "bonnes années" et avec l'insécurité due à la rébellion armée au Nord du Mali, on a remarqué une chute brutale de la production agricole et des cas de "non-récolte". Dans la phase actuelle du projet, avec le retour de la paix dans le septentrion malien, on est entrain de chercher à réellement sécuriser les aménagements de submersion contrôlée existants et de mettre l'accent sur les petits périmètres irrigués alimentés par des motopompes qui permettent d'assurer deux fois par an la production agricole (hivernage et contre-saison). Le cas du projet PAPIM est un cas spécifique car il s'agit de l'irrigation gravitaire à partir du Sankarani (affluent du Niger) et donc la maîtrise de l'eau est totale et la production assurée bon an mal an. La phase I de ce projet vient de démarrer il y a juste un an et il est assez tôt pour se prononcer sur la réussite ou non du projet. Cependant on peut constater que les populations ont été associées dès le début du projet et que celui-ci est né des cendres d'un projet précédent dans la zone qu'était le Projet "Office de développement de la Riziculture à Sélingué (ORS)". En ce qui concerne les indicateurs de mesure des performances des projets ils sont fixés initialement depuis la phase de conception du projet. Généralement ce sont des indicateurs objectivement vérifiables et que le système de suivi-évaluation mis en place devrait permettre d'en savoir l'état à tout moment du projet. Il s'agit par exemple de l'accroissement de la production réelle; l'accroissement des rendements; les bénéficiaires directs et indirects du projet; le nombre de producteurs formés et à quelles formations; l'impact des formations reçues; l'impact du projet sur 63 Le rapport d'achèvement du projet PPIP souligne que la performance générale de la Banque Mondiale a été insatisfaisante (P.17, 3ème paragraphe du rapport) 64 Agence de Promotion des Filières Agricoles au Mali

155
l'environnement, etc. Ces critères peuvent différés d'un projet à l'autre en fonction des objectifs initiaux fixés au départ. Cependant en pratique, certains responsables de projets admettent que le volet suivi-évaluation des projets constitue une réelle problématique dans la mesure où, en fonction des consultants, les indicateurs de suivi varient énormément. Ils constatent en outre qu'il n'existe pas de formation académique spécifique en suivi-évaluation et ceux qui sont généralement recrutés comme cadres de suivi-évaluation sont soit des socio-économistes, soit des agro-économistes qui ne parviennent pas à termes à maîtriser cette composante. Il y a donc une nécessité de formation de ces cadres en suivi-évaluation et d'harmonisation des approches et indicateurs, surtout pour les projets d'AHA qui s'inscrivent dans la même optique. Selon l'avis de plusieurs spécialistes interviewés, il serait opportun de ne plus baser la composante renforcement des capacités du personnel au sein des projets. La recherche d'une plus grande efficacité supposerait d'en faire une composante externe. En effet, ceci permettrait au bailleur de planifier la formation du personnel des projets (ce qui est une nécessité) et de mieux contrôler l'exécution de cette composante qui est, hélas, souvent négligée. L'Etat malien dispose d'une politique cohérente en matière d'aide extérieure et la coordination est bien assurée au niveau du Gouvernement. Une Cellule de coordination existe pour ce faire au niveau du Ministère des affaires étrangères qui coordonne toutes les aides destinées au Mali. Par ailleurs il faut noter que des initiatives nationales existent en matière de renforcement des capacités dans le domaine de la planification et de l'implantation de projets d'AHA. Cependant ces initiatives concernent plutôt les cadres des collectivités locales décentralisées (Assemblée régionales, Conseils de cercles, Conseils communaux et Mairies). Il s'agit là des initiatives du Gouvernement appuyé en cela par certains bailleurs de fonds (la SNV, la GTZ, l'AFD, la Banque Mondiale, l'USAID, etc.) visant à renforcer les capacités techniques des collectivités locales à la conception et à l'application de plans de développement locaux; à la gestion locale des collectivités concernées, etc. Des projets existent parmi lesquels on peut citer l'Agence Nationale d'Investissement des Collectivités Territoriales (ANICT); le Projet d'Appui aux Initiatives de Base (PAIB), etc. Quant à la formation des cadres des services techniques de l'Etat, elle relève généralement de chaque département ministériel qui prend en charge la formation et le recyclage de ses cadres et ceci, le plus souvent avec l'appui financier ou technique des bailleurs de fonds de ces départements. En ce qui concerne la motivation des cadres compétents à rester dans le pays, de plus en plus de personnes pensent que les cadres qui s'expatrient ne sont pas totalement perdus pour leurs pays. Ils gagnent plutôt de l'expérience et du savoir-faire qui peuvent servir à leurs pays d'origines quand ils décideront d'y retourner. On cite pour cas d'exemple les scientifiques et intellectuels de la diaspora africaine en Occident qui reviennent périodiquement en Afrique, avec le soutien de la Banque Mondiale, offrir des formations et animer des fora de discussions autour de thèmes liés au développement. De même l'apport financier de ces cadres à leurs pays d'origine n'est pas aussi à négliger dans la mesure où des statistiques sur l'immigration au Mali montrent qu'étant à l'extérieur, les cadres expatriés continuent à assurer la subsistance de leurs milieux d'origine par des envois de devises. Pour encourager les cadres à revenir dans leurs pays d'origine il faut d'abord leur assurer des conditions favorables de départ pour ceux qui prennent la décision de s'expatrier. Ceci ne pourrait que les inciter davantage au retour. De même certaines personnes interviewées font allusion à la récente initiative du Nigéria qui, afin de faire revenir ses cadres compétents au pays, a décidé de leur octroyer le triple du salaire d'un cadre local de même grade… Cet exemple peut servir de leçon à des pays comme le Mali. En ce qui concerne les cadres nationaux n'ayant pas pris la décision de s'expatrier, le système d'évaluation annuelle interne tel que pratiqué dans certains départements doit être généralisé. Cependant on ne doit pas seulement se limiter à l'avancement sur la grille de la fonction publique en

156
cas de performance, mais aussi et surtout au versement de primes d'incitation (pour les EPA) ou d'aide au logement pour d'autres catégories de fonctionnaires, ou d'autres formes d'incitation, etc. En termes d'exemple d'approche participative réussie dans le domaine de l'AHA en milieu rural c'est surtout le cas de Bewani, en zone Office du Niger qui est cité comme cas de réussite. En effet, la main d'œuvre pour l'aménagement de la plaine de Bewani a été fournie entièrement par les populations bénéficiaires elles mêmes et l'aménagement a été réalisé avec l'assistance technique sino-malienne. Même si la superficie octroyée par participant bénéficiaire est jugée de petite taille, cela a permis de recaser beaucoup de paysans sans terre qui se sentent aujourd'hui entièrement responsables de leur aménagement. Actuellement Bewani présente le taux de densité de population le plus élevé en zone office du Niger. Cet exemple est en voie de duplication dans d'autres localités du pays et d'autres pays pourront également s'en inspirer. L'assistance apportée par les bailleurs de font à différents niveaux de réalisation de projets d'AHA est jugée globalement positive même si certaines critiques sont faites. En effet, les bailleurs de fonds interviennent souvent avec des perceptions différentes et changeantes. A titre d'exemple la Banque Mondiale privilégie les projets générateurs de profit privé et a des procédures de décaissement des fonds octroyés souvent difficiles à suivre. Elle pose des conditionnalités d'accès aux prêts et aux financements et se réserve le droit de mettre fin à sa participation en cas de changement politique non souhaité… L'USAID octroie ses financements en raison de sa philosophie du moment. C'est ainsi qu'il y a trois à quatre ans, ce sont les activités en aval de la production (transformation, conditionnement et commercialisation) qui étaient financées par l'USAID. Actuellement, on est revenu vers le financement d'activités de production (riziculture, appui à la production de semences, etc.). Quant à la coopération néerlandaise, c'était le secteur agricole (zone ON) qui était privilégié dans les financements octroyés. Actuellement, les efforts de cette coopération vont vers la santé, l'assainissement, l'éducation, la lutte contre la pauvreté. Les financements de la coopération française sont jugés multiple et variés mais restent "très politisés" et dépendent non seulement de la capacité de négociation du Gouvernement donataire du moment mais aussi et surtout de l'orientation politique du Gouvernement français en place. La coopération allemande quant à elle, depuis quelques années se concentre sur le renforcement des capacités et l'appui aux systèmes financiers décentralisés. La FAO jouit d'une bonne réputation mais ses financements sont jugés lents à mettre en place et plusieurs requêtes, pour être réglées, doivent être adressées obligatoirement à la coordination régionale à Accra ou au siège à Rome. Cette multiplicité d'approches et de philosophie de financement fait que les gouvernants sont obligés "de se plier" à la volonté de certains bailleurs de fonds, même si ceux-ci ne répondent pas toujours au programme prioritaire de leur gouvernement. Les projets d'AHA étant des projets de long terme et qui ont besoin de financements stables et à décaissements réguliers, ne peuvent aboutir à des résultats probants que s'ils sont conçus à la demande des populations, en dehors de toute influence politique. Les procédures de décaissement des fonds octroyés par certains bailleurs doivent être facilitées et le contrôle de gestion instauré à tout moment jugé opportun par le bailleur. Il faut noter que c'est surtout l'USAID et les coopérations néerlandaises, allemande et canadienne qui prennent des initiatives nationales de renforcement des capacités. Ces initiatives sont jugées très efficaces et certains projets tels que le PAIB et l'ANICT ont donné de bons résultats. Afin d'assurer une collaboration plus étroite des bailleurs de fonds avec les acteurs locaux pendant les phases de planification et d'implantation des projets, il faudrait qu'un ou quelques représentants du bailleur participent aux missions de terrain pendant ces phases. L'exemple de la FAO à travers

157
son Programme Spécial de Sécurité Alimentaire (PSSA) est un bon exemple dans la mesure où les bénéficiaires ayant rencontré plusieurs fois certains représentants ou missions de la FAO depuis la phase de conception, une confiance mutuelle s'est vite instaurée et les cas de conflits ou de litiges concernant les AHA réalisés sont vite réglés dès qu'un des représentants du bailleur se présente. Les cadres nationaux quant à eux déplorent que les bailleurs de fonds ne s'intéressent généralement à eux que pendant la phase de montage du projet. Une fois le projet monté et le coordinateur choisi, il n'y a généralement plus de concertation. La mise en place d'un véritable cadre de concertation entre le bailleur de fonds et tous les cadres nationaux ayant servi au montage du projet, même s'ils ne sont pas recrutés par la suite, devrait permettre d'assurer un suivi plus efficace et d'apporter au moment opportun les rectificatifs qu'il faut pour la bonne marche du projet et son appropriation par les populations et le Gouvernement. Les directives prônées par les bailleurs de fonds, notamment la FAO et la Banque Mondiale, sont généralement suivies en matière d'AHA au Mali. Ces directives sont jugées pertinentes et sont d'ailleurs reprises dans les grandes lignes de la politique de développement rural du Mali telles que inscrites dans le SDDR, la SNDI, le CSLP, etc. Ces directives sont aussi traduites en termes d'indicateurs de succès des projets d'AHA.
IV. ETUDE DE CAS
4.1. Projet de Valorisation des Ressources en Eaux de Surface (VRES)
4.1.1. Présentation et mise en oeuvre du projet
A la différence des nombreux projets restés très directifs, l'approche retenue par le VRES pour l'aménagement et la mise en valeur de ses périmètres se fonde depuis son démarrage sur une très large participation des groupements paysans à tous les stades et niveaux d'intervention. L'objectif explicite est que chaque périmètre puisse se prendre en charge aux plans techniques et de gestion dès la 2ème année, soit après 1 ou 2 cycles culturaux1. Il convient donc de responsabiliser les producteurs dès le démarrage de l'intervention, avec une participation intensive à la réalisation des aménagements et à la formation des comités de gestion, tous deux conçus comme une condition d'accès à l'aide. On présente d'abord les apports respectifs de chaque partie et les diverses étapes opérationnelles que suit le projet dans la mise en œuvre de son approche. On décrit ensuite rapidement les avantages et les contraintes des divers types proposés d'aménagement. On compare enfin la démarche du VRES aux approches que développent les principaux projets intervenant dans la région. Les apports respectifs des groupements et du projet peuvent se synthétiser comme suit : Au niveau du groupement - Mise à disposition d'un site ;
1 Un hivernage + une éventuelle contre saison.
158
- Formation d'une association pré-coopérative, centrée sur l'organisation d'un comité de gestion et d'un comité de surveillance;
- Participation aux sessions d'alphabétisation et de formation à la gestion (le groupement prenant en charge la construction d'une salle de cours en banco);
- Participation en nature et en travail à la réalisation des aménagements et du magasin. Au niveau du projet - Identification du site ; - Etudes préalables ; - Conseils techniques pour la mise en valeur du périmètre et des outils de gestion; - Financement des formations : alphabétisation fonctionnelle des membres des groupements,
formation spécialisée des membres des comités de gestion et surveillance; formation technique des pépiniéristes et des moto - pompistes (…);
- Participation aux travaux d'aménagement, avec mise à disposition auprès des groupements du petit outillage nécessaire à l'entretien du périmètre;
- Financement à 100% du GMP, avec ses accessoires; - Financement à 100% des intrants destinés aux deux premiers cycles de mise en culture:
semences, engrais, gas-oil, huile, stock de pièces détachées, etc. Ainsi au delà de la 1ere année, chaque groupement assume de façon autonome les principales fonctions liées à la gestion technique et financière du périmètre et de ses équipements. Il se charge donc de l'achat des intrants, de la collecte de la redevance et de la commercialisation des produits2 . Il se charge également lui-même de l'entretien de l'aménagement en intrant ou la structuration des organisations inter-périmètres. La démarche opérationnelle Les différentes étapes concrètes Ces principes fixés, le projet suit une série d'étapes, dont le contenu et les apports peuvent légèrement varier suivant les situations et l'ONG chargée de la mise en œuvre de la démarche sur le terrain. De même, l'approche s'est allégée au cours de la deuxième phase du VRES, ce qui a permis une réduction des coûts et des délais de mise en œuvre. Identification et choix du site
Au démarrage du projet, centré sur les petits périmètres villageois d'environ 30 ha (PIV), le choix des sites se faisait en 3 temps : - Une prospection par le projet, visant à retenir des sites favorables à l'aménagement: proximité
du fleuve, situation pédologique favorable, absence de conflit foncier explicite; - Une étude socio-économique (réalisée par un consultant), pour confirmer l'intérêt des villageois
et la faisabilité de l'aménagement; - Une étude topographique et pédologique permettant de retenir définitivement les sites
d'aménagement. 2 Les groupements se chargent en fait de la commercialisation dès la 1ere récolte
159
La cellule-projet montait ensuite des petits dossiers d'aménagement, soumis à l'administration pour approbation avant leur réalisation sur le terrain. Cette phase relativement lourde a été simplifiée dans la deuxième phase du VRES, qui s'est de fait concentrée sur les aménagements de taille plus réduite : les MIG de 5 à 8 ha et les micro-périmètres privés de moins de 2 ha (les PEIF). Cette simplification ne tient pas seulement à la réduction des surfaces et de la taille des groupements. Elle tient aussi à la maîtrise croissante par le milieu et le projet des contraintes imposées par les aménagements1. Désormais, les groupements demandeurs remplissent une fiche de renseignements, précisant leur identité, la situation (géographique, foncière et hydraulique) du site proposé, les cultures envisagées, les modalités d'organisation du groupe (avec la structure du comité de gestion et le nom des responsables). Ils s'engagent à respecter les conditions d'octroi du GMP fixées par le VRES, dont la plantation de boisement, la réalisation d'autres cultures que le riz, la participation aux séances de formations, la construction d'un magasin en banco (…). L'approbation du chef de village et des autorités administratives (chef d'arrondissement) est requise, afin de prévenir d'éventuels litiges fonciers pouvant intervenir après l'aménagement. Ces fiches, d'abord soumises aux ONG présentes sur le terrain, sont ensuite transmises à la cellule-projet, qui procède à la sélection des sites à aménager. Préparation des travaux
Des travaux topographiques simplifiés (une 1/2 journée de terrain par MIG) sont ensuite réalisés par un prestataire de service. Ces travaux consistent en une levée altimétrique, levée topographique en bordure du fleuve, à la réalisation du profil en long de la tête morte et à l'implantation des bornes de délimitation. A partir de ces données, l'équipe-projet (ONG prestataire) élabore un plan d'aménagement. Le matériel de travaux (brouettes, pelles, pioches, dameuse locale et rouleaux de cordelette) est mis à la disposition du groupement. Ce matériel servira ultérieurement à l'entretien du périmètre. Les ONG d'appui sont également dotées par le VRES de divers matériels nécessaires aux chantiers : moules pour borne, gabarits pour coffrage, tuyaux PVC, gouttières en poterie locale, sacs de ciment (…). Elles peuvent également solliciter des matériels plus sophistiqués, gérés directement par la cellule projet (dame vibrante). Déroulement des travaux d'aménagement
Pour chaque périmètre, le groupement paysan désigne en assemblée générale un chef de chantier chargé d'assister le superviseur de l'ONG et/ou le prestataire retenu pour l'appui à la réalisation des aménagements. Ce chef de chantier villageois sera chargé de diriger les travaux. Il est responsable de l'organisation et du suivi des équipes villageoises et de divers travaux : placement des gabarits, des tracés sur le sol (…). Deux ou trois autres producteurs sont également formés à la confection des ouvrages (dimensionnement, réalisation des mesures, placement et montage des gabarits), en vue de rendre le groupe autonome dans l'entretien de son aménagement. Les ouvrages en ciment
1 Une bonne partie des nouveaux MIG ou PEIF ont été réalisés à proximité de sites ou des PIV avaient été implantés au cours de la 1ere phase

160
(bassins de dissipation, distributeurs d'eau) sont réalisés par des maçons villageois encadrés par les superviseurs du chantier.
Les travaux se déroulent en saison sèche (de janvier à juin). Ils débutent par le défrichement des parcelles, le découchage et le nettoyage du site, qui sont réalisés par les paysans, suivis des travaux de terrassement proprement dits. Les travaux portant sur les diguettes de séparation et le renforcement des ouvrages prennent place pendant la période de labour. A la réception de la motopompe, un test d'irrigation doit permettre de localiser les points faibles du terrassement et de les consolider avant la mise en eau définitive du périmètre.
La construction du magasin intervient souvent durant la saison sèche suivante, faute de temps et de main d'œuvre suffisante au cours de la première année. Après des magasins PMR-FED en dur, extrêmement coûteux, les constructions désormais recommandées sont des bâtiments en banco comprenant un logement pour le gardien, une salle de stockage pour le paddy et une autre pour les intrants.
Alphabétisation et formation du comité de gestion
Pendant le déroulement des travaux, la formation du comité de gestion proposé par les villageois débute. Il s'agit de le familiariser avec les documents de gestion proposés, avec les problèmes liés aux suivis des dépenses et de les alphabétiser dans leur langue maternelle. Cette formation se poursuit durant toute la première campagne de culture, à l'issue de laquelle les responsables villageois sont censés être autonomes dans la tenue des différents documents de gestion et le calcul de la redevance et de l'amortissement.
Le comité de gestion a également la charge d'appuyer le chef de chantier villageois dans la réalisation de son travail. Parallèlement, la personne désignée par le groupe comme motopompiste suit une formation sur le suivi, l'entretien journalier et la conduite de ce matériel.
Fourniture des intrants
Le projet fourni un fond de roulement nécessaire à l'acquisition des intrants (gasoil, huile, semences, engrais) nécessaire à la réalisation des deux premières campagnes. Afin de responsabiliser les paysans dans la gestion de leur périmètre et dans une optique d'apprentissage progressive, le projet met à leur disposition ce fond de roulement dès la fin des travaux sous la forme de "bons". L'ONG remet au comité de gestion des tickets d'un montant unitaire de 10.000 FCFA, le total des bons correspondant au montant de la redevance devant être collectée à l'issue du premier hivernage. Les responsables paysans réalisent l'ensemble des négociations avec les commerçants pour l'achat de leurs intrants. L'argent leur est remis au moment du paiement des transactions. Parallèlement, le formateur accompagne ces néo-alphabétes non dans leur tractations avec les négociants, mais dans le suivi des mouvements des fonds et la tenue des documents de gestion correspondants.

161
Mise en culture des parcelles
Dès la fin des travaux d'aménagement (en début d'hivernage), le groupement reçoit la motopompe, qui est ensuite montée. Le groupe procède à la répartition des parcelles entre les attributaires par tirage au sort. L'ensemble des producteurs bénéficient d'un suivi technique rapproché sous la forme de réunions et démonstrations durant la première campagne. L'accent est mis sur la conduite des pépinières, les choix variétaux, la fertilisation à dose pédagogique (les doses minimales conseillées par l'encadrement), le respect du calendrier cultural et la gestion de l'eau à la parcelle. Parallèlement à la réalisation des travaux d'aménagement, l'encadrement forme des pépiniéristes villageois, qui devront d'abord apporter leur appui à la production et à la plantation des plants d'eucalyptus destinés aux périmètres et, à terme, favoriser l'émergence de boisements privés.
Bilan de campagne
A l'issue de cette première campagne, une assemblée générale permet de faire le point des dépenses effectuées et de fixer le montant de la redevance à collecter. Les encadreurs, qui ont souvent aidé le comité de gestion à préparer cette réunion, y assistent en principe comme simples observateurs. En pratique, suivant la compétence des comités et le degré de confiance établie, ils peuvent jouer un rôle plus important de conseil, voire d'audit.
L'aménagement type Un aménagement type comprend : - Un groupe motopompe: il est placé sur bac flottant pour les modèles les plus puissants, sur
brouette ou chariot pour les plus récents. La crépite repose alors sur le fond, ce qui peut entraîner l'aspiration de boue et de gravier. C'est pourquoi Vacherot65 recommande de monter la crépite sur une tôle d'acier. Les GMP sont déplacés pour suivre le niveau d'eau. Les tuyaux d'aspiration et de refoulement (qui relient la GMP à l'aménagement) sont formés des tuyaux flexibles (pour les plus petits modèles) ou en tuyau galvanisé (pour les GMP de 400 m3/ha). Ces éléments sont fragiles et Vacherot notait que tous les flexibles des petits GMP étaient percés. Aussi, il recommandait la pose de flexibles renforcés d'un mètre de chaque coté de la pompe pour diminuer leur frais de remplacement;
- Un bassin de dissipation cimenté: il peut être réalisé en béton ou en ouvrage maçonné (ce qui
en limite l'érosion). Des difficultés de positionnement ont été relevées : le bassin est parfois implanté trop bas, avec une sortie de bassin trop haute par rapport au canal, ce qui entraîne une importante chute d'eau et donc des risques d'érosion dans la tête morte;
- La tête morte suivi du canal principal : la tête morte reste le principal point faible des
aménagements sommaires. De ce fait, des nombreuses fissures et effondrements des cavaliers ont été observés. Sur terrain sableux, la tête morte tend à s'ensabler. Cette fragilité est liée à la nature du matériau, mais aussi aux difficultés de compacter les remblais en l'absence de matériel lourd. Dans ce contexte, la réduction de la taille du périmètre et le dimensionnement de la tête morte (comme c'est le cas des MIG) facilite le contrôle de l'état des canaux et de la lame d'eau;
65 Consultant VRES
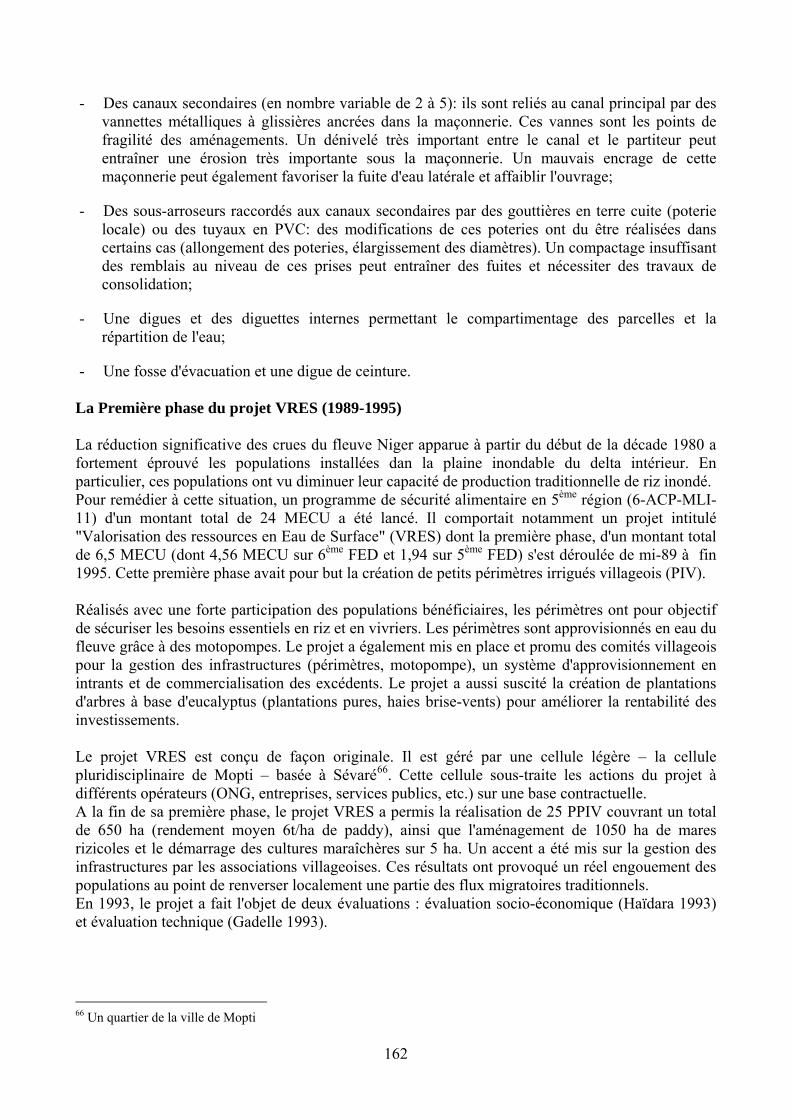
162
- Des canaux secondaires (en nombre variable de 2 à 5): ils sont reliés au canal principal par des vannettes métalliques à glissières ancrées dans la maçonnerie. Ces vannes sont les points de fragilité des aménagements. Un dénivelé très important entre le canal et le partiteur peut entraîner une érosion très importante sous la maçonnerie. Un mauvais encrage de cette maçonnerie peut également favoriser la fuite d'eau latérale et affaiblir l'ouvrage;
- Des sous-arroseurs raccordés aux canaux secondaires par des gouttières en terre cuite (poterie locale) ou des tuyaux en PVC: des modifications de ces poteries ont du être réalisées dans certains cas (allongement des poteries, élargissement des diamètres). Un compactage insuffisant des remblais au niveau de ces prises peut entraîner des fuites et nécessiter des travaux de consolidation;
- Une digues et des diguettes internes permettant le compartimentage des parcelles et la répartition de l'eau;
- Une fosse d'évacuation et une digue de ceinture. La Première phase du projet VRES (1989-1995) La réduction significative des crues du fleuve Niger apparue à partir du début de la décade 1980 a fortement éprouvé les populations installées dan la plaine inondable du delta intérieur. En particulier, ces populations ont vu diminuer leur capacité de production traditionnelle de riz inondé. Pour remédier à cette situation, un programme de sécurité alimentaire en 5ème région (6-ACP-MLI-11) d'un montant total de 24 MECU a été lancé. Il comportait notamment un projet intitulé "Valorisation des ressources en Eau de Surface" (VRES) dont la première phase, d'un montant total de 6,5 MECU (dont 4,56 MECU sur 6ème FED et 1,94 sur 5ème FED) s'est déroulée de mi-89 à fin 1995. Cette première phase avait pour but la création de petits périmètres irrigués villageois (PIV). Réalisés avec une forte participation des populations bénéficiaires, les périmètres ont pour objectif de sécuriser les besoins essentiels en riz et en vivriers. Les périmètres sont approvisionnés en eau du fleuve grâce à des motopompes. Le projet a également mis en place et promu des comités villageois pour la gestion des infrastructures (périmètres, motopompe), un système d'approvisionnement en intrants et de commercialisation des excédents. Le projet a aussi suscité la création de plantations d'arbres à base d'eucalyptus (plantations pures, haies brise-vents) pour améliorer la rentabilité des investissements. Le projet VRES est conçu de façon originale. Il est géré par une cellule légère – la cellule pluridisciplinaire de Mopti – basée à Sévaré66. Cette cellule sous-traite les actions du projet à différents opérateurs (ONG, entreprises, services publics, etc.) sur une base contractuelle. A la fin de sa première phase, le projet VRES a permis la réalisation de 25 PPIV couvrant un total de 650 ha (rendement moyen 6t/ha de paddy), ainsi que l'aménagement de 1050 ha de mares rizicoles et le démarrage des cultures maraîchères sur 5 ha. Un accent a été mis sur la gestion des infrastructures par les associations villageoises. Ces résultats ont provoqué un réel engouement des populations au point de renverser localement une partie des flux migratoires traditionnels. En 1993, le projet a fait l'objet de deux évaluations : évaluation socio-économique (Haïdara 1993) et évaluation technique (Gadelle 1993). 66 Un quartier de la ville de Mopti

163
La deuxième phase du projet VRES (1995-1999) Compte tenu des résultats encourageants obtenus par le projet, la Commission Européenne a convenu de financer une deuxième phase (7-ACP-MLI-078) pour un montant de 4,3 MECU. L'Objectif principal réside dans la consolidation des acquis en matière de sécurisation des productions et une intervention plus significative dans le domaine de la protection des ressources naturelles. Une étude de faisabilité a été réalisée dans ce sens au début de 1994 (De La Horie 1994). Les principaux volets de la deuxième phase du projet sont :
- la consolidation des PPIV créés pendant la première phase, - l'appui aux associations villageoises dans le domaine de la gestion et de l'entretien des
aménagements hydro-agricoles et des équipements par des actions d'animation, de formation avec notamment, des actions d'alphabétisation fonctionnelle destinées aux membres des associations villageoises,
- la création de 110 ha de riziculture supplémentaires et de 270 ha de boisement, - la diversification des cultures et des activités villageoises (140 ha de jardins et vergers
familiaux) rendue possible notamment par la mise en place de caisses autogérées de crédit pour les femmes,
- la gestion des ressources naturelles (sol, eau de surface, couvert végétal) dans une optique de préservation de l'environnement et de lutte contre la désertification grâce à des travaux de recherche-action participative.
La plupart des objectifs physiques sont atteints. De plus, les réflexions et les travaux ont été conduits pour une meilleure adaptation des réalisations aux différents contextes de la région. Ainsi, des PPIV dont les superficies aménagées variaient de 15 à 30 ha, le projet est passé à la promotion de micro périmètres irrigués de groupe (MIG) de 2 à 8 ha - à titre de test, puis aux petites exploitations irriguées familiales ou féminines (PEIF) de 0,5 à 1,5 ha.
Alors que les problèmes agro-techniques majeurs sont globalement résolus, le projet se heurte actuellement à des problèmes socio-économiques nouveaux qui risquent d'avoir une importance de plus en plus croissante et qui pourraient compromettre la viabilité et la réplicabilité des acquis. Ils se manifestent d'abord par une fragilité des associations villageoises liée à un besoin accru d'appui de type animation/conseil notamment dans le domaine de la gestion. Ils se manifestent également par l'importance croissante que prend l'environnement économique et social des associations (approvisionnement en carburant et intrants agricoles, système d'entretien-réparation de moto-pompes, crédit, commercialisation, fédération des associations,…) par l'insuffisance de structuration de cet environnement et par les difficultés des associations à la contrôler.
Les Réalisations du projet
Tableau 1 : Nombre de périmètres réalisés depuis le démarrage du projet ONG 89 90 91 92 93 94 95 VRES-1 96 97 98 VRES-2 TOTAL AFAR PIV 32 105 163 113 67 45 68 593 34 20 54 647 PIB 6 16 32 52 106 33 15 48 154 MIG 5 5 105 91 54 250 255 PIEF 0 S/total 32 105 163 119 83 77 125 704 172 91 89 352 1056
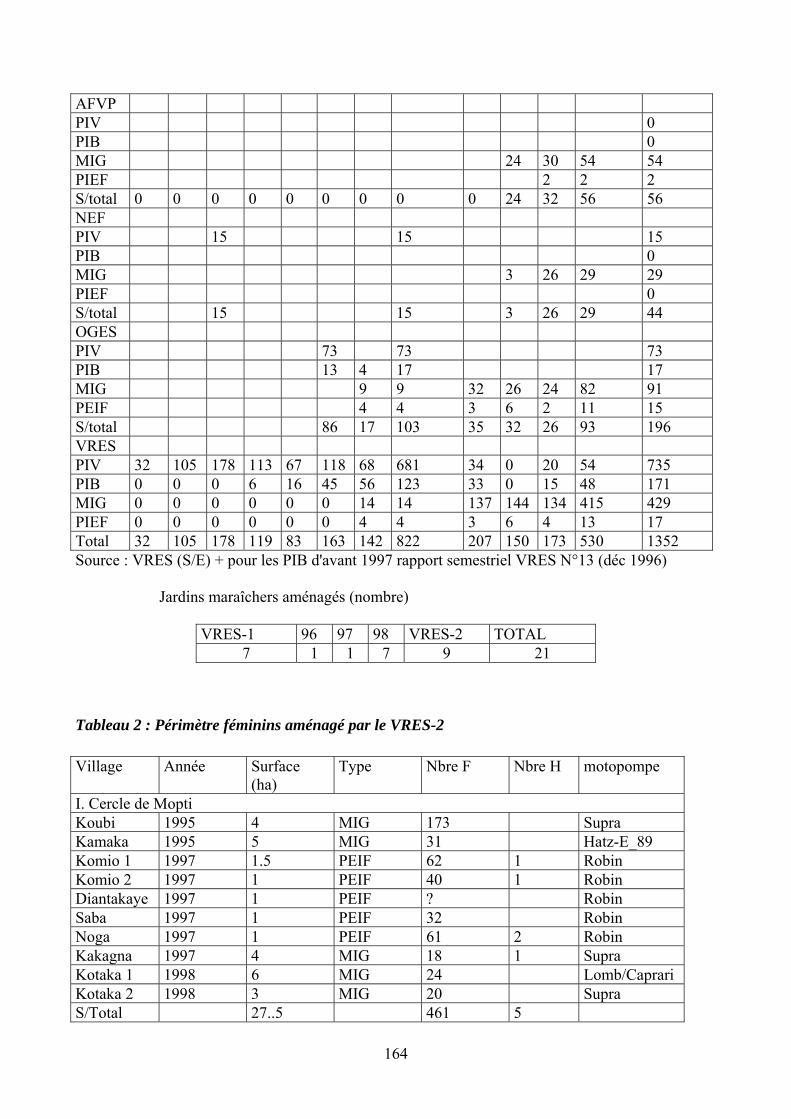
164
AFVP PIV 0 PIB 0 MIG 24 30 54 54 PIEF 2 2 2 S/total 0 0 0 0 0 0 0 0 0 24 32 56 56 NEF PIV 15 15 15 PIB 0 MIG 3 26 29 29 PIEF 0 S/total 15 15 3 26 29 44 OGES PIV 73 73 73 PIB 13 4 17 17 MIG 9 9 32 26 24 82 91 PEIF 4 4 3 6 2 11 15 S/total 86 17 103 35 32 26 93 196 VRES PIV 32 105 178 113 67 118 68 681 34 0 20 54 735 PIB 0 0 0 6 16 45 56 123 33 0 15 48 171 MIG 0 0 0 0 0 0 14 14 137 144 134 415 429 PIEF 0 0 0 0 0 0 4 4 3 6 4 13 17 Total 32 105 178 119 83 163 142 822 207 150 173 530 1352 Source : VRES (S/E) + pour les PIB d'avant 1997 rapport semestriel VRES N°13 (déc 1996) Jardins maraîchers aménagés (nombre)
VRES-1 96 97 98 VRES-2 TOTAL 7 1 1 7 9 21
Tableau 2 : Périmètre féminins aménagé par le VRES-2 Village Année Surface
(ha) Type Nbre F Nbre H motopompe
I. Cercle de Mopti Koubi 1995 4 MIG 173 Supra Kamaka 1995 5 MIG 31 Hatz-E_89 Komio 1 1997 1.5 PEIF 62 1 Robin Komio 2 1997 1 PEIF 40 1 Robin Diantakaye 1997 1 PEIF ? Robin Saba 1997 1 PEIF 32 Robin Noga 1997 1 PEIF 61 2 Robin Kakagna 1997 4 MIG 18 1 Supra Kotaka 1 1998 6 MIG 24 Lomb/Caprari Kotaka 2 1998 3 MIG 20 Supra S/Total 27..5 461 5
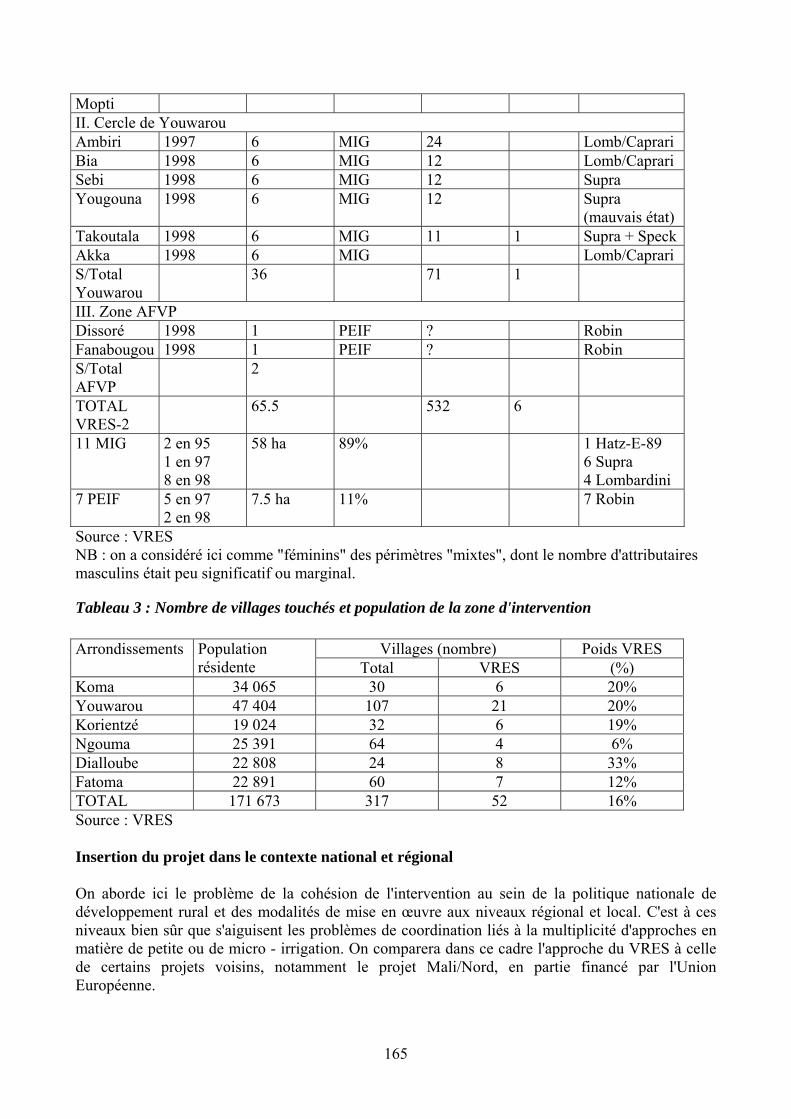
165
Mopti II. Cercle de Youwarou Ambiri 1997 6 MIG 24 Lomb/Caprari Bia 1998 6 MIG 12 Lomb/Caprari Sebi 1998 6 MIG 12 Supra Yougouna 1998 6 MIG 12 Supra
(mauvais état) Takoutala 1998 6 MIG 11 1 Supra + SpeckAkka 1998 6 MIG Lomb/Caprari S/Total Youwarou
36 71 1
III. Zone AFVP Dissoré 1998 1 PEIF ? Robin Fanabougou 1998 1 PEIF ? Robin S/Total AFVP
2
TOTAL VRES-2
65.5 532 6
11 MIG 2 en 95 1 en 97 8 en 98
58 ha 89% 1 Hatz-E-89 6 Supra 4 Lombardini
7 PEIF 5 en 97 2 en 98
7.5 ha 11% 7 Robin
Source : VRES NB : on a considéré ici comme "féminins" des périmètres "mixtes", dont le nombre d'attributaires masculins était peu significatif ou marginal.
Tableau 3 : Nombre de villages touchés et population de la zone d'intervention
Villages (nombre) Poids VRES Arrondissements Population résidente Total VRES (%)
Koma 34 065 30 6 20% Youwarou 47 404 107 21 20% Korientzé 19 024 32 6 19% Ngouma 25 391 64 4 6% Dialloube 22 808 24 8 33% Fatoma 22 891 60 7 12% TOTAL 171 673 317 52 16% Source : VRES Insertion du projet dans le contexte national et régional On aborde ici le problème de la cohésion de l'intervention au sein de la politique nationale de développement rural et des modalités de mise en œuvre aux niveaux régional et local. C'est à ces niveaux bien sûr que s'aiguisent les problèmes de coordination liés à la multiplicité d'approches en matière de petite ou de micro - irrigation. On comparera dans ce cadre l'approche du VRES à celle de certains projets voisins, notamment le projet Mali/Nord, en partie financé par l'Union Européenne.

166
Les grandes orientations du développement rural A partir de 1990, le Gouvernement malien a entrepris un important travail de réflexion et de concertation visant à renouveler sa politique de développement rural, en associant les diverses instances concernées, des représentants du monde rural et les partenaires financiers. Il s'en est suivi un Schéma Directeur du Secteur du Développement Rural, publié en mars 1992, qui se fixe 8 grands axes : - harmoniser les différentes démarches à travers une vision synthétique intégrant les diverses
composantes et divers acteurs du développement; - valoriser les atouts et lever les handicaps, notamment le faible niveau d'éducation des ruraux,
l'enclavement, l'insuffisante intégration entre l'agriculture et l'industrie, la faible capacité des opérateurs économiques et le déséquilibre ville/campagne;
- créer un environnement économique et social plus favorable : politique de prix, libéralisation économique, amélioration de l'alphabétisation fonctionnelle, reformulation des textes et réglementations régissant le foncier, les codes forestiers, pastoraux et de la pêche;
- rendre le développement durable par l'amélioration des conditions de vie et des revenus des ruraux, par une sécurisation alimentaire à moyen terme, et par la préservation des équilibres naturels;
- responsabiliser la société civile dans une perspective d'auto - administration locale et de décentralisation basée sur le village et la collectivité élargie (commune rurale), avec un appui au secteur privé;
- améliorer les conditions nutritionnelles, par l'augmentation et la diversification des produits et une meilleure appréciation des zones et des facteurs de distorsion;
- faire du secteur de Développement Rural le moteur de la croissance, par une amélioration de la production et de la commercialisation, et par la recherche de débouchés à l'exportation;
- adapter les fonctions d'appui aux besoins des producteurs et des opérateurs, par des révisions de législations et des reformes des structures d'appui existantes dans le cadre des options de désengagement de l'Etat et de privatisation.
Ce document a été complété par un Plan d'action du Ministère du Développement Rural, publié en Août 1993, qui suit les grandes lignes du Schéma Directeur, tout en intégrant les conclusions des séminaires et ateliers tenus au cours des années 1992/1993. Ce Plan d'action, toujours considéré comme le cadre politique de référence du secteur, s'articule autour de 6 objectifs prioritaires: - le désengagement de l'Etat et la responsabilisation des promoteurs/acteurs du développement
rural; - la redéfinition des rôles du Ministère du Développement Rural (MDR) et des structures d'appui
et d'encadrement, comme suite aux options de libéralisation, de décentralisation et de privatisation;
- le développement durable et la gestion des ressources naturelles (GRN); - la promotion du crédit rural dans la perspective du retrait de l'encadrement dans la distribution
et le recouvrement du crédit; - le développement prioritaire de 6 filières : coton, riz, arachide/oléagineux, céréales sèches, fruits
et légumes, et l'élevage; - une attention particulière aux groupes fragiles et vulnérables, notamment aux femmes et aux
jeunes ruraux.

167
Il est clair que les objectifs du VRES - 2 étaient et restent en parfaite concordance avec ces grands axes d'action67. Ils correspondent de même aux priorités qu'assignait le 7eme FED à la coopération entre le Mali et la Communauté Européenne. Les priorités du 7eme FED Le 7eme FED s'est articulé autour de trois secteurs de concertation :
1) Sécurité alimentaire et protection de l'environnement, avec des appuis sur : - La lutte contre la désertification et la gestion des ressources naturelles; - L'élevage et l'intégration agriculture/élevage, et la gestion des terroirs; - La maîtrise de l'eau et l'extension des petits périmètres irrigués villageois; - Le crédit agricole et la promotion de l'épargne rurale.
2) Initiative de base, coopération décentralisée et soutien au secteur privé; 3) Entretien routier et désenclavement.
On souligne ici les thèmes qui sont en concordance avec les grands objectifs du VRES - 2, à savoir : la sécurité alimentaire (par le biais notamment d'une meilleure maîtrise de l'eau et par une extension des petits périmètres irrigués villageois), la protection de l'environnement et le soutien aux initiatives de base. Les autres cadres de cohérence La Stratégie Nationale de Développement de l'Irrigation Une Stratégie Nationale de Développement de l'Irrigation a été élaborée avec le concours de la FAO et de la Banque Mondiale et s'inspire de quelques grands principes issus du Schéma Directeur du Développement Rural, qui souligne notamment 4 lignes directrices pour le sous - secteur irrigation :
- Concentrer les investissements publics sur la réhabilitation sélective des grands périmètres existants;
- Encourager une plus grande participation des attributaires aux coûts de réhabilitation et d'entretien des aménagements étatiques;
- Assurer aux exploitants des aménagements hydro - agricoles des services de vulgarisation et de recherche réellement efficaces;
- Promouvoir les investissements privés dans la petite/moyenne irrigation, en augmentant la capacité des exploitants à participer à l'identification, à la mise en œuvre et à la gestion d'initiatives économiquement viables.
Le programme National d'Infrastructures Rurales La Direction Nationale de l'Aménagement et de l'Equipement Rural (DNAER), au sein du Ministère du Développement Rural et Eau (MDRE) a élaboré un Programme National d'Infrastructures Rurales (PNIR), avec 3 volets :
1) Pistes rurales 2) Hydraulique villageoise et assainissement 3) Aménagement hydraulique et irrigation
67 On a souligné les axes du Plan d'action correspondant aux objectifs même du projet (de même pour les volets de concertation du 7eme FED)
168
Ce programme a fait l'objet au préalable d'un atelier de réflexion et de validation en septembre 1998. Il est fondé sur la stratégie nationale de développement de l'irrigation et est actuellement en cours d'exécution. De façon générale, le Ministère et la DNAER ont été très intéressés par l'approche de VRES, à savoir des périmètres associant des boisement aux cultures irriguées, ce qui permet de réduire les coûts des amortissements, tout en faisant des périmètres des mini - pôles locaux de développement et de gestion de l'environnement. A sa mesure, le VRES a eu ici un rôle novateur, en insistant dès le départ sur la responsabilisation des bénéficiaires et sur la diversification des activités. De fait, la stratégie développée dans le cadre du PNIR s'inscrit dans le cadre du processus de décentralisation (les communes ayant un rôle croissant dans la programmation, la mise en œuvre et le financement des actions de développement), tout en insistant sur les 3 axes suivants : • Appropriation des infrastructures par les usagers; • Participation des bénéficiaires au financement ou aux travaux (pas de périmètres "clé en
main"); • Diversification des productions.
C'est tout à fait l'approche développée par le VRES. Le Ministère, à travers le PNIR, est entrain de mettre en œuvre les conditions de financement de la petite irrigation, notamment en mettant l'accent sur l'application de taux de subvention qu'il conviendrait d'appliquer aux différents équipements (aménagement et matériels de pompage), suivant les zones et les situations. Le Schéma Régional d'Aménagement et de Développement pour la région de Mopti Dans le cadre de la mission de la Décentralisation, le Gouvernement du Mali a élaboré des avant-projets de Schémas Régionaux d'Aménagement et de Développement (SRAD), dont celui de la région de Mopti. Après un bilan diagnostic, qui rappelle les contraintes et les atouts de la région, le document souligne la stagnation de son économie et il précise que la région "devra renforcer son rôle de liaison entre le Nord et le Sud, en créant des centres importants d'échanges grâce au développement de l'élevage, de la pèche, de la pisciculture et de l'agriculture". La grande diversité de la Région de Mopti - et en particulier la nette division qui s'opère entre les zones inondée et exondée - doit conduire à adopter une approche sélective des actions de développement. "Une autre caractéristique de la Région de Mopti est la superposition dans le temps et dans l'espace de systèmes de production, source des conflits entre les différents utilisateurs des ressources (agriculteurs, éleveurs, pêcheurs). A cela s'ajoute une gestion des terres dominée par les règles coutumières aujourd'hui dépassées par l'évolution politique et économique du pays". Du point de vue sectoriel, l'aménagement et le développement de la région doivent viser : - "la mise en valeur de l'important potentiel en terres cultivables aussi bien en sec qu'en irrigué,
en s'attaquant résolument à la résolution des conflits et en favorisant l'intégration élevage/agriculture/sylviculture/pêche;
- la réalisation des aménagements par la maîtrise des eaux; - la conservation des écosystèmes (en généralisant les expériences positives de gestion
communautaire et villageoise en cours dans la région); - l'intensification du développement industriel, artisanal et touristique;
169
- la satisfaction des populations urbaines et rurales en énergie, notamment électricité, par la promotion des énergies nouvelles et renouvelables;
- le désenclavement interne et externe afin que la région joue pleinement son rôle de relais entre le Nord et le Sud du pays (et en priorité le désenclavement de la zone inondée);
- la relance du secteur commercial et des services pour soutenir l'effort des producteurs ruraux (avec notamment un renforcement du réseau bancaire et un développement des caisses de crédit villageoises);
- l'accélération de l'alphabétisation, l'élévation du niveau de scolarisation, du taux de la couverture sanitaire et la satisfaction des besoins en eau potable".
On conviendra que ce Schéma constitue un cadre général d'orientation, mais sans contenu concret au plan opérationnel. Les faiblesses de la coordination aux niveaux régional et local Si les objectifs du VRES, comme ses modes d'approche, correspondent bien aux grandes orientations fixées par le Gouvernement en matière de développement rural, il est plus délicat d'évaluer sa pertinence à des niveaux plus fins du fait de la faiblesse du dispositif de programmation à ces niveaux. En il existe au sein de chaque Région un Comité Régional de Développement, présidé par le Gouverneur et réunissant les différents services techniques et ONG intervenant dans la région. Un Comité identique existe au niveau du cercle et des dispositifs de programmation sont prévus dans le cadre de la décentralisation au niveau des communes urbaines et rurales. Toutefois ce dispositif ne dispose pas des outils ni des ressources en personnel et fonctionnement lui permettant d'assurer une réelle coordination des différentes interventions. Le partage se fait donc pour l'essentiel sur une base géographique, chaque projet couvrant en principe une zone, mais avec des objectifs et surtout des approches différentes. C'est le cas dans la 5eme région, où le VRES côtoie notamment l'ORM, le PSSA68, et divers projets mis en œuvre par des ONG, qui sont parfois partenaires du VRES. De même, on trouve en face de certains périmètres VRES, sur un bras du Niger, des aménagements soutenus par le projet Mali/Nord, financé en partie par l'Union Européenne, et qui développe une approche sensiblement différente, alors que les 2 projets touchent parfois la même population.
4.1.2. Coûts du projet
1) Décomposition des coûts du projet
68 Office Riz Mopti; Programme Spécial de Sécurité Alimentaire/FAO
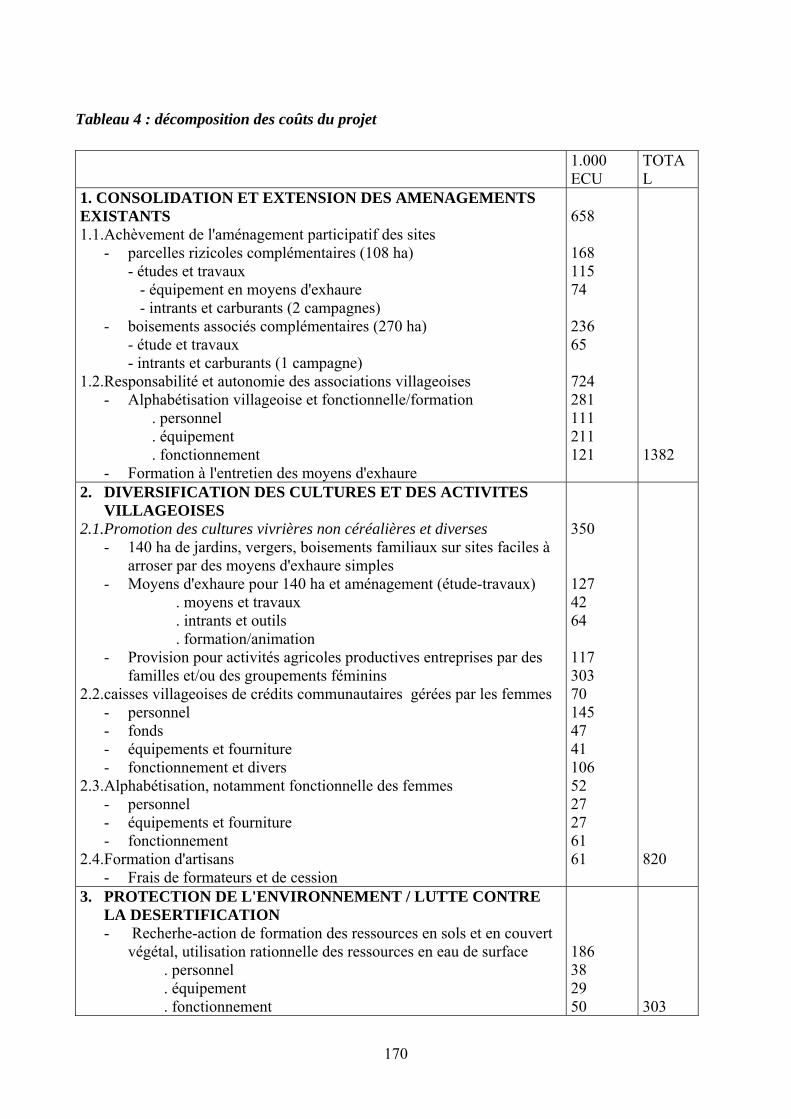
170
Tableau 4 : décomposition des coûts du projet
1.000 ECU
TOTAL
1. CONSOLIDATION ET EXTENSION DES AMENAGEMENTS EXISTANTS 1.1.Achèvement de l'aménagement participatif des sites
- parcelles rizicoles complémentaires (108 ha) - études et travaux
- équipement en moyens d'exhaure - intrants et carburants (2 campagnes) - boisements associés complémentaires (270 ha)
- étude et travaux - intrants et carburants (1 campagne)
1.2.Responsabilité et autonomie des associations villageoises - Alphabétisation villageoise et fonctionnelle/formation
. personnel . équipement . fonctionnement
- Formation à l'entretien des moyens d'exhaure
658 168 115 74 236 65 724 281 111 211 121
1382
2. DIVERSIFICATION DES CULTURES ET DES ACTIVITES VILLAGEOISES
2.1.Promotion des cultures vivrières non céréalières et diverses - 140 ha de jardins, vergers, boisements familiaux sur sites faciles à
arroser par des moyens d'exhaure simples - Moyens d'exhaure pour 140 ha et aménagement (étude-travaux) . moyens et travaux . intrants et outils . formation/animation - Provision pour activités agricoles productives entreprises par des
familles et/ou des groupements féminins 2.2.caisses villageoises de crédits communautaires gérées par les femmes
- personnel - fonds - équipements et fourniture - fonctionnement et divers
2.3.Alphabétisation, notamment fonctionnelle des femmes - personnel - équipements et fourniture - fonctionnement
2.4.Formation d'artisans - Frais de formateurs et de cession
350 127 42 64 117 303 70 145 47 41 106 52 27 27 61 61
820
3. PROTECTION DE L'ENVIRONNEMENT / LUTTE CONTRE LA DESERTIFICATION - Recherhe-action de formation des ressources en sols et en couvert
végétal, utilisation rationnelle des ressources en eau de surface . personnel . équipement . fonctionnement
186 38 29 50
303
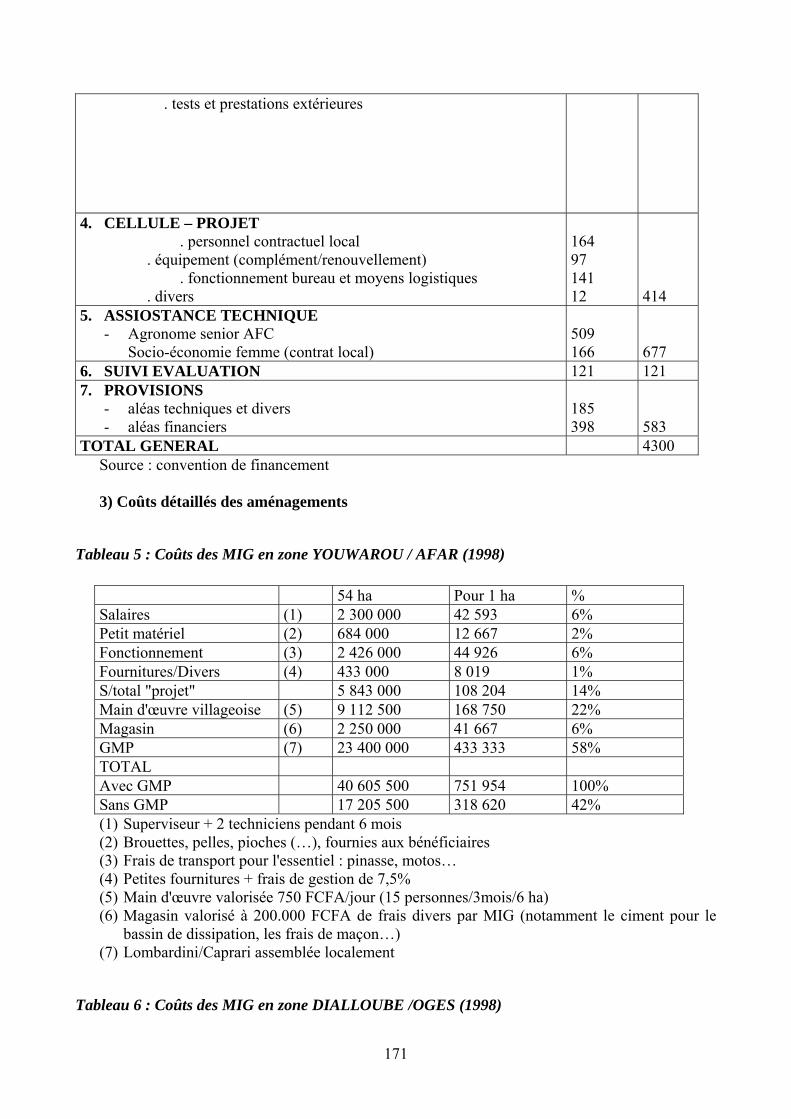
171
. tests et prestations extérieures
4. CELLULE – PROJET . personnel contractuel local . équipement (complément/renouvellement) . fonctionnement bureau et moyens logistiques . divers
164 97 141 12
414
5. ASSIOSTANCE TECHNIQUE - Agronome senior AFC
Socio-économie femme (contrat local)
509 166
677
6. SUIVI EVALUATION 121 121 7. PROVISIONS
- aléas techniques et divers - aléas financiers
185 398
583
TOTAL GENERAL 4300 Source : convention de financement
3) Coûts détaillés des aménagements
Tableau 5 : Coûts des MIG en zone YOUWAROU / AFAR (1998) 54 ha Pour 1 ha % Salaires (1) 2 300 000 42 593 6% Petit matériel (2) 684 000 12 667 2% Fonctionnement (3) 2 426 000 44 926 6% Fournitures/Divers (4) 433 000 8 019 1% S/total "projet" 5 843 000 108 204 14% Main d'œuvre villageoise (5) 9 112 500 168 750 22% Magasin (6) 2 250 000 41 667 6% GMP (7) 23 400 000 433 333 58% TOTAL Avec GMP 40 605 500 751 954 100% Sans GMP 17 205 500 318 620 42% (1) Superviseur + 2 techniciens pendant 6 mois (2) Brouettes, pelles, pioches (…), fournies aux bénéficiaires (3) Frais de transport pour l'essentiel : pinasse, motos… (4) Petites fournitures + frais de gestion de 7,5% (5) Main d'œuvre valorisée 750 FCFA/jour (15 personnes/3mois/6 ha) (6) Magasin valorisé à 200.000 FCFA de frais divers par MIG (notamment le ciment pour le
bassin de dissipation, les frais de maçon…) (7) Lombardini/Caprari assemblée localement
Tableau 6 : Coûts des MIG en zone DIALLOUBE /OGES (1998)
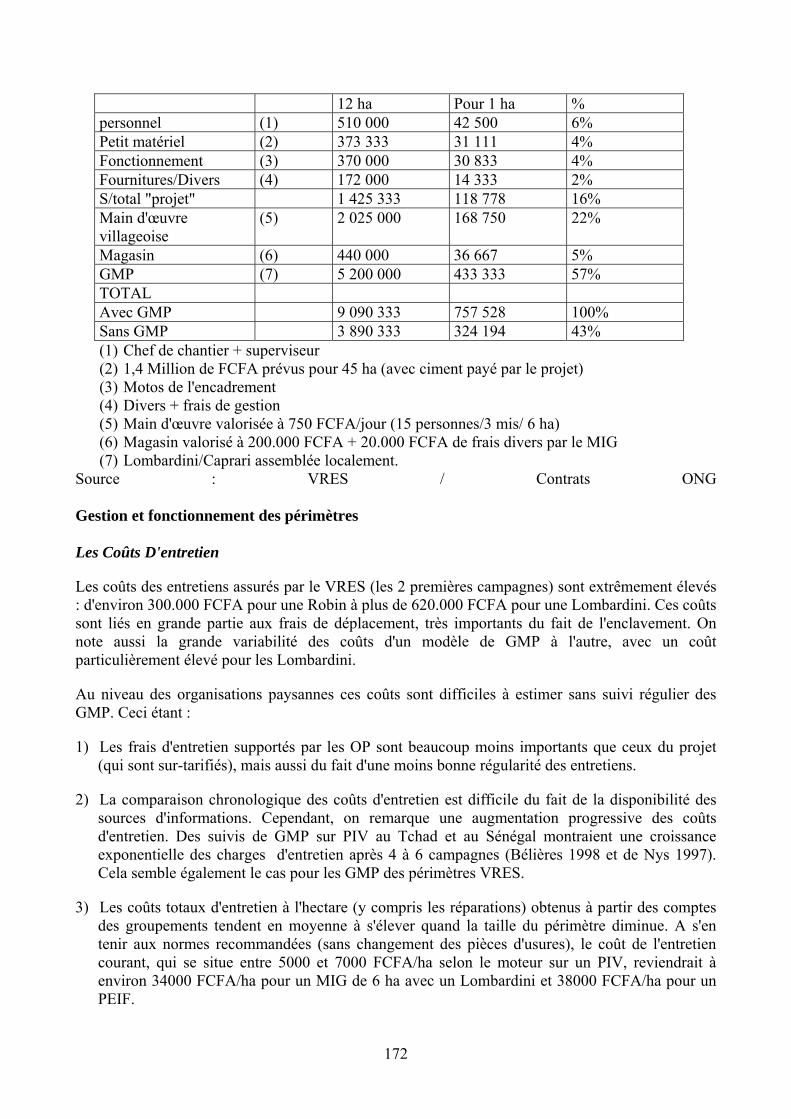
172
12 ha Pour 1 ha % personnel (1) 510 000 42 500 6% Petit matériel (2) 373 333 31 111 4% Fonctionnement (3) 370 000 30 833 4% Fournitures/Divers (4) 172 000 14 333 2% S/total "projet" 1 425 333 118 778 16% Main d'œuvre villageoise
(5) 2 025 000 168 750 22%
Magasin (6) 440 000 36 667 5% GMP (7) 5 200 000 433 333 57% TOTAL Avec GMP 9 090 333 757 528 100% Sans GMP 3 890 333 324 194 43% (1) Chef de chantier + superviseur (2) 1,4 Million de FCFA prévus pour 45 ha (avec ciment payé par le projet) (3) Motos de l'encadrement (4) Divers + frais de gestion (5) Main d'œuvre valorisée à 750 FCFA/jour (15 personnes/3 mis/ 6 ha) (6) Magasin valorisé à 200.000 FCFA + 20.000 FCFA de frais divers par le MIG (7) Lombardini/Caprari assemblée localement.
Source : VRES / Contrats ONG Gestion et fonctionnement des périmètres Les Coûts D'entretien
Les coûts des entretiens assurés par le VRES (les 2 premières campagnes) sont extrêmement élevés : d'environ 300.000 FCFA pour une Robin à plus de 620.000 FCFA pour une Lombardini. Ces coûts sont liés en grande partie aux frais de déplacement, très importants du fait de l'enclavement. On note aussi la grande variabilité des coûts d'un modèle de GMP à l'autre, avec un coût particulièrement élevé pour les Lombardini.
Au niveau des organisations paysannes ces coûts sont difficiles à estimer sans suivi régulier des GMP. Ceci étant :
1) Les frais d'entretien supportés par les OP sont beaucoup moins importants que ceux du projet (qui sont sur-tarifiés), mais aussi du fait d'une moins bonne régularité des entretiens.
2) La comparaison chronologique des coûts d'entretien est difficile du fait de la disponibilité des sources d'informations. Cependant, on remarque une augmentation progressive des coûts d'entretien. Des suivis de GMP sur PIV au Tchad et au Sénégal montraient une croissance exponentielle des charges d'entretien après 4 à 6 campagnes (Bélières 1998 et de Nys 1997). Cela semble également le cas pour les GMP des périmètres VRES.
3) Les coûts totaux d'entretien à l'hectare (y compris les réparations) obtenus à partir des comptes des groupements tendent en moyenne à s'élever quand la taille du périmètre diminue. A s'en tenir aux normes recommandées (sans changement des pièces d'usures), le coût de l'entretien courant, qui se situe entre 5000 et 7000 FCFA/ha selon le moteur sur un PIV, reviendrait à environ 34000 FCFA/ha pour un MIG de 6 ha avec un Lombardini et 38000 FCFA/ha pour un PEIF.

173
Toutes ses estimations tendent à valider l'hypothèse d'un sous entretien plus ou moins prononcé des GMP, notamment sur les MIG et les PEIF, qui peuvent conduire les groupements à limiter le nombre d'entretiens réalisés. La comparaison avec les coûts réels relevés dans les associations tend à valider cette hypothèse. Or, un entretien insuffisant des groupes peut conduire à un vieillissement précoce des GMP, notamment si la qualité du gasoil utilisé laisse à désirer. A titre d'indication, dans les PIV de 30 ha du Tchad, les frais cumulés de réparation/entretien sur la durée de vie du matériel atteignaient 45 000 FCFA/ha, tandis que les entretiens courants n'avaient pas été réalisés régulièrement.
Enfin, on notera que les déplacements des réparateurs (même pour des interventions hors contrat VRES) restent largement subventionnés par le projet. En effet, dans la mesure du possible, les garages privilégient le couplage entretiens/réparations avec les tournées d'entretien de terrains financées par le projet ou profitent occasionnellement des pinasses du projet ou des ONG pendant la période de crue. Ceci se traduit par des délais d'intervention parfois importants pour l'entretien et les réparations.
Cependant, vu les coûts de déplacements dans ces zones enclavées et le choix des prestataires (basés uniquement à Mopti pour la plupart), cette subvention se justifie sans doute : le garage moderne estime que chaque transport en pinasse sur Youwarou lui revient en moyenne à 205.000 FCFA. La prise en charge de tels coûts par une ou deux OP paraît dans ces conditions difficiles. Le transport par forains est possible : c'est le choix effectué par le garage Dewral, lorsqu'il n'y a pas d'autres moyens de déplacement. Mais cela impose des délais, qui peuvent être très préjudiciables à la production.
Notons que dans la région de Matam au Sénégal, le coût moyen d'entretien de moteurs de 2 ou 3 cylindres pouvait être estimer à 280. 000 FCFA par campagne (Bélières et al, 1998). Bien que les tarifs d'intervention des différents prestataires soient différents, il n'y pas véritablement de concurrence mais plutôt un zonage entre les différents mécaniciens.
Le garage Moderne et Dewral proposent des contrats globaux d'entretien aux OP (sur la base de 2 entretiens par campagne), au tarif respectif de 200.000 et 100.000 FCFA/campagne. Cette formule (qui inclut pièces détachées, frais de main d'œuvre et de déplacement) ne semble pas avoir eu de succès auprès des OP. Le coût élevé du Garage Moderne par rapport à ses prestations directes théoriques explique peut-être ce désintérêt.
Amortissement des GMP et coût de l'eau
Evaluation de l'amortissement
Avec une durée de vie moyenne des GMP de 2 à 3 cylindres de 8 000 heures et une durée moyenne de fonctionnement de 680 heures, il est raisonnable d'amortir le matériel sur 12 campagnes (et non 15 campagnes comme cela avait été initialement prévu par le projet). Les suivis menés dans la sous-région sur le même type de motopompes montrent que l'on peut s'appuyer sur une durée de vie des GMP supérieure à la norme généralement retenue de 5 ans. Dans la région de Matam, l'âge moyen des GMP en bon état de 10 ans, mais dans la plupart des cas ils n'avaient fonctionné que durant 8 campagnes. Au Tchad, la durée de vie théorique variait entre 5 000 et 8 000 heures de fonctionnement, soit aussi quelques 8 campagnes dans les conditions locales de fonctionnement.

174
Pour les GMP placés sur les MIG que l'on peut supposer plus fragiles et en l'absence de tout référentiel, nous retiendrons une durée de vie de 10 campagnes. On estimera la durée de vie des motopompes Robin sur une durée de 4 campagnes.
Tableau 7 : Montant des amortissements par campagne et type de GMP (en FCFA)
Hatz Guinard 3 cyl
Hatz Guinard 2 cyl
Supra-Pancard
Lombardini – Caprari
Robin
Ha 30 20 6 6 1,5
Campagne 12 12 10 10 4
Amortissement 1 175 900 720 500 238 900 299 000 125 000
Charge/ha 39 200 36 000 38 800 49 800 83 300
Charges hydrauliques
Suivant ces premières bases de calcul, on peut estimer que l'amortissement varie entre 40% et 60% du coût total de l'eau. On notera aussi que pour les petits modules (MIG et PEIF), le coût de l'eau est d'environ 50 % plus cher que dans les PIV. Cette différence est due à la fois à des charges de maintenance de GMP à l'hectare plus importantes et à des consommations en carburant/lubrifiant relativement plus élevées. Ces coûts sont encore plus importants avec des MIG de 4 ha, comme ceux que l'on rencontre dans certaines zones. De telles estimations mériteraient d'être validées par un suivi rapproché de terrain.
4.1.3. Contraintes au développement du projet
Le tableau suivant synthétise les caractéristiques de chaque type d'aménagement avec ses avantages et inconvénients.
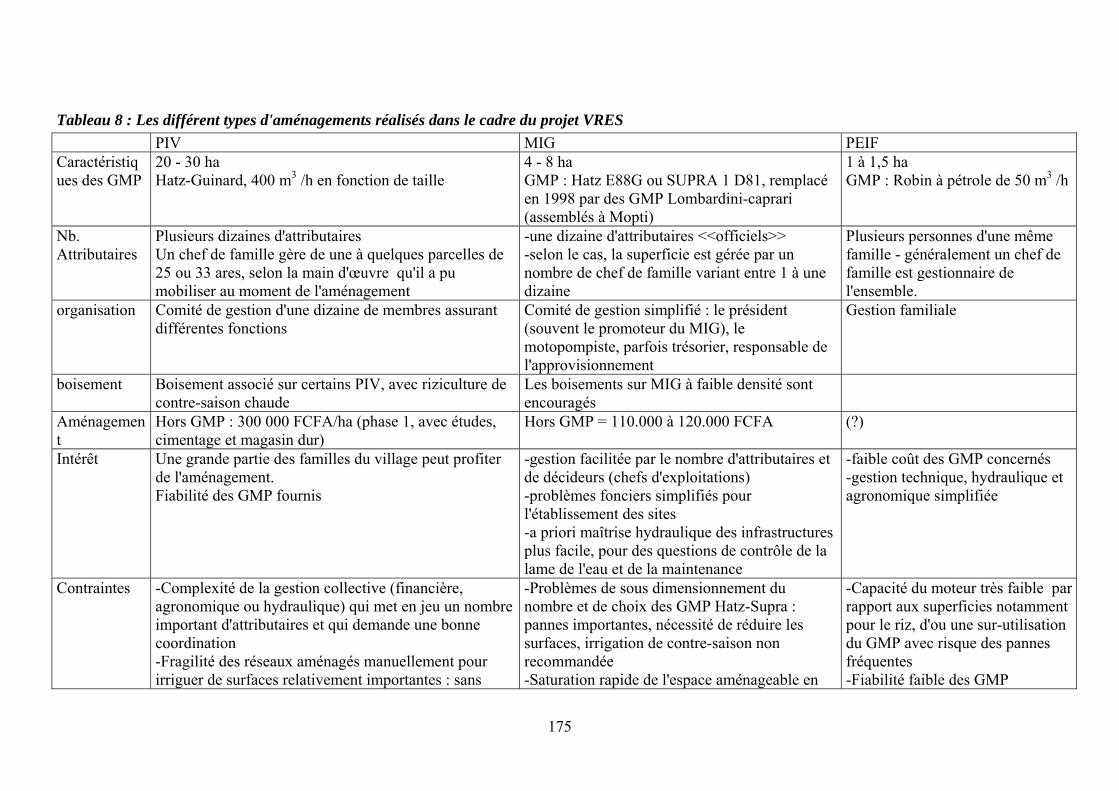
175
Tableau 8 : Les différent types d'aménagements réalisés dans le cadre du projet VRES PIV MIG PEIF Caractéristiques des GMP
20 - 30 ha Hatz-Guinard, 400 m3 /h en fonction de taille
4 - 8 ha GMP : Hatz E88G ou SUPRA 1 D81, remplacé en 1998 par des GMP Lombardini-caprari (assemblés à Mopti)
1 à 1,5 ha GMP : Robin à pétrole de 50 m3 /h
Nb. Attributaires
Plusieurs dizaines d'attributaires Un chef de famille gère de une à quelques parcelles de 25 ou 33 ares, selon la main d'œuvre qu'il a pu mobiliser au moment de l'aménagement
-une dizaine d'attributaires <<officiels>> -selon le cas, la superficie est gérée par un nombre de chef de famille variant entre 1 à une dizaine
Plusieurs personnes d'une même famille - généralement un chef de famille est gestionnaire de l'ensemble.
organisation Comité de gestion d'une dizaine de membres assurant différentes fonctions
Comité de gestion simplifié : le président (souvent le promoteur du MIG), le motopompiste, parfois trésorier, responsable de l'approvisionnement
Gestion familiale
boisement Boisement associé sur certains PIV, avec riziculture de contre-saison chaude
Les boisements sur MIG à faible densité sont encouragés
Aménagement
Hors GMP : 300 000 FCFA/ha (phase 1, avec études, cimentage et magasin dur)
Hors GMP = 110.000 à 120.000 FCFA (?)
Intérêt Une grande partie des familles du village peut profiter de l'aménagement. Fiabilité des GMP fournis
-gestion facilitée par le nombre d'attributaires et de décideurs (chefs d'exploitations) -problèmes fonciers simplifiés pour l'établissement des sites -a priori maîtrise hydraulique des infrastructures plus facile, pour des questions de contrôle de la lame de l'eau et de la maintenance
-faible coût des GMP concernés -gestion technique, hydraulique et agronomique simplifiée
Contraintes -Complexité de la gestion collective (financière, agronomique ou hydraulique) qui met en jeu un nombre important d'attributaires et qui demande une bonne coordination -Fragilité des réseaux aménagés manuellement pour irriguer de surfaces relativement importantes : sans
-Problèmes de sous dimensionnement du nombre et de choix des GMP Hatz-Supra : pannes importantes, nécessité de réduire les surfaces, irrigation de contre-saison non recommandée -Saturation rapide de l'espace aménageable en
-Capacité du moteur très faible par rapport aux superficies notamment pour le riz, d'ou une sur-utilisation du GMP avec risque des pannes fréquentes -Fiabilité faible des GMP

176
ouvrage de régulateur et avec des débits relativement importants, risque de dégradation rapide des points sensibles de l'aménagement (tête morte) -Chaque famille exploite une superficie réduite ( de une à quelques parcelles), qui ne peut satisfaire l'ensemble des besoins alimentaires de la famille, même avec des très bon rendements -Appartenance foncière floue
bordure de fleuve qui rend difficile les extensions au-delà des berges -Coûts d'amortissement et de maintenance très important
-Coûts d'amortissement et de maintenance très importants
Les Problèmes
- Un choix technique contestable
Si les premiers GMP retenus pour les PIV ont fait la preuve de leur robustesse, les SUPRA retenus en 1997 pour les premiers MIG se sont relevés mal adaptés : moteur trop rapide accouplé à une pompe de débit trop faible, puissance trop faible; instabilité du châssis; surestimation des superficies irrigables; fragilité de l'ensemble (…). Des problèmes importants sont vite apparus (fuite d'huile, surchauffage), au point que le projet a du changer ces motopompes. Les OP ont donc en partie supporté le coût de cette erreur technique. Car les problèmes se sont surtout manifestés au bout du deuxième hivernage. Le coût de cette erreur technique a donc été partiellement supporté par les OP. Car si les GMP ont été remplacés par le projet, certains MIG ont subi d'importants coûts de fonctionnement et parfois des pannes, qui les ont fragilisés
- La nécessité d'un référentiel technique et économique
Le projet a fait le choix d'accouplement des Lombardini/Caprari et le montage de châssis à Sévaré afin de réduire les coûts d'achat du nouveau modèle sélectionné. Si ce choix paraît économiquement justifié, un suivi technique et économique de ces machines sur plusieurs campagnes est indispensable pour évaluer l'adaptation de ce modèle aux conditions locales de fonctionnement.
Ainsi, l'estimation du nombre moyen d'heures de fonctionnement par campagne permet d'évaluer le nombre de campagnes avant révision ou renouvellement du moteur. On estime que les GMP doivent être renouvelés au bout de 8.000 heures, c'est à dire que dans les conditions de fonctionnement locales, au bout de 12 campagnes. Or l'amortissement du matériel était initialement prévu sur 15 campagnes. De la même manière, il conviendra d'estimer la durée moyenne de fonctionnement par campagne des Lombardini/Caprari sur un échantillon significatif pour estimer la durée normale de l'amortissement.
De manière générale, on regrettera l'absence de suivi et de référentiel technico-économique sur les différents modèles retenus qui permettrait d'évaluer les performances réelles de ces motopompes dans les conditions locales et donc d'orienter les choix techniques. C'est à partir de ces références que peut se développer un conseil technique adapté aux OP, notamment en ce qui concerne des stratégies de remise à neuf ou de renouvellement des GMP.
- La question des pièces détachées
Périodiquement, des ruptures de stocks en pièces détachées sont à déplorer. Durant l'hivernage1998 par exemple, la pénurie a durée près de 2 mois et demi. Ces pénuries peuvent être locales (Mopti) ou provenir des fournisseurs de Bamako, qui disposent en général d'un petit stock des pièces les plus courantes, insuffisantes pour éviter les ruptures ponctuelles. Or les délais de réacheminement peuvent être de plusieurs semaines.
A Sévaré, le Garage Moderne dispose d'un petit stock de pièces détachées récupérées auprès du projet. Il avait également négocié auprès de Dupé69 le renouvellement de ce stock dans la limite de sa surface financière, avec une remise de 10 % et un crédit fournisseur. Mais le non respect de ses engagements a remis en cause ce contrat. Ceci étant, le développement de la petite irrigation reste dans la zone encore trop réduit pour que la concurrence puisse jouer à plein. Le projet d'ouverture d'un magasin de pièces par SEDIMA ou encore les engagements pris par SOMIA à Diré dans le cadre du projet PACEEM pourraient améliorer la situation dans ce domaine.
69 Un des importateurs principaux de GMP et accessoires

178
La méfiance réciproque entre mécaniciens et OP: elle est alimentée par les délais d'intervention des mécaniciens, les ruptures de stock de pièces détachées et par la qualité des entretiens réalisés. De leur côté, les mécaniciens déplorent les retards de paiement des OP (notamment en soudure), les interventions "sauvages" sur le moteur ou la qualité du gas-oil acheté par les villageois. En fait cette méfiance traduit l'opposition entre deux stratégies opposées :
- d'une part, les OP cherchent logiquement à minimiser les coûts de maintenance des GMP, que l'enclavement et la faible responsabilisation des motopompistes villageois dans le dispositif rendent particulièrement onéreux;
- de l'autre, les mécaniciens privilégient les interventions les plus rémunératrices, c'est à dire les contrats d'entretien passés avec les projets (dont VRES), au détriment de leurs contrats directs avec les OP.
Dans ce contexte, le choix du projet d'ouvrir des espaces de dialogue entre fournisseurs de matériels et de pièces détachées, mécaniciens, OP – comme la réunion d'Ambiri de novembre 1998 – paraît indispensable. Cette rencontre a été l'occasion d'une réflexion sur les évolutions nécessaires du dispositif général d'entretien. Elle a débouché sur 2 grandes mesures concrètes, destinées à réduire les frais de maintenance :
- formation de motopompistes à l'entretien courant : la formation est réalisée par des prestataires non impliqués dans le dispositif actuel et sera doublée d'un suivi rapproché des motopompistes villageois durant leur première année d'intervention. Notons que cette réorganisation des modalités d'entretien des GMP risque de conduire très rapidement à la réduction du nombre de mécaniciens sur zone, ce qui déplacerait le problème des entretiens courants aux réparations.
- Gestion d'un stock de pièces détachées sur sites : la formation des motopompistes doit s'accompagner de la mise à disposition sur les sites de stock de pièces de rechange pour l'entretien usuel des GMP. Ce Stock pourrait être géré par les comités inter-PIV.
Pour conclure, on rappellera d'abord que toutes ces données stratégiques sur les coûts de fonctionnement et d'entretien des équipements restent très incertaines. Un suivi rapproché est ici tout à fait indispensable pour disposer de bonnes références technico-économiques. De même, le projet, en collaboration avec les ONG et les groupements, pourrait mettre en place un suivi du gasoil, dont la mauvaise qualité est probablement responsable de nombreux problèmes techniques.
Pour ce qui concerne le dispositif de maintenance des GMP, on conviendra d'abord que la création d'un secteur privé performant dans le domaine de la mécanique ne se décrète pas. L'opération prendra du temps et suppose des appuis sous diverses formes. De même, la concurrence peut difficilement jouer, sans un élargissement du marché, ce qui suppose une multiplication des GMP et donc de la petite irrigation. En attendant, la subvention partielle des frais de maintenance des OP (par exemple par une participation aux frais de déplacement) se justifie sans doute dans les conditions actuelles d'éloignement et d'enclavement. Il serait également possible de former quelques mécaniciens installés70 dans les petits centres locaux pour assurer un minimum de suivi/réparations. La tenue très approximative des documents comptables Si les divers documents comptables utilisés ont l'avantage d'être simples, ils sont rarement remplis de façon systématique et rigoureuse, ce qui alimente les conflits et les contestations. La situation 70 Par exemple, les réparateurs motos/mobylettes que l'on trouve dans toutes les petites villes rurales comme Youwarou ou Korientzé à défaut de mécanicien auto
179
tient d'abord aux insuffisances du dispositif de formation, qui sont accentués par les fréquents renouvellements des Comités de Gestion. Mais le manque de rigueur s'explique aussi parce que la plupart des exploitants ne voient pas l'utilité d'une bonne tenue comptable et ne remplissent le plus souvent les documents que parce que l'encadrement leur a dit de le faire. C'est ainsi que les fiches de stock sont rarement comparées aux stocks réels. De même, on n'utilise pas les cahiers de suivi des motopompes à des fins concrètes, par exemple pour effectuer des entretiens périodiques. En clair, les documents comptables ne sont pas utilisés comme des outils de gestion. On conviendra sur un autre plan que la rigueur comptable se doit d'être soutenue par une contrainte légale ou contractuelle, avec en parallèle un dispositif d'avantages ou d'incitations, comme par exemple la possibilité d'accéder au crédit – ce qui n'est pas le cas actuellement. L'approche non-directive du système d'aide actuel touche ici ses limites. Il serait donc souhaitable à l'avenir d'envisager une meilleure contractualisation des apports, tout en faisant de la bonne tenue comptable une condition de l'accès au crédit ou à d'éventuelles subventions. Un système de comptes certifiés pourrait dans ce cadre être envisagé. 4.1.4. Perspectives Au total, on conviendra que le début de structuration des associations de périmètres reste encore très embryonnaire. Les comités de coordination cumulent en fait les problèmes internes de gestion ou d'organisation de chacun de leurs membres, problèmes qui se répercutent au niveau de l'ensemble. C'est ainsi que chaque renouvellement de CG au sein d'un périmètre se traduit par la nécessité de recomposer la coordination. De plus, chaque comité se heurte à l'absence de ressources propres, ce qui s'explique par la faiblesse de ses activités, tout en en réduisant la possibilité. De façon générale, les fonctions actuelles des comités sont en réalité plus socio-politiques qu'économiques. Ce rôle d'arbitrage des conflits internes, mais aussi de représentation auprès du projet, comme des autorités, est certes important, mais leur faible capacité de gestion limite, voire interdit, au stade actuel tout développement significatif. On a vu par ailleurs que l'encadrement reste assez "attentiste", du fait de sa volonté de respecter l'autonomie des dynamiques locales, sans les casser. On conviendra toutefois qu'une telle position, aussi justifiée soit-elle, n'exclue pas des efforts accrus en matière de formation, information, conseil des comités, coordination, qui pourraient (comme ailleurs) fournir à termes des services stratégiques aux producteurs: vente d'intrants et de matériels ; commercialisation des produits ; location et réparation de GMP ; services d'audit et de conseil (…). Deux grands problèmes encore non résolus méritent dans ce cadre une attention particulière : celui du financement des Comités inter-PIV (avec notamment toutes les questions liées à l'accès au crédit) et celui de leur absence de statut légal. Ils conditionnent le développement à terme de ces organisations avec le renforcement de leurs capacités de gestion. En conclusion, les aménagements du VRES sont à l'origine d'une forte dynamique foncière, économique et politique au niveau des villages, qui tient d'abord à l'importance que les périmètres représentent en termes de revenus et de sécurité vivrière. Cette dynamique s'exprime entre autres par une très forte implication des élites locales au sein des groupements: chefs de village, imams, gros propriétaires fonciers, commerçants, responsables politiques (chacune de ces catégories pouvant se cumuler), dont les intérêts et les stratégies sont loin de toujours coïncider. Les contradictions, les luttes et les diverses stratégies de groupes et d'individus, qui sont en jeu dans les villages et maintenant dans les communes, se retrouvent ainsi projetés au sein des périmètres et
180
des associations, dont le contrôle devient un important enjeu de pouvoir à la fois politique et économique. Au-delà de quelques cas patents de détournement, malgré tout relativement rares, la plupart des crises auxquelles doivent faire face les organisations paysannes sont de fait attisées par des conflits de personnes et de stratégies. De façon générale, l'investissement des organisations paysannes par les diverses forces sociales témoigne de l'importance des périmètres. Mais si les élites conservent le plus souvent un poids déterminant, le jeu est désormais plus ouvert et on voit émerger dans le sillage des PIV ou des MIG de nombreux leaders paysans, qui tiennent à prendre leur part dans les actuelles recompositions en cours, notamment dans les luttes de pouvoir qui s'organisent au niveau des nouvelles communes. Exemple de l'importance des évolutions en cours : l'exclusion au niveau d'un PIV d'un chef de village qui ne payait pas ses redevances, ce qui était probablement impensable il y a seulement quelques années. Ceci posé, tout le diagnostic témoigne d'une certaine précarité de la très grande majorité des organisations paysannes. Cette précarité tient à plusieurs causes de nature interne ou externe et notamment : le manque de formation, l'incertitude foncière, l'absence de statut légal et la fragilité de leur situation financière, qui est amplifiée par la faiblesse des capacités de gestion, le coût et les insuffisances du système de maintenance des équipements et la non maîtrise des marchés. Le point crucial reste bien sûr le problème du renouvellement des motopompes, qui reste dans le contexte actuel très incertain, du fait des faibles marges financières dont disposent les OP, des incertitudes pesant sur la commercialisation des boisements et de l'absence actuelle de tout autre système de financement. La viabilité des organisations actuelles n'étant pas assurée, leur développement suppose le maintien d'un appui et l'amélioration qualitative du dispositif d'aide actuel. Les limites de l'intervention actuelle Des conseils aux producteurs de qualité inverse Comme on l'a vu, AFAR joue plus ou moins le rôle de "conseil technique" du projet pour les questions agronomique, de gestion et de boisement. C'est également AFAR qui a le plus approfondi la réflexion sur les stratégies d'intervention et de conseil technique auprès des producteurs. Durant les deux premières campagnes, les associations et les producteurs bénéficient d'un suivi rapproché et d'un encadrement assez directif : il s'agit de réussir la première campagne et de permettre l'apprentissage de nouvelles techniques intensives. L'accent est mis sur l'organisation d'une pépinière collective, la gestion de l'irrigation, la fertilisation à dose pédagogique et le choix de la variété. A partir de la deuxième campagne riz, une plus grande autonomie fondée sur le principe de l'apprentissage par essai-erreur. On peut cependant regretter que l'encadrement n'essaye pas de réduire l'impact négatif de certains choix techniques71 en encourageant les producteurs à pratiquer des tests sur des surfaces limitées par exemple. Le conseil technique, de façon générale, se centre sur les différentes opérations de l'itinéraire technique de la riziculture, de la plantation des eucalyptus ou des cultures maraîchères. Une attention particulière a été apportée à la formation des pépiniéristes villageois. On peut regretter l'absence de référentiel technique en matière de culture de diversification et parfois de maîtrise réelle de ces cultures par les agents d'encadrement. 71 Par exemple, l'implantation d'une variété de 180 jours comme BG-90-2 en contre saison chaude au lieu d'une variété de cycle court avec les conséquences sur la durée du cycle et donc les consommations d'eau et l'organisation du travail de l'hivernage.
181
La nécessité de faire évoluer les appuis-conseils pour répondre à la complexité croissante des problèmes Les relativement bons résultats techniques en riziculture témoignent cependant d'une véritable appropriation de ces techniques intensives. Cependant, les problèmes techniques évoluent et se complexifient. Il s'agit désormais d'appuyer les CG dans les opérations de commercialisation (bois, produits maraîchers), dans les questions d'organisation du travail et de planification des activités dans le pilotage technico-économique du périmètre. Il s'agit donc de renouveler les approches en matière de conseil, en s'engageant dans une démarche d'information des groupements sur l'évolution des marchés, sur les matériels motorisés utilisés et sur les stratégies de renouvellement du matériel possible. On soulignera également la nécessité d'un accompagnement technique particulier des femmes et des jeunes, qui tienne compte des difficultés spécifiques rencontrées par ces dépendants – notamment leurs plus faibles marges de manœuvre en matière de mobilisation de main d'œuvre et d'argent. Un conseil en gestion élargi L'encadrement focalise actuellement son appui sur la maîtrise du calcul de la redevance. La plupart des CG acquièrent une rapide autonomie dans ce domaine, sauf en ce qui concerne le calcul de l'amortissement, le plus souvent trop complexe pour être maîtrisé par les paysans, et il convient ici de revenir à des principes plus simples en matière d'amortissement, calculé sur une base annuelle. Comme on l'a déjà vu, le diagnostic annuel des comptes des OP effectué par AFAR répond à un véritable besoin d'audit. Il serait donc intéressant d'approfondir la réflexion sur ce rôle de l'encadrement comme "centre d'audit" et/ou de certification des comptes. Mais cela nécessiterait une clarification des relations entre les CG, le projet et les ONG d'encadrement. Cette contractualisation permettrait de préciser les engagements réciproques des différentes parties. Une participation des CG au financement de cette prestation et au choix de leur "conseiller" pourrait être prévue et étendue sous conditions de financement aux périmètres privés (PIL) qui le souhaiteraient. Au delà de cette fonction d'audit, ces conseillers en gestion pourraient être chargés de l'information des CG dans leurs relations avec l'environnement économique : évolution des marchés, accès au crédit, rentabilité des investissement, etc. Comme pour les questions plus techniques, il s'agit en fait de fournir aux gestionnaires des OP des informations qui leur permettent d'orienter leurs décisions. Les compétences de ces conseillers devront donc être à la fois techniques, comptables et économiques. L'accent pourra être mis sur :
- le problème de la gestion de la fertilité des périmètres ; - les problèmes de commercialisation et de mise en marché des productions (diffusion de
mercuriale ou d'information sur les filières de l'amont à l'aval, mises en contact avec les différents opérateurs) ;
- l'organisation et la diffusion de références technico-économiques sur le matériel motorisé de pompage, mais aussi tous les matériels qui pourraient être amenés à être diffusés dans la zone (décortiqueuse, batteuse). Ce référentiel devrait être étendu aux qualités des intrants, et notamment à la qualité du gasoil ;
- l'appui à l'organisation du travail et à la planification des activités pour éviter les retards de mise en place des cultures ;
- un appui rapproché aux inter-PIV. Une fonction mal maîtrisée : l'aval des filières

182
Le projet est resté dans une optique d'urgence, malgré un accroissement notable des productions et n'a pas suffisamment pris en compte les problèmes de marché et de commercialisation. Il convient donc de passer d'une optique de type aménagiste à une logique d'intervention qui prenne en compte l'ensemble des filières. Des marchés mal connus Les marchés des différents produits agricoles des périmètres irrigués (riz, produits maraîchers ou boisement) restent très mal connus. Le projet n'a fait aucun relevé de prix sur le riz/paddy, ni sur les principales spéculations maraîchères (et produits dérivés), que ce soit à Mopti ou sur les autres marchés du Delta. Or ces prix connaissent d'importantes fluctuations, d'une zone, d'une saison et d'une année à l'autre. D'autre part la rentabilité des périmètres irrigués est largement conditionnée par le prix du paddy et les possibilités d'écoulement des autres spéculations. Du fait même de l'accroissement des productions, la connaissance et le suivi régulier de ces filières sont donc essentiels. Des filières courtes sur des marchés étroits Le Paddy Les marchés agricoles locaux sont caractérisés par l'existence de filières courtes et l'atomisation de la commercialisation. Les ventes sont le plus souvent réalisées par les femmes. Pour le paddy, comme pour les autres produits, les ventes en gros sont tout à fait exceptionnelles, ce qui confirme l'étroitesse des marchés locaux72. Les prix varient comme ailleurs fortement suivant la période de l'année, avec une forte hausse pendant la soudure. Mais les prix locaux du paddy sont avant tout sensibles à la production du riz de mares. Sur ce plan, on a vu que le projet a bénéficié depuis la dévaluation d'une conjoncture très favorable, qui a permis de maintenir le riz à des prix élevés et en moyenne largement supérieurs à ceux qu'on peut observer sur d'autres régions du Mali : autour de 125 FCFA le kg de paddy à la récolte, avec des pointes de 200 FCFA à la soudure, dans les zones les plus enclavées, comme Takouti. On soulignera que de tels prix, qui tendent à gonfler la rentabilité actuelle du riz VRES, ne sont en rien garantis. La zone a d’ailleurs connu des chutes importantes de prix en 1993, en 1994 et même en 1995, du fait d’une forte production locale, doublée parfois de gros imports au niveau national. Le kg de paddy est alors descendu jusqu’à 70 FCFA, voire même dans certaines zones à 60 FCFA. Ceci étant, les marchés locaux du paddy restent dans une certaine mesure protégés par leur enclavement, ce qui renchérit le prix local du riz d’import surtout vendu à la soudure. Rappelons que le décorticage est réalisé par les femmes, presque toujours de façon manuelle. Les marges sont très mal connues. Mais tout indique qu’elles sont réduites. Le schéma joint présente les marges à titre indicatif sur la base de prix recueillis à la récolte sur le village de Diogui (cercle de Youwarou). Producteur C.G. Périmètre Commerçant (Saba) Consommateur 125 FCFA/kg 135 FCFA/kg 140 FCFA/kg 72 Le périmètre de Diogui, en 1998 a cédé 4 tonnes de paddy à un commerçant qui l'a revendu dans un village des environs sans périmètre. Mais de telles quantités sont assez exceptionnelles. Certains précisent qu'ils cherchent à freiner ce type d'achat "de gros"afin d'éviter une trop longue pénurie de paddy au village.
183
On soulignera qu’une bonne partie du paddy commercialisé l’est entre avril et juin, en fonction des prix sur les marchés locaux et des besoins financiers des groupements qui doivent lancer la nouvelle campagne et notamment acheter les intrants. Des quantités plus réduites sont vendues en dehors de cette période, suivant les besoins de trésorerie des exploitants ou des périmètres. On notera enfin des différences assez sensibles selon les variétés de riz, en fonction des préférences des consommateurs. Tout ceci devrait être systématiquement étudié et les informations transmises aux producteurs. Les cultures maraîchères L’étroitesse des marchés est encore plus préoccupante pour les cultures maraîchères, qui se conservent mal. Le plus gros marché régional, celui de Mopti, reste très limité, au regard des autres centres secondaires du Mali. Il est de plus approvisionné aux ¾ de la zone péri urbaine et les paysans du pays dogon (Chauvin, 1998). A titre d’exemple, le marché de la pomme de terre de la ville de Mopti est estimé à 200 T seulement, soit de 10 à 12 ha par an – alors que le projet a appuyé et encadré près de 4 ha en 1998. Les zones maraîchères encadrées par le VRES ne participent significativement à l’approvisionnement de cette ville que pour le gombo. La Mauritanie serait également un débouché important pour le piment et le gombo en sec du cercle de Youwarou, au nord. La commercialisation des boisements La valorisation des boisements se heurte aux mêmes difficultés de méconnaissance des marchés ou de prise en compte tardive des potentialités réelles de ces filières dans la région. Or, tout indique que le marché de Mopti, qui est le seul à avoir fait l’objet de premières prospections, est à la fois étroit, atomisé et peu susceptible d’absorber de grosses quantités de perches en même temps. Le problème est d’autant plus crucial que certains boisements doivent être exploités si on veut profiter au mieux de la capacité à rejeter. D’autre part, le produit de cette vente était censé permettre le renouvellement des GMP. Plusieurs voies pourraient être explorées : l’eucalyptus fait un excellent charbon ou bois de feu, mais la région dispose de très importantes ressources, notamment en bois mort ; il fait des perches de construction intéressantes et pourrait être transformé en chevron et dans une moindre mesure en planches, pour autant que leur qualité permette de concurrencer les bois locaux ou importés de Côte d’Ivoire ou du Ghana à des prix réduits. Il s’agit donc d’évaluer les potentialités des différentes options en fonction du marché et de ses exigences, ainsi que les modes de gestion des peuplements en fonction des modes d’exploitation (perches ou arbres). Cette évaluation technico-économique devrait faire appel à des spécialistes des filières bois dans la sous région pour étudier l’ensemble des problèmes de transformation et commercialisation des boisements, sans exclure d’autres marchés que celui de Mopti. S’il revient aux paysans de prendre les décisions leur permettant de valoriser au mieux ce capital, ils doivent être informés des différentes opportunités et potentialités et être mis en contact avec les différents opérateurs des filières concernées. Le VRES pourrait être aussi amené à appuyer certaines opération d’aval par le biais des opérateurs privés, afin d’améliorer le stockage, la transformation et le transport du bois.

184
La nécessité d’une action en matière de crédit agricole Le développement de l’intervention et surtout sa viabilisation supposent aujourd’hui une réflexion approfondie sur le crédit agricole. De fait, le volet crédit n’a pas été pris en compte au démarrage du projet, sinon dans une optique « sociale » centrée sur les groupements féminins et les activités d’aval (notamment la commercialisation du riz). Ce qui, entre autres, laissait de côté tous les aspects liés au renouvellement du matériel. Or, les structures de crédit sur lesquelles peuvent s’appuyer les producteurs de la zone pour s’équiper sont encore très embryonnaires. A cet effet, deux études ont été commanditées en novembre 2000 par le VRES ayant porté sur les aspects reboisement (avec d'autres essences et crédit)73.
- Le secteur bancaire formel Le secteur bancaire formel a peu de relations directes avec les agriculteurs, sinon par le biais de certains projets. La BNDA par exemple a dans le cadre des rapports avec Nyeta Mousso (Projet d’appui aux initiatives des femmes à Mopti et Sévaré) ; avec les caisses villageoises soutenues par CIDR dans le pays Dogon (300 millions de crédits en cours à 10 ou 12 % de taux d'intérêt) et aussi la NEF, qui promeut des caisses populaires dans le Korombana (CPK). Mais c’est à peu près tout. Avec le VRES il n’y a pas de convention formalisée. Si les OP du projet ont en général un compte ouvert à la BNDA, l’obtention d’un crédit reste tout à fait exceptionnelle, car les garanties exigées sont hors de portée de la quasi totalité des groupements ou exploitants. De façon générale, les relations du secteur bancaire formel avec le monde agricole relèvent aujourd’hui pour l’essentiel du gardiennage de fonds (l’épargne est rémunérée à 3,5%) et le directeur de la BNDA/Mopti estime que 95 % des crédits alloués aux paysans passent désormais par le micro-crédit décentralisé.
- Le crédit décentralisé On compte désormais de nombreux systèmes de crédit décentralisé dans la 5ème région, comme les CVECA du pays Dogon, Nyeta Mousso, Kondo Jigima, les CREC, etc. D’autres structures sont entrain d'être implantées, notamment sur Korientzé (où se concentrent d’importants revenus issus de l’élevage). Mais la zone VRES reste encore mal couverte, à l’exception de la zone NEF et de Kona, où une caisse Kondo Jigima a ouvert ses portes. Ces caisses développent des relations avec les opérateurs villageois. C’est ainsi que l’association des périmètres privés de Kona a obtenu des crédits de campagne auprès de la caisse locale de Kondo Jigima. Certains périmètres du VRES ont été approchés et seraient entrain d’y d’ouvrir des comptes. On soulignera toutefois que tous ces systèmes décentralisés fournissent avant tout des crédits court terme (le plus souvent de commercialisation), tout en se concentrant sur le secteur ou les petits centres urbains. Si des OP peuvent obtenir des crédits de campagne, à des conditions probablement plus intéressantes qu’avec certains types de crédit fournisseur, le problème du crédit équipement reste entièrement posé. En effet, la viabilité des périmètres mis en place suppose le renouvellement régulier des GMP, or, peu de périmètres on des fonds nécessaires pour procéder ce rachat ou les garanties exigées pour obtenir un crédit auprès du secteur bancaire, comme du système décentralisé. Le seul périmètre VRES à avoir jusqu’ici racheté un GMP est celui de Deybatta (l’ancienne machine sert désormais de secours). Mais cet achat (11 millions de FCFA) n’a pu se faire que parce que le périmètre disposait d’une épargne importante (8 millions de FCFA, ce qui est exceptionnel) et qu’il a pu 73 Etude bilan/diagnostic des systèmes de crédit en zone VRES et proposition d'actions dans le cadre du 8ème FED, Bakary S. Coulibaly, Manda Sadio Keita, Sidi Mohamed Touré. Novembre 2000.
185
bénéficier d’un prêt individuel de 3 millions d’un ancien Talibé de l’imam, qui est aussi le chef de village. Toutes ces conditions sont peu reproductibles et la plupart des périmètres éprouveront de très grosses difficultés, au vu de leur trésorerie et du contexte bancaire actuel, pour pouvoir renouveler leur équipement. On a vu les conditions usuraires auxquelles se soumettent certains périmètres d’initiative locale pour obtenir un crédit "fournisseur". L’absence d’un crédit à moyen terme, permettant de financer l’équipement agricole dans des conditions compatibles avec la rentabilité actuelle des cultures irriguées, devient un obstacle majeur au développement de la micro-irrigation, mais aussi à sa simple survie. De plus, une fois passée la phase test, le développement des micro-périmètres du type MIG ne pourra plus à l’avenir reposer sur une subvention à 100% des GMP. La mise en place d’un système de crédit agricole devient dans ce contexte indispensable. Elle devra s’appuyer sur les systèmes financiers décentralisés, qui se développent dans la région, avec lesquelles des conventions pourraient être envisagées. Les insuffisances de GRN et de la recherche-action
- Différentes opérations ponctuelles peu coordonnées Le volet GRN regroupe une série d'actions - test d'assez modeste envergure. Mais le projet se centre sur la faisabilité technique des activités proposées, puis encourage leur diffusion, sans que l'ensemble des implications techniques et socio-économiques ait été soigneusement évalué, notamment avec les producteurs, après les premiers tests. En l'absence d'une véritable étude de marché, on peut ainsi se demander si la bourgouculture irriguée est réellement rentable dans une région où cette plante est endémique. Pour ce qui concerne les aménagements de bas-fonds en cours dans la zone NEF, on peut également regretter que les expériences comparables dans la zone Mali sud n'aient pas été prises en compte. Des entretiens avec les producteurs laissent à penser que la mise en valeur semi-intensive projetée ne semble pas correspondre aux stratégies développées par les producteurs, plutôt centrées sur l'extensif.
- Nécessité d'un cadre local de cohérence De façon générale, les activités regroupées sous le terme de GRN sont des opérations ponctuelles développées en dehors d'un cadre de cohérence, intégrant l'ensemble des acteurs qui sont les gestionnaires de ces ressources au niveau local. De ce fait, leur impact et leur appropriation ne peuvent être que limités. Le développement d'une véritable politique de gestion des ressources naturelles dans les zones d'intervention VRES nécessiterait une plus grande implication des populations (paysans, mais aussi pêcheurs et éleveurs) dans la définition des axes d'intervention, ainsi que l'évaluation de ces interventions. Cela implique le développement d'outils adaptés de programmation et de négociation entre acteurs autour de la gestion de ces ressources, outils qui soient adaptés aux cadres villageois et communal. L'intégration de la programmation au niveau villageois permettrait une meilleure synergie entre les différentes activités économiques proposées par le VRES, voire l'exploitation de nouvelles orientations techniques : périmètres semi-submersibles ; nouveaux modes d'intégration riz/pisciculture et riz/élevage, etc.
4.2. Projet Pilote de Promotion de l'Irrigation Privée (PPIP)
186
4.2.1. Présentation et mise en oeuvre du projet
Le PPIP est une opération pilote d'assistance technique visant à lever les principaux obstacles au développement de la petite irrigation privée. Les efforts de renforcement des capacités du sous-secteur prévu par le projet devraient inciter et aider les agriculteurs à effectuer des investissements productifs dans l'irrigation et à améliorer leurs techniques d'irrigation et de culture. Le renforcement des capacités du personnel des banques maliennes en matière d'évaluation de projets d'investissement dans la petite irrigation et de la capacité des producteurs à élaborer des plans d'investissement adéquats devrait permettre d'améliorer les liens entre le secteur financier et l'irrigation privée. Objectifs du projet L'objectif global du projet consiste à induire une amélioration et une expansion des investissements dans la petite irrigation par des activités de renforcement des capacités, de façon à contribuer à la diversification des investissements sur l'exploitation, à l'accroissement de la productivité et de la sécurité alimentaire. L'objectif à moyen terme de cette opération pilote est de fournir aux petits irrigants davantage de services d'appui technique et de gestion pour les mettre mieux à même :
- d'identifier les investissements en matériels, infrastructures d'irrigation qui offrent le meilleur rapport coût-efficacité;
- d'exploiter et d'entretenir ces équipements; - d'établir des demandes de prêts pour les soumettre à des institutions financières et d'obtenir
des crédits pour l'investissement dans l'irrigation; - d'améliorer la sécurité alimentaire de leurs actifs, y compris de leurs droits fonciers et; - de développer leurs capacités (de producteurs indépendants et de groupements de
producteurs) en matière de gestion organisationnelle et financière et de gestion de micro-entreprises.
Le projet se devait par des actions de formation, renforcer :
- les compétences des institutions financières en matières d'évaluation des projets d'investissement dans l'irrigation, et.
- Les performances techniques des consultants indépendants et des bureaux d'études intervenant dans le secteur.
Les investissements sur l'exploitation concernaient environ 400 ha à réhabiliter et quelques 600 ha de nouveaux périmètres irrigués. Cette opération de petite irrigation comportait l'aménagement de bas-fonds, de périmètres irrigués individuels dans des zones urbaines, de systèmes de pompage villageois, ainsi que la réhabilitation de périmètres existants. Les activités du projet étaient fonction de la demande et, puisqu'il s'agissait d'une opération pilote, elles se sont limitées à certaines zones géographiques choisies parmi celles où la petite irrigation est la plus développée. La réussite du projet devrait être mesurée par la disposition des bénéficiaires à payer une part accrue du coût des services et par la capacité du secteur privé à mesurer ces activités. Description du projet Le Projet Pilote de Promotion de l'Irrigation Privée est une action pilote dont l'objectif global de développement consiste à induire une amélioration et une expansion des investissements dans la petite irrigation par des activités de renforcement des capacités de façon à contribuer à la diversification des investissements sur l'exploitation, à l'accroissement de la productivité et à la sécurité alimentaire.
187
Il s'agit d'un projet de recherche - développement et de renforcement des capacités qui doit permettre d'améliorer les compétences techniques des institutions privées, appelées à appuyer et à financer des investissements dans la petite irrigation. L'opération qui couvrait le District de Bamako et certaines localités des régions de Koulikoro (Koulikoro, Kati), de Ségou (Ségou, Bla, San), de Sikasso (Sikasso, Bougouni) et de Mopti (Mopti, Djenné) était prévue pour une durée de 4 ans. La zone d'application du projet devrait être couverte progressivement en commençant par le District de Bamako et les régions de Koulikoro, Ségou et Sikasso durant les deux premières années. A la lumière de ces résultats, les activités du projet devaient s'étendre à la région de Mopti après évaluation à mi-parcours. Le projet est ciblé principalement sur les producteurs (hommes et femmes) de quatre types d'exploitation se différenciant par la superficie aménagée pour l'irrigation :
les jardins familiaux qui ont moins de 0,5 ha; les exploitations ayant de 0,5 à 5 ha de superficie; les exploitations ayant de 5 à 10 ha de superficie; les exploitations de plus de 10 ha de superficie.
Le projet comprenait 7 composantes :
1) Appui à l'organisme d'exécution; 2) Services d'appui technique et de gestion des activités de formation; 3) Services juridiques et études techniques; 4) Tests d'équipement d'irrigation; 5) Renforcement des capacités; 6) Suivi et atténuation de l'impact sur l'environnement; 7) Enquêtes et études socio-économiques.
Dimensions socio-économiques du projet Pour la préparation du projet, deux grandes enquêtes ont été réalisées. Les principaux résultats suivants ont été obtenus : La région de Bamako/Koulikoro regroupe 76% des activités d'irrigation du pays concernant les petits périmètres irrigués. La superficie moyenne des exploitations irriguées est de 2,4 ha, 3 ha, 5 ha et 10 ha respectivement dans le District de Bamako et les régions de Ségou, Koulikoro et Mopti. La superficie des exploitations est très variable à l'intérieur des régions ou du District de Bamako. Elle va de 0,25 ha à 7 ha dans le District de Bamako. La superficie irriguée est généralement inférieure à 0,5 ha. La majorité des exploitations sont gérées par des particuliers. Seules 8% des exploitations irriguées de la région de Koulikoro sont gérées collectivement, mais cette proportion passe à 21% dans la région de Mopti et 23% dans la région de Ségou. Les cultures pluviales sont généralement les céréales (mil, sorgho, maïs et riz) et les cultures irriguées sont dominées par les légumes (tomate, oignon, choux-fleurs). Seuls 15% de la population active sont alphabétisés, dont 20% d'homme et 7% de femme. Concernant l'accès des producteurs aux services d'appui technique et de gestion, il est limité et 70% des agriculteurs de la région de Koulikoro disent ne pas avoir accès à ces services. La plupart des producteurs ont recours à des techniques d'irrigation primitives. La majorité des exploitants qui ont des jardins potagers (en moyenne, une superficie irriguée de 0,5 ha) emploient des techniques très rudimentaires, c'est-à-dire qu'ils vont puiser de l'eau au moyen de seaux à des puits peu profonds, dans les cours d'eau ou des mares. Chez d'autres irrigants, le matériel
188
d'irrigation, souvent vétuste, est mal entretenu et sous-utilisé. Les installations sont souvent composées d'éléments hétéroclites. L'étude d'avant projet estime les investissements moyens à l'hectare à :
0,9 million de FCFA dans le District de Bamako; 1,2 million de FCFA dans la région de Koulikoro; 0,4 million de FCFA dans la région de Mopti; 2,2 millions de FCFA dans la région de Ségou.
Les aménagements sont généralement autofinancés par les irrigants privés à hauteur de 63% à Koulikoro et 96% à Mopti. La part du crédit dans les investissements va de 5% dans la région de Mopti à 32% dans la région de Koulikoro et 16% dans le District de Bamako. Le mode d'accès à la terre semble reposer essentiellement sur des systèmes fonciers informels. Ainsi, la proportion de terre appartenant aux exploitants ou qui leur est prêtée selon les modalités du système coutumier va de 64% dans le District de Bamako à 88% dans la région de Mopti. Il n'existe de titre foncier que pour 5% des terres irriguées de la région de Koulikoro et 16% de celles du District de Bamako. L'étude économique de base réalisée a dégagé des taux de rentabilité économique des investissements à l'exploitation et de l'amélioration des systèmes de production et des méthodes culturales. Ces taux sont de 32% pour l'aménagement de nouveaux périmètres rizicoles de taille moyenne dans la région de Mopti et de 116% pour la réhabilitation des jardins maraîchers familiaux. L'augmentation du revenu net par habitant consécutive aux activités induites par le projet a été évaluée à environ 100000 FCFA pour les propriétaires de jardins potagers familiaux. Elle se situe entre 165000 et 600000 FCFA pour les petits exploitants et entre 300000 FCFA et plus de 540000 FCFA pour les exploitants moyens. Ces augmentations de revenu de tous les types d'exploitation représentent globalement un accroissement de plus de 100%74. L'étude de Diakité (199875), fait ressortir un taux moyen d'alphabétisation dans la zone du projet de 33% (dont 42% des hommes et 25% de femmes). Cette étude souligne que le système coutumier est de loin le mode d'acquisition de la terre le plus pratiqué dans la zone d'intervention du projet avec en moyenne 79% des exploitations. Dans la zone du projet, 10% des exploitations possèdent un titre foncier, 9% possèdent des titres provisoires et 2% des lettres d'attribution. La typologie des exploitations et les superficies mises en valeur a peu évolué depuis 1996. Les systèmes de culture existants dans la zone d'intervention du projet sont :
- les cultures sous irrigation, essentiellement les fruits et légumes; - les cultures maraîchères (oignon, tomate, pomme de terre…) qui sont en émergence.
Concernant l'approvisionnement en intrants, sont utilisés le DAP, l'urée, le complexe coton, le complexe céréales, le PNT, la fumure organique, les insecticides et herbicides divers. Deux systèmes d'approvisionnement existent dans la zone du projet :
- un système totalement maîtrisé par la CMDT où les producteurs bénéficient du crédit de campagne pour les intrants ainsi que de crédit à long ou moyen terme pour l'équipement en matériel de traction et motorisé ;
- un système totalement libéralisé où les acteurs tissent eux-mêmes des relations d'affaires. Actuellement, avec l'application des programmes d'ajustement structurel au Mali, la CMDT, l'OHVN et l'Office du Niger se sont totalement désengagés du système d'approvisionnement en 74 Ces estimations ont été faites depuis 1996 et ont été actualisées en 1998. 75 Etude socio-économique actualisée du PPIP, décembre 1998.

189
intrants. Ce sont les producteurs eux-mêmes qui, à travers leurs organisations et aidés par les chambres d'agriculture, lancent des appels d'offre pour leur approvisionnement en intrants. Il faut cependant reconnaître que depuis cette libéralisation, les producteurs connaissent de plus en plus des difficultés liées aux retards de certains adjudicataires dans la fourniture des intrants; des difficultés liées à l'accès au crédit intrant des institutions de micro-finance présentes dans la zone.
Tableau 9 : Grille de réalisation des objectifs du projet (en%) Années An.1 An.2 An.3 An.4 Total
Activités (en%)
10 40 30 20 100
Source: Diakité, 1998 1ère année du projet Le démarrage de tout nouveau projet de ce type est marqué généralement par des difficultés d'ordre organisationnel, des problèmes liés à la sensibilisation des acteurs et à leur adhésion aux objectifs du projet. C'est ainsi que concernant le PPIP, de par son caractère de projet pilote, il a été décidé se limiter les ambitions pendant la première année, ce qui explique l'objectif fixé de 10% de réalisation des activités pendant l'an 1 du projet. 2ème année du projet La sensibilisation des acteurs et des différents partenaires étant acquise, la mise en œuvre du projet est effective et le personnel est formé. Le projet peut ainsi réaliser les 30% de ses objectifs. 3ème année du projet La vitesse de croisière est atteinte en fin de deuxième année. La troisième année correspond à la période de plein essor du projet et on peut ambitionner de réaliser le maximum des activités, soit 40% des objectifs fixés. 4ème année du projet Le projet, après deux années de pleine activité tend vers sa fin. Les 20% restants des activités sont réalisés pendant la 4ème année.
Tableau 10 : Nombre de conseils apportés à des irrigants privés Indicateurs responsables An1 An2 An3 An4 TOTAL Conseil juridique APROFA/Consultants 45 135 180 90 450 Conseil en gestion APROFA/Consultants 50 150 200 100 500 Conseil technique APROFA/Consultants 35 105 140 70 350 Etudes de faisabilité APROFA/Consultants 40 120 160 80 400 Source: Diakité, 1998
Tableau 11 : Aides juridiques Indicateurs responsables An1 An2 An3 An4 TOTAL Demande de titres foncier et provis.
APROFA/Serices techniques et prestataires
25 75 100 50 250
Titres délivrés Gouvernement 19 56 75 38 188 Constitution de groupe de producteurs
APROFA/Consultants 7 21 28 14 70
Source: Diakité, 1998
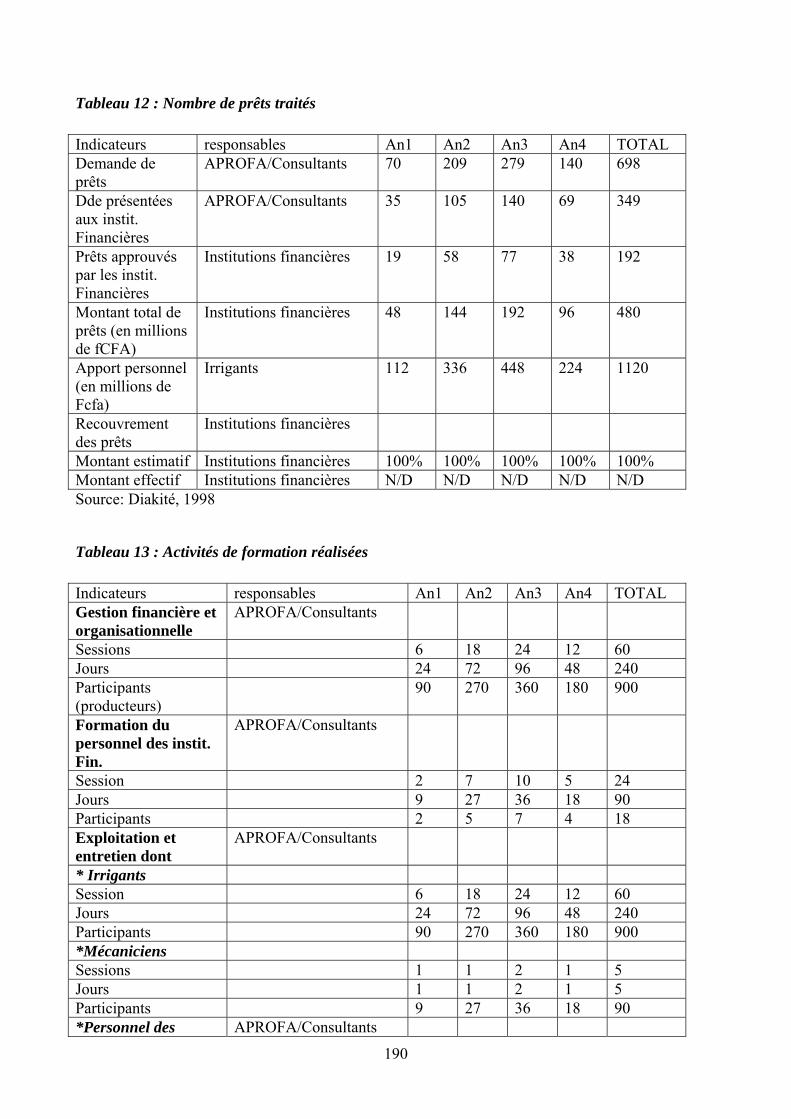
190
Tableau 12 : Nombre de prêts traités Indicateurs responsables An1 An2 An3 An4 TOTAL Demande de prêts
APROFA/Consultants 70 209 279 140 698
Dde présentées aux instit. Financières
APROFA/Consultants 35 105 140 69 349
Prêts approuvés par les instit. Financières
Institutions financières 19 58 77 38 192
Montant total de prêts (en millions de fCFA)
Institutions financières 48 144 192 96 480
Apport personnel (en millions de Fcfa)
Irrigants 112 336 448 224 1120
Recouvrement des prêts
Institutions financières
Montant estimatif Institutions financières 100% 100% 100% 100% 100% Montant effectif Institutions financières N/D N/D N/D N/D N/D Source: Diakité, 1998
Tableau 13 : Activités de formation réalisées Indicateurs responsables An1 An2 An3 An4 TOTAL Gestion financière et organisationnelle
APROFA/Consultants
Sessions 6 18 24 12 60 Jours 24 72 96 48 240 Participants (producteurs)
90 270 360 180 900
Formation du personnel des instit. Fin.
APROFA/Consultants
Session 2 7 10 5 24 Jours 9 27 36 18 90 Participants 2 5 7 4 18 Exploitation et entretien dont
APROFA/Consultants
* Irrigants Session 6 18 24 12 60 Jours 24 72 96 48 240 Participants 90 270 360 180 900 *Mécaniciens Sessions 1 1 2 1 5 Jours 1 1 2 1 5 Participants 9 27 36 18 90 *Personnel des APROFA/Consultants

191
bureaux d'études Session 0 1 1 0 2 Jours 0 15 15 0 30 Participants 0 15 15 0 30 Source: Diakité, 1998
Tableau 14: Tests d'équipements (le test est réalisé sur trois ans selon le cas) Tests Responsables An1 An2 An3 An4 TOTAL Points d'eau APROFA/Consu
ltants/DNAER
- fonçage manuel - 5(3) - - 5 - tarière manuelle - 5(3) - - 5 - tarière mécanique - - 3 - 3 - battage semi-mécanisé
- - 3 - 3
- pointes filtrantes - 5(3) - - 5 - puits améliorés - 5(3) - - 5 Exhaure APROFA/Consu
ltants/DNAER
- arrosoirs plastiques - 3(2) 3 - 6 - pompes Ciwara - 9(5) 3 - 12 - moteur Diesel/essence - 7(4) 8 - 15 Réservoirs APROFA/Consu
ltants/DNAER -
Réservoirs et citernes - 6(3) 5 - 11 Canalisation et gaines souples
- 10(5) 15 - 25
Mesures d'accompagnement
APROFA/Consultants/DNAER
- bancs d'essai moteurs - - 4 - 4 Réseau de distribution APROFA/Consu
ltants/DNAER
- par aspersion - Etudes 3 1 4 - Par goutte à goutte - Etudes 3 1 4 Superficie équipée (ha) - - 75 25 100 Source: Diakité, 1998 NB. Les chiffres entre parenthèses indiquent le nombre relatif aux sept premiers mois
Tableau 15 : Superficies couvertes par le projet (ha) Superficie Responsables An1 An2 An3 An4 TOTAL Aménagée APROFA 60 180 240 120 600 Jardins familiaux 0 0 0 0 0 Petites et moyennes entreprise :
60 180 240 120 600
- de 0,5 ha à 10 ha 53 158 211 106 528 - de 5 ha à 10 ha 5 15 21 10 52 - plus de 10 ha 2 6 8 4 20 Réhabilitée APROFA 40 120 160 80 400
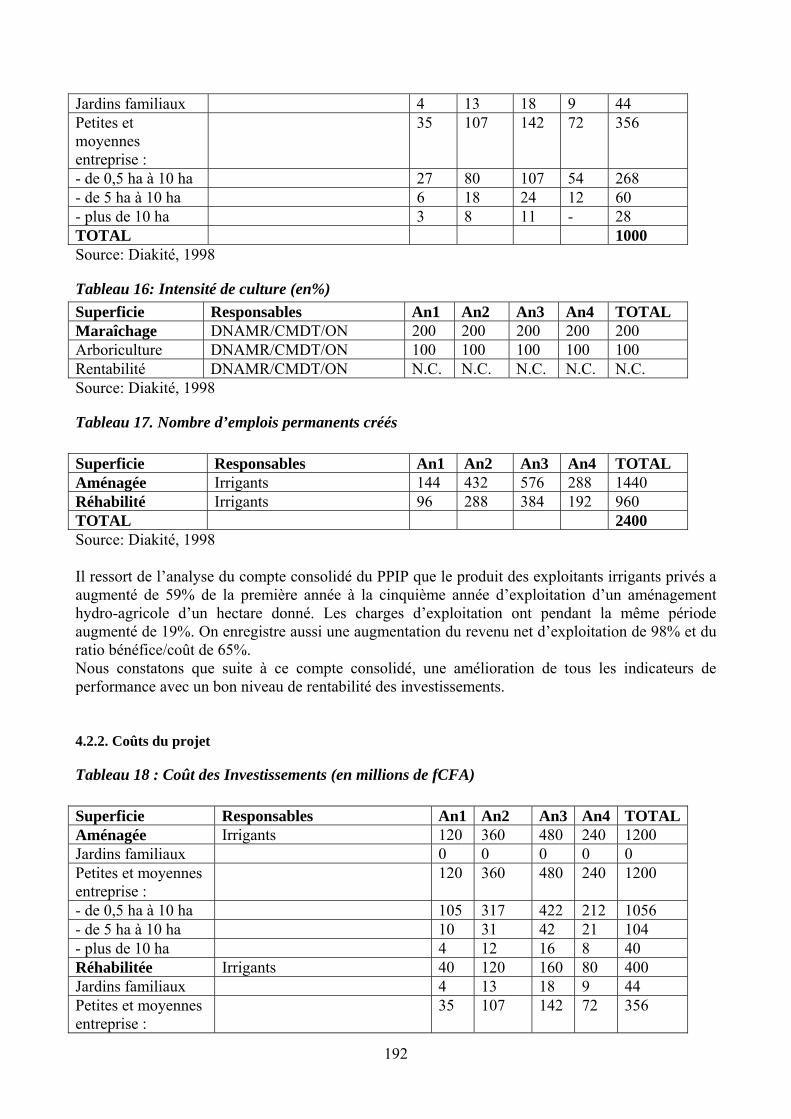
192
Jardins familiaux 4 13 18 9 44 Petites et moyennes entreprise :
35 107 142 72 356
- de 0,5 ha à 10 ha 27 80 107 54 268 - de 5 ha à 10 ha 6 18 24 12 60 - plus de 10 ha 3 8 11 - 28 TOTAL 1000 Source: Diakité, 1998
Tableau 16: Intensité de culture (en%) Superficie Responsables An1 An2 An3 An4 TOTAL Maraîchage DNAMR/CMDT/ON 200 200 200 200 200 Arboriculture DNAMR/CMDT/ON 100 100 100 100 100 Rentabilité DNAMR/CMDT/ON N.C. N.C. N.C. N.C. N.C. Source: Diakité, 1998
Tableau 17. Nombre d’emplois permanents créés Superficie Responsables An1 An2 An3 An4 TOTAL Aménagée Irrigants 144 432 576 288 1440 Réhabilité Irrigants 96 288 384 192 960 TOTAL 2400 Source: Diakité, 1998 Il ressort de l’analyse du compte consolidé du PPIP que le produit des exploitants irrigants privés a augmenté de 59% de la première année à la cinquième année d’exploitation d’un aménagement hydro-agricole d’un hectare donné. Les charges d’exploitation ont pendant la même période augmenté de 19%. On enregistre aussi une augmentation du revenu net d’exploitation de 98% et du ratio bénéfice/coût de 65%. Nous constatons que suite à ce compte consolidé, une amélioration de tous les indicateurs de performance avec un bon niveau de rentabilité des investissements.
4.2.2. Coûts du projet
Tableau 18 : Coût des Investissements (en millions de fCFA) Superficie Responsables An1 An2 An3 An4 TOTALAménagée Irrigants 120 360 480 240 1200 Jardins familiaux 0 0 0 0 0 Petites et moyennes entreprise :
120 360 480 240 1200
- de 0,5 ha à 10 ha 105 317 422 212 1056 - de 5 ha à 10 ha 10 31 42 21 104 - plus de 10 ha 4 12 16 8 40 Réhabilitée Irrigants 40 120 160 80 400 Jardins familiaux 4 13 18 9 44 Petites et moyennes entreprise :
35 107 142 72 356
193
- de 0,5 ha à 10 ha 27 80 107 54 268 - de 5 ha à 10 ha 6 18 124 12 60 - plus de 10 ha 3 8 11 6 28 TOTAL 1600
4.2.3. Contraintes au développement du projet
Les irrigants privés rencontrent les difficultés suivantes :
- difficultés d’accès au foncier ; - difficultés d’approvisionnement en intrants et en matériel d’irrigation ; - non maîtrise des techniques culturales ; - non maîtrise des techniques d’irrigation ; - faible valorisation des produits de l’irrigation privée ; - insuffisance de formation/information.
4.2.4. Perspectives
Le projet PPIP répondait à des besoins certains: (i) il existe un marché local et régional et même international pour les fruits et légumes et il existe au Mali un potentiel d'irrigation important; (ii) les contraintes concernant le niveau technique des exploitants et des organismes chargés de les appuyer et les problèmes de financement des exploitants ne sont toujours pas résolus et (iii) il est nécessaire de lier la production avec la commercialisation, ce qui justifiait la liaison organique avec le projet PAVCOPA. Même si le premier projet PPIP n'a pas connu le succès attendu, cela ne veut pas dire qu'il faut abandonner ses objectifs. Un nouveau projet devrait tenter de les atteindre mais combiné de manière institutionnelle avec un projet de commercialisation des produits agricoles. L'organisation d'un nouveau projet doit impliquer les bénéficiaires, c'est-à-dire que celui-ci soit dirigé par les producteurs et personnes intéressées au succès du projet et non dépendre d'une structure administrative ou para-administrative. Pour promouvoir le secteur privé, le recrutement du personnel et la gestion du projet doivent être souples et non encombrés de procédures qui durent des mois. La plus grande partie des activités doit être sous-traitée, ce qui favorisera l'émergence d'opérateurs locaux spécialisés. S'agissant d'activités en grande partie nouvelles, il faudra insister sur la formation des opérateurs et mettre en place un système de suivi-évaluation performant. Enfin, pour les zones à couvrir par le projet, il fat être modeste et se limiter d'abord aux principales zones actuelles de production, une extension à des zones plus difficiles d'accès devant être programmée ultérieurement. Les deux volets de recherche-développement concernant les techniques d'irrigation et de production doivent être poursuivis conjointement avec une orientation vers la diffusion des résultats et des objectifs et performances. Vu la durée importante des tests pour obtenir des résultats valides, les termes de référence de ces volets devraient être préparés dès la négociation du projet. Le public à viser par le projet doit être limité aux agriculteurs produisant pour le marché et capables d'apporter une partie des fonds, les institutions de crédit ne finançant jamais 100% des investissements. En général, ce sont les producteurs de fruits et légumes (ou de riz dans des conditions favorables). Ce ne sont pas les agriculteurs les plus pauvres et les bénéfices du projet pour la lutte contre la pauvreté ou la promotion des femmes seront plus diffus : sécurité alimentaire,
194
meilleure nutrition, revenus plus élevés, activités de transformation et commercialisation locales données aux femmes. Le financement des investissements agricoles est difficile dans les conditions du Mali, où les taux d'intérêt sont élevés et les garanties que demandent les banques difficiles à satisfaire. Toutes les pistes n'ont pas encore été explorées, y compris l'autofinancement de la plupart des producteurs. Dans tous les cas, il faudra concevoir des projets évolutifs qui croîtront avec la confiance que les financiers accorderont aux investisseurs ou avec les moyens propres des agriculteurs. En raison de l'évolution rapide du secteur financier, une étude doit être menée peu avant le démarrage d'un nouveau projet éventuel.
4.3. Projet d'Appui à la Promotion de l'Irrigation dans le secteur de Maninkoura (PAPIM)
4.3.1. Présentation et mise en oeuvre du projet
Le Projet d’Aménagement du Périmètre Irrigué de Maninkoura, (PAPIM), initié par le Gouvernement malien avec l’assistance du groupe de la Banque Africaine de Développement (BAD), se propose de contribuer à la réalisation de l’objectif de sécurité alimentaire, l’une des priorités de la politique de développement du Mali. Le PAPIM entend contribuer à l’atteinte de ce but à travers l’augmentation de la production agricole, la diversification des revenus, la restauration de l’environnement et la gestion rationnelle des ressources naturelles. Le programme des travaux engagés par le PAPIM comporte :
- la réalisation des travaux d’aménagement du périmètre de Maninkoura, d’une superficie nette de 1094 hectares ;
- l’exécution de la piste rurale Sélingué-Mainkoura, longue de 40 kilomètres ; - la réhabilitation de la zone de maraîchage (environ 60 hectares) du périmètre irrigué en aval
du barrage de Sélingué.
Le périmètre irrigué en Aval du barrage a été aménagé en 1983, et est en exploitation depuis cette date. Objectifs L’objectif sectoriel du projet est la réduction de la pauvreté, le renforcement de la sécurité alimentaire et l’amélioration des conditions de vie des populations.
Le projet devra permettre, à travers cette composante agricole, l’augmentation de la production, le développement des activités économiques rurales conduites par les femmes, la sauvegarde et la protection de l’environnement.

195
Localisation de la zone du projet
La zone du projet, d’une superficie estimée à 1200 km², est située dan la haute vallée du fleuve Niger entre les latitudes 11°30’ et 12°00’ Nord et les longitudes 8°00’ et 8°10’ Ouest. Elle occupe l’extrême Nord de la zone d’intervention de l’Office de Développement Rural de Sélingué (ODRS) qui est située dans la partie sud-est du pays et fait frontière avec la République de Guinée. La zone d’intervention de l’ODRS couvre une superficie d’environ 440 000 hectares s’étendant de la frontière guinéenne à la confluence Sankarani-Niger à Kourouba.
Climat, relief et végétation
Le climat de la zone est de type soudano-guinéen caractérisé par :
• une saison humide pluvieuse s’étalant de juin à octobre avec une faible pluviométrie en
mai ; • une saison sèche et froide de novembre à mi-février et une période chaude de mi-février
à avril. La moyenne de la pluviométrie varie entre 1 100 et 1 300 mm. Il faut noter que depuis 1972, un cycle de sécheresse a provoqué des précipitations sensiblement inférieures aux chiffres énoncés ci-dessus et plusieurs années n’ont connu qu’une pluviométrie variant de 750 à 900 mm. Par exemple en 2000 et en 2001, le cumul a été de 832 mm.
De façon générale le climat ne constitue pas une contrainte majeure pour les différentes cultures de la zone. Une mauvaise répartition de la pluviométrie peut gêner les cultures pluviales. Les températures minimales et maximales délimitent le calendrier agricole et imposent l’utilisation de matériel végétal adapté en terme de cycle de tolérance au froid.
Le relief de la zone est constitué par une succession de plateaux et de buttes cuirassés dont l’altitude varie entre 350 et 400 m. Leur sommet tabulaire se termine par une corniche à éboulis (blocs de cuirasse et de gravillons) laissant parfois apparaître la roche mère.
La végétation, à part quelques galeries forestières situées en bordure des talwegs périodiquement inondés par la crue du Sankarani, est du type soudanien (savane associée à un étage arbustif plus ou moins dense). Le réseau hydrographique est dominé par le fleuve Sankarani, un important affluent du fleuve Niger. CADRE AGRO-SOCIO-ECONOMIQUE Le développement du secteur rural constitue une des priorités de la politique agricole au Mali depuis l’indépendance en 1960. En effet, pays continental sahélien, le Mali est un pays à vocation agropastorale. Le secteur rural représente plus de 40 % de son PNB et ¾ de ses exportations. Environ 80 % de la population s’occupent de l’agriculture. Raison pour laquelle, le développement de la production et de la productivité du secteur demeure une constante préoccupation des autorités du pays. Cette constante s’explique par la précarité de la situation alimentaire due à la persistance de la sécheresse. Les contraintes climatiques (insuffisance et/ou mauvaise répartition de la pluviométrie dans le temps et dans l’espace) font du Mali un pays à déficit alimentaire et à faible revenu, malgré l’existence d’énormes potentialités agro-sylvo-pastorales. Les cultures pluviales ayant montré leurs limites, la tendance générale qui se dégage sur le plan national est le
196
renforcement des capacités des périmètres irrigués. Ainsi l’une des stratégies envisagées pour atteindre la sécurité alimentaire est la valorisation des ressources en eau régulées par des barrages afin de permettre aux populations rurales de diversifier leurs productions et de produire toute l’année.
Ceci entraînera l’augmentation de la production agricole, le développement des activités économiques rurales, notamment celles conduites par les femmes, la sauvegarde et la protection de l’environnement. Etats des lieux Par rapport à la main d'œuvre, les études antérieures ont montré que 85 % des producteurs utilisent la main d’œuvre familiale contre 15 % qui affirment ne pas l’utiliser. Pour ce qui concerne la main d’œuvre salariée, elle est utilisée par 45 % des exploitants. Ainsi plus de la moitié des producteurs (55 %), n’utilise pas de main d’œuvre salariée. Ils utilisent pour l’exécution des tâches, leurs propres enfants et/ou d’autres membres de la famille. Donc l’utilisation de la main d’œuvre familiale est plus importante dans la réalisation des activités que la main d’œuvre salariée. Dans la zone, des groupements féminins, masculins et mixtes existent mais ne répondent pas aux critères traditionnellement admis pour les groupements, car ils n’ont aucun statut juridique. En effet, ce sont des personnes qui se sont regroupées soit par affinité, soit sous l’impulsion d’une structure d’encadrement, soit au gré d’intérêts passagers. Certains groupements tels que le groupement féminin de Lafiabougou, ont été mis en place par la DACEP, structure de l’ODRS qui s’occupe de l’encadrement des maraîchers. Les membres d’un même groupement se partagent une même parcelle. Au lieu de s’associer pour produire ensemble, ils préfèrent cultiver chacun sa partie. Les revenus générés sont gérés individuellement. Par conséquent, il serait inexact de dire que ce sont de vrais groupements qui eux, ont un statut juridique, un objectif, un bureau, un comité de gestion, un fonds commun. Par rapport à la formation, elles ont déjà été organisées par les services d'encadrement de l'ODRS notamment à travers des visites d’échanges, des conseils pratiques etc. Ces formations classiques ayant montré leurs limites ont été remplacées par la méthode de Gestion Intégrée de la Production et des Déprédateurs des cultures maraîchères (GIPD). Les exploitants réunis en groupe, apprennent toutes les opérations culturales concernant les spéculations étudiées. L’accès au crédit est possible dans la zone à travers une caisse d’épargne, le « Kafo jiginew », à un taux d’intérêt de 10 %. Il est alloué généralement en début de campagne et remboursé en fin de campagne. Pour bénéficier du crédit, il faut au préalable être membre d'une association recensée au niveau de l’ODRS, car les montants accordés sont fonction de la superficie de la parcelle occupée par le demandeur. Les montants varient de 25 000 à 100 000 F CFA. Ces crédits sont généralement utilisés pour l’achat d’intrants en début de campagne.

197
Les exploitants se ravitaillent en intrants sur place, auprès de quelques boutiquiers de Sélingué. Ces intrants sont pour la plupart destinés au riz et ne sont donc pas adaptés au maraîchage. A cause du déficit hydrique, aucune mesure phytosanitaire n’est utilisée et les exploitants préfèrent abandonner purement et simplement les spéculations les plus sensibles tout en reconnaissant avoir obtenu des rendements très élevés lorsque la quantité d’eau s’est avérée suffisante. Parmi les cultures abandonnées à rendement potentiel élevé figurent la tomate, victime de la mouche blanche et du chancre bactérien et le concombre qui souffre de virose. Les besoins en intrants varient suivant les spéculations, mais on peut les résumer aux engrais suivants : urée, DAP, sulfate de potassium. En plus des engrais minéraux, la fumure organique est très utilisée en maraîchage, les quantités variant de 5 à 10 tonnes par hectare et suivant la disponibilité. Foncier L'accès au foncier est soumis est géré par l’Office de Développement Rural de Sélingué (ODRS). Aucun exploitant n’est propriétaire de sa parcelle. Les parcelles cultivées par les maraîchers leur sont cédées contre le paiement de la redevance par hectare et par campagne de vingt sept mille (27 000) francs CFA. Ces cessions ont été faites suite au remembrement effectué en 1999. Depuis cette date, aucun attributaire n’a officiellement cédé sa parcelle. Tous les attributaires payent régulièrement les redevances, une des conditions indispensables pour rester attributaire et bénéficier d’un crédit auprès de la caisse d’épargne et de crédit installée à Sélingué. L'exploitant attributaire de la parcelle est tenu de respecter le cahier de charge qui lui fait obligation de :
• exploiter la parcelle ; • ne pas la céder à une tierce personne ; • payer régulièrement la redevance ; • ne faire que du maraîchage sur la parcelle.
Ces consignes ne sont pas toujours respectées par les attributaires qui, souvent, cèdent lesdites parcelles à des tiers et cultivent du maïs pendant l’hivernage. La politique adoptée lors de la distribution des terres, était de faire en sorte que le maximum d’exploitants puisse disposer d’une parcelle. Les parcelles ont ainsi été morcelées en vue de satisfaire le plus grand nombre. Raison pour laquelle les superficies allouées sont parfois insignifiantes. Ce qui a pour conséquence l’insuffisance de la production. Considérations pédologiques L’étude pédologique effectuée pour le périmètre hydro-agricole en aval du barrage de Sélingué, permet d’identifier selon leur classe d’aptitude, deux types de sols :

198
• les premiers, à texture limono-sableuse, sont formés sur bas glacis d’érosion et appartiennent suivant les critères de la FAO, à la classe II. Leur aptitude est moyenne pour la polyculture pluviale et irriguée et ils représentent les 4/5 des superficies réservées au maraîchage. Les caractères physiques et hydrologiques sont assez favorables et, bien qu’ils soient pauvres en éléments nutritifs essentiels (NPK), cette carence peut être compensée par une bonne fertilisation organo-minérale. En outre la capacité de rétention de ces sols recommande une utilisation rationnelle de l’eau d’irrigation, surtout dans la partie centrale du périmètre où existent des zones de carapace. Les travaux de labour sont facilités par la bonne structure du sol ;
• pour le reste du périmètre (classe d’aptitude IV), son exploitation nécessite des efforts
spécifiques de gestion. Les sols sont d’aptitude minimale pour le maraîchage en raison de l’engorgement temporaire à permanent (cas des zones d’emprunt). Les sols de cette classe sont hydromorphes (à gley), leur texture est fine et le drainage est presque inexistant. Ce caractère défavorable au maraîchage impose pour ces sols des actions de gestion et d’aménagement supplémentaires pour ces cultures qui ne supportent pas l’engorgement ou une nappe affleurante. Leurs caractères physiques ne peuvent être compensés par des apports d’engrais et le planage s’avère nécessaire par endroits.
Par rapport aux cultures, leur bonne perméabilité font d’eau des sols favorables au maraîchage : toutefois les zones d’emprunt ainsi que les zones limitrophes des rizières, qui ont une texture plus fine, ne sont pas du tout favorables au maraîchage et leur utilisation nécessite soit un drainage adéquat, soit un remblai suivi de planage. D’une façon générale, la position topographique des parcelles ne facilite pas l’irrigation par gravité et tous les sols étudiés ont besoin d’apport d’amendements organiques et minéraux afin de neutraliser l’acidité et les risques de toxicité.
4.3.2. Coûts du projet
Tableau 19: Devis quantitatif et estimatif N°de prix
Désignation Unité Quantité Prix unitaire
Montant
Série 000 : INSTALLATION DE CHANTIER ET SERVICES 001 Installations générales de chantier ff 20 000 000 20 000 000 Total Série 000 20 000 000 Série 100 : DEFRICHEMENT, ABATTAGE, RIPPERAGE, PREPARATION DES
SOLS 101 Défrichement ha 30,00 60 000 1 800 000 102 Ripperage ha 30,00 40 000 1 200 000 103 Planage ha 2,45 140 000 343 000 104 Labour ha 30,00 30 000 900 000 Total Série 100 4 243 000 Série 200 : TERRASSEMENTS 201 Décapage m² 19 624 50 981 200 202 Réseau de drainage m3 1 141,65 1 500 1 712 475 203 Remblais pour canaux m3 6 475,92 1 900 12 304 248 204 Remblais de sable m3 0,5 3 000 1 500
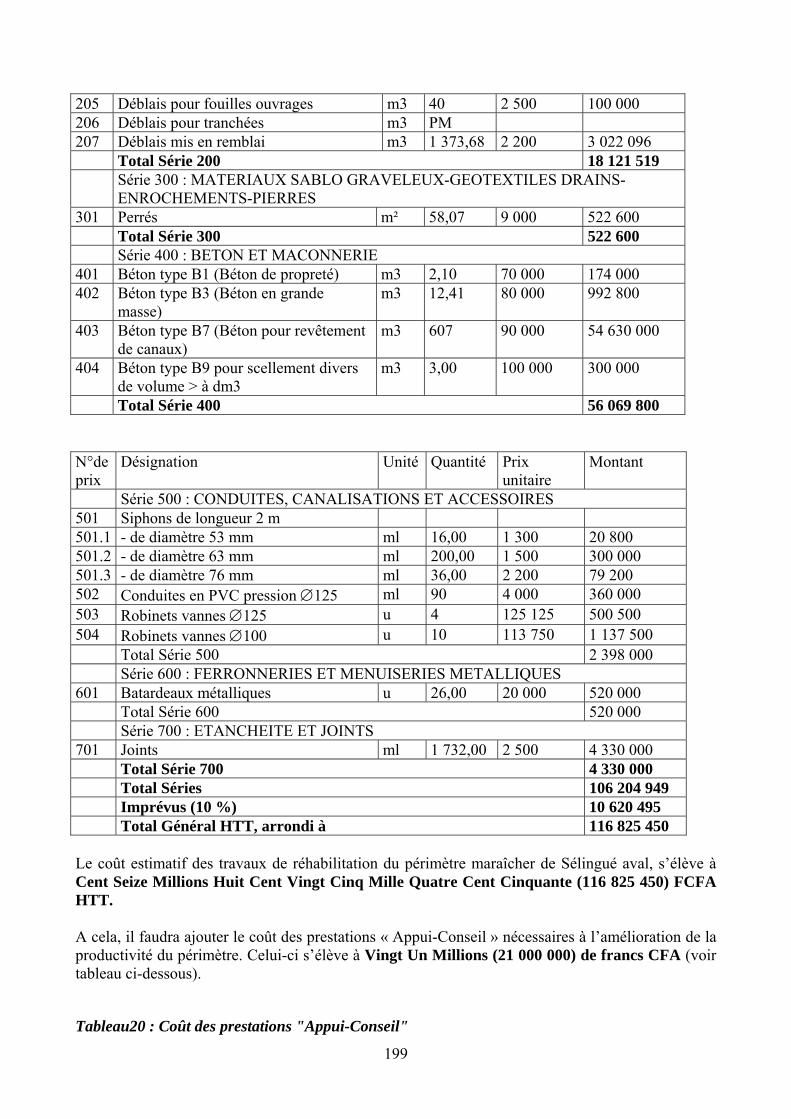
199
205 Déblais pour fouilles ouvrages m3 40 2 500 100 000 206 Déblais pour tranchées m3 PM 207 Déblais mis en remblai m3 1 373,68 2 200 3 022 096 Total Série 200 18 121 519 Série 300 : MATERIAUX SABLO GRAVELEUX-GEOTEXTILES DRAINS-
ENROCHEMENTS-PIERRES 301 Perrés m² 58,07 9 000 522 600 Total Série 300 522 600 Série 400 : BETON ET MACONNERIE 401 Béton type B1 (Béton de propreté) m3 2,10 70 000 174 000 402 Béton type B3 (Béton en grande
masse) m3 12,41 80 000 992 800
403 Béton type B7 (Béton pour revêtement de canaux)
m3 607 90 000 54 630 000
404 Béton type B9 pour scellement divers de volume > à dm3
m3 3,00 100 000 300 000
Total Série 400 56 069 800 N°de prix
Désignation Unité Quantité Prix unitaire
Montant
Série 500 : CONDUITES, CANALISATIONS ET ACCESSOIRES 501 Siphons de longueur 2 m 501.1 - de diamètre 53 mm ml 16,00 1 300 20 800 501.2 - de diamètre 63 mm ml 200,00 1 500 300 000 501.3 - de diamètre 76 mm ml 36,00 2 200 79 200 502 Conduites en PVC pression ∅125 ml 90 4 000 360 000 503 Robinets vannes ∅125 u 4 125 125 500 500 504 Robinets vannes ∅100 u 10 113 750 1 137 500 Total Série 500 2 398 000 Série 600 : FERRONNERIES ET MENUISERIES METALLIQUES 601 Batardeaux métalliques u 26,00 20 000 520 000 Total Série 600 520 000 Série 700 : ETANCHEITE ET JOINTS 701 Joints ml 1 732,00 2 500 4 330 000 Total Série 700 4 330 000 Total Séries 106 204 949 Imprévus (10 %) 10 620 495 Total Général HTT, arrondi à 116 825 450 Le coût estimatif des travaux de réhabilitation du périmètre maraîcher de Sélingué aval, s’élève à Cent Seize Millions Huit Cent Vingt Cinq Mille Quatre Cent Cinquante (116 825 450) FCFA HTT. A cela, il faudra ajouter le coût des prestations « Appui-Conseil » nécessaires à l’amélioration de la productivité du périmètre. Celui-ci s’élève à Vingt Un Millions (21 000 000) de francs CFA (voir tableau ci-dessous).
Tableau20 : Coût des prestations "Appui-Conseil"
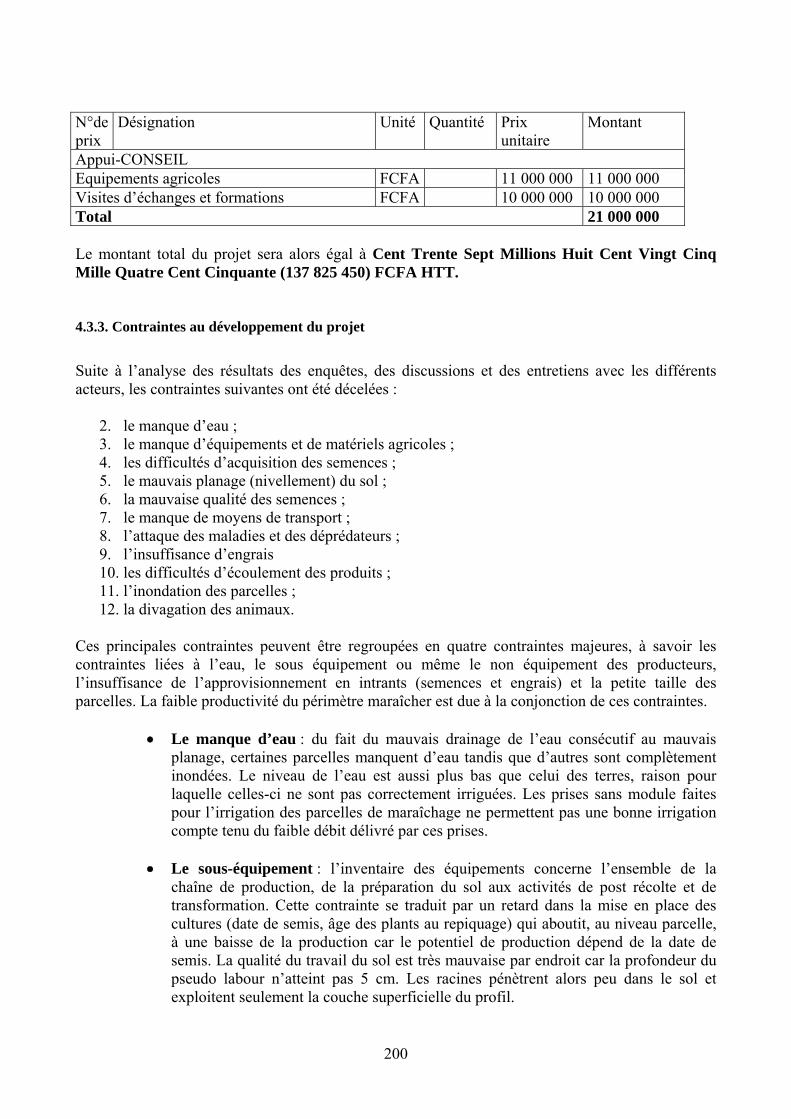
200
N°de prix
Désignation Unité Quantité Prix unitaire
Montant
Appui-CONSEIL Equipements agricoles FCFA 11 000 000 11 000 000 Visites d’échanges et formations FCFA 10 000 000 10 000 000 Total 21 000 000 Le montant total du projet sera alors égal à Cent Trente Sept Millions Huit Cent Vingt Cinq Mille Quatre Cent Cinquante (137 825 450) FCFA HTT.
4.3.3. Contraintes au développement du projet
Suite à l’analyse des résultats des enquêtes, des discussions et des entretiens avec les différents acteurs, les contraintes suivantes ont été décelées :
2. le manque d’eau ; 3. le manque d’équipements et de matériels agricoles ; 4. les difficultés d’acquisition des semences ; 5. le mauvais planage (nivellement) du sol ; 6. la mauvaise qualité des semences ; 7. le manque de moyens de transport ; 8. l’attaque des maladies et des déprédateurs ; 9. l’insuffisance d’engrais 10. les difficultés d’écoulement des produits ; 11. l’inondation des parcelles ; 12. la divagation des animaux.
Ces principales contraintes peuvent être regroupées en quatre contraintes majeures, à savoir les contraintes liées à l’eau, le sous équipement ou même le non équipement des producteurs, l’insuffisance de l’approvisionnement en intrants (semences et engrais) et la petite taille des parcelles. La faible productivité du périmètre maraîcher est due à la conjonction de ces contraintes.
• Le manque d’eau : du fait du mauvais drainage de l’eau consécutif au mauvais planage, certaines parcelles manquent d’eau tandis que d’autres sont complètement inondées. Le niveau de l’eau est aussi plus bas que celui des terres, raison pour laquelle celles-ci ne sont pas correctement irriguées. Les prises sans module faites pour l’irrigation des parcelles de maraîchage ne permettent pas une bonne irrigation compte tenu du faible débit délivré par ces prises.
• Le sous-équipement : l’inventaire des équipements concerne l’ensemble de la
chaîne de production, de la préparation du sol aux activités de post récolte et de transformation. Cette contrainte se traduit par un retard dans la mise en place des cultures (date de semis, âge des plants au repiquage) qui aboutit, au niveau parcelle, à une baisse de la production car le potentiel de production dépend de la date de semis. La qualité du travail du sol est très mauvaise par endroit car la profondeur du pseudo labour n’atteint pas 5 cm. Les racines pénètrent alors peu dans le sol et exploitent seulement la couche superficielle du profil.
201
• L’insuffisance de l’approvisionnement en semences de qualité se traduit par l’utilisation de semences « tout venant ». La pureté variétale et la propreté physique des semences « tout venant » réduisent la qualité des semences. Celles-ci ne sont pas souvent triées, ce qui diminue le taux de germination. Le faible taux de germination entraîne une insuffisance des plants.
A cela il faut ajouter la non disponibilité de tous les types d’engrais dont les producteurs peuvent avoir besoin. Du fait que l’essentiel de la commercialisation est assuré par les commerçants de la place, l’utilisation des engrais est en deçà des normes conseillées et souvent en retard par rapport aux dates optimales.
a) la petite taille des parcelles : la politique adoptée lors de la distribution
des terres était de faire en sorte que le maximum d’exploitants puissent disposer d’une parcelle sur laquelle chacun peut faire du maraîchage afin de subvenir à leurs besoins quotidiens. Les parcelles ont ainsi été morcelées en vue de satisfaire le plus grand nombre.
4.3.4. Perspectives
Le diagnostic des contraintes, l’analyse des opportunités et le bilan des cultures montrent que la rentabilité du périmètre maraîcher peut être est conditionnée à la levée des différentes contraintes ci-dessus citées. Il est à recommander de mettre en place un système de crédit fonctionnel et bien ciblé qui permettrait :
• d’améliorer le niveau de l’équipement ; • d’assurer la couverture en intrants ; • et d’appuyer la commercialisation des produits pour assurer la réussite de la
campagne de production. Par ailleurs, les mesures d’accompagnement ci-dessous doivent être prises : Appui aux groupements et aux capacités d’autogestion des exploitants La promotion des groupements est un objectif essentiel de renforcement de leur capacité de production. D’une manière générale, la non maîtrise de l’aménagement existant par les producteurs s’explique d’une part, par l’absence d’organisation professionnelle viable et d’autre part, par la non maîtrise des techniques culturales par les paysans. Aussi, cet objectif sera soutenu à travers :
• l’appui aux groupements existants et la mise en place de nouveaux groupements (création et renforcement de structures villageoises efficaces et représentatives, comités paritaires, comités de gestion, installation de GIE au sein du périmètre, etc.) ;
• la formation technique en gestion et en organisation ;
• l’alphabétisation fonctionnelle ;

202
• le renforcement technique des producteurs.
Mise en place d’un environnement économiquement favorable Elle se fera par les actions suivantes :
1. L’appui en matière de conservation, de stockage, de transformation et de commercialisation des produits maraîchers.
2. La facilitation de l’accès au crédit pour l’acquisition d’équipements, car les besoins en
crédit sont importants, et le niveau d’équipement est encore très faible. Pour remédier à cette situation, il s'avère nécessaire une implication de l’ODRS à travers la création de caisses d’épargne et de crédit. L’intensification des pratiques culturales nécessite des moyens financiers importants dont les paysans ne disposent malheureusement pas. Avec plus de possibilités d’accès au crédit, ils pourront non seulement s’équiper convenablement, mais aussi respecter les calendriers culturaux en utilisant des engrais de qualité et augmenter la productivité.
3. Le renforcement des capacités de vulgarisation, en mettant à la disposition des encadreurs
plus de moyens logistiques pour pouvoir mener à bien leur mission.
4. La professionnalisation des paysans dans la pratique de leur activité de production, à travers leur formation aux techniques appropriées susceptibles d’obtenir de hauts rendements.
5. L’exploitation rationnelle des parcelles pour une couverture optimale des besoins
alimentaires des exploitants de la zone de maraîchage.
6. Favoriser le regroupement des paysans dans des structures leur permettant de satisfaire les besoins économiques et sociaux du groupe.
Evaluation des besoins en matériels et équipements agricoles Le choix des matériels et équipements agricole à mettre à la disposition des exploitants pour l’obtention d’une meilleure productivité, est conditionné par une série de facteurs liés à/au :
• la capacité financière de l'exploitant, • respect du calendrier cultural, • l’importance du travail à réaliser et le niveau d’effort requis, • mode d’organisation sociale des exploitants et les possibilités d’association en vue
d’une utilisation commune des matériels et équipements. Aussi, l’évaluation des besoins en équipements des exploitants doit tenir compte de l’impérieuse nécessité de réaliser les travaux à temps, et ce, d’une manière optimale et à moindre coût. L’adéquation entre ces trois paramètres est généralement complexe, si bien que la mise en place d’un système de crédit équipement qui encouragerait les regroupements entre producteurs, s’avère nécessaire. Lors de la distribution des parcelles, les attributaires doivent être répartis en groupes. Le groupement de producteurs est responsable de la gestion et de l’entretien des matériels et
203
équipements leur appartenant. L’organisation et le fonctionnement du groupement seront définis à travers des statuts et règlement intérieur, conformément aux dispositions en la matière. Entretien Les travaux d’entretien sont d’une grande importance en matière d’irrigation. Ils permettent un bon drainage du périmètre et le maintient des différents ouvrages de régulation, dans un bon état de fonctionnement. Ceci permet de maintenir une bonne efficience de distribution de l’eau et conduit à l’amélioration de la productivité. Les canaux, les drains, les ouvrages et les réseaux de distribution doivent faire l’objet d’une inspection régulière pendant l’exploitation du périmètre afin de prendre les dispositions immédiates en vue de la réparation des ouvrages endommagés et le remplacement des équipements défectueux. Pour les canaux d’irrigation, il faudra veiller à enlever régulièrement des dépôts solides, conduisant à la réduction de la quantité d’eau véhiculée, et faussant inévitablement les doses d’irrigation. Les sillons doivent faire l’objet d’un entretien particulier. Lors des irrigations, il y a lieu de veiller à ce que l’écoulement des eaux se fasse correctement et que l’eau atteigne l’extrémité aval de tous les sillons. Au cours des opérations d’irrigation, éviter un débordement au dessous des billons. Gestion des ouvrages Pour la gestion des différents ouvrages, les mesures suivantes doivent être observées :
1. Pour les batardeaux métalliques mobiles, leur mise en place commence à l’aval du canal, et évolue progressivement vers l’amont, jusqu’à la fin de l’irrigation des premières planches. Il est extrêmement important de noter cette disposition, toute mesure contraire serait néfaste pour de bon fonctionnement du réseau concerné.
2. L’emploi des batteries de siphons suit cette même démarche : leur mise en fonctionnement
commence à l’aval et se termine à l’amont.
3. Les ouvrages d’extrémité fonctionnent automatiquement, chaque fois que le plan d’eau dans le canal dépasse la côte de la crête du déversoir. Ce cas de figure se présente en période de non irrigation alors que le robinet vanne demeure fermé ou aux moments de faibles prélèvements d’eau sur le canal concerné.
4. Pour l’ensemble des canaux d’irrigation, la comparaison du débit nominal (obtenu à partir
des superficies réellement irriguées) au débit de projet (calculé à partir de l’ouvrage de prise existant) montre que la quantité d’eau disponible est suffisante. Toutefois, ceci suppose qu’il y ait en permanence suffisamment d’eau dans le canal principal CP1, au moins au moment des irrigations.
204
4.4. Phase II du Projet de Développement en Zone Lacuste (PDZL)
4.4.1. Présentation et mise en oeuvre du projet
La zone d’intervention du Projet de Développement de la Zone Lacustre (PDZL) Phase II, située dans la région de Tombouctou, couvre en partie les cercles de Goundam, Diré et Niafunké pour un total de 10 villages. Elle se caractérise par une faible pluviométrie annuelle (200 à 300 mm par an). Le projet couvre une superficie de près de 35 000 hectares de lacs et mares (sans le lac Horo) et de vastes plaines de pâturage. L’agriculture, l’élevage et la pêche occupent près de 90% de la population. Le PDZL II Niafunké qui intervient dans la zone depuis 1999 s’occupe de l’aménagement des mares, lacs et PIV, de l’organisation, de la formation des producteurs et de l’amélioration du cadre de vie des populations (santé, assainissement, eau potable, etc.) ; mais il est important de remarquer que la première phase du projet (1990-1996) a été fortement perturbée par la rébellion armée du Nord du Mali. Ainsi, du fait de ces évènements, de nombreuses contraintes de production (sous équipement des paysans, faible capacité de gestion des organisations paysannes, insuffisance de structures de crédit, etc.) et des besoins majeurs de développement (infrastructures routières, socio-sanitaires, eau potable, etc.) n’ont pas pu être résolus ; d’où la justification d’une seconde phase du projet. Le PDZL II Niafunké, dans le but de mieux cibler ses interventions au cours de cette deuxième phase, a privilégié l’approche des systèmes de production. La zone du projet La zone d’intervention du Projet de Développement de la Zone Lacustre est située dans la Région de Tombouctou et couvre le cercle de Niafunké (moins l’arrondissement de Léré) et une partie des cercles de Goudam et Diré. Elle compte 138 villages pour une population d’environ 216.000 habitants (RGP 1998) composée majoritairement de Songhoï, de Peulh et de Touareg. La zone du projet peut être divisée en deux grands ensembles : le "Haoussa" sur la rive gauche du fleuve Niger correspondant à la zone des Mares et Lacs et le "Gourma" sur la rive droite dominé par une succession de petites dépressions ou péniplaines. Le fleuve Niger et ses multiples bras qui partagent les deux zones inondent les mares et lacs du haoussa et les plaines du gourma. Les populations sont réparties pour 50 % dans la vallée du fleuve, 40 % autour des lacs et mares et 10 % en dehors dont 3% pour la fraction nomade. La zone se caractérise par une faible pluviométrie (200 à 400 mm par an), des vents chauds, secs et souvent violents soufflant pendant une grande partie de l’année. Ces vents sont à l’origine de l’ensablement des mares, des lacs et des canaux d’irrigation. Les principales activités de la zone sont l’agriculture, l’élevage et la pêche. a) L’agriculture occupe la grande majorité de la population (≈70%) et les principales
spéculations pratiquées dans la zone du projet sont :
• Le mil est cultivé en pur ou associé à du niébé sur les sols dunaires. Les superficies consacrées à cette spéculation sont généralement importantes, mais la production est très
205
aléatoire liée à la faiblesse et à l’irrégularité des pluies et à la pauvreté des sols (rendement : 100-500 kg/ha) ;
• Le riz est une spéculation importante dans la zone du projet où plusieurs variétés sont
utilisées selon les zones : le riz flottant cultivé dans les pénéplaines non aménagées, occupe de grande superficie, mais la production est souvent aléatoire du fait de l’état des crues et l’effet des oiseaux et des poissons (rendement : 500-2000 kg/ha). Le riz "kobè" est cultivé à cheval sur les périodes de décrue et de crue principalement dans le système lac. En effet, les pépinières sont installées au début de la décrue et sont déplacées vers les zones basses au fur et à mesure du retrait de l’eau, pratique appelée localement "diba". Le repiquage final s’effectue dans la boue de la décrue et la plante se développe à la faveur des pluies et de la crue (rendement : 400-800 kg/ha). Le riz PIV est cultivé sur les périmètres aménagés irrigués avec l’utilisation de paquets techniques améliorés (semences améliorées, repiquage, fertilisation, etc.) ; le rendement varie de 2500 à 7000 kg/ha ;
• Le sorgho est une spéculation de décrue pratiquée de façon traditionnelle dans les systèmes
mares et lacs. Le rendement moyen à l’hectare est d’environ 1000 kg. A ces trois principales spéculations s’ajoutent le maïs, le gombo, la pastèque, le niébé, les courges, l’arachide, etc., très souvent associées aux cultures principales de décrue. Il est aussi important de noter que la culture du bourgou se développe de plus en plus dans la zone du projet. Cette culture fourragère constitue actuellement une source de revenu non négligeable pour les exploitants qui la pratiquent. Le PDZL qui encadre la zone depuis 1990 s’occupe de l’aménagement des mares, des lacs et des périmètres irrigués villageois, de l’organisation des producteurs, de la formation et de l’amélioration du cadre de vie des populations (santé, assainissement, eau potable, etc.). Dans le cadre des aménagements, le projet a réalisé 25 petits périmètres maraîchers (PPM) (116-161 hectares) dont 22 quasiment abandonnés actuellement, 21 périmètres irrigués villageois (PIV) pour une superficie de 347 hectares en 2003. PDZL a également des mares aménagées (les mares Danga, Goubo et Maïbangou) et les lacs Takadji et Fatih. b) La zone d’intervention du PDZL renferme de grandes naturelles comprenant de
nombreux points d’eaux permanents (lacs, mares et fleuve), de riches bourgoutières, de vastes pâturages en zone exondée et des cures salées. Ces avantages naturels font du projet une zone d’élevage par excellence. Le cheptel est constitué principalement de bovins (≈115.000), ovins/caprins (≈476.000) auxquels il faut ajouter des asins (≈31.000), des équins (≈600) et des camelins (≈1.600) généralement utilisés pour le transport. L’élevage est une activité pratiquée par tous les groupes ethniques de la zone, toutefois, il convient de distinguer ceux qui ont pour culture le pastoralisme (les grands éleveurs kel tamachek, peul et maure) et les sédentaires possédant généralement un petit troupeau (agro pastoralisme). Dans le cas du pastoralisme, deux modes d’exploitation sont pratiqués:
• la transhumance pratiquée par les peuls, se fait entre la sous zone exondée en hivernage
et les bourgoutières. Ce mouvement périodique des troupeaux est régi par un calendrier arrêté en commun accord avec l’ensemble des acteurs. La transhumance concerne une partie de la famille du pasteur, les autres membres restant au village. Les problèmes liés à la transhumance sont notamment les conflits entre agriculteurs et éleveurs (dégâts de récolte, obstruction des voies de passage des animaux, occupation des pâturages par les cultures) les pertes d’animaux dues aux épizooties et aux vols.
206
• le nomadisme qui est une pratique des kel tamacheck et des maures. Dans ce mode de conduite du troupeau, toute la famille du pasteur se déplace de campement en campement à la recherche de pâturages et de point d’eau. Il concerne toutes les espèces, les chameaux et les ânes étant utilisés pour le transport et l’exhaure d’eau. Il convient cependant de noter que, depuis plus d’une dizaine d’années, le nomadisme a tendance à disparaître dans la zone au profit du sédentarisme. En effet, des zones dites d’attache sont de plus en plus mises en valeur par des fraction (point d’eau, construction, aménagement, etc.) pour fixer une partie de la famille. le nomadisme connaît également des problèmes d’épizooties et de conflit avec d’autres éleveurs dans les bourgoutières des peuls.
c) La pêche pratiquée par presque tous les groupes ethniques est la troisième activité en
importance dans la zone. Elle est pratiquée en toute saison le long du fleuve et périodiquement dans les mares et lacs par les populations. autochtones et des migrants. Deux catégories de pêcheurs exercent cette activité: les pêcheurs sédentaires (autochtones) et les pêcheurs transhumants, originaires des régions voisines, sont des professionnels qui assurent l’essentiel de la pêche dans les différents plans d’eau.
Systèmes identifiés Une étude réalisée en 1999 par l’Institut d’Economie Rurale, avait défini et décrit cinq (5) principaux systèmes de production : i) le système des mares et lacs ; ii) le système dunaire ; iii) le système des périmètres irrigués ; iv) le système agro-pastoral et v) le système pastoral. Participation aux activités agricoles selon le genre La même étude de 1999 indique que les femmes et les hommes participent activement toutes/tous aux activités agricoles. Cependant, il apparaît que les céréales et l’arachide occupent plus les hommes que les femmes, en revanche, les femmes sont plus occupées par certaines cultures maraîchères (gombo, courge, etc.) que les hommes (cf. tableau ci-dessous).
Tableau 21: Participation aux activités agricoles selon le genre
Spéculations PARTICIPATION SELON GENRE
Riz
Sorgho
Mil
Niébé
Gombo
Dah
Pastèq.
Courge
Arachide
Patate
Femmes (%) 40 40 40 60 60 90 10 90 40 40 Homme (%) 60 60 60 40 40 10 90 10 60 60 Sources : Etude IER 1999 Caractérisation des systèmes de production Dans ce paragraphe, les trois premiers systèmes de production sont caractérisés suivant des éléments objectifs et mesurables : la population des UPA (nombre, niveau d’éducation, migration, etc.) ; le foncier (superficies cultivées et mode de tenure des terres) ; et l’équipement agricole (matériel agricole et animaux de trait). Nous avons estimé que tout peut caractériser un système, mais ces trois éléments retenus qui constituent la structure de l’UPA peuvent caractériser plus longtemps.

207
Population de l’UPA Les résultats du recensement de la population des UPA de l’échantillon d’étude indiquent que le nombre moyen de personnes dans les UPA (tous systèmes confondus) est de 14 dont environ 55% de femmes et 45% d’hommes. Les actifs représentent près de 57% de cette population et répartis entre les femmes et les hommes suivant les taux de 31 et 26% respectivement. La population de la zone du projet est jeune car 88% des personnes ont un âge compris entre 1 et 55 ans dont 31% de moins de 15 ans. Il convient cependant de noter que ces moyennes globales masquent des disparités entre les trois systèmes. En effet, le nombre moyen de personnes par UPA varie de 11 dans le système dune à 16 dans le système mare et le taux d’actifs de 54% dans le système lac à 63% dans le système mare. Il faut également noter un certain nombres de remarques intéressantes au niveau des trois systèmes :
Les UPA des zones de lacs et de mares sont plus peuplées que celles de la zone dunaire, phénomène lié certainement à l’existence de plan d’eau naturel ;
Les femmes sont numériquement plus importantes que les hommes, mais les actifs agricoles
se répartissent équitablement entre les deux sexes dans les systèmes dunaires et lac contre 60% d’actives agricoles dans le système mare. Cette prédominance pourrait s’expliquer par le développement les activités de maraîchage autour des mares pendant la contre saison.
La jeunesse de la population des UPA confère à la zone du projet un potentiel de main
d’œuvre à condition que le développement des investissements productifs puissent permettre de la maintenir dans le milieu.
a) Niveau d’éducation des membres des UPA : l’éducation des membres des UPA concerne ici
l’éducation "classique" (école française), l’éducation coranique et l’éducation des adultes (alphabétisation). En examinant individuellement les trois systèmes, l’on est tenté de dire que chaque système a une préférence parmi les trois types d’éducation : le système dunaire pour l’alphabétisation avec 33% ; le système lac pour l’enseignement coranique avec 52% et le système mare pour l’enseignement classique avec 28%.
En considérant l’aspect genre, il apparaît que parmi les personnes des UPA ayant étudié, les femmes sont moins représentées. En effet, elles représentent 46% du niveau primaire dans l’enseignement classique, 21% dans l’enseignement coranique et 26% dans l’éducation des adultes. Elles sont absentes dans le secondaire et dans le supérieur de l’enseignement classique. Il est cependant intéressant de noter tout de même que les filles sont majoritaires dans l’enseignement primaire avec 56% dans le système mare.
En définitive, on peut retenir que le taux d’éducation globalement est très faible dans les UPA enquêtées et que les niveaux acquis par ceux/celles ayant étudié sont généralement bas, donc non fonctionnels dans la plupart des cas. Cette situation est un des facteurs qui handicapent le développement durable de la zone du projet mérite d’être améliorée.
b) Mouvements migratoires : les mouvements migratoires concernent le départ d’un membre de
l’UPA de son village vers d’autres localités et l’arrivée d’un étranger dans l’UPA pendant une période donnée. Le premier cas appelé émigration est communément connue sous le nom
208
d’exode rural et le second cas est l’immigration. Dans cette étude, une période de trois (3) mois au moins a été retenue pour que le partant ou l’arrivant soit enregistré.
Les résultats de ces mouvements indiquent que 50% des UPA enquêtées connaissent l’exode rural en ce qui concerne chacun des trois systèmes. En revanche, les personnes qui partent représentent en moyenne 13% de la population des UPA et concernent exclusivement les hommes. L’émigration est plus importante dans le système lac avec 22% et l’est moins dans le système mare avec 11%. L’âge moyen des migrants est d’environ 34 ans. Les destinations préférées des migrants sont Bamako (50%), ceux du système dune enregistrant 67% et hors du Mali (44%), le maximum se situant dans le système lac avec 60%. Le motif principal déclaré de l’exode est la recherche de l’argent avec 81%. La zone du projet est également concernée par l’immigration car 50% des UPA enquêtées reçoivent des immigrants et ce taux global varie de 33% dans le système lac à 75% dans le système dune. Les arrivants comptent des hommes (70%) et des femmes (30%) avec un âge moyen d’environ 20 ans. Les motifs principaux déclarés de l’immigration sont d’ordre lucratif (argent et vivres) avec 55%, les études scolaires et coraniques (30%). Les mouvements migratoires dans la zone appellent quelques remarques intéressantes :
Le système dunaire défavorisé par la nature par rapport aux deux autres, enregistre aujourd’hui un taux d’exode parmi les plus faibles et reçoit le taux le plus élevé d’immigrants. Cette situation qui paraît paradoxale s’explique par l’aménagement de nombreux périmètres irrigués au bénéfice des villages par le projet.
A l’opposé, les villages enquêtés dans le système lac où il n’existe pas de PIV enregistre le plus fort taux d’exode et reçoit moins d’immigrants en dépit de la précieuse ressource naturelle permanente (lac) dont ils disposent.
En conclusion, le PIV constitue une option pertinente pour l’atteinte de l’autosuffisance
alimentaire dans la zone du projet ; mais pour qu’il en soit ainsi, il faut veiller aux conditions de durabilité de cette option qui sont évoquées plus loin.
Situation foncière des UPA La Situation foncière comprend ici les superficies exploitées par l’UPA et le mode de tenure des terres. Les superficies moyennes par UPA, par culture, par système et leurs modes de faire valoir présentent les caractéristiques suivantes : • La superficie totale moyenne exploitée par UPA varie fortement suivant les systèmes : environ 9
hectares dans le système mare contre près de 4 ha dans le système lac ; • Les céréales occupent la quasi totalité des superficies mises en valeur dans tous les
systèmes avec un maximum de 98% environ dans le système lac. En revanche, il existe une grande disparité dans la répartition de ces superficies entre les spéculations dans les systèmes : le mil occupe près de 61% de la surface consacrée aux céréales dans le système dunaire alors qu’il ne représente que 26% dans le système mare. En terme relatif, la culture du riz (toutes variétés confondues) est plus développée dans le système dunaire (36%) que dans les autres, mais en terme absolu, le riz est plus cultivé dans le système mare avec 2,75 ha en moyenne par UPA ;
209
• Les cultures de rentes sont négligeables dans toutes les UPA enquêtées et le culture des fourrages, en l’occurrence le bourgou, n’ont été enregistrées que dans les UPA du système dunaire et représente 4% des superficies mises en valeur ;
• Toutes les UPA enquêtées déclarent être propriétaires des terres qu’elles exploitent. En résumé, de la situation foncière des UPA de la zone du projet on retient les points essentiels suivants :
Au regard de la superficie moyenne par UPA, l’on est bien tenté d’affirmer qu’il n’existe pas de pression foncière particulière dans aucun des trois systèmes car, nous estimons que dans les conditions normales d’exploitation, cette superficie doit pouvoir nourrir la population de l’UPA. Toutefois, il existe des disparités entre les systèmes et c’est le système lac qui en est le moins servi, certainement du fait de la forte compétition des populations (agriculteurs, éleveurs, pêcheur) pour ces points d’eau permanents ;
La superficie moyenne de 6,15 hectares par UPA dans le système dunaire s’expliquerait par la
forte réduction des superficies de mil due aux années répétées de sécheresse ;
Les systèmes mare et lac sont caractérisés par la culture du sorgho, du mil et du riz alors que le système dunaire l’est par la culture du mil et du riz ;
Le mode direct de faire valoir les terres (propriétaire), déclaré par tous les exploitants enquêtés
semble contrarier l’affirmation générale selon laquelle presque toutes les terres appartiennent à quelques chefferies traditionnelles de la zone. Il faut cependant remarquer à cet effet que l’analyse approfondie de la question foncière n’était pas un objectif cette étude ;
La culture du bourgou commence à se développer dans le système dunaire car en plus de
l’alimentation du bétail, ce fourrage constitue une source de revenu pour les paysans. Equipement agricole de l’UPA L’équipement agricole comprend ici le matériel agricole et les animaux de trait . a) Matériel agricole : le matériel agricole retenu est composé de charrue, multiculteur, semoir,
houe asine, herse, charrette et pulvérisateur. Le nombre d’UPA possédant au moins un type de ce matériel est indiqué comme suit : en moyenne 33% des UPA de l’échantillon possèdent au moins une charrue, 28% une charrette et 6% une herse. Le taux d’équipement des UPA varie suivant les systèmes : 38% dans le système mare contre 25% dans le système dunaire pour la charrue ; 38% dans le système mare contre 0% dans le système dunaire pour la charrette et 13% dans le système mare contre 0% dans les deux autres systèmes. Les sources d’acquisition du matériel sont le marché par l’achat au comptant et parfois le projet à crédit.
b) Animaux de trait : les animaux de trait retenus sont le bœuf, l’âne et le cheval.Il ressort qu’en
moyenne 22% des UPA de l’échantillon possèdent au moins un bœuf de labour, 83% un âne et 6% un cheval. Les taux d’équipement en animaux de trait les plus élevés sont enregistrés dans le système lac. Les animaux de trait proviennent le plus souvent du troupeau de l’UPA et parfois acquis par des achats en ce qui concerne les ânes notamment.
c) Attelage opérationnel : a été défini comme un matériel plus le nombre d’animaux approprié
pour rendre ce matériel fonctionnel. Les attelages retenus ici sont une charrue + une paire de bœufs et une charrette + un âne. Il apparaît ainsi que 22% des UPA enquêtées possèdent un
210
attelage opérationnel : une charrue + une paire de bœufs et une charrette + un âne. En considérant les systèmes, trois situations sont mises en exergue :
• Les UPA du système lac sont les mieux dotés en attelages opérationnels avec 33% pour
chacun des deux types ; • Dans le système mare, beaucoup d’UPA possèdent du matériel (charrue, charrette) mais
elles n’ont pas le nombre d’animaux approprié pour le faire fonctionner ; • Les UPA du système dunaire ne possèdent pas d’attelage charrette + âne, situation
certainement liée au relief accidenté des villages enquêtés dans ce système qui n’est pas favorable à l’utilisation d’un attelage de ce type.
En définitive, l’analyse du niveau d’équipement des UPA de l’échantillon étudié relève que :
Le niveau d’équipement agricole des paysans de la zone du projet est très faible (22%) comparé à d’autres zones du Mali où il peut atteindre 75% à la CMDT et à l’Office du Niger par exemples ;
Le faible taux d’équipement est lié en grande partie à l’insuffisance, voire au manque de
structures de crédit agricole dans la zone du projet, situation qui permet pas d’améliorer la productivité agricole dans les UPA.
L'analyse de la structure des coûts de production montre à suffisance qu'en théorie, les paysans du système mare devraient logiquement renoncer à l’exploitation des PIV au profit du salariat journalier où ils sont censés gagner mieux, mais la réalité est tout différente pour plusieurs raisons : - La probabilité pour les membres des UPA d’avoir régulièrement et pendant longtemps du travail
journalier est très faible ; - La peur des critiques sociales d’avoir déserté leurs champs à cause de la pauvreté ; - La raison la plus objective à notre avis est le fait que les paysans maliens en général ne sont pas
intéressés, par méconnaissance ou non, à cette notion de rémunération journalière de la force de travail pour des activités qui leur sont propres, mais plutôt par le volume d’argent qu’ils escomptent avoir de ces activités comme marge. Les UPA du système mare qui gagnent près de 178.000FCFA/ha au prix de 120 FCFA/kg (après déduction de toutes les charges d’exploitation) préfèrent exploiter leurs PIV. Ils ont en effet de quoi subvenir à de nombreux besoins financiers et échappent également au risque de non emploi et aux critiques sociales.
La conclusion qu’il faut donc tirer des UPA-PIV du système mare est que la main d’œuvre familiale est moins bien rémunérée, mais ces UPA n’enregistrent pas de revenu négatif d’exploitation. Etablir donc un compte d’exploitation en valorisant systématiquement la main d’œuvre familiale dans un environnement où les possibilités de travail sont très limitées peut aboutir à des conclusions irrationnelles. Un compte d’exploitation établi sur cette base aurait abouti effectivement à un revenu moyen négatif de 116.000 FCFA/ha dans les PIV de ce système. En tous les cas, la question de prix à donner à un facteur de production (semence, main d’œuvre, etc.) fourni par le paysan lui-même demeure toujours posée. La notion de coût d’opportunité reste certes la solution adoptée, mais qu’il faut utiliser avec beaucoup de souplesse.

211
4.4.2. Coûts du projet
Le coût de base de l’ensemble du projet est estimé à 6.048,6 milliards de Fcfa, (prix de base : juin 1995) soit 12.601,6 millions de $ US sur une période de 6ans (taux de change 480Fcfa = 1$ US). Environ 28% correspond à des coûts en devises étrangères. La structure des coûts du projet montre qu’environ 83% correspondent à des investissements et 17% à des dépenses récurrentes.
Tableau 22 : structure des coûts du projet
Coût d’investissement Fcfa (millions) Dollars eu (1000) % Génie civil 2 145 4470,4 35Equipement 312 649,4 5Véhicule 511,8 1066,3 8Formation 277,9 578,9 5Etude 271,6 565,8 4Fonds de roulement 277,1 577,4 5Intrants 169,2 352,6 3Assistance technique 517,6 1078,4 9Développement local 350 729,2 6Divers 39,6 82,4 1Travail paysan 172,5 359,4 3Total coût d’investissement 5 045,10 10510,6 83Coût récurrent Coût d’opération 561,5 1169,8 9Salaire 414,4 863,2 7Maintenance génie civil 27,8 58 - Sous-total coût récurrent 1003,7 2091 17Total coût de base 6048,8 12601,6 100
En incluant les imprévus physiques (7%) sur le coût de base, le coût total du projet s’élève à 6.457,7 milliards de Fcfa (13.453,6 millions de $ EU). Les imprévus financiers (469,2millions de Fcfa, soit 977,500 dollars) ont été calculés sur la base d’une inflation annuelle de 2,5% pour les coûts locaux, qui est l’hypothèse adoptée par la Banque Mondiale pour les années 1996 e »t au delà. Une présentation synthétique des coûts par composante est donnée ci-dessous. L’on trouve en annexe 1 les tableaux détaillés du COSTAB, ainsi que les tableaux résumés par composantes et catégories de dépenses.
La répartition des coûts par composante est donnée dans le tableau suivant.
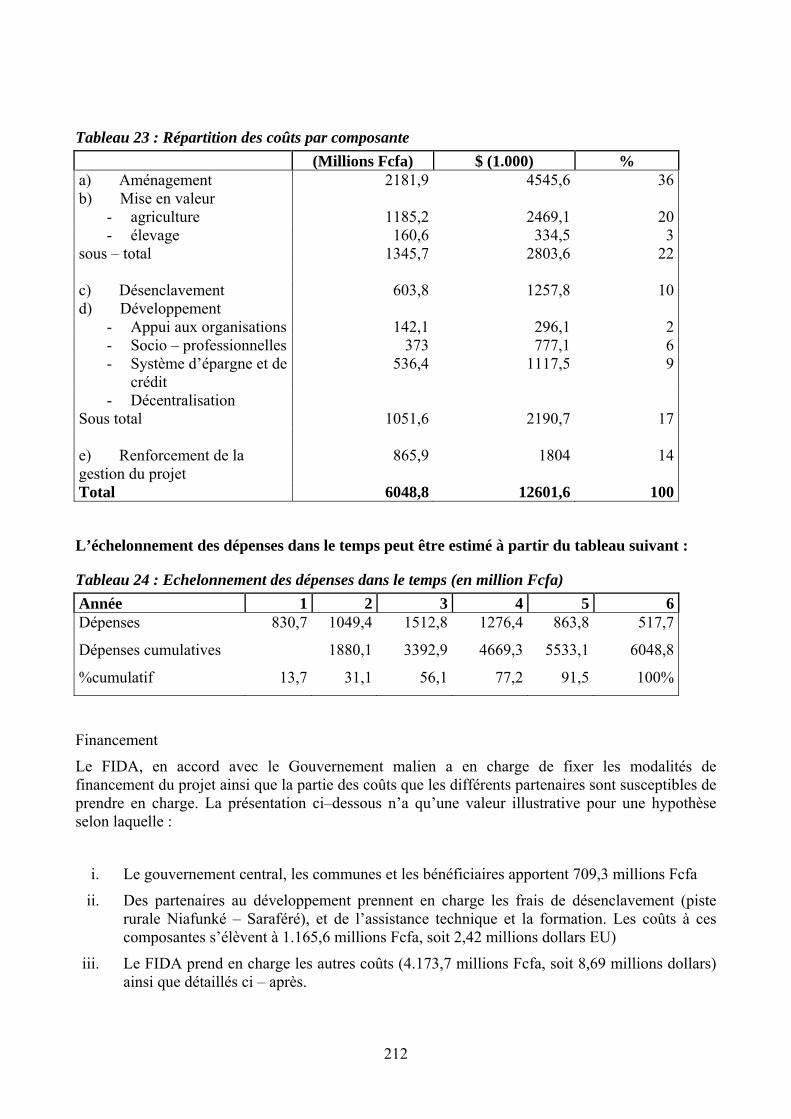
212
Tableau 23 : Répartition des coûts par composante (Millions Fcfa) $ (1.000) %
a) Aménagement 2181,9 4545,6 36b) Mise en valeur
- agriculture 1185,2 2469,1 20- élevage 160,6 334,5 3
sous – total 1345,7 2803,6 22 c) Désenclavement 603,8 1257,8 10d) Développement
- Appui aux organisations 142,1 296,1 2- Socio – professionnelles 373 777,1 6- Système d’épargne et de
crédit 536,4 1117,5 9
- Décentralisation Sous total 1051,6 2190,7 17 e) Renforcement de la gestion du projet
865,9 1804 14
Total 6048,8 12601,6 100
L’échelonnement des dépenses dans le temps peut être estimé à partir du tableau suivant :
Tableau 24 : Echelonnement des dépenses dans le temps (en million Fcfa) Année 1 2 3 4 5 6Dépenses 830,7 1049,4 1512,8 1276,4 863,8 517,7
Dépenses cumulatives 1880,1 3392,9 4669,3 5533,1 6048,8
%cumulatif 13,7 31,1 56,1 77,2 91,5 100%
Financement
Le FIDA, en accord avec le Gouvernement malien a en charge de fixer les modalités de financement du projet ainsi que la partie des coûts que les différents partenaires sont susceptibles de prendre en charge. La présentation ci–dessous n’a qu’une valeur illustrative pour une hypothèse selon laquelle :
i. Le gouvernement central, les communes et les bénéficiaires apportent 709,3 millions Fcfa
ii. Des partenaires au développement prennent en charge les frais de désenclavement (piste rurale Niafunké – Saraféré), et de l’assistance technique et la formation. Les coûts à ces composantes s’élèvent à 1.165,6 millions Fcfa, soit 2,42 millions dollars EU)
iii. Le FIDA prend en charge les autres coûts (4.173,7 millions Fcfa, soit 8,69 millions dollars) ainsi que détaillés ci – après.
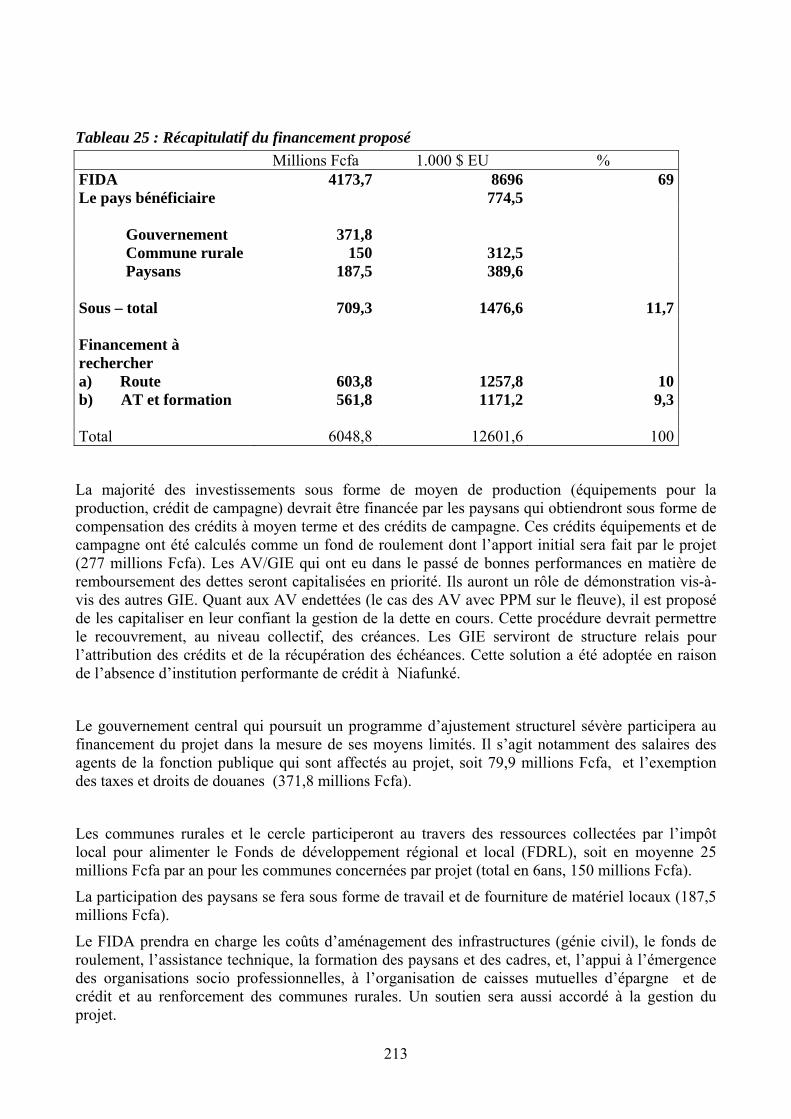
213
Tableau 25 : Récapitulatif du financement proposé Millions Fcfa 1.000 $ EU %
FIDA 4173,7 8696 69Le pays bénéficiaire 774,5
Gouvernement 371,8Commune rurale 150 312,5Paysans 187,5 389,6
Sous – total 709,3 1476,6 11,7 Financement à rechercher a) Route 603,8 1257,8 10b) AT et formation 561,8 1171,2 9,3 Total 6048,8 12601,6 100
La majorité des investissements sous forme de moyen de production (équipements pour la production, crédit de campagne) devrait être financée par les paysans qui obtiendront sous forme de compensation des crédits à moyen terme et des crédits de campagne. Ces crédits équipements et de campagne ont été calculés comme un fond de roulement dont l’apport initial sera fait par le projet (277 millions Fcfa). Les AV/GIE qui ont eu dans le passé de bonnes performances en matière de remboursement des dettes seront capitalisées en priorité. Ils auront un rôle de démonstration vis-à-vis des autres GIE. Quant aux AV endettées (le cas des AV avec PPM sur le fleuve), il est proposé de les capitaliser en leur confiant la gestion de la dette en cours. Cette procédure devrait permettre le recouvrement, au niveau collectif, des créances. Les GIE serviront de structure relais pour l’attribution des crédits et de la récupération des échéances. Cette solution a été adoptée en raison de l’absence d’institution performante de crédit à Niafunké.
Le gouvernement central qui poursuit un programme d’ajustement structurel sévère participera au financement du projet dans la mesure de ses moyens limités. Il s’agit notamment des salaires des agents de la fonction publique qui sont affectés au projet, soit 79,9 millions Fcfa, et l’exemption des taxes et droits de douanes (371,8 millions Fcfa).
Les communes rurales et le cercle participeront au travers des ressources collectées par l’impôt local pour alimenter le Fonds de développement régional et local (FDRL), soit en moyenne 25 millions Fcfa par an pour les communes concernées par projet (total en 6ans, 150 millions Fcfa).
La participation des paysans se fera sous forme de travail et de fourniture de matériel locaux (187,5 millions Fcfa).
Le FIDA prendra en charge les coûts d’aménagement des infrastructures (génie civil), le fonds de roulement, l’assistance technique, la formation des paysans et des cadres, et, l’appui à l’émergence des organisations socio professionnelles, à l’organisation de caisses mutuelles d’épargne et de crédit et au renforcement des communes rurales. Un soutien sera aussi accordé à la gestion du projet.
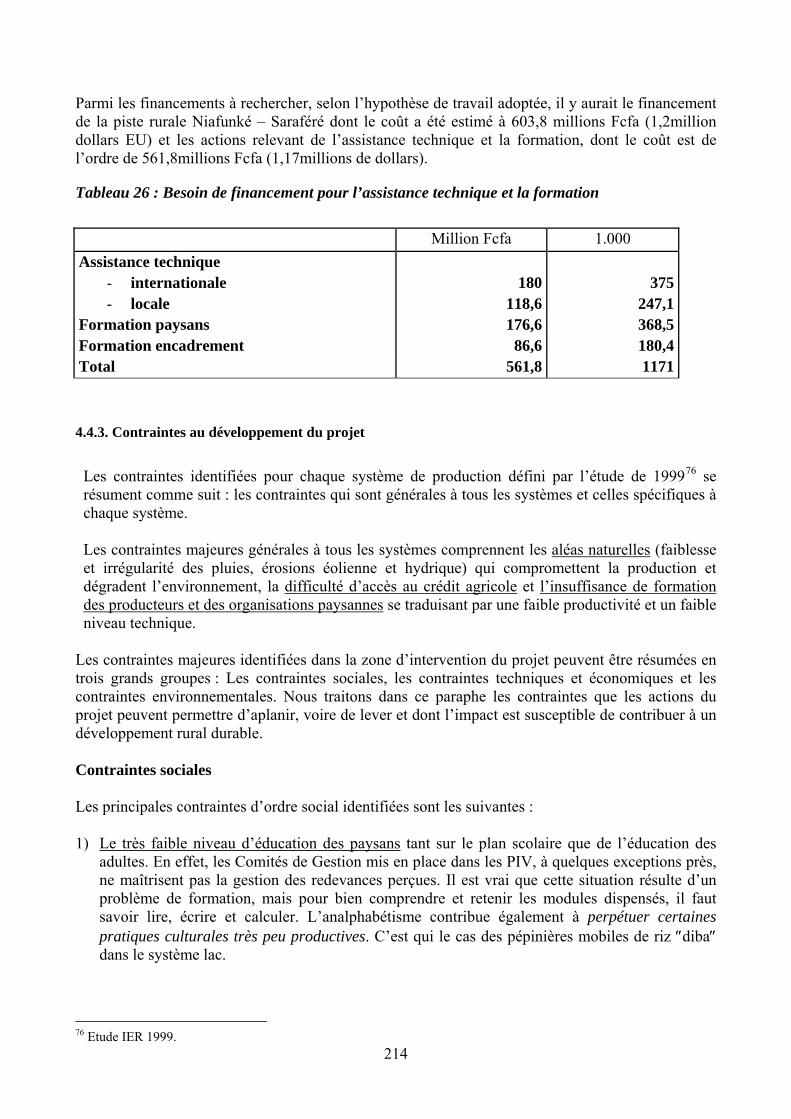
214
Parmi les financements à rechercher, selon l’hypothèse de travail adoptée, il y aurait le financement de la piste rurale Niafunké – Saraféré dont le coût a été estimé à 603,8 millions Fcfa (1,2million dollars EU) et les actions relevant de l’assistance technique et la formation, dont le coût est de l’ordre de 561,8millions Fcfa (1,17millions de dollars).
Tableau 26 : Besoin de financement pour l’assistance technique et la formation Million Fcfa 1.000 Assistance technique
- internationale 180 375- locale 118,6 247,1
Formation paysans 176,6 368,5Formation encadrement 86,6 180,4Total 561,8 1171
4.4.3. Contraintes au développement du projet
Les contraintes identifiées pour chaque système de production défini par l’étude de 199976 se résument comme suit : les contraintes qui sont générales à tous les systèmes et celles spécifiques à chaque système. Les contraintes majeures générales à tous les systèmes comprennent les aléas naturelles (faiblesse et irrégularité des pluies, érosions éolienne et hydrique) qui compromettent la production et dégradent l’environnement, la difficulté d’accès au crédit agricole et l’insuffisance de formation des producteurs et des organisations paysannes se traduisant par une faible productivité et un faible niveau technique.
Les contraintes majeures identifiées dans la zone d’intervention du projet peuvent être résumées en trois grands groupes : Les contraintes sociales, les contraintes techniques et économiques et les contraintes environnementales. Nous traitons dans ce paraphe les contraintes que les actions du projet peuvent permettre d’aplanir, voire de lever et dont l’impact est susceptible de contribuer à un développement rural durable. Contraintes sociales Les principales contraintes d’ordre social identifiées sont les suivantes : 1) Le très faible niveau d’éducation des paysans tant sur le plan scolaire que de l’éducation des
adultes. En effet, les Comités de Gestion mis en place dans les PIV, à quelques exceptions près, ne maîtrisent pas la gestion des redevances perçues. Il est vrai que cette situation résulte d’un problème de formation, mais pour bien comprendre et retenir les modules dispensés, il faut savoir lire, écrire et calculer. L’analphabétisme contribue également à perpétuer certaines pratiques culturales très peu productives. C’est qui le cas des pépinières mobiles de riz ″diba″ dans le système lac.
76 Etude IER 1999.

215
2) L’accumulation des organisations paysannes (Association Villageoise, Coopérative, Comité de Gestion, etc.) et les approches différentes des structures qui les animent dans les villages créent la confusion chez les paysans. Cette situation, aggravée par l’insuffisance de qualification de certaines structures d’encadrement (ONG nationales locales notamment), ne permet pas aux dirigeants de ces organisations de jouer efficacement leurs rôles auprès des paysans.
3) La forte emprise des chefs traditionnels sur les populations ne favorise pas la gestion
participative des actions collectives (biens d’équipement, périmètres aménagés, etc.). Cette ″pesanteur sociale″ explique également en grande partie la non fonctionnalité des associations socioprofessionnelles dans la mesure où les notables du villages, souvent analphabètes, tiennent à appartenir aux organes dirigeants par prestige.
4) Les conflits latents ou déclarés entre agriculteurs et éleveurs à propos de l’aménagement de
certaines mares (Maïbangou, Koboro) n’assurent pas la quiétude des populations, quiétude qui est la condition sine qua non pour travailler.
Contraintes économiques La contrainte majeure d’ordre économique identifiée est l’insuffisance, voire l’absence de structures de crédit agricole dans la zone d’intervention du projet. Les conséquences de cette situation se traduisant par :
1) Le faible niveau d’équipement des paysans en matériels agricoles crée des goulots d’étranglement dans la gestion des calendriers culturaux. En raison de l’insuffisance du matériel de culture attelée (22% en moyenne des UPA possèdent une charrue + une paire de bœufs et moins de 3% des surfaces sont labourées à la charrue), il y a chevauchement entre les calendriers culturaux dans les différents systèmes. Cette contrainte se ressent surtout dans les périmètres irrigués villageois dont l’exploitation exige des labours. A titre d’exemples, certaines exploitantes du PIV féminin de Tonka étaient obligées de piocher leurs parcelles au cours de la campagne 2002/2003 faute de charrue ou de tracteur.
2) Les difficultés d’accès aux intrants (semences améliorées, engrais, produits vétérinaires,
zootechniques et phytosanitaires) se traduisent par une faible productivité agricole. L’importance du crédit a été démontrée pendant la campagne 2002/2003 dans les PIV de Singo et Tomi-village à travers un prêt intrants octroyé aux exploitants par l’Union des Coopératives Agricoles et Maraîchères de Niafunké (UCAMAN). Cette facilité d’accès aux intrants et l’apport de la fumure organique ont permis, en effet à ces exploitants d’intensifier la culture du riz ; obtenant ainsi des rendements de 5.300 kg à 7.500 kg de paddy à l’hectare.
Une autre contrainte d’ordre économique est le problème d’écoulement de certains produits maraîchers périssables tels que l’échalote et la tomate. Contraintes environnementales Les contraintes environnementales majeures identifiées sont : 1) La forte dégradation des ressources naturelles liée aux effets conjugués du climat et des activités
humaines, a favorisé les phénomènes d’érosion et d’ensablement. L’érosion hydrique qui a provoqué des ravines sur les berges des mares (mare de Danga notamment) rend difficile la

216
maîtrise de l’eau dans les parties exploitables de ces mares. Le fleuve, les lacs, les mares et les périmètres aménagés sont fortement menacés par le phénomène d’ensablement favorisé par l’érosion éolienne.
2) Les attaques des nuisibles des cultures (chenilles, grillons, sautereaux, oiseaux granivores) très
fréquentes dans la zone, notamment autour des lacs et mares et sur les périmètres irrigués, constituent un facteur de baisse de la production.
Les résultats obtenus montrent que la zone d’intervention du projet a des atouts, le PDZL a des acquis, mais que les contraintes à lever sont encore très nombreuses.
Tableau 27: Récapitulatif des systèmes de production et leurs contraintes
SYSTÈMES
CONTRAINTES
Système des mares et lacs
• La gestion de l’eau (rentrée et sortie) ; • Accès difficile aux crédits agricoles (équipements, intrants) ; • Dégâts sur les cultures (d’animaux, oiseaux, sautereaux, chenilles) ; • Superficie très limitée ; • Manque d’organisations des producteurs ; • Erosions hydrique et éolienne ; • Faiblesse des crues ; • Faible niveau technique des paysans ; etc.
Cultures dunaires
• Insuffisance des pluies ; • Accès difficile aux crédits agricoles (équipements, intrants) ; • Manque de variétés améliorées bien adaptées ; • Dégâts sur les cultures (d’animaux, oiseaux) ;
Système PIV
• Superficie limitée (faible) ; • Accès difficile aux crédits agricoles (équipements, intrants) ; • Insuffisance d’entretien des infrastructures et des équipements ; • Manque de renouvellement des semences ; • Coûts de production élevés.
Système agro-pastoral
• Insuffisance des pâturages (problème d’alimentation) ; • Difficulté d’accès aux soins vétérinaires ; • Manque de crédit pour l’embouche.
Système pastoral
• Insuffisance des pâturages (problème d’alimentation) ; • Difficulté d’abreuvement pendant la transhumance et le nomadisme ; • Difficulté d’accès aux soins vétérinaires ; • Perte d’animaux (épizooties et vols) ; • Conflit avec les agriculteurs.
Pêche
• .Manque d’accès aux crédits d’équipement de pêche ; • Irrégularité des crues.
Sylviculture
• Insuffisance de formation en matière de conduite des pépinières ; • Insuffisance/manque d’eau pour arroser les pépinières ;
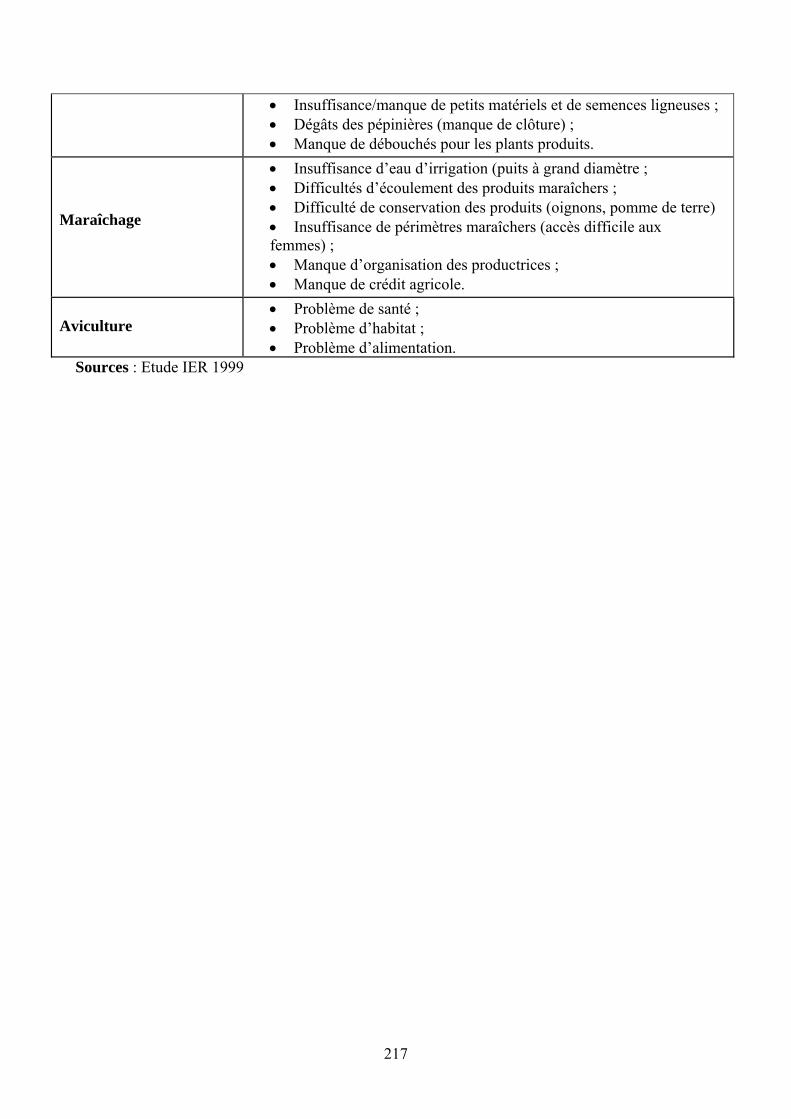
217
• Insuffisance/manque de petits matériels et de semences ligneuses ; • Dégâts des pépinières (manque de clôture) ; • Manque de débouchés pour les plants produits.
Maraîchage
• Insuffisance d’eau d’irrigation (puits à grand diamètre ; • Difficultés d’écoulement des produits maraîchers ; • Difficulté de conservation des produits (oignons, pomme de terre) • Insuffisance de périmètres maraîchers (accès difficile aux femmes) ; • Manque d’organisation des productrices ; • Manque de crédit agricole.
Aviculture
• Problème de santé ; • Problème d’habitat ; • Problème d’alimentation.
Sources : Etude IER 1999

218
4.4.4. Perspectives
Les contraintes détaillées ci-dessus sous-tendent les propositions de solutions suivantes : 1) Le renforcement de l’alphabétisation et la dynamisation des organisations paysannes :
L’éducation scolaire ne relève pas de la compétence du projet, en revanches les actions déjà entamées dans le domaine de l’alphabétisation doivent être renforcer et de façon stratégique :
Le projet ne doit plus ambitionner d’entreprendre l’alphabétisation tous azimuts, il doit
désormais cibler les villages et les acteurs à former. Les villages cibles doivent être ceux où la population partage un centre d’intérêt commun viable tel que, par exemple, un PIV et en ce qui concerne les apprenants, le choix doit porter sur des jeunes (hommes et femmes) motivés(es), disponibles et stables dans le village ;
La formation doit se faire de façon fonctionnelle, c’est à dire, tous les exercices doivent se
rapporter concrètement aux activités que les exploitants mènent. A cet effet, le projet peut commettre un consultant très confirmé dans l’enseignement des adultes pour l’élaboration des documents didactiques et de gestion et pour assurer la formation de base. Les ONG locales qui ont déjà un contrat avec le projet pourront par la suite assurer le suivi et le recyclage pour les jeunes formés à un niveau dit de post alpha. Pour renforcer cette formation, le projet organiser des voyages d’études dans d’autres projets et offices où les alphabétisés ont atteint une compétence dans la gestion des affaires collectives du village ;
Les jeunes bien formés/es doivent occuper les postes de direction dans les organisations. Afin
d’amener les vieux notables à accepter cette situation, il faut constamment les sensibiliser en leur expliquant les enjeux dans l’occupation de tel ou tel poste dans le comité de gestion par exemple. Toutefois, des postes de membres d’honneur peuvent leur être octroyés afin de ménager leur susceptibilité et leur fierté. Il convient de souligner que la loi coopérative qui doit régir désormais toutes les organisations et associations pourrait bien résoudre la multiplicité des dénominations et des approches ; ceci permettra en principe de mieux orienter les paysans.
2) La forte emprise des chefs traditionnels sur les populations est un sujet très délicat et sensible,
mais il faut tout de même l’aborder car, elle constitue une entrave à la réussite de beaucoup d’actions et un facteur qui milite contre l’émulation des populations. Il s’agit d’être persévérant dans la sensibilisation, mais en concentrant les efforts d’abord sur les chefs traditionnels réceptifs et instruits ; une fois acquis pour la cause, ceux-ci pourraient amener ensuite les autres à changer de comportements.
3) Les conflits entre agriculteurs et éleveurs concernant l’aménagement des mares et lacs
pourraient être résolus à travers l’élaboration d’un plan d’aménagement consensuel ou tous les acteurs estimeront n’avoir pas été lésés. L’élaboration d’un tel plan doit se faire par une approche participative où tous les acteurs auront leurs mots à dire. Il faut avouer que l’élaboration des plans d’aménagements est souvent l’œuvre des seuls techniciens compétents en la matière, habillée au mieux par des études sociologiques sommaires.
4) L’insuffisance ou l’absence de structure de crédit agricole : la situation peut s’améliorer si le
projet apporte un appui conséquent à la création d’une structure solide de crédit du genre caisse mutualiste d’épargne et de crédit. A cet effet, le projet pourrait s’inspirer de l’expérience de la Fédération des Caisses Mutualistes du Delta à Niono qui semble résoudre de nombreux problèmes des associations socioprofessionnelles de l’Office du Niger.
219
5) La lutte contre la dégradation des ressources naturelles : le projet a déjà beaucoup d’actions
dans ce sens (formation de certains groupements féminins pour la production de plants forestiers, les actions anti-érosives sur les berges de certaines mares, etc.), à présent il doit poursuivre ces actions en les renforçant. En effet, les femmes pépiniéristes formées à cet effet se sont senties délaisser par le projet qui n’achète plus les plants qu’elles produisent ; or les débouchés pour ces plants forestiers sont très limités. Des difficultés ont été constatées effectivement à Mékoé et à Tonka. Afin de résoudre ce problème, le projet doit sensibiliser les paysans pour développer l’agro foresterie et il doit également associer aux cordons pierreux de lutte contre l'érosion le traitement biologique des berges des mares.
6) La lutte contre les attaques des nuisibles des cultures : le projet doit activer le contrat qui le lie à
l’organisme de la protection phytosanitaire des végétaux dont un représentant réside à Niafunké. Le PDZL a honoré toutes les clauses contractuelles et l’organisme ne fournit pas les prestations prévues. Le projet doit également demander les services des spécialistes en entomologie afin d’inventorier tous les nuisibles dans la zone des lacs. Certains nuisibles ne sont pas encore bien connus et pourtant ils sont très dévastateurs.
CONCLUSION GENERALE ET RECOMMANDATIONS La stratégie nationale d'investissement, de planification et de mise en œuvre de projets d'AHA au Mali est bien pensée et concorde bien avec les directives des bailleurs de fonds. Cependant les procédures de conception, de financement, de planification et de mise en œuvre des projets d'AHA au Mali souffrent de quelques écueils qu'il est opportun de citer :
- l'obligation pour le Gouvernement du Mali d'adopter la philosophie du bailleur de fonds pour pouvoir bénéficier de son financement;
- le peu de présence du bailleur de fonds hormis pendant les phases de conception et de fin du projet;
- le retard dans le décaissement des fonds octroyés; - la multiplicité des procédures selon les bailleurs de fonds; - la faible collaboration directe entre les bailleurs de fonds et les bénéficiaires; - la faiblesse des capacités techniques des collectivités locales; - le niveau élevé d'analphabétisme des populations bénéficiaires; - la sous-utilisation des capacités techniques des cadres nationaux; - la faiblesse de rémunération des cadres fonctionnaires des projets.
En ce qui concerne les cas de projets étudiés, le constat suivant se dégage : Il existe des contraintes qui sont récurrentes selon le type d'aménagement considéré, notamment :
- Système de maîtrise totale de l'eau avec pompage : l'une des difficultés majeures de ce type d'aménagement est la contrainte liée au choix technique du matériel de pompage. En effet ce choix est le plus souvent opéré par l'équipe de projet sans consultation préalable ni approbation des bénéficiaires, ce qui fait que dans la plupart des cas, les bénéficiaires qui ont déjà une certaine expérience d'utilisation de GMP, trouvent que les pompes fournies n'ont pas la robustesse requise pour supporter les conditions physiques du terrain. Le choix unilatéral du matériel par l'équipe du projet s'explique par des raisons d'économie (matériel moins cher et à maintenance plus facile) qui ne correspondent pas souvent aux besoins réels sur le terrain. De même la maintenance et le renouvellement des GMP constituent une des contraintes majeures auxquelles les exploitants font face dans la phase d'expansion des projets.

220
Le problème du foncier est aussi un des problèmes importants de ce système dans la mesure où c'est dans la plupart des cas le droit coutumier ancien qui s'applique à ces terres et il est très difficile de concilier ce droit avec les règles de gestion et d'appropriation des espaces communautaires telles que définies par la loi malienne actuelle. De ce fait, le partage des terres après aménagement ne se fait jamais comme convenu avec l'administration, avant les aménagements. De nombreux cas de conflits existent entre autochtones (propriétaires fonciers coutumiers) et allochtones (installés relativement récemment dans la zone).
Les aspects de suivi-évaluation pendant les projets ne sont généralement pas maîtrisés, ce qui fait qu'il existe rarement des référentiels technico-économiques permettant de juger de l'atteinte des objectifs fixés préalablement au démarrage du projet. Dans la plupart des cas, on fait appel de manière ponctuelle à des consultants pour gérer les urgences liées à la fourniture de rapports pour la suite des décaissements.
Il en est de même pour les formations qui généralement ne sont pas évaluées et ne sont pas suivies de recyclage. De ce fait les exploitations oublient rapidement ce qu'ils ont appris et attendent toujours que les techniciens du projet viennent régler leurs difficultés de gestion du moment.
- Les systèmes en submersion libre ou contrôlée : ces systèmes sont les premiers à avoir été mis en place au Mali pendant la période des opérations de développement rural (ODR) dans les années 1970, qui se sont érigées actuellement pour la plupart en Offices de développement. Il s'agit aussi des bas-fonds aménagés autour de plusieurs villages, surtout en zone cotonnière dans le Mali-sud77. Ces aménagements avaient à l'époque suscité beaucoup d'espoir pour le Mali car le pays sortait d'une grave sécheresse qui avait pratiquement décimé les 2/3 du cheptel du pays. Les aménagements de submersion contrôlée en zones Office Riz Ségou et Office Riz Mopti devaient garantir la sécurité alimentaire des populations bénéficiaires et assurer l'approvisionnement des zones chroniquement déficitaires du pays. Pendant quelques années de bonne pluviométrie successives, ces aménagements ont permis d'atteindre des succès réels. Cependant ils vont vite montrer leurs limites dès que "les bonnes années" de pluviométrie et de crue vont alternées avec "les mauvaises années". La pluviométrie et la crue étant insuffisantes, l'eau n'arrivait pas à entrer dans les aménagements et on se retrouvait en pleine situation de déficit alimentaire. En cas de pluviométrie et de crue trop abondantes, les cultures dans la plaine sont inondées.
Cette situation va obliger le pays à adopter une nouvelle stratégie qui va consister à financer de moins de moins d'aménagements en submersion contrôlée et de chercher plutôt à sécuriser les existants. Il s'agira de renforcer les des digues de ceinture autour des plaines de submersion et de les équiper en vannes pour l'admission et de lâcher d'eau au moment où ce serait opportun. Il fallait aussi équiper, là où c'est possible les plaines de submersion contrôlée en ouvrages pour le pompage de l'eau (cas de la plaine pour la riziculture à San).
Les exemples d'aménagement de bas-fonds en zone Mali-sud ont permis à plusieurs titres de sécuriser la production agricole (riz, maraîchers) en zone d'intervention de la CMDT. Cependant le recentrage récent des activités de la compagnie cotonnière a favorisé le transfert de ces activités dans les prérogatives du PNIR.
- Le dispositif actuel de référence pour l'aménagement hydro-agricole au Mali est devenu le périmètre irrigué de dimension variant de 0,5 à moins de 100 ha. Ce type d'aménagement
77 Ces aménagements ont été réalisés pour la plupart par la CMDT dans ses zones d'intervention.
221
bien que plus coûteux à l'ha par rapport à la submersion contrôlée, permet d'assurer la production agricole sur deux campagnes agricoles (hivernage et contre-saison), ce qui permet de rentabiliser les investissements initiaux.
- Le système gravitaire avec maîtrise totale de l'eau (cas de l'ON, du PAPIM et de l'OPIB, etc.) : ce système représente une grande opportunité en termes de développement agricole pour le Mali. A titre d'illustration la zone ON représente environ 80.000 ha irrigués sur un potentiel de plus d'un million d'ha. Cependant les aménagements sont très coûteux du fait de l'envergure des surfaces à aménager et cet effort en investissement de base doit être fourni par l'Etat malien qui manque de ressources financières. La tendance actuelle est à la forte implication des populations bénéficiaires pour réduire les coûts d'aménagement et accroître leur responsabilité vis-à-vis de ceux-ci. Le cas du périmètre de Bewani en zone ON sert d'exemple d'illustration dans la mesure où la totalité de la main d'œuvre pour l'aménagement aurait été fournie par les bénéficiaires.
Tous ces systèmes précités font face à une contrainte commune à savoir la forte précarité financière des bénéficiaires et leur analphabétisme qui, de ce fait, se voient confrontés à des problèmes en termes d'appropriation des infrastructures, en moyens financiers pour leur approvisionnement en intrants et matériels agricoles, en terme d'accès au crédit agricole (systèmes totalement libéralisés actuellement dans le pays) et ne peuvent donc assurer aucun investissement d'envergure.
En terme de perspectives, les initiatives d'appui à la stratégie nationale d'investissement, de planification et d'exécution des projets d'aménagement hydro-agricole au Mali doivent viser à :
- Exiger le concours des populations bénéficiaires de la phase de conception à la phase finale d'appropriation du projet;
- Dissocier l'octroi de financement des projets d'AHA de la conception spécifique d'un ou de plusieurs bailleurs de fonds;
- Aider à renforcer les investissements privés en zones d'irrigation gravitaire;
- Promouvoir à la demande les initiatives privées et communautaires de réalisation de micro-périmètres irrigués avec système de pompage;
- Soutenir le renforcement des capacités des organisations paysannes ainsi des producteurs individuels (formation, micro crédit, aides, etc.);
- Soutenir le renforcement des capacités des cadres et bureaux d'études privés chargés de la surveillance technique des infrastructures;
- Favoriser l'utilisation des compétences techniques nationales et locales;
- Développer des cadres de consultation entre l'expertise nationale, les bailleurs de fonds et les bénéficiaires;
- Renforcer les capacités des collectivités locales décentralisées.
222
BIBLIOGRAPHIE
1. Etat d'Avancement du Projet PDZL de Niafunké, du 1er juillet au 31 décembre 1994,
MDRE/DNA, janvier 1995
2. Etude bilan/diagnostic des systèmes de crédit en zone VRES et proposition d'actions dans le
cadre du 8ème FED, Bakary S. Coulibaly, Manda Sadio Keita, Mohamed Sidi Mohamed
Touré. VRES, Novembre 2000.
3. Etude de mise en place d'un mécanisme de financement de l'irrigation au Mali, BRL-
ingénieurs, rapport 2004
4. Etude d'exécution de la zone de maraîchage de Sélingué Aval, Cira-Sarl, 2004.
5. Etude pour la mise en place d'un mécanisme de contrôle et surveillance des travaux
d'aménagement du PAPIM, MDR/ODRS, 2004
6. Etude socio-économique actualisée du Projet pour la Promotion de l'Irrigation Privée
(PPIP), APROFA, rapport final, décembre 1998.
7. Etude sur l’évolution des systèmes de production dans la zone d’intervention du Projet de
Développement de la zone lacustre (PDZL) Phase II, Niafunke, ECOFIL/IER, Rapport
2003.
8. Evaluation du Projet Valorisation des Ressources en Eaux de Surface en 5ème région VRES-
Phase II, Texte Principal, Cirad-tera N°39/99, juin 1999
9. Evaluation du Projet Valorisation des Ressources en Eaux de Surface en 5ème région VRES-
Phase II, Annexe, Cirad-tera N°39/99, juin 1999
10. Le foncier rural au Mali, Etats des lieux et problématiques, CEDREF-GED, Juin 2000.
11. Programme de Travail et Budget annuel 2002 du Projet PDZL de Niafunké,
MDR/DNAMR/PDZL Phase II, octobre 2001
12. Projet d'Etudes de faisabilité de petits barrages de retenue dans la région de Kangaba,
MMEE/DAF, CIRA-Sarl, mai 2002
13. Rapport d'achèvement du Projet Pilote de Promotion de l'Irrigation Privée, 15 Août 2003, La
Banque Mondiale, Développement Durable IV, Région Afrique.
14. Rapport d'évaluation du Projet Pilote de Promotion de l'Irrigation Privée, 1997, Association
internationale pour le Développement Agissant en qualité d'Administrateur du Fonds
intérimaire spécial, rapport n°16256-MLI, République du Mali, 29 avril 1997, Agriculture
Groupe III, Département-pays 15, Région Afrique, La Banque Mondiale.
223
15. Répertoire des projets et programmes du secteur du développement rural, 2002, Cellule de
planification et de statistique, Ministère de l'Agriculture, de l'Elévage te de la Pêche,
Novembre 2002. Mali
16. Schéma d'Aménagement et de Développement du Cercle d'Ansongo (Région de Gao), MEF-
SG/PRECAGED, Adikarim Touré, Version finale, avril 2001
17. Suivi et évaluation du projet PDZL de Niafunké, MDRE/IER. PAER, février 1993
Lois, Décrets, Stratégies Nationales
1. Code de l'Eau, Secrétariat Général du Gouvernement, Journal Officiel, Spécial N°8 du 02
mai 2002
2. Contrat-Plan (2002-2004), Rapport d'exécution, Office du Niger, janvier 2004
3. Lois et Décrets de la Décentralisation, Mission de Décentralisation, Primature de la
République du Mali, Février 1997
4. Stratégie Nationale de Développement de l'Irrigation, MDRE, août 1999
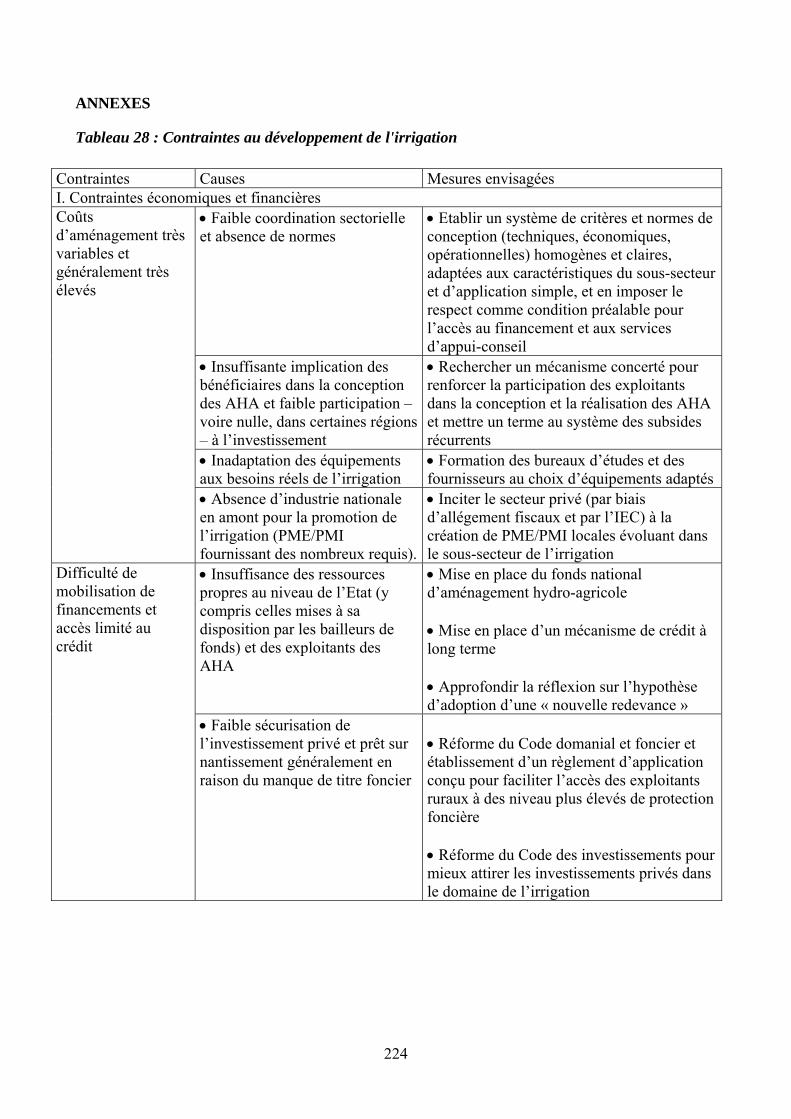
224
ANNEXES
Tableau 28 : Contraintes au développement de l'irrigation
Contraintes Causes Mesures envisagées I. Contraintes économiques et financières
• Faible coordination sectorielle et absence de normes
• Etablir un système de critères et normes de conception (techniques, économiques, opérationnelles) homogènes et claires, adaptées aux caractéristiques du sous-secteur et d’application simple, et en imposer le respect comme condition préalable pour l’accès au financement et aux services d’appui-conseil
• Insuffisante implication des bénéficiaires dans la conception des AHA et faible participation – voire nulle, dans certaines régions – à l’investissement
• Rechercher un mécanisme concerté pour renforcer la participation des exploitants dans la conception et la réalisation des AHA et mettre un terme au système des subsides récurrents
• Inadaptation des équipements aux besoins réels de l’irrigation
• Formation des bureaux d’études et des fournisseurs au choix d’équipements adaptés
Coûts d’aménagement très variables et généralement très élevés
• Absence d’industrie nationale en amont pour la promotion de l’irrigation (PME/PMI fournissant des nombreux requis).
• Inciter le secteur privé (par biais d’allégement fiscaux et par l’IEC) à la création de PME/PMI locales évoluant dans le sous-secteur de l’irrigation
• Insuffisance des ressources propres au niveau de l’Etat (y compris celles mises à sa disposition par les bailleurs de fonds) et des exploitants des AHA
• Mise en place du fonds national d’aménagement hydro-agricole • Mise en place d’un mécanisme de crédit à long terme • Approfondir la réflexion sur l’hypothèse d’adoption d’une « nouvelle redevance »
Difficulté de mobilisation de financements et accès limité au crédit
• Faible sécurisation de l’investissement privé et prêt sur nantissement généralement en raison du manque de titre foncier
• Réforme du Code domanial et foncier et établissement d’un règlement d’application conçu pour faciliter l’accès des exploitants ruraux à des niveau plus élevés de protection foncière • Réforme du Code des investissements pour mieux attirer les investissements privés dans le domaine de l’irrigation

225
• Réticences de la BNDA à l’octroi de crédits à moyen terme et insuffisante capacité d’évaluer des projets d’investissements en AHA
• Renforcement des capacités de la BNDA et réorientation de ses activités dans le sens d’une augmentation de l’octroi de crédits à moyen terme. • Revitalisation/réglementation du crédit informel (coopératives, caisses, ONG) visant la croissance accélérée de ce sous-secteur dont le poids actuel est marginal
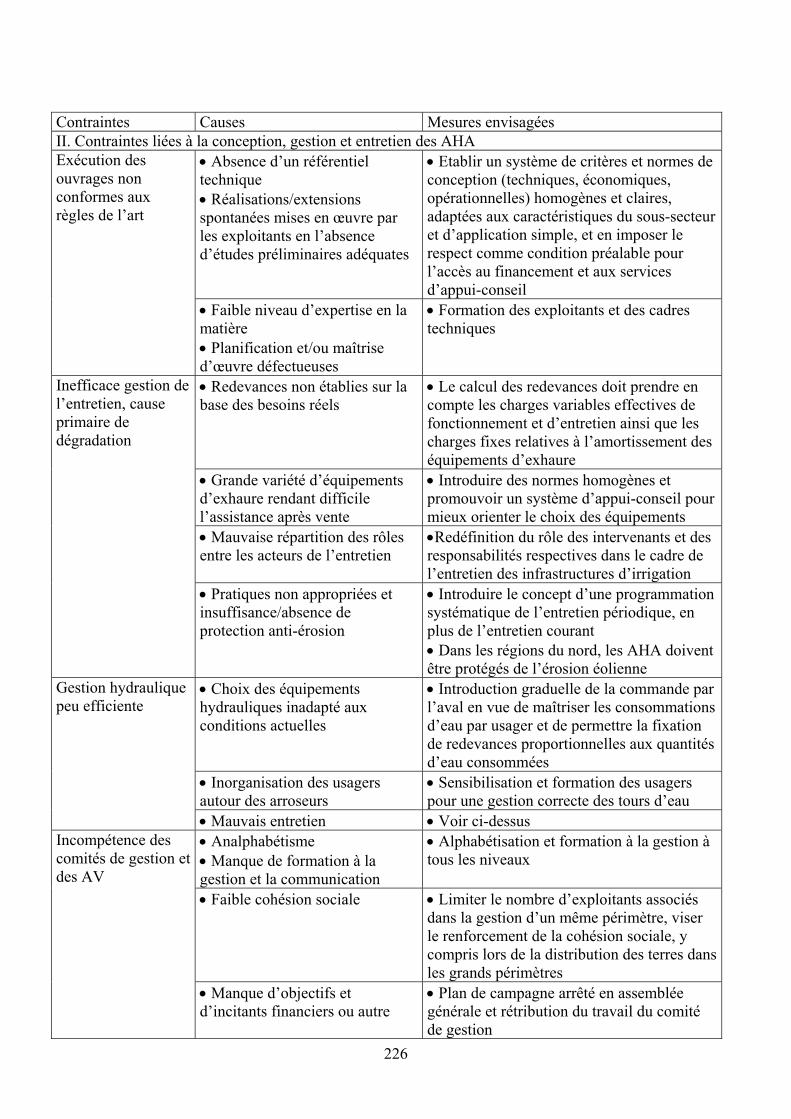
226
Contraintes Causes Mesures envisagées II. Contraintes liées à la conception, gestion et entretien des AHA
• Absence d’un référentiel technique • Réalisations/extensions spontanées mises en œuvre par les exploitants en l’absence d’études préliminaires adéquates
• Etablir un système de critères et normes de conception (techniques, économiques, opérationnelles) homogènes et claires, adaptées aux caractéristiques du sous-secteur et d’application simple, et en imposer le respect comme condition préalable pour l’accès au financement et aux services d’appui-conseil
Exécution des ouvrages non conformes aux règles de l’art
• Faible niveau d’expertise en la matière • Planification et/ou maîtrise d’œuvre défectueuses
• Formation des exploitants et des cadres techniques
• Redevances non établies sur la base des besoins réels
• Le calcul des redevances doit prendre en compte les charges variables effectives de fonctionnement et d’entretien ainsi que les charges fixes relatives à l’amortissement des équipements d’exhaure
• Grande variété d’équipements d’exhaure rendant difficile l’assistance après vente
• Introduire des normes homogènes et promouvoir un système d’appui-conseil pour mieux orienter le choix des équipements
• Mauvaise répartition des rôles entre les acteurs de l’entretien
•Redéfinition du rôle des intervenants et des responsabilités respectives dans le cadre de l’entretien des infrastructures d’irrigation
Inefficace gestion de l’entretien, cause primaire de dégradation
• Pratiques non appropriées et insuffisance/absence de protection anti-érosion
• Introduire le concept d’une programmation systématique de l’entretien périodique, en plus de l’entretien courant • Dans les régions du nord, les AHA doivent être protégés de l’érosion éolienne
• Choix des équipements hydrauliques inadapté aux conditions actuelles
• Introduction graduelle de la commande par l’aval en vue de maîtriser les consommations d’eau par usager et de permettre la fixation de redevances proportionnelles aux quantités d’eau consommées
• Inorganisation des usagers autour des arroseurs
• Sensibilisation et formation des usagers pour une gestion correcte des tours d’eau
Gestion hydraulique peu efficiente
• Mauvais entretien • Voir ci-dessus • Analphabétisme • Manque de formation à la gestion et la communication
• Alphabétisation et formation à la gestion à tous les niveaux
• Faible cohésion sociale • Limiter le nombre d’exploitants associés dans la gestion d’un même périmètre, viser le renforcement de la cohésion sociale, y compris lors de la distribution des terres dans les grands périmètres
Incompétence des comités de gestion et des AV
• Manque d’objectifs et d’incitants financiers ou autre
• Plan de campagne arrêté en assemblée générale et rétribution du travail du comité de gestion

227
• Manque de transparence dans l’utilisation des redevances perçues
• Détermination de la redevance sur la base de critères objectifs, conduite contradictoirement avec les exploitants • Bilan annuel en assemblée générale des coûts engagés sur la redevance • Alphabétisation fonctionnelles des exploitants axée sur la gestion financière des aménagements
• Association redevances eau et crédit intrants
• Séparation redevance eau et intrants agricoles
Non paiement des redevances
• Non application des sanctions prévues au cahier des charges
• Respect du cahier des charges
NB AHA : Aménagement Hydro Agricole

228
Contraintes Causes Mesures envisagées III. Contraintes liées à la mise en valeur agricole
• Obligation de satisfaire (partielle) un maximum de bénéficiaires
• La taille de la parcelle individuelle doit être fixée en rapport avec les besoins alimentaires des exploitants et avec la rentabilité des investissements
• Accès limité au crédit à moyen terme
• Voir plus haut (contraintes économiques et financières)
• Insuffisance de paysans semenciers
• Stimuler l’augmentation du nombre des paysans semenciers par la formation, l’appui du Service semencier national pendant la culture et la fourniture d’équipements de conditionnement
Attribution des parcelles individuelles trop petites pour couvrir le besoin alimentaire
• Faiblesse du contrôle de qualité et du suivi des paysans semenciers
• Renforcer le contrôle de qualité des semences
•Désengagement de l’Etat de la filière engrais • Commerce privé peu attractif
• Promouvoir, par des mesures incitatives l’intérêt de privés pour la filière
• Achat à crédit généralisé • Limiter le crédit intrants aux bénéficiaires solvables
• Infrastructures routières déficientes, enclavement
• Améliorer les voies de communications
Insuffisance disponibilité et coût élevé des engrais
• Demande atomisée • Grouper la demande par zone géographique via GIE (intermédiaire commercial)
• Cycles végétatifs de certaines spéculations non adaptés (trop longs) à la double culture et aux conditions édaphoclimatiques
• Recherche de variétés adaptées
• Utilisation de variétés peu performantes (canne à sucre)
• Utiliser des équipements de transformation adaptés à de meilleures variétés de canne
• Non respect du calendrier cultural
• Respect du calendrier cultural précisé au cahier des charges
• Disponibilité en eau de surface insuffisante
• Recherche et évaluation de systèmes alternatifs d’irrigation
Insuffisante production de contre-saison
• Coût élevé et faible disponibilité de l’eau souterraine
• Diffusion de techniques de forages à faible coût • Promotion de systèmes d’irrigation économisant l’eau
• Faible intérêt des exploitants • Information et appui-conseil pour des produits porteurs
•Difficile adaptation des techniques culturales d’une spéculation à l’autre
• Acquisition de paquets technologiques adaptés et formation des paysans
Manque de diversification
• Ignorance technique et insuffisante information des producteurs
• Démonstration chez paysans novateurs, visant à prouver les avantages économiques de la diversification (cf. PSSA)

229
•Absence de filières commerciales spécialisées
• Développer le système d’information du marché (SIM) et encourager l’émergence d’opérateurs-filière en dehors des filières traditionnelles
•Appui-conseil limité à la riziculture
•Adapter l’appui-conseil aux exigences de la diversification
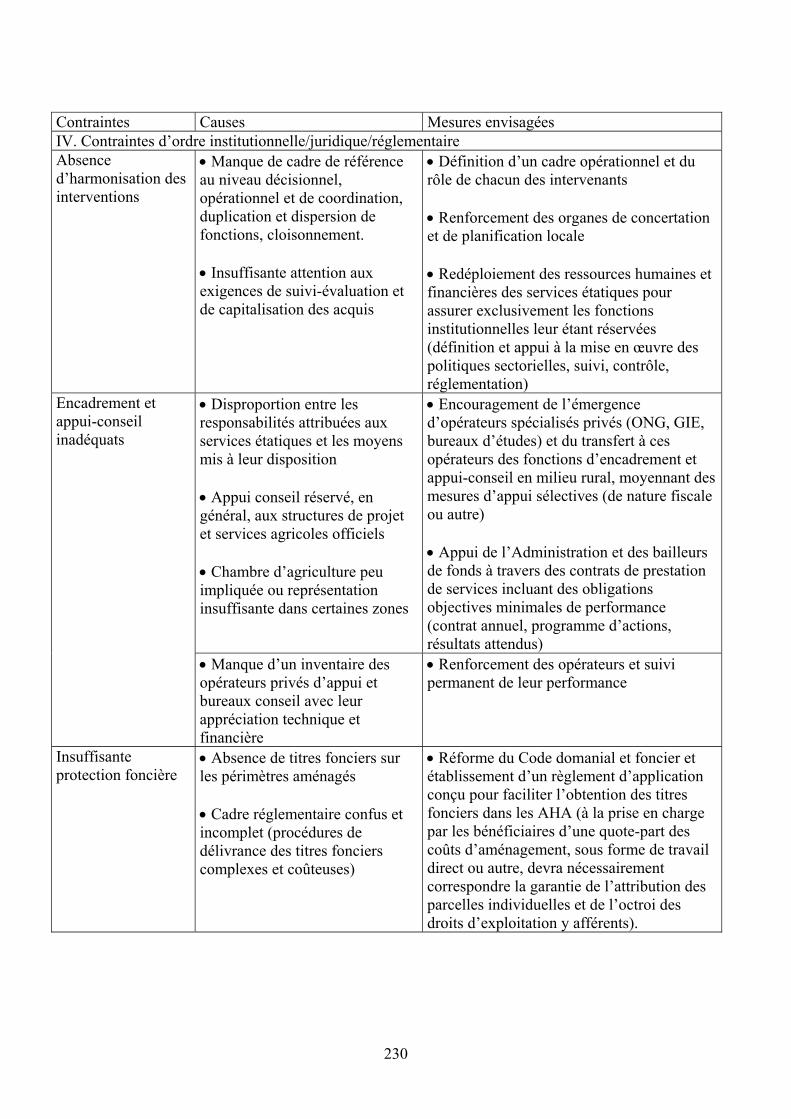
230
Contraintes Causes Mesures envisagées IV. Contraintes d’ordre institutionnelle/juridique/réglementaire Absence d’harmonisation des interventions
• Manque de cadre de référence au niveau décisionnel, opérationnel et de coordination, duplication et dispersion de fonctions, cloisonnement. • Insuffisante attention aux exigences de suivi-évaluation et de capitalisation des acquis
• Définition d’un cadre opérationnel et du rôle de chacun des intervenants • Renforcement des organes de concertation et de planification locale • Redéploiement des ressources humaines et financières des services étatiques pour assurer exclusivement les fonctions institutionnelles leur étant réservées (définition et appui à la mise en œuvre des politiques sectorielles, suivi, contrôle, réglementation)
• Disproportion entre les responsabilités attribuées aux services étatiques et les moyens mis à leur disposition • Appui conseil réservé, en général, aux structures de projet et services agricoles officiels • Chambre d’agriculture peu impliquée ou représentation insuffisante dans certaines zones
• Encouragement de l’émergence d’opérateurs spécialisés privés (ONG, GIE, bureaux d’études) et du transfert à ces opérateurs des fonctions d’encadrement et appui-conseil en milieu rural, moyennant des mesures d’appui sélectives (de nature fiscale ou autre) • Appui de l’Administration et des bailleurs de fonds à travers des contrats de prestation de services incluant des obligations objectives minimales de performance (contrat annuel, programme d’actions, résultats attendus)
Encadrement et appui-conseil inadéquats
• Manque d’un inventaire des opérateurs privés d’appui et bureaux conseil avec leur appréciation technique et financière
• Renforcement des opérateurs et suivi permanent de leur performance
Insuffisante protection foncière
• Absence de titres fonciers sur les périmètres aménagés • Cadre réglementaire confus et incomplet (procédures de délivrance des titres fonciers complexes et coûteuses)
• Réforme du Code domanial et foncier et établissement d’un règlement d’application conçu pour faciliter l’obtention des titres fonciers dans les AHA (à la prise en charge par les bénéficiaires d’une quote-part des coûts d’aménagement, sous forme de travail direct ou autre, devra nécessairement correspondre la garantie de l’attribution des parcelles individuelles et de l’octroi des droits d’exploitation y afférents).
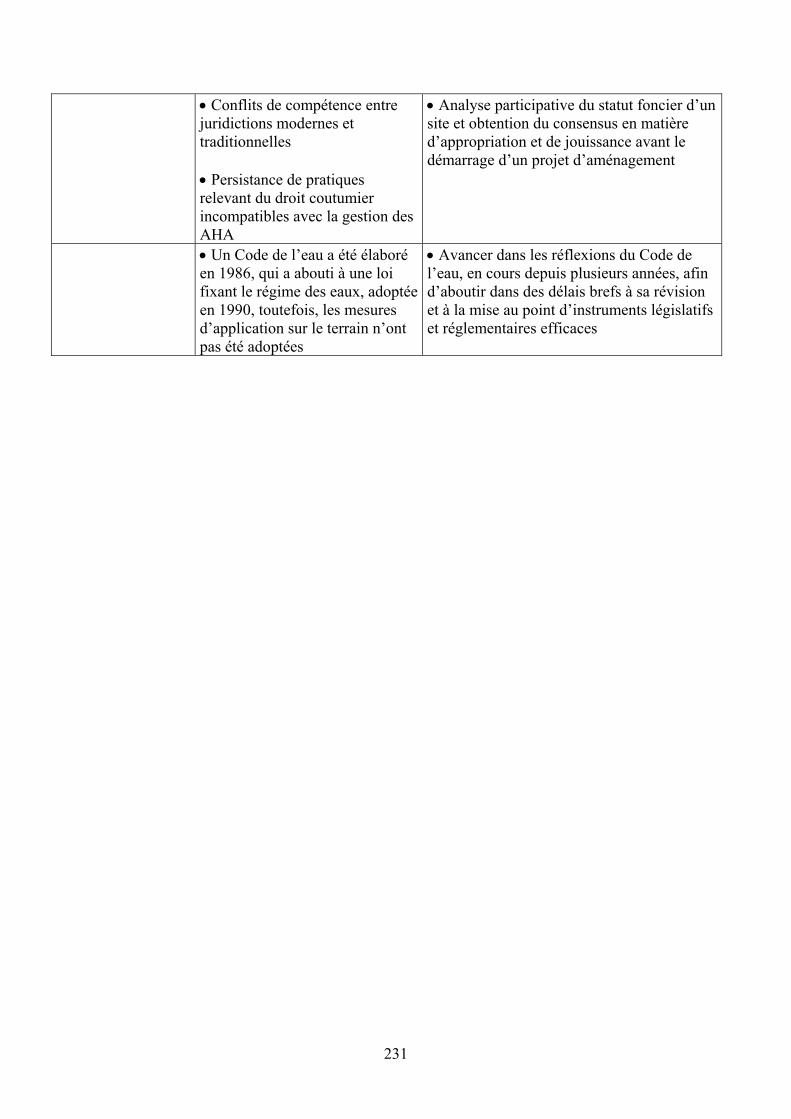
231
• Conflits de compétence entre juridictions modernes et traditionnelles • Persistance de pratiques relevant du droit coutumier incompatibles avec la gestion des AHA
• Analyse participative du statut foncier d’un site et obtention du consensus en matière d’appropriation et de jouissance avant le démarrage d’un projet d’aménagement
• Un Code de l’eau a été élaboré en 1986, qui a abouti à une loi fixant le régime des eaux, adoptée en 1990, toutefois, les mesures d’application sur le terrain n’ont pas été adoptées
• Avancer dans les réflexions du Code de l’eau, en cours depuis plusieurs années, afin d’aboutir dans des délais brefs à sa révision et à la mise au point d’instruments législatifs et réglementaires efficaces
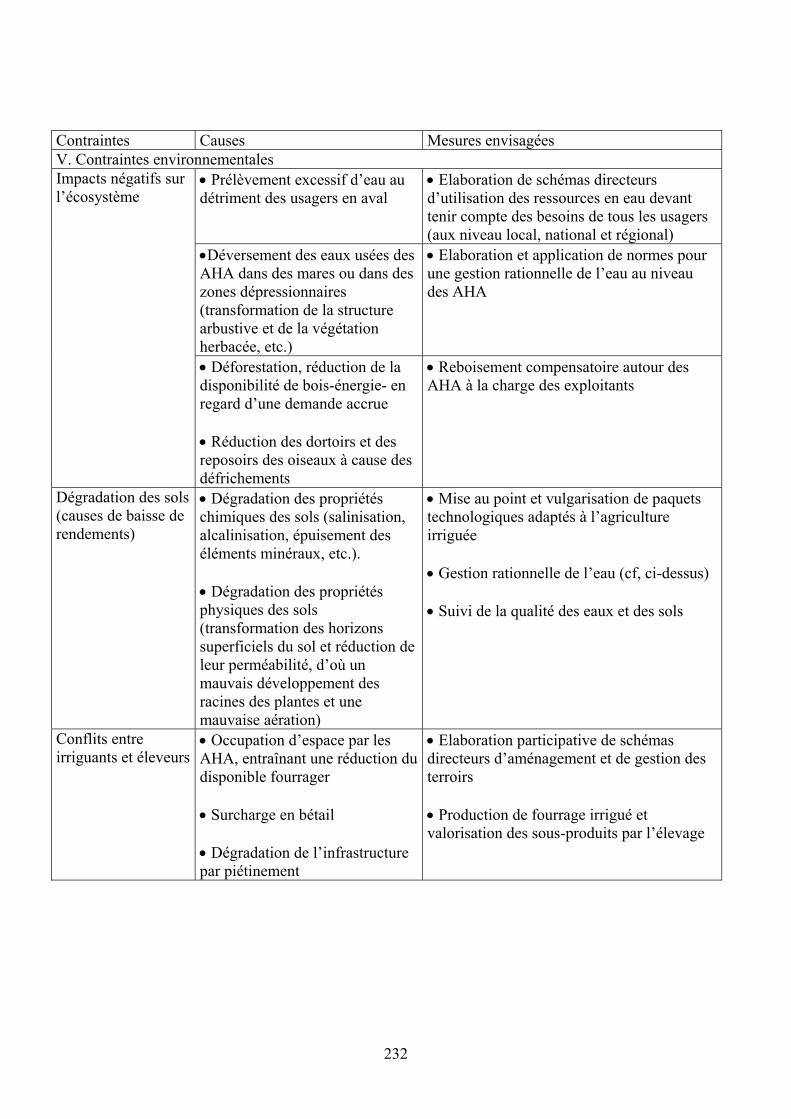
232
Contraintes Causes Mesures envisagées V. Contraintes environnementales
• Prélèvement excessif d’eau au détriment des usagers en aval
• Elaboration de schémas directeurs d’utilisation des ressources en eau devant tenir compte des besoins de tous les usagers (aux niveau local, national et régional)
•Déversement des eaux usées des AHA dans des mares ou dans des zones dépressionnaires (transformation de la structure arbustive et de la végétation herbacée, etc.)
• Elaboration et application de normes pour une gestion rationnelle de l’eau au niveau des AHA
Impacts négatifs sur l’écosystème
• Déforestation, réduction de la disponibilité de bois-énergie- en regard d’une demande accrue • Réduction des dortoirs et des reposoirs des oiseaux à cause des défrichements
• Reboisement compensatoire autour des AHA à la charge des exploitants
Dégradation des sols (causes de baisse de rendements)
• Dégradation des propriétés chimiques des sols (salinisation, alcalinisation, épuisement des éléments minéraux, etc.). • Dégradation des propriétés physiques des sols (transformation des horizons superficiels du sol et réduction de leur perméabilité, d’où un mauvais développement des racines des plantes et une mauvaise aération)
• Mise au point et vulgarisation de paquets technologiques adaptés à l’agriculture irriguée • Gestion rationnelle de l’eau (cf, ci-dessus) • Suivi de la qualité des eaux et des sols
Conflits entre irriguants et éleveurs
• Occupation d’espace par les AHA, entraînant une réduction du disponible fourrager • Surcharge en bétail • Dégradation de l’infrastructure par piétinement
• Elaboration participative de schémas directeurs d’aménagement et de gestion des terroirs • Production de fourrage irrigué et valorisation des sous-produits par l’élevage

233
Dégradation des conditions sanitaires
• Pollution des eaux des canaux tertiaires et des drains, ainsi que des trous d’emprunt, utilisés pour les besoins domestiques • Création de niches pour espèces nuisibles • Accroissement de la population résidente autour des AHA associé au manque d’infrastructure et d’éducation sanitaire
• Mise en place de réseaux fonctionnels d’assainissements autour des AHA et mise en œuvre d’un programme d’hydraulique villageoise

235
IRRIGATION, PLANNING AND IMPLEMENTATION: NIGERIA CASE STUDIES
FADAMA IRRIGATION INVESTMENTS
Babatunde Omilola, Consultant

236
Abbreviations and Acronyms
ADD Agricultural Development Department ADB African Development Bank ADF African Development Fund ADF-UA African Development Fund-Bank Unit of Account ADP Agricultural Development Project ADPEC Agricultural Development Project Executive Committee APMEU Agricultural Projects Monitoring and Evaluation Unit BASIRDA Bauchi State Integrated Rural Development Authority CDD Community Driven Community DFRRI Directorate of Food, Roads and Rural Infrastructure DFID Department for International Development FACU Federal Agricultural Coordinating Unit EIA Environmental Impact Assessment ERR Economic Rate of Return ESIA Environmental and Social Impact Assessment FADPEC Federal Agricultural Development Project Executive Committee FAO Food and Agricultural Organization of the United Nations FCA Fadama Community Association FCT Federal Capital Territory FDA Federal Department of Agriculture FGN Federal Government of Nigeria FI Fadama Infrastructure Division FMANR Federal Ministry of Agriculture and Natural Resources (before May 1999) FMAWRRD Federal Ministry of Agriculture, Water Resources and Rural Development (later divided into
FMANR and FMWRRD) FMAP Financial Management Action Plan FMARD Federal Ministry of Agriculture and Rural Development (after May 1999) FME Federal Ministry of Environment FMF Federal Ministry of Finance FMR Financial Monitoring Report FMWRRD Federal Ministry of Water Resources and Rural Development (before May
1999) FMWR Federal Ministry of Water Resources (after May 1999) FUAs Fadama Users’ Associations FUG Fadama User Group GDP Gross Domestic Product GEF Global Environment Fund GNP Gross National Product ICR Implementation Completion Report IDA International Development Association (Word Bank Group) IFAD International Fund for Agricultural Development IGAs Income-Generating Activities JARDA Jigawa State Agricultural and Rural Development Agency KARDA Kebbi State Agricultural and Rural Development Authority KNARDA Kano State Agricultural and Rural Development Authority LDP Local Development Plan LFD Local Fadama Desk LFDC Local Fadama Development Committee LG Local Government
237
LGA Local Government Authority LGC Local Government Council LUPSM Land Use Planning and Seed Multiplication MANR State Ministry of Agriculture and Natural Resources MARD State Ministry of Agriculture and Rural Development M & E Monitoring and Evaluation MIS Management Information System MTR Mid-Term Review MTRM Monthly Technology Review Meeting NAPEP National Poverty Alleviation Program NATSP National Agricultural Technology Support Project NC National Coordinator NEEDS National Economic Empowerment and Development Strategy NFDO National Fadama Development Office NFDP National Fadama Development Project NFF National Fadama Facility NFFCC National Fadama Facility Coordinating Committee NFTC National Fadama Technical Committee NPC National Project Coordinator OFARD On-Farm Adaptive Research Division PCD Project Completion Document PCU Projects Coordinating Unit PDO Project Development Objective PDP Program Development and Planning PFMU Project Financial Management Unit PIM Project Implementation Manual PIU Project Implementation Unit PPF Project Preparation Facility PME Planning, Monitoring and Evaluation RBDAs River Basin Development Authorities RBRDAs River Basin and Rural Development Authorities RID Rural Institutions Development SA Special Account SAR Staff Appraisal Report SARDA Sokoto State Agricultural and Rural Development Authority SEEDS State Economic Empowerment and Development Strategies SFDO State Fadama Development Office SIAs State Implementing Agencies SPA Subproject Agreement SPC State Project Coordinator TOR Terms of Reference TSD Technical Services Division UA Bank Unit of Account UNDP United Nations Development Program UNICEF United Nations Children’s Fund WUA Water Users’ Association
238
INTRODUCTION AND BACKGROUND INFORMATION
Some Background Information on Nigeria
1.253 Nigeria is a very diverse country: demographically, geographically, ethnically,
economically, and socially. Nigeria’s estimated population of over 130 million makes it the most populous country in Africa and the tenth most populous country worldwide. It is estimated that the country’s population will reach close to 200 million by 2025 (World Bank, 2001). Nigeria’s population is largely rural, with 63.7 percent of the population living in rural areas.
1.254 Nigeria occupies about 923,768 square kilometers of land. While the Republics of Niger and
Chad define the territorial boundaries of Nigeria in the north, the territorial boundaries are defined by Republic of Cameroon on the east and Benin Republic in the west. Nigeria consists of 36 states and a Federal Capital Territory (FCT) called Abuja. The states and FCT are subdivided into Local Government Areas (LGAs) for administrative purposes. The states and FCT are also grouped into six recognized geo-political zones based on ethnic identity in most cases. These six geo-political zones are North-east, North-west, North-central, South-east, South-west and South-south. Nigeria, which became a nation-state in 1914 when the British colonial administration amalgamated the Northern and Southern protectorates and Lagos colony into one administrative unit, has gone through a chequered post-colonial history since attaining political independence from Britain in 1960. Since political independence, Nigeria has experienced more than twice as many years of military rule as civilian rule. In 1999, Nigeria embraced democratic pluralism after almost 30 years of military authoritarianism. Although the exact ethnic composition of Nigeria is highly contested, there are about 374 identifiable ethnic groups in Nigeria of which the Igbos in the Southeast, the Hausas in the Northeast and Northwest and the Yorubas in the Southwest are the three major ethnic groups. These three ethnic groups comprise roughly 17 percent, 28 percent and 20 percent of the Nigerian population respectively.
1.255 Despite its wealth of human and natural resources and having earned hundreds of billions of
dollars from oil since 1970, Nigeria presents characteristics of a conflict society due to competition among ethno-regional constituencies for control of huge rents that accrue to the state from the operations of the petroleum industry. These characteristics include a stagnant economy, decaying infrastructure, and some of the worst basic social indicators in the world. Nigeria is ranked among the 26 poorest countries in the world; two of every three Nigerians (about 70%) live below the extreme poverty line of US$1 a day, which is defined as having insufficient income to purchase a basic basket of goods and services (World Bank, 2001). The incidence of poverty in Nigeria rose rapidly from a mere 38 percent in 1985 to 70 percent at the present time. Poverty is more pronounced in northern zones of Nigeria than southern zones. Nigeria has consistently been ranked near the bottom of UNDP’s Human Development Index, coming 148 out of 174 countries in 2002. Nigeria’s low gross GNP per capita of $260 in 2000 is one of the lowest in the world. Nigeria’s GNP per capita is lower among people living in rural areas, limiting their access to adequate nutrition, quality health care, and other basic social services, especially among vulnerable groups (women and children) (World Bank, 1999; UNICEF, 2001). Nearly 15 percent of Nigerian children do not survive to their fifth birthday. Malnutrition contributes to more than 50 percent of deaths of children under five. Less than one-half of the population has access to safe water (40% in rural areas) and only 41 percent have access to adequate sanitation (32% in rural areas).

239
Overall, the adult literacy rate in Nigeria is 56 percent; however, the rate for males (67%) is much higher than for females (47%).
Figure 1: Map of Nigeria showing the location of Nigerian
States
AGRICULTURE SECTOR IN NIGERIA
1.256 Historically, agriculture was the mainstay of Nigeria’s economy and provided basic human
needs and raw materials for agro-industries (World Bank, 1998; Okumadewa, 1997). The Nigerian agricultural sector in periods immediately after political independence from Britain in 1960 performed commendably the roles of Nigeria’s major source of employment, income generation, foreign exchange to such an extent that the regional development witnessed in Nigeria during these periods were connected to the sector (Okuneye, 1995). In 1960/61, agriculture accounted for two-third of Nigeria’s GDP. However, with the introduction of oil boom in the 1970s, the agriculture sector was neglected by the successive

240
ruling military and civilian regimes in preference for the lucrative payoffs from oil profits. Agriculture suffered severely during the oil boom because of its decreased ability to retain labor due to the appreciation of the Nigerian currency (Naira), rises in non-farm income and focus of public expenditure in sectors other than agriculture. In no time, the proportion of agriculture in Nigeria’s GDP fell drastically from 45 percent to 27 percent between 1970 and 1982, while a drastic decline in the production of cash crops made exports in agriculture to be insignificant. Nigeria’s economy is now highly dependent on capital-intensive oil industry, which contributes around 95 percent of export earnings and about 75 percent of government revenue. Yet, agriculture currently accounts for one-third of Nigeria’s GDP, employs about 70 percent of the country’s labor force and contributes around 5 percent of its total exports. Roughly 70 percent of the rural population in Nigeria remains poor, and these rural people depend directly or indirectly on agriculture for their livelihoods. Most of the rural people who engage in agriculture are smallholders who cultivate land under rainfed conditions utilizing traditional methods.
Irrigation Sub-Sector in Nigeria 1.257 The coordinated approach for the development of Nigeria’s Water Resources Programme in
support of agriculture and food production started with the establishment of two River Basin Development Authorities (RBDAs) in the arid North of the country, namely, the Lake Chad Basin Development Authority and the Sokoto-Rima Basin Development Authority in 1973. Seven additional RBDAs were established in 1976. A total of 11 RBDAs scattered across the country were created for the integrated and comprehensive development of large-scale irrigation schemes in the country by the end of the 1970s. This number was increased to 18 by the Buhari-led military government in 1984. During the same year, the name of the RBDAs metamorphosed to River Basin and Rural Development Authorities (RBRDAs) with the central objective of developing large-scale irrigation schemes across the country.
1.258 About 160 dams were constructed via the RBDAs, with an estimated total reservoir capacity
of 11 billion cube meters to irrigate about 725,000 hectares of farmland. However, the RBDAs have performed woefully in developing and investing in agricultural water management, in that the large-scale irrigation schemes associated with them have failed to meet food production needs of Nigerians. The actual irrigated land under the RBDAs declined from 45,000 ha during 1990/91 to a meagre 26,000 ha during 1999/2000. Their capital costs were also extremely high in relation to returns with associated technical and management problems (Adams and Hughes, 1987; Carter, 1992). For instance, Adams (1991) argues that the record of formal, large-scale irrigation in Nigeria is extremely poor; with costs exceeding budget and production costs rarely being met. Among other reasons, the dismal record of large-scale irrigation in Nigeria has been attributed to concentration of land in the hands of a few relatively wealthy farmers (See, for instance, Binns and Mortimore, 1989). The large-scale irrigation schemes or large dams in Nigeria have also been criticized of possessing more negative downstream socio-economic and environmental impacts than positive impacts. The negative socio-economic and environmental impacts of large-scale irrigation or large dams, which are well documented, include forced displacement of large groups of people, decline of a downstream fishery due to flood control, negative health effects associated with water-borne diseases such as outbreak of malaria incidence, loss of natural habitat, water loss, salinity and waterlogging among others (See, for instance, Adams, 2000; Thomas, 1995; Thomas and Adams, 1999). Consequently, investment in agricultural water management in Nigeria via large-scale irrigation schemes
241
has fallen dramatically due to sharp decline in lending for large-scale irrigation by donor agencies.
1.259 Since late 1980s and early 1990s, Nigerian government has recognized that the dependence
on rainfed farming by its traditional smallholders, who constitute the backbone of its agricultural sector, would not be able to achieve food security and poverty reduction for its rapidly growing population. For instance, in January 1987, the Nigerian government issued a Statement of Agricultural Policy, which included the following key objectives: (a) self-sufficiency in basic food commodities; and (b) increased agricultural production for export and raw industrial materials for local use (FMANR, 1997). This has led to some investments in irrigation by harnessing surface and groundwater resources for the development of small-scale, farmer-managed irrigation in the fadamas78. Private small-scale irrigation in the fadamas has been identified as the key to intensification of agricultural water development in Nigeria.
1.260 Many reasons have been advanced for the necessity of supplementing rainfed agriculture
with small-scale, farmer-managed irrigation in Nigerian fadama lands. First, the areas of land irrigated by farmers, without help from Nigerian government and donor agencies, using traditional systems of agricultural water management far surpassed those developed by the Nigerian government and its donor agencies via large-scale irrigation schemes, and at much lower cost (Carter, 2003). For instance, 75 percent of about 90,000 ha of irrigated land in Nigeria is believed to be under private small-scale fadama irrigation while the remaining 25 percent is under public large-scale irrigation schemes. Second, the current population of Nigeria, which is over 130 million and the rapid population growth of Nigeria, has made FAO to consistently list Nigeria among countries that are technically unable to meet their food needs from rainfed agriculture at low level of inputs. Third, the devastating effect of desertification and drought in the last three decades on the dry sub humid and semi-arid agro-ecological zones of Nigeria have made Nigerian government to embark on investments in smallholder irrigation. Fourth, the rapidly growing demand for food, coupled with seasonal variations, unpredictability and unreliability that have characterized the pattern of rainfall in the dry sub humid and semi-arid agro-ecological zones of Nigeria have necessitated the supplementation of rainfed agriculture with small-scale irrigation. Rainfall averages over 2000 mm per annum in the southeast, 1000 mm in the centre reducing to as low as 500 mm in the northeastern part of Nigeria. While the pattern of rainfall distribution in northern Nigeria is unimodal, it is bimodal in southern Nigeria.
78 Fadama is a local word in Hausa language for irrigable land, which is popularly used in Nigeria to refer to the seasonally flooded or floodable floodplains along major savanna rivers and/or depressions on the adjacent low terraces.
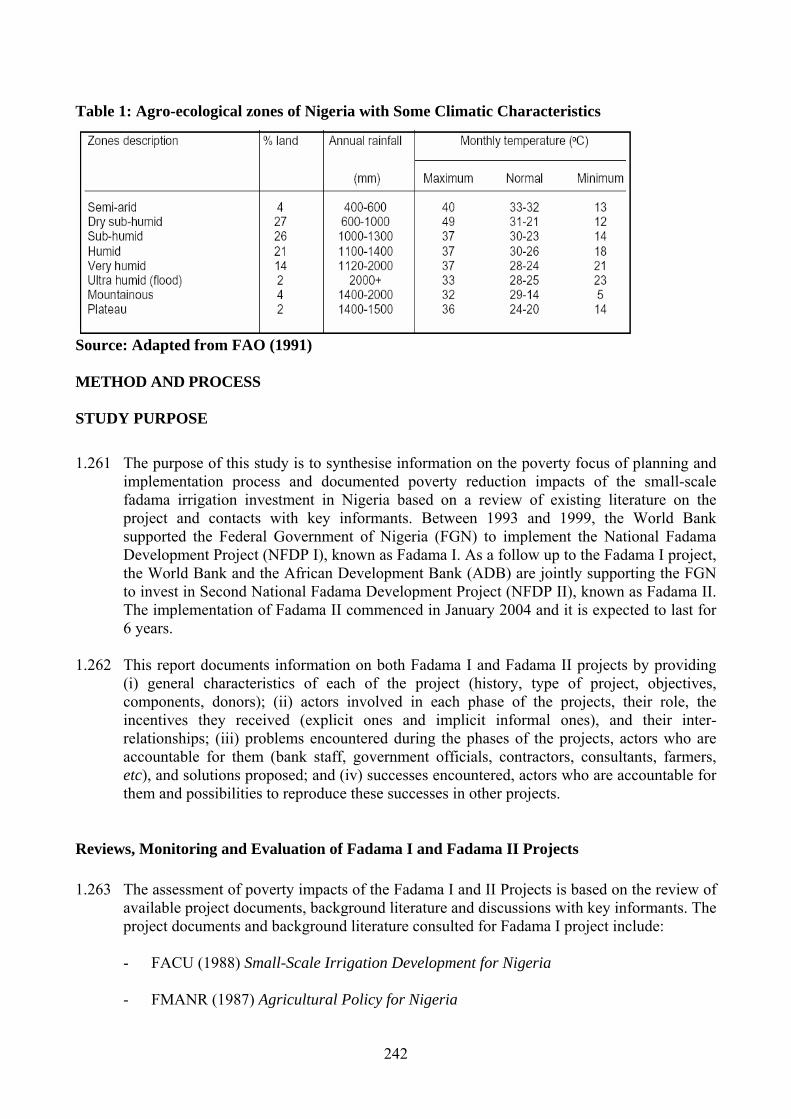
242
Table 1: Agro-ecological zones of Nigeria with Some Climatic Characteristics
Source: Adapted from FAO (1991) METHOD AND PROCESS STUDY PURPOSE 1.261 The purpose of this study is to synthesise information on the poverty focus of planning and
implementation process and documented poverty reduction impacts of the small-scale fadama irrigation investment in Nigeria based on a review of existing literature on the project and contacts with key informants. Between 1993 and 1999, the World Bank supported the Federal Government of Nigeria (FGN) to implement the National Fadama Development Project (NFDP I), known as Fadama I. As a follow up to the Fadama I project, the World Bank and the African Development Bank (ADB) are jointly supporting the FGN to invest in Second National Fadama Development Project (NFDP II), known as Fadama II. The implementation of Fadama II commenced in January 2004 and it is expected to last for 6 years.
1.262 This report documents information on both Fadama I and Fadama II projects by providing
(i) general characteristics of each of the project (history, type of project, objectives, components, donors); (ii) actors involved in each phase of the projects, their role, the incentives they received (explicit ones and implicit informal ones), and their inter-relationships; (iii) problems encountered during the phases of the projects, actors who are accountable for them (bank staff, government officials, contractors, consultants, farmers, etc), and solutions proposed; and (iv) successes encountered, actors who are accountable for them and possibilities to reproduce these successes in other projects.
Reviews, Monitoring and Evaluation of Fadama I and Fadama II Projects 1.263 The assessment of poverty impacts of the Fadama I and II Projects is based on the review of
available project documents, background literature and discussions with key informants. The project documents and background literature consulted for Fadama I project include:
- FACU (1988) Small-Scale Irrigation Development for Nigeria - FMANR (1987) Agricultural Policy for Nigeria
243
- World Bank (1991) Food Security and Nutrition Study for Nigeria
- FAO (1991) Project Completion Reports for Bauchi, Kano and Sokoto Agricultural Development Programs (ADPs)
- FACU (1991) Small-Scale Irrigation Component (Fadama Development) ADF I
- World Bank (1989) Strategy for Agricultural Growth in Nigeria
- FAO (1989) Thematic Supervision Mission of Fadama Component in ADPs
- KNARDA (1987) Watari Irrigation Project: Final Report on Updating of Feasibility
Study
- World Bank (1992) Staff Appraisal Report, Federal Republic of Nigeria National Fadama Development Project
1.264 The project documents and background literature consulted for Fadama II project include:
- World Bank (2000) Implementation Completion Report, Nigeria-National Fadama Development Project (Loan 3451-UNI)
- World Bank (2003a) Updated Project Information Document (PID), Nigeria-Second
National Fadama Development Project. Available: http://www-wds.worldbank.org/servlet/WDSContentServer/WDSP/IB/2003/07/22/000094946_0307100402515/Rendered/PDF/multi0page.pdf
- World Bank (2003b) Project Appraisal Document on a Proposed Credit in the
amount of SDR 72.95 Million (US$100.0 Equivalent) to the Federal Republic of Nigeria for the Second National Fadama Development Project
- African Development Fund (ADF) (2004) Appraisal Report, Federal Republic of
Nigeria-National Fadama Development Program
- Projects Coordinating Unit (PCU) of the Federal Ministry of Agriculture and Rural Development (FMARD) (2002) Environmental Impact and Social Assessment for Fadama II (Southern Belt)
- PCU-FMARD (2003) EIA Report- Environmental Impact and Social Assessment for
Fadama II
- Department of Agricultural Economics, University of Ibadan, Nigeria Consultancy Research Team (2002) Fadama II: Development of Performance Monitoring and Evaluation Indicators
- PSE Consultants Limited (2002) Irrigation Study on Alternative Water Management
Techniques
- BDO-OFO Consulting, Management Consultants (2002) National Fadama Development Project II-Institutional Strengthening Study

244
- Tahal Consulting Engineers Limited and Agrodev International Corp. (2002) Second Fadama Development Project-Social and Environmental Impact Assessment and Mitigation Plan (Middle Belt Region)
- ENPLAN Consultancy Group (2002) National Fadama Development Project II-
Social and Environmental Impact Assessment and Mitigation Plan (Northern EIA)
- Fetson Associates Limited (2002) Marketing and Agro-Processing Study
- PKF Pannell, Kerr Forster (Chartered Accountants and Management Consultants) (2002) Sustainable Financing Arrangements for Private Irrigation Development for National Fadama II Irrigation Project
- PCU-FMARD-National Fadama Development Office (NFDO) (2004a) Fadama II:
Poverty Reduction through Empowerment
- PCU-FMARD-NFDO (2004b): Half Yearly Report of Fadama II (January-June 2004)
- PCU-FMARD-NFDO (2004c): Half Yearly Report of African Development Bank-
Fadama II (January-June 2004)
1.265 Discussions were also had with some key informants on both Fadama I and II projects. All the key informants consulted were/are involved in both Fadama I and Fadama II projects. Knowledgeable and active actors in both projects were deliberately consulted so as to generate rich information from them. Generally, about 23 representatives of the FGN spreading across FMARD, Federal Ministry of Water Resources (FMWR) and Federal Ministry of Environment (FME) were consulted on subjects such as project costs and financing arrangements, administration, gender issues, adaptive research, rural institutional development, program development and planning, infrastructure engineering, procurement, irrigation and drainage, monitoring and evaluation79. As it was very difficult to pin down representatives of the donor agencies, only 2 representatives of the donors were consulted. About 8 representatives of the state governments responsible for Fadama project management unit in Jigawa state and the Federal Capital Territory (FCT) and 3 consultants were interviewed. Further, information was derived from extensive discussions with the current National Project Coordinator (NPC) of Fadama II (who was also a key member of the Program Development and Planning (PDP) of FACU, which implemented Fadama I project). Field visits to some of the Fadama I project sites and discussions with some Fadama I project beneficiaries from different wealth classes and gender also enrich the Report. In particular, I visited some fadama irrigation sites concentrated along the banks of the Burum Gana Channel in the Hadejia-Nguru Wetlands in Jigawa state, and in Gwagwalada/Kwali/Kuje Local Government Councils (LGCs) of the FCT, Abuja, to take a look at the Fadama project areas and to discuss with representatives of local governments, block/village extension supervisors/agents and Fadama I beneficiaries from different wealth classes and gender, in such a way to inform and contribute to the content of the Report
79 See Annex 1 for the list of key informants consulted.

245
SYNTHESIS OF INFORMATION ON PLANNING PROCESS OF THE FADAMA PHASE I PROJECT FUNDED BY THE WORLD BANK DESCRIPTION OF FADAMA IN NIGERIA 1.266 The seasonally waterlogged or flooded land-known as fadamas in Nigeria-comprise: (a)
enclosed or open depressions; (b) streamside fadamas, which are found adjacent to river channels in intermittent or continuous strips, or (c) floodplain fadamas, which are characterized by backswamps, levees, point bars, meander scrolls and oxbow lakes. In the northern Nigerian states, the fadamas are mainly low-lying flood plains composed of fluvial deposits and containing extensive exploitable aquifers. Fadamas vary in width from a few hundred meters to as 20km and encompass the land and water resources that could be developed for irrigated agriculture. Fadamuni is actually the plural of fadama, but it is more common in literature to see ‘fadamas’. In other parts of Africa, features similar to fadamas are called dambos (Zambia); vleis (Zimbabwe and South Africa); mbugas (East Africa) and bolis (Sierra Leone).
NEED FOR INVESTMENTS IN FADAMA IRRIGATION IN NIGERIA 1.267 Nigeria, which accounts for nearly one-fourth of sub-Saharan Africa’s poor, has been hugely
involved in small-scale fadama irrigation investments so as to boost the opportunities for poor people to gain and maintain secure access to productive assets (e.g., land, water and other natural resources) and social assets (e.g., extension services and education). In Nigerian fadama lands, the rationale for resource utilization hinges on the availability of valuable agricultural resources in zones where agricultural prospects are poor due to the low and erratic nature of rainfall, vagaries of weather and extended periods of drought. Evaporation and evapotranspiration are high in Nigerian fadama lands. Irrigation is highly essential for crop and food production in Nigerian fadama lands during the dry season, and even during wet season irrigation is useful to reduce crop risks. Fadama utilization, which has been a major feature of the agricultural, food, economic and demographic experience of the Nigerian dry belt (Kolawole et al., 1994), has largely benefited from dry season irrigation investments by northern Nigerian ADPs since the mid-1970s and early 1980s.
1.268 Food crop production in the fadamas has traditionally depended on rainfed agriculture
during wet season and on residual moisture after flood recession in the dry season. Until early 1980s, irrigation in Nigerian fadama lands was undeveloped and limited by available technology (the traditional water lifting devices, such as, the labor-intensive shadoof, calabash and bucket irrigation from channels, which are used to lift water onto the land). Water lifting by such devices can only irrigate land area limited to about 0.1 ha per shadoof. In the mid-1970s, the World Bank provided assistance of up to US$1.16 billion for the initiation of state-level ADPs in northern Nigeria as the country’s oil production and revenues were rapidly expanding and stimulating rapid urban growth. The ADPs were designed to increase smallholder income and food crop production with emphasis on extension, rural infrastructure and input supply. Only one percent of total lending of the World Bank for agriculture through the ADPs was specifically meant for small-scale irrigation in the fadamas.
1.269 Although there was no specific small-scale irrigation development in the fadamas through
the ADPs, the ADPs in Bauchi, Kano (now Kano and Jigawa since August 1991) and Sokoto (now Sokoto and Kebbi since August 1991) states contained features that supported

246
and promoted fadama development. These three states (now five states) were not only the first states to have the state-wide ADPs but have also performed better than all other Nigerian states in fadama development because at least 60 percent of the total irrigated land in the fadamas in Nigeria are located in these states. The ADPs in these northern Nigerian states started by attempting to promote village perimeters using large diesel pump sets. However, there was little demand. The ADPs adjusted by, first, promoting tubewells with small gasoline powered pumps, and, later, washboring (introduced from India), a low-cost technique suitable for shallow aquifers overlain by coarse materials. Although the ADPs were generally unsuccessful, the fadama components were remarkably adjudged to be successful (World Bank, 1995). It was then believed that if tapped fully, investments in the small-scale irrigation development in Nigerian fadama lands could accelerate rapid agricultural growth and poverty alleviation for small-scale farmers, and even feed the rapidly growing population of Nigeria. IFAD financed the first and only other externally funded small-scale irrigation project in the fadamas apart from the World Bank. The IFAD-financed small-scale fadama development is a small component for fadama development in the Community Development Project in Katsina State (US$12.2 million)
PLANNING PROCESS OF THE FADAMA PHASE I PROJECT FUNDED BY THE WORLD BANK
1.270 Fadama I project in Nigeria was initiated and prepared by FACU80 with assistance from
FAO and the World Bank, and with active participation of Kano, Sokoto and Bauchi state governments of Nigeria (FACU, 1988; FACU, 1991; FAO, 1991; World Bank, 1991). The initiation of the Fadama I project was primarily hinged on (i) the 1988 FACU Report, Small-Scale Irrigation Development for Nigeria, in which FACU identified the existence of almost 2 million ha of fadama farmland that could be developed for small-scale irrigation in Nigeria; (ii) the 1989 FAO Thematic Supervision Mission of Fadama Component in ADPs, in which FAO reiterated that the fadama development championed by the trio northern ADPs of Bauchi, Kano and Sokoto could be further easily exploited; and (iii) the 1989 World Bank Report, Nigeria-Strategy for Agricultural Growth, in which the World Bank identified private, farmer-managed, small-scale irrigation as a key strategy of accelerating agricultural growth in Nigeria. The 1991 World Bank Project Completion Reports for Bauchi, Kano and Sokoto ADPs further accentuated the idea of the project. This is because it was revealed at completion that the three ADPs actually developed almost 97,000 ha of small-scale fadama irrigation as compared to their joint appraisal target of about 67,000 ha.
1.271 In a nutshell, Fadama I project was a project conceived and identified based on missions and
reports of FACU and two donor agencies namely World Bank and FAO. Arising from these reports and missions, the FGN approached the World Bank with a request to provide financial assistance for further development of 100,000 ha of small-scale irrigation in the fadamas. FACU, on behalf of the FGN, drafted and submitted project proposals for fadama development under the Sokoto, Bauchi and Kano ADPs to the World Bank (FACU, 1990). The World Bank and the FGN had several consultations on this request and agreed on thematic, policy and operational framework or strategy through which the Bank could assist the FGN to invest in small-scale irrigation development program in the fadamas. The preparation of the project then commenced by the World Bank and the FGN in 1991. An
80 Alongside with Agricultural Projects Monitoring and Evaluation Unit (APMEU), FACU has now been renamed Projects Coordinating Unit (PCU) under the Federal Ministry of Agriculture and Rural Development (FMARD) since March 2000.
247
appraisal mission concerning the necessity of investing in Fadama I project visited Nigeria in March 199181.
1.272 Prior to the preparation of Fadama I, FACU, funded by both the World Bank and the FGN,
carried out detailed hydro-geological surveys and shallow aquifer surveys and feasibility studies in order to understand and define the shallow aquifers in the fadamas. FACU also conducted environmental impact assessments and surveys to determine the social and ecological impacts that the project could generate in the fadama communities and formulate measures to militate against risks associated with these. FACU prepared the Terms of Reference (TORs) for the pre-feasibility and feasibility studies of the planned Fadama I project, with extensive review and comments from other agencies of the FGN. These agencies included Health, Livestock, Forestry, Water Resources, Rural Development and Land Agencies/Departments as well as the ADPs. The mission and task members contained in the TORs cut across various disciplinary disciplines. For instance, the TOR for environmental survey/assessment included a Rangeland Management Specialist, a Social Anthropologist, a Public Health Specialist, a Freshwater Fisheries Specialist and a Wildlife Biologist. FACU then sent revised TORs to the World Bank for final review. These pre-feasibility and feasibility surveys were completed in Bauchi, Kano and Jigawa states in 1987; Kebbi, Sokoto and Plateau states in 1988; and Katsina state in 1990. Bauchi, Kano and Sokoto ADPs also specifically conducted their own pre-feasibility and feasibility studies to identify and understand the benefits that could be generated from further investments in small-scale irrigation in the fadamas amidst tight budget. For instance, while Sokoto ADP conducted a feasibility study of the Sokoto fadama shallow groundwater in 1988 using private consultants/contractors (Wardrop Engineering Inc., 1988); the Kano ADP completed a feasibility study of the Watari Irrigation Project in 1987 by force account (KNARDA, 1987).
Fadama I Project Description and Goals 1.273 The objectives of the NFDP I were to: (i) install 50,000 shallow tubewells by drilling and
washboring in Nigerian fadama lands for small-scale irrigation over a period of 4 years; (ii) simplify drilling technology for the shallow tubewells; (iii) construct fadama infrastructure for small-scale irrigation; (iv) organize fadama farmers for irrigation management, cost recovery and to have better access to credit, marketing and other services; (v) conduct aquifer studies, monitor and upgrade irrigation technologies; and (vi) complete a full environmental assessment of the environmental and social impact of future fadama development. The tubewells constructed were expected to create capacity for irrigating a maximum of about 100,000ha of fadama land from which at least 50,000ha would be irrigated during the project life.
1.274 The maximum irrigation potential under Fadama I project was estimated to be 100,000 ha.
However, since it was not very likely that this irrigation potential could be fully realized, an assumption of 50,000 ha of irrigation potential was used to derive the project benefits. The technologies adopted for fadama irrigation investment included water lifting from streams or rivers with the use of small or large gasoline-powered pumps (and later washbores)
81 Members of the appraisal mission included C.G. Ranade (Mission Leader); L. Campbell; R. Tillman; D. Ilebani (World Bank); A. Schumacher, M. Hossain and G. Schokman (consultants). Others included Q. Umar; M. Nasim and P. Yadav (FACU). J. Joyce and E. Lim acted as the managing Division Chief and the Department Director, respectively, for the mission.
248
depending on the size of the land to be irrigated. Through training, the direct beneficiaries of the fadama irrigation investments were expected to manage most of these technologies themselves. Furthermore, the fadama irrigation development project was designed to contribute to increased agro-pastoral and food chain supply productivity and competitiveness through improved technology. It was also aimed at boosting competitiveness of non-farm rural enterprises, and improving access to gainful employment through increased labor mobility. The project was, thus, created to provide off-farm income and rural employment and significantly improve the income earning capacity of poor farmers and contribute to poverty reduction in the rural areas.
1.275 The size of schemes fully irrigated and developed under Fadama I project was about 30,000
ha as against the target area of 50,000 ha. The accumulated size of fadama land cropped during the project life was 153,992 ha, with an average fadama farmer having cropping intensity of 2 ha per fadama season. The crops cultivated included wheat, rice and vegetables such as tomatoes, onions, garlic and peppers in the dry season. Some fadama farmers also cultivated vegetables such as green peas and spinach while some farmers also cultivated short-season crop such as cowpeas, maize, lettuce and other leafy vegetables from April to June, in between the wheat harvest and the planting of rice.
Fadama I Project Costs- Sources and Level of Funding 1.276 On March 26, 1992, the World Bank approved a loan of US$67.5 million for Nigeria to
implement Fadama I. The loan, which became effective on February 23, 1993, is payable over 20 years plus a 5-year grace period at the World Bank’s standard variable rate. Although the loan was supposed to close on September 30, 1996, it officially closed on March 31, 1999. This implied that rather than lasting for 4 years as estimated at appraisal, the project was implemented in 6.5 years. In essence, between 1993 and 1999, the FGN implemented the project by building on the achievements of some of the northern ADPs to develop small-scale, farmer-based irrigation through the extraction of shallow ground water with low-cost petrol-driven pumps in fadama lands. The direct northern Nigerian state beneficiaries of the US$67.5 million loan were Bauchi, Jigawa, Kano, Kebbi and Sokoto states. This is because these five northern Nigerian states have pioneered fadama irrigation development under the earlier World Bank-funded ADPs. Moreover, the five northern Nigerian states successfully satisfied the criteria for participation in the project. These criteria included (i) completion of shallow aquifer studies demonstrating potential for fadama development; and (ii) completion of the fadama components in on-going World Bank-funded ADPs. The agreement between the World Bank and the FGN was that the latter would on-lend, on the same terms as the World Bank loan, US$55 million to the beneficiary states, in that each beneficiary state would be eligible for at least US$3.5 million with additional amounts being taken from the balance of US$37.5 million on a first-come-first served basis. US$5.9 million was reserved for a National Fadama Facility (NFF), which would be on-lent to other Nigerian states, on similar terms as the World Bank loan. The Nigerian states that would benefit from the NFF were expected to meet some specific eligibility criteria, such as completion of a shallow aquifer survey and availability of qualified and experienced members of staff to carry out the project. US$6.6 million was earmarked for environmental assessment, monitoring and studies to be conducted by FACU.
1.277 It was estimated that US$91.6 million would be the project base costs for the 4-year
disbursement period of the project, with a foreign exchange amount of US$49.8 million. Apart from the costs associated with salaries, studies and technical assistance, all other costs

249
were estimated with a 10 percent physical contingency. Total project costs, including all contingencies, amounted to US$105.9 million. No less than 73 percent of the total project costs was earmarked for investment in irrigation at farm level for tubewells and irrigation pumps in the participating states. Fadama infrastructure; fadama institutional development; and fadama planning, monitoring and evaluation were expected to consume the remaining total project costs by 10 percent, 7 percent and 10 percent respectively.
1.278 The World Bank loan of US$67.5 million was expected to finance about 64 percent of total
project costs, by covering 100 percent of foreign exchange and 20 percent of local costs. The financing plan for the project entailed that the World Bank loan would only finance the capital costs of the project, while the beneficiary states of Nigeria and the FGN would finance the recurrent project costs completely. Only 4 percent of total project costs, i.e., US$4.5 million was required to be contributed by the beneficiary state governments to cover local salaries and other operating costs. 27 percent of the total project costs, i.e., US$29.2 million was required from the fadama beneficiaries as their contributions towards the project. The FGN was to contribute the remaining amount of US$4.7 million (4 percent of total project costs). The FGN’s contribution includes US$3.9 million on duties and taxes.
1.279 Tables 2 and 3 show the appraisal estimates and actual estimates of Fadama I Project Costs
and Project Financing. As shown from Table 2, the actual total project cost of was 2 percent less than the appraisal estimate. As shown from Table 3, the beneficiary Fadama I state governments of Nigeria financed the project with US$10.5 million, which was more than double the appraisal estimate of US$4.5 million; while the FGN had a shortfall of US$0.5 million from the target of US$4.7 million. Farmers, against the target of 28 percent estimated at appraisal, contributed 22 percent of total actual project costs.
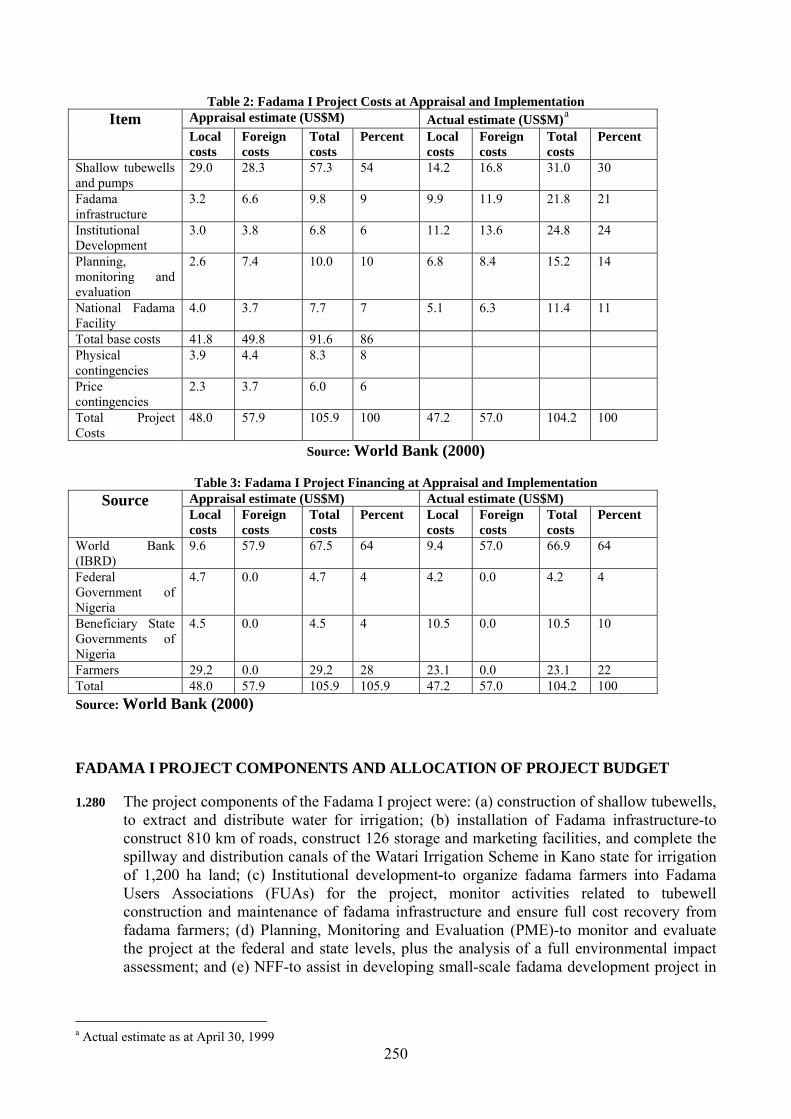
250
Table 2: Fadama I Project Costs at Appraisal and Implementation Appraisal estimate (US$M) Actual estimate (US$M)a Item Local costs
Foreign costs
Total costs
Percent Local costs
Foreign costs
Total costs
Percent
Shallow tubewells and pumps
29.0 28.3 57.3 54 14.2 16.8 31.0 30
Fadama infrastructure
3.2 6.6 9.8 9 9.9 11.9 21.8 21
Institutional Development
3.0 3.8 6.8 6 11.2 13.6 24.8 24
Planning, monitoring and evaluation
2.6 7.4 10.0 10 6.8 8.4 15.2 14
National Fadama Facility
4.0 3.7 7.7 7 5.1 6.3 11.4 11
Total base costs 41.8 49.8 91.6 86 Physical contingencies
3.9 4.4 8.3 8
Price contingencies
2.3 3.7 6.0 6
Total Project Costs
48.0 57.9 105.9 100 47.2 57.0 104.2 100
Source: World Bank (2000)
Table 3: Fadama I Project Financing at Appraisal and Implementation Appraisal estimate (US$M) Actual estimate (US$M) Source Local costs
Foreign costs
Total costs
Percent Local costs
Foreign costs
Total costs
Percent
World Bank (IBRD)
9.6 57.9 67.5 64 9.4 57.0 66.9 64
Federal Government of Nigeria
4.7 0.0 4.7 4 4.2 0.0 4.2 4
Beneficiary State Governments of Nigeria
4.5 0.0 4.5 4 10.5 0.0 10.5 10
Farmers 29.2 0.0 29.2 28 23.1 0.0 23.1 22 Total 48.0 57.9 105.9 105.9 47.2 57.0 104.2 100 Source: World Bank (2000)
FADAMA I PROJECT COMPONENTS AND ALLOCATION OF PROJECT BUDGET 1.280 The project components of the Fadama I project were: (a) construction of shallow tubewells,
to extract and distribute water for irrigation; (b) installation of Fadama infrastructure-to construct 810 km of roads, construct 126 storage and marketing facilities, and complete the spillway and distribution canals of the Watari Irrigation Scheme in Kano state for irrigation of 1,200 ha land; (c) Institutional development-to organize fadama farmers into Fadama Users Associations (FUAs) for the project, monitor activities related to tubewell construction and maintenance of fadama infrastructure and ensure full cost recovery from fadama farmers; (d) Planning, Monitoring and Evaluation (PME)-to monitor and evaluate the project at the federal and state levels, plus the analysis of a full environmental impact assessment; and (e) NFF-to assist in developing small-scale fadama development project in
a Actual estimate as at April 30, 1999
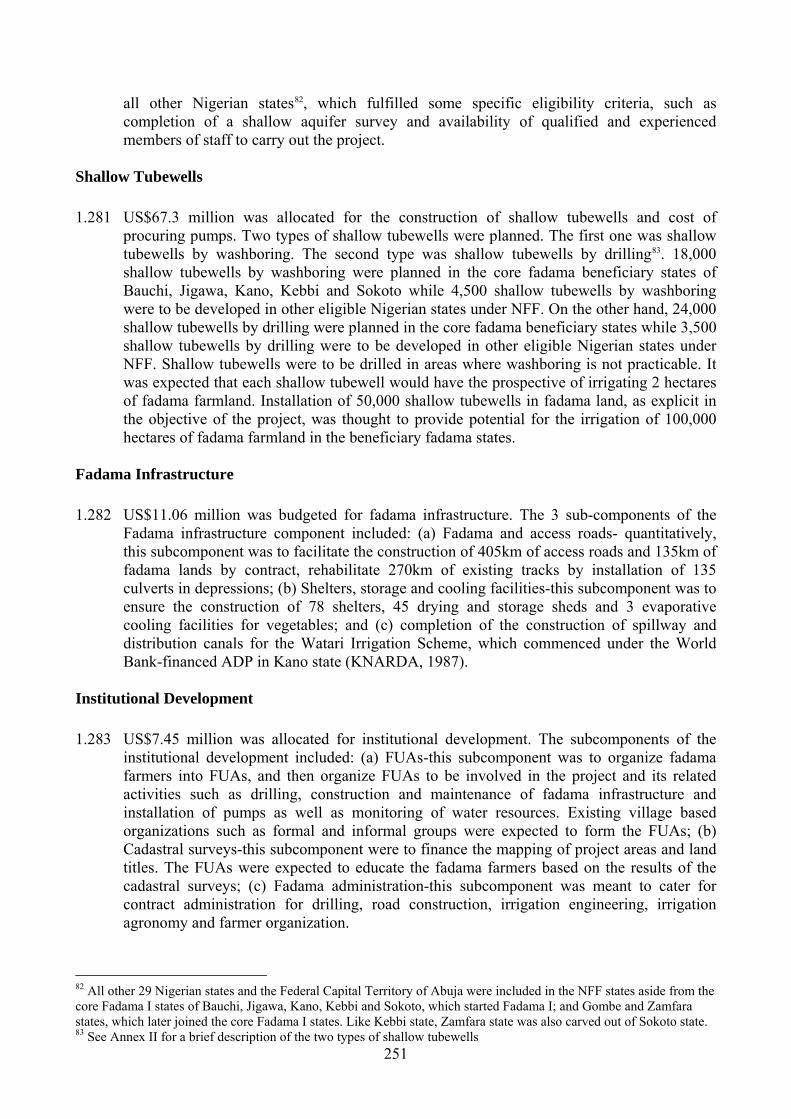
251
all other Nigerian states82, which fulfilled some specific eligibility criteria, such as completion of a shallow aquifer survey and availability of qualified and experienced members of staff to carry out the project.
Shallow Tubewells 1.281 US$67.3 million was allocated for the construction of shallow tubewells and cost of
procuring pumps. Two types of shallow tubewells were planned. The first one was shallow tubewells by washboring. The second type was shallow tubewells by drilling83. 18,000 shallow tubewells by washboring were planned in the core fadama beneficiary states of Bauchi, Jigawa, Kano, Kebbi and Sokoto while 4,500 shallow tubewells by washboring were to be developed in other eligible Nigerian states under NFF. On the other hand, 24,000 shallow tubewells by drilling were planned in the core fadama beneficiary states while 3,500 shallow tubewells by drilling were to be developed in other eligible Nigerian states under NFF. Shallow tubewells were to be drilled in areas where washboring is not practicable. It was expected that each shallow tubewell would have the prospective of irrigating 2 hectares of fadama farmland. Installation of 50,000 shallow tubewells in fadama land, as explicit in the objective of the project, was thought to provide potential for the irrigation of 100,000 hectares of fadama farmland in the beneficiary fadama states.
Fadama Infrastructure 1.282 US$11.06 million was budgeted for fadama infrastructure. The 3 sub-components of the
Fadama infrastructure component included: (a) Fadama and access roads- quantitatively, this subcomponent was to facilitate the construction of 405km of access roads and 135km of fadama lands by contract, rehabilitate 270km of existing tracks by installation of 135 culverts in depressions; (b) Shelters, storage and cooling facilities-this subcomponent was to ensure the construction of 78 shelters, 45 drying and storage sheds and 3 evaporative cooling facilities for vegetables; and (c) completion of the construction of spillway and distribution canals for the Watari Irrigation Scheme, which commenced under the World Bank-financed ADP in Kano state (KNARDA, 1987).
Institutional Development 1.283 US$7.45 million was allocated for institutional development. The subcomponents of the
institutional development included: (a) FUAs-this subcomponent was to organize fadama farmers into FUAs, and then organize FUAs to be involved in the project and its related activities such as drilling, construction and maintenance of fadama infrastructure and installation of pumps as well as monitoring of water resources. Existing village based organizations such as formal and informal groups were expected to form the FUAs; (b) Cadastral surveys-this subcomponent were to finance the mapping of project areas and land titles. The FUAs were expected to educate the fadama farmers based on the results of the cadastral surveys; (c) Fadama administration-this subcomponent was meant to cater for contract administration for drilling, road construction, irrigation engineering, irrigation agronomy and farmer organization.
82 All other 29 Nigerian states and the Federal Capital Territory of Abuja were included in the NFF states aside from the core Fadama I states of Bauchi, Jigawa, Kano, Kebbi and Sokoto, which started Fadama I; and Gombe and Zamfara states, which later joined the core Fadama I states. Like Kebbi state, Zamfara state was also carved out of Sokoto state. 83 See Annex II for a brief description of the two types of shallow tubewells

252
Project Planning, Monitoring and Evaluation (PME) 1.284 US$10.74 million was budgeted for planning, monitoring and evaluation of the project in
order to appraise its effectiveness at federal and state levels, conduct full environmental impact assessment of the project for future fadama development, conduct specific studies and baseline surveys on cropping intensities, yields and production, local manufacturing of pumps, etc, prepare yearly reports on fadama irrigation development, and monitor water and land resources of the fadama development arena among others.
National Fadama Facility (NFF) 1.285 US$9.38 million was budgeted for fadama development in other Nigerian states (aside from
the core fadama beneficiary states of Bauchi, Jigawa, Kano, Kebbi and Sokoto), which met the specific eligibility criteria for participating in the project, including completion of shallow aquifer studies; full-scale environmental assessment; and demarcation of areas for fadama development and establishment of the FUAs. The fund for the NFF was to be administered by the FMANR through a National Fadama Facility Coordinating Committee (NFFCC).
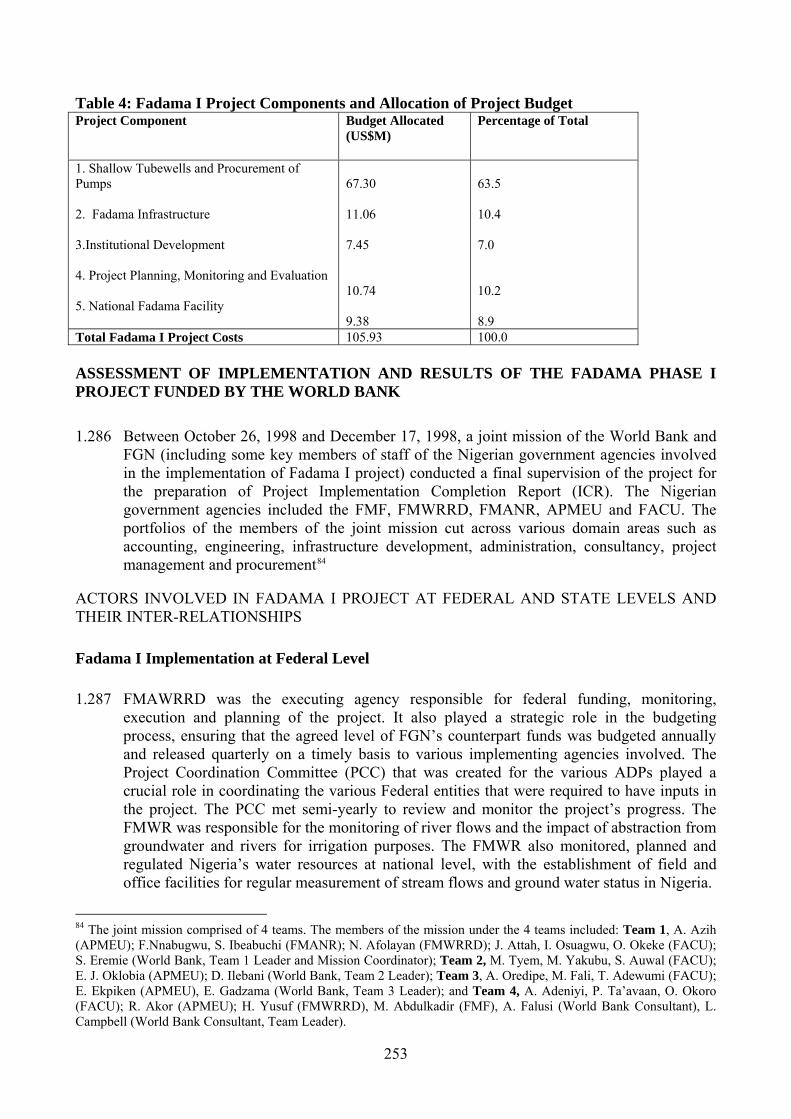
253
Table 4: Fadama I Project Components and Allocation of Project Budget
ASSESSMENT OF IMPLEMENTATION AND RESULTS OF THE FADAMA PHASE I PROJECT FUNDED BY THE WORLD BANK
1.286 Between October 26, 1998 and December 17, 1998, a joint mission of the World Bank and
FGN (including some key members of staff of the Nigerian government agencies involved in the implementation of Fadama I project) conducted a final supervision of the project for the preparation of Project Implementation Completion Report (ICR). The Nigerian government agencies included the FMF, FMWRRD, FMANR, APMEU and FACU. The portfolios of the members of the joint mission cut across various domain areas such as accounting, engineering, infrastructure development, administration, consultancy, project management and procurement84
ACTORS INVOLVED IN FADAMA I PROJECT AT FEDERAL AND STATE LEVELS AND THEIR INTER-RELATIONSHIPS Fadama I Implementation at Federal Level 1.287 FMAWRRD was the executing agency responsible for federal funding, monitoring,
execution and planning of the project. It also played a strategic role in the budgeting process, ensuring that the agreed level of FGN’s counterpart funds was budgeted annually and released quarterly on a timely basis to various implementing agencies involved. The Project Coordination Committee (PCC) that was created for the various ADPs played a crucial role in coordinating the various Federal entities that were required to have inputs in the project. The PCC met semi-yearly to review and monitor the project’s progress. The FMWR was responsible for the monitoring of river flows and the impact of abstraction from groundwater and rivers for irrigation purposes. The FMWR also monitored, planned and regulated Nigeria’s water resources at national level, with the establishment of field and office facilities for regular measurement of stream flows and ground water status in Nigeria.
84 The joint mission comprised of 4 teams. The members of the mission under the 4 teams included: Team 1, A. Azih (APMEU); F.Nnabugwu, S. Ibeabuchi (FMANR); N. Afolayan (FMWRRD); J. Attah, I. Osuagwu, O. Okeke (FACU); S. Eremie (World Bank, Team 1 Leader and Mission Coordinator); Team 2, M. Tyem, M. Yakubu, S. Auwal (FACU); E. J. Oklobia (APMEU); D. Ilebani (World Bank, Team 2 Leader); Team 3, A. Oredipe, M. Fali, T. Adewumi (FACU); E. Ekpiken (APMEU), E. Gadzama (World Bank, Team 3 Leader); and Team 4, A. Adeniyi, P. Ta’avaan, O. Okoro (FACU); R. Akor (APMEU); H. Yusuf (FMWRRD), M. Abdulkadir (FMF), A. Falusi (World Bank Consultant), L. Campbell (World Bank Consultant, Team Leader).
Project Component Budget Allocated (US$M)
Percentage of Total
1. Shallow Tubewells and Procurement of Pumps 2. Fadama Infrastructure 3.Institutional Development 4. Project Planning, Monitoring and Evaluation 5. National Fadama Facility
67.30
11.06 7.45 10.74 9.38
63.5 10.4 7.0 10.2 8.9
Total Fadama I Project Costs 105.93 100.0
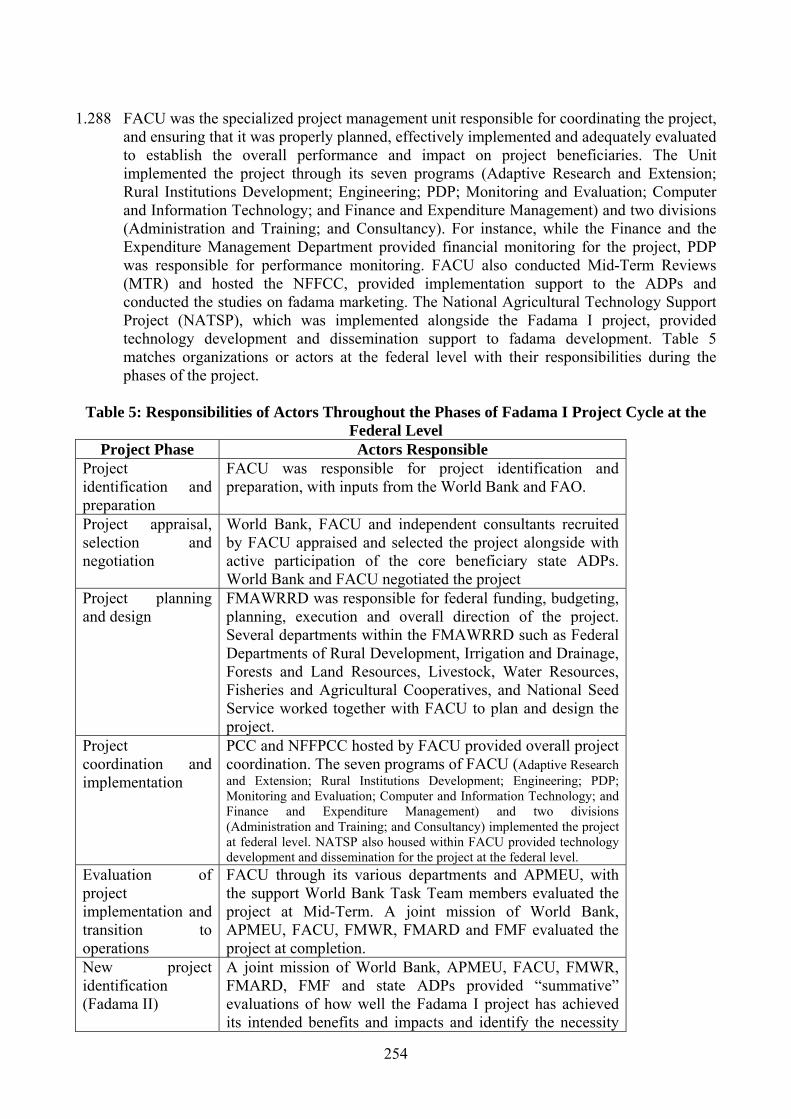
254
1.288 FACU was the specialized project management unit responsible for coordinating the project,
and ensuring that it was properly planned, effectively implemented and adequately evaluated to establish the overall performance and impact on project beneficiaries. The Unit implemented the project through its seven programs (Adaptive Research and Extension; Rural Institutions Development; Engineering; PDP; Monitoring and Evaluation; Computer and Information Technology; and Finance and Expenditure Management) and two divisions (Administration and Training; and Consultancy). For instance, while the Finance and the Expenditure Management Department provided financial monitoring for the project, PDP was responsible for performance monitoring. FACU also conducted Mid-Term Reviews (MTR) and hosted the NFFCC, provided implementation support to the ADPs and conducted the studies on fadama marketing. The National Agricultural Technology Support Project (NATSP), which was implemented alongside the Fadama I project, provided technology development and dissemination support to fadama development. Table 5 matches organizations or actors at the federal level with their responsibilities during the phases of the project.
Table 5: Responsibilities of Actors Throughout the Phases of Fadama I Project Cycle at the
Federal Level Project Phase Actors Responsible
Project identification and preparation
FACU was responsible for project identification and preparation, with inputs from the World Bank and FAO.
Project appraisal, selection and negotiation
World Bank, FACU and independent consultants recruited by FACU appraised and selected the project alongside with active participation of the core beneficiary state ADPs. World Bank and FACU negotiated the project
Project planning and design
FMAWRRD was responsible for federal funding, budgeting, planning, execution and overall direction of the project. Several departments within the FMAWRRD such as Federal Departments of Rural Development, Irrigation and Drainage, Forests and Land Resources, Livestock, Water Resources, Fisheries and Agricultural Cooperatives, and National Seed Service worked together with FACU to plan and design the project.
Project coordination and implementation
PCC and NFFPCC hosted by FACU provided overall project coordination. The seven programs of FACU (Adaptive Research and Extension; Rural Institutions Development; Engineering; PDP; Monitoring and Evaluation; Computer and Information Technology; and Finance and Expenditure Management) and two divisions (Administration and Training; and Consultancy) implemented the project at federal level. NATSP also housed within FACU provided technology development and dissemination for the project at the federal level.
Evaluation of project implementation and transition to operations
FACU through its various departments and APMEU, with the support World Bank Task Team members evaluated the project at Mid-Term. A joint mission of World Bank, APMEU, FACU, FMWR, FMARD and FMF evaluated the project at completion.
New project identification (Fadama II)
A joint mission of World Bank, APMEU, FACU, FMWR, FMARD, FMF and state ADPs provided “summative” evaluations of how well the Fadama I project has achieved its intended benefits and impacts and identify the necessity
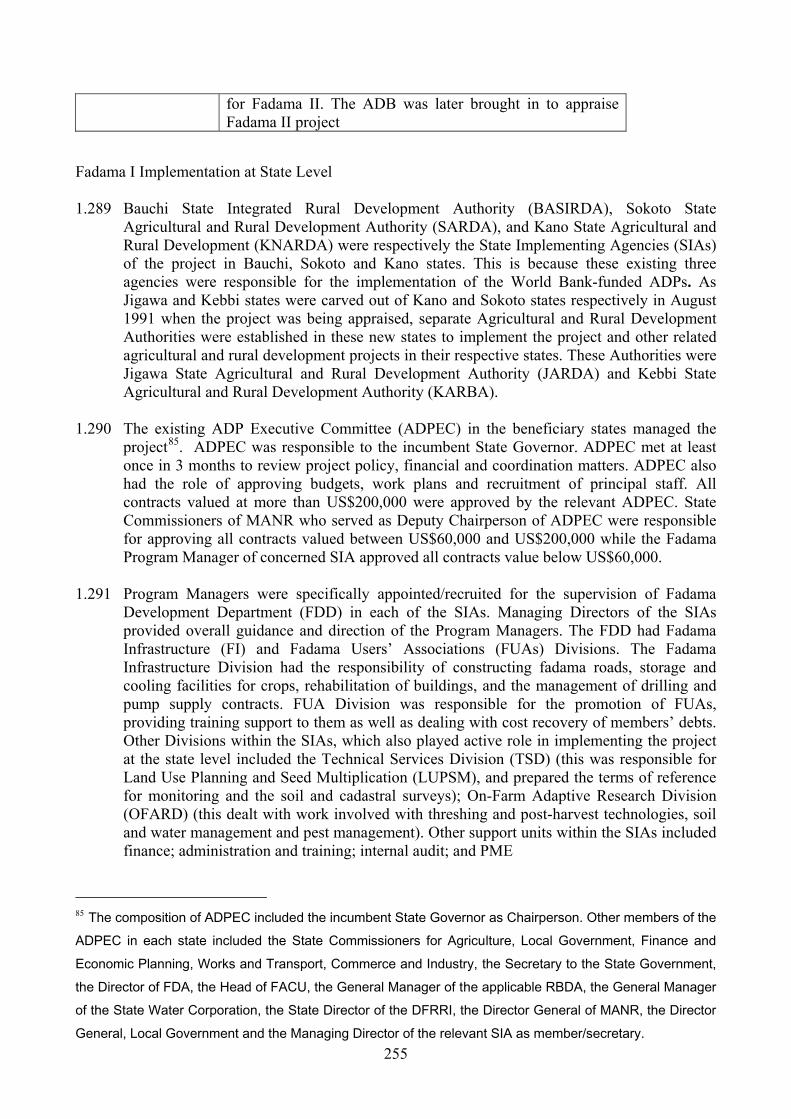
255
for Fadama II. The ADB was later brought in to appraise Fadama II project
Fadama I Implementation at State Level 1.289 Bauchi State Integrated Rural Development Authority (BASIRDA), Sokoto State
Agricultural and Rural Development Authority (SARDA), and Kano State Agricultural and Rural Development (KNARDA) were respectively the State Implementing Agencies (SIAs) of the project in Bauchi, Sokoto and Kano states. This is because these existing three agencies were responsible for the implementation of the World Bank-funded ADPs. As Jigawa and Kebbi states were carved out of Kano and Sokoto states respectively in August 1991 when the project was being appraised, separate Agricultural and Rural Development Authorities were established in these new states to implement the project and other related agricultural and rural development projects in their respective states. These Authorities were Jigawa State Agricultural and Rural Development Authority (JARDA) and Kebbi State Agricultural and Rural Development Authority (KARBA).
1.290 The existing ADP Executive Committee (ADPEC) in the beneficiary states managed the
project85. ADPEC was responsible to the incumbent State Governor. ADPEC met at least once in 3 months to review project policy, financial and coordination matters. ADPEC also had the role of approving budgets, work plans and recruitment of principal staff. All contracts valued at more than US$200,000 were approved by the relevant ADPEC. State Commissioners of MANR who served as Deputy Chairperson of ADPEC were responsible for approving all contracts valued between US$60,000 and US$200,000 while the Fadama Program Manager of concerned SIA approved all contracts value below US$60,000.
1.291 Program Managers were specifically appointed/recruited for the supervision of Fadama
Development Department (FDD) in each of the SIAs. Managing Directors of the SIAs provided overall guidance and direction of the Program Managers. The FDD had Fadama Infrastructure (FI) and Fadama Users’ Associations (FUAs) Divisions. The Fadama Infrastructure Division had the responsibility of constructing fadama roads, storage and cooling facilities for crops, rehabilitation of buildings, and the management of drilling and pump supply contracts. FUA Division was responsible for the promotion of FUAs, providing training support to them as well as dealing with cost recovery of members’ debts. Other Divisions within the SIAs, which also played active role in implementing the project at the state level included the Technical Services Division (TSD) (this was responsible for Land Use Planning and Seed Multiplication (LUPSM), and prepared the terms of reference for monitoring and the soil and cadastral surveys); On-Farm Adaptive Research Division (OFARD) (this dealt with work involved with threshing and post-harvest technologies, soil and water management and pest management). Other support units within the SIAs included finance; administration and training; internal audit; and PME
85 The composition of ADPEC included the incumbent State Governor as Chairperson. Other members of the ADPEC in each state included the State Commissioners for Agriculture, Local Government, Finance and Economic Planning, Works and Transport, Commerce and Industry, the Secretary to the State Government, the Director of FDA, the Head of FACU, the General Manager of the applicable RBDA, the General Manager of the State Water Corporation, the State Director of the DFRRI, the Director General of MANR, the Director General, Local Government and the Managing Director of the relevant SIA as member/secretary.
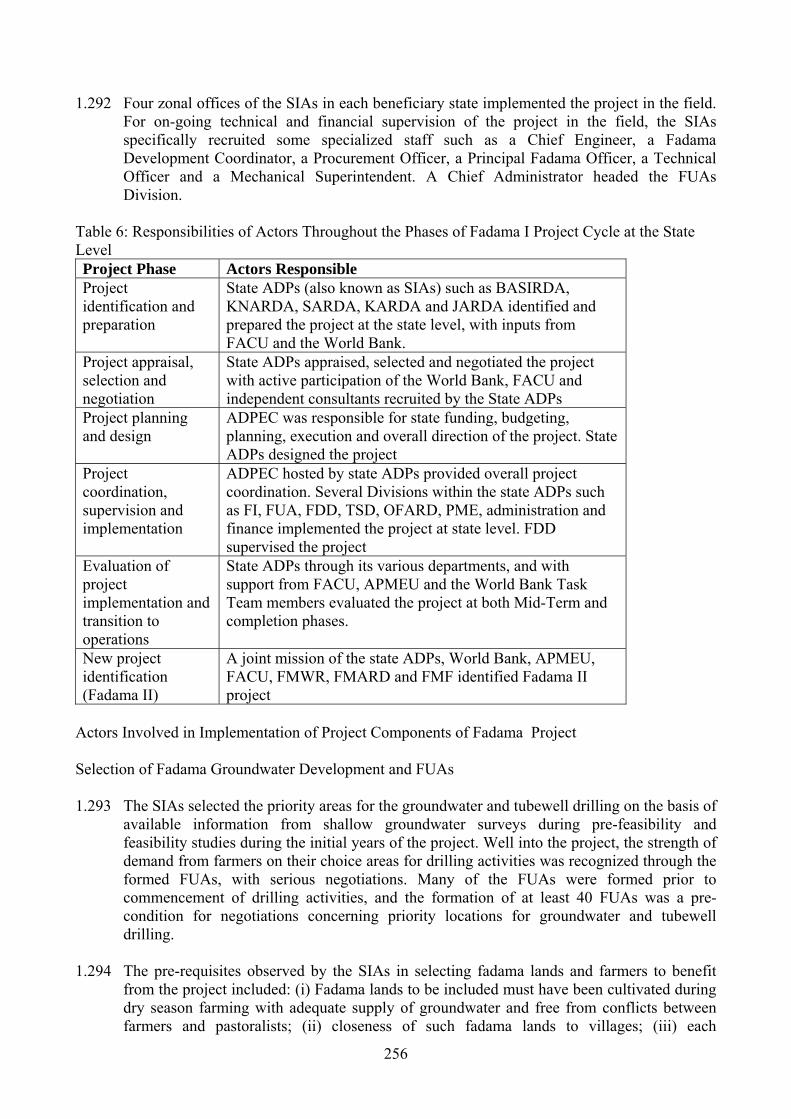
256
1.292 Four zonal offices of the SIAs in each beneficiary state implemented the project in the field. For on-going technical and financial supervision of the project in the field, the SIAs specifically recruited some specialized staff such as a Chief Engineer, a Fadama Development Coordinator, a Procurement Officer, a Principal Fadama Officer, a Technical Officer and a Mechanical Superintendent. A Chief Administrator headed the FUAs Division.
Table 6: Responsibilities of Actors Throughout the Phases of Fadama I Project Cycle at the State Level Project Phase Actors Responsible Project identification and preparation
State ADPs (also known as SIAs) such as BASIRDA, KNARDA, SARDA, KARDA and JARDA identified and prepared the project at the state level, with inputs from FACU and the World Bank.
Project appraisal, selection and negotiation
State ADPs appraised, selected and negotiated the project with active participation of the World Bank, FACU and independent consultants recruited by the State ADPs
Project planning and design
ADPEC was responsible for state funding, budgeting, planning, execution and overall direction of the project. State ADPs designed the project
Project coordination, supervision and implementation
ADPEC hosted by state ADPs provided overall project coordination. Several Divisions within the state ADPs such as FI, FUA, FDD, TSD, OFARD, PME, administration and finance implemented the project at state level. FDD supervised the project
Evaluation of project implementation and transition to operations
State ADPs through its various departments, and with support from FACU, APMEU and the World Bank Task Team members evaluated the project at both Mid-Term and completion phases.
New project identification (Fadama II)
A joint mission of the state ADPs, World Bank, APMEU, FACU, FMWR, FMARD and FMF identified Fadama II project
Actors Involved in Implementation of Project Components of Fadama Project Selection of Fadama Groundwater Development and FUAs 1.293 The SIAs selected the priority areas for the groundwater and tubewell drilling on the basis of
available information from shallow groundwater surveys during pre-feasibility and feasibility studies during the initial years of the project. Well into the project, the strength of demand from farmers on their choice areas for drilling activities was recognized through the formed FUAs, with serious negotiations. Many of the FUAs were formed prior to commencement of drilling activities, and the formation of at least 40 FUAs was a pre-condition for negotiations concerning priority locations for groundwater and tubewell drilling.
1.294 The pre-requisites observed by the SIAs in selecting fadama lands and farmers to benefit
from the project included: (i) Fadama lands to be included must have been cultivated during dry season farming with adequate supply of groundwater and free from conflicts between farmers and pastoralists; (ii) closeness of such fadama lands to villages; (iii) each
257
beneficiary fadama farmer was not allowed to own more than 2 tube wells, and they must be members of FUAs that were ready to pay the complete cost of shallow tubewells and pumps installed on their fadama farmland.
Drilling of Shallow Tubewell and Supply of Pumps 1.295 SIAs recruited private contractors for tube well drilling. The SIAs undertook the training of
potential private contractors. The SIAs was responsible for contracting the supply of pumps to private contractors. Hence, the private sector played a crucial role in wholesale and retail supply of irrigation pumps. Almost all the irrigation pumps were imported. In most cases, there were no adequate spare parts for the irrigation pumps. Some of the private dealers, however, stocked ample spare parts and second-hand or reconditioned irrigation pumps. Public sector agencies such as the Farmers Supply Companies dominated the marketing of irrigation pumps by obtaining the irrigation pumps from the private dealers such as the representatives of foreign pump manufacturers.
1.296 The SIAs, through their FI Division and Tenders Committees, were responsible for
preparing and issuing the tenders for the evaluation of contract bids to drill tubewells and supply irrigation pumps, and the selection of the qualified bidders. In particular, FI was responsible for awarding contracts of small-scale tubewell drilling and pump supplying of less than US$60, 000. The Contract Administration and Procurement Officer within the SIAs supervised most of the tubewell drilling and pump procurement contracts. Sometimes, the private consultants employed by the SIAs for the specific purpose supervised some of the tubewell drilling and pump procurement contracts in some participating states.
1.297 Two types of shallow tubewell construction took place under Fadama I. The first one was
shallow tubewell by drilling. The equipment for this type of drilling involved high capital cost and hence the drilling activity was contracted out to large contractors, some of which were local and others who were local branches of foreign companies. The SIAs provided training for the drilling staff. The second type of installation of shallow tubewell was by washboring. Washbore technology required low capital cost, which made it much more accessible to a much wider range of potential contractors. However, the application of washbore technology was only limited to fadama areas where aquifers are at depths of less than 7 meters and overlain mainly by coarse or moderately coarse textured materials. Again, the SIAs provided training for the recruited washbore contractors. The SIAs also assisted the farmers in providing them with quality control of using the washbore technology.
Fadama Infrastructure 1.298 The FI in the SIAs identified and surveyed fadama road alignments together with
preliminary engineering design, financial and economic analysis. Fadama roads and access roads were contracted out by the SIAs to interested local contractors and some foreign contractors. The Contract Administration and Procurement Officer in the respective SIAs was responsible for the preparation of tender documents for fadama and access roads. With the assistance of FACU, the SIAs prepared reports on annual road works program, and submitted such reports to the World Bank annually. The SIAs also recruited supervisors for the FI contracts. The LGCs carried out routine maintenance of fadama roads, shelters and cooling facilities within their jurisdiction. The SIAs, with the support of FACU, assisted the LGCs in achieving the latter.

258
Cost Recovery 1.299 The SIAs were responsible for recovering costs of irrigation development from beneficiary
farmers. This includes cost of shallow tubewell drilling/washboring. The cost recovery was designed in such a way that cash rebates were built in for farmers who paid either on the delivery of the irrigation pumps and completion of well drilling/washboring, or immediately after the first harvest of the dry season. Farmers who sought deferred payments were charged the full cost of financing applied by commercial banks for loans covering similar activities. Three-related approaches were used by SIAs to avoid beneficiary fadama farmers’ default in repayment of amounts due to the SIAs. These approaches included: (i) pledging of pumps; (ii) provision of mutual guarantees for repayment by minimum of 3 fadama farmers from the same fadama users’ association; (iii) barring of defaulting fadama farmers from receiving future assistance in irrigation development. The costs recovered from fadama farmers were deposited into a separate special account of the SIAs. The NFFCC Secretariat monitored the special account for cost recovery, with the statement of such accounts sent to the World Bank and the FDA through the NFFCC quarterly.
Institutional Development-Training and Fadama Users’ Associations (FUAs) 1.300 The FDD within the SIAs developed and implemented training programs under the project.
The FDD facilitated the training of farmers and small-scale contractors in the procedures and techniques of developing shallow tubewells by drilling and washboring, and in maintaining them. The Fadama Technical Officers located in the FDD also provided training to farmers concerning procedures to be followed in monitoring aquifer depths and in accounting and financial management procedures for the operation of fadama users’ associations’ credit management.
1.301 The FUA Division within the SIAs had the responsibility of promoting FUAs as village-
based organizations. FUAs were actually formed based on voluntary, free and independent association among interested farmers. Each FUA had approximately 25 farmers. The SIAs recruited some consultants as advisors to the FUA Division to help in formation of FUAs. The role of the FUAs in the project included ensuring of joint purchase of drilling/washboring services; mutual transport and marketing of inputs and outputs; collection of fees from participating farmers in order to guarantee loan repayment; operation and maintenance of fadama infrastructure such as roads, pumps and storage; and regulation of water use in fadama lands. The FUA Division of the SIAs submitted to FACU, the World Bank and APMEU every 6 months a report outlining their activities.
National Fadama Facility 1.302 The NFFCC was responsible for the administration of the project funds in fadama facility
states, i.e, managing and disbursement of the project funds. It also provided project oversight of the facility states. Members of the NFFCC consisted of the Director, FDA; Director, Federal Department of Livestock; Director, Federal Department of Irrigation and Drainage; Director of Agricultural Sciences in the National Agency responsible for agricultural research; Director of one of the agricultural research institutes (nominated by the National Agency responsible for agricultural research); two Managing Directors of the SIAs; Head of Unit of APMEU; one active small-medium scale farmer who had been awarded the best farmer in one of the core beneficiary states (nominated by FUAs); two private pump traders (nominated by Managing Directors of SIAs). The Director/Program Leader of PDP Department of FACU served as the member secretary of the NFFCC. The
259
Federal Minister of FMAWRRD appointed the Chairperson for the NFFCC. FACU hosted the secretariat of the NFFCC.
Project Monitoring and Evaluation 1.303 FACU coordinated the monitoring and evaluation of the various components of Fadama I,
particularly Mid-Term Reviews. It also coordinated the preparation of comprehensive progress reports by the participating implementing agencies, and the formation of FUAs. It monitored the movement towards transition to Fadama II. The World Bank officials at the World Bank Country Office in Nigeria supported FACU staff in PME, particularly Completion Reviews. The PME departments of the SIAs conducted the fadama baseline surveys, the cropped area and yield survey to measure cropping intensities and yields as well as adoption rate and impact studies. APMEU supported the PME departments, prepared periodic reports on fadama development and identified performance indicators, which were utilized by the joint missions of the World Bank and the FGN86.
1.304 FACU carried out an evaluation study of pastoral-farmer conflict in the fadama locations in
1998 but an important study of the characterization of the depletion of shallow aquifers and identification of the potential for recharge of the aquifers through controlled flooding from existing dams was not conducted by FACU despite the fact that it was commissioned to conduct this study at Mid-Term review. Other important evaluation studies conducted by FACU included the 1999 study on the possibility of local manufacturing of pumps as almost all the pumps used under Fadama I were imported; and the 1998 study on fadama marketing. The state beneficiary fadama also conducted various shallow aquifers between 1991 and 1998 to ascertain the further potential for fadama irrigation and delineate priority areas for drilling.
Failures of Fadama Phase I Project 1.305 The full realization of the objectives of Fadama I project was seriously held back due to a
number of shortcomings in project planning and implementation. The flaws associated with the project included the following:
1.306 Chief among such shortcomings was the lack of involvement/participation of intended
project beneficiaries and clients in project planning, preparation and implementation. For instance, farmers were not actually responsible for maintaining their own infrastructural facilities and they were not allowed to select appropriate components suitable for them both during project design and project implementation. The dominant view of ‘development’ via the project was that it is something to be done for people (and to them), and not something people do by themselves. This flaw, which strongly stems from general defect of the project institutional/organizational structure, prevented the project beneficiaries from being major players in the management and development of their own development agenda. There was also insufficient enlightenment and mobilization of farmers and intended project beneficiaries about the benefits of the project during project planning and even during project implementation. This flaw is recognized in the supervision and evaluation documents and acknowledged by all the actors involved in the project at all levels. It is obviously the one of the top priority defects to be corrected on the scales of reference of the
86 Apparently, the differences between responsibilities of FACU and APMEU were not obvious. This led to a high degree of lack of institutional coordination, institutional conflicts and unnecessary flexing of muscles among the officials of the two institutions. After the introduction of a new democratic government in Nigeria, the FGN did well in 1999 to merge FACU and APMEU together to become PCU under FMARD

260
donors, the FGN and the states because of the current tide in the development arena about encouraging project beneficiaries to take ownership of development projects for meaningful participation.
1.307 The Fadama I project did not target the poor farmers and there were no implicit and explicit
poverty reduction impacts of the investment in fadama irrigation project both by the funder-World Bank and the fadama implementing agencies in Nigeria at both federal and state levels. There were no targeting strategies to reach various categories of the poor under the project because the project strictly followed a top-down planning process, in that all decision-making on fadama investment proposals emanated from the implementing agencies. The project was also not tied to any national poverty reduction agency/strategy in Nigeria and there were no poverty impact studies carried out on its intended beneficiaries. The in-depth cause of this serious flaw is that it was not envisaged during and after project preparation and implementation. This flaw is not recognized in the supervision and evaluation documents. The donors, FGN and the state actors involved in the project have also not acknowledged it. It is, however, number one issue the potential fadama beneficiaries (fadama resource) user would like to be addressed because of their pathetic poverty status.
1.308 By focusing exclusively on crop production via the development and promotion of simple
and low-cost improved irrigation technology (petrol or gasoline engine pump), downstream additive activities of marketing and processing of farm produce were neglected. The absence of marketing and processing infrastructure implied that beneficiary fadama farmers were unable to make much gains from their farm produce, and to receive best prices available in the markets for their food items since they were forced to sell at farm gate prices without adding values to the produce. In most cases, many of the beneficiary fadama farmers depended on the middlemen who came to their largely inaccessible fadama arena to buy off their farm produce at very ridiculous prices. In some instances, some of the perishable farm produce of fadama farmers such as leafy vegetables, tomatoes and peppers did not even get beyond their farms, as poor post-harvest handling made them lose quality. In fact, post-harvest losses emanating from inadequate transportation and marketing infrastructure as well as omission of processing, storage and other downstream activities in must have claimed up to 60 percent of the project output. The in-depth causes of this problem included lack of its inclusion during project preparation and implementation. This flaw is recognized in the supervision and evaluation documents and acknowledged by all the actors involved in the project at all levels. It is also one of the top priority defects to be corrected on the priority lists of the donors, the FGN and the states. The direct potential and actual primary beneficiaries of the project are, however, of the opinion that the actors at all levels are only paying lip service to this problem, as this flaw is considered to be the bane of their impoverishment, which the latter has not successfully helped them to overcome in the past.
1.309 By focusing only on farmers, the project ignored other traditional fadama resource users in
Nigerian fadama lands. This shortcoming implied that the complexity and dynamism within the physical and institutional landscape of Nigerian fadama lands and the broader context within which micro-level actors such as farmers, pastoralists and fishermen interact with one another was neglected. The result of this shortcoming was that with the introduction of the dry season fadama irrigation project, many pastoralists felt they had been denied the access to dry season grazing resource. In fact, the competitive uses to which fadama land was put under the project became the source of potential and actual conflicts amongst the various rural land users in fadama lands. These include conflicts among settled farmers; between
261
farmers and pastoralists; and between farmers and fishermen. The project did not provide mechanisms of conflict prevention during the appraisal of the project. Even during the implementation of the project when it became obvious that conflicts among the various rural land users in fadama lands was threatening the successful implementation of the project, no mechanisms for conflict resolution was injected into the project. The more pronounced conflicts, which resulted in destruction of some constructed tubewells and stoppage of fadama farming activities for a while, were conflicts between pastoralists and fadama farmers. This flaw is recognized in the supervision and evaluation documents and acknowledged by all the actors involved in the project at all levels. It is another top priority on the agenda of the donors, the FGN, the states and fadama resource users.
1.310 The project ignored the contribution that women can make to the success of the project, as
there was no differentiation between women-controlled fadama wetlands and male-controlled fadama fields. It was basically assumed that only men engage in fadama irrigated farming in Nigeria because the project appraisal document did not make a single mention of including women in the project. This assumption must have been made because the core implementing states of the project were northern Nigerian states where many Hausa women are kept in ‘purdah’ due to religious and cultural beliefs, which comparatively prevent them from engaging in farming activities and gaining access to and control over productive resources. However, there are some women that still engage in fadama irrigated farming who should have been included in the project, particularly as the project expanded into central and southern Nigeria (where, arguably, more women engage in fadama farming than men) under NFF. In fact, only 7 percent of the total FUAs formed were all female FUAs, although some FUAs in the fadama facility states were mixed. Less than 2 percent of the FUAs established in northern Nigerian states of Kano and Kebbi were all female FUAs, and there were no mixed FUAs in these states. At the other extreme, 86 percent and 50 percent of the FUAs formed were all female FUAs in southern Nigerian states of Enugu and Imo respectively. The latter is despite the lack of recognition of women in the project planning, preparation and implementation. Because there was no planning of including women in, there was poor staffing and general defect the organizational structure of the SIAs by qualified women to interact with women farmers. Capturing differences between male-controlled fadama fields and female-controlled fadama fields would have yielded more meaningful project investments. This flaw is recognized in the supervision and evaluation documents and acknowledged by all the actors involved in the project at all donor and federal levels. It is, however, not considered a flaw at all by the actors and project beneficiaries at the state and local levels in the core Muslim-dominated northern Nigerian states. Many of the actual and potential project beneficiaries (mostly men) even have the opinion that it is fundamentally wrong for women to be allowed to cultivate farmland. This flaw is definitely on the bottom of the ladder rung in this part of Nigeria.
1.311 There were delays in award of contracts for the construction of shallow tubewells by some
of the implementing SIAs or ADPs. Some of the delays were occasioned by lack of proper accountability for construction contracts earlier awarded by such ADPs. And in some instances, some contractors who had been awarded the contracts of constructing shallow tubewells by either drilling or washboring abandoned work in preference for more lucrative or juicy contracts by other agencies and authorities. The implication of the latter was that some construction works of shallow tubewells were abandoned halfway, and this seriously affected the successful implementation of the project. Even after the award of well drilling and pump supply contracts, some contractors failed to implement the contracts while some performed very woefully in implementing such contracts. For instance, it was reported that in some northern Nigerian states like Sokoto, many contractors who abandoned their work
262
were originally penalized through the revocation of their contracts on the ground of non-performance. Surprisingly, these same contractors were again re-awarded the same contracts due to political interference. Such erring and defaulting contractors were really not brought to book due to socio-political interference, and as a matter of fact, it was established in some of numerous interviews conducted that many of the contractors hired for well drilling and pump procurement actually fronted for the same government officials who hired them. In other words, the SIAs senior officials only managed to award themselves many of the project-related contracts. Some contractors also delayed in procuring and distributing pumps to the intended beneficiary farmers. In some cases, the pumps procured were poorly matched with construction of shallow tubewells, which resulted in some beneficiary states possessing more tubewells or pumps. Hence, only about 30,000 hectares of fadama land was developed using the project infrastructure rather than the appraisal target fadama land area of 50,000 ha. Both improper project implementation and institutional decay were responsible for this flaw. The flaw is recognized in some supervision and evaluation documents. It is acknowledged by only very few of the actors involved in the project at federal and state levels. It is obviously not a top priority issue.
1.312 Many beneficiary fadama farmers refused to pay a deposit for the construction of shallow
tubewells until they saw pumps that they would use for either shallow tubewell by drilling or pumping from shallow aquifer by washboring. The latter was because of lack of trust and project ownership by the beneficiary fadama farmers. Dearth of fuel for beneficiary fadama farmers’ irrigation pumps also adversely affected the project, as the period of the implementation of the project (1993-1999) was one of the most turbulent political periods of Nigeria when artificial scarcity of fuel was at its highest in the country. Improper project planning, preparation and implementation accounted for this flaw. This flaw is not recognized in the supervision and evaluation documents. It is, however, acknowledged by all the actors involved in the project at all levels. It is not a priority issue to be tackled.
1.313 On the part of Nigerian government, some factors militated against the project, which FGN
could have avoided. These factors included (i) untimely release of allocation of project budget by the government. For instance, Federal funding was not released in 1997. Although the FGN made this up in 1998/99, the delay in release of the funds negatively affected implementation of the project in the earlier year. Some of the beneficiary fadama states were also erratic in releasing their counterpart funds timely; (ii) delays in the operation of the Centralized Special Account by FACU (iii) irregular meetings of the ADPEC and the FADPEC, which resulted in unnecessary delays in taking decisions concerning work programs and budgets; (iv) allowing states of Nigeria that did not fulfil some of the key eligibility criteria such as the conduct of the aquifer study, to participate in the National Fadama Facility (v) Poor pump procurement and well drilling planning and contract management by many of the state implementing agencies (SIAs) adversely affected the project. All these defects were witnessed at the implementation phase of the project cycle. Institutional/organizational flaws accounted for the defects. Many of the defects are recognized in the supervision and evaluation documents and acknowledged. They are, however, not top priority issues.
1.314 On the part of the World Bank that provided the bulk of funds for the project, a lot of lapses
by the Bank adversely affected the project. Such lapses included: (i) The Bank’s disagreement with the federal and state actors on specifications of pumps to be procured adversely delayed project implementation; (ii) The Bank slacked in providing adequate supervision concerning procurement operations of pumps by the implementing agencies. This shortcoming led to a number of flaws in the procurement operations such as lack of
263
transparency in the choice of contractors or firms assigned to procure pumps; lack of appropriate procurement planning, including contract packaging and procurement scheduling; splitting of procurement contracts by some implementing agencies for rent-seeking; weak record keeping and procurement filing system by many implementing agencies; unsatisfactory contract management by many implementing agencies; non-enforcement of contractual conditions for defaulting contractors; (iii) The issuance of procurement no-objections directly to individual NFF states by the Bank without the knowledge of the NFFCC Secretariat did not only undermined the NFFCC but also made it extremely difficult for the Secretariat to efficiently and effectively coordinate the project. The latter led to over-commitment on the loan proceeds for the project. All these defects were witnessed at the implementation phase of the project cycle. Institutional/organizational flaws accounted for the defects. Many of the defects are recognized in the supervision and evaluation documents and acknowledged. They are, however, not top priority issues.
1.315 Some World Bank officials in Nigeria connived with officials and actors of the project at
federal and state levels to defraud the Nigerian government of project funds through the procurement of obsolete and refurbished equipment at the value of brand new ones. For instance, it was widely reported in national daily newspapers and in international media that six World Bank officials connived with the key Fadama officials to cause financial loss to the FGN under Fadama I to the tune of 100 million naira (see, for instance, Pan African News Agency of August 7, 2000). The World Bank officials refused to appear before the Justice Saidu Kawo panel set up to investigate allegations of procurement irregularities under the project, citing diplomatic immunity. Nevertheless, the panel recommended that three of the World Bank officials directly involved with the fraudulent procurement be ordered to refund UK£522,577.75 and US$561,840 to the FGN, being 25 percent surcharge of the contract sum. It was also gathered that the fraudulent activities were carried out through undue favouritism by the concerned officials in awarding procurement contracts to some foreign companies, which bid for the projects. There was also recycling of apparently favored companies in all the project components. This defect was witnessed at the implementation phase of the project cycle. Institutional/organizational flaws accounted for the defect. The defect is not recognized in the supervision and evaluation documents. It is also not acknowledged by the actors except the primary project beneficiaries. It is on the bottom of priority ladder rung.
1.316 There was technical gap in the small-scale irrigation infrastructure pump design, in terms of
adoption and dissemination of adapted standard prototypes from the implementing agencies. Level of support for the irrigation pump technologies was grossly inadequate. Training of beneficiary fadama farmers in the repair of pumps, and the supply of spare parts to replace those worn through use, received inadequate attention by the implementing agencies. The implication of the latter was that although some beneficiary fadama farmers received irrigation pumps, but they could not use such irrigation pumps because they could not obtain spare parts or make repairs of the pumps. This defect was witnessed at both preparation and implementation phases of the project cycle. The defect is not recognized in the supervision and evaluation documents. It is also not acknowledged by the donor, federal and state actors except the primary project beneficiaries. While it is on the bottom of priority ladder rung of project implementers, it occupies a prime position on the priority list of the actual and potential primary project objectives.
1.317 No satisfactory arrangements were made by the SIAs to allow the FUAs to procure their
tubewells and pumps directly from suppliers. Most SIAs did not make satisfactory arrangements to transfer ownership of fadama infrastructure such as fadama access roads

264
and storage and cooling facilities to the LGCs and particularly to the FUAs. The latter led to serious complaints by the FUAs and individual beneficiary fadama farmers about the inappropriate size and location of the fadama facilities and infrastructure provided for them by the SIAs. Some farmers then purchased the pumps of their choice directly from dealers outside the project arrangements, while some farmers engaged private drillers to construct their tubewells outside the project intervention. This defect was witnessed at both preparation and implementation phases of the project cycle. The defect is not properly recognized in the supervision and evaluation documents. The project actors at donor, federal and state levels acknowledged it. While it is on the bottom of priority ladder rung of project implementers, it occupies a prime position on the priority list of the actual and potential primary project objectives.
1.318 Some of the Nigerian states that benefited in the project under the NFF such as Adamawa,
Taraba, Akwa Ibom, Cross River, Rivers and Enugu states did not conclude the conduct of aquifer studies to determine the priority areas for small-scale fadama irrigation development in their states. In many cases, this action led to the installation of tubewells on a trial and error basis, which resulted in a number of unsuccessful tubewells, as farmers could not achieve their desired pumping from surface water from such tubewells. For instance, half of the 18 tubewells drilled in Taraba state were abortive. Insufficient staffing and funding and weak linkages between the fadama unit and other units of the SIAs led to poor technology development to support fadama development in many of the non-core fadama states. This defect was witnessed at both preparation and implementation phases of the project cycle. The defect is recognized in the supervision and evaluation documents. The donor, federal and state actors, and the primary project beneficiaries also acknowledged it. While it is on the bottom of priority ladder rung of project implementers, it occupies a prime position of the priority list of the actual and potential primary project objectives.
1.319 With regards to procurement and distribution of pumps, 108 percent of the planned 50,000
pumps was procured; but unfortunately only about 61 percent of this target was distributed to beneficiary fadama farmers in the core fadama states at the close of the project. In the non-core fadama states, only about 16 percent of the 11,350 pumps procured was distributed to farmers at the end of the project. The reason proffered for this wide gap was that at the end of the project, some fadama farmers who were yet to pay their initial deposit or who had not constructed their tubewells were denied the already procured pumps. On probing further, it was gathered that some principal officials saddled with the responsibility of distributing the procured pumps were actually trapped in corruption. According to some of the project beneficiaries interviewed, in some cases these pumps were not even procured at all by the officials involved, as the fund meant for that purpose must have been diverted for personal use of such officials. Some project beneficiaries were also of the opinion that some of the principal officials actually procured pumps but these pumps were used in their own fadama lands instead of distributing them to farmers. Other factors responsible for non-distribution of procured pumps to farmers included unwarranted delays in procuring the pumps, not taking the preference of farmers for some brands of pumps into consideration, poor synchronization of well drilling and pump procurement and slow disbursement of funds from the Centralized Special Account for this purpose. This defect was witnessed at implementation phase of the project cycle. The defect is partly recognized in the supervision and evaluation documents. It is, however, not acknowledged by the donor, federal and state actors except the primary project beneficiaries. While it is on the bottom of priority ladder rung of project implementers, it occupies a prime position on the priority list of the actual and potential primary project objectives.

265
1.320 About two-third of the FUAs formed were formally registered to access credit. Members of the remaining one-third of the FUAs had tremendous difficulty in accessing credit facilities, which largely prevented them from participating in the project. Even many members of the FUAs who were formally registered complained of receiving meagre production credit from commercial banks notwithstanding the assistance of the SIAs, which prevented them from mobilizing enough savings for a more sustainable credit scheme. The performance of cost recovery from the FUAs was also poor during the initial years of the project, with some states such as Kano, Edo and Ekiti having only about 20 percent cost recovery, before total project cost recovery could reach an average of 71 percent during the latter years of the project. There was poor performance of formation and development of FUAs in some fadama facility states, which adversely affected the implementation of credit package to farmers. For instance, while 1,135 FUAs were formed in Plateau state, only 13 FUAs were formed in Edo state. On the whole, there was lack of capacity building of FUAs and individual beneficiary fadama farmers on group management, bookkeeping, banking/credit operations, savings mobilization and loan repayment. This defect was witnessed at implementation phase of the project cycle. The defect is duly recognized in the supervision and evaluation documents. The donor, federal and state actors as well as the primary project beneficiaries also acknowledged it. It is a top priority issue.
1.321 Many organizations and actors were involved in the project at state and federal levels, with
serious overlaps of roles and responsibilities. This led to a high degree of lack of institutional coordination. Institutional conflicts and unnecessary flexing of muscles among the officials of the actors at state and federal levels were the end products of such cumbersome institutional/organizational structure. For instance, the differences between responsibilities and roles of FACU and APMEU were not obvious. There were struggles and conflicts between these two institutions in terms of timeliness of monitoring and evaluation exercises, effective utilization of previous monitoring and evaluation reports, and adequacy of logistic requirements such as funds. After the introduction of a new democratic government in Nigeria, the FGN did well in 1999 to merge FACU and APMEU together to become PCU under FMARD. This flaw was witnessed at both the planning and implementation phases of the project cycle. The defect is not recognized in the supervision and evaluation documents. The donor, federal and state actors as well as the primary project beneficiaries also do not acknowledge it. It is not a top priority issue.
Successes of Fadama Phase I Project 1.322 The project achieved the objective of constructing 50,000 tubewells in the fadama lands, as
only the construction of 3 tubewells was the shortfall in achieving the maximum objective of constructing 50,000 tubewells in the fadama land. Nevertheless, many beneficiary fadama farmers opted for tubewell construction by washboring rather than shallow tubewell by drilling. Almost 67 percent of the tubewells constructed were washbores compared with a project appraisal estimate of 45 percent. The size of schemes fully irrigated and developed under the project was about 30,000 ha as against the target area of 50,000 ha. The accumulated size of fadama land cropped during the project life was 153,992 ha, with an average fadama farmer having cropping intensity of 2 ha per fadama season.
1.323 To a large extent, the goal of simplifying drilling technology for shallow tubewells was
realized. A number of trials on drilling techniques that resulted in cost saving were conducted by the SIAs. Examples of such trials included replacement of the 100 mm screen and pipe with a 75mm screen and 63mm pipe without adversely affecting the performance of the tubewells. In particular, the technical staff such as engineers of the FACU improved

266
on the jetting process for washbores. A number of FUA farmers were also trained by the ADPs on techniques of drilling technology and washboring, banking operations and production management. It was reported that about 51,906 FUA farmers were trained by the ADPs. Some of the trained FUA farmers went on to train other members, and construct washbores and tubewells for other farmers.
1.324 The project objective of constructing and rehabilitating roads, storage facilities and the
Watari Irrigation Scheme was significantly achieved. About 87 percent of the 810km target of fadama access road construction was achieved. A new spillway was constructed in place of the damaged one at the Watari Irrigation Scheme and about 678 ha out of a target of 1,200 ha was fully developed for irrigated agricultural production by 38 WUAs. A very high achievement in the formation of FUAs was recorded. About 9,239 FUAs were formed, 138 percent of the target of 6,693 set at appraisal of the project.
1.325 Monitoring and upgrading of fadama irrigation technology were substantially achieved. An
innovative and successful procedure responsible for this result was the utilization of NATSP, which provided adequate technology development and dissemination support to fadama development. In the core fadama states, adaptive research program resulted in improved technologies for water and soil management, and diversification to cultivating new crops. For instance, Irish potato, garlic, industrial sugarcane and fruit trees were introduced to minimize the seasonal tomato and onion market surplus experienced in some areas. Some Nigerian states such as Gombe, Kebbi and Bauchi recorded as huge as almost 90 percent of loan recovery from farmers.
Table 7: Indicators for Fadama I Project Implementation Indicators Appraised/Planned Completed/Implemented Core States 1.Shallow tubewells Washbore (number constructed) Tubewell (number drilled)
18,000 24,000
25,477 13,380
2. Pumps Number procured Number distributed
42,000 42,000
42,827 28,438
3. Fadama Infrastructure (a) Access road construction (Km) (b) FUA go-downs and storage sheds (number constructed) (c) Cooling facilities (number constructed) (d) Watari Irrigation Scheme
810 138 5 Construction of spillway and distribution canals to irrigate about 1,200 ha at ERR of 23 percent
716 130 4 Spillway and distribution canals constructed to irrigate about 678 ha at ERR of 21 percent
4.Institutional Development (a) Fadama administration (man months of experts)
324 in the core Fadama I states
540 because of division of two of the states
5. Planning, monitoring and evaluation (a) Conduct of environmental impact assessment by FACU

267
(number) (b) Technical assistance for FACU (man months) (c) Preparation of progress reports on fadama development by APMEU
3 120 1 per year
3 263 1 per year
Facility States 6.National Fadama Facility (a) Washbores (number constructed) (b) Tubewells (number constructed) ©Pumps procured (number) (d) Pumps distributed (number)
4,500 3,500 8,000 8,000
8,051 3,089 11,350 1,839
II. Modified Indicators 1. Shallow tubewells (a) Washbore (number constructed) (b) Tubewell (number drilled)
28,669 15,519
25,477 13,380
2. Pumps (a) Number procured (b) Number distributed
44,188 44,188
42,827 28,438
3.Fadama Infrastructure (a) Access road construction (Km.)
609
511
Source: World Bank (2000) 1.326 Although there were no explicit monitoring and evaluation studies on the impacts of the
project on poor people’s livelihoods, particularly its intended beneficiaries, some implicit studies by FACU showed that there was increased irrigation technology adoption and crop yield in the core fadama states. For instance, 62 percent and 65 percent improvement in tomato varieties and vegetable production were observed in Kano and Jigawa states respectively due to the project. 36 percent and 334 percent improvement in wheat production were also derived for Kano and Jigawa states respectively via the project. Within some fadama communities, it was adjudged to be responsible for reduction in seasonal rural-urban migration due to gainful employment for young people in the rural areas in the fadama farms during the dry season.
1.327 Although FACU and APMEU engaged in institutional conflicts; the organizational structure
of FACU in terms of planning, monitoring and implementation process of the project involved the provision of regular feedback on the progress of project implementation and the problems faced during implementation. FACU also consisted of operational and administrative activities that tracked resource acquisition and allocation, production or the delivery of services and cost records. FACU also performed creditably its role of coordinating the project, and providing implementation and supervision assistance during joint project supervision missions with the World Bank and other project actors through appropriate project specification and managerial performance. It is not surprising that the organizational structure of FACU has been retained in its fusion with APMEU to form PCU in 1999.

268
1.328 The economic rate of return (ERR) of the project at appraisal, which was 24 percent, was well below the re-estimated ERR of 40 percent. The appraisal ERR was derived on the basis of: (a) pump/tubewell and pump/washbore package cost of N10, 362 and N6, 837 respectively, at shadow exchange rate of US$1 = N12.5; (b) net incremental benefits with and without the project; (c) price of farm inputs minus subsidies or taxes; (d) labor inputs (using market wage rate of N20 per day in 1991 and other local costs converted to shadow values with shadow value factor being 0.85); and (e) incremental outputs of rice, wheat and vegetables valued at farm-gate prices. The ERR for vegetables/wheat was done on the basis of: (i) using washbore, 36 percent or more; and (ii) using tubewell, 62 percent or more for 0.5 ha or larger and 15 percent for 0.2 ha. The ERR for grains was derived on the basis of: (i) using washbore, minus for 0.2 ha, 14 percent for 0.5 ha and 43 percent for 1.0 ha; and (ii) using tubewell, minus for 0.5 ha or less and 20 percent for 1.0 ha. The re-estimated ERR over a 20-year project life (1993-2013) at a discount rate of 0.12 was 40 percent based on the same assumptions made at project appraisal but with the usage of 1994 prices and two cropping intensities during the project life. Table 6 shows the economic costs and benefits derived for the core fadama states and Watari Irrigation Scheme based on the re-estimated ERRs.
Table 8: Economic costs and benefits for Core Fadama states and Watari Irrigation Scheme in Kano State Project Unit Cost
(N million) Benefit (N million)
Net Benefit (N million)
Net Present Value (N million)
ERR (percent)
Bauchi 1,728.7 3,663.7 1,935.0 1,114.5 44 Gombe 813.9 1,685.9 872.0 157.0 40 Jigawa 1,845.5 5,326.7 3,481.2 727.5 40 Kano 2,701.7 4,776.0 2,074.3 511.2 44 Kebbi 1,682.9 4,824.2 3,141.3 662.6 43 Sokoto 607.2 1,319.5 712.3 147.4 31 Zamfara 272.3 534.9 262.6 26.8 18 Watari 430.3 1,979.4 1,549.1 237.4 21 All 10,082.5 24,110.3 14,027.8 3,307.6 40 Source: World Bank (2000)

269
Synthesis of Information on Planning Process and Implementation Arrangements for the Fadama Phase II Project Funded by the World Bank and the African Development Bank
A. Description and Goals of Fadama Phase II Project 1.329 The Fadama II project was conceptualized and designed as a successor to the Fadama I
project. The Fadama II project is designed to build on the successes of the Fadama I project while avoiding the pitfalls of the latter. The Fadama II project is designed with a focus on community-driven development with involvement and participation of the project beneficiaries, stakeholders or clients at every stage of the project cycle. As with the Fadama I project, the FGN requested the World Bank to provide financial support for Fadama II project during the implementation phase of the former. The FGN and the World Bank had several consultations on this request and agreed on thematic, policy and operational strategy through which the Bank could finance the project. The project was then prepared with the active collaboration of the FGN, state governments, staff of donor agencies such as the World Bank, ADB, DFID, USAID and other stakeholders in Nigeria. The project is being co-funded by the World Bank, ADB, the GEF, FGN, participating state governments of Nigeria, participating LGCs and various communities in Nigeria. While the World Bank is supporting the project in 12 Nigerian states, the ADB focuses on 6 Nigerian states. The target states of the World Bank support are Adamawa, Bauchi, Gombe, Imo, Kaduna, Kebbi, Lagos, Niger, Ogun, Oyo, Taraba states and the FCT. The target states of the ADB support are Borno, Jigawa, Katsina, Kogi, Kwara and Plateau states. The duration of Fadama II project is 6 years. The project started in January 2004 and it will be completed by June 2009 and closed by December 2009.
1.330 It is generally believed that Fadama II project ought to be a predominantly northern Nigerian
project, as generally witnessed under Fadama I project. This is because fadama itself is a Hausa word, which refers to irrigable land or low-lying planes with alluvial deposits. This perception has led to the outcry in some quarters of Nigeria that the states in southern Nigeria are only featuring prominently in the Fadama II project because of Nigerian politics and political considerations since the current President of Nigeria is from southern Nigeria. From field research, it is realized that this perception is wrong because many states in southern Nigeria are traditionally agrarian in nature with many irrigable farmlands that have been going on for decades. Nevertheless, an estimated 70 percent of the 2 million ha of total irrigation potential in Nigeria is in northern Nigeria while only about 20 percent of this potential is in the humid southern Nigeria with the remaining 10 percent in the highland areas of central Nigeria.
1.331 Both the World Bank and the ADB that are supporting the Fadama II project have similar
but somewhat divergent project development goals in their project appraisal documents. According to the Project Appraisal Document prepared by the World Bank:
The project development objective is to sustainably increase the incomes of Fadama Users-- those who depend directly or indirectly on fadama resources (farmers, pastoralists, fishers, hunters, gatherers, and service providers)-- through empowering communities to take charge of their own development agenda, and by reducing conflict between fadama users. Fadamas—the hausa name for irrigable land-- are flood plains and low-lying areas underlined by shallow aquifers and found along Nigeria’s river systems. The proposed project will take a demand-driven approach whereby all users of fadama
270
resources will be encouraged to develop participatory and socially-inclusive Local Development Plans (LDPs). The LDPs will provide the basis for support under the Project.
(World Bank 2003b)
1.332 On the other hand, the Project Appraisal Document prepared by the ADB has its project
development objective of enhancing agricultural production, productivity and value addition for smallholders and rural entrepreneurs in fadama areas on a sustainable basis while its sector goal is to reduce poverty by improving the living conditions of the rural poor and to contribute to food security and increased access to rural infrastructure.
1.333 The World Bank’s objectively verifiable indicators of the project by end of year 6 are three.
The first one is the raising of average real incomes of 50 percent of male and female fadama resource users who benefit from the project by 20 percent compared to the baseline. The second one is the successful implementation of the LDPs and other Project-supported activities by 60 percent of Fadama Community Associations (FCAs). The third one is the reduction of conflict among fadama resource users by 75 percent as compared to the baseline.
1.334 On the other hand, the ADB’s key performance indicators are six. First, incidence of poverty
in Nigeria is expected to reduce from 70 percent in 1996 to less than 35 percent by 2010. Second, area under improved technology and services is expected to increase by 5 percent for crops, 40 percent for livestock, 50 percent for fisheries and 40 percent for others by year 6, as compared to the baseline. Third, productivity of crop, livestock and aquaculture is expected to increase by at least 20 percent by year 3 and by 50 percent by year 6, as compared to the baseline. Fourth, collection, storage and preservation of marketable surpluses to be increased by at least 30 percent by year 3 and 80 percent by year 6, as compared to the baseline. Fifth, raising of processing of project output by 20 percent by year 3 and 40 percent by year 6. Sixth, increment in output value addition by 15 percent by year 3 and by 70 percent by year 6.
1.335 The main striking features of the Fadama II project by all the parties involved include (i)
stimulation of poverty reduction in the non-oil economy of Nigeria; (ii) adoption of a private sector-led, community-driven development (CDD) approach (i.e, a bottom-up approach), rather than public sector-dominated development strategy (i.e., a top-down approach) observed under Fadama I project, in the identification, preparation and prioritization of rural infrastructure and marketing infrastructure projects to be financed; (iii) empowering and building the capacity of communities and various fadama resource users, including crop farmers, pastoralists, fisherfolks and other stakeholders to manage, plan, implement, mobilize and select their own agricultural research and advisory services.
B. Fadama Phase II Project Components 1.336 The World Bank has five Fadama II Project Components namely, (i) Capacity Building; (ii)
Fadama Infrastructure; (iii) Pilot Asset Acquisition Support; (iv) Demand Responsive Advisory Services; (v) Project Management, Monitoring and Evaluation. On the other hand, the ADB has three Project Components namely, (i) Capacity Building and Advisory Services; (ii) Infrastructure Development; (iii) Project Management, Monitoring and Evaluation. The project components are very similar and they are being complemented by a
271
GEF funding program focusing on the conservation of the critical ecosystems and biodiversity within Fadama areas.
CAPACITY BUILDING 1.337 This component aims to assist fadama resource users to carry out planning, implementation,
operation and maintenance of their sub-projects on a participatory basis. Fadama Community Associations (FCAs) are expected to be created at the local levels, which would comprise of various constituent Economic Interest Groups (EIGs) or Fadama Resource User Groups (FUGs). Through the use of trained and contracted facilitators, FCAs and FUGs would be trained to acquire the skills and technical know-how to identify and prioritize community development needs, manage contracts, prepare proposals for investments and advisory services. The outputs of the participatory planning process of the FCAs are enshrined within the LDPs
FADAMA INFRASTRUCTURE DEVELOPMENT 1.338 Fadama Infrastructure Development component is designed to be demand-driven by
financing the construction and the rehabilitation of eligible projects and rural infrastructure such as small-scale irrigation, livestock water troughs, grazing reserves, agro-processing equipment, water pumping machines, feeder and access roads, community storage and marketing infrastructure, etc prioritized through the LDPs and prepared by the FCAs and the FUGs on a participatory basis.
Pilot Asset Acquisition Support
1.339 The Pilot Asset Acquisition Support component aims to provide support for income-
generating activities and livelihood-enhancing activities of FUGs by facilitating the acquisition of productive assets for community-based and led activities. This component also seeks to ameliorate the potential impact of market failures in the rural finance sector on the poor FUGs through matching grants. A matching grant of forty 40 percent would supplement the beneficiaries financing share of 60 percent of cost of the asset.
Demand Responsive Advisory Services
1.340 This component will finance advisory services that will support both on-going and new
investment activities of fadama users in response to demand of fadama users, training learning events and studies conducted to identify new market opportunities. Fadama resource users that benefited from the Pilot Asset Acquisition Support component of Fadama II are expected to receive technical and management training so as to equip them with the necessary skills to properly make the most of the acquired assets.
PROJECT MANAGEMENT, MONITORING AND EVALUATION 1.341 This component has three sub-components namely, (a) Project Management, which is
expected to support new or existing institutional framework and mechanisms at the federal, state and local levels of government to coordinate and manage the project; (b) Support to FMARD, which is conceptualized to support the enhancement of the current database and poverty policy formulation capacity of FMARD by financing the establishment and operation of a rural development data bank, and capacity building for policy and strategy formulation and implementation; and (c) Monitoring and Evaluation, which is expected to

272
assess performance of Fadama II implementation through management information systems, impact evaluations, beneficiary assessments and environmental assessments.
C. Project Costs- Sources and Level of Funding and Allocation of Project Budget 1.342 Between October 28 and November 2, 2003, Fadama II was negotiated at the World Bank.
On December 16, 2003, the Board of the Bank approved the project and a credit facility of US$100 million to implement it in 12 Nigerian states. The project was declared loan disbursement effective on May 27, 2004. The US$100 million credit attracts commitment fee of 0.5 percent and a service charge of 0.75 percent per annum. The credit is repayable over 40 years with 10 years grace period. On December 12, 2003, the ADB also approved a loan of ADF-UA 22 million (about US$30.82 million at August 2003 exchange rates) to implement Fadama II in 6 Nigerian states. The ADB loan became disbursement effective on May 3, 2004.
1.343 The total Fadama II project cost estimated by the World Bank for the 12 Nigerian states its
support covers is US$125.37 million, excluding taxes and duties but including physical and price contingencies. The estimated total Fadama II project cost by the ADB for the 6 Nigerian states its support covers is ADF-UA 25.12 million (US$35.19 million at August 2003 exchange rates). Table 7 shows the summary of total project costs by components by both the World Bank and ADB. Table 8 shows the financing plan for Fadama II. While the World Bank is financing 80 percent of the total project cost under its jurisdiction, the ADB proposes to finance 88 percent of the total project cost under its jurisdiction. With the addition of the expected GEF grant87 of about US$7 million meant for tackling environmental issues in all the 18 participating states, the total estimated project cost of Fadama II by all the institutions involved amounts to around US$168 million.
87 It is still not clear of how and when the GEF grant will be disbursed.

Table 9: Fadama II Project Costs by Components at Appraisal
Source: Compiled from World Bank (2003b) and ADF (2004)
88 Please note that I converted the estimated project costs/budget allocation of the African Development Bank support from Bank Unit of Account (UA) to US$ using the August 2003 exchange rate-the period when ADB appraised Fadama II. During this period, UA 1 = US$ 1.40086
Budget Allocated (US$M) Project Component
Local costs
Foreign costs
Total costs Percent
1. World Bank A. Capacity Building B. Rural Infrastructure Investment C. Pilot Productive Asset Acquisition Support D. Demand-responsive Advisory Services E. Project Management, Monitoring and Evaluation F. Project Preparation Facility Total Baseline Costs Physical Contingencies Price Contingencies Total Project Costs
13.29 27.22 7.47 7.82 8.95 - 64.75 0.44 3.82 69.01
1.75 28.35 18.17 1.47 4.66 1.30 55.70 0.30 0.36 56.36
15.04 55.57 25.64 9.29 13.62 1.30 120.45 0.74 4.18 125.37
12 44 21 7 11 1 96 1 3 100
2. African Development Bank88 A. Capacity Building & Advisory Services B. Infrastructure Development C. Project Management Total Baseline Costs Physical Contingencies Price Contingencies Total Project Costs
10.07 4.02 1.47 15.56 0.13 0.76 16.45
7.24 9.56 0.61 17.41 0.52 0.81 18.74
17.31 13.58 2.08 32.97 0.65 1.57 35.19
49 39 6 94 2 4 100

Table 10: Fadama II Project Financing at Appraisal
Source: Compiled from World Bank (2003b) and ADF (2004)
Budget Allocated (US$M) Source of Financing
Local Costs
Foreign Costs
Total Costs
Percent
1. World Bank A. World Bank (IDA) B. Federal Government of Nigeria (FGN) C. Beneficiary State Governments and Local Communities D. Financing Gap Total Project Costs
57.48
4.27
7.25
0.01
69.01
42.52 0.10 13.73 - 56.36
100.00 4.37 20.99 0.01 125.37
80 3 17 0 100
2. African Development Bank A. African Development Fund (ADF) B. Federal Government of Nigeria (FGN) C. State Governments D. Local Governments E. Communities Total Project Costs
12.24
0.42
2.88
0.60
0.30
16.44
18.58 0.16 0.01 - - 18.75
30.82 0.58 2.89 0.60 0.30 35.19
88 2 8 2 1 100

274
D. Fadama Phase II Implementation Arrangements-Planned Distribution of Roles and Responsibilities
1.344 The implementation arrangements of Fadama II by both the World Bank and
the ADB are the same. Put differently, there are not any striking differences in the implementation processes proposed by both donors. This is because during preparation and appraisal of the project, the teams of the donor agencies and other donors such as DFID and USAID with active involvement of the FGN, state governments and other critical stakeholders worked closely together to design the project on a participatory basis. The FGN also invited the Fadama II preparation teams of both the World Bank and the ADB to Nigeria between August and December 2002 where a multi-donor project design and preparation mission was launched in August 2002. Although both the World Bank and the ADB appraisal teams appraised the project independently bearing in mind the states of Nigeria they are both supporting, they visited Nigeria and conducted their appraisal of the project simultaneously around July and August 2003, thereby making contacts with one another and with the Federal, State and LGC officials in Nigeria.
1.345 The FGN, World Bank and the ADB intend to address some of the failures of
Fadama I project in the on-going Fadama II project by (i) empowering primary project beneficiaries’ participation through CDD; (ii) investing the bulk of the project funds in specific rural infrastructure investments such as the provision of downstream marketing and processing infrastructure; (iii) emphasizing the inclusion and participation of women in the new project; (iv) supporting the establishment of rural non-farm enterprises (e.g., by financing livestock-related activities, including public investments in demarcation of stock routes, grazing reserves and watering points and smallholder fisheries production, processing and marketing).; (v) embracing non-fadama irrigators such as pastoralists, fisher folks, hunters, gatherers, food processors, service providers and other fadama resource users in the project; (vi) improving mechanisms of conflict resolution and prevention among fadama resource users; and (vii) providing demand-responsive advisory services to fadama resource users; (viii) recruiting facilitators as social agents and catalysts of providing sufficient enlightenment campaign, education, sensitization and mobilization of fadama resource users to participate in, and benefit from, the project.

275
Fadama II Implementation at the Local Level- Actors to be Involved and their Inter-relationships
1.346 The guiding principle of Fadama II is that communities themselves will decide on the
identification, preparation and prioritization of projects to be supported and financed. It is expected that a Local Fadama Desk (LFD) and Local Fadama Development Committee (LFDC) will be created at the local level. The LFD is housed within the agricultural department of each participating LGC. The LFD receives LDPs from the FCAs, screens the LDPs to conform with standard criteria, forward the cleared and screened LDPs to the LFDC for appropriate action, and return the rejected LDPs to the FCAs with specific recommendations on how to improve it. The LFD also arranges meetings of the LFDC to review and approve LDPs, monitor community mobilization efforts and ensure that priorities and needs of FCAs are observed in the LDPs. A distinctive LDP includes (i) an agreed list of prioritized rural infrastructure sub-projects that are technically viable, economically feasible, environmentally sustainable, socially desirable and consistent with project development objectives and plans; (ii) a gender and poverty alleviation strategy (iii) a proposed plan to mitigate against conflict in Fadama areas; (iv) a proposed plan action for training and capacity building; and (v) a solid framework for financing and maintaining approved subprojects. The LFDC monitors community mobilization efforts at ensuring that FCAs are allowed to manage, plan, implement and mobilize resources for their own development according to their needs, priorities and realities89. The LFDC also reviews and approves LDPs and subprojects at the local level, communicates approved LDPs and subprojects to the State Fadama Development Office (SFDO) for funding.
1.347 EIGs or what is better known as FUGs are regarded as the primary beneficiaries of
Fadama II project. The FUGs select their desired investment subprojects. The membership of each FUG is expected to be between 20 and 30 households. The FUGs depend directly or indirectly on fadama resources. They include farmers, pastoralists, fishers, hunters, gatherers, and service providers. The FUGs that share similar interest within the same fadama locality are expected to organize themselves into a legal entity called FCAs, with women constituting one-third of the membership of such FCA. The membership of such FCAs will be constituted on democratic basis. The FCA selects FUGs that would benefit from the project. The FCA also provides appropriate training for its members and manages the association’s accounts. It is the responsibility of the FCA to identify, prepare, implement, operate, contract and maintain their LDPs and subprojects through the help of trained and contracted facilitators. The facilitators introduce, sensitize and mobilize FUG members to the objectives and guidelines of Fadama II. The facilitators also help with the formation of FCAs, preparation of LDPs and implementation of approved LDPs and subprojects.
1.348 For any LDPs or subprojects of FUGs to receive response and action, each participating
FUG must submit a proposal for carrying out such subprojects to an FCA. The FCA will evaluate and recommend such proposal to the LFDC. The LFDC will then approve/disapprove such subprojects. Immediately after LFDC might have approved any subprojects for the FUGs, the FCAs are expected to start accessing a share of costs for
89 Chairperson of respective LGC will chair the LFDC while a traditional or community leader designated by the FCAs will deputize. Civil servants and a diversity of stakeholders from civil society and the private sector are expected to be members of LFDC, who must not be more than 12.
276
design and implementation of such subprojects. Disbursements to the FCAs will only take place through LDPs and Subproject Agreements (SPA). It is also assumed that some unorganized communities might not be able to follow this procedure. In the case of the latter, the social mobilization program of Fadama II has engaged the services of accredited, trained and contracted facilitators to organize, facilitate and catalyze the process of approving subprojects for FUGs.

277
Fadama II Implementation at the State Level- Actors to be Involved and their Inter-relationships
1.349 The ADP is coordinating all the activities of Fadama II in each participating state on
behalf of the state Ministry of Agriculture and Rural Development (MARD). SFDO has already been established within ADP to manage the project in each participating state. State Project Coordinators (SPC) have also been recruited/selected for all the project beneficiary states on a democratic basis. Each SPC is directly responsible to the Program Manager of the ADP in the state. The SFDO is saddled with the responsibility of mobilizing, recruiting, training and managing facilitators and other stakeholders whose actions are germane to the success of the project. The SFDO prepares annual work plan, budget, accounting statements, financial audit (through independent auditors) and assesses the quality and sustainability of subprojects financed. Aside from monitoring and evaluating the overall performance of the project in their respective states, the SFDO also monitors and evaluates the financial, technical and physical subprojects implemented by FCAs, particularly at mid-term and completion reviews.
1.350 At the state level, an existing institution called ADPEC provides state level project
oversight90. ADPEC is responsible for selecting participating LGCs in the Fadama locales and assessing progress of project implementation at the state level. A sub-committee of the ADPEC called the State Fadama Development Committee (SFDC) is to be set up to oversee the project and coordinate SFDO, with the Permanent Secretary of the MARD serving as the chairperson of the committee. SFDC mainly meets every six months to approve budgets, work plans, auditor reports, project accounts, financial reports; review quarterly progress reports and conduct PME.
Fadama II Implementation at the Federal Level-Actors to be Involved and their Inter-relationships
1.351 The PCU, a specialized project management unit of the FMARD is the executing agency
of Fadama II. Within the PCU, the National Fadama Development Office (NFDO) has been created with utmost responsibility of coordinating Fadama II project, and ensuring that the project is properly planned, effectively implemented and adequately evaluated to establish the overall performance and impact on project beneficiaries. At the federal level, an existing institution called FADPEC will oversee and supervise the entire project91. FADPEC was responsible for selecting participating Fadama II states in Nigeria. FADPEC also monitors progress of project implementation such as quarterly progress, approves NFDO annual work plan, budget, annual physical and financial reports. A sub-committee of FADPEC called National Fadama Technical Committee (NFTC) is also expected to be established by the FMARD, with the Permanent Secretary of FMARD serving as its chairperson. The NFDO is the secretariat for the NFTC. The NFTC is expected to meet twice annually to streamline the coordination of the project within FMARD, provide appropriate feedback and recommendations to relevant technical
90 Each participating state Governor chairs ADPEC. Other members of ADPEC include members from state Ministries of Works, Economic Development, Finance and representatives of the private sector and women’s groups 91 The Minister of FMARD is the chairperson of FADPEC. Other members of FADPEC include all Directors of technical departments of FMARD and the PCU

278
departments quarterly and provide general oversight for all the components of the project. The NFTC was also responsible for recruiting and staffing of the NFDO during project appraisal. The FMF was responsible for signing the loan agreement between the donors and the FGN92.
E. Description of Selection Process of Various Beneficiary Groups under Fadama II Pre-requisites for Selecting Participating Fadama II States 1.352 The 18 beneficiary Fadama II states were selected based on a comprehensive list of
criteria and process. These criteria include (i) a written expression of interest and proposed action plan by states to participate in the project (ii) a written commitment by states to pay their regular counterpart funds monthly (iii) proof of existing active, viable and operational FCAs and other organized EIGs (iv) a written document proposing that upstream and downstream post-harvest activities will be carried out (v) confirmation of existing conflict management committees in the fadama areas (vi) achievement of complete appraisal of existing fadama infrastructure (vii) achievement of recovering up to 90 percent of loan under Fadama I for accessing the World Bank credit while at least 75 percent loan recovery rate under Fadama I was sufficient to benefit from the ADB support. (viii) at least one-third of the composition of ADPEC must be from the private sector and farmer organizations, with at least one woman (ix) satisfactoriness of proper utilization of Fadama I funds (x) proof of responsible and responsive project management group (xi) proper and solid linkages with LGCs must be established
Pre-requisites for Selecting Participating Fadama II LGCs 1.353 As mentioned above, the ADPEC is responsible for selecting participating LGCs. The
criteria and process through which to do this selection are very similar to those observed for participating states, and these include (i) a written expression of interest and proposed action plan to participate in the project (ii) a written commitment to pay their regular counterpart funds monthly if the state government wants them to do so (iii) proof of existing active, viable and operational EIGs with strong desire, commitment and eagerness to float an FCA (iv) achievement of complete appraisal of existing fadama infrastructure (v) at least two-thirds of LFDC must be made up of FCA representatives, civil society and private sector, with females constituting at least 20 percent of LFDC membership (vi) at least two highly trained and qualified field officers must be members of LFD.
Pre-requisites for Selecting Participating Fadama II FCAs and FUGs 1.354 To be eligible for participation under Fadama II, FCAs and FUGs must meet the
following criteria (i) FCAs must be composed of legally recognized/registered FUGs/EIGs. The FUGs/EIGs in turn must have been formed based on voluntary membership and must be enjoying formal recognition and backing of the LGCs and relevant beneficiary states; (ii) members of FCAs and FUGs/EIGs must come from the same LGCs and relevant beneficiary states; (iii) each participating FUG must submit a proposal on priority subprojects to an FCA for evaluation; (iv) recognition of FCAs and
92 See Annex 4 for the Organizational Chart of Fadama II Project Implementation Arrangement
279
FUGs/EIGs as a legally constituted civil association with a written constitution and executive committee for their association/group; (v) FCA must have an established Fadama Management Committee (FMC); (vi) the executives of FCAs and FUGs/EIGs must be democratically elected.; (vi) FCAs and FUGs/EIGs must have credible bank or savings accounts; (vii) eagerness and commitment to operate within a socially-inclusive fadama development process; (viii) a written commitment to follow and implement the guiding principles of Fadama II as enshrined in the PIM.
IX: Conclusions: Suggestions for Improving Planning and Implementation Process of
Fadama II with a Poverty Focus 1.355 It must be mentioned that the planning and implementation arrangements of Fadama II
are far more compelling to drive the project to success than what was observed under Fadama I. Based on the project goals, objectives, organizational and implementation arrangements proposed by the World Bank and the ADB as explained above, it is apparent that Fadama II project has a very good chance of succeeding. In fact, from my discussions with some of the key members of NFDO and SFDO in Jigawa and FCT, they are of the opinion that Fadama II project is the best thing to happen to Nigerian agricultural and rural development. This is backed with the confirmation that at the request of the FGN, the World Bank has agreed to finance Fadama III for a total IDA funding of $250 million after the expiration of Fadama II despite the fact that the latter project is in its early stage. Nevertheless, there are many areas where the procedures and organisational arrangements proposed to implement the project might limit or hinder the success of the project, as observed in recent happenings in the life of the project. These areas of concern are briefly itemised in the following paragraphs.
1.356 According to both the World Bank and the ADB, the sector goal of the Fadama II project
is to reduce poverty by improving the living conditions of the rural poor. Apart from the fact that the sector goal of ADB of cutting poverty in Nigeria through Fadama II from 70 percent in 1996 to 35 percent by 2010 is not only ambitious but highly unrealistic since the donor’s ADF support for Fadama II will benefit only a total of 720,000 people in 6 Nigerian States if successfully completed, the World Bank, ADB and the FGN are not properly streamlining the project with the existing and on-going national poverty reduction strategies in the country. For instance, it was observed and gathered that the project has no implicit and explicit relationships with National Economic Empowerment and Development Strategy (NEEDS), Nigeria’s current national poverty reduction strategy and the State Economic Empowerment and Development Strategies (SEEDS) at the state levels, as well as the existing National Poverty Alleviation Programme (NAPEP) in Nigeria at both planning and implementation arrangements. It then implies that without proper linkages and relationships among poverty-orientated projects, programs and strategies in Nigeria, the likelihood of duplication of activities and implementing similar project components is higher.
1.357 The whole idea of Fadama II project is centred on adoption of a participatory approach or
private sector-led, community-driven development approach (i.e, a bottom-up approach), rather than public sector-dominated development strategy (i.e., a top-down approach). What was observed on the ground is quite a stark contrast to this, particularly during the appraisal and planning stages of the project. Many potential primary beneficiaries of the

280
project claimed ignorance of knowledge about the new project or being involved in the development process of the project. It is important that this project is implemented in a way that the primary beneficiaries are involved in practice so as to feel they own the project to a significant extent. Inadequate dissemination of information (or providing it in an inaccessible style); lack of transparency over the pre-requisites for selecting project participants; failure to properly integrate the poorest and most marginalized groups of people into the project; and provision of inadequate time for proper participation by the poorest groups of people are some of the spotted weaknesses, which could jeopardise the implementation process of the project and thereby hampers its impact, if not nipped in the bud immediately.
1.358 Although the recruitment of the actors involved in the implementation of the project at
local, state and federal levels was very transparent, there are pockets of problems here and there on recruitment of staff based on favoritism. For instance, facilitators for Fadama II were first recruited at the national level before the state implementing agencies clamoured for the recruitment of these staff directly by themselves in their own communities. This was done in order to recruit facilitators with endowed knowledge of, and familiarity with, fadama localities where they would work. However, some grossly ineffective, inexperienced and unqualified facilitators have succeeded in being recruited as facilitators in some of the participating states and LGCs due to political interference. Although appropriate institutional and in-service training programs that properly equip people for the jobs they must do have been organized for these facilitators through social mobilization program of NFDO and SFDOs, such undue socio-political interference in recruiting project staff members must be prevented in order for the project to be successful.
1.359 Many of the potential primary beneficiaries of the project (FUGs) interviewed are not
aware of the Fadama II project, as most of them dwell in very rural communities. Although several facilitators have been appointed/recruited to provide extensive communication education and information dissemination campaign and the sensitization of these potential primary beneficiaries, these facilitators are being poorly remunerated in terms of transportation costs of visiting the local communities of fadama users. Only about US$40 to US$80 is being paid monthly to each of these facilitators to commute, move and transport within the rural communities of fadama users in order for them to introduce, sensitize and mobilize FUG members to the objectives and guidelines of Fadama II. This is grossly inadequate. From discussions with some of these recruited facilitators, they are of the opinion that they would only collect the money meant for transportation and refuse to visit the core rural locales where the chronic poor fadama users reside. The implication of the latter is that many of the potential primary beneficiaries of the project are not only very likely to be left out in receiving benefits of the project but also various categories of the chronic rural poor, which the project aims to reach might not be targeted.
1.360 The organizational setting of Fadama II project is quite simpler than what was observed
under Fadama I due to the formation and creation of specialized departments and offices to handle the former rather than relying on existing endless incompetent bodies that thrived on proliferation of roles and responsibilities as witnessed during the latter. Nevertheless, Fadama II organizational setting still contains too many actors that might limit the degree of institutional coordination and breed institutional conflicts. For instance, the roles of NFTC and NFDO at the federal level as well as the roles of SFDC

281
and SFDO at the state level overlap one another in such a manner that unnecessary institutional conflicts are very likely to occur among these respective bodies during the implementation process of the project. Overlapping organizational roles and responsibilities need to be carefully prevented for the project to have meaningful impact and success.
1.361 Many fadama resource users who have never deemed it necessary in the past to float or
form a group are now hurriedly putting together their own FUGs or EIGs in order to fulfil the guiding principles of the project, which would in turn enable them to access the benefits accrued from the project. The danger in this trend is that such FUGs and EIGs formed by these kinds of fadama resource users would not be far away from serious conflicts and project implementation bottlenecks in the future, as it was gathered that these kinds of FUGs/EIGs are only interested in accessing the loan/credit benefits of the project and then disappear just like the way they might have appeared. To avoid this implementation error, the project must consciously target existing viable and active EIGs in local communities relevant for the project support.
1.362 Although the planning and implementation arrangements of Fadama II by both the World
Bank and the ADB are the same, it seems as if there is no proper synchronization between the donors’ operational modalities of engaging the staff of the FGN and other Nigerian actors involved in the project at all levels to perceive the project as the same project being principally co-funded by two donors. It seems as if many of the project actors in Nigeria are treating the project as two separate projects of the World Bank and the ADB. This portends a great source of concern if the project is to be successful, as unnecessary rivalry and conflicts could be generated among officials attached to the different project components attributed to the donors.
1.363 Most of the consultancies for implementing the project seem to be awarded to
international consultants, some of whom are staff members of the donor agencies. There are many local consultants who can handle some of these consultancies quite well, as these consultancies gulp a substantial amount of money, which could be re-directed to other priority components of the project. The relationship between the staff members of the donors and the implementing agencies in Nigeria also need to be relationship of partners in progress rather than a “superior-inferior” relationship.

282
REFERENCES Adams, W. (1991) Large Scale Irrigation in Northern Nigeria: Performance and Ideology.
Performance and Ideology. Transactions of the Institute of British Geographers 16 (287-300)
Adams, W. (2000) Downstream Impacts of Dams. South Africa: World Commission on Dams Adams, W. and Hughes, F. (1987) The Hazards of Large Scale Irrigation in the Sahel and Sudan
Zones of Africa, In: Millington, A., Mutiso, S. and Binns, A. (eds.) African Resources, Volume 2: management. Geographical Papers No. 97, University of Reading, pp. 17-29.
African Development Fund (ADF) (2004) Appraisal Report, Federal Republic of Nigeria-
National Fadama Development Program. Tunis: ADB Binns, J. and Mortimore, M. (1989) Ecology, Time and Development in Kano State, Nigeria; pp.
359-380, in Swindell, K., Baba, J. and Mortimore, M. (eds.) Inequality and Development: Case Studies from the Third World. London: Macmillan
Carter, R. (1992) Small-scale Irrigation in Sub-Saharan Africa: A Balanced View. Proceedings
of the Conference on Priorities for Water Resources Allocation and Management, pp103-115, Overseas Development Administration.
Carter, R. (2003) Water and Poverty: Redressing the Balance. Inaugural Professorial Lecture,
Institute of Water and Environment, Cranfield University, UK, 28th March 2003 FACU (1988) Small-Scale Irrigation Development for Nigeria. Ibadan: FACU FACU (1990) Project Proposals for Fadama Development Under Bauchi, Kano and Sokoto
ADPs FACU (1991) Small-Scale Irrigation Component (Fadama Development) Under the ADPs
(Bauchi, Kano and Sokoto) FAO (1989) Thematic Supervision Mission of Fadama Component in ADPs. Rome: FAO FMANR (1987) Agricultural Policy for Nigeria. Abuja: FMANR KNARDA (1987) Watari Irrigation Project: Final Report on Updating of Feasibility Study.
Kano: KNARDA Okumadewa, F. (1997) Poverty and Income in Nigeria - Measurements and Strategies for
reform. Paper presented at the Vision 2010 Workshop, April 1997, Abuja. Okuneye, P. (1995) Nigerian Agriculture on the Run: Refuses to Move. University of
Agriculture, Abeokuta, Nigeria Inaugural Lecture Series No. 2 36p. Palmer-Jones, R. (1987) Irrigation and the Politics of Agricultural Development in Nigeria, In:
Watts, M. (ed.), State, Oil, and Agriculture in Nigeria. University of California Press, Berkeley.
283
PCU-FMARD (2002a) Environmental Impact and Social Assessment for Fadama II (Southern
Belt). Abuja: PCU PCU-FMARD (2002b) Fadama II: Development of Performance Monitoring and Evaluation
Indicators. Department of Agricultural Economics, University of Ibadan, Nigeria Consultancy Research Team Report
PCU-FMARD (2002c) Irrigation Study on Alternative Water Management Techniques PSE
Consultants Limited Report PCU-FMARD (2002d) National Fadama Development Project II-Institutional Strengthening
Study BDO-OFO Consulting, Management Consultants Report PCU-FMARD (2002e) Second Fadama Development Project-Social and Environmental Impact
Assessment and Mitigation Plan (Middle Belt Region) Tahal Consulting Engineers Limited and Agrodev International Corp. Report
PCU-FMARD (2002f) National Fadama Development Project II- Social and Environmental
Impact Assessment and Mitigation Plan (Northern EIA) ENPLAN Consultancy Group Report
PCU-FMARD (2002g) Marketing and Agro-Processing Study Fetson Associates Limited Report PCU-FMARD (2002h) Sustainable Financing Arrangements for Private Irrigation Development
for National Fadama II Irrigation Project PKF Pannell, Kerr Forster (Chartered Accountants and Management Consultants) Report
PCU-FMARD (2003) EIA Report- Environmental Impact and Social Assessment for Fadama II.
Abuja: PCU PCU-FMARD-NFDO (2004a) Fadama II: Poverty Reduction through Empowerment. Abuja:
NFDO PCU-FMARD-NFDO (2004b): Half Yearly Report of Fadama II (January-June 2004) Abuja:
NFDO PCU-FMARD-NFDO (2004c): Half Yearly Report of African Development Bank-Fadama II
(January-June 2004). Abuja: NFDO UNICEF/Nigeria (2001) Federal Government of Nigeria and UNICEF Master Plan of Operations
for a Country Programme of Cooperation for Nigerian Children and Women—2002-2007, Lagos: UNICEF
Wardrop Engineering Inc. (1988) Sokoto Fadama Shallow Groundwater Study. Sokoto: SARDA World Bank (1989) Strategy for Agricultural Growth in Nigeria. Report No. 7988-UNI.
Washington D.C.: The World Bank
284
World Bank (1991a) Food Security and Nutrition Study for Nigeria. Washington D.C.: The World Bank
World Bank (1991b) Project Completion Reports for Bauchi, Kano and Sokoto Agricultural
Development Programs (ADPs). Washington D.C.: The World Bank World Bank (1992) Staff Appraisal Report, Federal Republic of Nigeria National Fadama
Development Project Washington, D.C.: The World Bank World Bank (1998) Human Development Report. Washington D.C.: The World Bank World Bank (2000) Implementation Completion Report, Nigeria-National Fadama Development
Project (Loan 3451-UNI) Washington, D.C.: The World Bank World Bank (2003a) Updated Project Information Document (PID), Nigeria-Second National
Fadama Development Project. Available: http://www-wds.worldbank.org/servlet/WDSContentServer/WDSP/IB/2003/07/22/000094946_0307100402515/Rendered/PDF/multi0page.pdf
World Bank (2003b) Project Appraisal Document on a Proposed Credit in the amount of SDR
72.95 Million (US$100.0 Equivalent) to the Federal Republic of Nigeria for the Second National Fadama Development Project. Washington, D.C.: The World Bank

285
ANNEX 1: LIST OF KEY INFORMANTS/PERSONS CONSULTED CONCERNING BOTH FADAMA I AND FADAMA II PROJECTS
Representatives of the FGN
- Dr A. A. Oredipe (NPC, NFDP II. He also served as a National Coordinator (NC) of the PDP of the PCU-
FMARD, which was/is the executing agency of both NFDP I and NFDP II)
- Dr Salisu Ingawa (Director, PCU-FMARD)
- Dr Babandi (Regional Head, PCU-FMARD)
- Gidado Bello (Administration Department, PCU-FMARD-NFDO) - Dr Victoria Agu (Community Development and Gender Specialist, PCU-FMARD-NFDO)
- Dr George Imonike (Monitoring and Evaluation Specialist-ADB Component, PCU-FMARD-NFDO)
- F. K. Idefoh (Monitoring and Evaluation Specialist-World Bank Component, PCU-FMARD-NFDO)
- A.S. Balarabe (Special Assistant, Capacity Building, PCU-FMARD-NFDO)
- Alabi Samuel (Special Assistant, Rural Infrastructure, PCU-FMARD-NFDO)
- A.O. Suleiman (FMF, Abuja, Nigeria)
- Dr O. O. Oyebanji (Program Leader, Adaptive Research and Extension, PCU-FMARD)
- Ayo Adeniyi (Program Leader, PDP, PCU-FMARD)
- Chief Akanji (Rural Institutional Development Section, PCU-FMARD)
- Egbe Oklobia (Program Leader, Monitoring and Evaluation, PCU-FMARD)
- Godwin Ononiwu (Program Leader, Rural Institutional Development, PCU-FMARD)
- J. O. Adewumi (Project Accountant, World Bank Component, PCU-FMARD-NFDO)
- Mrs Ladi Auwal (Project Accountant, ADB Component, PCU-FMARD-NFDO)
- Mrs Nnonyelu (Deputy Director, Federal Department of Rural Development, FMARD)
- Engr. Okoro (Infrastructure Engineer, PCU-FMARD)
- J. D. Alhassan (Procurement Specialist, FMARD)
- Engr. A. K. Tijani (Engineering Design Officer, Irrigation and Drainage Department, FMWR)
- Engr. K. A Afolabi (Irrigation and Drainage Department, FMWR)
- Dr O. A. Ogunsola (Deputy Director, Federal Department of Agriculture and Land Resources, FMARD)
Representatives of the State Governments
- M. Uwazie (SPC, NFDP II in FCT; formerly Head of PME during NFDP I)
- Dr Obamiro (Program Manager, ADP in FCT)
- Mr Jegede (Senior Official, ADP in FCT)

286
- Mallam Isah (Zonal Manager, Western Zone, ADP in FCT)
- Mallam Baba (Block Extension Supervisor/Agent, Gwagwalada/Kwali LGCs of the ADP in FCT)
- Mohammed Hardi (Director of Fadama, JARDA)
- Kabiru Ali (Program Manager, JARDA)
- Yaro Yusuf (Zonal Manager, Hadejia, JARDA)
Representatives of the Donors
- Olagoke Oladapo (Agricultural Economist, ADB, Nigeria Country Office. He was formerly a key staff member of PDP of the PCU-FMARD that actively participated in the implementation of NFDP I. He currently serves as the main representative of the ADB in Nigeria for the implementation of NFDP II);
- Dr Foluso Okumadewa (World Bank Country Office, Abuja, Nigeria)
Consultants
- Professor Olayemi (Research Team Leader, Department of Agricultural Economics Consultancy Group, University of Ibadan, Nigeria)
- Professor Falusi (World Bank Consultant, former Director of FACU)
- Dr Yusuff (Research Team Member, Department of Agricultural Economics Consultancy Group,
University of Ibadan, Nigeria

287
Annex II: Description of Shallow Tubewells Constructed under Fadama I Project
Shallow Tubewell by Drilling 1.364 Rotary or percussion (bailer) rigs were used for this type of drilling so as to establish
wells to depths of 10 to 16 meters through relatively hard material PVC or galvanized steel casing 100mm with a slotted screen inserted into the drilling. A 50 mm pump intake tubing could then be inserted into the casing. A concrete could then generally be placed at the surface in order to secure the casing and drain spillage in order to minimize contamination.
SHALLOW TUBEWELL BY WASHBORING
1.365 For this type of technology, a soil auger or other hand tools was used to excavate more
resistant coarse materials on fadama land area, and water was pumped through a 50 to 75 mm rigid PVC pipe fitted with a nozzle inserted into the excavation to jet out deeper granular material. In less than 30 minutes, it was possible to achieve a depth of 7 or 8 meters. Hence, the jetting pipe could then be withdrawn while a well casing with screen could be inserted in its place to the full depth of excavation. The well casing consisted of rigid 50 to 75 mm diameter PVC pipe, in which the bottom 1.5 m contained 0.5 mm slots and a plug inserted at the end. The pump intake could then be coupled directly to the casing.
.
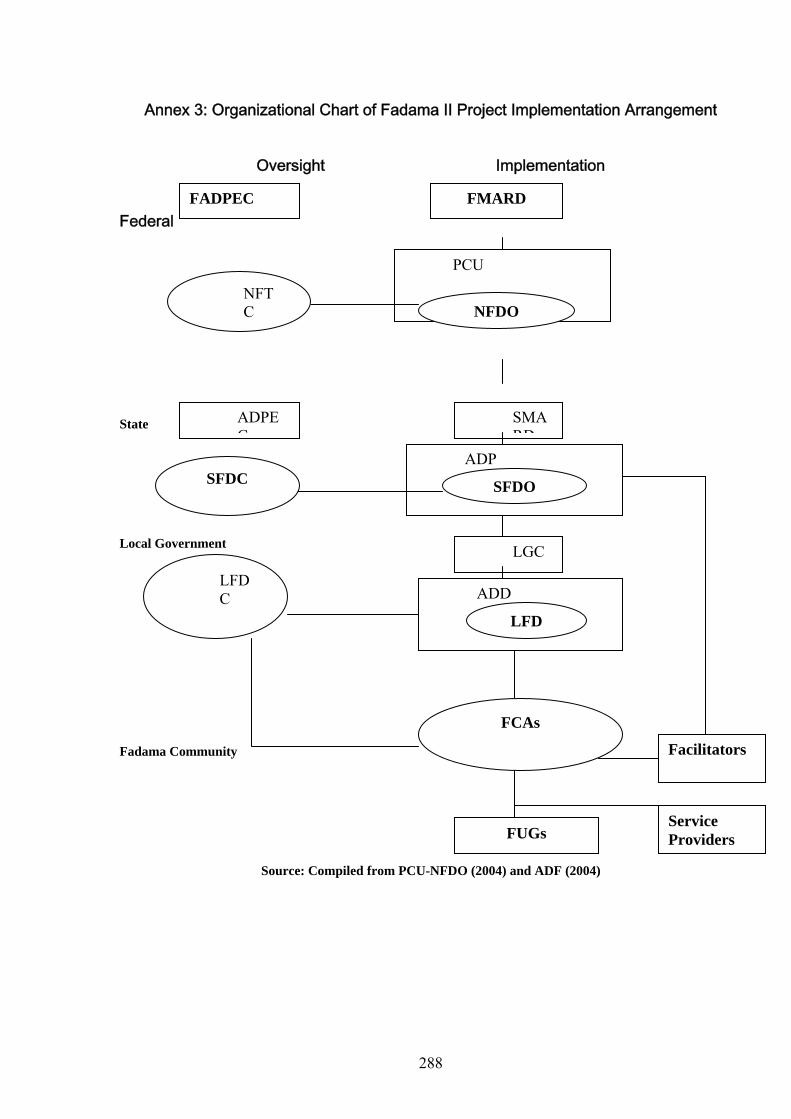
288
Annex 3: Organizational Chart of Fadama II Project Implementation Arrangement
Oversight Implementation
Federal
State
Local Government
Fadama Community
Source: Compiled from PCU-NFDO (2004) and ADF (2004)
FADPEC
PCU
FMARD
NFDONFTC
SMARD
ADP
SFDO
ADPEC
SFDC
LGC
ADD
LFD
FCAs
FUGs
LFDC
Facilitators
Service Providers

289
290
2
OPPORTUNITIES FOR PRIVATE SECTOR PARTICIPATION IN AGRICULTURAL WATER
DEVELOPMENT AND MANAGEMENT

291

292
3
EVALUATION OF THE ENVIRONMENTAL AND HEALTH IMPACTS OF INFORMAL
AGRICULTURAL WATER DEVELOPMENT IN SUB-SAHARAN AFRICA
M. McCartney, E. Boelee, O. Cofie and Country Consultants

293
Table of Contents SYNTHESIS 294 CASE STUDY 3.1 Environmental and Health Assessment of Smallholder Irrigation within Dambos in Zambia……………………………………………..298 CASE STUDY 3.2 Environmental and Health Assessment of small reservoirs in Burkina
Faso……………………………………………………………………330 CASE STUDY 3.3 Comparison of formal and informal agricultural water development
using appropriate environmental and social indicators, in Ghana……..369
294
SYNTHESIS 3.1 A recent review (McCartney et al., 2004) highlighted the paucity of quantitative
data and information on the environmental and health impacts of agricultural water development in sub-Saharan Africa. This was particularly true for smallholder and informal agricultural water development.
3.2 The limited availability of information on environmental and health implications
of small-holder irrigation is of concern, because small-scale irrigation is increasingly being promoted in sub-Saharan Africa for the following reasons:
it provides business opportunities for private entrepreneurs it generally has low investment and operational costs it requires much less enterprise and management capability than large formal schemes
3.3 Furthermore, they are widely perceived to be less environmentally damaging than
large schemes. However, with only limited quantitative data available it is not possible to scientifically substantiate this perception. The extent to which many small-holder schemes are sustainable in the long-term, particularly when they are up-scaled, is not known. Because of the importance of this issue for agricultural water development in sub-Saharan Africa, three case studies were undertaken to obtain and consolidate available information on a range of health and environment issues.
3.4 The first study comprised an environmental and health assessment of small-holder
irrigation within a type of seasonally saturated wetland (called dambo) in Zambia. This study was undertaken because the water resources provided by wetlands in arid and semi-arid regions make them attractive for small-holder cultivation and there are socio-economic pressures resulting in increased wetland cultivation throughout much of sub-Saharan Africa. However, wetlands are relatively fragile ecosystems and the long-term environmental and health impacts of wetland utilization are not well documented.
3.5 The second study comprised an environmental and health assessment of small
reservoirs in Burkina Faso. This study was considered important because small earth dams are increasingly being used to improve community water resources, both for domestic and agricultural use. However, the environmental and health impacts resulting from this water storage are not well researched.
3.6 The third study comprised a comparison of the impacts of different agricultural
water development projects using selected environmental and social indicators in Ghana. The intention of this project was to utilize simple indicators to make comparisons of the impacts of different types of agricultural water development, across a range of scales and including both formal and informal schemes.
295
3.7 Generic findings arising from all three case studies include:
• Contrary to many peoples’ perceptions, small-scale agricultural water development can have adverse environmental and health impacts. Currently these impacts are widely disregarded and there is a general lack of interest in these issues.
• Present policies and legislation generally fail to provide sufficient environmental
safeguards. Most small-holder activities, including those promoted by many NGOs, by-pass strategies intended to protect the environment.
• There is a general lack of quantitative, and particularly site-specific, data that can
be used to assist in the development of policies and management strategies to minimise adverse impacts.
• It is difficult to see how current practices for environmental protection can be
modified to encompass small-holder activities, in a way that is pragmatic and economically viable. Realistically, the only policies that will succeed are those that build local understanding and capacity and encourage self-regulating and self-enforcing incentives for improved environmental and health management.
3.8 Specific findings from case study 1:
• Throughout Zambia, there is an upward trend in the use of dambos for agricultural activities. There are a number of socio-economic and natural drivers causing this change, but key among them are the recently liberalized macro-economic conditions and the frequent occurrence of drought in past years.
• There is no evidence of widespread over-exploitation of dambos and the general
perception among small-holder farmers in Zambia is that they have utilized dambos sustainably for several decades. Nonetheless, there is evidence of adverse environmental impacts arising from irrigation within dambos. These include: drying of water courses, increased sedimentation, declining soil fertility, salinization, reduction of natural vegetation cover and increased prevalence of pests (e.g. nematodes).
• There is no doubt that environmental changes resulting from agricultural use impact
the health of communities utilizing dambos. However, these are difficult to isolate from the numerous other factors affecting the health of communities. One area of potential risk is through exposure to agro-chemicals. To date there are no records of direct health problems arising from use of agro-chemicals in dambos, but it is also the case that no research has been conducted. There is evidence of linkages, arising through the marketing of produce grown in dambos, between HIV-AIDS and smallholder dambo utilization. However, further research is required to substantiate these findings.
296
• Institutionally, the capacity of government departments to deal effectively with dambo-cultivation issues in Zambia is limited. There is need for collaboration with local and international experts and NGOs to effectively deal with the task of developing and disseminating technologies for sustainable utilization of dambos.
3.9 Specific findings from case study 2:
• In many places, the creation of small reservoirs in Burkina Faso has resulted in increased household income through productive agricultural activities upstream and downstream of the dam. However, in almost all cases no preventive measures were taken to ensure that the small reservoirs do not have adverse environmental and health impacts.
• Significant environmental degradation can occur in the vicinity of small dams as
result of increased pressure from people and livestock arising as a direct result of improved water resources. Pollution and sedimentation of small reservoirs can occur as a consequence of inappropriate land-use practices and poor catchment management.
• The water related diseases most directly linked to the construction of small dams
are schistosomiasis and malaria. The few field studies on health impacts of small dams suggest that transmission of both schistosomiasis and malaria may increase around the small dams.
• Knowledge of water related diseases, including causes and avoidance measures,
is low in Burkina Faso. Public awareness campaigns are necessary to explain to communities the possible impacts of dams and irrigated agriculture on their health. This should be done even before the promotion of preventive and curative measures against the water-related diseases. Alternative water sources for domestic supply should be developed if possible.
• The reduction of the negative impacts of small dams on the environment and
public health requires an integrated approach that specifically identifies the enhancing and limiting factors that influence environmental impacts and the transmission of diseases in the dam environment. It is only from a good knowledge of the risks that effective environmental management and disease control programs can be developed in a way that fits with regional strategies for poverty eradication and sustainable development.
3.10 Specific findings from case study 3:
• In Ghana, the livelihoods of farmers utilizing both formal and informal irrigation schemes had improved. In this study, 63% asserted they were financially better-off and 37% stated that they had used profits derived from irrigation to educate their children.
297
• Environmental and health assessments were not conducted prior to the implementation of any of the formal or informal schemes surveyed. Furthermore, in none of the schemes are there on-going programmes of environmental and health monitoring.
• There is a lack of knowledge on the part of the farmers, particularly with respect to potential environmental impacts on areas downstream of the development and the potential damage to wildlife habitats. In most schemes the farmers are concerned primarily with pest and weed management and soil fertility problems, since these have direct impacts on their livelihoods.
• There were insufficient data to isolate the health impacts of individual schemes. However, many farmers attributed improvements in health status to improved food security, reduced malnutrition and increased ability to purchase medical care. Increased prevalence of malaria was the most commonly acknowledged negative impact attributed to irrigation. In the formal schemes increased schistosomiasis was commonly thought to have arisen as a result of the creation of snail habitat.
• Currently capacity building is not a component of even formal agricultural water development projects. There is need for much greater training of farmers, on both formal and informal irrigation schemes, to raise awareness of environmental and health issues and potential mitigation measures.
298
Case Study 3.1
Environmental and Health Assessment of Smallholder Irrigation Within Dambos in Zambia
Matthew McCartney1, Angel Elias Daka2 and Isaac Ntambo3
1 International Water Management Institute, Pretoria, South Africa 2 Cooperative League of the USA, Lusaka, Zambia
3 International Development Enterprises, Lusaka, Zambia

299
300
SYNTHESIS 3.11 This case study was conducted to consolidate information on the environmental and
health impacts associated with utilizing the water resources of dambos for small-holder cultivation in Zambia. The study, which comprised a broad national overview supported with more specific information collected from two dambos, was conducted between July and September 2004. Some of the key findings from the study are:
1. Throughout Zambia, there is an upward trend in the use of dambos for
agricultural activities. There are a number of socio-economic and natural drivers causing this change, but key among them are the liberalized macro-economic conditions and the frequent occurrence of drought in recent years.
2. Land use practices in dambo utilization, provide livelihood options such as
food production, but can also be detrimental to the environment. Furthermore, there is no doubt that environmental changes resulting from agricultural use impact the health of communities utilizing dambos. However, to date very little research has specifically addressed the environmental and health implications of dambo utilization.
3. The general perception among small-scale farmers using dambos in Zambia
is that they have used dambos sustainably for several decades. Generally the impacts of smallholder use are widely perceived to be minimal. However, the implications of scaling-up dambo utilization are not clear.
4. There is no evidence of widespread over-exploitation of dambos.
Nonetheless, there is evidence of adverse environmental impacts arising from dambo agriculture. However, as with large irrigation schemes, where small incremental changes often go un-noticed until their impact begins to have a serious effect on production, it seems that currently these impacts are widely disregarded. The risk is that they will be neglected to the point where, in future, dambo productivity is undermined and it is not possible to rehabilitate them.
5. Present environmental policies and legislation in Zambia, fail to provide
safeguards to protect dambos from potentially negative environmental impacts arising from smallholder use for cultivation. Most smallholder activities, including those promoted by many NGOs, by-pass strategies intended to protect the environment. It is difficult to see how current environmental assessment procedures can be modified to incorporate smallholder use of dambos, in a way that is both pragmatic and economically viable.
6. Realistically, the only policies that will be successful are those that empower
local people to manage and control the dambos in their own landscape. The aim should be to provide an enabling framework that will both conserve and encourage the sustainable use of wetlands. The challenge is to find how self-

301
regulating and self-enforcing incentives for sustainable management can be implemented.

302
Table of Contents Page INTRODUCTION 302 Country context 303 Dambo utilization 304 Scope of this chapter 305 Policy and legal framework 306 Past research and current trends in dambo utilization 309 Environmental impacts 311 Hydrology 311 Water quality 313 Soil erosion 315 Pests 316 Impacts on flora and fauna 318 Health impacts 319 Diseases 320 Exposure to agro-chemicals 322 HIV/AIDS 323 Conclusions and recommendations 324 References 326
303
INTRODUCTION 3.12 The key objective of this study was to provide guidance to the government of
Zambia and donor agencies on policy for future investment in activities that promote small-holder use of, and irrigation in, seasonally saturated wetlands known as dambos. Specifically the intention was to:
• Identify the environmental and health impacts of crop production within
dambos. • Assess the risks associated with such developments. • Identify possible mitigation measures and action plans.
3.13 The study comprised a broad national overview, based on previous studies and
expert opinion. This was supported with more specific information and local knowledge obtained from two dambos used extensively for agriculture, namely Katuba and Kabangwe. These two dambos are located just to the north of Lusaka. In 2000, ZATAC, in collaboration with IDE and Agriflora (an export vegetable company), introduced high value crops in Katuba under a treadle pump irrigation project involving about 100 small-scale-farmers.
3.14 In the current study, the approach adopted comprised a literature review and non-
structured interviews with key informants (Appendix 3A-A). In addition information was obtained from other countries where relevant and available.
COUNTRY CONTEXT
3.15 Zambia has a population of 10.5 million and an annual growth rate (1999-2002) of approximately 2.5%. Since independence Zambia’s economic development has been dominated by the decline in the purchasing power of the country’s copper resources. This situation has been aggravated by frequent occurrences of drought, failure to diversify the economy away from copper and the HIV/AIDS pandemic. As a result of the decline in copper prices and subsequent heavy borrowing, Zambia has become one of the most heavily indebted countries in Africa, and during much of the 1990s interest payments on foreign debt service were higher than public spending on human development. There was a decline in per capita income from US$ 752 in 1965 to US$ 351 in 2002 (PRSP, 2002).
3.16 The adverse economic conditions, have affected Zambia’s ability to fight poverty and improve the living conditions for its population. It is estimated that in 1998, 73% of the population lived below the official poverty line. The poor lack not only income but also access to basic services such as education, health, safe water and infrastructure. Average life expectancy is just 33 years. More than 10% of children die before their first birthday and an additional 6% do not survive past
304
five years of age. Zambia ranks 163 out of 173 countries covered by the 2003 United Nations Human Development Report.
3.17Currently agriculture contributes approximately 20% of GDP. It is estimated that farming provides a living for 50% of the Zambian population and that small-scale farmers, cultivating land with oxen or hoes, comprise over 90% of the farming population (Mukanda, 1997). However, of the 2,750,000 ha of potential irrigation, only 156,000 ha are irrigated (MACO, 2004). Zambia’s Poverty Reduction Strategy Paper (PRSP) highlights the need for economic growth and diversification of production and exports. The PRSP gives the highest priority to agriculture in the diversification of production and exports, employment creation, income generation and promotion of food security. It sees a role for expanded commercial farming existing alongside small-scale farming.
DAMBO UTILIZATION 3.18 Throughout Zambia, increasing population is resulting in both intensified and
diversified utilization of dambos (Mukanda, 1997). Dambos occupy approximately 3,500,000 ha (i.e. 4.6%) of the land surface of the country (Ferreira, 1981). They support rural livelihoods both through agriculture and provision of natural resources. In many areas dambo agriculture makes an appreciable contribution to livelihoods in terms of both direct cash income and contributions to food security. It is the availability of water, in otherwise dry areas or during dry periods that make dambos a valuable agricultural resource. In some communities the poorest households obtain 90% of their cash income from the sale of produce grown in dambos. Many dambos are used as part of coping strategies during times of drought (Masiyandima et al., 2004).
3.19 It is estimated that presently about 100,000 ha of dambos in Zambia are cultivated
(Daka and Gondwe, 1998). In recent years, several NGOs (including CLUSA and IDE) have promoted the utilization of relatively inexpensive irrigation technologies (e.g. treadle pumps) to assist farmers to increase dambo productivity by enabling expansion of dry season cultivation. It is estimated that, since 1997, five thousand treadle pumps have been distributed in Zambia, many for use in dambos. The major sources of these pumps are IDE and CLUSA. However, a small number have been distributed by other NGOs and private companies (Table 3A-1).
3.20 The final draft of Zambia’s recent irrigation policy review and strategy recognizes
the potential for increased irrigation within dambos. However, it also acknowledges their important environmental role and calls for more research to identify suitable locations and to assess the impacts of small-scale water control and interventions (MACO, 2004).

305
Table 3.1: Distribution of treadle pumps in Zambia
Organization Areas Number IDE Mainly Eastern, Western and Southern Provinces 3,500 CLUSA Southern, Central, Eastern, Copperbelt 800 GTDP Southern Province 150 Red Cross Livingstone 500 (Source: IDE and CLUSA progress reports) 3.21 Although the potential for increased dambo agriculture is widely acknowledged,
to date research into their utilization has concentrated primarily on agronomic issues and there has been almost no research into the environmental and health implications. Large-scale drainage of dambos, by European farmers in the early part of last century, particularly in what is now Zimbabwe, resulted in extensive gulleying and desiccation that ultimately led to legislation prohibiting all dambo cultivation, in that country (McFarlane and Whitlow, 1990). Although similar legislation has never been passed in Zambia, the risks associated with smaller scale farming activities, such as those allied to treadle pump irrigation remain unclear. In particular the cumulative environmental impact of numerous small-scale interventions and the consequences of malaria and other water-related diseases on long-term sustainability are uncertain.
SCOPE OF THIS CHAPTER 3.22 This chapter consolidates available information on the environmental and health
implications of dambo cultivation in Zambia, with particular reference to irrigation. Section 3A2, describes current national environmental protection practices and how these relate to agricultural activities within dambos. Section 3A3, briefly summarizes past dambo research in Zambia and assesses current trends in dambo utilization in the country. Section 3A4, evaluates the potential environmental hazards associated with cultivation within dambos. The major potential impacts on hydrology, water quality, soil erosion and biota are identified and, as far as possible, the extent to which they are occurring is assessed. Section 3A5, evaluates the range of possible health implications and, again as far as possible, assesses the extent to which current agricultural practices are impacting the health of communities. Section 3A6, presents conclusions and recommendations for sustainable irrigation in dambos in Zambia.

306
POLICY AND LEGAL FRAMEWORK 3.23 Zambia is a signatory to various international conventions that influence
environmental policy in the country (Table 3A-2). In relation to dambos the most relevant is the Ramsar Convention, which promotes the “wise-use” of wetlands. A recent resolution of the contracting parties to the convention recognizes the importance of wetland agriculture and calls for increased research to develop guidelines to enhance the positive role and minimize the negative impacts of agriculture (Ramsar, 2002).
Table 3.2: List of International Conventions and Agreements to which Zambia is a
signatory and which influence environmental policy in the country. Title Year
signed Year ratified
Convention on biological diversity (CBD) 1992 1993 Convention on Wetlands of International importance especially as Waterfowl Habitat (Ramsar Convention)
1971 1991
Convention on International Trade in Endangered Species of Wild Flora and Fauna (CITES)
1980 1981
The United Nations Framework Convention on Climate Change 1992 1993 United Nations Convention to Combat Desertification 1992 1996 Convention on the Protection of World Cultural and Natural Heritage
- 1984
Convention on the Conservation of Migratory Species of Wild Animals
- 1979
3.24 Currently, Zambia does not have a national policy that specifically guides the
utilization of wetlands and there is no single institution with a mandate to manage wetlands. There is a National Strategy and Action Plan (ECZ, undated), but the national policy on wetland conservation, drafted by ECZ in 2000, is still awaiting approval by cabinet. When ratified, this policy will promote the conservation and “wise-use” of wetlands. Although no specific mention is made to agriculture, the policy seeks to promote the socio-economic development potential of wetlands by facilitating ecologically sound development through local communities (ECZ, 2000).
3.25 The management of wetlands has been constrained because its mandate keeps
being changed from one Ministry department to another. Recently the mandate was transferred from the Environmental Council of Zambia to the Zambia Wildlife Authority (ZAWA), which lies within the Department of Wildlife and National Parks. This does not offer flexibility between total conservation and sustainable utilization. Recently, discussions have been undertaken to harmonize the draft wetland policy with the recently enacted Agricultural Policy.
3.26 In recent years environmental awareness regarding the potential adverse impacts
of development projects, including agricultural projects, has resulted in a

307
framework for environmental protection and national resources conservation. The Environmental Protection and Pollution Control Act (EPPCA) of 1990 established the Environmental Council of Zambia (ECZ), which is the lead institution for the co-ordination of environmental management in Zambia. ECZ responsibilities include:
• Coordination of all the activities of all ministries and other bodies concerned
with environmental protection. • Management of the Environmental Impact Assessment (EIA) process for all
development projects. • Provision of advice on all matters relating to environmental conservation,
protection and pollution control. • Conducting studies and make recommendations on standards related to
improvement and maintenance of sound ecological systems. • Monitoring trends in the use of natural resources and their impact on the
environment. • Drawing up and enforcing regulations related to water, air and noise pollution,
pesticides and toxic substances and waste management. 3.27 In addition, to the EPPCA there are numerous other legal instruments that, at least
in theory, influence dambo utilization (Table 3A-3). In 1994, EIA was recognized as one of the underlying principles in the National Environment Action Plan (NEAP). Formulation of the EIA regulations was initiated by ECZ in 1993 and the regulations were finalized and passed as Statutory Instrument number 28 in 1997. These stipulate that a “project brief” must be presented to ECZ prior to the implementation of all development projects. On the basis of the project brief, ECZ determines if there is need for an EIA or if the project is approved with or without conditions. If an EIA is required the process is administered by ECZ, who draws up the terms of reference and evaluates the EIA report. With respect to agriculture, EIA is always required for “large-scale” land clearance and all irrigation projects of more than 50 ha in extent. The ECZ is also responsible for ensuring that any mitigation measures devised within environmental management plans, derived through the EIA process, are implemented.
3.28 Despite current policy, EIAs are largely donor driven and for the most part
restricted to large construction projects. For example, the USAID mission in Zambia helps to enforce this statutory instrument by ensuring that an EIA is conducted for any of their projects. Among the EIAs conducted in Zambia by USAID is an assessment of arsenic poisoning of boreholes in Southern Province and evaluation of the environmental and health aspects of all the activities undertaken by CLUSA (USAID, 2002). For large-scale projects involving land clearing and community resettlements, examples of EIA compliance are Nakambala Sugar Estates, the Small-scale Irrigation Project (SIP) and Consolidated Farming Company that grows sugarcane in the Kafue flats.

308
Table 3.3: List of legal instruments with some bearing on dambo utilization
Legal Instrument Year
enacted Environmental Focus
Environmental Protection and Pollution Control Act
1990 Environmental protection and pollution control
Conservation Act 1970 Conservation of natural resources outside protected areas
Forest Act 1998 Establishment and management of national forests, local forests and conservation of forests and trees.
Zambia Wildlife Act Establishment and management of national parks, game management areas and the protection of all wildlife.
Public Health Act 1978 Prevention and suppression of diseases and regulation of all matters concerned with public health.
National Heritage Conservation Commission
1989 Preservation of heritage
Water Act 1957 Control, ownership and use of water (excepting international boundaries)
Lands Act 1995 All matters pertaining to management of land and land tenure.
Agricultural Lands Act 1960 Regulation of use of agricultural lands. Planning Act 1962 Land use management 3.29 There are several recognized limitations with the current EIA practices in relation
to agricultural development within dambos. These include:
• Most small-scale community and NGO developed projects do not participate in the formal EIA process. Very few submit project briefs to ECZ. Adverse impacts are generally perceived to be negligible and little consideration is given to long-term impacts and the consequences of scaling-up activities. It is possible that in many cases the organizations promoting smallholder interventions within dambos are unaware of the formal EIA process.
• The costs of conducting EIA, which are borne by the developer, are
prohibitive. Most NGOs and community-based projects cannot afford to conduct an EIA. It is incongruous, but EIA regulations and penalties are so weak that penalty fees for non-compliance are lower than the cost of undertaking an EIA.
• The capacity of ECZ to follow-up on mitigation measures developed through
EIA process is very limited. Currently monitoring is restricted to larger-scale projects.
309
PAST RESEARCH AND CURRENT TRENDS IN DAMBO UTILIZATION 3.30 A review of literature indicates that very little research has been conducted into the
environmental and health issues associated with dambo cultivation. Most documented research pertains to agronomic and social studies. In relation to environmental and health impacts most of what is documented is qualitative rather than quantitative analyses.
3.31 The Farming Systems Research Team (FSRT) then called Adaptive Research
Planning Team (ARPT) has in the past carried out several agronomic and socio-economic studies of dambo utilization in Luapula province. Ferreira (1974) and Whitlow (1985) identified the potential for growing rice in dambos in the rainy season, followed by dry season cropping of wheat and vegetables like Irish potatoes, tomatoes, cabbage, green maize (on dambo margins), beans and sweet potatoes (ARPT,1984,1985,1988,1992,1993). Dougnac (1986) in work undertaken at Mabumba, reported on the use of residual soil moisture in wetlands of Luapula province and indicated that water management remains a critical factor requiring further research. His studies on micro-nutrients in dambos reveal that such work needs to be continued as micro-nutrients are the key determinant for sustained fertility in dambo soils. His findings from agronomic trials of crop production such as maize, wheat, beans, rape, kale, carrots, beetroot, broad beans, peas, onions and amaranthus viz avis planting dates, fertilizer levels, timing of land preparation and application of fertilizer and lime have resulted in increased diversification of crop production in dambos.
3.32 Discussions with farmers in the field reveal that past research has had some impact
on dambo utilization. Some demonstration/trials by ARPT have contributed to the following changes in the communities/farmers:
• Farmers are now able to grow a wide variety of crops in dambos. These crops
include exotics such as rape, tomatoes, cabbage, chinese cabbage, etc. which are now grown in the dry season. Previously utilization was often limited to rice cultivation in the rainy season, because farmers didn't know it was possible to grow other crops.
• Diversity of crops introduced into dambos has attracted more farmers into
dambo cultivation and they have extended cropping patterns to growing perennial plantation and fruit crops such as bananas, sugarcane, oil palm tree and citrus respectively. This precedence has made it possible for vegetables to be available for consumption throughout the year.
3.33 Agricultural production on the wetlands of Zambia is undergoing change. In both the
wetter northern part of the country and the semi-arid southern parts of the country, wetland utilization for agricultural production has increased in recent years. There are many reasons for this:

310
• increased pressure on wetland cropping due to population increase • drought occurrences that have adversely affected upland cropping and
caused a shift to wetlands utilization • socio-economic changes in the country which mean there are fewer jobs than
required for a growing population leading to increased use of wetlands to generate income through sales of produce grown in more reliable environments than upland fields.
3.34 In Luapula Province in Northern Zambia, for instance, quantitative survey data
indicates that increasing numbers of people are utilizing the dambos for the cultivation of dry season crops, particularly vegetables (Daka and Kokwe, 1996). The underlying force towards this increased utilization is the changed macro and micro-economic conditions currently prevailing. Dambos have recently been used for growing vegetables and green maize, which are considered high value crops. Many believe that as the need to earn cash increases, people who depend on agriculture for cash earnings will increasingly exploit dambo resource to meet their needs. The domestic advantages of increased ease of access to drinking water and water for soaking (processing) of cassava (a major starch staple of Luapula and to a lesser extent on the Copperbelt and Northern Provinces) cannot be underestimated. The diversification of land use which enables production of cash and food crops is something that farmers alluded to as another reason for increased utilization of dambos.
3.35 Similarly in Central Province, there is increased and intensive use of dambos for dry
season vegetable production (Matsumoto and Sakaide, 1993). Here household income generation and the risk of upland crop failure are the paramount reasons given for increased use. The recent droughts in Zambia have also contributed to the recognition and increased utilization of wetlands for agricultural production. It is increasingly common for farmers to extend their field crops (maize) from the uplands to the margin of the dambos. This is a recent phenomenon intended to guard against total crop failure in case of partial droughts, which have been repeatedly experienced in Zambia in recent years. In the event of a partial drought this cropping pattern ensures that at least on the dambo fringe, crops still have adequate moisture to reach maturity before the dambo dries up, thereby avoiding total loss of the crop.
3.36 In Eastern Province (Raussen et al. 1995) point out that gardening in dambos has
intensified especially since the second half of the 1980s. Equally the variety of crops grown has widened especially in areas close to bigger markets such as Chipata.
3.37 In the Zambezi river system, the trend in floodplain utilization for crop production
shows a different picture. In Western Province, a range of factors have influenced the movement of people out of the wetlands. A desire to engage in more commercial maize cultivation, a migration to be closer to services and infrastructure, a response to changing environmental circumstances of land pressure and desiccation and a reaction to the lack of technological, research and extension support for agriculture in wetland areas, have all combined to affect the current

311
pattern. In many places, livestock (cattle) are dependant on wetlands for dry season grazing and water provision. In some of the farming systems of Zambia there is a trend towards overstocking on the wetland ranges (section 4.3).
ENVIRONMENTAL IMPACTS 3.38 Dambos are widely perceived as fragile ecosystems that perform beneficial
ecological functions, particularly with respect to regional hydrology. For much of the last century concern was expressed that if dambos were disturbed these valuable functions would be lost. For example, a Commission of Enquiry (1939) in Zimbabwe (formerly Southern Rhodesia) denounced smallholder cultivation in dambos claiming that “...... once pleasant valleys [were] transformed by this means to barren stretches of gaping dongas [i.e. gulleys]” (McFarlane and Whitlow, 1990). Indeed, in Zimbabwe, legislation was introduced earlier this century (i.e., the Water Act (1927 and 1976); the Natural Resources Act (1941 and 1975); the Public Streambank Protection Regulation (1956)), which intended to bring about the cessation of all dambo cultivation, primarily to protect their perceived hydrological functions (Whitlow, 1992).
3.39 In principle, dambos may be degraded either through lowering of the water table,
leading to drying out, or through an increased rate of erosion leading to destruction of the wetland through gullying or removal of deposits downstream (Scoones, 1991). Changes in the water balance of dambos will arise as a consequence of changes in infiltration rates, both of the dambo and surrounding catchment; changes in evapotranspiration levels, or changes in the storage capacity of the dambo and the surrounding catchment area. Such changes may have adverse impacts on flora and fauna as well as ecological functions that benefit people.
3.40 In relation to dambo agriculture, principal areas of environmental concern are
expressed about impacts on hydrology, water quality, soil erosion and loss of flora and fauna. For farmers specifically another key concern is pests.
HYDROLOGY 3.41 It is a widely held perception that dambos play a key role in the hydrology of
southern Africa. It is often quoted in scientific literature that dambos act as “sponges” or reservoirs, storing water during the wet season and releasing it slowly through the dry season, thus maintaining dry season river flows (e.g. Kanthack, 1945; Mackel, 1974; Perera, 1982). In many dambos the natural grasses senesce in the dry season and so it has long been assumed that, at this time of the year, evapotranspiration from dambos is considerably lower than potential rates. Concern was first expressed early in this century that cultivation would reduce dry season flow by promoting transpiration:
312
“....... the primary effects of cultivation will result in the loss of moisture, as ploughing exposes a greatly increased surface area of damp soil to the sun and wind and the active growth of winter crops or pastures increases transpiration losses” (Rattray et al, 1953).
3.42 Irrigation from shallow wells and drainage of wetter areas are practices adopted
by many small-scale farmers. It might be expected that these interventions would further reduce dry season flows since they exacerbate any drop in the watertable. Turner (1986) observed a rapid fall in the water table early in the dry season following wetland drainage. However, in practise the consequences of drainage and irrigation may be complex, because lowering of the water table in some places may actually decrease evaporation. Work conducted in Europe has shown that drainage of soils may in fact increase dry weather baseflow (Robinson, 1990). Furthermore, the perception that dambos play a significant role in the maintenance of dry season recession flows has recently been questioned (e.g. Bullock, 1992; McCartney, 1998) but the results of the few quantitative studies conducted to date have produced conflicting results.
3.43 On the basis of a water balance study conducted on a small catchment in Zimbabwe,
Faulkner and Lambert (1991) estimate that cultivation of up to 10% of the catchment or 30% of a dambo (whichever is greater) will have little overall effect on the hydrological regime of the catchment. However, these figures may only be applicable in the specific environment (e.g. average annual rainfall 850 mm) in which they worked. McCartney et al (2001) present a simple “rule of thumb” to estimate the maximum number of treadle pumps that can be used with limited impact on water resources) in headwater dambos. The rule takes into account the ratio of the wetland area to the total catchment area, the mean annual rainfall, the volume of water typically extracted using a treadle pump and the dry season contribution of water to the dambo from upslope. However, further studies are required to determine to what extent these recommendations can be generalised and applied to dambos in other agroecological zones.
3.44 In Zambia, Daka (1998) highlights long-term land use changes at Mudobo and
Fikolwa dambos in Southern and Central provinces, respectively. Information from both Fikolwa and Mudobo dambos indicates a decline in the wet area and hence a general drying up of these dambos (Table 3A-4). This is widely attributed to reduced precipitation over time (Daka, 1998). At Fikolwa wetland, no farmer cultivated this dambo because of general flooding in 1967. However, increased use was noticeable as water receded in subsequent years. By about 1993, 300 ha dambo gardens had been established. At Mudobo dambo, variation in soil moisture is believed to have played a major role in changing patterns of utilization. Land coverage for gardens indicate 125 ha in 1970, followed by 25 ha in 1980 and a dramatic increase to 200 ha in 1991.

313
3.45 At Kabangwe, it is reported that the water table regimes have changed since the early 1960’s. In the past the wetland flooded regularly. However, more recently much of the dambo has dried out. Some shallow wells have been abandoned and many of these have collapsed. Farmers attribute this change to reduced precipitation, but also increased use (i.e., abstraction of water) as a result of population increase both at the wetland site and also in Lusaka. Rising population has led to increased demand for wetland produce and resulted in increased cultivation and irrigation.
3.46 At Katuba, the community perception is that groundwater levels have generally
declined over the past decade. Most farmers have had to repeatedly deepen the shallow wells that they use for irrigation water. In addition, many streams that drain the dambo have reduced flows and there are sections of the main drainage stream that now dry up each year. Furthermore, primary tributaries, Kayosha and Tulonga Tubili, that were perennial streams, now also dry up at the height of the dry season. This is a problem for some farmers who use treadle pumps to abstract water from these streams. The community’s perception is that the frequent droughts of the 1990s are largely responsible for the decline in water levels and subsequent reduced flows. The extent to which the problem has been made worse by treadle pump irrigation is not known.
Table 3.4: Temporal changes in land characteristics in Mudobo and Fikolwa dambos and their catchments
Mudobo Dambo
Year Catchment Area (Ha)
Wet Dambo
Area (Ha)
Dambo Gardens
(Ha)
Upland Fields (Ha)
Built Area and
roads (Ha)
Forest/grassland (Ha)
1970 1000 250 125 100 25 500 1980 1000 225 25 175 125 400 1991 1000 225 200 75 175 325
Fikolwa Dambo 1967 1200 125 0 6.25 318.75 750* 1983 1200 100 275 50 450 325* 1993 1200 75 300 150 450 225* *Covered by bush and grassland (source: Daka, 1998) WATER QUALITY 3.47 The possibility of water pollution in dambo environments is connected to the
application of fertilisers and pesticides. The use of fertiliser is obviously related to soil fertility. Soil fertility within dambos is a function of the parent material, soil age and moisture relations. Furthermore, dambos act as sinks for suspended and dissolved material (sediment and salts) conveyed from upland areas. This has implications for soil productivity and it is widely believed that the accumulation

314
of soil fines and their associated nutrients and organic matter increase the soil fertility compared to adjacent slopes (Ingram, 1992).
3.48 In Zimbabwe, Thompson (1969) states that dambo soils are “always inherently
more fertile than surrounding topland soils" and Bell et al. (1987) found that soils in the upper dambo zone had more fines, higher cation exchange capacity, base saturation, available phosphorous and a more favourable pH than the dry upslope soils. Similarly, in Lusaka Province in Zambia, the dambo gleys were found to be more fertile in terms of chemical properties than the upper catena soils (Perera, 1982). However, because their alluvial and colluvial parent materials are derived from very old and well leached upland soils not all dambo soils are fertile. Furthermore, frequent drying and reflooding may result in nitrogen losses through sequential nitrification-denitrification. After trials conducted in Zimbabwe the following conclusion was made:
“The cropping potential of the dambos results from the availability of water to the crops, especially during periods of mid season drought. It does not result from inherent high nutrient availability” (Grant, 1995).
3.49 To maximise the benefit of the dambo moisture many small-scale farmers (including
all those talked to during visits conducted for this study) apply fertilisers to their gardens (section 4.3). Furthermore, plant diseases, particularly in dambo vegetable production, are a major constraint to attaining high yields and product quality. Dambo gardens are usually small and the relatively humid environment increases the advent of diseases (e.g., fungal and bacterial diseases). For this reason many dambo farmers also utilize agro-chemicals for disease control. However, because the water table is close to the ground surface and many dambo soils are drained there may be significant risk of fertiliser and pesticide leaching to both surface and groundwater.
3.50 Studies have shown that a high degree of knowledge about pesticide use exists
among small-scale farmers cultivating crops in dambos. Farmers at Fikolwa, Kabangwe and Katuba dambos indicated that no environmental problems had been caused by inappropriate chemical application. No groundwater or surface water pollution has been reported in these wetlands. In fact, to date, with more than thirty years of crop production in dambos in many places, there is no documented evidence, anywhere in Zambia, of dambo pollution as a consequence of pesticide use. However, it is also the case that very little, if any, research has been done to investigate possible impacts.
3.51 Many dambo farmers traditionally use botanical pesticides such as tephrosia, ground
hot chili, wood ash dissolved in water and sprayed on vegetables to control pests such as aphids, red ants and red-spider mite. Increasing use of such methods is occurring. Some farmers use agro-chemicals but with generally good knowledge of handling both the chemical and the equipment used for spraying. These farmers do not use the same well for both domestic and irrigation purposes. Wells used for

315
drawing domestic water are usually located in dambo margins whereas those for irrigation are located in the seepage and lower grassland zone. This practice was confirmed by farmers at Fikolwa and Kabangwe dambos. Whilst, in Zambia, there are no reported cases of groundwater or surface water contamination as a consequence of chemical application, experience elsewhere indicates that contamination is possible, often as a result of incorrect handling of application equipment (sprayers) and pesticide residues and spray drift (Erne, 1970). It is possible that some pesticides may leach through surface run-off to streams or wells in dambos. In order to determine the overall impact, a monitoring programme is required.
SOIL EROSION 3.52 Conversion of dambos from dense grassland to crop land may increase erosion
risk. The removal of vegetation may result in more erosive overland flows, as well as making the surface more prone to rainfall impact. Even when the grassland vegetation is replaced by mature crops, these will not develop as thick a root mat and leaf canopy as the natural grasses and sedges. Clearance of vegetation and ploughing and ridging over a few years can destroy soil structure with resultant sheet or gully erosion. Inappropriate farming methods (i.e., excessive drainage to produce large areas of uniform soil moisture) resulted in accelerated gullying and desiccation of dambos on commercial farms in Zimbabwe (Whitlow, 1992). However, dambo cropping probably results in a lower erosion risk than if the dambo was under intensive grazing use with a short grass sward (Scoones, 1991). Overgrazing and trampling prevents regeneration of grasses and herbs that cover and protect the soil. Trampling compacts the surface, reducing permeability and increasing the amount of runoff, at the same time breaking down soil structure so that soil material is more easily removed by runoff water. The hazard is worst where cattle congregate (e.g., around water holes) and where tracks are worn down by continual use, since these initiate gully erosion.
3.53 Recently, gullying in dambos in Malawi and Zimbabwe has been attributed to
deforestation of the upland immediately surrounding dambos (i.e., interfluves). It is argued that the increased head of water under interfluves, arising from the decreased transpiration following deforestation promotes upward discharge into the dambo, thereby promoting gulleying (McFarlane and Whitlow, 1990). Although, much research needs to be done to verify this theory it does highlight that management of dambos must be considered within the context of the whole catchment; interfluve management is an essential component of any sustainable dambo landuse.
3.54 Many farmers at both Kabangwe and Katuba commented on declining soil fertility
in the dambo. Several of the farmers at Katuba stated that the soils in their dambo plots were now fertilizer dependent. It is probable that the decline in fertility is a consequence of increased cultivation, mono-cropping and reduction in fallow

316
periods. Farmers at Katuba commented that they no longer implement fallow periods because they were “chasing money”. High salinity levels have been observed in some fields in the western side of Katuba. Interviews with key informants reveal problems of poor plant performance dating back more than two decades. It is not clear whether there is a relationship between this and the farming or irrigation activities that have been taking place. The overall extent of salinity problems has not been investigated and requires quantitative verification. One farmer at Kabangwe stated that application of lime improved his crop response, implying that acidification of soils might have been the cause for poor crop response. However, a proper investigation would need to be carried out to validate this.
3.55 At Katuba dambo localized deforestation and to some extent cattle grazing (although
stock levels are relatively low) are, through promotion of sheet soil erosion, believed to be a cause of land degradation (Ntambo, 2004). There are evident grass tussocks, and loose sand is found along the exposed roads and footpaths in the upland parts. In some areas, the problem of reduced stream flow (section 4.1) has been exacerbated by heavy siltation within the stream channel. This is caused by soil erosion from the banks resulting from cultivation of the dambo right to the stream bank. However, the specific impact of treadle pump irrigation to erosion in the gardens has not been established.
3.56 Elsewhere in Zambia, the cattle grazing within dambos is a primary cause of soil
erosion (FSRT, 1994). In eastern Zambia problems caused by the overgrazing of dambos became apparent in the mid-1950s. Excessive land pressures resulted in the herding of cattle on dambos during the wet season. This led to compaction of the wet soil, causing a reduction in water drainage and decreasing the growth of grass that would have been available for the dry season (Priestley and Greening, 1956). Erosion caused by overgrazing is still apparent today (Raussen et al. 1996). In Southern Province, with the exception of the Kafue Flats area, the plateau rangelands have also been reported to be overgrazed due to overstocking. In the floodplains of the Kafue and Zambezi rivers wetland ranges are fairly resilient to overgrazing because the annual floods limit the grazing period. In the wetter region of Northern and Luapula provinces of Zambia, the cattle populations are still relatively low and no evidence of overgrazing has yet been observed.
3.57 Conflicts over the use of dambos for crop production and livestock grazing have
been reported in almost all the farming systems where wetlands are used for these activities (ARPT -Western Province, 1988; Rogg, 1993; FSRT, 1994 and Raussen et al 1996). The only exception seems to be in the Northern zone where, with the exception of Northwestern Province, this conflict has generally not been observed.
PESTS 3.58 Pests are a common problem in irrigation systems. To date, there has been little
quantitative evaluation of pest problems in dambo cultivation. However, a recent
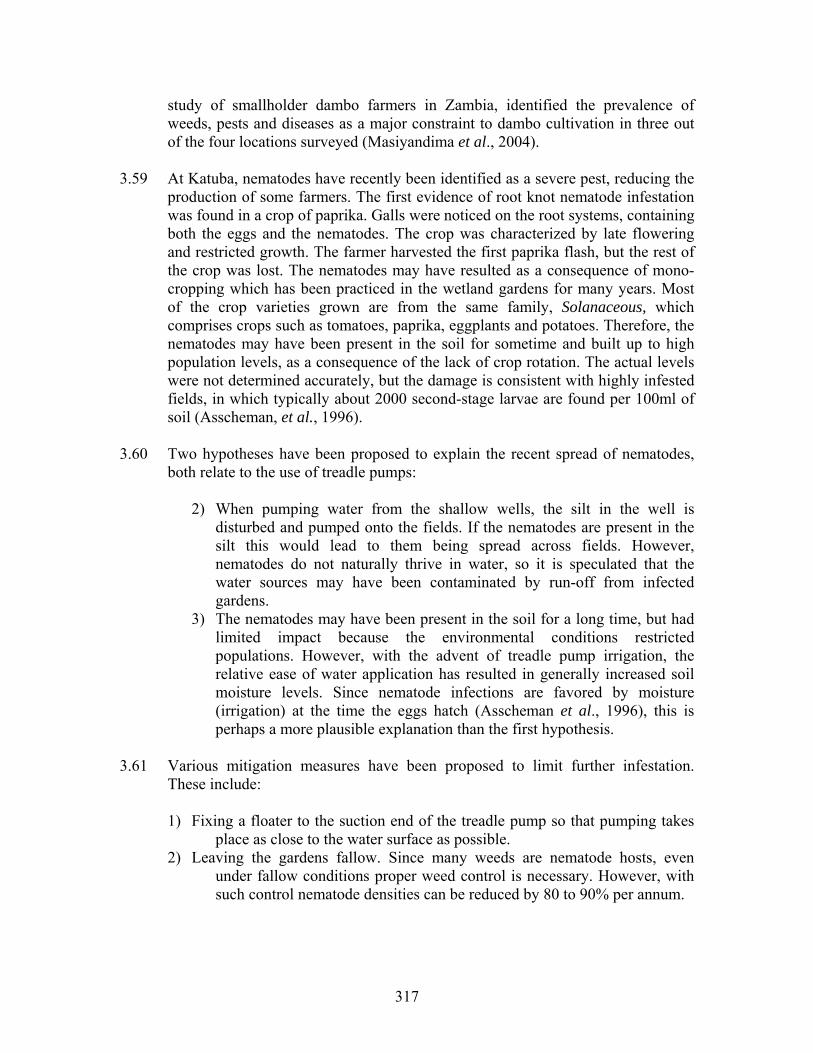
317
study of smallholder dambo farmers in Zambia, identified the prevalence of weeds, pests and diseases as a major constraint to dambo cultivation in three out of the four locations surveyed (Masiyandima et al., 2004).
3.59 At Katuba, nematodes have recently been identified as a severe pest, reducing the
production of some farmers. The first evidence of root knot nematode infestation was found in a crop of paprika. Galls were noticed on the root systems, containing both the eggs and the nematodes. The crop was characterized by late flowering and restricted growth. The farmer harvested the first paprika flash, but the rest of the crop was lost. The nematodes may have resulted as a consequence of mono-cropping which has been practiced in the wetland gardens for many years. Most of the crop varieties grown are from the same family, Solanaceous, which comprises crops such as tomatoes, paprika, eggplants and potatoes. Therefore, the nematodes may have been present in the soil for sometime and built up to high population levels, as a consequence of the lack of crop rotation. The actual levels were not determined accurately, but the damage is consistent with highly infested fields, in which typically about 2000 second-stage larvae are found per 100ml of soil (Asscheman, et al., 1996).
3.60 Two hypotheses have been proposed to explain the recent spread of nematodes,
both relate to the use of treadle pumps:
2) When pumping water from the shallow wells, the silt in the well is disturbed and pumped onto the fields. If the nematodes are present in the silt this would lead to them being spread across fields. However, nematodes do not naturally thrive in water, so it is speculated that the water sources may have been contaminated by run-off from infected gardens.
3) The nematodes may have been present in the soil for a long time, but had limited impact because the environmental conditions restricted populations. However, with the advent of treadle pump irrigation, the relative ease of water application has resulted in generally increased soil moisture levels. Since nematode infections are favored by moisture (irrigation) at the time the eggs hatch (Asscheman et al., 1996), this is perhaps a more plausible explanation than the first hypothesis.
3.61 Various mitigation measures have been proposed to limit further infestation.
These include:
1) Fixing a floater to the suction end of the treadle pump so that pumping takes place as close to the water surface as possible.
2) Leaving the gardens fallow. Since many weeds are nematode hosts, even under fallow conditions proper weed control is necessary. However, with such control nematode densities can be reduced by 80 to 90% per annum.

318
3) The greatest reductions in nematodes are effectuated on moist bare land. Sowing or planting late enough after tillage, to exhaust initial populations by starvation, can reduce the larvae hatch at soil temperatures above 8oC.
4) Crop rotation helps keep the nematode populations below damaging levels. It is important to rotate with crops that are non-hosts such as cereals and grasses. Rotation with crops such as maize, rape and cabbage is useful. At Katuba Sun-hemp and lemon grass have been planted to mitigate the nematode problem. However a cost benefit analysis revealed that it was not profitable for the small-holder farmers to grow sun-hemp profitably.
5) Generation of humus-mulching, composting, manure dropping, in the soil introduces organisms, such as Pasteuna penetrans Bacillus, that attack the nematodes. To be successful, such practices must be continued for a period of approximately three years. Most Katuba farmers consider composting a very labor-intensive activity and consequently it is not used commonly. Composting also requires a large amount of water when turning the heap. Farmers are advised to compost in-situ.
6) Nematicides can be used but the costs are too high for treadle pump farmers. Some of the farmers apply Termik, a pesticide banned in some other countries, as a soil fumigant. It is effective for control of termites and leaf minor but is a highly potent substance that can pollute water in the streams. Recent water quality tests indicate that currently termik is absent from the wells and streams.
IMPACTS ON FLORA AND FAUNA 3.62 Conversion of dambos to cultivation invariably has impacts for flora and fauna,
both directly and indirectly as consequence of changing habitat. The extent of the impact is dependent on the scale of the project, the nature of alterations, previous land-use and local biota. Compared to uplands, wetlands are characterized by high primary productivity and a multiplicity of habitats that enables them to support a large diversity of life. Consequently, the impacts arising from agriculture, particularly in arid and semi-arid areas, can have a disproportionately large impact on flora and fauna.
3.63 In a previous study, aerial photographs taken at time intervals of ten to sixteen
years were compared with ground truth information derived from transect walks at Fikolwa and Mudobo dambos in Southern and Central provinces (Daka, 1998). Evaluated changes in land cover were confirmed by interviews of key-informants (Table 4). Environmental impacts are highlighted in terms of vegetation changes, settlements, dambo cultivation and desiccation (reduction in wetness). The analyzes showed that at Fikolwa wetland catchment forest reduced at a rate of 3.3% from 750 ha in 1967 to 325 ha and 225 ha respectively in 1983 and 1993. Similarly, the rate of deforestation at Mudobo was determined to be 2% per annum. At this wetland, forest cover declined from 500 ha in 1970, to 400 ha and 325 ha in 1980 and 1991 respectively. Interviews from both wetlands indicated that increased utilization of wetlands for crop production had resulted in people
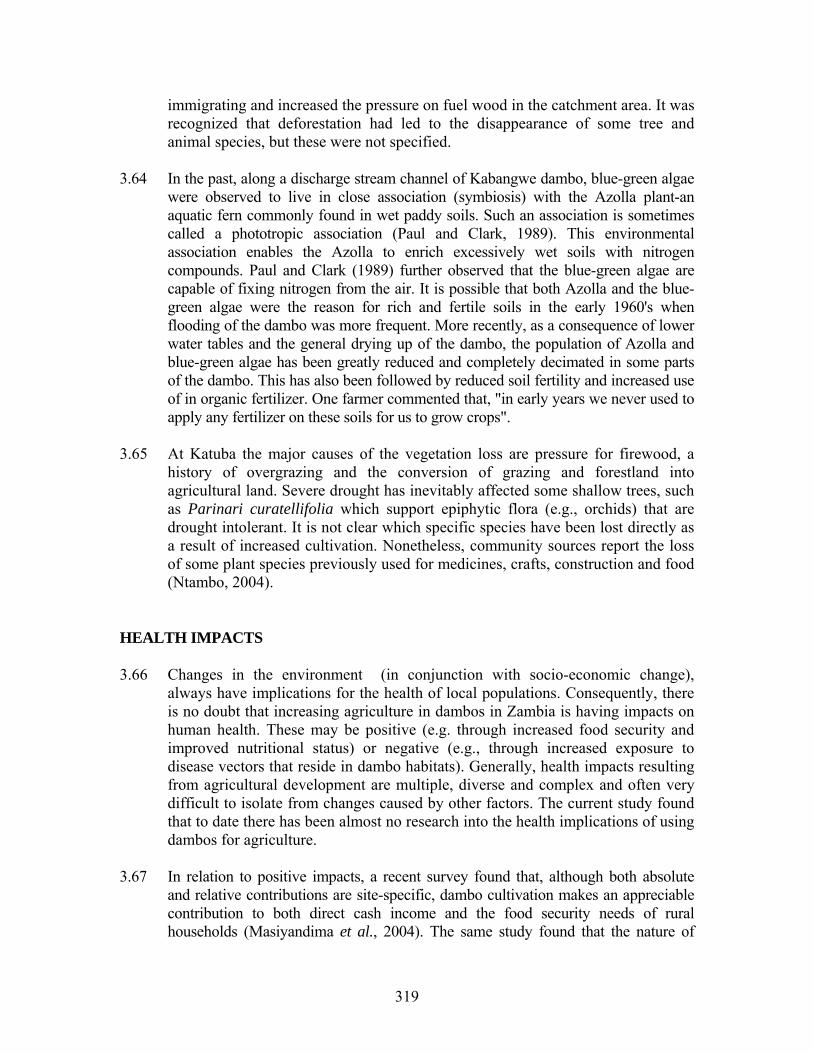
319
immigrating and increased the pressure on fuel wood in the catchment area. It was recognized that deforestation had led to the disappearance of some tree and animal species, but these were not specified.
3.64 In the past, along a discharge stream channel of Kabangwe dambo, blue-green algae
were observed to live in close association (symbiosis) with the Azolla plant-an aquatic fern commonly found in wet paddy soils. Such an association is sometimes called a phototropic association (Paul and Clark, 1989). This environmental association enables the Azolla to enrich excessively wet soils with nitrogen compounds. Paul and Clark (1989) further observed that the blue-green algae are capable of fixing nitrogen from the air. It is possible that both Azolla and the blue-green algae were the reason for rich and fertile soils in the early 1960's when flooding of the dambo was more frequent. More recently, as a consequence of lower water tables and the general drying up of the dambo, the population of Azolla and blue-green algae has been greatly reduced and completely decimated in some parts of the dambo. This has also been followed by reduced soil fertility and increased use of in organic fertilizer. One farmer commented that, "in early years we never used to apply any fertilizer on these soils for us to grow crops".
3.65 At Katuba the major causes of the vegetation loss are pressure for firewood, a
history of overgrazing and the conversion of grazing and forestland into agricultural land. Severe drought has inevitably affected some shallow trees, such as Parinari curatellifolia which support epiphytic flora (e.g., orchids) that are drought intolerant. It is not clear which specific species have been lost directly as a result of increased cultivation. Nonetheless, community sources report the loss of some plant species previously used for medicines, crafts, construction and food (Ntambo, 2004).
HEALTH IMPACTS 3.66 Changes in the environment (in conjunction with socio-economic change),
always have implications for the health of local populations. Consequently, there is no doubt that increasing agriculture in dambos in Zambia is having impacts on human health. These may be positive (e.g. through increased food security and improved nutritional status) or negative (e.g., through increased exposure to disease vectors that reside in dambo habitats). Generally, health impacts resulting from agricultural development are multiple, diverse and complex and often very difficult to isolate from changes caused by other factors. The current study found that to date there has been almost no research into the health implications of using dambos for agriculture.
3.67 In relation to positive impacts, a recent survey found that, although both absolute
and relative contributions are site-specific, dambo cultivation makes an appreciable contribution to both direct cash income and the food security needs of rural households (Masiyandima et al., 2004). The same study found that the nature of

320
household resource dependence and hence demands on wetland resources alters as households socio-economic status changes. Consequently, the health impacts are also likely to vary. Further research is required to determine the extent to which the benefits derived from dambo cultivation translate into health impacts.
DISEASES 3.68 Although difficult to link directly with dambo cultivation, the current study found
that dambo farmers are afflicted by a number of diseases that are potentially exacerbated by work in the dambo environment. These include malaria, diarrheal diseases (e.g., dysentery), rheumatic anthritis (a condition exacerbated by working in water) and pneumonia. These diseases were common among dambo users at Katuba and Kabangwe dambos.
3.69 At Katuba wetland, data obtained from a rural health centre, shows the occurrence
of pneumonia and diarrhea in children under five years old (Figures 3A-1 and 3A-2). Pneumonia incidences are greatest during the rainy season (i.e. November – April) when the wetland is saturated. Conversely, the number of diarrhea cases is greatest in the dry season (i.e. from May to October) when water is less available and many wells gradually dry up. Figure 3A-3, shows malaria incidence in all age groups. As with pneumonia in children under five years old (Figure 1) malaria incidence is greatest in the wet season, particularly the latter half (i.e. January to March) when the wetland is saturated.
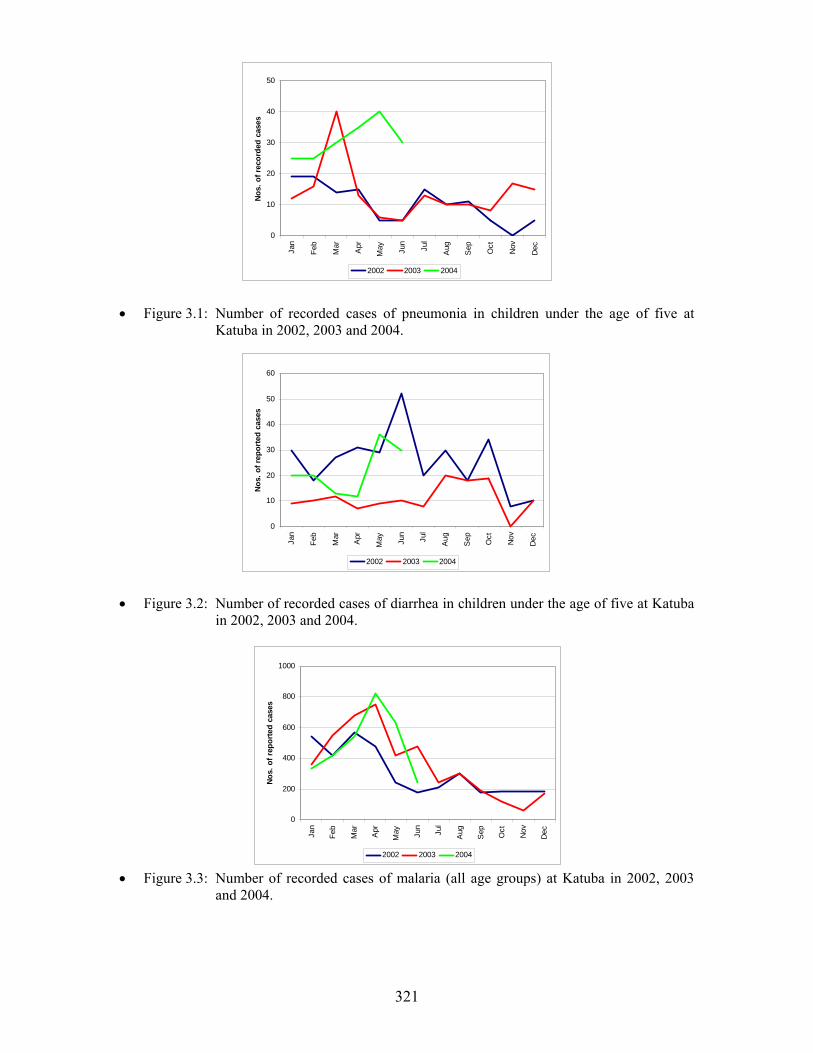
321
• Figure 3.1: Number of recorded cases of pneumonia in children under the age of five at
Katuba in 2002, 2003 and 2004.
• Figure 3.2: Number of recorded cases of diarrhea in children under the age of five at Katuba
in 2002, 2003 and 2004.
• Figure 3.3: Number of recorded cases of malaria (all age groups) at Katuba in 2002, 2003 and 2004.
0
10
20
30
40
50
60
Jan
Feb
Mar
Apr
May Ju
n
Jul
Aug
Sep Oct
Nov
Dec
Nos
. of r
epor
ted
case
s
2002 2003 2004
0
200
400
600
800
1000
Jan
Feb
Mar
Apr
May Ju
n
Jul
Aug
Sep Oct
Nov
Dec
Nos.
of r
epor
ted
case
s
2002 2003 2004
0
10
20
30
40
50
Jan
Feb
Mar
Apr
May Ju
n
Jul
Aug
Sep Oct
Nov
Dec
Nos
. of r
ecor
ded
case
s2002 2003 2004

322
3.70 At Katuba malaria incidence is believed to be exacerbated, by commercial sand mining close to the dambo, which results in pits that hold stagnant water and provide ideal breeding grounds for malaria. The specific impact of wetland cultivation on malaria cannot be isolated, from other factors, but farmers recognize that their exposure to mosquitoes is increased as a consequence of working in the wetland. Interestingly one farmer claimed that the use of a treadle pump reduced his exposure to mosquitoes because he no longer had to irrigate by hand. This meant he no longer had to keep dipping buckets in the shallow well where the mosquitoes breed, which disturbed them, and led to him being bitten.
3.71 Malaria and bilharzia were highlighted as major diseases at Kabangwe wetland
where snails were evident along a stream outlet channel from a dam. Cases of dysentery have also been reported during October and November when water sources dry up just before the onset of the rainy season. Farmers further highlighted general body fatigue/pain as a result of the labour required to till heavy wetland soils and the need to carry heavy watering buckets for irrigation. Farmers at Kabangwe dambo buy their drugs for malaria and painkillers at an agro-chemical shop called BURMA Pharmaceuticals.
EXPOSURE TO AGRO-CHEMICALS 3.72 The current study found that farmers are generally aware of the risks associated with
agro-chemical use. They mix pesticides in containers used solely for this purpose. These containers are hidden in their gardens after work and are never used at their homesteads. Furthermore, water for domestic use is drawn from different wells to those from which water is drawn for mixing chemicals. Domestic water is taken from wells located in the upper parts of the dambo, whereas that for pesticides is drawn from wells in the seepage zones where most gardens are located. However, it is not clear whether farmers working in their gardens ever drink water from the “agricultural” wells.
3.73 One potential hazard associated with chemical use is that because of the lack of
sprayers, sweeping brooms made from grass straw are used for “spraying” vegetables. These are dipped in water mixed with the pesticide and then vegetables are hand sprayed by “wagging” the sweeping broom. The risks associated with this practice are recognized. This type of spraying is undertaken only by men, because women often carry babies on their backs and farmers do not want their children inhaling the chemicals.
3.74 At Kabangwe all farmers use gloves and mouth masks when spraying agro-
chemicals. To date, there is no record of direct health problems ever having arisen as a result of pollution of ground or surface water or direct ingestion of chemicals (e.g., on vegetables) at this wetland site. However, no research has been conducted to verify that there have been no health impacts.

323
HIV/AIDS 3.75 Currently HIV/AIDS presents one of the biggest challenges to agricultural
production in sub-Saharan Africa. HIV/AIDS affects family labour, the most productive resource that poor people have, and HIV/AIDS-induced morbidity and mortality threatens household demography and productive capacity (IFAD, 2004). The household loses young adult on- and off-farm labour, practices and skills and are unable to meet high-peak seasonal labour demands. According to a FAO report, HIV/AIDS is responsible for the decimation of skilled and unskilled agricultural labour. It has taken the lives of about seven million agricultural workers in sub-Saharan Africa to date and could claim an additional 16 million (up to 26% of the agricultural labour force) by 2020 (IFAD, 2004).
3.76 In some countries the loss of indigenous farming methods, inter-generational
knowledge, and specialized skills and practices has been attributed to AIDS. In East Africa, farming practices essential to the survival of the coffee-banana farming system, such as mulching, weeding and pruning, are being neglected or abandoned in high HIV/AIDS prevalence areas. Evidence from two districts of Kenya further suggests that the transfer of agricultural knowledge from parents to children is being severely undermined as reflected in the low level of agricultural knowledge among orphan-headed households (IFAD, 2004). In Zimbabwe, for instance, before the recent political turmoil, agricultural output from communal areas fell by a staggering 50%, largely due to HIV/AIDS, according to a 1997 report (IFAD, 2004).
3.77 Although no detailed records are available, HIV/AIDS prevalence is high at both
Katuba and Kabangwe dambos. Further research is required to determine the link between dambo cultivation and HIV/AIDS. However, it was reported that women who sell vegetables grown in the dambo and travel to Lusaka to sell them, fall prey to some marketers who will only agree to sell the vegetables on behalf of the women in exchange for sex. Similarly, it was reported that amongst women who travel to the dambos to purchase vegetables some are so desperate that they offer the farmers sex in exchange for produce.
3.78 Treadle pump operation in dambos is highly dependent on family labour. Often
labour is provided by young women and girls, but this is the group at highest risk of infection. However, irrigation with treadle pumps is less labour intensive than watering with buckets so in some circumstances treadle pumps could be used as part of strategies to cope with HIV/AIDS. IDE has recently developed, and promoted, low-cost drip irrigation systems that can be used in conjunction with treadle pumps. These reduce irrigation labour requirements by over 50%. Conversely, if productivity in households is reduced, they will be less able to afford treadle pumps. Consequently, the overall impact of the epidemic on treadle pump use cannot be foreseen at present.
324
CONCLUSIONS AND RECOMMENDATIONS 3.79 Wetlands are some of the most productive natural ecosystems in Zambia. Dambos
present the opportunity to support a range of livelihoods through agriculture, livestock, fish, wild products, building materials etc. Their importance for a particular livelihood will vary according to a households social and economic position, inter and intra seasonal climatic variations and the macro policy environment. The value of dambos therefore, is that they add diversity and increase the possibility of different livelihoods and combinations of livelihoods. They are an integral part of the landscape utilization patterns. This diversity is expressed spatially, (e.g., through activities taking place in different parts of the landscape); temporally (e.g., seasonal/inter annually) and socially (i.e., across different stakeholders). By recognizing this diversity and building on it, it is possible to enhance the range of livelihood options for rural households.
3.80 In relation to the environment and health impacts of dambo cultivation, the current
study enables the following conclusions to be drawn:
1. Cultivation and grazing are economically important activities in dambos and support the livelihoods of many rural communities throughout Zambia. However dambos also provide other livelihood benefits such as vegetation for construction and plants used for medicinal purposes. They are also an important habitat for a variety of flora and fauna.
2. In general, throughout Zambia, there is an upward trend in the use of dambos
for agricultural activities. There are a number of socio-economic and natural drivers causing this change, but key among them are the liberalized macro-economic conditions and the frequent occurrence of drought in recent years.
3. Land use practices in dambo utilization, provide livelihood options such as
food production, but can also be detrimental to environmental sustainability. Furthermore, there is no doubt that environmental changes resulting from agricultural use impact the health of communities utilizing dambos. However, to date very little research has specifically addressed the health and environmental implications of dambo utilization.
4. The general perception among small-scale farmers using dambos in Zambia
is that they have utilized dambos sustainably for several decades. Generally the impacts of smallholder use are widely perceived to be minimal. However, the implications of scaling-up dambo utilization are not clear.
5. Currently there is no evidence of dambos being ruthlessly overexploited.
Nonetheless, there is evidence of adverse environmental impacts arising from dambo agriculture. However, as with large irrigation schemes, where small incremental changes often go un-noticed until their impact begins to have a
325
serious effect on production, it seems that currently these impacts are widely disregarded. The risk is that they will be neglected to the point where, in future, dambo productivity is undermined and it is not possible to rehabilitate the ecosystems.
6. Research into appropriate cultivation practices that will ensure the
environmental sustainability of dambos should be encouraged and supported. Important areas of focus include the use of organic fertilizers (green manuring), organic chemicals for pest and plant disease control and ascertaining the environmental implications of using of water lifting devices, such as treadle pumps.
7. Insufficient research has been undertaken to ascertain the overall impact of
dambo agriculture on the health of rural communities. Some adverse impacts are probable but it is difficult to isolate these from the numerous other factors affecting the health of communities. Of particular concern is HIV/AIDS. Research on the inter-linkages between HIV/AIDS and smallholder dambo utilization and irrigation should be conducted.
8. Institutionally, the capacity of government departments to deal effectively
with wetland issues in Zambia is limited. There is need for collaboration with local and international experts and NGOs to effectively deal with the task of developing and disseminating technologies for sustainable utilization of wetlands.
9. Present environmental policies and legislation in Zambia, fail to provide
safeguards to protect dambos from potentially negative environmental impacts arising from smallholder use for cultivation. Most smallholder activities, including those promoted by many NGOs, by-pass strategies intended to protect the environment. It is difficult to see how current environmental assessment procedures can be modified to incorporate smallholder use of dambos, in a way that is both pragmatic and economically viable. However, there is need to amend and harmonize various pieces of environmental legislation to more fully incorporate dambos. Enactment of the current draft wetland policy should be speeded up.
10. Realistically, the only policies that will be successful are those that empower
local people to manage and control the dambos in their own landscape. The aim should be to provide an enabling framework that will both conserve and encourage the sustainable use of wetlands. The challenge is to find how self-regulating and self-enforcing incentives for sustainable management can be implemented.
326
REFERENCES ARPT-WP (Adaptive Research Planning Team - Western Province), 1988. Annual
Report 1988/89, Mongu, Zambia. Asscheman, E., Bokx, J.A., Brinkman, H., Bus, C.B., Hotsma, P.H., Meijers, C.P.,
Mulder, A., Scholte, K., Turkensteen, L.J., Wusten, R. and Van der Zaag, D.E. 1996. Potato Diseases-Diseases, Pests and Defects. Co-published -NIVAA, Netherlands and Aardappelwereld, Netherlands.
Banda D.J., 2004. Major soils of Eastern, Central, Lusaka, Copperbelt and Southern
Provinces of Zambia. Department of Soil Sciences, School of Agricultural Sciences, University of Zambia. Zambia
Bell, M., Faulkner, R., Hotchkiss, P., Lambert, R., Roberts, N. and Windram, A. 1987.
The use of dambos in rural development, with reference to Zimbabwe. Loughborough University and University of Zimbabwe. Final report to ODA. 235 pp.
Bullock, A. 1992. The role of dambos in determining river flow regimes in Zimbabwe. J.
Hydrol. 134, 349-372. Daka, A.E and Gondwe, P. 1998. Analysis of Dambo studies in Zambia and design of a
monitoring study arising from their implications and applications of lessons learnt; their relevance to sustainable utilization and assessment for Dambo management practices. Report to FAO. 42 pp.
Daka, A.E. and Kokwe, M. 1996. Dambo utilization in Luapula: an assessment of soil
fertility and improvement (SOFI) sub-component under the Luapula Livelihood Food Security Programme (LLFSP/FINNAGRO-FINLAND).Mansa,Zambia. 42pp.
Daka, A.E. 1988. Socio-Economic Impact of the use of Dambos, Their Long-term Land
Use Changes and Classification in the SIWUP/SPFS Pilot Areas in Zambia. A CONSULTANCY Report for FAO- on a Smallholder Irrigation and Water Use Programme (SIWUP)/ Special Programme for Food Security (SPFS).Lusaka.59 pp.
Dougnac, M. 1986. Dry Season Cropping. Two years of experimental work on Dambos in
Luapula Province. Research Branch , Ministry of Agriculture, Mansa, Zambia. Environmental Council of Zambia (ECZ), undated. Zambia Wetlands Programme:
National Strategy and Action Plan. Ministry of Environment and Natural Resources, Government of the Republic of Zambia.
Environmental Council of Zambia (ECZ), 2000. National Policy on Wetlands
Conservation. Ministry of Environment and Natural Resources, Government of the Republic of Zambia.

327
Erne,K.1970. Herbicides in the Swedish Environment. Statens Veternarmedcinska
Anstalt,Stockholm, Sweden.11pp. Faulkner, R.D. and Lambert, R.A. 1991. The effect of irrigation on dambo hydrology: a
case study. J. Hydrol. 123, 147-161. Ferreira, R.E.C. 1981. Ecological aspects of rice production in Dambos in Luapula
Province. Research Memorandum No. 29. Research Branch, Ministry of Agriculture, Zambia.
Ferreira, R. 1977. Dambos: their agricultural potential. Part 4. Cattle grazings. Farmings
in Zambia II, 1-2. Ferreira, R.E.C.1974. Dambos: their agricultural potential, part 1- general comments.
Farming in Zambia, October 1975. FSRT (Farming Systems Research Team), 1994. An informal survey of Southern
Province. FSRT, Research Branch Branch, Ministry of Agriculture, Zambia. Grant, P.M. 1995. The fertility of dambo soils and the related response of maize to
fertilizers and manure. In Owen, R. Verbeek, K., Jackson, J. and Steenhuis T. (editors) Dambo Farming in Zimbabwe: water management, cropping and soil potentials for smallholder farming in the wetlands. University of Zimbabwe Publications, Harare, 1-8.
IFAD, 2004. Strategy Paper on HIV-AIDS for East and Southern Africa. Accessed
August 20th 2004. --- Give website IFAD,2001. Strategy Paper on HIV/AIDS For East and Southern Africa.Rome, Italy.63pp. Ingram, J. 1992. Wetlands in drylands: the agroecology of savanna systems in Africa.
Part 2: soil and water processes. Report of the International Institute for Environment and Development 69 pp.
Kanthack, F.E. 1945. Relationships between rainfall and runoff in central southern
Africa. Proc. S. Afr. Soc. of Civil Engin. 43, 29-48. Kokwe,M. and Daka,A.E. 1995. Review of wetland Development in Zambia. A
consultancy Report for FAO:Lusaka.PP85. Mackel, R. 1974. Dambos. A study in morphodynamic activity on the plateau regions of
Zambia. Catena 1, 327-365.
328
Masiyandima, M., McCartney, M.P. and van Koppen, B. 2004. Wetland contributions to livelihoods in Zambia. FAO Field Report: FAO-Netherlands Partnership Programme on Sustainable Development and Management of Wetlands.
Matsumoto and Sakaide.1993. Diversification of land use for food security: A case of
dambo use in Central province. Kabwe, Zambia.11pp. McCartney, M.P., Boelee, E., Cofie, O., Amerasinghe, F. and Mutero, C. 2004. Planning
and management to improve the benefits and reduce the environmental and health costs of agricultural water development in sub-Saharan Africa: desk review. Report to the African Development Bank.
McCartney, M.P., Daka, A.E. and Laker, M.C. 2001. Water abstraction from dambos
using treadle pumps. 27th WEDC conference: People and systems for water, sanitation and health. Lusaka, Zambia, 2001. 465-468.
McCartney, M.P. 1998. The hydrology of a headwater catchment containing a dambo.
Unpublishd PhD thesis, University of Reading. 266 pp + appendices. McFarlane, M.J and Whitlow, R. 1990. Key factors affecting the initiation and progress
of gulleying in dambos in parts of Zimbabwe and Malawi. Land Degradation and Rehabilitation 2, 215-235.
Ministry of Agriculture and Co-operatives (MACO). 2004. Irrigation policy review and
strategy – 2003: final draft. McCartney, M.P., Daka A.E. and Phiri, G. 1998. Design of an Environmental Monitoring
Programme for Dambos in Zambia. A Smallholder Irrigation Water Use Programme. A Consultancy Report for FAO. PP35. Lusaka, Zambia.
Mukanda, N. 1998. Wetland classification for agricultural development in Eastern and
Southern Africa: the Zambian case In: Wetland characterization and classification for sustainable agricultural development. Proceedings of sub-regional consultation, Harare, Zimbabwe – FAO, Harare, Zimbabwe.
Ntambo, I. 2004. FNPP study: Sustainable development and management of wetlands.
Katuba Case Study. Report to International Water Management Institute. Paul, E.A., and F.E. Clark. 1989. Soil micro-biology and biochemistry, Academic Press Inc.,
San Diego, CA. Perera, N.P. 1982. The ecology of wetlands (dambos) of Zambia, and their evaluation for
agriculture - a model for the management of wetlands in sub-humid eastern and southern Africa. Inter. J. Ecol. and Environ. Sci. 8, 27-38.
Poverty Reduction Strategy Paper, 2002.
329
Priestley, M.J.S.W and Greening, P. 1956. Ngoni land utilisation survey 1954-1955.
Government Printer, Lusaka, Zambia. Ramsar Convention Bureau, 2002. Resolution VIII.34: Agriculture, wetlands and water
resource mangement. 8th Meeting of the Conference of Contracting Parties to the Convention on Wetlands. Valencia, Spain, 18-26, November 2002.
Rattray, J.M., Cormack, R.M.M. and Staples, R.R. 1953. The vlei areas of S. Rhodesia
and their uses, Rhod. Agric J. 50, 465-483. Raussen, T., Daka, A.E. and Bangwe, L.1996. Agroecology and use of Dambos on the
Eastern Zambian Plateau. Report of a field study. Journal of Applied Irrigation Science 31(2), 183-206. Germany.
Raussen, T., Kolwe, M. and Daka, A.E., 1998. Dambo Irrigation; An Integral Component
Of Small-scale farming systems in Southern Africa. Journal of Applied Irrigation Science 33(2), 183-206. Germany.
Robinson, M. 1990. Impact of improved land drainage on river flows. Institute of
Hydrology Report No. 113. Wallingford. Rogg, H. 1993. Dambo utilization survey on the Southern Districts of North-western
Province. ARPT - North-western Province. IRDP, Kabompo, Zambia. Scoones, I. 1991. Wetlands in drylands: the agroecology of savanna systems in Africa.
Part 1: Overview - ecological, economic and social issues. Report of the International Institute for Environment and Development 114 pp.
Thompson, J.G. 1969. The classification and cultivation of wetland and vleis.
Unpublished paper, Ministry of Agriculture, Harare. Turner, B. 1986. The importance of dambos in African agriculture. Land Use Policy,
3(4). Land use in Africa. Butterworth Scientific, Guildford UK, 343-347. USAID, 2002. Environmental Review of the Rural Group Business Programme (RGBP).
Lusaka. Whitlow, J.R. 1992. Gullying within wetlands in Zimbabwe: an examination of
conservation history and spatial patterns. S. Afr. Geog. J. 74, 54-62.

330
Appendix 3.1: List of Interviews conducted Name Position Mr. Rob Munro Project manager of CLUSA, Zambia Mr. George Phiri Head of AfDB small-scale irrigation project, Zambia Mr. Chris Mswaile World Wide Fund for Nature, Zambia Mr. Nyambe Nalumino World Wide Fund for Nature, Zambia Mr. Dong Qinsong FAO representative, Zambia Mr. Wiggan Kanchela Zambia Agribusiness Technical Assistance Centre (ZATAC) Mr. Mlotha Damaseke Agriculture and Natural Resources, USAID Mr. Brian Nkandu Inspector, Environmental Impact Assessment, Environmental
Council of Zambia Dr. Yerokun School of Agricultural Sciences, University of Zambia Mrs. Malekano Farmer at Katuba dambo Mr. Noah Phiri Farmer at Katuba dambo Mr. Shadrick Phiri Farmer at Katuba dambo Mr. Sakula Farmer at Katuba dambo Mr. Andy Chibuye Water Development Board, Ministry of Water and Energy Mr. Limbusha Clinical officer at Kayosha Maternity Clinic, Katuba Dr. Siame Chief Natural Resource Management Officer at Ministry of
Tourism, Environment and Natural Resources Dr. Justine Kangwe University Teaching Hospital Professor Siziya University of Zambia, School of Medicine Ombe William Farmer at Kabangwe wetland Charles Kazembe Farmer at Kabangwe wetland Mwape Likando Farmer at Kabangwe wetland Brian Likando Farmer at Kabangwe wetland Frank Likando Farmer at Kabangwe wetland

331
Case Study 3.2
Environmental and Health Assessment of small reservoirs in Burkina Faso
André Koné1 and Eline Boelee2 1 Health Geographer, Ouagadougou, Burkina Faso 2 International Water Management Institute, Addis Ababa, Ethiopia

332
SYNTHESIS
381 This case study was conducted to determine the health impacts of small dams in Burkina Faso. Small earth dams have been increasingly promoted in several West-African countries since the 1980s but the environmental and health impacts resulting from this type of intervention are not well researched. However, some secondary information turned out to be available in “grey” literature such as students’ theses. Data from different sources have been combined into national maps and synthesized for small reservoirs in different climatic zones. Some of the key findings from the study are:
1) In Burkina Faso, around 1500 small dams have been constructed, most of these since
1974, to provide water to people and livestock in drought-prone areas. In the drier parts of the country, these reservoirs are still mainly used for watering livestock, sometimes leading to heavy local population pressure. In other areas the water is increasingly used for irrigation of vegetables. A new government strategy initiated in 2002 foresees the construction of more dams and 20,000 hectares of new village irrigation systems.
2) In many places, the creation of small reservoirs in Burkina Faso has resulted in
increased household income through productive agricultural activities upstream and downstream of the dam. However, in almost all cases no preventive measures were taken to ensure that the small reservoirs do not have adverse environmental and health impacts.
3) Significant environmental degradation can occur in the vicinity of small dams as
result of increased pressure from people and livestock arising as a direct result of improved water resources. Pollution and sedimentation of small reservoirs can occur as a consequence of inappropriate land-use practices and poor catchment management.
4) The water related diseases most directly linked to the construction of small dams are
schistosomiasis and malaria. For schistosomiasis, some field studies found increased transmission after implementation of the dam, especially in the semi-arid north, where the reservoirs provided perennial water bodies in an area where previously the intermediate snail host depended on temporary pools. Human behavior regarding water use and hygiene however is more important than the presence of snails as a determinant of transmission. For malaria the link is even more complicated as mosquitoes hardly breed in the reservoir itself and an increase in vector mosquitoes does not necessarily lead to increased malaria transmission.
5) Knowledge of water related diseases, including causes and avoidance measures, is
low in Burkina Faso. Public awareness campaigns are necessary to explain to communities the possible impacts of dams and irrigated agriculture on their health. This should be done even before the promotion of preventive and curative measures against the water-related diseases. Alternative water sources for domestic supply
333
should be developed if possible.
6) The reduction of the negative impacts of small dams on the environment and public health requires an integrated approach that specifically identifies the enhancing and limiting factors that influence environmental impacts and the transmission of diseases in the dam environment. It is only from a good knowledge of the risks that effective environmental management and disease control programs can be developed in a way that fits with regional strategies for poverty eradication and sustainable development.

334
LIST OF ABBREVIATIONS AMVS Development agency for Sourou (Autorité de la Mise en Valeur du
Sourou) CNLP National center for malaria control (Centre National de Lutte contre le
Paludisme) CNRFP National research and education center on malaria (Centre National de
Recherche et de Formation sur le Paludisme) CRPA Regional center for agro-pastoral production (Centre Régional de
Production Agropastorale) FAO Food and Agricultural Organization of the United Nations FEER Water and rural engineering fund (Fond de l’Eau et de l’Equipement
Rural) GNP Gross National Product IRD Institute of Development Research (Institut de Recherche pour le
Développement), previously known as ORSTOM MOB Bagré works control agency (Maîtrise d’Ouvrage de Bagré) NGO Non-Governmental Organization OCCGE Organization for coordination and cooperation in the fight against large
endemics (Organisation pour la coordination, la coopération dans la lutte contre les grandes endémies) of the Muraz Center in Bobo-Dioulasso.
OCP Onchocerciasis Control Program ONBAH National office for dams and irrigation schemes (Office national des
barrages et aménagements hydro agricoles) WHO World Health Organization

335
Table of Contents Page INTRODUCTION 336 Health impacts 336 Small Dams in Burkina Faso 338 Water resources 338 Water resources development 340 Water Policy 342 Characteristics of small dams 343 Health Impacts of Small Dams in Burkina Faso 345 Environmental impacts 345 Schistosomiasis 346 Geographical distribution of schistosomiasis 346 Small Dams, Snails and Schistosomiasis 349 Malaria 352 Geographical Distribution of Malaria 352 Small Dams, Mosquitoes and Malaria 353 Other vector-borne diseases 355 Drinking from the dams and water-borne diseases 356 Nutritional impacts 358 Discussion and Conclusion 359 Schistosomiasis control 359 Malaria control 360 Corrective and preventive action at small dams 362 Health education 362 Integrated Management of Small Dams 363 References 364
336
INTRODUCTION: SMALL RESERVOIRS IN WEST AFRICA 3.82 The West-African landscape is marked by the presence of multiple small water
reservoirs for irrigation, livestock watering, flood protection, groundwater recharge and for human consumption. Storage of surface flow that concentrates in the inland valleys during the rainy season became a traditional and simple technique used widely in rural areas with important water deficits. The majority of the existing small reservoirs is located between the Sahel zone where annual rainfall is less than 400mm and the wetland with less than 1200 mm per year. In the sahelian countries like Burkina Faso, Niger and Mali, the purpose of implementing these small dams was mainly to resolve the water needs for people and cattle located in the arid areas.
3.83 The majority of the small dams were implemented after 1980. Their number
varies significantly over the three countries, with an estimated 1500 in Burkina Faso, more than one thousand in Mali and some twenty in Niger. All are localized in areas with high population density, e.g. in Burkina Faso most of the small reservoirs are found in the Nakambé basin where population densities can reach 100 inhabitants per square kilometer. Elsewhere the reservoirs have attracted people and thus contributed to human packing as it is the case in the Dogon region in Mali (Morin 1990).
3.84 In the southern parts of West Africa, where annual rainfall is everywhere more
than 1000 mm, the presence of the small dams is not justified by climatic constraints as it is the case in the sahelien areas. In Côte d’Ivoire for example where one counts nowadays nearly 300 small dams in the north and the center of the country, the implementation of the water reservoirs had different objectives: water provision for livestock (269 dams) and irrigation (19 dams), according to Le Guen (2000). The construction of small dams started here in the 1970s following the successful control of onchocerciasis (river blindness) that previously infested the inland valleys. Now the valleys could be developed for rice irrigation (Cecchi 1998; Le Guen 2000). Since the 1980s the demand from pastoralists for watering points increased tremendously after droughts in 1973/74 and 1982, which had considerably reduced the available sources of water as well as the pastures in the Sahel countries. An additional motive for investing in water for livestock was the desire to fix the migrating pastoralists of neighboring countries in Côte d’Ivoire and thereby reduce the costs of meat importation (Le Guen 2000).
HEALTH IMPACTS 3.85 The small perennial or temporary reservoirs create new ecosystems in previously
(semi) arid zones, where the presence of surface water is a new fact. The establishment of small dams is accompanied by important modification of the local environment and changed behavior of the benefiting population. Together these factors may support the development of water-related diseases and lead to
337
higher levels of endemics or even cause epidemics. Agents of disease (e.g. bacteria, protozoa, viruses, algae) as well as transmitting insects or intermediate hosts (e.g. mosquitoes, snails, flies) may develop in the water bodies while people may get infected through ingestion, by water-skin contact, by mosquito bite or even by inhalation. In West Africa the main diseases associated with the implementation of the small reservoirs are schistosomiasis, malaria and diarrhea.
3.86 The development of schistosomiasis around the small reservoirs is an indicator of
the relation the human population maintains with this water resource since its transmission occurs through water-related activities of a domestic (e.g. bathing, laundry) or productive (e.g. irrigation, fishing) nature. Though there are few detailed studies available, spread of this disease was announced everywhere in West Africa with small dam development. The new seasonal or perennial water bodies provide spatial and temporal refuges for the intermediate host snails that previously were confined to ponds and temporary rivers in the rainy season.
3.87 In Mali a strong prevalence of Schistosoma haematobium infection (urinary
schistosomiasis) is found in the Dogon country where many small dams were created for horticulture. This production activity caused important concentrations of people around these reservoirs leading to their over-exploitation, much water contact and subsequent high infections rates (Morin, 1990). The same impacts of the small dams on the development of schistosomiasis were described in Burkina Faso (CEGET 1983; Poda 1985, 1996; Poda et al. 2001, 2003; Poda and Traoré 2000). With a national prevalence of almost 30%, some pockets with high endemicity generally appear in the zones where small dams were established. In the wetlands in the north of Côte d’Ivoire, the development of schistosomiasis in relation to small dams was mentioned as well (Le Guen 2000).
3.88 Irrigation schemes downstream of the small dams may constitute favorable
biotopes for the development of the Anopheles mosquito, which can be a vector of malaria. However, this does not always lead to increased transmission of malaria, depending on climatic and anthropogenic factors (Henry et al. 2000). In the irrigated plain of Banzon on the river Mouhoun, mosquito aggression is definitely higher than that of the savanna zone without irrigation (Koné 1992; Tia et al. 1992). In the drier sahelian zones where transmission is primarily seasonal, the few rare studies indicate that malaria could grow to epidemic proportions after the establishment of a water reservoir and irrigation system (CNLP-press 1998).
3.89 In the Sahel, the availability of drinking water in sufficient quantities throughout
the year is still very low. Hence many people depend on water from the small reservoirs, though this is rarely suitable for consumption. As a result, diarrhea still constitutes one of the major causes of mortality among children in rural areas, especially where part of the drinking water comes from the reservoirs (Lorenzi and Volta 1987; Duboz et al. 1987, 1988).

338
3.90 Many detailed studies on the impact of small reservoirs on human health were carried out in Burkina Faso during the last thirty years. Most of the results have not been published formally and are not available in English. This synthesis of results will make it possible to measure the consequences of the local environmental modifications induced by these small dams and the resulting interactions between people and this new aquatic environment regarding risk of disease.
SMALL DAMS IN BURKINA FASO WATER RESOURCES 3.91 In Burkina Faso, a sahelian country in West Africa, climatic conditions are
unfavorable to the development of agriculture and livestock breeding that together represent more than two thirds of its domestic production. The agricultural sector employs nearly 90% of the population, mainly in the rural areas, and contributes 40% to the GNP. The total population was around 10.3 million inhabitants in 1996 with an annual growth of 2.7%. Spread over the land surface of 274,200 square kilometer the average population density is 38 inhabitants/km2 varying from 19 in the north to more than 70 in the central region. Usually three main climatic zones are distinguished (Table 3B-1). The rainfall is unequally distributed in time and space; primarily concentrated in three months in the sahelian zone and spread over six to seven months in the southern part of the Sudanese zone (see also Figure 5 for a map of the zones).
Table 3.1: Main climatic zones in Burkina Faso
Name Annual rainfall Temperatures (low in January and high in April)
Sahelian zone < 600 mm 10 – 40 °C North-Sudanese zone 600 – 1000 mm 13 – 38 °C Sudanese zone (South-West)
> 1000 mm 12 – 38 °C
3.92 The water resources of the country can be divided into three large basins and a
smaller fourth (Figure 3B-1), which will be discussed in detail below and summarized in Table 3B-2.
Comoé basin
3.93 With a surface 18,326 square kilometers this basin covers 7% of the territory surface. It is located in the Sudanese climatic zone with tropical characteristics and two well-marked seasons: a dry season from November to June and a rainy one July to October. Annual rainfall varies from 1100 to 1300 mm. The basin is drained by the Léraba (5,024 km2) and Comoé (9,800 km2) rivers which are perennial and three temporary rivers Kodoum (1,117 km2), Baoué (1,555 km2)
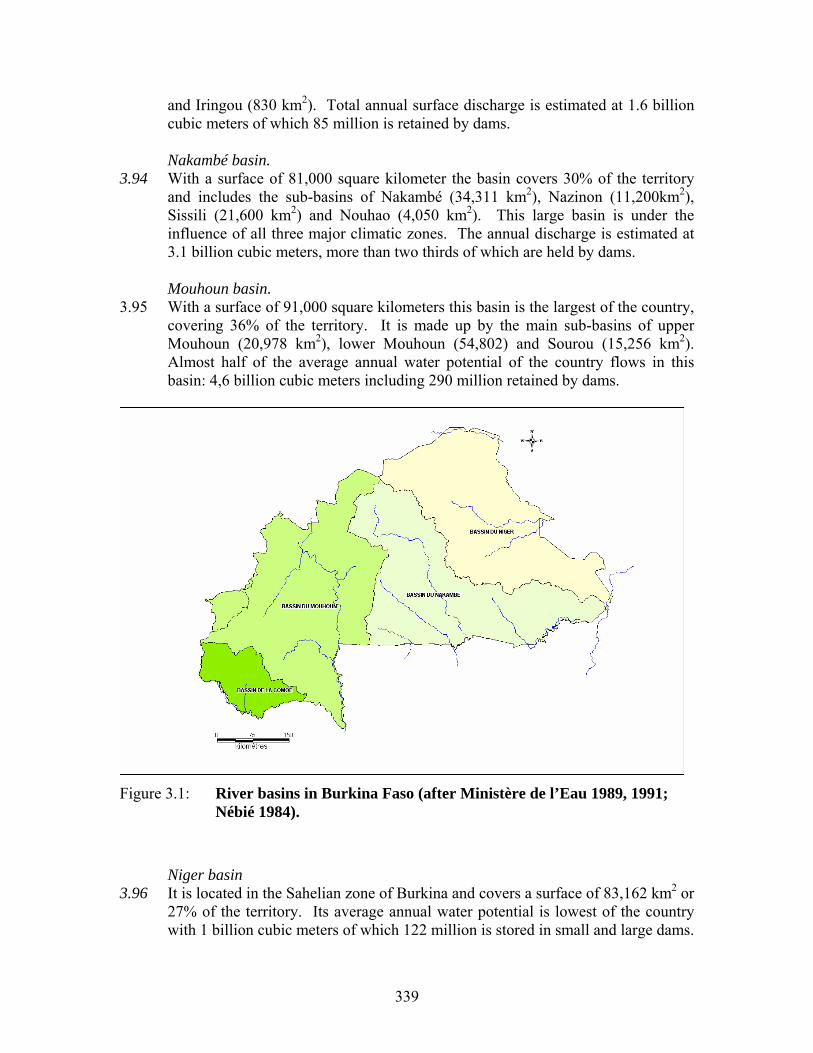
339
and Iringou (830 km2). Total annual surface discharge is estimated at 1.6 billion cubic meters of which 85 million is retained by dams.
Nakambé basin.
3.94 With a surface of 81,000 square kilometer the basin covers 30% of the territory and includes the sub-basins of Nakambé (34,311 km2), Nazinon (11,200km2), Sissili (21,600 km2) and Nouhao (4,050 km2). This large basin is under the influence of all three major climatic zones. The annual discharge is estimated at 3.1 billion cubic meters, more than two thirds of which are held by dams.
Mouhoun basin.
3.95 With a surface of 91,000 square kilometers this basin is the largest of the country, covering 36% of the territory. It is made up by the main sub-basins of upper Mouhoun (20,978 km2), lower Mouhoun (54,802) and Sourou (15,256 km2). Almost half of the average annual water potential of the country flows in this basin: 4,6 billion cubic meters including 290 million retained by dams.
Figure 3.1: River basins in Burkina Faso (after Ministère de l’Eau 1989, 1991;
Nébié 1984).
Niger basin 3.96 It is located in the Sahelian zone of Burkina and covers a surface of 83,162 km2 or
27% of the territory. Its average annual water potential is lowest of the country with 1 billion cubic meters of which 122 million is stored in small and large dams.
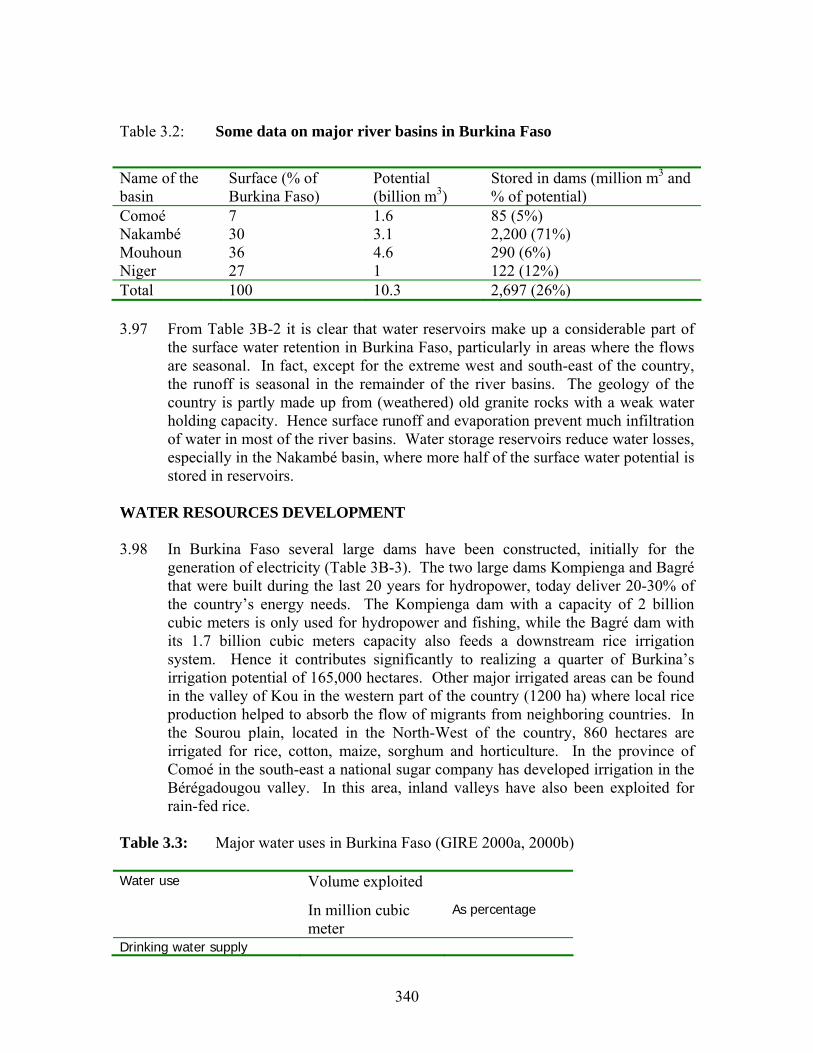
340
Table 3.2: Some data on major river basins in Burkina Faso
Name of the basin
Surface (% of Burkina Faso)
Potential (billion m3)
Stored in dams (million m3 and % of potential)
Comoé 7 1.6 85 (5%) Nakambé 30 3.1 2,200 (71%) Mouhoun 36 4.6 290 (6%) Niger 27 1 122 (12%) Total 100 10.3 2,697 (26%) 3.97 From Table 3B-2 it is clear that water reservoirs make up a considerable part of
the surface water retention in Burkina Faso, particularly in areas where the flows are seasonal. In fact, except for the extreme west and south-east of the country, the runoff is seasonal in the remainder of the river basins. The geology of the country is partly made up from (weathered) old granite rocks with a weak water holding capacity. Hence surface runoff and evaporation prevent much infiltration of water in most of the river basins. Water storage reservoirs reduce water losses, especially in the Nakambé basin, where more half of the surface water potential is stored in reservoirs.
WATER RESOURCES DEVELOPMENT 3.98 In Burkina Faso several large dams have been constructed, initially for the
generation of electricity (Table 3B-3). The two large dams Kompienga and Bagré that were built during the last 20 years for hydropower, today deliver 20-30% of the country’s energy needs. The Kompienga dam with a capacity of 2 billion cubic meters is only used for hydropower and fishing, while the Bagré dam with its 1.7 billion cubic meters capacity also feeds a downstream rice irrigation system. Hence it contributes significantly to realizing a quarter of Burkina’s irrigation potential of 165,000 hectares. Other major irrigated areas can be found in the valley of Kou in the western part of the country (1200 ha) where local rice production helped to absorb the flow of migrants from neighboring countries. In the Sourou plain, located in the North-West of the country, 860 hectares are irrigated for rice, cotton, maize, sorghum and horticulture. In the province of Comoé in the south-east a national sugar company has developed irrigation in the Bérégadougou valley. In this area, inland valleys have also been exploited for rain-fed rice.
Table 3.3: Major water uses in Burkina Faso (GIRE 2000a, 2000b)
Volume exploited Water use
In million cubic meter
As percentage
Drinking water supply

341
- Rural and semi-urban 90 4% - Urban 200 10% Irrigation 280 14% Livestock 75 5% Energy 1300 67% Total 1945 100% 3.99 The water requirements for irrigation are highest in the two basins of Comoé
(2000 m3/year/km2) and Mouhoun (1000 - 1900 m3/year/km2) because of the large irrigation schemes that require two thirds of these amounts (Figure 3B-2). In the Nakambé basin the water requirements are more diverse, though similar for large and small scale irrigation, inland valleys and horticulture. None of these types of irrigation focus entirely on rice cultivation. In the southern Nakambé and the Niger basin, where most of the country’s livestock is concentrated, animals are the main consumers of water (Figure 3B-3). They need more than 200 m3/year/km2.
Total water requirement (m3/year/km2)
Horticulture
Large-scale irrigation
Small-scale irrigation
Inland valleys
Type of irrigation
Figure 3.2: Water requirements for irrigation in Burkina Faso (GIRE 2000b).
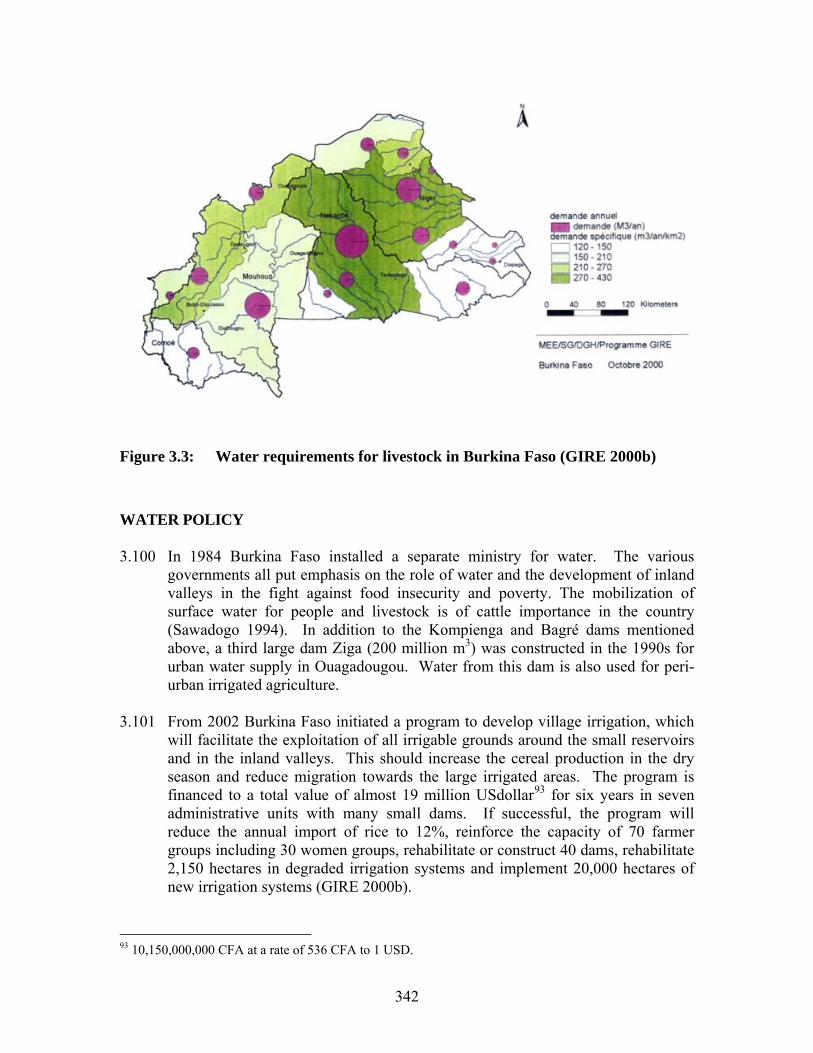
342
Figure 3.3: Water requirements for livestock in Burkina Faso (GIRE 2000b)
WATER POLICY 3.100 In 1984 Burkina Faso installed a separate ministry for water. The various
governments all put emphasis on the role of water and the development of inland valleys in the fight against food insecurity and poverty. The mobilization of surface water for people and livestock is of cattle importance in the country (Sawadogo 1994). In addition to the Kompienga and Bagré dams mentioned above, a third large dam Ziga (200 million m3) was constructed in the 1990s for urban water supply in Ouagadougou. Water from this dam is also used for peri-urban irrigated agriculture.
3.101 From 2002 Burkina Faso initiated a program to develop village irrigation, which
will facilitate the exploitation of all irrigable grounds around the small reservoirs and in the inland valleys. This should increase the cereal production in the dry season and reduce migration towards the large irrigated areas. The program is financed to a total value of almost 19 million USdollar93 for six years in seven administrative units with many small dams. If successful, the program will reduce the annual import of rice to 12%, reinforce the capacity of 70 farmer groups including 30 women groups, rehabilitate or construct 40 dams, rehabilitate 2,150 hectares in degraded irrigation systems and implement 20,000 hectares of new irrigation systems (GIRE 2000b).
93 10,150,000,000 CFA at a rate of 536 CFA to 1 USD.
343
Four institutions are currently responsible for planning and water management in Burkina Faso:
1. The Ministry of Water, in charge of water resources, has four institutions
under its supervision: the development agency of Sourou (AMVS), the Bagré works control agency (MOB), the national office for dams and irrigation schemes (ONBAH), and the water and rural engineering fund (FEER).
2. The Ministry of Agriculture and Livestock. 3. The regional centers for agro-pastoral production (CRPA). 4. The Ministry in charge of rural organization.
CHARACTERISTICS OF SMALL DAMS 3.102 The diversity of sources and census methods make it possible to compile an exact
situation of the spatial distribution of the dams as well as the principal characteristics of these. In Burkina Faso a small dam is defined by the height of the dam, which should be below 10m. Maximum storage capacity or volume is not a criterion because most reservoirs are vast but very shallow with important seasonal variations. The latest estimate gives a total of 1469 dams, half of which are located in the Nakambé basin, 29% in the Mouhoun basin, 19% in the Niger basin and 2% in the Comoé basin (GIRE 2000b, 2001). Four types of dams are identified in Burkina Faso (GIRE 2000a, 2001):
• Dams intended to create water reserves. They are built on non-permanent
rivers and retain surface water during the rainy season to meet the human and animal water requirements. In practice some of the reservoirs are used for industrial production, urban energy, fishing and serve to feed the groundwater for drinking water supply. The majority of small dams of Burkina fall in this category.
• Regulation dams for flood management. • Dams for regulation of local streams. • Diversion dams in rivers. These dams are used to block the rivers, raise the
water level and feed a canal. This type of dams is mainly found on rivers of the valleys of Kou, Karfiguela and Banzon in the south-west of the country.
3.103 The temporary or permanent character of these water reservoirs will vary
according to the type and rainfall. Nowadays an estimated 500 dams (out of 1500) retain water year-round (GIRE 2000b). In the south-western part of the country more half of the dams retain water all the year. In the Nakambé basin the situation varies from north to south. In the North, more of two thirds of the dams are temporary reservoirs, in the central part of the basin it is practically one dam on two and to the extreme East most dams are perennial.
3.104 Though the creation of small reservoirs started in the 1920s in Burkina Faso, it is
during the 1980s that about half of the inventoried dams were created (Figure 3B-
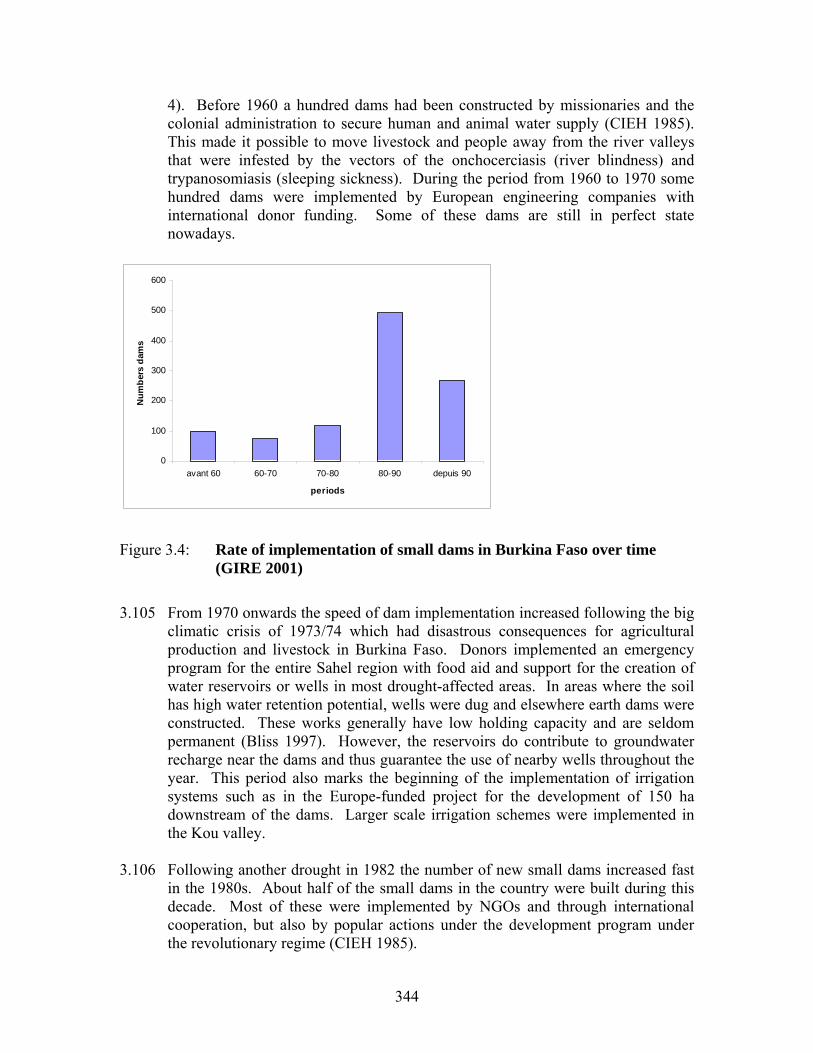
344
4). Before 1960 a hundred dams had been constructed by missionaries and the colonial administration to secure human and animal water supply (CIEH 1985). This made it possible to move livestock and people away from the river valleys that were infested by the vectors of the onchocerciasis (river blindness) and trypanosomiasis (sleeping sickness). During the period from 1960 to 1970 some hundred dams were implemented by European engineering companies with international donor funding. Some of these dams are still in perfect state nowadays.
0
100
200
300
400
500
600
avant 60 60-70 70-80 80-90 depuis 90
periods
Num
bers
dam
s
Figure 3.4: Rate of implementation of small dams in Burkina Faso over time
(GIRE 2001)
3.105 From 1970 onwards the speed of dam implementation increased following the big
climatic crisis of 1973/74 which had disastrous consequences for agricultural production and livestock in Burkina Faso. Donors implemented an emergency program for the entire Sahel region with food aid and support for the creation of water reservoirs or wells in most drought-affected areas. In areas where the soil has high water retention potential, wells were dug and elsewhere earth dams were constructed. These works generally have low holding capacity and are seldom permanent (Bliss 1997). However, the reservoirs do contribute to groundwater recharge near the dams and thus guarantee the use of nearby wells throughout the year. This period also marks the beginning of the implementation of irrigation systems such as in the Europe-funded project for the development of 150 ha downstream of the dams. Larger scale irrigation schemes were implemented in the Kou valley.
3.106 Following another drought in 1982 the number of new small dams increased fast
in the 1980s. About half of the small dams in the country were built during this decade. Most of these were implemented by NGOs and through international cooperation, but also by popular actions under the development program under the revolutionary regime (CIEH 1985).
345
HEALTH IMPACTS OF SMALL DAMS IN BURKINA FASO 3.107 The new program for village irrigation that was launched in 2002 will lead to
important modifications of the environment around the small dams. The effects on the development of certain diseases may or may not be comparable to the situations already described in the large irrigation systems in the region (Kou valley in Burkina Faso, Manantali in Mali and the Senegal River valley). In Burkina Faso several studies investigated the health impact of large dams and irrigation schemes (Carnevale and Robert 1987; Chastre 1994; Cissé et al. 2000; Poda and Traoré 2000). Much less is known about the environmental impacts and about the impacts of small reservoirs.
ENVIRONMENTAL IMPACTS 3.108 The construction of small dams in a catchment area has impacts on the
environmental, human and hydrological characteristics of this catchment area as well as on the downstream area. On the hydrological level it is established that the creation of one or several water reservoirs can effectively control the seasonal floods. Clusters of dams have reduced the floods and contributed to a more beneficial use of the water. The floods have become less violent while rivers flows have been prolonged and erosion of the river beds reduced. Now more water from floods can infiltrate. To the north of the town of Kaya in the central part of the country, the presence of a dozen dams in a small catchment area reduced the flood flow from 38 m3/s to 23 m3/s, while the time of flow was prolonged from 36 hours to 4 days. Unfortunately it led to a prolonged submersion of the easily flooded zones and part of the agricultural land could not be exploited because of the water excess. These new moisture conditions may favor the breeding of disease vectors like mosquitoes that can transmit malaria, dengue fever or lymphatic filariasis and of intermediate snail hosts of schistosomiasis (CEGET 1985).
3.109 On the demographic level, the establishment of small dams led to a redistribution
of human population pressure. In most of the villages around the Yitenga dam, the population increased dramatically and led to degradation of the ecosystem. Contrary, one village lost half of its population because it was flooded by the reservoir and another disappeared almost entirely because their inland valley could no longer be used for commercial horticulture (Yonkeu 2001). The same author made a historical analysis of the land use around the Yitenga dam by comparing the situations in 1979, 1993 and 2001 (Table 3B-4). After the construction of the dam a much smaller area was inundated after the floods. Forest and savanna vegetation was replaced by degraded secondary vegetation, man-made savanna and gardens as a result of increased population pressure. In addition, 120 hectares of dense forest were destroyed downstream from the dam. The high population density increased pressure on the land for homesteads and cultivation, pushing peoples to marginal ground and reducing the fallow period.

346
Wood collection for domestic use and intensive collection of crop residues after harvest exposed the soil to erosion in the rainy season. The reservoir got polluted by solid wastes and sewerage draining into the water. Human waste and the refuse domestic are drained in the dam by the streaming contributing thus to an important pollution of this resource. The areas under rice irrigation and horticulture increased and people planted useful tree species in the savanna such as Azadirachta indica (neem) Eucalyptus camaldulensis, Mangifera indica (mango tree) and Psidium guajava (guava tree). All these environmental changes may have serious consequences for the population that use the reservoir (Yonkeu 2001).
Table 3.4: Dynamics of land use around Yitenga dam between 1979 and 2001 (Yonkeu 2001)
Landuse Area in 1979
(ha) Area in 1993 (ha)
Area in 2001 (ha)
Difference 1979-2001 (ha)
Difference 1979-2001 (%)
Koupéla town 115 207 1,663 +1,548 1346 Pouytenga town and villages 90 182 958 +868 964 Fallow 186 292 257 +71 38 Open water 24 152 131 +107 446 Easily flooded zone 491 217 217 -274 56 Rice growing and horticulture 10 61 79 +69 690 Cultivated area 12,266 11,207 9,483 -2,783 23 Man-made savanna (with useful species)
0 543 540 +560 -
Degrade savanna 0 466 1206 +1206 -
Shrubby natural savanna 822 781 781 -41 5 Forest 54 42 42 -12 22 Total 14,058 14,150 15,357 SCHISTOSOMIASIS
GEOGRAPHICAL DISTRIBUTION OF SCHISTOSOMIASIS 3.110 Perennial or temporary water bodies such as those created by small dams offer
ideal conditions for the aquatic and amphibian snails that are potential intermediate hosts of human and bovine schistosomiasis. According to studies carried out in Burkina Faso in the last twenty years, the prevalence of this disease has been about 30% with important local variations. The most frequent form in the country is urinary schistosomiasis caused by Schistosoma haematobium. Within the main climatic zones of Burkina Faso, the heterogeneity in the transmission pattern of schistosomiasis is closely linked to the water systems. In general, irrigation systems and small permanent water bodies are preferred breeding sites for the snail hosts as well as principal points of contact between people and parasite. Hence the spatial distribution of schistosomiasis is closely correlated to that of the intermediate hosts and climate (Poda 1996). The highest

347
prevalences of S.heamatobium were observed in villages with at least one dam. These decrease from north to south. Specific differences that are characteristic for the climatic zones (Table 3.1) are discussed in more detail below (Poda and Traoré 2000). Figure 3.5 shows the mean of low and high prevalence in villages with a small dam, calculated from Poda (1996).

348
Figure 3.5: Climatic zones and sub-zones with average schistosomiasis prevalence
in villages with a small dam (after Poda 1996).
Transmission foci in the Sahelian climate zone.
3.111 Beyond 14 degrees northern latitude, annual rainfall does not exceed 500 mm and perennial water surfaces are very few and mainly consist of occasional reservoirs and temporary ponds (Dori, Oursi, Markoy, Soum, Darkoy). The fast draining of the majority of the rivers and water reserves at the beginning of the dry season does not allow a continuous development of the intermediate hosts and transmission only takes place here during the rainy season. People and livestock are highly concentrated around the few water bodies throughout the year, which supports constant circulation of the parasite and leads to a hyper-endemic of urinary schistosomiasis.
Transmission foci in the South-Sahelian climate zone.
3.112 Between the 13th and 14th parallel rainfall varies from 500 to 750 mm annually with a dry season that lasts from 7 to 8 months. This area also has some natural lakes (Bam, Dem, Siam) and small dams with irrigated horticulture (Ouahigouya, Yalogo, Tougouri, Louda, Mani). The epidemiological situation is as heterogeneous as the variety in water systems. Urinary schistosomiasis is meso-endemic with some pockets of hyper-endemy around small dams. In Bogandé near a dam for livestock (capacity 2 Mm3), built in 1966, a prevalence of 62% was found. The small dam (1.2 Mm3) in Mani coincided with a local prevalence of 82%. Finally the highest prevalence of 100% was observed in Thion with a genuine small dam (0.2 Mm3) built in 1957 (Poda 1996). The presence of small
349
dams does not everywhere lead to increased transmission. In the village of Louda prevalence was 10% in spite of the presence of a small dam of 3.2 Mm3 and rice cultivation (Villenave 1985).
Transmission foci in the North-Sudanese climate zone
3.113 Between latitudes 13° and 11°30 annual rainfall ranges from 750 to 900mm with a 6 to 7 months dry season. Many contributing streams to important rivers run through this zone and about half of the small dams of the country are located here (700-800). It is estimated that the construction of such a great number of small dams enabled the spread of urinary schistosomiasis to meso-endimic proportions. In the central part around Ouagadougou, high prevalences were observed in certain villages of Oubritenga that had small dams. It is the case in the villages of Daguilima where the prevalence was 85% and Tanguiga where it was 55% (Traoré 2001). This prevalence is higher than observed in the south around the large Bagré dam where the prevalence was 33% in 1992 before completion of the dam (Zan et al. 1993). In the extreme East of this zone, prevalences were 52% around the water reservoir of Fada N Gourma and 70% around Diapaga (Poda and Traoré 2000).
Transmission foci in the South-Sudanese climate zone.
3.114 In this zone between 12° and 10° northern latitude most of the rivers and water reservoirs are permanent, offering favorable breeding sites to the intermediate hosts of the schistosomiasis. However, transmission is low and prevalence the lowest of the entire country, probably because the high turbidity of the water during the rainy season does not facilitate the establishment of snails nor contact with the parasite. The few exceptions of high endemicity were observed around large irrigated areas such as the Kou valley where S.haematobium prevalence was 80% and S.mansoni prevalence 40%. In two villages where commercial horticulture was well developed, Dafiguisso and Dafinso, the prevalence of S.mansoni was 64% and 45% respectively, while in Dafinso prevalence of S.haematobium was less than 6%. Around the large hydropower dam of Kompienga the prevalence was 31% in 1989 (Poda and Traoré 2000).
Transmission foci in the Sub-Sudanese climate zone
3.115 Located at the extreme south-west of Burkina this zone receives on average more than 1000 mm of rain per year. It has a very dense network of permanent streams and rivers. Apart from large works such as Comoé there are also some small dams. The permanent water bodies enable continuous transmission of schistosomiasis, hence S.haematobium is hyper-endemic and S.mansoni hypo-endemic.
SMALL DAMS, SNAILS AND SCHISTOSOMIASIS 3.116 Snail surveys carried out by Poda and his team from 1985 to 1995 showed the
importance of small dams in the distribution of intermediate snail hosts of schistosomiasis in Burkina Faso (Poda 1996). They found 41% of the intermediate hosts in the small dams, 34% in the rivers, 20% in temporary ponds,
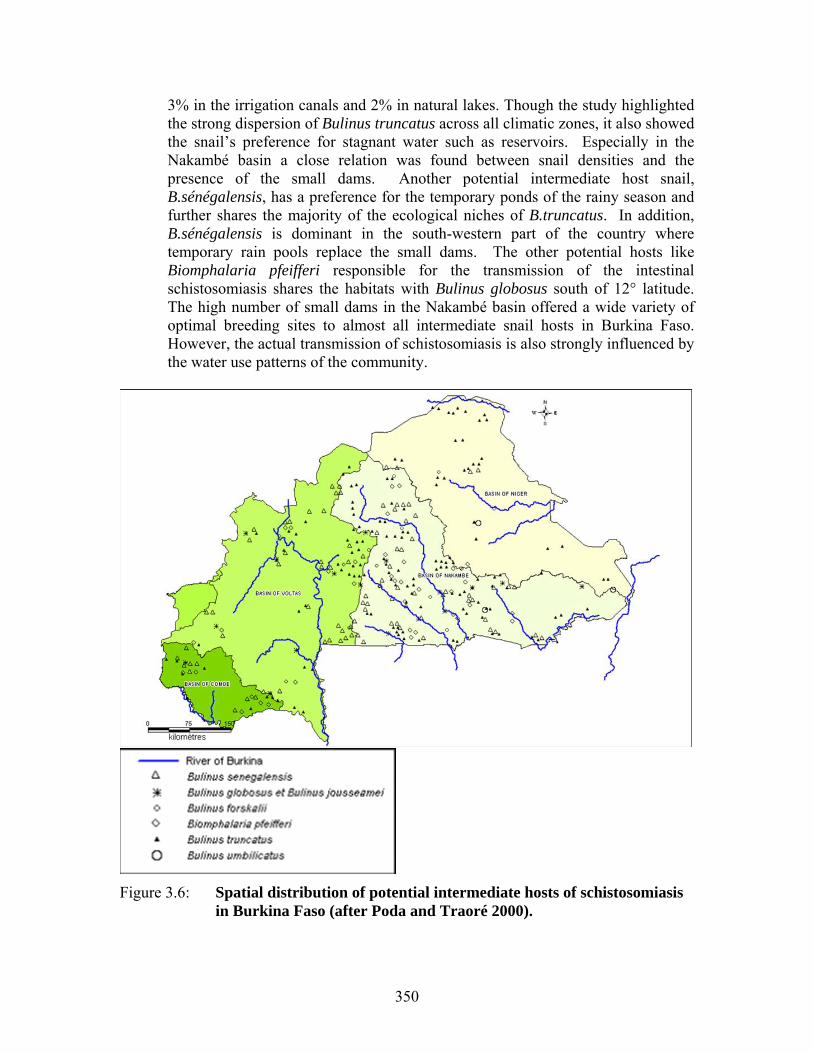
350
3% in the irrigation canals and 2% in natural lakes. Though the study highlighted the strong dispersion of Bulinus truncatus across all climatic zones, it also showed the snail’s preference for stagnant water such as reservoirs. Especially in the Nakambé basin a close relation was found between snail densities and the presence of the small dams. Another potential intermediate host snail, B.sénégalensis, has a preference for the temporary ponds of the rainy season and further shares the majority of the ecological niches of B.truncatus. In addition, B.sénégalensis is dominant in the south-western part of the country where temporary rain pools replace the small dams. The other potential hosts like Biomphalaria pfeifferi responsible for the transmission of the intestinal schistosomiasis shares the habitats with Bulinus globosus south of 12° latitude. The high number of small dams in the Nakambé basin offered a wide variety of optimal breeding sites to almost all intermediate snail hosts in Burkina Faso. However, the actual transmission of schistosomiasis is also strongly influenced by the water use patterns of the community.
Figure 3.6: Spatial distribution of potential intermediate hosts of schistosomiasis
in Burkina Faso (after Poda and Traoré 2000).

351
3.117 From a comparative study of three foci of Schistosoma haematobium in Burkina Faso by Poda et al. (2001), it appears that the high prevalence in the village of Donsin is related to the proximity of a small dam. Built in 1955, this small dam of 200,000 cubic meters offers optimal conditions for the development of one of the principal intermediate hosts, B.truncatus that occurs in 75% of the sites. The reservoir, located near the school, is regularly used by the children for bathing. Around the second village B.senegalensis and B.truncatus were identified in the temporary ponds and the other small dam of 75,000 cubic meters from 1986, which was hardly used by the population. The prevalence of the disease was 38%, in line with the general situation of areas with temporary ponds, where B.senegalensis was responsible for all transmission. In Djerma, the weak prevalence of 10% related to the temporary character of the river. The low density of B.truncatus indicates that the transmission probably took place elsewhere. From this study the small dams appears as a water system that can locally modify the transmission of schistosomiasis in areas where previously only temporary water bodies were available (Poda et al. 2001).
3.118 A study carried out in 1983 in the area of Kaya on the other hand, seems to
indicate that the mere presence of a small dam is not sufficient to modify the epidemiologic profile of the population that uses it (Villenave 1985). By comparing three villages each with different water systems, this author highlighted the importance of human behavior for disease transmission in the relation that each community has with its environment. Villenave compared the village of Louda with its 3.2 Mm3 dam from 1958 and irrigated rice to the villages of Damesma located in a valley with natural lakes and Noaka with only seasonal access to water. The highest prevalence was found in Noaka, despite its lack of water resources and facilities (Table 3B-5). Actually the human pressure on the few water points facilitated transmission of schistosomiasis. In Damesma and Louda the epidemiologic situation can partly be explained by the dispersion of the population in hamlets, leading to a dispersed pattern of water contacts. Hence, though the intermediate hosts are present in all three ecosystems, the circulation of the parasite will vary according to human population pressure and water use behavior (Villenave 1983).
Table 3.5: Prevalence of urinary schistosomiasis in three villages in Burkina
Faso (Villenave 1983)
Louda Damesma Noaka Males 12% 18% 41% Females 8% 9% 25% Total 10% 14% 33%
352
3.119 This observation was confirmed later in the Valley of Sourou (Poda et al. 2003). By comparing pilot zones without irrigation systems to those close to irrigation infrastructure, installations, it turned out that scarcity of water led to higher infection rates (65-83%). In the villages where only temporary ponds were available, population density around these was high, facilitating disease transmission. In the village near the irrigation system, prevalence was only 41% (Poda et al. 2003).
MALARIA 3.120 Transmitted by the Anopheles mosquito malaria constitutes the principal cause of
mortality in children under 5 in Burkina Faso and accounts for 20% of the consultations at health care facilities. It is generally endemic but epidemics occur in certain areas related to important modifications of the water resources. The increase in mosquito vector density caused by the presence of a small reservoir and irrigated area is a real risk. But as with schistosomiasis, the actual incidence of malaria will vary according to the climatic zone (Danis and Mouchet 1991).
GEOGRAPHICAL DISTRIBUTION OF MALARIA 3.121 In the southern Sudanese or tropical climatic zone, with annual rainfall over 800
mm and a rainy season of more than four months, malaria transmission is high with 100-1000 infected bites per year. The sporozotic index of the main vectors Anopheles gambiae, An.aranbiensis, An.funestus and An.nili is 2 to 5%. Resistance is effective from the age of 10 years and generally adults do not suffer much from the disease. Still, malaria accounts for 30-35% of all fevers, varying between 10% in the dry and over 80% in the rainy season. With continuous transmission throughout the year, an increase in the vector population because of the presence of small dams will not have an effect on malaria incidence under these climatic circumstances (Henry et al. 2000)
3.122 The other sahelian climatic zones of the country have less than 800 mm rain
annually. The variations in rainfall over space and time lead to important variations in mosquito production. The transmission, ensured by An.arabiensis and to a lesser extent by An.funestus, is concentrated over the short rainy season of less than four months. In the northern part the inoculation rate is around 15-20 bites per person per year. The resistance decreases while going north along with an increasingly unstable character of the disease. In this zone epidemic episodes are frequent during the period of heavy rains, affecting children under 12 as well as adults. The few studies that have been done in this zone indicate that implementation of a water reservoir with irrigation system may be followed by malaria epidemics (CNLP-press 1998).

353
3.123 Certain environmental modifications in these two zones can locally disturb the transmission pattern of malaria. This can be caused by rivers or lakes but also by the construction of dams and irrigation systems. These may increase the availability of stagnant water, create breeding sites and thereby lengthen the transmission period during the dry season.
SMALL DAMS, MOSQUITOES AND MALARIA 3.124 The knowledge on impact of water resources development on malaria is largely
based on studies in the valley of Kou (Brengues and Coz 1973; Carnevale and Robert 1987), Banzon (Koné 1992; Tia et al. 1992), and Bagré that analyzed the situation around large dams and irrigation systems. Only few studies addressed the impact of small dams on the transmission of malaria. Teams of OCCGE and IRD (formerly ORSTOM) studied the area around Bobo-Dioulasso, where continuous transmission takes place. CNRFP (formerly CNLP) conducted complementary studies on dams in the sahelian climatic zone. All studies conclude that the presence of a water surface offers better conditions to the proliferation of the vectors of malaria.
3.125 The presence of three small dams around Ouagadougou strongly increased the
malaria risk during the rainy season. A resident living near the reservoirs receives on average 3-4 Anopheles bites during the rainy against 1 bite for those living in the city center. Parallel to the spatial decrease of mosquito density, the infection rate in children also decreases with increasing distance from the dam from 51 to 23 %. Likewise, the parasite load of Plasmodium falciparium in the blood diminishes from 46 parasites/ml at 100 m to only 4/ml at 800-1000 m from the dam (CNLP-press 1998). These results do not take into account the effect of human population density, which may constitute a screen for the dispersion of mosquitoes far from the breeding sites lodgings. Still the study shows the direct relation between presence of the dams and malaria transmission. The case of Ouagadougou may be unique though in the sense that it combines large water surface and more mosquitoes with very high human density. This same situation of more mosquitoes leading to more malaria may not occur in rural areas.
3.126 Recent studies in the irrigated Kou Valley showed very high densities of vector
mosquitoes, especially Anopheles gambiae sl and An.funestus. People may receive up to 226 bites/person/night in the wet season, on average no less than 30,000 An.gambiae sl bites per year against 1200-1800 in areas without irrigation (Baldet et al. 2000). These observations confirm earlier studies in the same area (Carnevale and Robert 1987) and in other nearby irrigation systems (Koné 1992; Tia et al. 1992). In all these cases however, the increase in mosquito aggression was not followed by increased malaria transmission; in fact transmission in the irrigated areas is lower than in villages without irrigation. Similar findings have been reported from irrigated rice cultivation in the inland valleys of Côte d’Ivoire (Henry et al. 2003). A combination of factors seems to explain this paradox of more vectors and less transmission (see also Ijumba and Lindsay 2001): high mortality of the vectors, hence many mosquitoes die before the Plasmodium cycle

354
is completed; a strong local tendency of Anopheles towards zoophagy and the generalized use of protective bed nets by the wealthier rice growers. This complex interaction of several factors, including migration and human behavior, can not be extrapolated to small dams.
3.127 Based on a few preliminary case studies of small dams, the situation might be
contrary to what has been observed in the large irrigation schemes in Kou and Banzon. An investigation among 366 households around the small dam of Yitenga in the south-east of Burkina, showed that malaria accounted for 80% of the reported diseases (Figure 3B-7). Horticulture on the banks of this small dam inside the town on Pouytemga offer perennial breeding sites to the vectors (Yonkeu 2002).
Figure 3.7: Main diseases in the town of Pouytenga near the small dam of Yitenga
in south-east Burkina Faso (Yonkeu 2002). 3.128 Contrary to the situation for schistosomiasis, the small dams will have an indirect
impact on the transmission of malaria. The water reservoir itself provides very few breeding sites and increased malaria transmission is mainly found around small dams with irrigation systems. The impact of such small irrigated areas could be important at the local level in the province of Bam where more than 500 hectares around small dams are irrigated, in the Gnagna province, with 275 ha, in Oubritenga (225 ha) and in Sanmentenga (517 ha) (Figure 3B-8). As these provinces are located in the sahelian zone of seasonal transmission, it is possible that the irrigation systems around the small dams offer optimal conditions for the transmission of malaria throughout the year.
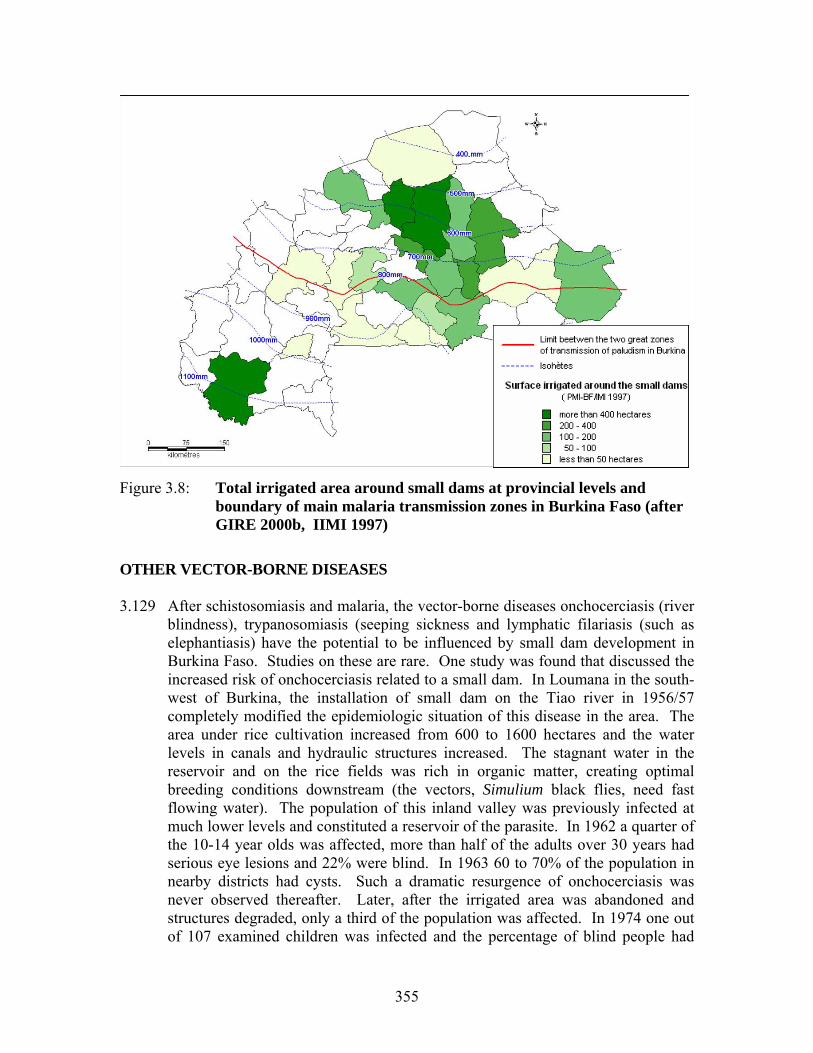
355
Figure 3.8: Total irrigated area around small dams at provincial levels and
boundary of main malaria transmission zones in Burkina Faso (after GIRE 2000b, IIMI 1997)
OTHER VECTOR-BORNE DISEASES 3.129 After schistosomiasis and malaria, the vector-borne diseases onchocerciasis (river
blindness), trypanosomiasis (seeping sickness and lymphatic filariasis (such as elephantiasis) have the potential to be influenced by small dam development in Burkina Faso. Studies on these are rare. One study was found that discussed the increased risk of onchocerciasis related to a small dam. In Loumana in the south-west of Burkina, the installation of small dam on the Tiao river in 1956/57 completely modified the epidemiologic situation of this disease in the area. The area under rice cultivation increased from 600 to 1600 hectares and the water levels in canals and hydraulic structures increased. The stagnant water in the reservoir and on the rice fields was rich in organic matter, creating optimal breeding conditions downstream (the vectors, Simulium black flies, need fast flowing water). The population of this inland valley was previously infected at much lower levels and constituted a reservoir of the parasite. In 1962 a quarter of the 10-14 year olds was affected, more than half of the adults over 30 years had serious eye lesions and 22% were blind. In 1963 60 to 70% of the population in nearby districts had cysts. Such a dramatic resurgence of onchocerciasis was never observed thereafter. Later, after the irrigated area was abandoned and structures degraded, only a third of the population was affected. In 1974 one out of 107 examined children was infected and the percentage of blind people had
356
dropped (Hervouët 1980, 1984). The effectiveness of international control programs such as WHO/OCP makes it possible today to minimize the risks of onchocerciasis transmission. It is also very well possible that transmission of this disease is reduced by water resources development, especially when fast-flowing water in rivers and streams is replaced by slower flowing waters in canals and structures.
3.130 The development of lymphatic filariasis may also be promoted by the presence of
the small dams. Since this disease can be transmitted by a variety of mosquitoes, an increase in different types of water bodies may offer optimal conditions for almost all vectors. While the infection is endemic in Africa, it especially poses a public health problem in Asia where two thirds of the infected people are found. Around the small dams of the Mossi high plains in Burkina Faso, high vector densities were found (Brengues and Coz 1973; Brengues 1975).
DRINKING FROM THE DAMS AND WATER-BORNE DISEASES 3.131 In rural areas where the access to drinking water is difficult, small dams constitute
an important source of water supply to the population. Though more than 33,000 water points have been created in rural areas in recent years, access to drinking water remained a major concern for the rural population. In certain provinces less than half of the villages has safe water supply (Figure 3B-9). In some areas where more than 90% of the villages have wells, they may dry out so fast that people still have to use water from the small dam. More half of the children in Burkina Faso do not have access to drinking and those who have cannot use more than 20 liter per person per day. Diarrheal diseases account for many deaths, approximately 350,000 children per year (Ministère de la Santé 1993).
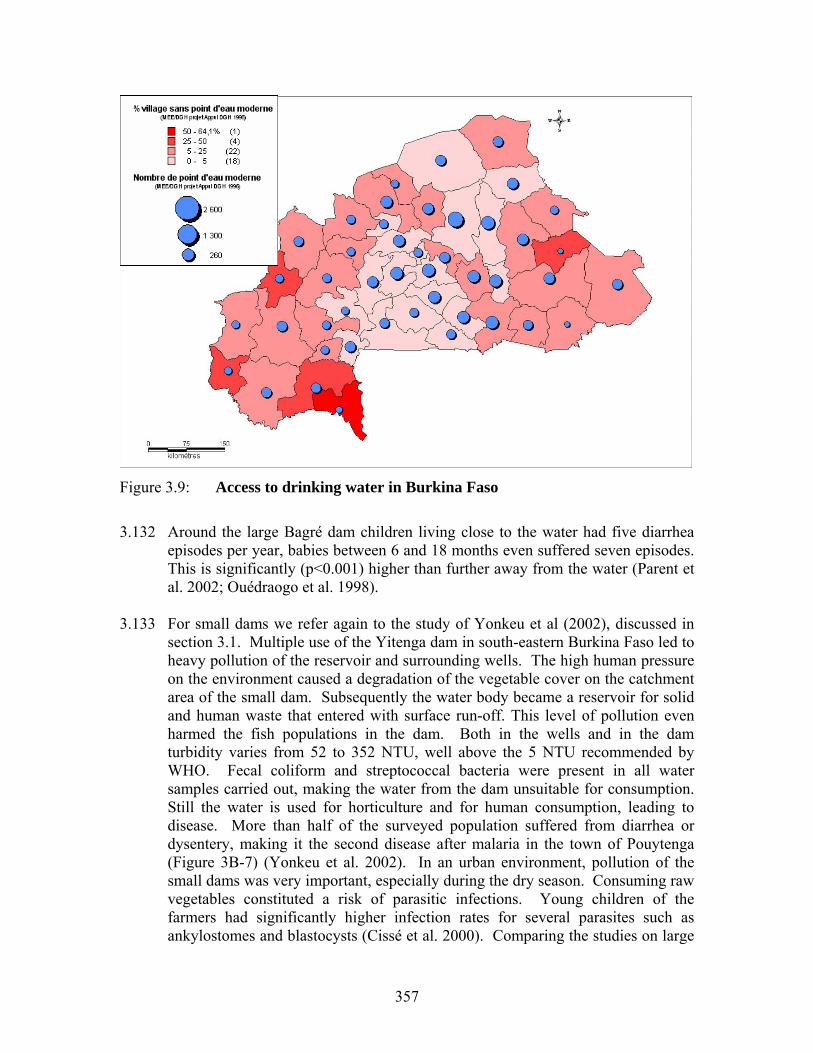
357
Figure 3.9: Access to drinking water in Burkina Faso
3.132 Around the large Bagré dam children living close to the water had five diarrhea
episodes per year, babies between 6 and 18 months even suffered seven episodes. This is significantly (p<0.001) higher than further away from the water (Parent et al. 2002; Ouédraogo et al. 1998).
3.133 For small dams we refer again to the study of Yonkeu et al (2002), discussed in
section 3.1. Multiple use of the Yitenga dam in south-eastern Burkina Faso led to heavy pollution of the reservoir and surrounding wells. The high human pressure on the environment caused a degradation of the vegetable cover on the catchment area of the small dam. Subsequently the water body became a reservoir for solid and human waste that entered with surface run-off. This level of pollution even harmed the fish populations in the dam. Both in the wells and in the dam turbidity varies from 52 to 352 NTU, well above the 5 NTU recommended by WHO. Fecal coliform and streptococcal bacteria were present in all water samples carried out, making the water from the dam unsuitable for consumption. Still the water is used for horticulture and for human consumption, leading to disease. More than half of the surveyed population suffered from diarrhea or dysentery, making it the second disease after malaria in the town of Pouytenga (Figure 3B-7) (Yonkeu et al. 2002). In an urban environment, pollution of the small dams was very important, especially during the dry season. Consuming raw vegetables constituted a risk of parasitic infections. Young children of the farmers had significantly higher infection rates for several parasites such as ankylostomes and blastocysts (Cissé et al. 2000). Comparing the studies on large
358
dams with the ones on small dams it appears that the small dams have an unquestionable impact on the development of the diarrheal diseases in Burkina Faso.
NUTRITIONAL IMPACTS 3.134 Agriculture in Burkina Faso depends strongly on the climate that does not allow
the production of sufficient food for an active and healthy life. The low agricultural productivity is thus at the origin of a precarious nutritional situation that may locally be very serious and deteriorating. In 1993, 29% of the children under five had low weight for age and in 1999 this had increased to 34%. Child mortality had gone up in the same period from 187 to 219 per thousand. Water resources development is considered as a local and national opportunity to increase agricultural production, particularly in the dry season.
3.135 The main objective of the earlier mentioned program for small village irrigation is
to reduce food insecurity in the rural areas. The small dam with irrigation system should make it possible for the producers to increase their income and diversify nutrition. A recent FAO study on the impact of three small irrigation projects on health and well-being of the population in Burkina, Mali and Tanzania showed that small dams and wells enabled the people to better face the dry periods, to diversify their food intake and to consult health services when needed. The three projects increased production, transformation and preparation of a wide range of indigenous food, supported by food education the participation of women groups (FAO 2001). On the other hand irrigation systems may also be accompanied by new constraints such as social and economic reorganizations, and increased workload especially for women, which will have an impact on the nutritional and health state of the children, as was reported in Côte d’Ivoire (De Plaen et al. 2003).
3.136 In Burkina Faso hardly any studies have been done on the nutritional impacts of small dams, but some assumptions can be formulated based on investigations at the large systems at Bagré and Sourou. About half of the children present some form of malnutrition and 90 of them are anemic. This made them more vulnerable to disease, while exposure to malaria and diarrhea in turn reduced their health. The thinness of the children was related to their parents’ activities, especially to horticulture, which is practiced primarily by women. In the area of onion cultivation around the Bagré dam, a woman has one and a half hour per day to look after her own health and she can rest 2 hours less than women of the other villages (Ouédraogo et al. 1998).
3.137 In the absence of better targeted studies, these findings on horticulture in large irrigation schemes might be extrapolated to small dams since this is the main form of agriculture around these reservoirs. It is very well possible that the nutritional

359
state of children around these dams will be negatively affected if their mothers are engaged in this type of production.
DISCUSSION AND CONCLUSION 3.138 The fight against poverty in West African western zone depends on making
available sufficient quantities of water to the population, both to satisfy their domestic needs and to make it possible increase agricultural production through irrigation. The creation of small reservoirs in (semi) arid areas is part of this strategy. The previously discussed studies on impacts of small dams in Burkina Faso highlighted the importance of these small dams on the increase of household income through productive agricultural activities upstream and downstream of the dam. However, no preventive measures were taken to ensure that the small dams do not further degrade rural public health. Luckily the water-related diseases that affect the population near the dams, mainly schistosomiasis and malaria, are sufficiently known and control measures are available that can be applied in planning, design and management of the small dams.
SCHISTOSOMIASIS CONTROL 3.139 The strategies to control schistosomiasis have the triple aim to eliminate the snail
population in the water bodies, prevent (re)infection of people and to limit contamination of the water by infected urine or feces.
3.140 The ecology of the intermediate host snails of schistosomiasis has been
extensively studied in sub-Saharan Africa and many control options are now available. Here only the control measures that could be applied to small dams will be discussed. Removal of aquatic vegetation from the banks of the reservoir, and from canals and drains, will deprive the snails from food, shelter and refuge from strong currents, and has been proven successful in a comparable situation (Boelee and Laamrani 2004). In many of the small dams in Burkina Faso, the reservoirs are shallow and hectares of wooded savanna and forest were covered by a few meters of water. As a result, many trees and bushes can be seen sticking out of the water and may provide excellent substratum for algae that the snails feed on. Some of the aquatic vegetation in the lake, canals or fields is used for animal feed or local medicine, such as Palpalum sp., Loudetia togoensis, Crotalaria sp., Dracaria sp., Physalis angulata, Aspilia sp., and Euphoria hirta (Yonkeu 2002). Here the local population may not be prepared to clean the aquatic vegetation. For new small dams and related irrigation systems, the design should include positive experiences from other parts of the world such as free draining structures (Chimbari et al. 1991) and canals that can be dried or flushed (Pike 1987). However, good environmental and water management is at least as important to keep the dam and irrigated area free of intermediate hosts of schistosomiasis.
360
3.141 The small dams are often used as place for bathing, exposing people to infective
Schistosoma cercariae. However, the use of soap will make the bathing safer as most soap is toxic to the larvae. The soap will remain effective in the water for a while after the bath and may thus play an important role in reducing the transmission of schistosomiasis (Combes et al. 1983).
3.142 To prevent contamination of the water, an effective use of sanitary facilities will
prevent the inflow of infected urine and feces. The management of human waste is a crucial element in the fight against many water-related diseases. Since it is impossible to prevent all water contact and subsequent “accidents” in a hot climate, health education could focus on the proper use of latrines and encourage people to relieve themselves in a safe place before they enter the water. For schistosomiasis control it is also important to reduce the human reservoir and treat the population with effective drugs such as praziquantel. This is central in all schistosomiasis control programs and promoted by WHO, both to reduce morbidity (disease symptoms) and to break the transmission cycle (Engels 2000). In areas of very high schistosomiasis endemics, mass treatment can be applied. In Burkina Faso this led to important reductions in the number of S.heamatobium eggs in the urine of 69% in children one year after treatment and 38% two years later. In adults this was higher (respectively 90% and 87%), indicating a high rate of re-infection among children (Sellin et al. 1984). This health care approach has its limitations in Burkina Faso as in the rural areas only 10 to 14% of all patients consult the modern health services (MS/CRDI 2000). Moreover, the symptoms of schistosomiasis are by most people not perceived as serious enough to seek medical care. Or even in some areas where urinary schistosomiasis has been endemic for a long time, bloody urine among was considered as “menses” of young boys, a necessary step towards adulthood. Therefore in Burkina Faso as in most African countries special so-called vertical control programs, usually very well equipped, against diseases such as schistosomiasis are much more effective to reach the population.
MALARIA CONTROL
3.143 Today the most common strategies to control malaria are the use of impregnated
bed nets and early case detection and treatment, with special attention to pregnant women and children. The objective of the bed nets is to reduce, at household level, the contact between vectors and people during the main biting period of Anopheles. In addition, the impregnated nets may have a knock down effect on the mosquito population. In the rice areas of Burkina Faso, the use of nets and curtains impregnated with the permethrin decreased the indoor resting density of An.gambiae by 99.5% and the number of indoor bites by 83% during two years (Pietra et al. 1991). The use of impregnated nets and curtains also has effects on the transmission of malaria at a larger scale. In a 1000 square kilometer area the use of impregnated curtains in 158 villages reduced the biting rate from 218 to 11 bites/person/month (Cuzin-Ouattara at al. 1999; Diallo et al. 1999; Habluetzel et
361
al. 1999). In the Kou Valley the number of infective bites per person per year dropped with 94% after the introduction of bed nets impregnated with deltamethrin (Robert and Carnevale 1991). The nets seem to act against other diseases as well as Habluetzel et al. (1999) found that it reduced overall child mortality by 15%.
3.144 However, the excessive use of insecticides by commercial farmers in some cases
led to the emergence of resistance in the vectors to the impregnation insecticides. In the rice village of Kafiné, 150 kilometers north of Bouaké in Côte d'Ivoire, the use of impregnated mosquito nets did not reduce the number of bites. This failure was due to the resistance of An.gambiae to the used permethrin (Doannio et al. 1999). In this area more than 20% of the female An.gambiae, which makes out 92% of the captures (Dossou-Yovo et al. 1994), survive traditional concentrations of permethrin. Mortality reaches 95% with deltamethrin and lambdacyalothrin, but there is a significant reduction of the knock-down effect (Elissa et al. 1993). The intensive use of insecticides in agriculture, particularly in rice and cotton, appear to be the cause of this resistance.
3.145 Another problem with the use of impregnated bed nets and curtains is their low
uptake. In the south-west of Burkina Faso only 20% of the distributed impregnated bed nets were found a year later and many of the nets in this rice zone were of very poor quality (Klein et al. 1989). This can partly be explained by the lack of awareness in the communities of the relation between mosquito bites and malaria. For example in the Banzon plain the consumption of fruit was regarded as the principal cause of malaria. However, the nuisance caused by high mosquito densities and the high biting rate of 167 bites/person/night led to a generalized use of mosquito nets. Behavior change is crucial if the nets are to be effective. The impregnated bed nets as main strategy for malaria control only work when people are under the nets during the hours when the Anopheles mosquitoes are most active. A study in Burkina Faso showed that the vectors were most active just before midnight, when 39% of the rural population was outside, far from their nets (Procacci et al. 1991).
3.146 Though effective treatment is readily available in Burkina Faso, not all will seek
this. A longitudinal follow-up of 709 children from 6 to 31 months during for 6 months in 2003 in a rural area revealed that 69% of the confirmed ill children were treated at home, 16% at the local health center, 13% at the village and 1% at the hospital. The choice for a certain type of treatment was determined by the accessibility of the medical facilities and severity of the disease (Müller et al. 2003). Other studies showed that in Burkina Faso only 3% of malaria cases are effectively dealt with in the rural communities and 21% of the cases are taken to a health facility (Krauze and Sauerborn 2000).

362
CORRECTIVE AND PREVENTIVE ACTION AT SMALL DAMS 3.147 The development of water-related diseases around small dams and their
sometimes dramatic impact on the neighboring communities are not inevitable. Achievements in research and disease control allow for a restriction of many of the diseases. The application however is faced with many difficulties resulting from the inadequate health system and the low level of awareness in the populations at risk. In West Africa, primary health care facilities that are closest to the rural population are fixed structures focused on curative care. Field visits are generally only carried out as part of large programs such as vaccination campaigns. Access to health facilities is limited to the population physically as well as financially. Even when these constraints are minimized, actual consultation of the medical facilities is determined by a range of other factors such as social representation of the disease, the perception of its causes, which may be mystical or religious and its gravity. The fight against water-related diseases around small dams requires two essential actions: health education and integrated management of the infrastructure.
HEALTH EDUCATION 3.148 Health and hygiene education could play a major role in the fight against water-
related diseases. Most of the small dams constitute a new ecosystem the beneficiaries are not used to. After 20 years of using the new facilities for bathing, laundry and agriculture, the knowledge of water-related diseases has not improved in Burkina Faso. Public awareness campaigns are necessary everywhere to explain to the communities the possible impacts of the dams and the irrigation system on their health. This should be the first step before even the promotion of preventive and curative measures against the water-related diseases. Especially since the current level of awareness of these diseases and their cycles is very low in Burkina Faso. For instance regarding diarrhea, accounting for 57% of the health problems in children under five, only 13% of the women knew what caused diarrhea and what rehydration therapy means (Duboz et al. 1987, 1988; UNICEF 1988). This average rate hides enormous differences in the rural areas where the illiteracy of the women reaches 89% and 79% in men. With such an educational level, the links between the water reservoirs and the development of water-related diseases are not easily understood. General education is a pre-requisite for health education to be effective.
3.149 More important for the success of health education however, is the availability of
alternatives. In the western part of Niger with high infection rates of urinary schistosomiasis, a comprehensive health education campaign aimed at changing the behavior of the population at risk. Despite the use of video, public discussions and school programs, more than half of the population kept on using the transmission sites, as these were the only sources of water for domestic needs (Garba et al. 2001).

363
INTEGRATED MANAGEMENT OF SMALL DAMS 3.150 The reduction of negative impacts of the small dams on the environment and
public health cannot be addressed in a sectoral way. The evaluation of the health impacts of water reservoirs should not be limited to research on the ecology of mosquitoes and snails, or to the measurement of disease incidence in the population. Health impact assessments should specifically identify the enhancing and limiting factors the transmission of water-related diseases in the new dam environment. From a good knowledge of the risk factors, an effective control program can be initiated that fits in with the regional strategies for poverty eradication and sustainable development. It is only by dealing with the health impacts that the increased incomes generated by the small dams really lead to improvements in rural well-being. Such an approach must be applied at two levels.
3.151 At the national level, the implementation of small dams must be inserted into the
regional development plan to ensure an equal spread of interventions over space and avoid high pressure of people and animals around some rare water points. In the planning process, potential spontaneous migration to the new perennial water reservoirs should be taken into account and appropriate accommodating measures should be implemented. Especially when the rest of the district remains under-equipped, there is a risk of increased transmission of schistosomiasis. Preventive measures could consist of treating people (and cattle) for this disease before they enter the newly equipped area, rather than treating infected children alone. The success of mitigating the unwanted health impacts of small dam development, such as water-related diseases, depends to a large extent on an effective public health system. In West Africa, the present fixed health facilities are not sufficient to address the important endemics of schistosomiasis, malaria and diarrhea. Mobile teams may fulfill this task much more effectively and therefore be more cost-efficient as well.
3.152 At the local level, a bottom-up community health system will allow a good
application and uptake of disease control strategies. Such a structure would also promote the construction and effective use of sanitary facilities, the use of soap with strong larvicidal potential. In collaboration with other community groups, such as the water committees that are organized around domestic water supply points, farmer groups, women groups and especially (agricultural) water user associations, recurrent environmental activities can be planned, such as clearing the reservoirs banks of vegetation and solid waste removal. Hence the community can take the maintenance of a clean and healthy environment into their own hands and thereby increase their health and well-being.
364
REFERENCES Baldet, T.; Diabaté, A.; and Guiguemdé, T.R. 2000. Etude de la transmission du
paludisme en 1999 dans la plaine rizicole de la Vallée du Kou (Bama), Burkina Faso. Cahiers Agriculture, 9(5):422.
Bliss, F. 1997. De l’aide d’urgence au développement villageois intégré, 100 micro-
barrages pour le Burkina. Développement et Coopération, 5: 22-25. Boelee, E. and Laamrani, H. 2004. Community participation in environmental control of
schistosomiasis in Akka Oasis, South of Morocco. Tropical Medicine and International Health, 9(9):997-1004.
Brengues, J. 1975. La Filariose de Bancroft en Afrique de l'Ouest. ORSTOM, Paris, 301
pp. Brengues, J. and Coz, J. 1973. Quelques aspects fondamentaux de la biologie
d'Anopheles gambiae Giles (Sp: A.) et d'Anopheles funestus Giles, en zone de savane humide d'Afrique de l'Ouest. Cahiers ORSTOM.Serie Entomologie Médicale et Parasitologie, 11(2):107-126.
Carnevale, P.; and Robert, V. 1987. Introduction of irrigation in Burkina Faso and its
effect on malaria transmission. In Effects of agricultural developpement on vector-borne diseases. FAO Rome, pp 57-67.
Cecchi, P. 1998. De la construction d’un objet pluridisciplinaire : les petits barrages du
nord de la Côte d’Ivoire. Natures Sciences et Sociétés, 6(2):73-83. CEGET. 1985. De l'épidémiologie à la géographie humaine. CEGET, Travaux et
Documents de Géographie Tropicale No 48, Table ronde "Tropiques et Santé", 04-06 octobre 1982, Bordeaux, France, pp 313.
Chastre, C. 1994. Analyse bibliographique sur l’impact des aménagements hydrauliques
sur la santé et la nutrition dans les pays en développement: cas du barrage de Bagré au Burkina Faso. Mem DESS : Nutrition et Alimentation, Montpéllier II. ORSTOM, Ouagadougou Burkina, 56 p.
Chimbari, M.; Chitsiko, R.J.; Bolton, P.; and Thomson, A.J. 1991. Design and operation
of a small irrigation project in Zimbabwe to minimise schistosomiasis transmission. OD/P106, HR Wallingford.
CIEH. 1985. Petits barrages en terre au Burkina Faso: Bilan et analyse critique.
CIEH/UNESCO/EIER, 156 pages + annexes.
365
Cissé, G.; Kientga, M.; Ouédraogo, B.; and Tanner, M. 2000. Développement du maraîchage autour des eaux de barrage à Ouagadougou: quels sont les risques sanitaires à prendre en compte? Cahiers Agricultures, 11(1): 31-38.
Combes, C.; Boiteux, J.-P.; Marcon, M.-C. ; Marcou, L.; and Sellin, B. 1983. Possibilités
d’emploi des agents de surface amphotères dans la lutte contre les agents de transmission des schistosomoses. Ann. Parasitol. Hum. Comp., 58:353-359.
CNLP-press. 1998. Paludisme à deux vitesses à Ouagadougou. 2-5. Cuzin-Ouattara, N.; Van den Broek, A.H.A.; Habluetzel, A.; Diabaté, A.; Sanogo-
Ilboudo, E.; Diallo, D.A.; Cousens, S.N.; and Esposito, F. 1999. Wide-scale installation of insecticide-treated curtains confers high levels of protection against malaria transmission in a hyperendemic area of Burkina Faso. Trans. R. Soc. Trop. Med. Hyg., 93:473-479.
Danis, M. and Mouchet, J. 1991. Paludisme. UREF/ELIPSES/AUPELF, 240 p. De Plaen, R.; Geneau, R.; Teuscher, T.; Koutoua, A.; and Seka, M.-L. 2003. Living in
the paddies: a social science perspective on how inland valley irrigated rice cultivation affects malaria in Northern Côte d’Ivoire. Tropical Medicine and International Health 8(5):459–470.
Diallo, D.A.; Habluetzel, A.; Cuzin-Ouattara, N.; Nebié, I.; Sanogo, E.; Cousens, S.N.; and Esposito, F. 1999. Widespread distribution of insecticide-impregnated curtains reduces child mortality, prevalence and intensity of malaria infection, and malaria transmission in rural Burkina Faso. Parassitologia, 41:377-381.
Doannio, J.M.C.; Dossou-Yovo, J.; Diarrassouba, S.; Chauvancy, G.; Darriet, F.;
Chandre, F.; Henry, M.C.; Nzeyimana, I.; Guillet, P.; and Carnevale, P. 1999. Efficacité des moustiquaires pré-imprégnées de perméthrine Olyset Net® en zone de résistance des vecteurs aux pyréthrinoides, I. Evaluation Entomologique. Med. Trop., 59:349-354.
Dossou-Yovo, J.; Doannio, J.; Rivière, F.; and Duval, J. 1994. Rice cultivation and
malaria transmission in Bouaké city (Côte d’Ivoire). Acta Tropica, 57:91-94. Duboz, P. and Vaugelade, J. 1987. Etude de la mortalité avant 5 ans: premiers résultats.
ORSTOM, Ouagadougou, Burkina Faso, 47 p. Duboz, P.; Vaugelade, J.; Lafrance, N.; and Sankara, M. 1988. Maladies diarrhéïques
chez les enfants de 0-4 ans et attitudes des mères concernant ces maladies et techniques de réhydratation orale. UNICEF, Ouagadougou, Burkina Faso, 242 p.
Elissa, N.; Mouchet, J.; Rivière, F.; Meunier, J.Y.; and Yao, K. 1994. Sensibilité
d’Anopheles gambiae aux insecticides en Côte d’Ivoire. Cahiers Santé, 4:95-99. Engels, D. 2000. Stratégie de lutte contre les schistosomiases. In La lutte contre les
schistosomiases en Afrique de l’Ouest, Edition IRD, pp 135-140.
366
FAO. 2001. Améliorer la santé grâce à l'irrigation. Food and Agriculture Organization
of the United Nations. www.fao.org/nouvelle/2001/010305-f.htm Garba, A.; Campagne, C; Poda J.N.; Parent, G.; Kambiré, R.; and Chippaux J.P.; 1999.
Les schistosomiases dans la région de Ziga (Burkina Faso) avant la construction du barrage. Santé publique.
Garba, A.; Barkire, A.A.; Vera, C.; Sellin, B.; and Chippaux, J-P. 2001. Impact de la
sensibilisation des populations dans la lutte contre la bilharziose urinaire au Niger. Cahiers Santé, 11(1):35-42.
GIRE. 2000a. Connaissance des ressources en eau sur le plan quantitatif : pertinence du
système de suivi. Version définitive, rapport technique RT-OTEG – R1. Direction Générale de l’Hydraulique, Ministère de l’Environnement et de l’Eau, Burkina Faso, 185 p.
GIRE. 2000b. Ouvrages de mobilisation des ressources en eau : inventaire et pertinence
du suivi – version provisoire, rapport technique n° RT-OTEG – R1.5 Direction Générale de l’Hydraulique, Ministère de l’Environnement et de l’Eau, Burkina Faso, 35 p.
GIRE. 2001. Etat des lieux des ressources en eau du Burkina Faso et de leur cadre de
gestion (version finale). Direction Générale de l’Hydraulique, Ministère de l’Environnement et de l’Eau, Ouagadougou, Burkina Faso, 243 p.
Habluetzel, A.; Cuzin, N.; Diallo, DA.; Nebié, I.; Belem, S.; Cousens, SN.; and Esposito,
F. 1999. Insecticide-treated curtains reduce the prevalence and intensity of malaria infection in Burkina Faso. Trop. Med. Int. Health, 4: 557-64.
Henry, M.C.; Roger, C.; Audibert, M.; Mathonnat, J.; Dossou-Yovo, J.; and Carnevale, P. 2000. Morbidité palustre en zone rizicole de savane au nord de la Côte d’Ivoire. Cahiers Agriculture 9(5):419.
Henry, M-C.; Rogier, C.; Nzeyimana, I; Assi, S.B.; Dossou-Yovo, J.; Audibert, M.;
Mathonnat, J.; Keundjian, A.; Akodo, E.; Teuscher, T.; and Carnevale, P. 2003. Inland valley rice production systems and malaria infection and disease in the savannah of Côte d’Ivoire. Tropical Medicine and International Health, 8(5):449–458.
Hervouët, J-P. 1980. Du riz et des aveugles, l'onchocercose à Loumana. ORSTOM,
Ouagadougou Burkina Faso, pp10. Hervouët, J-P. 1984. Les effets d'un aménagement hydroagricole sur l'onchocercose :
l'exemple de Loumana, Haute-Volta. ORSTOM, Bobo-Dioulasso Burkina Faso, pp4.
367
Ijumba, J.N.; and Lindsay, S.W. 2001. Impact of irrigation on malaria in Africa: paddies
paradox. Medical & Veterinary Entomology, 15(1):1-11. IIMI. 1997. Analyse diagnostic et performances de 5 périmètres irrigués autour de
barrages au Burkina Faso, Rapport Final. Institut International du Management de l’Irrigation et Ministère de l’Environnement et de l’Eau, Ouagadougou, 254 p.
Klein, J-M.; Ouari, B.; and Carnevale, P. 1989. Enquête sur le devenir des moustiquaires
imprégnées d’un programme de lutte expérimentale contre le paludisme trois ans après leur distribution aux habitans d’un village de la zone de savane au Sud-Ouest du Burkina Faso. ORSTOM, Bobo-Dioulasso, Burkina, 12 p.
Koné, A. 1992. Disparités spatiales du paludisme à Banzon. Mémoire de Maîtrise de
géographie de la santé. Université de Ouagadougou FLASHS, 60 p. Krause, G.; and Sauerborn, R. 2000. Comprehensive community effectiveness of health
care. A study of malaria treatment in children and adults in rural Burkina Faso. Ann. Trop. Paediatr., 20: 273-282.
Le Guen, T. 2000. Aménagements hydro-agro-pastoraux dans la zone soudanienne du
Nord de la Côte d’Ivoire et leur impact sur la santé: le cas des schistosomoses. In Cahiers Agriculture, 9(5):432.
Lorenzi, G. de and Volta, C. 1987. Projet eau potable: rapport final: année 1986. Projet
Eau Potable, Ouagadougou, Burkina Faso, 54 p. Ministère de la Santé. 1993. Programme national de lutte contre les maladies
diarrhéiques au Burkina Faso (1994-1998). Ministère de la Santé de l'Action Sociale et de la Famille, Ouagadougou, Burkina Faso, 44 p.
Ministère de l'Eau. 1989. Etude du bilan d'eau au Burkina Faso. Rapport intermédiaire de la deuxième phase 1987-1990. Tome II : Inventaire des ressources en eau. Ministère de l'Eau du Burkina Faso et Ministère de la Coopération des Pays-Bas, Ouagadougou.
Ministère de l'Eau. 1991. Etude du bilan d'eau au Burkina Faso. Etude du schéma directeur d'approvisionnement en eau potable du Burkina Faso (1990-2005), Version définitive, Tome I: Rapport national. Ministère de l'Eau du Burkina Faso et Ministère de la Coopération des Pays-Bas, Ouagadougou.
MS/CRDI. 2000. Evaluation des liens entre les programmes d’ajustement macro-
économique. La réforme du secteur de la santé et l’accessibilité. L’utilisation et la qualité des services de santé. Rapport Global. Ministère de la Santé de l'Action Sociale et de la Famille, Ouagadougou, Burkina Faso, 110 p.

368
Morin, D. 1990. Contribution a l'amélioration de l'intervention en Aménagement hydroagricole: cadre de référence en santé communautaire. Memoires et Theses, No 3, Université Laval, Québec, 43 p.
Müller, O.; Traoré, C.; Becher, H.; and Kouyaté, B. 2003. Malaria morbidity, treatment-
seeking behaviour, and mortality in a cohort of young children in rural Burkina Faso. Trop. Med. Int. Health., 8:290-296.
Nébié, O. 1984. Les aménagements hydroagricoles au Burkina Faso: analyse et bilan
critiques. Travaux de l’Institut de Géographie de Reims, 83-84:123-140. Ouédraogo, F. de C.; Ira, T.V.; Parent, G. 1998. Etat nutritionnel des jeunes enfants en
relation avec l’activité des mères dans un espace en changement: le cas du barrage de Bagré. Travaux et Recherches Géographiques Lomé Togo: 149-160.
Parent, G.; Zagré, N-M.; Ouédraogo, A.; and Guiguembé, T.R. 2002. Les grands hydro-
aménagements au Burkina Faso contribuent-ils à l'amélioration des situations nutritionnelles des enfants? Cahiers Agricultures, 11(1) :51-57.
Pietra, Y.; Procacci, P.G.; Sabatinelli, G.; Kumlien, S.; Lamizana, L.; and Rotigliano, G.
1991. Impact de l’utilisation des rideaux imprégnés de perméthrine sur le paludisme dans une zone rurale de haute transmission au Burkina Faso. Bull. Soc. Path., 84:375-385.
Pike, E.G. 1987. Engineering against schistosomiasis/bilharzias, Guidelines towards
control of the disease. MacMillan Publishers, London. Poda, J.N. 1985. Les mollusques hôtes intermédiaires des schistosomes dans la province
du Bam. Notes et Documents Burkinabé Burkina Faso, 16(1):53-65. Poda, J.N. 1996. Distribution spatiale des hôtes intermédiaires des schistosomes au
Burkina Faso: facteurs influençant la dynamique des populations de Bulinus truncatus rohlfsi CLESSIN, 1886 et de Bulinus senegalensis MULLER, 1781. Thèse de Doctorat FAST, Ouagadougou, Burkina Faso, 215 p.
Poda, J.N.; Dianou, T.; Kambou, T.; Sawadogo, B.; and Sondo, B. 2001 – Etude
comparative de trois foyers bilharziens à Schistosoma haematobium au Burkina Faso, Parasitologie.
Poda, J.N.; Gagliardi, R.; Kam O.; and Niameogo, T. 2003. La perception des
populations des maladies diarréïques au Burkina Faso: une piste pour l’éducation aux problèmes de santé. VertigO – la revue en sciences de l’environnement, 4(1).
Poda, J.N. and Traoré, A. 2000. Situation des schistosomoses au Burkina Faso – In : La
lutte contre les schistosomoses en Afrique de l’ouest. IRD Paris (France) (Colloques et Séminaires). Séminaires, -18/100/0, Niamey, Niger : 177-195.
369
Procacci, P.G.; Lamizana, L.; Pietra, V.; Di Russo, C.; and Rotigliano, G. 1991.
Utilisation de rideaux imprégnés de perméthrine par les habitants d’une communauté rurale au Burkina Faso. Parassitologia. 33: 93-98.
Robert, V.; and Carnevale, P. 1991. Influence of deltamethrin treatment of bed nets on malaria transmission in the Kou valley, Burkina Faso. Bull. WHO, 69:735-740.
Sawadogo, J.-M. 1994. Le Burkina Faso recueille son eau goutte à goutte: barrages et
puits communautaires dans la bataille de l’eau. Agriculteur Africain, 12: 32-33. Tia E.; Gazin P.; Molez J.-F.; Koné, A.; and Lochouan, L. 1992. Aménagements
hydroagricoles et nuissance culicidienne : l’exemple de Banzon, Burkina Faso. Cahiers d’Etudes et de Recherches Francophones, 2:114-118.
Traoré, P. 2001. Aménagements hydro-agricoles et état nutritionnel des enfants de 0 à 5
ans dans la vallée du Sourou. UFR/SDS, Ouagadougou Burkina Doctorat de médecine, 127 p.
UNICEF. 1988. La Lutte contre les maladies diarrhéiques au Burkina Faso. UNICEF,
Ouagadougou, Burkina Faso, 69p. Villenave, D. 1985. Société, eau espace : la schistosomiase urinaire dans le périmètre
aménagé de Louda, Kaya (Burkian Faso). Notes et documents Burkinabè, 16(3-4):14-50.
Yonkeu, S. 2002 – Conséquence des modifications de l’environnement du barrage de
Yitenga sur la santé de l’écosystème et des populations riveraines. In- 5ème Conférence Inter-Régionale sur l’Environnement et l’Eau-Envirowater 2002 p. 520-531.
Zan, S.; Ouédraogo, J.-B.; Coulibaly, S.O.; and Guiguemdé, T.R. 1993. Enquête
sanitaire de base sur les bilharzioses dans la zone d’aménagement hydroagricole de Bagré, Burkina Faso. Science et technique, Série Sciences Naturelles Burkina Faso, 20(2):93-98.

370
Case Study 3.3
Comparison of formal and informal agricultural water development using selected environmental and social indicators, in
Ghana
Consultant: Gordana Kranjac-Berisavljevic,
Department of Agricultural Mechanisation and Irrigation Technology, University for Development Studies, Tamale, Ghana
With contribution from
Olufunke Cofie, International Water Management Institute, Accra, Ghana
371
SYNTHESIS 3.153 This study was designed to investigate and compare the environmental and social
impacts of selected irrigation projects in Ghana and to come up with appropriate policy and investment recommendations. Indicators for impact measurement were identified from literature and through expert consultation. While some of the indicators can be used for rapid assessment of impact, others will require detailed study. For this pilot study, eight agricultural water projects within the coastal and guinea savanna zones of Ghana were assessed using selected indicators. The project selection was made to reflect differences in types and geographical location and to include structured irrigation ‘schemes’94 i.e. mainly initiated or owned by government and those informal systems that emerged as a result of community or individual initiatives. They include three formal schemes, one groundwater (shallow well) irrigation system, one rainwater harvesting irrigation system, one closed conduit system and two ‘wastewater’95 irrigation set-ups. For each scheme, information was gathered through individual interview and focus group discussions at the farmer level as well as from the scheme managers (where applicable) and district officials. Twenty farmers per scheme were randomly chosen for the individual interview. Some of the key findings from the study are discussed below
3.154 Apart from the 22 formal irrigation schemes recorded in government statistics in
Ghana, several hundreds of water developments projects exist all over the country. These range from shallow well irrigation to the use of wastewater, and rainwater harvesting systems for supplementary irrigation. The extent of these less structured systems is not fully known.
3.155 Sampled farmers from both formal and informal irrigation schemes studied
observed that irrigation has improved their livelihood and wellbeing. While 63% claimed increased financial independence, 37% have used profits from irrigated farming to educate their children, and in some cases have improved their own education from same source. With irrigation, they now have more diversified assets (TVs, bicycles, processing mills etc) as compared to, for example, the traditional investments in livestock before irrigation. Moreover improvements in farmers’ health status were reported and these have been attributed to better access to food, reduced cases of malnutrition and affordability of medical care when necessary. Negative health impacts recognised by the respondents were mostly related to malaria incidences which in this study could not be wholly attributed to water developments as there was no related prevalence test.
3.156 There is a general lack of information on health and environmental impact. Pest
infestation and poor soil fertility are common environmental problems in all the
94‘Schemes’ in this context can refer to structured canals as common in formal irrigation, but also to simple furrow or bed systems in informal irrigation. 95 ‘Wastewater’ (or polluted water) as used in this report refers to a mixture of greywater, surface runoff, sewage effluent and sometimes rainwater all passing through a main drain within the selected settlements.

372
schemes while loss of wildlife, soil erosion, water logging and sedimentation were mentioned in the more structured schemes. Awareness on several health issues is low as capacity building is not currently an organized component of agricultural water development projects in Ghana. Training on integrated pest management (IPM) has been carried out on four of eight selected schemes, while issues on water management as well as health and environment were neglected. There is need for more training of farmers to raise awareness on potential environmental and health problems as well as possible mitigation measures. Issues of special importance include how to recognise different environmental problems, water borne and water related diseases and their management, which mitigating measures are the most effective and who to contact in case of problems.
3.157 In addition to the structured schemes which are managed by Ghana Irrigation
Development Association (GIDA), some of the informal developments seem to have good potential for scaling up. Examples are: the closed conduit system at Tilli which is associated with a minimal disruption of natural ecosystem and the ground water (shallow well) irrigation system at Keta which has been practiced for about a century. However, an expansion of groundwater exploration for irrigation in Ghana would required more information on groundwater storage and recharge. In this regard, Government could increase investment in evaluation of groundwater potential for irrigation, accompanied with the related health and environmental impact assessments.
373
TABLE OF CONTENTS Page List of abbreviations 373 Introduction 374
• Study background 374 • Agricultural water developments and government support in Ghana 375 • Past studies on the impact of agricultural water development projects 377
Study Methodology 380 Results and Discussions 387
• General socio-economic characteristics of respondents 387 • Health Impact of different agricultural water development projects 392 • Environmental impact of different types of agricultural water development 392
Formal irrigation scheme 393 Ground water irrigation 394 Wastewater irrigation 395 Water harvesting 396
• Mitigating adverse health and environmental effects of selected water development projects 397
Conclusion and Recommendations for Policy and investment 401 References 403

374
List of Abbreviations
AIDS - ACQUIRED IMMUNE DEFICIENCY SYNDROME
EPA - Environmental Protection Agency EIA - Environmental Impact Assessment GIDA - Ghana Irrigation Development Authority GPRS - Ghana Poverty Reduction Strategy
HIV - HUMAN IMMUNE DEFICIENCY VIRUS
ICOUR Irrigation Company of the Upper Region IPM - Integrated Pest Management IWMI - International Water Management Institute LACOSREP Land Conservation and Smallholde Rehabilitation Project MoFA - Ministry of Food and Agriculture STD - Sexual Transmitted Diseases UDS - University for Development Studies WUA - Water Users Association

375
INTRODUCTION
Study background
3.158 Ghana is a tropical semi humid country with a population of about 20 million.
Annual rainfall varies from 890 mm/year in the coastal zone to 2030 mm/year in the western parts of the country. The rainfall is bi-modal in the south and mono-modal in the north. The country’s water resources are estimated to be 53.2 km3 per year, consisting of 30.3km3/year of internally produced water resources and 22.9km3/year of runoff from other countries (FAO, 1998). Agriculture plays a major role in the social and economic life of the country. In 2000, the agricultural sector employed about 65% of the work force, accounted for approximately 40% of total export and contributed 41% to Gross Domestic Product, GDP (GIDA/JICA, 2004). The country is heavily reliant on rainfed crop production and agriculture is not able to meet the domestic demand for food. The total arable land area is 13.6 million ha of which only about 4.76 million ha is actively cultivated. An expansion in the current area of land under irrigation is anticipated in the near future.
3.159 Irrigation schemes are often controversial development projects. While critics point to the negative impacts, others argue that they considerably improve livelihoods by increasing food security and reducing poverty. However, agricultural water developments can have different impact depending on their location and measures considered and carried out during feasibility and project construction phases. The main objective of this case study was to compare different agricultural water development initiatives in Ghana using selected environmental and social indicators. Specifically, the study was designed to:
• Make a rapid assessment of the extent and impacts of the informal schemes as compared to the formal ones
• Document relevant indicators that might be used to predict the impact of a particular agricultural water development
• Investigate a range of such indicators and make a comparison of selected formal and informal irrigation projects in Ghana
3.160 It was anticipated that the findings of this study would provide assistance to donor agencies for policy guidelines on future investment in both formal and informal irrigation developments in Ghana, and sub-Saharan Africa in general. The report consists of a brief overview on agricultural water development in Ghana based on
376
literature survey and also findings carried out by a pilot study with focus on eight different schemes selected from the northern and southern part of the country.
Agricultural water development and government support in Ghana
3.161 In the 1970s, Ghana adopted the self-sufficiency policy which resulted in the creation of Ghana Irrigation Development Authority (GIDA), a division under the Ministry of Food and Agriculture (MoFA) in 1977. The GIDA was fashioned as the sole agency involved in the development and management of irrigation schemes providing all agricultural inputs and extension services. It operated and maintained the systems, delivered water to the farmer's fields and secured credit for agricultural inputs. GIDA was originally mandated to deal with structured government irrigation systems and became only recently interested in informal irrigation developments in peri-urban agriculture or around small reservoirs. Policies to deal with informal schemes are still under development in Ghana.
3.162 Different forms of irrigation varying from large scale, structured schemes to small, traditional irrigation systems using hand dug wells and water harvesting structures can be found in the country. For the purpose of this report, the various irrigation systems have been grouped under the formal and informal, although some of the systems do not fit neatly on one side or the other of this classification, but they rather bridge the divide.
The formal scheme
3.163 Formal irrigation schemes here refer to structured systems which are mainly initiated or owned by the government. Formal schemes in Ghana cover an array of sizes, technologies and organizational arrangements. GIDA acquires all project land by legislation and leases it out to interested farmers on a short-term basis while farmers pay an irrigation service charge which depends on irrigation type. At present, GIDA has 22 on-going projects, scattered throughout the country, with sizes of schemes ranging from 10 to about 3,000 ha. Three of the schemes are completely out of production while another 3 are operational only during rainy season, thus providing supplementary irrigation. The total area developed by GIDA for irrigation is about 8700 ha but as at June 2003, only about half of this was actually irrigated (GIDA/JICA, 2004), due to breakdown of facilities, and in some cases, inadequate farm machinery. According to recent studies (Nagayo, 2004), irrigation systems using pumps have a land utilization rate of only about 10%, while those based on gravity or pumps+gravity reach 42-64% of the area
377
developed for irrigation. Untill 1990 all formal irrigations schemes were under governmental management through GIDA. However, since 1990, the management of formal schemes is increasingly transferred to farmers’ organisations. Due to its poor performance, Ghana’s formal irrigation sector covers less than 1% of Ghana’s actively cultivated land and also only about 1% of its agricultural aggregate output (Van Edig et al., 2002).
Informal irrigation systems
3.164 Informal irrigation set-ups refer to usually less structured agricultural water
development projects constructed and owned by individuals or small community groups, often without sophisticated equipment or intensive capital use and intensive capital. It includes surface and overhead irrigation through diverting watercourses, or water from ponds, drains, harvested rainwater, untreated sewage as well as groundwater irrigation using water from shallow, hand dug wells. Some of the informal systems have a long tradition.
3.165 Government statistics do not contain information about the extent of informal
irrigation in Ghana and there is only a patchwork of data available. Several hundreds of small reservoirs exist in northern Ghana and are used for dry season irrigation as well as for livestock or domestic purposes. In the Upper East region alone, over 200 of such small reservoirs are found. Hand dug wells are also used to extract groundwater from alluvial channels along the courses of ephemeral streams during the dry season in both Upper East and Upper West Regions. Down south in Keta and Anloga districts of Volta Region, large areas of land under groundwater irrigation (shallow hand dug wells) have been used by smallholder farmers for over a century.
3.166 In the peri-urban areas, farmers are driven by the prospect of ready market and
possibility of additional income during the dry season to irrigate rapidly increasing land areas. HR Wallingford (2000) estimated that around the city of Kumasi, there are about 11,900 ha of land irrigated through informal irrigation, which is more than the figure quoted for formal irrigation systems in the whole country. Seasonal irrigation around the city has been reported to contribute about 80% of primary income of households involved (Cornish and Lawrence, 2001). Irrigated agriculture using wastewater is practiced by many individuals in urban and peri-urban areas without any support from Government or Non Governmental Organisations (NGOs) (Keraita et al 2002, Abdul-Ghanyu et al 2002).
378
The Accelerated Agriculture Growth and development Strategy and other agricultural water development policies in Ghanaes
3.167 Some recent policies in Ghana support agricultural water development. The
Ghana Poverty Reduction Strategy (GPRS) 2003-2005, discusses the poverty dimension in the country and outlines programmes of Ministries to achieve poverty reduction including the improvement of agriculture through irrigation. In the 1990s, the Ministry of Food and Agriculture (MoFA) formulated an Accelerated Agricultural Growth and Development Strategy designed to increase the sector’s annual growth rate from 2-3 % (1990-96) to 5-6 % as programmed in Ghana’s ‘Vision 2020’. According to the ‘Vision 2020’ policy document, the total area under irrigation will be extended from 8,700 to at least 100,000 ha by 2020. This would imply a future water consumption of up to 4,114 m3 x 106. With an increased cropping intensity for the Volta Basin alone, this implies a six-fold increase in annual demand for irrigation water, from 0.565 km3 in 2000, to 3.605 km3 in 2020 (Van Edig et al 2002). However, Nagayo (2004) considers the ‘Vision 2020’ as completely unrealistic, considering Ghana’s ability to maintain so far only 5200 ha under formal irrigation. The Ministry of Food and Agriculture (MoFA), through a number of projects such as the Small Scale Irrigation Projects (SSIP), the Village Infrastructure Project (VIP), Land Conservation and Smallholder Rehabilitation Project (LACOSREP, IFAD funded) etc, is undertaking various forms of investments in agricultural water development. Some of these projects have been subjected to Strategic Environmental Assessment which gives a broad framework from which individual projects or sub-project will dove–tail, while details on health and the environment are often concealed. In any case, it should be noted that Ghana’s Environmental Protection Agency (EPA) started to demand an EIA for irrigation projects only very recently (1999). Furthermore, EIA is required for commencement of new irrigation schemes, while the existing ones were not considered.
Past studies on the impact of agricultural water development projects in Ghana 3.168 For many years, most agricultural investments in Ghana were considered
beneficial as they were intended to improve some aspects of agricultural production. Consequently, there exist only a few studies which try to address various forms of impact, and only a few used quantitative analyses. But agricultural water development projects in Ghana can have both positive and negative impacts. On the positive side, irrigation has led to increased food supply, income and improved the nutrition as well as livelihood of the farmers. On the
379
other hand, it has led to socio-cultural changes and increased incidence of water-borne diseases.
3.169 A study carried out by Sam (1993) on selected formal irrigation schemes in
Ghana showed that with irrigation, economic activities such as fishing, farming and trading have increased absolute incomes in related communities as well as food supply and nutrition. For example, average annual post-project farm income at Tono, Weija and Dawhenya irrigation projects was about 3, 7 and 13 times higher than the average annual farm income before the irrigation projects. However, he also reported that traditional cultural practices which have sustained the identities of some communities have been undermined by some irrigation projects. In particular, at Tono and Vea irrigation schemes, sacred places of ancestors were destroyed during the construction of irrigation projects. Also, social life of the people was affected: at Dawhenya, farmers no more gather to sing, drum and dance in the evenings because of tiredness after the day’s job at the irrigation project. Moreover, Sam (1993) reported that some communities living near irrigation projects complained of an upsurge in the stealing of farm produce. In the same study, increase in fauna populations of rodents, snakes and water fowls was observed at various irrigation projects while large reservoirs in Tono, Weija and Dawhenya have altered the speed of winds in their localities.
3.170 Besides socio-cultural and environmental impacts enumerated above, one of the
most serious problems on irrigation projects is the potential health hazard resulting from multiple use of reservoirs particularly, the use of open water channels for drinking, bathing, washing of clothes and disposal of human and animal wastes (Hillel, 1997). Data collected during 1960-61 period showed high prevalence of schistosomiasis in the eastern, more densely settled part of what was then the Upper Region of Ghana. The mean prevalence of urinary schistosomiasis in the region's eastern part was 20% in 15 districts without dams, 42% in 16 districts with dams 12 years old, and 52% for 6 districts with dams of 3 years old. While areas in the western part of the region with few or no dams had infection rates under 10% in 6 districts, and 10 – 29 % in 10 other districts, prevalence was over 70% in 2 of the 3 western districts containing dams (FAO, 1996). In more recent studies, schistomiasis has also been found to be associated with water developments. In the Upper East Region of Ghana about 104 earth dams were built within 3 years during which the regional rate of schistosomiasis increased three folds from 17% to 51% prevalence. A survey conducted in the region in 1997, indicated a 40 year ecological entrenchment of elevated levels of schistosomiasis with reference to 1957, when a major project in agricultural water development was commissioned. These high prevalence levels of water borne and water related diseases have been attributed to negligence in planning (Hunter, 2003). Health status and general wellbeing of the farmer determines the level of productivity.In Cameroon, health and productivity observations were made for rice-growers and it was found that a 10% reduction in the incidence of urinary schistosomiasis resulted in 4% increase in rice production (Audibert, 1986).

380
3.171 An epidemiological survey was carried out to ascertain the transmission
characteristics of bancroftian filariasis at Okyereko irrigation project in southern Ghana in both dry and wet seasons of 1999. High vector population and related epidemiological consequences were observed in both seasons. (Dzodzomenyo et al., 1999). It was further reported that since the construction of the Okyereko dam, malaria transmission has been intense in the community. In another instance, a reconnaissance survey of lymphatic filariasis in north-east Ghana showed that all communities reporting filariasis as a public health problem had once benefited from agricultural water developments such as small size village dams (Hunter et al.,1993). The study of Appawu et al., (2001) in Upper East Region also indicated that infectivity rates and annual transmission potential of Anopheles gambiae were significantly higher in farming communities practicing irrigation than non irrigation communities.
3.172 In summary, it is clear that some agricultural water development schemes have
brought significant benefits, while others have caused obvious environmental damage and social change. However, there are few direct comparisons of the impact of different approaches to irrigation. This study is a first attempt to fill this gap in Ghana.

381
STUDY METHODOLOGY
Identification of Appropriate Indicators
3.173 As described in the introduction, IWMI carried out a pilot study comparing social,
health and environmental impacts in eight formal and informal irrigation schemes in different parts of Ghana. A literature review of possible indicators for assessment of the impact of different kinds of irrigation schemes was carried out prior to field investigations. From the review possible impacts and their measurable indicators have been compiled and presented in Table 3.1. Impact of agricultural water development can result directly from the use of water for irrigation or indirectly due to the use of the available water for domestic and other productive purposes such as, fishing, livestock, processing. Indirect impact from the use of agricultural water for other productive purposes has not been included in the list. While certain indicators e.g improved social habits, can only be described qualitatively, a few others can be measured through rapid assessment or detailed study. At the beginning of the study, questionnaires were developed to reflect these indicators but after expert consultations and preliminary field visit to pre-test the questionnaires, only selected indicators (indicated as ‘used’ in Table 3.1) were used for actual survey. This is because the data required for such indicators were either not available or could not be measured within the short time available for this rapid assessment
Table .3.1: List of likely impacts and their measurable indicators

382
Type of Impacts Measurable Indicators Indicators used in field studies
Socio-economic Employment opportunities in farming
• Number of households involved in irrigation scheme
Used
Food security • Income generated from irrigated farming Used Improved standard of living • Acquired assets through irrigated farming Used Increased economic and social activities
• Type and abundance Not used
Improved domestic water supply
• Proportion of population using irrigation water for domestic activities
Used
Change in population • Immigration/emigration due to scheme Not used Environmental Impact Area inundated • Population displaced
• Habitat damaged Not used Used
Flooding of adjacent areas during heavy rains
• Area flooded Not used
Reduced downstream water flow • Stream diversion • No of conflict with downstream users
Not used
Poor water quality due to pollution with agrochemicals, sediments and disease pathogens
• Solid concentration and oxygen loading • Concentration of nutrients and trace elements • Pesticide levels; microbial contamination
Not used Not used
Not used
Low ground water levels • Declining water table Not used
Subsidence or caving in of nearby porous rock formation due to over abstraction of groundwater
• Number and frequency of occurrence Not used
Drowning of children and other vulnerable persons
• Number of cases
Water logging • Soil moisture content Not used Reduced yield compared to non irrigated farms
• Soil salinity • Soil fertility
Not used Used
Increased weed growth • Species identification and abundance Used Increased sedimentation of channels
• Sediment load of drainage water Not used
Proliferation of aquatic weeds • Species identification and abundance Used Algal blooms
• Oxygen loading; Nutrients; Trace elements; Pesticide levels; Biological parameters
Not used
Pests invasion • Species identification and abundance Used Increased population of migrant birds
• Species identification and abundance
Soil erosion • Sedimentation evidence in channels and streams Used Health Impact Improved nutrition and well being • No of meals per day, children’s body weight vs. height Not used Poor health status
Incidence or prevalence of : • Malaria • Schistosomiasis • Diarrhoea • Guinea worm; Other water related diseases
Used

383
Field measurement of selected indicators
3.174 Eight water development schemes in five districts located in four regions across the country were selected for study. They are:
• a large (850 ha) and a small (25ha) formal scheme at Vea and Lamboya, respectively, both in the Upper East region;
• the first ever government planned irrigation project constructed at Dawhenya in the early days of Ghanaian independence, in the Greater Accra Region;
• a shallow well irrigation area which has been in existence for more than 100 years at Keta close to the coast in the Volta Region;
• a closed conduit irrigation system at Tilli in Upper East region;
• irrigation in an inland valley based on supplementary rainwater harvesting (the Gbirimah project, Northern region)
• two wastewater irrigation systems, one in the north (“Zaguyiri” near Tamale in the Northern Region) and the other in the south (“Mitchel Camp” near Tema in the Greater Accra Region).
3.175 Irrigation schemes were selected from only two of the five agroecological zones (AEZs) in Ghana: the Guinea Savanna Ecological Zone (northern part of Ghana) and in the Coastal Savanna Ecological Zone (Southern Ghana). The choice of these two AEZs is based on their peculiarity: the northern part of Ghana has the largest number of irrigation developments, most of which are small scale informal and farmer managed. The southern with usually insufficient rainfall in the minor season has a great attraction for all year round irrigation. The scheme selection was made to reflect differences in types and to include systems that were mainly initiated or owned by government and those systems that emerged as a result of community or individual initiatives. Main agroecological zones and study sites are shown in Fig 3.1 while general information on the selected schemes are presented in Table 3.2
3.176 For each scheme, information was gathered through individual questionnaire interview and focus group discussions at the farmer level as well as from the scheme managers (in formal set-ups) and district officials. Twenty farmers per scheme were randomly chosen for the individual interview making a total of 160 farmers. Information gathered and data obtained were analysed using descriptive statistics. Vea, Lamboya and Dawhenya schemes represent the typical formal types while Keta, Zaguyiri and Mitchel are typical informal schemes. Tilli and Gbirimah schemes fall in between formal and informal types which shows that in some cases it is fairly difficult to have a clear separation of schemes into formal/informal. Tilli scheme which was initiated by a community church is fairly well structured like formal schemes while Gbirimah scheme was actually initiated

384
by the government but is a typical example of water harvesting systems commonly practiced by individuals and communities in the country. Both have been added to the informal category in this report. In order to simplify the discussions on the various types schemes, the socio-economic characteristics and health impacts are discussed generally for all the schemes while environmental impacts are presented in four categories: formal irrigation scheme (Vea, Lamboya and Dawhenya); groundwater irrigation (Keta); wastewater irrigation (Zaguyiri and Mitchel); and water harvesting system (Gbirimah)
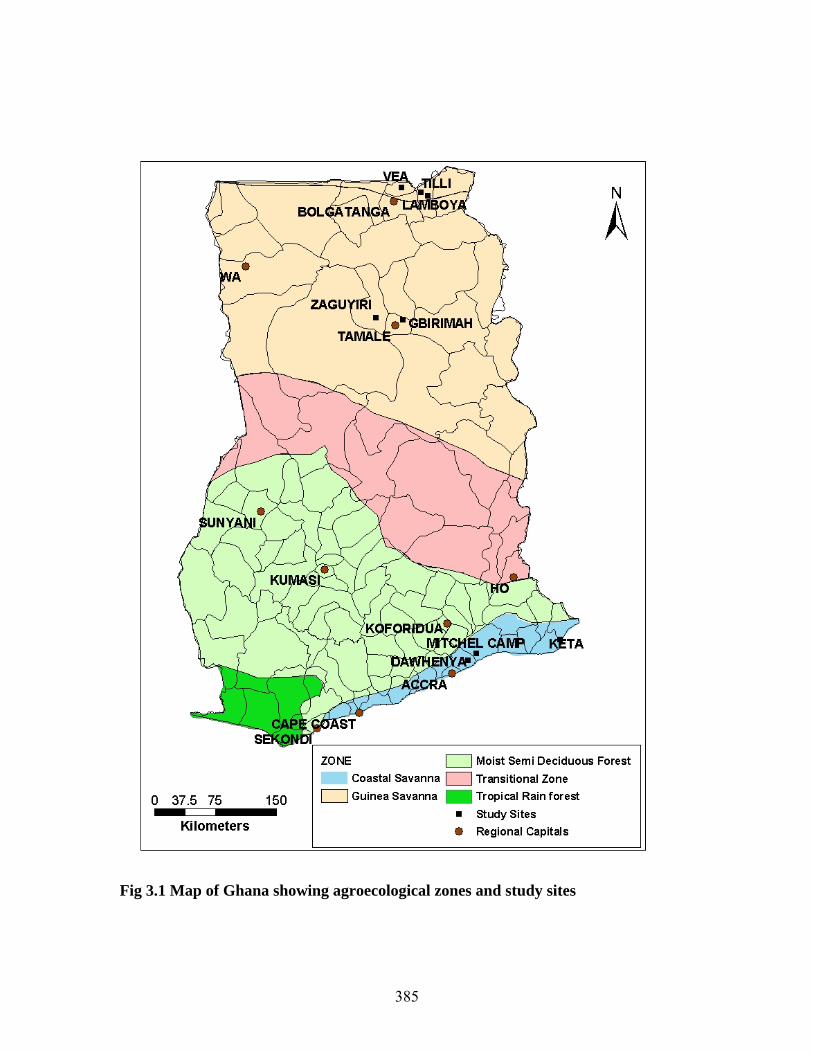
385
Fig 3.1 Map of Ghana showing agroecological zones and study sites

386
Table 3.2: General characteristics of selected Agricultural Water Developments projects in Ghana.
Name of Scheme Keta Dawhenya Mitchel Camp Zaguyiri Gbirimah Vea Lamboya Tili
Zone: Coastal Savanna Ecological Zone Guinea Savanna Ecological Zone
Political Region: Volta Greater Accra Northern Upper East Upper East
District: Keta Dangme West Tema Tamale Bongo/Bolgatanga Bawku West
Latitude (oN): 5o48’ 5o55’ N 5 o45’N 9o28’ 9o28’ 10o45’ Not available 10o53’
Longitude (oE/W) 0o54’E 0 o10’E 0 o07’W 0o50’W 0o45’W 1o W Not available 0o32’W
Rainfall (mm/annum): 600-800 1100 900-1000
Size of Water Development
10,000 ha (estimate)
197 ha
10 ha
5 ha
1,000 ha (estimate
850 ha
25 ha
12 ha
Type of water development
Informal Formal Informal Informal Informal formal Formal Informal
Year started More than 100 years of shallow well utilisation
1959 Not available 1960s 1998 1965 2000 1997
Fitness in government’s strategic frameworks
Food security and water resources development
Food security NA NA Food security and employment generation
Food security Poverty reduction strategy
Target population Not applicable Communities with only fishing as occupation prior to project
Not applicable Not applicable Rice growing communities in 3 valleys
8 communities where rural-urban migration was a problem
About 625 people
About 4000 people in the community

387
Estimated number of people involved
200 000 222 220 250 2475 2 000 237 200
Source of water Groundwater Surface Water Wastewater Wastewater Water harvesting
Surface Water
Surface Water
Surface Water
System Operation Shallow Well Intermittent flow Intermittent flow
Intermittent flow Continuous flow
Intermittent flow
Intermittent flow
Intermittent flow
Irrigation methods Overhead irrigation using bucket, watering can, treadle pump, Diesel powered pump or mini sprinklers.
Open channels; main channels are lined, while laterals lines are earthen
Rice is grown in flooded basins
Manual lifting of water from main channel. Then overhead irrigation using bucket or watering can
Manual lifting of water from main channel. Followed by overhead irrigation of raised beds using bucket or watering can
Open channels
Rice in flooded basins
Open channel flow
Open ended furrows and rice in basins
Open channel
flow
Open ended furrows
Closed conduit system
Overhead irrigation of sunken beds from bucket or watering can
Average volume of water extracted
annually m3/ha
986/well 19,500
53,253 6,408
(Supplementary)
5,850
35 986 55, 000
42,606
Overall project irrigation efficiency* (%)
Not available 52% calculated in 1993/94, currently not measured (management of the scheme transferred to farmers)
Not available Not available Not available 47.3 % for the period
1989-95:
14.4 %
Calculated in 2002
48.8 %
Calculated in 2002
*These are efficiency figures (calculated after Bos and Nuitgeren, 1979- ICID methodology) obtained from project reports of the various schemes and literature published but not from the practical field work/measurements in this study.
388
RESULTS AND DISCUSSIONS
General socio-economic characteristics of respondents
3.177 Out of the 160 farmers interviewed, 65% were men, while 35% were women.
Generally, women do not have access to land under most of the traditional Ghanaian systems of land tenure, they have to acquire their plots through the male family members (husband, father, brother,). However in irrigation systems, women form a substantial portion of the total number of farmers. Acquisition of irrigated plots in their own right is therefore an important improvement in their livelihoods. In this study, more women than men were found in the wastewater irrigation systems (Table 3.3). The average age of farmers engaged in irrigation was about 40 years and they have been practicing irrigated farming for about 9 years. On the average, 68% of the respondents do full-time irrigation, while the rest are engaged in dry season irrigation with rainfed agriculture during the rainy season. More than half of the farmers did not have formal education, a majority of those who had access to formal education stopped at secondary school level.
3.178 Rice and vegetables are the main crops grown in the schemes. Rice is peculiar
to the government schemes where in some cases, vegetables are also cultivated off-season. The private schemes specialise on vegetable farming. Sizes of farm holdings are larger in the north than in the south, due to generally less population density and pressure on the land. Irrigated farming is considered as a family business. Respondents mentioned that up to four household members are engaged in the farm at any given time. Eighty-two of sample farmers are members of farmers’ association which serve as mutual self-help channels for inputs and credit.
3.179 Forty-eight percent of the respondents have access to piped water and 36%
access boreholes (36%) for domestic water supply. Others use streams or dug-outs. Lack of adequate sanitation facilities is a major problem; only 23% of the respondents have proper sanitary facility (e.g. septic latrine, pit latrine or sewerage system), while a great majority (78%) have no access.
3.180 Irrigation farming is seen as an income generating activity. On the average, about 49% of the income of respondents was attributed to irrigation. This however varies with type of water development. While farmers at Gbirimah water harvesting scheme reported only 22%, those at Dawhenya and Keta indicated that 71% and 78 % of their total annual income respectively come from irrigation (Table 3.3). This is probably due to the fact that irrigation at Gbrimah serves only to supplement rainfed agriculture while the latter ones are high in-and output’ schemes. Only a very small portion (average of 7%) of

389
irrigated crops is consumed by the household, the remaining come from rainfed agriculture and food purchases. In all, 61% of the respondents from the Coastal savanna agroecological zone indicated that their income comes from irrigated land, while in the Guinea savanna zone, the estimated percentage of income from irrigation was about 41%.

390
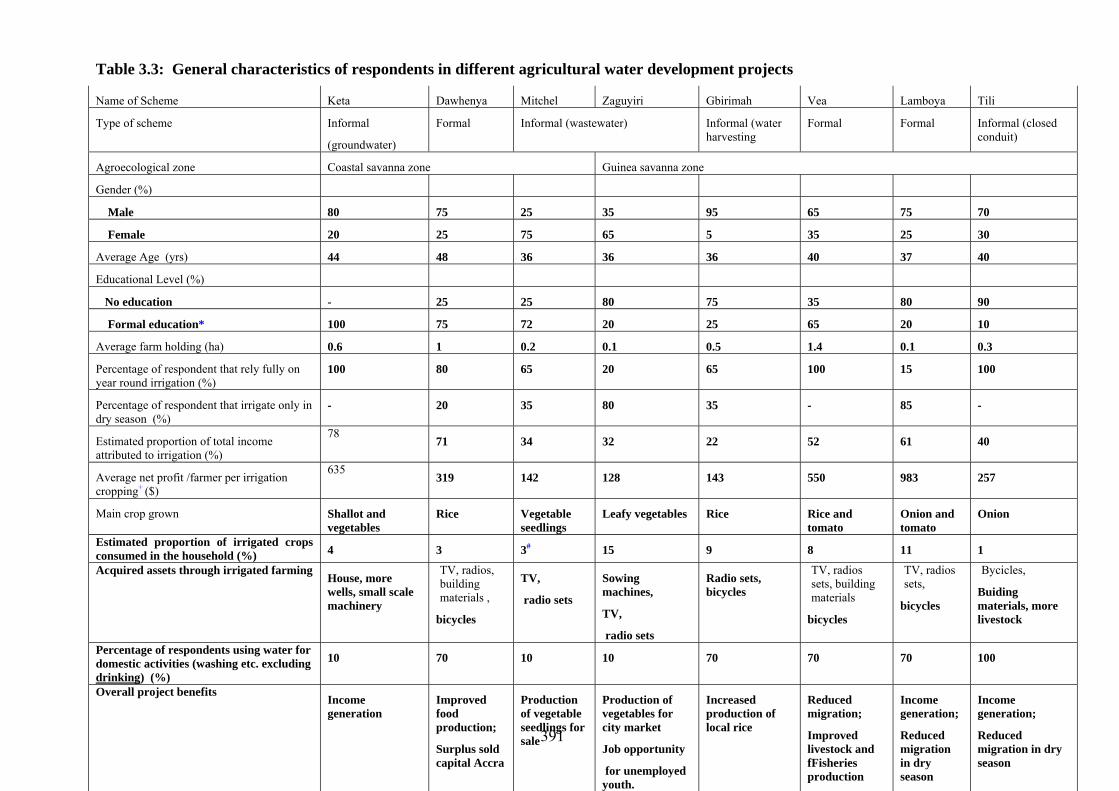
391
Table 3.3: General characteristics of respondents in different agricultural water development projects
Name of Scheme Keta Dawhenya Mitchel Zaguyiri Gbirimah Vea Lamboya Tili
Type of scheme Informal
(groundwater)
Formal Informal (wastewater) Informal (water harvesting
Formal Formal Informal (closed conduit)
Agroecological zone Coastal savanna zone Guinea savanna zone
Gender (%)
Male 80 75 25 35 95 65 75 70
Female 20 25 75 65 5 35 25 30
Average Age (yrs) 44 48 36 36 36 40 37 40
Educational Level (%)
No education - 25 25 80 75 35 80 90
Formal education* 100 75 72 20 25 65 20 10
Average farm holding (ha) 0.6 1 0.2 0.1 0.5 1.4 0.1 0.3
Percentage of respondent that rely fully on year round irrigation (%)
100 80 65 20 65 100 15 100
Percentage of respondent that irrigate only in dry season (%)
- 20 35 80 35 - 85 -
Estimated proportion of total income attributed to irrigation (%)
78 71 34 32 22 52 61 40
Average net profit /farmer per irrigation cropping+ ($)
635 319 142 128 143 550 983 257
Main crop grown Shallot and vegetables
Rice Vegetable seedlings
Leafy vegetables Rice Rice and tomato
Onion and tomato
Onion
Estimated proportion of irrigated crops consumed in the household (%) 4 3 3# 15 9 8 11 1
Acquired assets through irrigated farming House, more wells, small scale machinery
TV, radios, building materials ,
bicycles
TV,
radio sets
Sowing machines,
TV,
radio sets
Radio sets, bicycles
TV, radios sets, building materials
bicycles
TV, radios sets,
bicycles
Bycicles,
Buiding materials, more livestock
Percentage of respondents using water for domestic activities (washing etc. excluding drinking) (%)
10 70 10 10 70 70 70 100
Overall project benefits Income generation
Improved food production;
Surplus sold capital Accra
Production of vegetable seedlings for sale
Production of vegetables for city market
Job opportunity
for unemployed youth.
Increased production of local rice
Reduced migration;
Improved livestock and fFisheries production
Income generation;
Reduced migration in dry season
Income generation;
Reduced migration in dry season

392
*This includes primary, secondary and Tertiary education; + Number of cropping in a year vary from scheme to scheme and from year to year # Refers to percentage not sold out but used by farmer
393
3.181 Almost all respondents considered irrigation to have improved their livelihood, Sixty-three percent claimed increased financial independence, 37% have used profits from irrigated farming to educate their children, and in some cases have been able to improve their own education. Moreover, respondents testified to possession of more diversified assets (possession of radio and TV sets, bicycles, houses or building materials, processing mills etc.) with irrigation.
Health Impact of different agricultural water development projects 3.182 In the schemes under investigation, the respondents attested to improvements
in their health status over time. These improvements were attributed to additional income from irrigated agricultural production which they have used for more food purchases and therefore reduced cases of malnutrition. Income generated from irrigation has also been used by respondents to access health facilities when in need of medical care. Negative health impacts recognised by the respondents were mostly related to malaria incidences. In the formal schemes, the farmers observed that malaria and other water related diseases such as schistosomiasis, increased following the introduction of the scheme. These problems could be due to creation of breeding grounds for vectors of water borne and water related diseases (mosquito larvae, snails, etc). Potential health risks are associated with the use of highly polluted water for irrigation as described under the chapter on wastewater irrigation.
3.183 Additional information on disease incidence was gathered at the district health offices. The study revealed that malaria was a leading water related disease in all communites. Incidence of malaria has been monitored systematically over the past three years in Tamale Municipality (where Zaguyiri and Gbirimah schemes are situated). It was observed that the number of cases is on the increase; as well as the number of guinea worm infestation. High incidence of malaria is a major concern, but this cannot be solely attributed to agricultural water development, as the whole of Ghana lies in a highly malaria prone area. In all the other districts, only information for year 2003 was readily available. Reported cases of intestinal nematodes, diarrhea, and skin/eye infections and cholera were found to be prominent in all the districts visited. However, incidence of these diseases could not all be linked to the various water developments as prevalence studies were not done. It could be argued that poor sanitation observed almost everywhere could be a major contributor to some of the diseases. A more detailed study would be required to establish disease prevalence in relation to agricultural water developments
Environmental Impact of different agricultural water developments projects
394
Formal Irrigation schemes
3.184 Establishment of the formal scheme (Vea, Lamboya and Dawhenya) involved
complete clearance of natural vegetation cover in the command area with the associated potential of negative impacts on the microclimate. In many cases it involved the construction of a dam and water reservoir. The environmental impact of construction of dams and water reservoirs have been reported by McCartney et al. (2004) to include destruction of crops and natural vegetation in the reservoir area due to flooding, aquatic weeds proliferation, changes in groundwater regime and modifications in microclimate. Excessive removal of vegetation exposes the soil to erosion thereby leading to a loss of top soil and nutrient leaching. The clearing of vegetation also disrupts the water cycle, increasing the rate of runoff, changing flow regimes and increasing siltation in the downstream zone (Dougherty and Hill, 1995).
3.185 The source of water and type of irrigation system used has impact on scheme
environment. The principal source of water for all the formal schemes selected for the study was surface water, channeled through open earthen or lined canals. Rice is then grown in flooded basins and vegetables on ridges supplied by water through open ended furrows. The mode of system operation was intermittent flow in almost all the cases. Open channels are frequently associated with sedimentation, in the northern part of the country, at the start of the rainy season, when lands are bare of vegetation after the long dry period. Therefore it is not surprising that 85% and 95% of sampled farmers at Lamboya and at Vea, respectively, indicated sedimentation of canals as one of their main problems. Farmers’ participatory scheme management can take care of these problems (Nagayo, 2004). At the time of field survey (August 2004), farmers at the large Vea scheme (850 ha) were still waiting for the scheme managing company (Irrigation Company of Upper Region, ICOUR) to clean up irrigation canals. At Dahwenya irrigation project, on the other hand, all irrigation channels are usually drained and desilted by the farmer group before beginning of each irrigation season.
3.186 At Vea, effect of irrigated agriculture on the wildlife population (reduction in
crocodiles) was reported by respondents, while at Dawhenya, the natural habitats of monkeys and birds were destroyed because of the irrigation project. The aggregate response of farmers in formal irrigation schemes with regards to environmental problems is presented in Fig. 3.2. Agricultural weeds, pests and soil fertility depletion were the most frequently mentioned problems.
3.187 Apart from agricultural weeds aquatic weeds was observed in some of the
formal schemes. It was not considered to pose serious problem at Dawhenya scheme, but Pistia stratiotes, Vallisneria sp. Nymphea lotus were present in significant amounts in the main drain of Lamboya irrigation scheme. The presence of weeds in farm lands is highly provocative and could encourage excessive use of herbicides. For example, there have been reports of poor
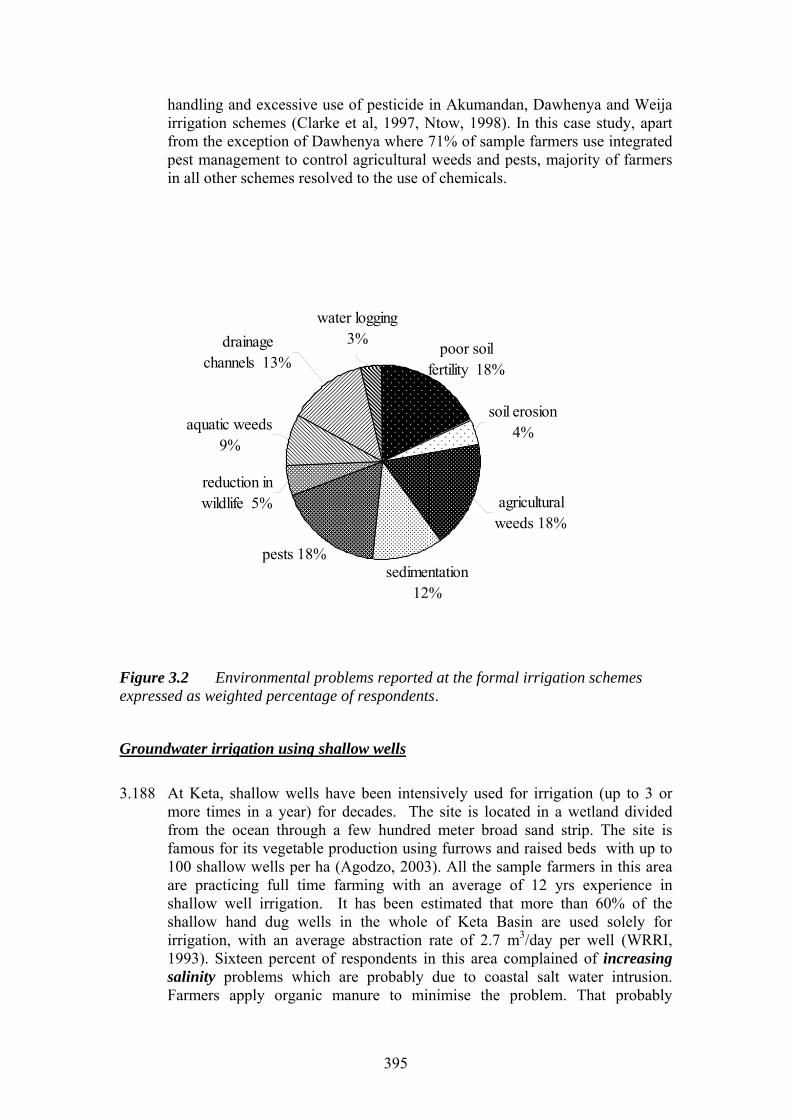
395
handling and excessive use of pesticide in Akumandan, Dawhenya and Weija irrigation schemes (Clarke et al, 1997, Ntow, 1998). In this case study, apart from the exception of Dawhenya where 71% of sample farmers use integrated pest management to control agricultural weeds and pests, majority of farmers in all other schemes resolved to the use of chemicals.
poor soil fertility 18%
water logging 3%drainage
channels 13%
aquatic weeds 9%
reduction in wildlife 5%
soil erosion 4%
agricultural weeds 18%
pests 18%sedimentation
12%
Figure 3.2 Environmental problems reported at the formal irrigation schemes expressed as weighted percentage of respondents.
Groundwater irrigation using shallow wells
3.188 At Keta, shallow wells have been intensively used for irrigation (up to 3 or
more times in a year) for decades. The site is located in a wetland divided from the ocean through a few hundred meter broad sand strip. The site is famous for its vegetable production using furrows and raised beds with up to 100 shallow wells per ha (Agodzo, 2003). All the sample farmers in this area are practicing full time farming with an average of 12 yrs experience in shallow well irrigation. It has been estimated that more than 60% of the shallow hand dug wells in the whole of Keta Basin are used solely for irrigation, with an average abstraction rate of 2.7 m3/day per well (WRRI, 1993). Sixteen percent of respondents in this area complained of increasing salinity problems which are probably due to coastal salt water intrusion. Farmers apply organic manure to minimise the problem. That probably
396
explains why 80% of respondents at this location use organic manure which is more than as recorded among respondents in other irrigation sites. Organic manure improves soil permeability and releases carbon dioxide and some organic acids during decomposition This helps in lowering soil pH, releasing calcium by solubilization of calcium carbonate (CaCO3) and other minerals and replacement of exchangeable sodium by basic cations such as calcium and magnesium thereby lowering the exchangeable sodium percentage and hence reducing salinity (Rhoades et al. 1992). Moreover, spreading organic materials on the soil surface will reduce evaporation losses and decrease the opportunity for soil salinization. Another prominent problems in this site is pests infestation such as soil nematode and borers.
3.189 In Ghana, groundwater resources have so far been mostly developed for
domestic use, particularly for rural water supply through boreholes. However, recent initiatives by MoFA considered groundwater exploration as one of the options for future small scale irrigation developments provided the water yield is sufficient as the groundwater yield is generally low and hence not readily used for irrigation. Studies carried out in the Northern Region (Kwei, 1997) showed no chemical contamination in groundwater, but rather problems of turbidity and colour, which do not constitute limiting factor in irrigation
Wastewater irrigation 3.190 At Zaguyiri and Mitchel schemes, based on the use of wastewater, common
challenges for all the farmers were weeds and poor soil fertility. Incidence of pests, such as red ants and nematodes were reported at Mitchel Camp to cause up to 50% of crop losses. There is also potential impact of the use of polluted water for irrigation and of misuse of pesticides but farmers were not aware of this. Continuous use of highly polluted water as in these cases can lead to soil contamination and eutrophication. The annual volume of polluted water used was estimated to range from 6,408 m3/ha at Zaguyiri to 53,253 m3/ha at Mitchel respectively. Impact on soil and water was not analysed in this rapid assessment but previous studies by Abdul-Ghaniyu et al. (2002) in six vegetable gardening sites within Tamale showed faecal coliform levels higher than 2x10⁶/100 ml for all sites. IWMI studies (unpublished) on wastewater irrigation in different Ghanaian cities also recorded faecal coliforms (FC) counts of up to 108/100 ml, which is far above recommended values (≤ 1*103/100ml; WHO 1989).
3.191 The risk associated with use of polluted water for irrigation transcend beyond
farmers to consumers. Vegetables are often contaminated with pathogens from water in addition to contamination from manure and pesticides application. Mensah et al. (2001) reported faecal bacteria contamination in lettuce and cabbage leaves varying from 1000 to over 30,000 in number. The use of polluted or wastewater in urban and peri-urban areas has a potential for growth due to its availability and economic returns. For example, Danso et al. (2002) reported that incomes of farmers using wastewater for irrigation in Ghana
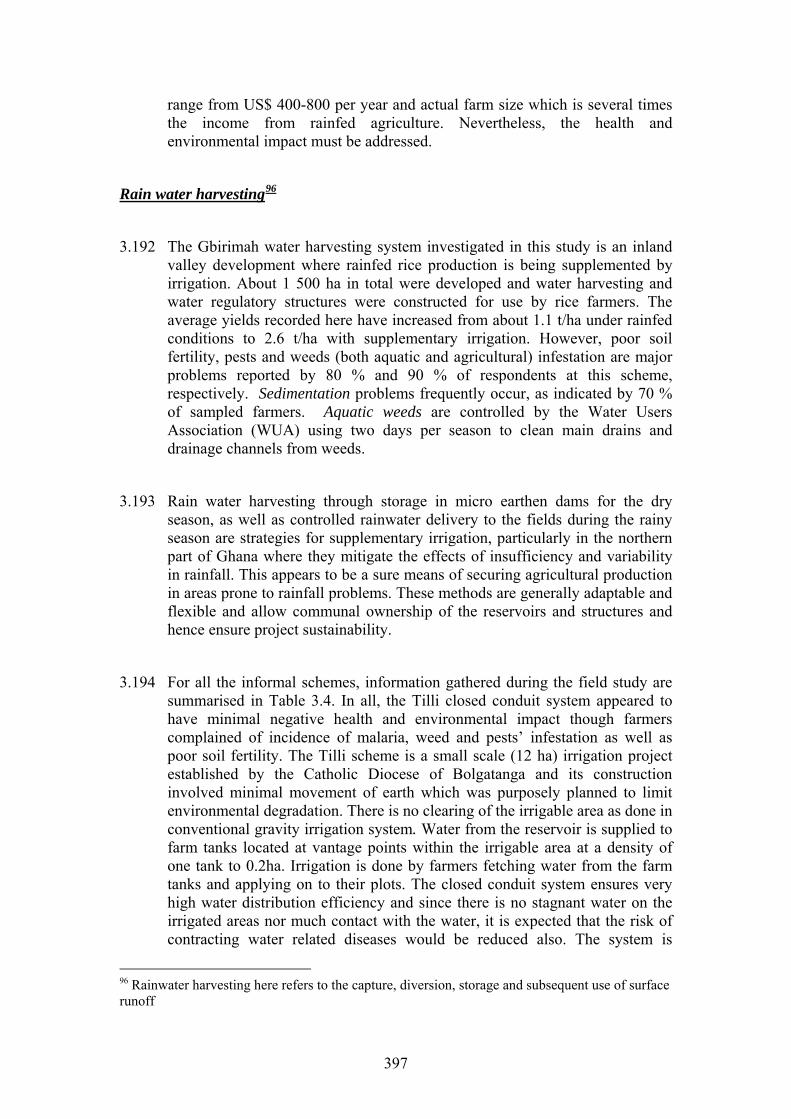
397
range from US$ 400-800 per year and actual farm size which is several times the income from rainfed agriculture. Nevertheless, the health and environmental impact must be addressed.
Rain water harvesting96
3.192 The Gbirimah water harvesting system investigated in this study is an inland
valley development where rainfed rice production is being supplemented by irrigation. About 1 500 ha in total were developed and water harvesting and water regulatory structures were constructed for use by rice farmers. The average yields recorded here have increased from about 1.1 t/ha under rainfed conditions to 2.6 t/ha with supplementary irrigation. However, poor soil fertility, pests and weeds (both aquatic and agricultural) infestation are major problems reported by 80 % and 90 % of respondents at this scheme, respectively. Sedimentation problems frequently occur, as indicated by 70 % of sampled farmers. Aquatic weeds are controlled by the Water Users Association (WUA) using two days per season to clean main drains and drainage channels from weeds.
3.193 Rain water harvesting through storage in micro earthen dams for the dry season, as well as controlled rainwater delivery to the fields during the rainy season are strategies for supplementary irrigation, particularly in the northern part of Ghana where they mitigate the effects of insufficiency and variability in rainfall. This appears to be a sure means of securing agricultural production in areas prone to rainfall problems. These methods are generally adaptable and flexible and allow communal ownership of the reservoirs and structures and hence ensure project sustainability.
3.194 For all the informal schemes, information gathered during the field study are summarised in Table 3.4. In all, the Tilli closed conduit system appeared to have minimal negative health and environmental impact though farmers complained of incidence of malaria, weed and pests’ infestation as well as poor soil fertility. The Tilli scheme is a small scale (12 ha) irrigation project established by the Catholic Diocese of Bolgatanga and its construction involved minimal movement of earth which was purposely planned to limit environmental degradation. There is no clearing of the irrigable area as done in conventional gravity irrigation system. Water from the reservoir is supplied to farm tanks located at vantage points within the irrigable area at a density of one tank to 0.2ha. Irrigation is done by farmers fetching water from the farm tanks and applying on to their plots. The closed conduit system ensures very high water distribution efficiency and since there is no stagnant water on the irrigated areas nor much contact with the water, it is expected that the risk of contracting water related diseases would be reduced also. The system is
96 Rainwater harvesting here refers to the capture, diversion, storage and subsequent use of surface runoff

398
designed in such a way that sections can be isolated for repairs without affecting the functioning of other parts of the network. Moreover, the entire system is simple and requires minimal training of farmers to effectively manage, operate and maintain it.
Mitigating adverse health and environmental effects of selected water development projects 3.195 For all the schemes selected in this case study, there were no planned
mitigation measures before the start of operation nor any monitoring systems currently in place to address possible health and environmental impact. Responsibility for catchment management lies with the GIDA, MoFA, ICOUR or water user association, as the case may be, but this is not well managed. The review by McCartney et al (2004 – literature review part of this study), highlighted the fact that an integrated approach is required to ensure good health and environmental management in the context of agricultural water developments. Amelioration measures were classified into three types following Bergkamp et al., (2000): those that avoid anticipated adverse effects; those that mitigate or reduce those undesirable effects that cannot be completely avoided, and those that compensate for effects that can neither be avoided nor sufficiently mitigated.
3.196 HEALTH AND ENVIRONMENTAL STATUS OF WATER DEVELOPMENT INDIRECTLY AFFECT FARMERS’ LIVELIHOOD HENCE APPROPRIATE MEASURES NEED TO BE PUT IN PLACE TO MITIGATE NEGATIVE IMPACTS AND ENHANCE THE BENEFITS IN AGRICULTURAL WATER USE. FOR THIS CASE STUDY, THE LINK BETWEEN H&E STATUS, FARMER PRODUCTIVITY AND POVERTY AS WELL AS SUGGESTED MITIGATION MEASURES ARE SUMMARIZED IN FIG 3.3
,
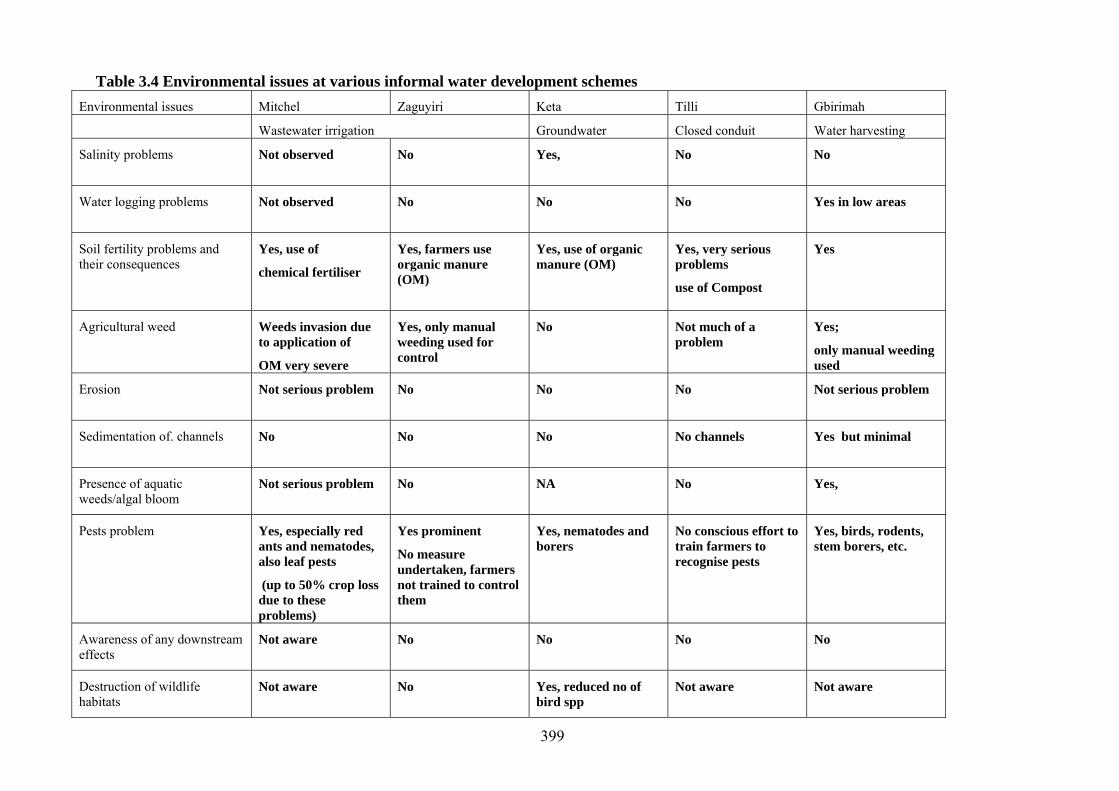
399
Table 3.4 Environmental issues at various informal water development schemes Environmental issues Mitchel Zaguyiri Keta Tilli Gbirimah
Wastewater irrigation Groundwater Closed conduit Water harvesting
Salinity problems Not observed No
Yes,
No No
Water logging problems Not observed No
No
No Yes in low areas
Soil fertility problems and their consequences
Yes, use of
chemical fertiliser
Yes, farmers use organic manure (OM)
Yes, use of organic manure (OM)
Yes, very serious problems
use of Compost
Yes
Agricultural weed Weeds invasion due to application of
OM very severe
Yes, only manual weeding used for control
No
Not much of a problem
Yes;
only manual weeding used
Erosion Not serious problem No
No
No
Not serious problem
Sedimentation of. channels No No
No
No channels Yes but minimal
Presence of aquatic weeds/algal bloom
Not serious problem No
NA No Yes,
Pests problem Yes, especially red ants and nematodes, also leaf pests
(up to 50% crop loss due to these problems)
Yes prominent
No measure undertaken, farmers not trained to control them
Yes, nematodes and borers
No conscious effort to train farmers to recognise pests
Yes, birds, rodents, stem borers, etc.
Awareness of any downstream effects
Not aware No
No
No No
Destruction of wildlife habitats
Not aware No
Yes, reduced no of bird spp
Not aware Not aware
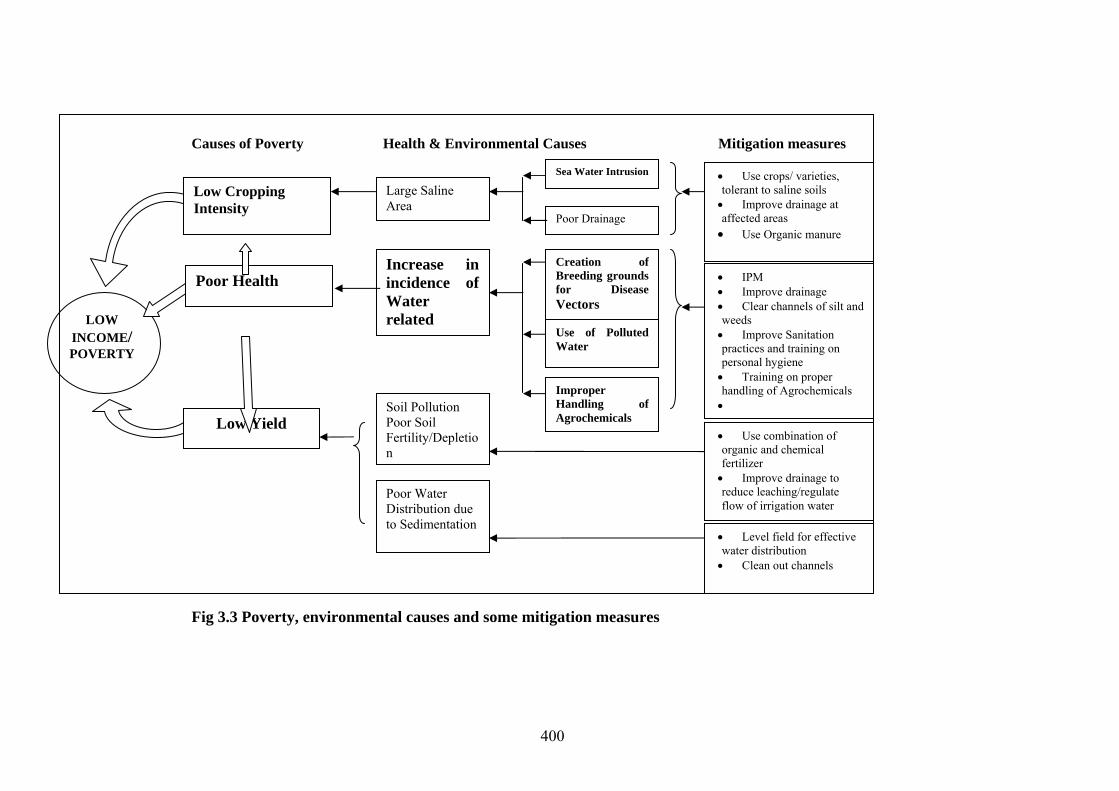
400
Causes of Poverty Health & Environmental Causes Mitigation measures
Fig 3.3 Poverty, environmental causes and some mitigation measures
• Level field for effective water distribution • Clean out channels
• Use crops/ varieties, tolerant to saline soils • Improve drainage at affected areas • Use Organic manure
• IPM • Improve drainage • Clear channels of silt and weeds • Improve Sanitation practices and training on personal hygiene • Training on proper handling of Agrochemicals •
• Use combination of organic and chemical fertilizer • Improve drainage to reduce leaching/regulate flow of irrigation water
LOW INCOME/ POVERTY
Sea Water Intrusion
Poor Drainage
Creation of Breeding grounds for Disease Vectors
Improper Handling of Agrochemicals
Use of Polluted Water
Soil Pollution Poor Soil Fertility/Depletion
Poor Water Distribution due to Sedimentation
Increase in incidence of Water related
Large Saline Area
Low Yield
Low Cropping Intensity
Poor Health

401
CONCLUSIONS AND RECOMMENDATIONS FOR POLICY AND INVESTMENT IN AGRICULTURAL WATER DEVELOPMENT
3.197 This case study shows that, detailed health and environmental impact studies were either not conducted or the results are not available in the schemes surveyed. A literature survey covering the whole of Ghana confirmed this. The lack of information is particularly acute for informal schemes. Farmers in both formal and informal schemes are not well informed of the health and environmental impact of irrigation. They are mostly concerned with pest and weed management and soil fertility problems which have direct effects on their productivity. Lack of general health information is a major concern due to the possible increase in malaria and guinea worm incidence through irrigation in Northern Ghana. Currently, capacity building is not an organized component of even formal agricultural water development projects. Only IPM training was carried out on four of the eight selected schemes, while the issues in water management, health etc., were largely neglected.
3.198 The sustainability of irrigation projects depends not only on the profitability, maintenance and continuance of the schemes once implemented but also consideration of their long term health and environmental effects. Donors may decide to invest more in specific areas and types of projects, depending on local conditions. Some formal schemes have the advantage of serving multipurpose needs and users such as domestic water needs, fishing, livestock watering, as well as irrigation. This can have large impact on food security and poverty reduction. However, they require more knowledge/training (which most often is lacking among users) in order to derive the full benefits. They also have high maintenance requirements which are often overlooked until complete breakdown is salvaged by major rehabilitation. Investment funds could consider formal irrigation schemes as an option but to achieve positive outcomes this should be designed with simple and low maintenance infrastructure which would ensure efficient and reliable on-farm water delivery with minimal negative health and environmental impact e.g The scheme such as Tilli closed system ensures low maintenance- the only maintenance is at the farm tank which requires cleaning and minor patching of cracks. Efficiency is improved and guaranteed because the farmer lifts only the required amount of water and has no incentive to lift more than that as he requires to apply additional effort. Health impacts are minimized as the volume of stagnant water especially in the irrigable area is reduced and therefore affects the mosquito breeding areas. In addition, contact with irrigation water is minimal and therefore reduces the risk of contracting water related diseases
3.199 The informal developments (such as water harvesting schemes, shallow hand dug wells, waste water irrigation) are often on small scale, constructed with low infrastructure requirement, simple maintenance and minimal environmental disruption. The environmental disruption is a function of scale of the scheme, especially with the headworks which conventionally involves the construction of a dam as in large schemes. The other factor is the water delivery method. Gravity systems in formal schemes involve clearing of large areas to remove any obstacles to placing of canals and leveling of plots. Therefore, the larger the scheme the more the disruption.
3.200 Schemes with reduced local environmental impact, such as many informal
schemes might have a larger potential for expansion for many reasons: • the technology is simple and in many cases low cost, usually consisting
of small pumps or cans drawing water from shallow well, streams or small reservoirs, with less environmental impact than larger schemes with water reservoirs covering considerable areas of land.

402
• the arrangements for operating such systems are private or communal. • the farmer is an active participant in project design and
implementation as in the Gbirimah water harvesting project and Tilli closed conduit system.
• most of the systems generate high and timely cash returns to farmers. This is particularly true for irrigation systems close to the urban areas.
3.201 Government and donors could capitalize on farmer-driven interventions to
improve the efficiency of investments. Examples are found in the use of hand dug wells or low quality water for cultivation of vegetables. Presently, many national governments and donors frown at the use of polluted water or wastewater, but that has not deterred the farmers from this practice. Possible investment in this regard is to devise technical means by which the health risks associated with wastewater irrigation can be minimized and develop appropriate guidelines for using polluted water for irrigation in low-income countries (Drechsel et al., 2002). Where effective wastewater treatment is rarely feasible due to cost of treatment at source and transport to agricultural areas, an investment opportunity could be the development of appropriate low cost on-farm treatment technologies to improve water quality and reduce health risks. With this, the wastewater reuse can have an important role in agricultural production of small holder farmers. .
3.202 An expansion of groundwater exploration for irrigation in Ghana cannot be
recommended unless detailed studies of groundwater storage and recharge are available. In this regard, Government could increase investment in studies and evaluation of groundwater potential for irrigation accompanied with the related health and environmental impact assessment.
3.203 Both formal and informal irrigation farmers need to be trained on the proper
and safe methods of abstracting, diverting, distributing and managing agricultural water with due consideration of possible hazards such as, transmission of water borne diseases, pollution from agrochemicals, excessive abstraction from aquifers, etc. For some of these issues, neither locally tested mitigation methods nor extension material is available. In future investments, more systematic and comprehensive evaluation of environmental and health impacts of schemes must be undertaken, in order to develop appropriate mitigation measures.
3.204 Changes that donors should encourage to enhance quality and quantity of
investments in agricultural water development relate to improvements in design of infrastructure, training and capacity building as well as inputs supply, as they affect directly or indirectly the health and socioeconomic life of the farmers as well as environmental status of the schemes. Investments should be holistic in nature to derive optimum benefits: in addition to technical and financial aspects, environmental issues relating to the investment must be considered thoroughly and in detail in order to be understood and appreciated by the beneficiaries – e.g. how to recognise different environmental problems; what to do in each case at the community/individual level; who and where to contact in case of problems that cannot be resolved locally..
403
REFERENCES
Abdul-Ghanyu, S., Kranjac-Berisavljevic’, G., Yakubu, I.B., Keraita, B., 2002. Sources and Quality of water for Urban vegetable production, Tamale, Ghana, UA RUAF Magazine no 8, p 10.
Agodzo, S.K., 2003. Shallow well irrigation for shallot farmers in the Keta lagoon area of Ghana’ J. Ghana Institution of Engineers, V.1 No1, Accra, Ghana p.1-7.*
Appawu, M.A., Dadzie, S.K., Baffoe-Wilmot, A., and Wilson, M.D(2001).Lymphatic filariasis in Ghana: entomological investigation of transmission dynamics and intensity in communities served by irrigation systems in the Upper East Region. Tropical Medicine and International health Vol 6 No 7 511-516
Audibert,M., 1986.Agricultural non-wage production and health Status: a case study in a tropical environment. Journal of Development Economics 24:275-291.
Bergkamp, G., McCartney, M. Dugan, P., McNeely, J. and Acreman, M. 2000. Dams, ecosystems functions and environmental restoration. Thematic Review II. 1. Prepared as input to the World Commission on Dams, Cape Town. 200 pp Clarke, E.E.K., Levy, L.S., Spurgeon, A. and Calvert, L.A. 1997. The problems associated with pesticide use by irrigation workers in Ghana. Occup. Med. 47, (5): 301-308 Cofie, O., Drechsel, P., Obuobie, E. Danso, G and B. Keraita. 2003. Environmental Sanitation and Urban agriculture in Ghana. In Harvey, P. (ed) Towards the Millenium Development Goals: Actions for Water and Environmental Sanitation. Proceedings of the 29th WEDC conference. Abuja, Nigeria. 9-12
Cornish, G.A and Lawrence, P. 2001. Informal Irrigation in Urban and Peri-Urban areas. A summary of Findings and Recommendations. HR Wallingford and Department for International Development. 88p.
Dougherty, T.C and Hill, A.W. 1995. Environmental Impact Assessment of Irrigation and drainage. Drainage Projects. Food and Agricultural Organisation (FAO).Irrigation and drainage paper 53.
Drechsel, P., U.J. Blumenthal and B. Keraita. 2002. Balancing health and livelihoods: Adjusting wastewater irrigation guidelines for resource-poor countries. Urban Agriculture Magazine 8: 7-9
Dzodzomenyo,M.,Dunyo,S.K.,Ahorlu,C,K..,Coker,W.Z.,Maxwell,Appawu.A.M. Pedersen, E.M and Simonsen, P.E. (1999) Bancroftian filariasis in an irrigation project community in southern Ghana. Tropical Medicine and International Health.Vol 4 No 1 pp13-18.
404
FAO 1996a. Agriculture and Food security. World Food Summit. November, 1996, Rome.*
FAO 1998: Aquastat, FAO’s Information system on water and Agriculture, Land and Water Development Division of FAO, Rome
Feenstra, S., Hussain, R., and Van der Hoek W. 2000. Health Risks of Irrigation with Untreated Urban wastewater in the Southern Punja, Pakistan. IWMI Pakistan, Lahore. 13p.
Environmental Protection Agency (EPA), 1999. Environmental Assessment Regulations, Accra, Ghana.*
Ghana Health Assessment Project Team (1981).A Quantitative Method of assessing the health impact 0of different diseases in less developed countries.Int. J Epidemiol.10(1);73-80
Ghana Irrigation Development Authority (1989) Unpublished records
Ghana Irrigation Development Authority (GIDA) and Japan International Cooperation Agency (2004).Small Scale Irrigated Agriculture Promotion Project-Follow Up(SSIAPP-FU).Strategies for Effective Utilisation of Existing Irrigation Projects.328pp
Hillel, D., 1997. Small Scale irrigation for Arid Zones; Principles and options, FAO
Development Series 2, FAO, Rome.
HR Wallingford 2000. Informal peri-urban irrigation in Africa. WATER (May issue, page 4)
Hunter,R.,Rey,L., Chu, K.Y.,Adekolu-John,E.O and Mott K.E(1993).Parasitic diseases in water resources development: The need for intersectoral negotiations.World Health Organonisation,Geneva. Hunter, J.M., (2003). Inherited burden of disease: agricultural dams and the persistence of bloody urine (Schistosomiasis haematobium) in the Upper East Region of Ghana. Social Science and Medicine 56(2003) 219-234
Keraita, B., Drechel, P., 2002. Wastewater use in informal irrigation in urban and periurban areas of Kumasi, Ghana, Urban Agriculture Magazine no 8, p.11-13. *

405
Keraita, B., Drechsel, P. and Amoah, P. 2003. Influence of urban wastewater on stream water quality and agriculture in and around Kumasi, Ghana. Environment & Urbanization 15 (2) 171-178
Kwei, C.A. (1997), Evaluation of Groundwater Potential in the Northern Region of Ghana, CIDA, Quebec
MCCARTNEY, M. E. BOELEE, O.COFIE, F. AMERASINGHE, S. GEBRESELASSIE, C. MUTERO AND D. PEDENL (2004). PLANNING AND MANAGEMENT TO IMPROVE THE BENEFITS AND REDUCE THE ENVIRONMENTAL AND HEALTH COSTS OF AGRICULTURAL WATER DEVELOPMENTS IN SUB-SAHARAN AFRICA. DESK REVIEW: REPORT TO THE AFRICAN DEVELOPMENT BANK
Mensah, E., Amoah, P., Drecshel, P. And Abaidoo, R.C. 2001.Environmental concerns of urban and peri-urban agriculture: case studies from Kumasi and Accra.In: Drecshel, P. and Kunze, D.(eds).Waste Composting for urban and peri-urban agriculture: closing the rural-urban nutrient cycle in sub-Saharan Africa. CABI, IWMI, FAO, Wallingford.55-68
Nagayo, N. 2004. The way forward in Ghana, with farmers’ participation, for sustainable irrigation management. JICA presentation at the GIDA-JICA Stakeholder Forum on SSIAPP, Accra, 28. May 2004.
Ntow, W.J. 1998 Pesticides misuse in Akomadan to be tackled. NARP Newsletter, 3(3): July – September. Pg 3
Obuobie, E., P. Drechsel, and Danso, G. 2004. Gender in open-space irrigated urban vegetable farming in Accra. Urban Agriculture Magazine 12: 13-15]
Rhoades, D., A. Kandiah and A.M. Mashali. 1992 The use of saline waters for crop production - FAO irrigation and drainage paper 48. FAO, Rome.
Sam, E.K., 1993. Field Survey of the impacts of water Projects in Ghana. Water Resources Research Institute.62 p
Van Edig, A., S. Engel and W. Laube. 2002. Ghana’s water institutions in the process of reform. http://www.glowa-volta.de/general/pubs/van_edig2002.pdf
World Bank 1993. Environmental Assessment/Analysis Reports. Ghana Agricultural Sector Project EA Category B. Environmental Impact of Irrigation Development and Mitigation Measures. P5
406
World Bank, 1993. Ghana 2000 and Beyond: Setting the stage for Accelerated Growth and Poverty Reduction, Economic Report, 11486, Washington, DC, USA.
WRRI. 1993. Rural Drinking Water Supply and Sanitation Project in the Volta
Region: Inventory and assessment of potential for hand dug wells in the Volta region. WRRI/DANIDA.

407
4
AGRICULTURAL WATER AND LIVESTOCK
PRODUCTION CASE STUDIES IN SUB-SAHARAN AFRICA
D. Peden, A. Astatke, I. Baltenweck, K. Sonder, G. Tadesse, A. Workalemahu, M. Asrat, K. Berhe, A. El Wakeel, H. Faki, B. Fadlalla, A. Notenbaert and A. Freeman
408
SYNTHESIS
Water-livestock investment domains: Fifteen water-livestock investment domains (WLD) were derived from Africa-wide public domain spatial databases. These take into account much of the great diversity of animal production systems involving many species (camel, cattle, equines, goats, and sheep, (but excluding poultry and swine), market access, human population densities, and a measure of discretionary surplus water supply that could be used for irrigation. Because of the widely varying agro-ecology, rich human cultures, and related animal keeping practice and purposes, the WLDs provide a broad-brush overview of the continent and relevant key water-livestock investment issues. These WLDs highlight areas in Africa where production system specific opportunities exist for investing in agricultural water to promote livestock sector growth. On a case-by-case basis, specific water development projects will need more detailed studies at the planning stage. Nine case studies were selected, mostly from Ethiopia and Sudan, the two African countries that have the most domestic animals and representative the range of agricultural production systems found in SSA. Collectively, they highlight water-related livestock production issues that require the attention of water policy makers who are intent on maximizing their impact in contributing to poverty reduction. They also address observed important issues of particular importance to the fifteen WLDs.
Planning for livestock in irrigation systems: Two case studies focused on large-scale irrigation (Gezira) and micro-dam based irrigation (Tigray). They indicate that little or no thought had been given to the inclusion of livestock production options as a productive and marketable output of investments. The did not adequately consider water requirements of livestock kept in and around irrigation systems for non-productive purposes such as farm power, household nutrition and household assets savings. Establishment of new irrigation systems will affect livestock keepers because they lose traditional access to watering points and dry season grazing reserves. Pastoralist may also view irrigation development as an opportunity for a new source of free drinking water for their animals. Although animal feed can have high market value in distant markets as well as support local livestock production, there is little evidence that the “fodder option” was considered in planning irrigation development. For these reasons, past investments in irrigation may have lost opportunities to enhance animal-based agricultural production.
Livestock drinking and irrigation: Irrigation development tends to take place in areas where water scarcity also constrains livestock access to drinking water. Irrigation development may cut animals off from access to traditional drinking areas. Although irrigation systems supply water to farmers, it is surprising that domestic animals often must travel significant distances to find drinking water or must enter reservoirs and canals where they damage irrigation infrastructure. This study suggests that farmers could realize enhanced livelihoods through integration of livestock drinking water into overall irrigation planning and design. There are two additional benefits to providing drinking water. First, provision of water on a continuous basis increases individual animals’ milk production and thus production of an important highly valued marketable product that also enhances household nutrition. Such dairy production has become an important poverty reduction strategy in Kenya and could do so elsewhere in association with irrigation development. Second, provision of livestock drinking water in irrigation systems enables irrigation farmers to increase animal production in adjacent rainfed pasture that lacks drinking water. Including drinking facilities may help improve overall investment returns where livestock are or could become important.
409
Livestock health and irrigation: Fasciolosis, an economically important water-borne livestock disease, will likely increase as a result of investments in agricultural water in semi-arid areas including livestock dominated WLDs that previously experienced low prevalence. Irrigation policy may need to consider complementary curative and preventative approaches including provision of veterinary services and irrigation designs that help break the life cycle of the parasite and its vectors. Reducing other human and animal diseases may require similar action. The poverty-reducing and market-enhancing outcome of such actions will likely be increased water productivity for livestock, improved quality of animal products that command higher market value, and higher overall return on investments in agricultural water.
Livestock management to reduce degradation of irrigation systems: In large-scale and small-scale irrigation systems, sedimentation results in high maintenance costs, reduced water quality and a shortened lifespan of the infrastructure. Improved livestock management can help reduce these costs of irrigation. Three basic approaches could be integrated into agricultural water development. First, providing watering points that are isolated from the reservoir can reduce the transmission of water-borne diseases such a cryptosporidium and coliform bacteria. Second, establishing riparian vegetative buffer zones that exclude animals can help filter out sediments and pathogens (particularly parasites) to help maintain water quality and reduce siltation. Third, better management of the upper catchments can help reverse the trend toward increasing rates of infilling irrigation canals and reservoirs with sediment. These interventions require collaboration between irrigation personnel and institutions with those responsible for up-slope land and animal management. This issue is not confined to animal management, and improved annual cropping practices are needed.
A holistic approach to water harvesting: Water harvesting with micro-dams involves concentrating rainfall into command areas equivalent to about 10% of the catchment. Irrigation development and planning often pays insufficient attention to management of catchment areas apart from excluding its use by local people. In the short run, such exclusion proved beneficial, but in the long-run, controlled use of catchments located upslope from riparian buffer zones could produce additional livelihood generating benefits such as production of firewood and feed for zero-grazed animals. Investments in micro-dam based irrigation could realize improved overall performance through holistic planning that integrates management of the catchment, reservoir and command areas.
Market opportunities for livestock produced in irrigation systems: Demand for livestock products is growing quickly particularly near expanding urban population centres. These are located in highly varied livestock production systems and where there are favourable incentives for investing in agricultural water. Demand driving profitable irrigation development will likely coincide with opportunities for marketing highly valued livestock products in SSA. Investors and producers have a range of irrigation options to support livestock sector growth. First, if prices are high, production of feed using either harvested irrigated forage crops or irrigated pasture may be a good choice. Second, farmers can grow dual-purpose food-feed crops such as sorghum or maize that provide both feed for animals and food for people. Third, with restraints to prevent overgrazing, animals can graze on fallows and in adjacent non-irrigated pasture. On a case-by-case basis, assessments are needed to determine which combination of crop and feed options are most profitable and useful in meeting household needs. Assuming that animal production is viable, then a range of complementary policies and strategies are needed. These include provision veterinary services and institutions to support market development. As already noted, dairy production can be very profitable to poor smallholder farmers who have good market access. To
410
maximize milk production, provision of continuous water supply to cows may give a very high return on investment.
Livestock and irrigation systems – conflict and its resolution: Irrigation systems are often established in some of SSA’s most water stressed areas that traditionally have supported livestock dominated agricultural production. Pastoralists as a group include some of Africa’s most impoverished peoples. Inadequate consideration of pastoral livelihood needs has led to reduced access to water resources and aggravated their already extreme poverty. Much conflict among peoples in Africa centres on the competition between pastoralists and immigrant crop producers particularly in dry season grazing reserves. To minimize such conflict, investments in irrigation development may need to consider a range of options such as:
• Providing alternate drinking water in water scarce rangelands that produce surplus animal feed.
• Providing migration corridors to enable livestock to reach well designed watering points in or near irrigation schemes.
• Providing feed from fallow, dual-purpose food-feed crops or forage crops grown in irrigation schemes.
• Encouraging the planting of succulent forage plants and fodder trees in rangelands that can be used in dry seasons and drought and relieve pressure on irrigated areas.
• Providing innovative and socially acceptable asset savings institutions that encourage pastoralists to de-stock to levels that make them more resilient to the onset of drought and less dependent on feed and water from irrigation schemes.
• Sensitive encouragement and capacity building to promote socially acceptable and environmentally sustainable shifts from nomadic livelihoods to adoption of agro-pastoral production where herders can directly benefit from investments in irrigation rather than being marginalized by them.
Capacity building and institutional reform: In all case studies, there was a chasm-size gap between livestock management and water management policy and practices resulting in much incoherence and conflict between water users and marginalization of minority or economically disadvantage groups. Professional personnel have, by and large, never been trained to think about joint management of water and livestock resources. Most of the case studies indicate that community involvement in planning and managing water, land and animal resources has been greatly lacking. At regional and national levels, there was little integration of livestock and water development. Investments in irrigation development could benefit greatly from multi-sectoral approaches to coherent and joint management of natural resources and training of professional, extension and community level personnel to adopt multi-sectoral thinking.
Interdependence of irrigation and other livestock production systems: Livestock migrate, often spending time both in irrigations systems (or depending on feed produced within them) and in other agricultural production systems. This creates a market chain linking pastoral, mixed crop-livestock, urban grazing systems. To maximize return from investments in water for livestock sector growth, complementary investments in livestock development in non-irrigated areas are needed.
411
Supply-side versus demand-side management: Investment in water for livestock sector growth can often “piggy-back” cost-effectively on investments being made in irrigation. For example, providing a continuous supply of drinking water to dairy cattle can generate high returns on investment without using much additional water. Investments in irrigated water solely for feed may be justified if prices for animal products are high, but this strategy may require excessive and unsustainable amounts of water. Demand side management of water for livestock production may also provide great savings using innovations such as dual-purpose food-feed crops, conservation tillage and better management of livestock around water resources.

412
A. BACKGROUND TO LIVESTOCK-WATER CASE STUDIES.
4.1. Market demand for livestock products: Delgado et al. (1999) estimated that demand for meat and milk production in SSA will grow by 3.4% and 4.0% respectively over the next fifteen years. These rates for SSA are higher than those predicted for developing countries as a whole. Urban population growth will drive this demand for animal products and determine areas where investments in agricultural water to support livestock sector growth will be most profitable.
4.2. Livestock and diversity: Livestock in Sub-Saharan Africa (SSA) include many species (cattle, camel, goats, sheep, equines, poultry and swine), and each of these includes a diverse range of local and imported breeds. Livestock production also takes place in a wide range of climatic and ecological conditions ranging from very hot and dry areas where few crops are grown to more humid and temperate production systems where crops are highly integrated with animal production. Cutting across this genetic and environmental diversity are a myriad of cultural variations that affect what species are kept, how they are valued and used, and who among the human population cares for and benefits from them. In this study, we focus on cattle, sheep, goats and camels with implications for swine and equines, but we do not address poultry.
4.3. Intensification of agricultural production in SSA and livestock: Paradoxically and globally, livestock dominated rangelands and pastoral lands are characterized by lower animal densities than more intensified crop production systems including those found in urban and peri-urban areas, mixed crop-livestock production systems and large-scale irrigation schemes. Both small-scale and large-scale irrigation serve to intensify agricultural production. Experience in SSA and South Asia suggests strongly that efforts to efforts intensify crop production in both rainfed areas through non-water interventions and through improved agricultural water management will lead to increased numbers of livestock kept by farmers and other community members. Improving animal productivity in association with agricultural development presents an opportunity to increase overall benefits arising from investments in agricultural water.
4.4. Livestock market chains and inter production systems linkages: Livestock migrate. This distinguishes animal production from most other forms of agricultural production. As the case studies will show, many animals spend part of their lives in rangeland areas, but move into rainfed and irrigated croplands in search of water and feed during dry seasons and into urban areas when fattened or sold. In urban areas, livestock often depend on feed based on crop residues and forage crops produced in both irrigated and rainfed fields. Thus, market oriented livestock production creates linkages or a complex market-chain involving rainfed grazing and crop production, irrigation schemes and livestock markets. Maximizing the return on investments in agricultural water where livestock are produced may require addressing opportunities and constraints to livetock production and marketing the found outside of the geographical domain of a particular irrigation project. Feed produced in irrigation schemes and used to fatten animals can greatly enhance market opportunities for livestock raised in distant areas.
4.5. Tropical livestock units (TLU): Much of the discussion in this report deals with livestock as a group of many species. Because herd composition varies greatly from one place to another and animals come in different sizes and consume water in
413
amounts which are at least partly related to animal size, we have used the concept of the Tropical Livestock Unit (TLU), “a convenient method for quantifying a wide range of different livestock types and sizes in a standardized manner” (FAO, 2004) to enable integration of cattle camel, cattle, equines, goats, and sheep. One TLU is 250 kg of live animal weight. For example, Camels, cattle, sheep and goats are judged to be equivalent to 1.0, 0.7, 0.1 and 0.1TLU each respectively. The TLU concept has some limitations. For example, it normally does not take into account different breeds and different animal growth stages. Refer to FAO (2004) for more information about TLUs.
4.6. Agricultural water, irrigation and livestock: Animal production requires several forms of agricultural water. Irrigation can help increase feed supply particularly in feed scarce areas. Because livestock exist in and around irrigation both large-scale and small-scale irrigation schemes, they will also drink from irrigation infrastructure, and unless properly managed, contaminate the water supply. Since domestic animals often spend part of their time away from irrigated areas, complementary investments in improving availability and quality of water outside of irrigated areas may be necessary to support animal production. In this study, while emphasis is given to livestock use of and impact on water in irrigation schemes, reference is also made to some essential and complementary animal uses of water in non-irrigated areas. Because of the complex nature of livestock-water interactions including multiple forms of use and multiple locations where livestock use water, this study does not confine itself to irrigation only.
4.7. Stratification of SSA for livestock production: Based on available datasets for Africa, a stratification of Sub-Saharan Africa into water-livestock investment domains (WLD) was developed. A full description of the methods used will be made available soon in a separate synthesis report being prepared by ILRI. WLDs represent the overlay or intersection of cartographic representations of farming system types, physical access to markets and water availability. This stratification forms a framework for identifying opportunities for investments in water development to support livestock sector growth. Such a framework could be expanded to include investment opportunities for agricultural water in SSA to support other marketable commodities beyond the livestock products emphasized herein. This framework combines information about Farming Systems, Market Access, Population Density and Water Availability:
• The farming systems description differentiates between livestock dominant production with little or no cropping (pastoral areas) and mixed crop-livestock systems that can be sub-divided into rainfed and irrigated areas. Public domain data from diverse sources and available at ILRI were used.
• Physical market access for SSA was described by cost-distance analysis and it represents the physical access to towns with a population of more than 50,000 in the year 2000. The physical access (in terms of travel time) was calculated on the basis of land cover, slopes and transport routes. An additional travel cost was taken into account at national boundaries, since these were considered to act as barriers.
• The human population density estimates (number of people per km2) to 2030 were based on 2004 figures from the Center for International Earth Science Information Network to match country-level projections according to the UN medium
414
estimates, but with some spatial modeling within countries, to take account of market demand.
• For water availability, river basin values from the FAO Atlas of Water Resources and Irrigation in Africa were used. The values for Internally Renewable Water Resource (IRWR) and Natural Inflow (NI) were added up and combined into a “Discretionary Surface Water” raster dataset. IRWR represents the sub-basins contribution to the overall runoff of the major basin and is actually the difference between precipitation and actual evapotranspiration or the "surplus" rainfall that either infiltrates to recharge aquifers or runs off into rivers. It is calculated using a model that takes into account precipitation, reference evapotranspiration, and soil moisture storage capacity. This so-called “surplus” was then routed through the river basins and natural inflow calculated.
• Making the stratification useful requires limiting the number of WLD classes, and this in turn requires simplifying the number categories in the input spatial data sets. An expert working group agreed on the following classes for input data:
- Farming systems: a) rainfed agriculture highly dominated by livestock with little or no cropping; b) mixed crop-livestock production in rainfed areas, and c) mixed crop-livestock production in large scale irrigation schemes.
- Market access: a) “Good” with distance to market less than 50 km, and b) “bad” with distance greater than 50 km.
- Human population density: a) “High” or greater than 50 people/km2, and “low” with less than 50 people/km2.
- Discretion water availability: a) “High” with more than 300 mm/year equivalence, and “low” with less than 300 mm/year equivalence.
With these four criteria and classes, there are 24 possible water-livestock investment domains,
• Because the cartographic data used in this analyses were available for the whole Africa, we did not limit the spatial analyses to Sub-Saharan Africa, the domain for this investment study.
• Further analyses reveal that 10 of these WLDs were almost trivial totaling less than four percent of the continental land area and serving as home for less than four percent of the human population. If more detailed localized investment studies should be carried out in future, then these minor WLDs may become more important. For this study, we consider 14 WLDs to be potentially important regions for investing in water to support livestock sector growth.
• Because urban livestock keeping lies at the heart of market oriented production, but occurs in very small areas of Africa for which continent-wide mapping is not appropriate, we have added a 15th WLD, “urban livestock production”
4.8 Water-livestock investment domains: The 15 water investment domains are shown in Figure IV-1, and tabular summaries of these domains for SSA are given in Table IV-1. Investors interested in developing agricultural water can use this as guide to identify what livestock production systems will be affected by and can take advantage of investments in irrigation. And, investors interested in livestock can use this to help identify WLDs in SSA where agricultural water development could support livestock sector growth.
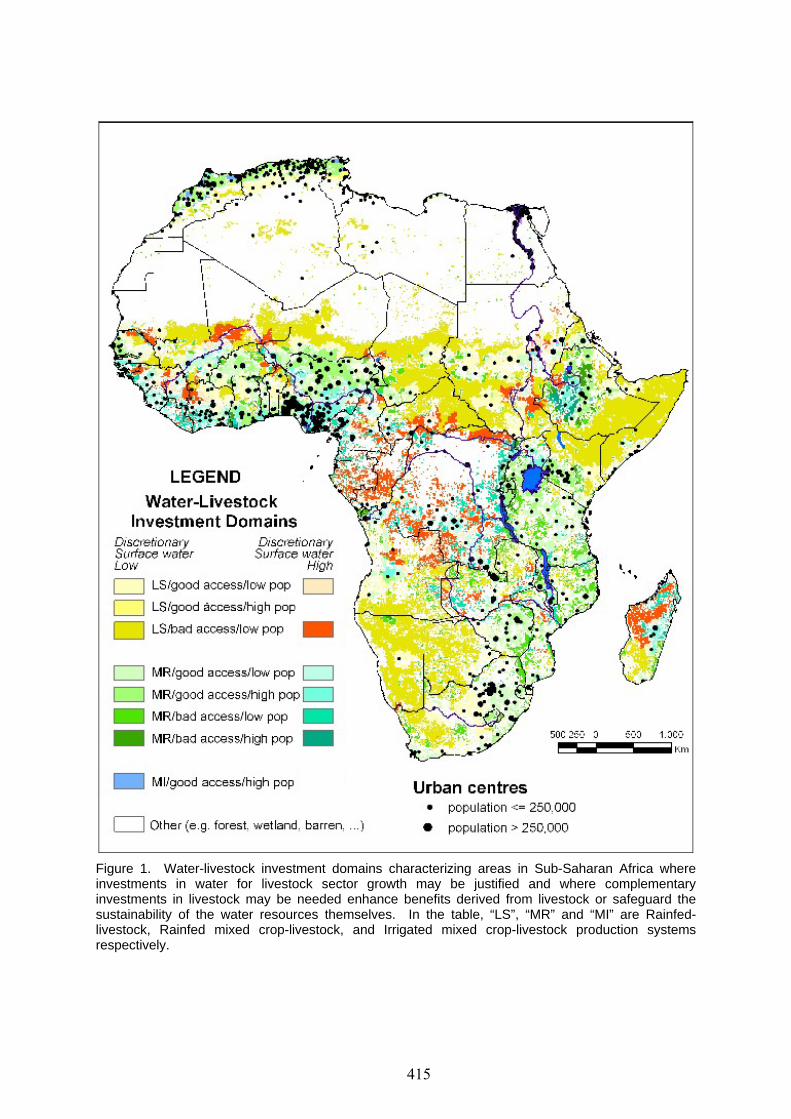
415
Figure 1. Water-livestock investment domains characterizing areas in Sub-Saharan Africa where investments in water for livestock sector growth may be justified and where complementary investments in livestock may be needed enhance benefits derived from livestock or safeguard the sustainability of the water resources themselves. In the table, “LS”, “MR” and “MI” are Rainfed-livestock, Rainfed mixed crop-livestock, and Irrigated mixed crop-livestock production systems respectively.
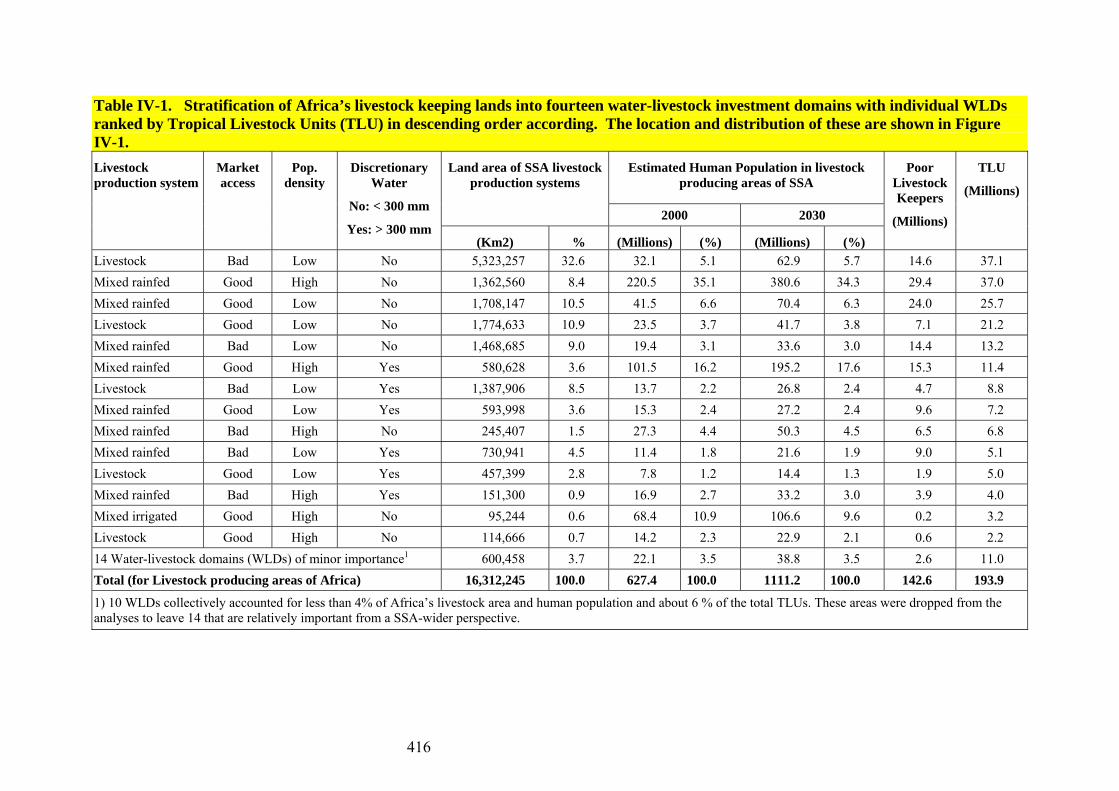
416
Table IV-1. Stratification of Africa’s livestock keeping lands into fourteen water-livestock investment domains with individual WLDs ranked by Tropical Livestock Units (TLU) in descending order according. The location and distribution of these are shown in Figure IV-1.
Estimated Human Population in livestock producing areas of SSA
Land area of SSA livestock production systems
2000 2030
Livestock production system
Market access
Pop. density
Discretionary Water
No: < 300 mm
Yes: > 300 mm (Km2) % (Millions) (%) (Millions) (%)
Poor Livestock Keepers
(Millions)
TLU
(Millions)
Livestock Bad Low No 5,323,257 32.6 32.1 5.1 62.9 5.7 14.6 37.1 Mixed rainfed Good High No 1,362,560 8.4 220.5 35.1 380.6 34.3 29.4 37.0 Mixed rainfed Good Low No 1,708,147 10.5 41.5 6.6 70.4 6.3 24.0 25.7 Livestock Good Low No 1,774,633 10.9 23.5 3.7 41.7 3.8 7.1 21.2 Mixed rainfed Bad Low No 1,468,685 9.0 19.4 3.1 33.6 3.0 14.4 13.2 Mixed rainfed Good High Yes 580,628 3.6 101.5 16.2 195.2 17.6 15.3 11.4 Livestock Bad Low Yes 1,387,906 8.5 13.7 2.2 26.8 2.4 4.7 8.8 Mixed rainfed Good Low Yes 593,998 3.6 15.3 2.4 27.2 2.4 9.6 7.2 Mixed rainfed Bad High No 245,407 1.5 27.3 4.4 50.3 4.5 6.5 6.8 Mixed rainfed Bad Low Yes 730,941 4.5 11.4 1.8 21.6 1.9 9.0 5.1 Livestock Good Low Yes 457,399 2.8 7.8 1.2 14.4 1.3 1.9 5.0 Mixed rainfed Bad High Yes 151,300 0.9 16.9 2.7 33.2 3.0 3.9 4.0 Mixed irrigated Good High No 95,244 0.6 68.4 10.9 106.6 9.6 0.2 3.2 Livestock Good High No 114,666 0.7 14.2 2.3 22.9 2.1 0.6 2.2 14 Water-livestock domains (WLDs) of minor importance1 600,458 3.7 22.1 3.5 38.8 3.5 2.6 11.0 Total (for Livestock producing areas of Africa) 16,312,245 100.0 627.4 100.0 1111.2 100.0 142.6 193.9
1) 10 WLDs collectively accounted for less than 4% of Africa’s livestock area and human population and about 6 % of the total TLUs. These areas were dropped from the analyses to leave 14 that are relatively important from a SSA-wider perspective.

417
4.9 Selection of case studies: Although there are many and varied potential problematic issues involving joint management of livestock and agricultural water, we selected a number of case studies to reflect examples of situations where there are critical interactions between water and livestock and where investment can bring about improved livelihoods, poverty reduction, equity, and environmental sustainability. Given the vastness of the African continent its agro-ecological and cultural diversity, a few case studies cannot be statistically representative of the whole. However, many of the lessons from some case studies are applicable to multiple water-livestock development domains. Thus collectively, these case studies offer useful insights into approaches for effective investment in agricultural water for livestock sector growth in all the WLDs. Table IV-2 highlights the WLDs for which the case studies will have greatest relevance. There is much scope for further studies, particularly when planning specific individual water development projects start. Most of the case studies were conducted in Ethiopia and Sudan. These two African countries have the largest numbers of livestock, and they occupy diverse agro-ecologies. Some gaps that should be filled in future, but many principles emerging here have wider implications and applicability.
Central Africa was not included because from a livestock perspective this part of SSA is not environmentally suitable for most forms of animal production. The current GIS stratification lacks information on cultural diversity and further refinements in selecting WLDs could address this issue. The case studies may have a bias toward the cultural environment of East African and Arabic pastoral livestock systems leaving some gaps in understanding West and Southern African conditions.
4.10 Need for a bottom-up participatory approach. Any investment or development activities generated to develop water for the livestock sector, must take into account community-based needs that will be site-specific and the diagnostics of which lie outside the realm covered by this report. However, the absence of detailed participatory consultation and information derived from does not negate the future need for it.
4.11 Toward better water-livestock policy: Implicit hypotheses in this study are:
• That conventional agricultural water development policy, planning and management have not adequately addressed the reality that livestock are an important part of agricultural production systems where much of the irrigation investment takes place,
• That new irrigation systems attract livestock keeping whether planned for or not,
• That many opportunities for poverty reduction and market development have thereby been lost, and
• That future investment in agricultural development can benefit from active consideration of livestock keeping and production in and around irrigations systems.
418
Because livestock production takes many forms and has many purposes, each development project will need to critically examine the relevance of livestock production options. Furthermore, policy and subsequent action will require in depth participation by the diverse stakeholders and sets of policy will be needed at local, regional, national and international levels. This study lacks a continent-wide and in-depth analysis of community-based and household perceptions and views. Thus, this study will not attempt to give site-specific options, but will highlight critical livestock-water issues to guide future investments in and use of agricultural water across SSA.

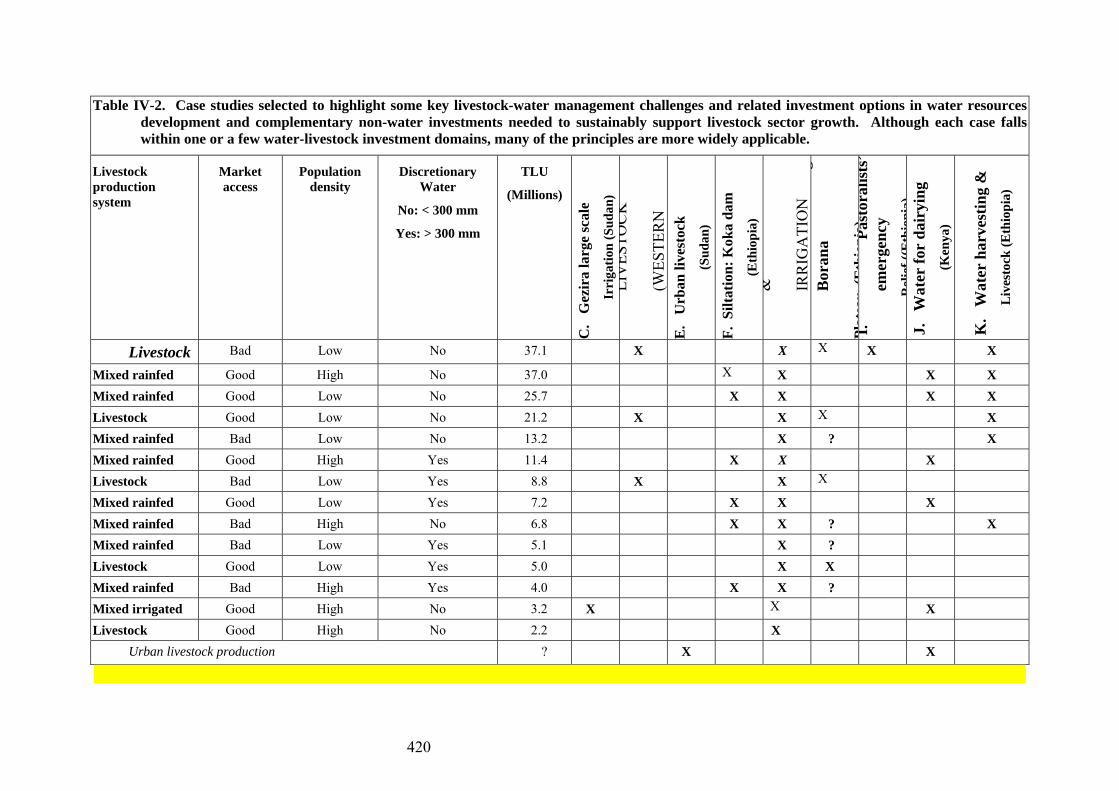
420
Table IV-2. Case studies selected to highlight some key livestock-water management challenges and related investment options in water resources development and complementary non-water investments needed to sustainably support livestock sector growth. Although each case falls within one or a few water-livestock investment domains, many of the principles are more widely applicable.
Livestock production system
Market access
Population density
Discretionary Water
No: < 300 mm
Yes: > 300 mm
TLU
(Millions)
C.
Gez
ira
larg
e sc
ale
Irri
gatio
n (S
udan
) LI
VES
TOC
K
(WES
TER
N
E.
Urb
an li
vest
ock
(Sud
an)
F. S
iltat
ion:
Kok
a da
m
(Eth
iopi
a)
&
IRR
IGA
TIO
N
gB
oran
a
Plat
eau
(Eth
iopi
a)I.
Pa
stor
alis
ts’
emer
genc
y R
elie
f((E
thio
pia)
J.
Wat
er fo
r da
iryi
ng
(Ken
ya)
K.
Wat
er h
arve
stin
g &
L
ives
tock
(Eth
iopi
a)
Livestock Bad Low No 37.1 X X X X X
Mixed rainfed Good High No 37.0 X X X X Mixed rainfed Good Low No 25.7 X X X X Livestock Good Low No 21.2 X X X X Mixed rainfed Bad Low No 13.2 X ? X Mixed rainfed Good High Yes 11.4 X X X Livestock Bad Low Yes 8.8 X X X Mixed rainfed Good Low Yes 7.2 X X X Mixed rainfed Bad High No 6.8 X X ? X Mixed rainfed Bad Low Yes 5.1 X ? Livestock Good Low Yes 5.0 X X Mixed rainfed Bad High Yes 4.0 X X ? Mixed irrigated Good High No 3.2 X X X Livestock Good High No 2.2 X
Urban livestock production ? X X

421
B GEZIRA LARGE SCALE IRRIGATION SCHEME, SUDAN
4.12 Methodology and information sources: In February 2004, Sudan’s Ministry of Science and Technology (MOST) requested support for livestock research in the country. This led to the formation of a team that would address the emerging and important issue of better integrating livestock and water management. The importance of the issue to the country is obvious when one realizes that Sudan has by far the most animals and the largest irrigation scheme of any African country. This report is based on discussion with Sudan’s researchers held over a six-month period and followed up a four-day effort in August 2004 to compile critical information on large-scale irrigation schemes, pastoral livestock production and livestock keeping in the urban area of Khartoum. References cited were augmented by the team’s in-depth knowledge of these systems
4.13 The Gezira Scheme, situated between the Blue and White Niles, covers an area of about 880,000 ha and produces most of the Sudan's cotton and wheat, as well as significant amounts of sorghum, groundnut and vegetables, along with other crops. It provides livelihoods for some 120,000 farmers and their families as well as various groups of immigrant families and labor. Irrigation water consumption by the scheme accounts for about 35% of the Sudan's allocation of the Nile waters of 18.5 billion m3 (World Bank, 2000) and represents a major investment component of the scheme. Although irrigation primarily targets field crops, substantial populations of various livestock types exist in the scheme that are directly or indirectly affected by the irrigation water supply.
4.14 Historically, there was hardly any consideration of livestock integration in the cropping system at the start of the scheme in 1925 when the focus was predominantly on cotton. At that time a small area of the scheme was allotted outside the main crop to the fodder legume "lubia" (Lablab purpureus) to feed oxen for land preparation. However, lubia was introduced six years later in the rotation in a small area (3%-6% of the total farm area and 6%-12% of the crop area) along with sorghum, a crucial food crop from which stover is an important component of livestock feed, in about 30% of the crop area. Lubia was abandoned in 1974 due risks of its transmission of insects (whitefly) to cotton, but the cultivation of sorghum continued and expanded, while other crops, mainly groundnuts, wheat and vegetables became integral parts of the rotation with the crop intensification policy in the early 1970s, as more water was made available to the Gezira.
4.15 Multiple roles of livestock in Gezira. In the early period of irrigation at Gezira, pastoralists continued to bring animals into the Gezira for traditional dry season grazing resulting in conflict with croppers. However, by the 1980s, 90% of the residents including tenants, merchants, and labourers owned most of the animals in the scheme including cattle, sheep, goats, camels, donkeys, horses, chickens and pigeons. Numbers of locally owned animal increased partly because tenants sought alternatives sources of income and livelihoods to cash crops having low profitability particularly in areas where irrigation water supply was unreliable and partly because with people with increased wealth invested in livestock as a means of storing their newly accrued assets. DEVCO (1984) that the average tenant receive 30% of his/her income from livestock and that 40% of the animals in the scheme belonged labourers. Many of the residents’ animals were kept seasonally in rangelands outside of the irrigation scheme because of the need for feed but returned to take advantage for crop residues. However, the equines were kept within for personal transport and to pull carts. Historically, cattle, sheep and goats were kept for milk and market sales, but these were products consumed locally because of high demand that includes

422
expanding urban and peri-urban areas within the Gezira area. Demand for Gezira’s crop residues and other feed stuffs to supply Khartoum and the associated export market aggravated farmers’ efforts to feed their own animals forcing them to send their animals into adjacent rangeland areas.
4.16 The early crop rotations did not consider livestock production in terms of forage requirements apart from cotton and sorghum residues and grazing on fallow and marginal lands, in spite of the fact that a considerable part of the tenants owned animals. In 1968/69 some 55,882 ha were grown with lubia while the cultivation of phillipesera, another legume fodder, was encouraged. But such a trend did not continue and animals had to thrive mainly on crop residues, especially purchases of sorghum residues from rain-fed areas, and grazing on natural pastures that imply traveling of long distances at times of feed shortages.
4.17 Due to the severe drought in the first half of the 1980s and based on recommendations of studies conducted at the Agricultural Research Corporation, there was a significant shift in policy aimed at promoting the integration of livestock in the cropping system of the Scheme. This involved the change of the then 4-course rotation to a 5-course rotation that accommodates a leg of forages, mainly legumes. The shift implied a reduction in the area of other crops and directing part of the irrigation water to the benefit of forages for livestock production. Associated with this, a limited number of farmers who did not own livestock were provided with either two cows or five head of sheep each on loan basis from the Agricultural Bank of Sudan in season 1991/92. Using this approach, 820 cows were distributed in the growing season of 1991/92. This implies that, on the production side, policies were supportive of livestock integration into the cropping system as judged by the plan to grow and expand the forage area to reach about 183,578 thousand ha by season 1993/94. However, implementation on the ground was far from what was planned such that the forage area underwent a sharp decline from a maximum of 12,605 ha in 1991/92 to 1,891 ha in 1992/93 and to only 487 ha in 1993/94, after which the 5-course rotation was no longer used. Gezira official statistics revealed no forage cultivation during the period from 1994/95 to 2001/2002, and it likely remains true now. Currently, the rotation is widely recognized as cotton – sorghum – groundnuts – wheat (or other winter crops) – fallow (World Bank, 2000).
4.18 Reasons for failure to adopt the 5-course rotation and grow forages appear multi-dimensional. Firstly, since only 40% of the tenants owned livestock, the incentives for the majority of the tenants (60%) to grow fodder crops were lacking. Secondly, tenants who were provided with support to own animals lacked experience in livestock management. Thirdly, the labour cost per animal was high for households that received just a few of them, and diseconomies of scale became a disincentive to keep them. Fourthly, markets for livestock products were not well-developed, discouraging farmers from expanding production. Related to this, there were no effective policies in place to address the disposal of livestock products in terms of developing markets or processing to match the area-related production policies.
4.19 Literature from various sources and different key-informants give conflicting accounts of the numbers of livestock and the market potential for livestock, livestock products and animal feed. Part of the confusion lies in the fact that Gezira is not just populated with tenants who surprisingly have relatively few animals, but by others who often keep many. Furthermore, many Gezira residents own animals but keep them on rangelands for much of the year, and they do so because of lack of feed and as a place to store accumulated in the currency of livestock numbers. Yet, it is reported that there is a poorly developed market for animal feeds. Although
423
information sources report that feed is generally lacking, much feed is exported from Gezira suggesting that it has high value for supplying urban livestock in Khartoum and for fattening export-bound cattle and sheep in and around this large urban centre. What is clear is that there are many domestic animals in Gezira, much grazing land adjacent to it, and high demand for feed in nearby Khartoum. At minimum, there is a need for a systematic assessment of the opportunities for and constraints that limit livestock production from realizing its potential in the irrigation scheme.
4.20 Although substantial amounts of crop residue were and are still produced in the Gezira, they are subjected to considerable variability both over time and space in relation to the requirements of livestock in terms of dry matter. This might be a justification for farmers who own small numbers of livestock not to grow fodder as recommended on account of its relative availability.
4.21 The balance between animal numbers and their feed requirements with feed supply in the Gezira requires attention. There are about 1.72 m head of livestock in the Gezira, corresponding to about 0.57 m TLU (Fadlalla, 2001). Of these, cattle amount to about 0.40 m head, sheep are 0.58 m head, and goats are 0.64 m head. The average ownership of livestock per farmer is about 5.3 TLU, taking into consideration that 40% of the Gezira tenants own livestock as mentioned earlier. Total feed production from crop residues and fallow pasture in the scheme is estimated at about 2.0 m tons of DM on average, which varies with the total area planted and the crop mix. Sorghum stover contributes well above 50% of the DM. Relating crop residue amounts to livestock requirements, energy requirements can be met in 10 out of the 18 administrative units (named "Groups") of the Gezira Scheme (Fadlalla, 2001). Faki et al. (1993) indicated that, although the total dry matter (DM) from crop residues and fallow pastures more than meets the requirements in total, significant monthly deficits of 115 tons are faced in the period, July to October, implying the need for fodder processing and conservation.
4.22 Irrigation water is a major factor influencing livestock production in the Gezira. Although the engineering capacity of the irrigation network was designed for water supply to match planned crop areas within the identified rotations, yet actual water supply has for a long time run short of meeting crop requirements due to the reduction in the capacities of irrigation canals through silt accumulation and weed infestation. This has resulted in a reduction of the efficiency of the irrigation system to less than 50% (World Bank, 2000) as compared with a designed efficiency of 75%. Irrigation constraints of this nature have far-reaching implications on crop productivity, including crop residues, sorghum grains and cotton seed cake that are used as animal feed. Reduced availability of irrigation water also limits possible expansions of the cropped area and consequently of the potential for forage and residue production. This may constrain meeting the demand for forage now rising from both inside and outside Sudan.
4.23 Limited supply of water and lack of appropriate allocation of water to meet livestock production requirements enhances the likelihood of conflict between livestock keeping interests and crop producers who feel at risk when unwanted animals seek water and feed.
Water/livestock relations in the Gezira are also associated with some hazards. The design of the irrigation system does not address the issue of watering animals in a sensible manner. Animals drink directly form irrigation canals with high banks and accordingly poor accessibility resulting in all possible hazards of drowning and risks of accidents and physical fractures. Moreover, water-borne diseases are a major threat to the animal health and their productivity. Liver flukes and other diseases are
424
transmitted among animals through canal water. Water-borne zoonotic diseases also adversely affect human health in the scheme requiring coordinated investments in both veterinary and human health.
4.24 Water related policy:
• Planning for livestock in irrigation systems. Gezira is an example of large-scale irrigation developed without taking into account the existing livestock production in the area, the potential for livestock and livestock products to contribute to wealth generation and poverty reduction, the role that livestock play in households including preservation of family wealth, milk for local consumption, and animal power. However, African farmers value and keep domestic animals even in irrigation schemes. Planning for and design of future development an rehabilitation of large-scale irrigation systems require a livestock impact assessment to address:
1. Costs to pastoralists who lose access to dry season grazing reserves,
2. Potential for conflict between pastoralists and irrigators and measures to reduce this,
3. Opportunities for marketing of livestock, livestock products and feeds,
4. Alternate options for enabling residents of irrigation schemes to save newly generated wealth arising from the adoption of irrigation in contrast to the prevailing trend for people to invest in animals that require additional feed and water for animal maintenance, and
5. Project design that provides feed and water for livestock kept for multiple purposes taking into account the need for year-round supplies
6. Project design that integrates of animal use of grazing lands adjacent to the command areas with use of feed produced in irrigated areas that provide fallow, crop residues and dedicate irrigated forage crops.
• Livestock drinking and irrigation. Farmers’ livestock need drinking water, but Gezira is an example of widespread lack of planning for this. Although much water is associated with irrigation systems, safe places for drinking are often lacking and availability may depend on water allocation schedules. In developing new irrigation schemes and in restoring old ones, policy makers and planners need to take into account the presence of livestock through provision of drinking water at spatially strategic watering points and to design canals to exclude livetock from them. Storage tanks or other approaches may be needed to satisfy animals’ needs when water is not supplied to crops.
• Livestock health and irrigation. This case study typifies an African-wide problem that livestock are susceptible to water borne diseases such as liver fluke (Fasciolosis). Such diseases decrease animal productivity, decrease the value of animal products, threaten animal populations that serve as the accumulated store of wealth arising from investments in irrigation, and jeopardize human health in the case of zoonotic diseases. Livestock also contribute to contamination of water by spreading organisms such as cryptosporidium and pathogenic strains of coliform bacteria. A combination of interventions involving both improved water and livestock management may be needed. For example, on one hand, providing drinking water and feed in a manner the separates animals from habitats where snail vectors are common can break the cycle of parasitic infections. On the other hand, animal based interventions such as providing low cost anthelmintic drugs (ones that treat liver fluke) can greatly increase animal health and productivity.
425
Combining both veterinary and water management approaches may be beneficial by increasing overall agricultural productivity and by reducing the need to keep so many water-consuming animals for household purposes.
• Livestock management to reduce degradation of irrigation systems. This case study confirmed that livestock damaged irrigation canals when they climb down steep embankments to drink. Reports also suggest that poor upstream grazing practices may contribute to sedimentation of reservoirs, dams and irrigation canals thereby reducing their longevity and effective command areas, and increasing their maintenance costs. Improving animal management in, around, and upstream from irrigation systems may help prolong the useful live of investments in irrigation by reducing sedimentation and the associated high amplitude of in-flow that varies from periods of flood to times of deficiency and by mitigating damage to canals.
4.25 Complementary livestock related policy:
• Market opportunities for livestock produced in irrigation systems. Evidence from Gezira suggests that little thought was given to the potential for producing livestock and livestock products as highly valued marketable outputs. Irrigation development may benefit from factoring in the demand for animals, animal products, and feeds as opportunities to be considered in developing and rehabilitating large-scale irrigation systems. There will be trade-offs between allocating land and water to livestock and crops. In the case of Gezira, it appears that non-tenant residents play a major role in livestock production, but nevertheless, they are largely dependent on water and feed resources made available through irrigation. Animals also need designated physical space where they can be kept, watered and fed. Where livestock can or do contribute to livelihoods, they will need better feed quality, fodder processing and feed storage. In addition, this case study suggests that livestock-related market infrastructure and market information is lacking and that non-water market investments could improve the water productivity of the whole system.
• Livestock management to reduce degradation of irrigation systems. Declining soil fertility constrains irrigated crop production, and use of livestock manure may help remedy this problem, but this requires policy and action favourable to keeping livestock in places where manure is needed. Inclusion of leguminous fodder as an irrigated crop or in rotational fallows may also enhance the soil fertility enhancing value of manure. Additionally, livestock that graze on rangelands adjacent to command areas may deposit manure within command areas and on their return to the irrigation scheme. Such biomass transfer augments soil fertility.
• Livestock health and irrigation. Policy-makers need to promote measures such as vector and parasite control to mitigate a range of livestock and human diseases that are aggravated by close association of livestock with water. Additionally, provision of veterinary care may foster increased productivity and profitability of animal products that meet food safety and health regulations that are vital to market access.
• A trend toward privatization. The Gezira and other Sudanese irrigation systems are likely to undergo major restructuring. This will probably include privatization of the delivery of inputs and services by the private sector except for water supply, research and extension that the state will continue to provide. Farmers will have free choice of crops and activities in which they engage. Under a free-market
426
situation, investments will have higher response to market changes where livestock production can certainly become a priority production options. Implementation of this policy requires care to ensure smooth transition from an old to new economy in the scheme.
4.26 Key findings:
• Whether planned or not, livestock will normally be present in and around large-scale irrigation schemes in sub-Saharan Africa. Without planning, conflict between livestock keeping and other agronomic livelihoods may arise.
• Original irrigation planning and development largely ignored the reality that livestock would be present in the irrigation scheme and contribute value added production, animal power for cultivating fields and transport, and serve as means of storing household wealth arising from investments in irrigation. Some of the wealth generated from irrigated crop production is secured through livestock ownership that requires water and feed for maintenance.
• Siltation of the Gezira irrigation canals has reduced overall performance and reduced the amount of potentially available crop residue that could be used as animal feed.
• Market development for livestock, livestock products and feeds was not part of the planning process, and some potential benefits have been lost.
• Effective policies and technologies for provision and storage of feed and drinking water are lacking.
• Because livestock are forced to drink from irrigation canals, water becomes contaminated, water borne diseases such as liver flukes reduce profitability of livestock production, and animals damage can embankments.
• The Gezira will likely undergo a major shift toward privatization of the delivery of farm inputs except for water, research and extension and probably for livestock keeping as well.
• Policy changes are needed to:
- Prevent and deal with possible conflicts between pastoralists and irrigation farmers when the former bring animals to traditional dry season grazing areas that have been occupied by farmers,
- Balance requirements for feed production with crop production taking into account feed quality and its seasonal availability,
- Support market options for livestock, livestock products and feeds, - Enable strategically placed year-round watering options for livestock
to increase livestock production and to reduce animal access to canals, - Strategic allocation of drinking water for animals increase access to
crop residues, and - Provision of veterinary services with particular attention given to
water-borne diseases such as Fasciolosis. -

427
C. PASTORAL RAIN-FED LIVESTOCK PRODUCTION IN WESTERN SUDAN
4.27 Methodology and information sources: In February 2004, Sudan’s Ministry of Science and Technology (MOST) requested support for livestock research in the country. This led to the formation of a team that would address the emerging and important issue of better integrating livestock and water management. The importance of the issue to the country is obvious when one realizes that Sudan has by far the most animals and the largest irrigation scheme of any African country. This report is based on discussion with Sudan’s researchers held over a six-month period and followed up a four-day effort in August 2004 to compile critical information on large-scale irrigation schemes, pastoral livestock production and livestock keeping in the urban area of Khartoum. References cited were augmented by the team’s in-depth knowledge of these systems
4.28 Livestock population: Western Sudan is the most important livestock producing area in the country. The total number of livestock in Western Sudan (comprising Greater Darfur and Greater Kordofan States) is about 47.529 million head, forming about 39% of the Sudan’s national herd. In terms of numbers, sheep is the most dominant species forming 40% of the total animal population in the region, followed by cattle and goats, each contributing 28%, while camels’ form 4%.
4.29 Livestock production systems: Two distinctive systems of livestock production prevail in Western Sudan. These are agro-pastoralism and nomadism. Agro-pastoralism combines traditional rain-fed crop farming with sedentary and semi-sedentary livestock keeping, while nomadism involves rearing animals as the major means of livelihood where the nomads' way of life is migration with their livestock. In the northern parts of the region, camel herders or "Abbala" are found within a complex involving raising camels and sheep along with some goats. In the southern part, the "Baggara" mainly cattle raisers are found. The two complexes distinctively practice a rainy season and a dry season migratory movements, which usually carries them outside their homelands (locally called, “dars”).
• The Abbala system (camel herders): The Abbala "dars" are in northern parts of the region where they usually spend the rainy season grazing on the available range there. All of the Abbala herders operate from small fixed settlements made of widely spread homesteads that are located near watering points, with separation between households and the herds. Apart from negligible millet cultivation, the Abbala do not practice crop production. As an adaptation to the harsh environment, the system utilizes the developed traits of the camels including tolerance to water deprivation and ability to walk for long distances to graze the very sparse vegetation, which would otherwise be wasted. A distinctive source of grazing for the animals of the Abbala during the latter part of the rainy season is the Gizzu, a localized area of succulent plants found in the hyper-arid zone. The Gizzu is usually associated with sandy soils, localized depressions, and dry Gizzu grounds. In some years camel herders travel up to 1000 km in the desert in search of the Gizzu. Gizzu utilization is interrupted by years of rain failure estimated at 2 out of every 5 years. Harrison and Jackson (1958) estimated the carrying capacity of Gizzu areas was at 26 TLU/km² in areas located on basement complex soils. This carrying capacity implies a primary production of 600 kg/ha, which can be attained only in those parts receiving more than 200 mm of rains.
With the cessation of the rains, the Abbala pastoralists move southwards in search of grazing during the dry season, following different migration routes, which takes them far south up to the Bahr El Arab river. This southern movement brings the
428
Abbala in contact with the sedentary cultivators, as well as with the Baggara tribes resulting in conflict with both groups.
• The Baggara cattle herders: The agro-pastoral system of the region is typical of cattle herders (Baggara). Harrison and Jackson (1958) and Hunting Technical Services (1974; 1976) identified five ecological systems namely the Qoz, Baggara, Regeba, Bahr, and Basement Land systems, which differ according to rainfall, soil type and human activity. Though livestock provides for the major part of the household needs, these groups do practice limited crop production in the form of millet, sorghum, groundnuts, sesame and other crops. The main livestock species raised are cattle, although some sheep and goats are also kept. The pattern of migration is affected by the herd size and the season. Large herd owners prefer to spend the dry season at Bahr El Arab, Upper Nile, Bahr El Ghazal and Central Africa. However, since 1983, migration into these areas has been seriously hampered by the civil war in Southern Sudan. Smaller herd owners opt to stay on the acidic sandy (Qoz) land system, and Qoz/alluvial transition zone, depending mainly on water from water yards and wells.
Similar to the case of the Abbala, the Baggara carry a northward movement with the progress of the rains, and a return movement with the finishing of the rains, resulting in conflict situations with villagers and the Abbala herders.
4.30 Sources of water: Rainfall is the major source of water for the livelihoods of people in the region. It sustains agriculture and range vegetation, and provides drinking water for human and livestock populations. The richness of the range resource, which is virtually the exclusive source of feed for livestock, declines from north to south following the gradient in rainfall. This pattern of rainfall and consequently the available pasture dictates the seasonal movement of livestock herders along the north-south axis.
Water for human and livestock is usually available from one or more of five main sources. These are:
Water yards or deep boreholes in the case of the deep underground water basins such as the Baggara Basin.
a. Shallow wells found in alluvial deposits in the riverbeds and banks of seasonal water courses.
b. Man-made pools (hafirs) on clay soils in basement complex areas. c. Seasonal temporary ponds and ditches filled during the rainy season. d. Permanent water sources from rivers and lakes in the far southern part of the
region such as Bahr Al Arab and Lakes Kundi, Keilak and Abiad.
In drought years, the livestock movement continues deep south into Bahr El Ghazal and Upper Nile States where the source of water is the White Nile or its tributaries. The diverse water sources mentioned above facilitate a fairly even distribution of livestock on the range. Nonetheless, there are many overgrazed areas due to high concentration of animals around various watering points. There are also considerable expanses of underutilized rangelands due to shortages of drinking water. Therefore the balance between the distribution of water sources and the utilization of rangeland is a vital policy issue whereby grazing pressure can be released from overgrazed areas through opening of new water sources in underutilized areas.
429
4.31 Water borne-diseases, animal health and zoonoses: Obviously, the excessive animal densities around water sources and the resulting overgrazing and land degradation leads to poor animal condition, low productivity and high mortality among livestock, especially during the late dry season. This situation might in some cases be associated with transmission of a number of animal diseases such as liver flukes particularly in cases of open confined water sources such as lakes and hafirs. Around dams, for instance, schistosomiasis in animals may create problems. In the Jebel Marra area in the west, infection of livestock with fascioliasis, schistosomiasis and coccidiosis are among major causes for concern in many animal species. Under dug wells and surface water sources, coccidiosis and cryptosporidiosis can sometimes flare up. Other water-borne diseases such as colibacillosis and salmonillosis are common causes of animal illness under poor water hygiene. Animal trekking for long distances in search for water along with the associated crowdedness can subject animals to infectious diseases like contagious bovine pleuropneumosis (CBPP), trypanosomosis through biting flies, brucellosis, tuberculosis, paratuberculosis, etc. Zoonotic diseases such as salmonellosis and cryptosporidiosis could also be transferred to humans though contaminated water. Animals that migrate further south into Bahr El Ghazal and Upper Nile States might contract diseases such as trypanosomiasis. Since in most cases, animals and humans drink directly from the same water source with no sanitary measures the hazard of transmission of zoonotic diseases is likely to be high.
4.32 Competition and demand for water: Concurrent droughts and the resulting continual migration of affected communities with their animals southwards within the region to areas with relatively better water and range resources has led to increasing frictions and in some cases to major conflicts between crop growers and pastoralists as witnessed now in Darfur.
Water in Western Sudan is a critically scarce resource reflecting on the livelihoods of the people in the region. In most areas people have to pay high prices for drinking water for both humans and animals thereby consuming a large share of the household budget. In some cases, especially in water yards of the Qoz lands, water accounts for as much as 60% of such budgets. This drives more people, particularly those with large herds of animals, to utilize the open water sources with all the implications and hazards mentioned above.
On account of its scarcity and high costs, at lib watering of animals is uncommon, rather, animals are subjected to relatively long watering intervals. Camels may be watered every 9-15 days, and when given water they can drink 40-120 litres. The watering interval for cattle can extend for 2-3 days with a water capacity of 15-40 litres. Sheep and goats have a watering regime of 3-5 days and can drink 2-4 litres of water at a time. Such practices have a detrimental effect on the condition of animals. Since the grazing close to watering points is gradually depleted towards the end of the dry season, animals have to walk for over 20 kilometers to reach the grazing locations. A study by Fadlalla (1987) showed that sheep walking 20 km/day lose 29% of the energy they store during a day. However, other studies (Mukhtar and Fadlalla, 1988) have shown that there is no difference in weight gain or feed intake between sheep watered daily or at intervals of two, three or four days. Although this provides opportunities to reduce the high cost of energy lost through walking by increasing the watering interval, such watering intervals are often exceeded in many cases.
4.33 Water harvesting: Water harvesting for crop cultivation and for animals and humans exists in various forms. Dams and terraces in water catchment areas are

430
examples of such forms. In high rainfall areas, terraces are used as a means of water harvesting for cultivation of different field and horticultural crops and shallow dug wells for human and animal uses. In poor-savannah areas, water-harvesting techniques comprise dams, hand-dug wells, terraces and cultivation in water catchment areas. Watermelon represents an important means of water harvesting strategy where it is grown in vast areas to be utilized in the dry season for both human and animal use. Moreover, a widespread method is water storage in baobab trees (Adansonia digitata) during the rainy season for household and animal use in summer. In wood savannah climate where rainfall ranges between 300 and 700 mm, water harvesting methods include boreholes, dug wells, dams and utilization of water catchment areas for crop production and livestock keeping.
4.34 Livestock-based livelihoods: The pastoral livestock systems of Western Sudan are closely interlinked with livestock fattening, markets and export based in Khartoum Province and with feed production originating from large-scale irrigation systems such as Gezira and Kenana located near Khartoum. Without Khartoum in the market chain, much of the value of livestock production in Western Sudan would be lost.
4.35 Water-related policy issues:
• Planning for livestock in irrigation systems. Although pastoral areas are not irrigated systems, there can be both positive and negative synergy between large-scale irrigation systems and nomadic livestock production. On one-hand irrigated forages and crop residues can be used to fatten range raised livestock for export markets greatly enhancing demand for pastoral production and providing increased options for high value outputs associated with irrigation. On the other hand, irrigation development often deprives pastoralists of dry season grazing reserves greatly jeopardizing their livelihoods. In developing or rehabilitating irrigation systems, there is need to take into account the trade-offs and potential benefits arising from investments in irrigation in locations valued by pastoralist livestock producers. Appropriate policy can address the market opportunities for providing feed to fatten livestock in the market chain connecting pastoral areas to consumer markets, the need for equitable consideration of the impact of irrigation development on pastoralists’ traditional land tenure and grazing and watering rights.
• Complementary water-related policy in pastoral areas. While the prime target readership for this paper focuses on investors concerned with development and rehabilitation of irrigation, the following points document complementary policy that may be required in pastoral areas that interact with irrigated agriculture. - Develop drinking water supplies in pastoral areas. Policy makers need to
consider expansion of livestock watering points in pastoral areas that have surplus supplies of rangeland feed but remain underutilized because of lack of drinking water. Possible interventions include the establishment of "hafirs", boreholes, water yards and dams in such areas. Care is needed to ensure that ground water is not contaminated and that communities limit animal numbers and prevent overgrazing. Such solutions may help reduce conflict that arises when pastoralists lose access to dry season grazing reserves.
- Invest directly in livestock within water harvesting systems. Often water harvesting is most needed in areas where livestock production is the dominant form of agriculture. Although production of food crops is common, improving fodder production and quality needs greater consideration with due consideration to the best forage and dual food-feed crops that can be produced.
431
- Water quality. Improved sanitation at watering points is needed to effectively combat water-borne and zoonotic animal diseases. Appropriate improved technologies in the design and management of watering points are needed.
- National policy on water can greatly influence livestock management. Among other factors, water availability and the ecology of the region influence the types of species kept and herd size depend largely on access to water. Thus, there is a need for water development policy to be closely integrated with livestock policy in pastoral areas.
4.36 Complementary livestock policy:
Under the existing situation, camels and sheep are important in the drier north, while cattle dominate in southern parts where better grazing and water are available. However, raising a mixture of animal species of animals increases the efficiency of range utilization while they produce milk at different seasons increasing its year-round availability. Small ruminants are frequently kept together with cattle or camels. In most cases, more animals are usually kept are necessary for subsistence, mainly to cater for natural disasters, predators and theft. Together with other policies, public and private investments in developing water resources can be geared to serve the most economically efficient distribution and intensity of livestock that, at the same time, lead to environment conservation under pastoral systems through the geographical distribution of water points. Some priority policy options include:
• Promote education and human capacity building. These are of paramount importance for enhancing greater awareness for the management of the water resources, especially with respect to sanitation issues, health problems and rational use of drinking water. Accordingly, investment in human capacity building, besides its general positive impact on various aspects of life, is expected to reflect positively on water/livestock management issues.
• Management of common property grazing and watering resources. Ineffective communal use of land is a well-known constraint to livestock production that negatively influences the efficiency of utilization of natural pastures and available water resources. Although the issue is a complicated one, policies will need to gradually consider legislation on land tenure rights, if degradation of natural resources is to be harnessed and economically efficient livestock production systems are to be in place. Where appropriate traditional pastoral institutions for allocating feed, range and water resources needs consideration along with institutionalization of individual grazing rights to access to natural resources.
• Livestock market development and provision of drinking water. Linking promotion of markets with development of drinking water for pastoral livestock can help prevent overstocking of animals after development of watering points. Markets form an important policy options that has implications for livestock production in general as well as important relations to water for livestock. Under the pastoral systems of western Sudan, water influences the marketing pattern of livestock where usually the bulk of marketing activities occurs during two main periods. One of those periods is just before the northward migration at the onset of the rains to provide for household needs, and the other before embarking on the dry period migration towards the end of the rainy season. Water investments for pasture improvement and drinking water can be effective in promoting a more even distribution of marketing activities with possible increased stability in prices and supply to both producers and consumers.
432
4.37 Key findings:
• Western Sudan, a water scarce area, is home to about 50 million domestic animals, there is a great need to balance animal distribution with availability of water and feed in the rangelands.
• To a large degree, profitability of pastoral livestock production is linked through the market chain to fattening animals around Khartoum for local consumption and export. The large-scale irrigation systems located in proximity to Khartoum provide the feed resources necessary to enable the transfer of animals from remote rangelands in Western Sudan to consumers.
• Shortages of drinking water and feed force pastoralist migration and contribute to conflict. Developing watering facilities is a priority in feed surplus areas and could help reduce conflict. Use of ground water and water harvesting are priority investment options, but the trade-off between provision of year-round and seasonal water must be considered.
• High prices for drinking water forces pastoralists to take their animals to open water sources and causes contamination.
• Watering points require effective management to prevent contamination of water and spread of water-borne animal and zoonotic diseases.
• Education and capacity building in management of livestock around water resources in rangelands are needed.
• Policies (including those addressing land and water rights) and institutional arrangements are needed to bring about effective community-based management of common property watering points.
• Investments in and enabling policies for development of and access to markets for livestock and livestock products must be linked to investments in drinking water development for livestock.

433
D. URBAN AND PERI-URBAN LIVESTOCK PRODUCTION, KHARTOUM, SUDAN
4.38 Methodology and information sources: In February 2004, Sudan’s Ministry of Science and Technology (MOST) requested support for livestock research in the country. This led to the formation of a team that would address the emerging and important issue of better integrating livestock and water management. The importance of the issue to the country is obvious when one realizes that Sudan has by far the most animals and the largest irrigation scheme of any African country. This report is based on discussion with Sudan’s researchers held over a six-month period and followed up a four-day effort in August 2004 to compile critical information on large-scale irrigation schemes, pastoral livestock production and livestock keeping in the urban area of Khartoum. References cited were augmented by the team’s in-depth knowledge of these systems.
4.39 Livestock in Khartoum: Urban and peri-urban livestock in sub-Saharan Africa is becoming increasing important. With urban populations growing and anticipated increased income, urban populations will likely drive future demand for meat and milk products. While most cities in Sub-Saharan Africa have ignored or banned livestock, they continue to thrive. For poor urban dwellers, livestock provide income based on a high valued agricultural product that requires a small land base. Most animal feed is imported into cities and is produced using “virtual water” or water depleted outside of the city to enable agricultural production within it. The advantage of virtual water is that it reduces competition with other water users within the urban system. Provision of drinking water and preventing or coping with contamination of surface run-off water are the main issues. Khartoum is a unique example of a major centre that has accommodated livestock within its domain.
Small family businesses and modern dairy farms constitute the major part of this system. Although many families in towns used to keep few small ruminants, mainly goats, inside their residences for home supply of milk, this seems to be decreasing. Further, Khartoum represents one of the most important markets and trade centers for live animals in the country. It hosts transient traders' business in livestock brought form various parts of the country, especially western Sudan, for export and local market supply. It also has a flourishing market for milk on account of the escalating population growth brought about by the rising rural-urban migration. In addition, the slaughter house in Khartoum forms a centre for meat exports, although most of Sudan's livestock exports are in the form of live animals.
4.40 The pastoralist-urban interface: Some of the prevailing livestock production systems in Khartoum have emerged through long-term interactions with pastoralists who move due to drought, especially during the severe drought years of the early 1980s, to the vicinity of towns. Salih (1985) described the situation of pastoralists' settlement in the North West parts of Omdurman (part of Khartoum Province), pointing out that the penetration of the market economy, the imposition of modern systems of governmental control and an increasing frequency of natural disasters, such as drought and desertification have dramatically changed the picture for pastoralists, who have become ever more dependent on and vulnerable to fluctuations in the market economy of which they are an integral part. This led to gradual urbanization of those nomadic people who nevertheless keep large numbers of animals dominated by goats. His study revealed the concerns with water for animals and feed, where especially sheep and cattle need large supplies of water. Cattle in particular cannot skip drinking for a long period and they cannot reduce their water
434
requirements by eating green plants. They drink three times the quantity of water used by a sheep, a goat or a camel. Quoting estimates by the Ministry of Agriculture, Food and Natural Resources from 1972, Salih (1985) reports that a cow drinks 0.03 cubic meters a day; whereas a camel, a goat, or a sheep drinks 0.01. However, this difference largely reflects the size difference between cattle and sheep. Since the banks of the rivers can supply an abundance of water and a relatively good supply of fodder, green grasses, and other sources of feeding, cattle owners have made their way to the outskirts of Omdurman town and scattered villages alongside the banks of the rivers.
4.41 ivestock trading and marketing in Khartoum: With the growth of livestock trade, particularly exportation to Saudi Arabia and the Gulf States, merchants and companies, mostly operating from Khartoum, gradually replaced traditional traders. The big livestock market located at Omdurman is not only the transit center and terminal market for a large proportion of the officially marketed livestock, but it is also the financial and organizational pivot of Sudan’s livestock marketing. Wholesale merchants from Omdurman provide most of the working capital used in production and marketing. They also provide credit to butchers and have the export business “know-how”. By means of a network of agents and dependent traders, these merchants also dominate secondary markets outside Khartoum. The market is an important collection and transaction centre for livestock, especially for cattle and sheep, for export and domestic slaughtering. Animals brought on hoof or by trucks from distant rural areas by traders are associated with high investments in original purchases, feed and watering en-route, animal maintenance at the market centre, and risks of losses at various stages of the market. Because much of the urban livestock production and marketing depends on the supply of animals from distant pastoral areas and because pastoralists depend on the urban market for income generation, there is a great need to integrate urban and pastoral policy and planning. One without the other is not sustainable.
Improving marketing is the key to the development of the livestock sector in pastoral systems, especially western Sudan, and Khartoum holds the key. Those systems are characterized by high risks and costs, seasonality of supply, and the fact that they handle almost exclusively mature livestock. All these characteristics are largely the result of the transport constraint; and it is by improving the facilities of moving stock from the west, that the most immediate improvement to the marketing system may be achieved (Hunting Technical Services (1976 – an old reference, but also confirmed by numerous interviews with key informants during this study). Thus investments in water development for the pastoral areas must be linked to effective market development that is now focused on Khartoum province.
Although the livestock population of 1.14 million head within Khartoum State (Ministry of Animal Resources, 2000) is low compared with other states of the country and forms only about 1% of the country total, it gains high importance because of its high integration in the market. The city provides commercialization opportunities for drought stressed pastoralists in spite of the unfavorable marketing environment within which wholesale merchants extract high profits (Salih, 1985).
4.42 Milk selling involves less risk to migrant pastoralists than the sale of live animals. Those migrants, however, cannot afford to maintain such large dairy herds, which would require massive capital investment, high labour capacity and full time attendance. Thus, it is now customary to see various forms of milk distribution in Khartoum: by carts pulled by donkeys from small producers to houses and retail

435
shops, and by trucks from larger modern dairy farms to business firms and big retail centres.
4.43 Water and feed for livestock in Khartoum: A striking feature of all peri-urban livestock systems is the high dependence on purchased feed and water. In this respect, water forms an important investment element, both on the forage production side as well as with respect to its direct use at the livestock production level. Irrigated fodder production represents one of the most important cropping activities around Khartoum, with competition from only vegetables and fruits. Most irrigation water is drawn from the Nile, but opportunities exist to use urban wastewater for feed production as it is now used to support Khartoum’s greenbelt. In addition, considerable feed and feed ingredients including fodder, concentrates, molasses, and cotton cake come from irrigated areas outside the province. Recently, fodder exports have emerged as a new activity on account of the growing demand from the Arabian Gulf States. Fodder production entails a major investment concern in water, given the limited cultivable areas around Khartoum.
4.44 Livestock diseases. Livestock diseases pose a great risk to animal health, and in the case of zoonotic diseases to human health particularly in cities like Khartoum. Situations conducive to disease transmission are:
• Importation of disease from pastoralist areas. The continuous flow of livestock from many different places increases the likely hood of introducing diseases. During the long migration to the city, animals may also come into contact with infect animals along the way. Controlling these diseases is a priority for ensuring that livestock and livestock products conform to animal health and food safety standards. High concentrations of animals and people living together increase the probability of disease transmission.
• Water borne animal and zoonotic diseases. Water is one of the most important media for transmission of animal and zoonotic diseases, and urban dairying is at risk to water-borne diseases. In modern dairy farms, reasonable hygienic measures might be followed, but data will be needed to support this lacking. Urban smallholder producers are more vulnerable because they lack access to reliable sources of quality drinking water. Not only do their animals face greater risk, but also lack of clean water makes hygienic conditions difficult to maintain in the handling of milk and milk products.
• Khartoum has a thriving business of water vendors who collect and deliver water for animal drinking and for domestic use. There appears to be no control on the quality of water that these sellers provide.
4.45 Water-related policies: • Planning for urban livestock and the role of irrigation. Khartoum is more
advanced than many urban areas in planning for the presence of livestock and provision of irrigation systems to support their maintenance. Khartoum, itself, is the center of a major livestock marketing system that brings livestock from Western Sudan and imports forage and crop residues from nearby irrigations systems. Within the peri-urban area, much irrigated animal feed is produced, but opportunities may exist to promote irrigated feed production through the use of urban wastewater in future. Given the linkages between the Khartoum-based livestock markets and the feed potential of nearby irrigation systems, there is need to for coherent policies for promotion irrigated feed production, its delivery to Khartoum and marketing.
• Complementary water-related policy in urban. Although much of the feed used in Khartoum comes from nearby irrigations schemes, there are complementary water policy and management issues that need to be addressed within Khartoum province:
436
- The legislative and regulatory framework in which livestock are kept and watered needs to be strengthened to provide full cost recovery for water used and to ensure hygienic measures are taken to prevent contamination of surface, ground and river water. This includes instituting sanitary measures to cope with waste discharge from the large abattoir in Omdurman.
- Recognizing the need for large amounts of feed to support more than one million domestic animals in Khartoum Province, strategies for efficiently providing feed with minimal water use are needed. Re-use of urban wastewater to irrigate forage crops is one option. Greater dependence on crop residues from distant irrigation schemes that reduces use of feed produced within the city may be another option. However, such as strategy dictates that efforts are made to integrate the development of the residue-based feed markets for producers in irrigated regions with urban markets. Trade-off analyses will be needed to judge whether or not irrigated feed production in the vicinity of Khartoum is justified given the high value of water for other purposes. Although, the Nile River is close at hand, the competition between production of livestock feed and horticulture centres on the availability of land, the trade-off between choices of irrigated crops, and the cost of pumping water from the river.
- Investments in clean water are essential to maintenance of hygienic conditions during processing of animal products.
4.46 Complementary livestock policy issues in urban Khartoum: Investments in water to support livestock sector growth in and around Khartoum may not achieve maximum benefit if key non-water policies are ignored. • Animal health. To encourage animal disease prevention and promote animal and
human health as well as improvement in the quality of animal products, integrated water and livestock management will likely be needed along with appropriate enabling policy. Although substantial veterinary services are provided, the need for improvement is evident. Because animals host waterborne diseases that affect people, provision of animal health services should accompany hygienic measures to use or dispose of animal waste in ways that do not contaminate highly valued urban water supplies demanded for industrial and domestic purposes. Because Khartoum is a major center for the export of livestock products, complementary investments in veterinary services to maintain high animal productive animals and to make animals and animal products acceptable in the market place are needed.
• Livestock market development. The pastoral and urban livestock systems are highly interconnected, and policy and development in one requires complementary investment in the other. Improvement in marketing is a key to successful livestock production in pastoral systems. Improved market access is needed to justify increased pastoral production. Provision of water and feed on migration trekking routes from pastoral areas to city is also required. Physical improvements in the terminal market in Khartoum, including market structures and provision of sanitary feed and drinking water, are of paramount importance.
• Trade-off between exporting animal feed and exporting animals and animal products. Twin export markets exist in the Khartoum area for manufactured animal feeds and for animals and animal products. As evidence from Gezira showed, the feed demand from Khartoum placed constraints on feed availability to farmers in the irrigation schemes. Exports of fodders such as alfalfa, feed, live animals and animal products all target the Arabian Gulf States. Success in marketing one may reduce demand for the others. Perhaps in addition to market forces, analyses are needed to determine the mix of export that contributes to poverty reduction and income generation. Key informants suggested a range of options such as placing export duties on feed and fodder to encourage value added
437
animal production in Khartoum, but more analyses are needed. The outcome of these will have implications for the uses to which scarce water resources are put. Policy may also be needed to ensure that livestock production is based on full cost recovery for water used.
4.47 Key findings:
• Khartoum is a very important livestock centre from the perspective of the growing demand for livestock products within the city and its continuing role as the pastoralists’ gateway to export markets.
• In the case of Khartoum, investing in water for urban livestock keeping must go hand-in-hand with investment in pastoral livestock production. This includes investing in secure trekking routes linking distant grazing lands and Khartoum.
• Investment and development of animal handling infrastructure including drinking water, facilities for handling animal waste from live animals and abattoirs, and clean water to maintain hygienic animal processing are needed.
• Strategies are needed to ensure that feed sourcing using minimal amounts of high valued water and increasing reliance on crop residues from nearby large scale irrigation could be encouraged.
• Evidence suggests that complementary provision of veterinary health services is essential particularly in relation to water-borne diseases that affect both livestock and people. Effort is also needed to maintain international animal health and food safety standards required to access international markets.
438
E. SOIL LOSS AND SILTATION OF AGRICULTURAL WATER RESOURCES - ETHIOPIA’S KOKA DAM
4.48 Methodology and information sources: With kind assistance of Eyasu (2003), work conducted by FAO to assess siltation rates in the Koka dam was integrated with a thesis (Berhe, 2004) assessing changes in land-use cover in the upper catchments of the Awash River basin of Ethiopia. Both Berhe and Elias had conducted surveys, literature reviews and key informants in the recent past.
4.49 The Koka Dam: Completed in 1960, Ethiopia’s Koka dam is one of the country’s most important multi-purpose reservoirs providing significant hydropower and irrigation water for large-scale and small-scale production. In the forty years since construction, thirty percent of the reservoirs original lives storage capacity of 1.7 billion m3 was lost due to sedimentation (Eyasu, 2003). This resulted in lost generating capacity and associated economic losses amounted about to 387 million Ethiopian Birr or 45 Million US$ in 2003 and that the cost of dredging the reservoir to restore original storage capacity could total at least 60 million US$.
Average annual sedimentation, estimated in 1989, behind the Koka dam reduced storage volume by 25 million m3/year (EVDSA, 1989), but the rate of sediment in-flow has more than doubled from 1970 to 2002 (Eyasu, 2003). This increasing infilling of the reservoir coincides with a corresponding trend in degradation of and soil loss from up-slope land. This further suggests that annual economic losses will continue to increase unless effective effort is made to conserve both soil and water resources. Increased cultivation of annual crops, deforestation, over-grazing are often cited as the primary causes of degradation, but evidence now suggests that current cropping practices are the most important influence in highland Ethiopia. Sedimentation from Ethiopia is the probable cause of siltation of irrigation canals mentioned in the Gezira case study.
4.50 Annual cropping is the primary problem: Hurni (1990) concluded that annual cropland was the primary source of soil loss in Ethiopia and that soil loss per hectare was about eight times greater under such cultivation than under grazing (Table IV-3). Since 1970, annual crops have replaced much of the grazing land. For example, in the Yerer watershed upslope from the Koka Dam, Berhe (2004) estimated that grazing land decreased from 67 to 35 % of total land area while cropland expanded from 25% to 56%. Eyasu (2004) gives similar figures for other parts of the Awash basin showing a significant shift in land-use from grazing to cultivation. Over-grazing is not the primary cause of soil loss and sedimentation of water bodies as is commonly believed, but nevertheless, excessive removal of crop residue for feed and livestock grazing on stubble after harvest will, along with cultivation, expose soil in croplands to erosive forces.
4.51 Well managed grazing and siltation: Evidence worldwide suggests that well managed pasture is an excellent method of minimizing erosion, sedimentation and by implication siltation. For example, Stone and Moore (1997) states that: “permanent pasture keep soil erosion to a minimum”. Nevertheless, keeping livestock away for stream banks and water edges and preventing downward sloping livestock trails can help reduce sedimentation.
Table IV-3. Estimated major sources of soil loss from different land-use practices in Ethiopia and implied major sources of sedimentation of water bodies in Ethiopia

439
Total soil loss Land use or cover Area of country
(%)
Estimated
Soil Loss (tons/ha/yr)
(Million tons/year) (% of total)
Annual crops 13 42 672 45
Grazing and browse 51 5 312 21
Wood and bushland 8 5 49 3
Forests 4 1 4 <1
Other 24 - 457 30
Total 100 1,493 100
(Source: Hurni, 1990)
4.52 Investing in up-slope land management: Experience with the Koka Dam exemplifies the reality that poor land and crop management upslope jeopardizes investments in water storage reservoirs because of siltation. Safeguarding down-slope water resources requires parallel investments in both expanding storage capacity and in improved catchment management. Without such measures, existing and future investments in development of agricultural water such as ponds, micro-dams and irrigation canals will have a reduced lifespan and anticipated increased agricultural production may not be realized. There is compelling evidence to suggest that investments in development of agricultural water need to be accompanied by parallel investments in conservation of upslope areas within the catchment through technologies such as establishing permanent grass cover and strips on steep slopes, terracing and conservation tillage. Reducing livestock stocking rates may be beneficial if this enables retention of greater crop residue and stubble on annual croplands. Such a measure may have to be coupled with strategies to increase off-take per head in order to maintain required livestock production and animal power.
4.53 Increasing water for crops through conservation tillage: Addressing water conservation will be of paramount importance to improving agricultural production in water scarce livestock systems in Africa. One way of implementing water conservation would be through the adoption of conservation tillage by farmers in the region. Conservation tillage is the minimum manipulation of the soil, about 3-4 cm soil depth, for planting crops and leaving at least a fifth of the crop residue at harvest for soil cover. The soil cover not only reduces evaporation from the soil but will also protect the soil from wind and water erosion. It has also been found that the straw enhances the formation of organic matter, which can store water better but also improves the nutrient availability for crops to be grown on that land. Investing in conservation tillage is an important strategy to increase agricultural water for crop production, but site-specific trade-offs in benefits and costs must be assessed.
Most farmers in mixed crop livestock systems with low water potential in Africa use animal power for the cultivation of their crop areas. The crop areas are ploughed deep, up to 25 cm depth, for preparation with high power requirements. Time of cultivation varies from 70-120 hrs/ ha depending on the type of animal drawn implement used. In the Ethiopian situation where traditional oxen-powered methods are used for land preparation, the time used is highest averaging around 120 hrs/ha for the different soil types. The draught animals used in the low water potential areas of mixed crop livestock systems are estimated to be 30 million head of oxen with 14 million in Ethiopia alone (World Bank, 2004). Studies on Ethiopian Vertisols showed that using minimum tillage reduced the time of land preparation and planting to 25 hrs/ ha, a
440
reduction of more than 75% from the traditional system (Astatke et al, 2003). Thus conservation tillage could allow a substantial reduction (say 50%) in the numbers of the draught animals maintained in the country. Let us assume that one ox requires about 5 kg of feed per day, that about half of this comes from grazing, and that one m3 of rainwater will produce about 4 kg of feed. Then, reducing the number of oxen will save about 1.6 billion m3/year of transpired water in grazing areas. This is a very conservative figure since maintaining oxen herds requires other animals including breeding females, young males, and oxen in training. In addition, conservation tillage directly increases availability of agricultural water to crops, and crop residues not consumed due to decreased oxen herd size can help replenish soil fertility and productivity. Fewer grazing cattle results in less water loss through transpiration associated with reduced feed consumption. The water saved in the grazing areas could then help support additional livestock for production of marketable animal products, regenerate vegetative cover, restore ecosystem services such as biodiversity, and recharge ground water.
One of the major components of conservations is to plant crops as the rains start to capture the water by the crop and lower the loss of water from evaporation and percolation. As from the experience in Ethiopia, one problem associated to the adoption of conservation tillage on the Vertisols has been associated with the bylaws of keeping animals in the crop fields up to the end tail of the main rainy season thus planting crops late to use residual moisture. This has lead to crop water stresses during the latter part of the growing period and thus leading to lowering crop yields. The main reason for having this livestock bylaw by the community was due to feed shortage, which could be resolved by de-stocking through conservation tillage practices.
4.54 Integrating up-slope annual cropping and down-slope protection of water bodies: Evidence from the Awash River basin of Ethiopia reveals the inter-linkage of two serious problems. On one hand, farmers raising annual crops face chronic water deficits and continuing loss of soil and its fertility. The severity of this problem appears to be accelerating. On the other hand, storage capacity of downstream water bodies that are vital for agricultural production is declining at an increasing rate. Conservation tillage and other measures to control soil loss and run-off can help extend the life of reservoirs. Upstream preventative measures are likely to be less costly than dredging water bodies after the problem arises. While grazing is not the primary cause of soil loss, improved crop management together with limiting animal numbers can serve as a valuable tool for managing water resources.
4.56 Water policy issues:
• Planning for livestock near irrigation systems. Benefits from investing in agricultural water storage and irrigation canals are often threatened by siltation. Poorly managed livestock contribute to land degradation that threatens these water bodies. There is a great need to couple upstream and up-slope land management improvements to mitigate this problem. Policy-makers need to build effective collaboration between engineers who develop water infrastructure and the communities and agencies that influence forces causing upslope and upstream soil loss and sedimentation. Evidence shows that most often water resource development in SSA has not effectively implemented measures to prevent siltation and the associated loss of storage capacity for agricultural water. Here, the prime water development policy needed is to actively integrate appropriate land-based measures to control upstream and upslope soil loss to prevent damage to reservoir
441
and canal capacity. Ideally, investments in watershed management practices that reduce upslope and upstream soil loss and run-off should be implemented before construction of downstream and downslope irrigation systems begins.
• Complementary water policy issues:
- Although contrary to conventional wisdom, livestock are often not the primary cause of sedimentation of water bodies in SSA. Over much of SSA, inappropriate cropping practices are a major cause. Nevertheless, excessive use of crop residue whether through in-situ grazing or zero-grazing systems, needs to be restricted to keep a minimum acceptable level of ground cover on farmers’ fields. This practice will reduce rainwater run-off and increase infiltration that recharges soil moisture and ground water. Other measures to prevent soil erosion are also needed.
- Improved livestock management is needed to help ensure that animal paths do not become starting points for gully erosion and livestock need to be kept away from water bodies to prevent shoreline and stream bank erosion.
4.57 Key findings:
• Siltation of man-made reservoirs shortens their lifespan. Prudent investment in developing ponds and dams for agricultural water will include steps to reduce loss of performance through up-slope soil erosion and consequent infilling due to siltation.
• Annual cropping is the primary cause of siltation in Ethiopia and is a leading cause elsewhere on sloping lands in Sub-Saharan Africa. In many cases, sedimentation is associated with cultivation on agriculturally marginal land that has long served as sustainable pasture for grazing animals.
• Overgrazing is not the primary cause of siltation, but improved animal management to prevent erosion associated with trails and disturbance along the edge of water bodies is needed.
• Conservation tillage up-slope from reservoirs and well-maintained pasture can greatly reduce soil loss and siltation. If conservation tillage was widely adopted in Sub-Saharan Africa where oxen are extensively used, less feed would be needed. Resulting savings of about 20 million m3/year could be realized, while more agricultural water would reach the rooting layer of crops thereby increasing soil moisture and crop production.
442
F. Impact of Irrigation on Animal Health in Community-Based irrigation schemes – The case of sheep fasciolosis in the Awash Basin, Ethiopia
4.58 Methodology and information sources: During the period of this investment study, an MSc student, Michael Asrat conducted a survey (Asrat, 2004) to assess the impact of developing community based irrigation schemes on the Sheep Fasciolosis, a “canary” for the general problem of snail borne animal diseases around linked to animal association with water. This was a well-designed survey, coupled with extensive field and laboratory work. Michael kindly agreed to work with our team to help apply and interpret the findings in the context of the need for future investing agricultural water for livestock.
4.59 Sheep Fasciolosis and irrigation: About 85% of the population of Ethiopia is engaged in subsistence agriculture. The agricultural system depends on rainfall that is often irregular and erratic. In order to alleviate the impact of irregularities of rainfall that often occurs, Agricultural bureaus and different NGOs have encouraged community-based irrigation in different parts of the country. The main objectives of such efforts are to minimize dependence on rainfed agriculture and improve food security. Most of these irrigation systems were designed and developed without considering their interactions with livestock. The irrigation system, however, has drawbacks, which creates suitable conditions for the spread of water born parasitic diseases such as Fasciolosis, Schistosomiasis and Malaria by serving as breeding sites for vectors such as snails and mosquitoes.
Over 90% of Africa’s Small ruminants are found in East and West Africa, with only small population in central and southern Africa. Small ruminants are known for sources of meat, milk, skin and manure. They supply valuable animal proteins of high biological value in the form of meat, milk plus essential minerals and fat-soluble vitamins to poor people, pregnant mother and young children. Nevertheless, they are widely affected by Fasciolosis (Okewole, et. al. 2000; WHO 1995).
In cattle and sheep, Fasciolosis causes severe anemia, weight loss, low milk yield and poor meat production. Heavy infection can also lead to death of the host. Direct losses due to Fasciolosis are mortality and liver condemnations (rejection of livers at meat inspection). Whereas loss of body weight, milk production, reduction of power and weight of lambs from infected ewes are indirect losses of this disease (Brook 1983). The economic impact of this disease can be realized when considering the reduced milk yield and growth rate of the infected animals, their chronic low-grade anemia, and the loss of condemned livers when the animals are slaughtered. The reduction in sheep wool production in some cases rises to 39% (Malek, 1985).
Sheep and goat are very susceptible to acute fasciolosis especially the immature flukes tunnelling through the liver parenchyma causes extensive tissue damage and haemorrhage that culminate sever clinical disease and high mortality of grazing sheep in Africa (Okewleo, 2000). During the movement of the immature stages of Fasciola hepatica, which may continue for months, symptoms may include abdominal pain, an enlarged live, fever, vomiting and diarrhoea.
4.60 Survey of Fasciolosis and community-based irrigation: Asrat (2004) conducted a survey of sheep Fasciolosis in the Awash River Basin of Ethiopia. The purpose was to assess infection prevalence rate and the risk factors associated with the disease. The

443
study focused on the infection prevalence of fasciolosis in sheep raised around small-scale traditional irrigation schemes in the highlands area, mid and lowland areas of the upper Awash River basin.
Table IV-4 shows infection prevalence of Fasciolosis based on feacal samples of 1296 sample. The only observed significant difference (p>0.05) in prevalence occurred between low rainfall sites (Godino and Batu Degaga & Donni) in the dry season in non-irrigated areas and all other site-season-water permutations. The results suggest that wherever sheep are closely associated with water, whether from irrigation or rainy season exposure, Fasciolosis prevalence will be higher than in non-irrigated dry areas. The implication is that by introducing irrigation into semi-arid and arid regions, livestock will be at greater risk to Fasciolosis and probably other snail borne diseases, and measure to counter this threat may be needed.
Table IV-4. Infection prevalence of ovine Fasciolosis Parasite associated with community-based irrigation at four sites in the Awash River Basin, Ethiopia.
Grazing Land Holetta Godino (Debre Zeit)
Batu Degaga and Donni
Mean
Elevation (m.s.l) 2100 2000 1400 - Annual rainfall (mm) 1200 800 730 - Mean min/max temp (o C) 3/23 8/25 10/35 - Dry season prevalence (%)
Irrigated land 64.5a 57.3 a 58.3 a 61.1
Non irrigated land 57.3 a 37.3 b 32.1 b 41.8 Total 62.3 47.9 46.9 53.6 Wet season prevalence (%)
Irrigated land 64.0 a 54.4 a 61.5 a 60.3
Non irrigated land 63.5 a 52.9 a 55.0 a 58.1 Total 63.7 53.8 58.4 59.2 Prevalence of parasites was significantly less (p>0.05) in the non-irrigated areas(a) in the dry season than in the wet season(b).
The prevalence of fasciolosis is economically important throughout the basin. It tends it be higher in irrigated than in non-irrigated areas, but the difference is greatest in the lower elevation areas that are hotter and drier. The data suggest that introducing irrigation into hot dry regions may encourage increased transmission of the parasite whereas in areas with higher moisture, fasciola may be a chronic problem with little impact arising irrigation.
4.61 Water related policy:
• Livestock drinking and irrigation. This case study specifically examines the issue of an economically important livestock disease, Fasciolosis, that is widespread through SSA and that can be aggravated in semi-arid areas through the introduction of irrigation systems. Livestock become infected when grazing near the edge of canals and reservoirs and when drinking from them. Farmers can benefit from healthier animals if irrigation system design provides alternative
444
watering troughs and feeding areas that are physically separated from the irrigation infrastructure.
4.62 Complementary livestock-related policy:
• Provision of veterinary services. While integrated livestock and water management may help reduce parasitic infection, farmers may gain increased profitability from the introduction of irrigation systems if they have access to veterinary health services that can increases individual animal productivity. In the case of Fasciolosis in Ethiopia, sheep can be treated for cost of about US$ 0.25 per year. When planning irrigation development and rehabilitation, policy should help enable provision of complementary animal health services. In addition, measures to reduce snail populations may be helpful.
4.63 Key findings:
• Fasciolosis is most common in highland humid areas but is of considerable importance wherever permanent surface water and irrigation co-exist with snail vectors and where sheep and probably other animals have exposure to them.
• The Fasciola parasite limits animal productivity, marketability and profitability. Other case studies report similar problems with this disease. Thus, to maximize livestock productivity balanced with crop production in irrigated areas requires either or both snail and vector control measures with the latter likely to help reduce human diseases such as schistosomiasis.
• Appropriate policies and strategies to complement irrigation development may include the following that can be applied individually or in combination:
- Strategic application of anthelmintics (a family of drugs for treating Fasciolosis) provides effective control of most trematode infections (Hansen and Perry, 1994).
- Reduction in the number of intermediate host snails by chemical or biological control as well by periodic drainage and cleaning of canals.
- Fencing, accompanied by provision of safe drinking water, grazing management (including zero grazing), and other management practice to keep animals away from habitat populated by snails.
H. Re-allocating water used for pastoralists’ wealth savings and reducing drought risk - the Borana Plateau, Ethiopia
4.64 Methodology and information sources: This case study builds on the work the USAID-funded project, Livestock Information Network & Knowledge System (LINKS) for Enhanced Pastoral Livelihoods in East Africa (http://glcrsp.ucdavis.edu/projects.htm). With the kind support of this project team, ILRI’s researchers analyzed project information from the perspective of understanding water livestock productivity of the Borana pastoral system.
4.65 The Borana Plateau: The Borana Plateau in southern Ethiopia is an important cattle-raising region occupying a total land area of 95,000 km2 and ranging from 1000 to 1600 m above sea level. The annual rainfall averages 700 mm (Coppock, 1994) giving a total of 66.5 billion m3 yr-1. Rain is the only significant source of water. The
445
dominant cattle breed in the area is the Boran, a hardy animal used for producing both milk and meat. The Borana pastoralists number about 325,000, or about 45,000 households, and herd over 1 million head of cattle along with some sheep, goats and camels (Desta, 2001).
Desta (2001) estimated that average household ownership of cattle dropped from 96 to 58 head from 1980 to 1997 respectively in the Borana Plateau. The decline in the number was due to the droughts of 1983-85 and in the early 1990s. This represents a 40% decline in a key indicator of Borana assets and a corresponding aggravation of poverty. On average, households sell or slaughter about 2 head of cattle per year, illustrating that drought-related mortality was the key factor regulating cattle numbers. To maintain household food security, consumption and sales, households require about 18 head of cattle. This includes six lactating cows (Cossins, 1983). Thus, about 80 % of the “good” or optimal year cattle population is kept for insurance and asset purposes, while in a drought year it would be 70%. Numbers kept in excess of drought period minima can be viewed as animals kept as a drought coping strategy. Desta (2001) points out that the monetary value of the death losses during the 17 years was estimated at US $ 6,500 per household and when extrapolated to the entire Borana Plateau the total loss may have exceeded US $300 million. Maintaining these extra animals aggravates water environmental degradation and water depletion.
THE HIGH COST OF WATER TO MAINTAIN WEALTH AND TO AVOID DROUGHT: LIVESTOCK REQUIRE MUCH WATER FOR FEED AND SOME FOR DRINKING. BORAN CATTLE NEED 5 KG OF DRY MATTER FEED FOR MAINTENANCE, PRODUCTION AND REPRODUCTION PER DAY. RESEARCH IN SOUTH AFRICA USING THE RAIN USE EFFICIENCY INDEX (RUE), BEING DEFINED AS THE PRODUCTION OF PLANT DRY MATTER (DM) IN RELATION TO RAINFALL AMOUNT, HAS SHOWN THAT THE BIOLOGICAL LIMIT SEEMS TO BE AROUND 3.33 KG OF DRY MATTER PER M3 OF RAINWATER, BUT THAT AN ACCEPTABLE AVERAGE VALUE FOR RANGELANDS IS 0.66 KG OF DRY MATTER PER M3 (PALMER, 2000). ON THE BORANA PLATEAU, AN ESTIMATED 11 BILLION M3 YR-1 OF WATER ARE REQUIRED TO SUPPORT 90 CATTLE THAT IS TYPICAL FOR HOUSEHOLD AT THE END OF A PERIOD OF GOOD YEARS (TABLE IV-5). IF PASTORALISTS REDUCED CATTLE NUMBERS BY 50 HEAD PER HOUSEHOLD AND ADOPTED AN ALTERNATIVE ASSET SAVINGS APPROACH SUCH AS A MONETARY SYSTEM, THEN THE AMOUNT OF WATER SAVED PER HOUSEHOLD WOULD BE 136,875 M3 OF WATER PER YEAR. THUS, THE AMOUNT SAVED IN THE WHOLE BORANA PLATEAU WOULD BE AS 6.1 BILLION M3 RESULTING IN A REDUCTION OF WATER USE FROM 11 TO 5 BILLION M3 YR-1.
THE BORANA EXAMPLE SHOWS THAT LIVESTOCK KEEPERS USE LARGE QUANTITIES OF WATER TO MAINTAIN THEIR WEALTH. SUCCESS IN REDUCING POVERTY WILL GENERATE MORE DEMAND OF ANIMALS AND HENCE FOR WATER. SOCIALLY ACCEPTABLE MEANS FOR DE-STOCKING WOULD GREATLY REDUCE WATER USE BY LIVESTOCK. WHILE MORE DETAILED STUDIES ARE NEEDED TO IDENTIFY MORE PRECISELY THE OPTIMAL, PRACTICAL AND SOCIALLY ACCEPTABLE HOUSEHOLD HERD SIZE, REALLOCATING 6.1 M3 OF WATER IN THE BORANA PLATEAU COULD GREATLY ENABLE IMPROVED

446
PRODUCTIVITY PER HEAD BY MAKING MORE RAINFED ANIMAL FEED AVAILABLE. THE WATER NOT USED BY LIVESTOCK COULD ALSO SUPPORT INCREASED PRODUCTION OF NATURAL VEGETATION, RESTORATION OF ECOSYSTEM SERVICES, GROUND WATER RECHARGE, AND ADOPTION OF ALTERNATE OR SUPPLEMENTARY LIVELIHOOD ENHANCING ACTIVITIES.
Table IV-5. Estimated rainwater required to produce feed+ for livestock in the Borana plateau.
Amount of depleted rain water (Billion m3 yr-1)
Cattle keeping scenarios* pastoral households
No. animals
per family
Livestock related beneficial outputs Total to
produce feed
For feed for assets
& to avoid risk
Potentially saved & available
for reallocation
Allow herd size to increase naturally in good years
90 • Milk and 2 head • Off-take: 2 per year • Asset accumulation • Drought risk
11.1 8.9 0
Maintain herd size at “natural” level less 50 head
40 • Milk and 2 head • Off-take: 2 per year • Asset accumulation • Min. drought risk
5.0 2.8 6.1
Keep minimum herd size needed for family needs
18 • Milk and 2 head • Off-take: 2 per year
2.2 0 8.9
+ Drinking water requirements are not shown in this table. Average total rainfall is 700 mm or 66.5 billion m3 yr- for the entire 95,000 km2.
Assumes 45,000 households; and each animal requiring 2,700 m3 yr-1; cattle feed consumption of 5kg day-1 and water productivity of feed at 0.66 kg m-3.
Of the water used by pastoral livestock, most is required to enable pastoralists to preserve their wealth and to cope with drought risk. The Borana people know that they must keep six animals to ensure that one survives. Following this strategy not only greatly increases the water requirements, but it also contributes to the depletion of feed reserves increasing the animal mortality when drought does arrives. Loss of vegetation also promotes evaporative depletion of scarce water. Clearly, a collective strategy to de-stock enables increase feed production and reduces risk of feed shortages, but action by individual families may have little or no effect.
4.66 Re-allocating water to combat desertification. Evidence (Scheffer et al. 2001) from analyses of diverse ecosystems indicates that “restoring a desired ecological state may require drastic and expensive intervention”. In desertified rangelands, normal plant-soil interactions that maintain vegetation cover have been lost along with the capacity of the vegetation soil-complex to absorb precipitation and make it available for uptake by plants. Past management has led to a collapse of the productive capacity of rangelands. De-stocking through adoption of alternative wealth savings and drought risk avoidance strategies may provide an feasible opportunity reverse the Sub-Saharan Africa-wide scourge of desertification in arid and semi-arid regions by helping to restore ecosystem stability and resilience.

447
4.67 Water related Policy:
• Planning for livestock in irrigation systems. This case study does not directly address irrigation. However, in times of drought and during dry seasons, pastoralists often deplete feed reserves and move their livestock to traditional dry season grazing reserves. Their need to move often follows a period in which herd sizes increased as they built up their wealth assets. Many dry season grazing reserves have been occupied by either rainfed crop production or by the introduction of irrigated production. When pastoralists meet crop farmers, conflict often arises. To reduce such conflict, irrigation development may need to either provide required water and feed for pastoralists or to invest in institutions such as alternative wealth savings programs that can decrease pastoralists’ need to access the feed and water in irrigation areas.
• Water management in pastoral areas. De-stocking has the potential to reduce overall feed consumption while increasing feed available to individual animals. One consequence of this is increased productivity per animal. Another consequence is that reduced grazing pressure enable restoration of vegetative ground cover that may lead to sequestration of Carbon, increased infiltration, reduced run-off and increased wild biodiversity among other ecosystem services. Effective management of water in rainfed pastoral lands requires community-based approaches to allocating common property resources. Encouraging such behaviour requires enabling policy.
4.68 Complementary livestock policy: In pastoral areas much of the water used by livestock can be attributed to household strategies to preserve wealth and avoid drought. De-stocking to levels sufficient to maintain household requirements for milk, meat and sales of a few animals per year would reduce pastoralists needs to migrate to find water and feed and could reduce conflict with irrigation farmers. Innovative institutional support for alternative strategies to secure and maintain household wealth and collective action to limit herd sizes could take great pressure off water and feed resources in and around irrigation systems.
4.69 Key findings:
• A critical examination of pastoralists’ livestock keeping practices suggests that large amounts of rainwater are used to maintain wealth assets and to help cope with drought. Because of lack of a community-based approach to drought coping, families’ practice of allowing herd sizes to increase during good years aggravates rather than helps mitigate the drought related hardship and animal loss.
• Transpired water depleted to produce the cattle feed for animals kept for wealth savings and drought risk avoidance amounts to at least 1 billion m3 per year. This is equivalent to the storage capacity of about 1000 micro-dams described in the case study on water harvesting in Tigray.
• Collectively, water depleted through transpiration, evaporation and run-off amounts to at least 6 billion m3 per year or the equivalent to the storage capacity of about 6000 micro-dams described in the case study on water harvesting in Tigray.
• Extrapolating water costs for wealth savings and drought risk avoidance to all pastoral areas as well as agro-pastoral areas in Africa reveals current water use of tens of billions of m3 per year.
448
• Opportunities may exist to implement an effective demand-side approach to water management in pastoral areas by investing in the development of collaborative, participatory, effective, and socially acceptable institutions that can provide alternatives to wealth savings and drought risk avoidance. While actual investment costs have not been estimated, we hypothesize that they will be much less than investing in physical infrastructure to store an equivalent amount of water.
• While water saved through alternative approaches to wealth savings and drought risk avoidance might not easily be used to increase agricultural production, this strategy may provide real opportunities to restore the health and resilience of pastoral ecosystems.

449
G. INVESTING IN DROUGHT MITIGATION FOR PASTORALIST LIVESTOCK KEEPING, ETHIOPIA
4.70 Methodology and information sources: In 2004, ILRI joined a consortium (Livestock
Working Group or LWG) working in Ethiopia to assess how long-term solutions to the problem chronic and recurrent drought related losses experienced in the pastoral areas of Ethiopia. As part of this process, a major report FAO (2003) with recommendations was prepared, and information from this process was the primary input to this case study along with years of ILRI’s in-house experience.
4.71 Climatic variability in semi-arid Ethiopia and loss of livestock. Semi-arid lands occupy 60 % of Ethiopia where recurrent drought and acute shortages of livestock feed and water are common. Recent major droughts occurred in 1974, 1984, 1992 and 2002. In total, about 1.38 million cattle, sheep, camel, goats and donkeys (Table IV-7) valued at 160 million USA dollars were lost in these four drought years (FAO). Warning signals frequently arrived following considerable livestock losses and the responses were too late and often inappropriate. Although livestock are the most important asset for pastoralists and play considerable role in food production in the highland the existing, early warning systems (EWS) focus mainly on crop production and food aid. Though droughts cannot be avoided, improving the efficiency and cost effectiveness of emergency interventions can minimize their impact on livestock and pastoralists’ and farmers’ livelihoods. Timely intervention is also crucial during a drought (LWG, 2004 – referencing the FAO 2003 workshop on Livestock emergency interventions in Ethiopia).
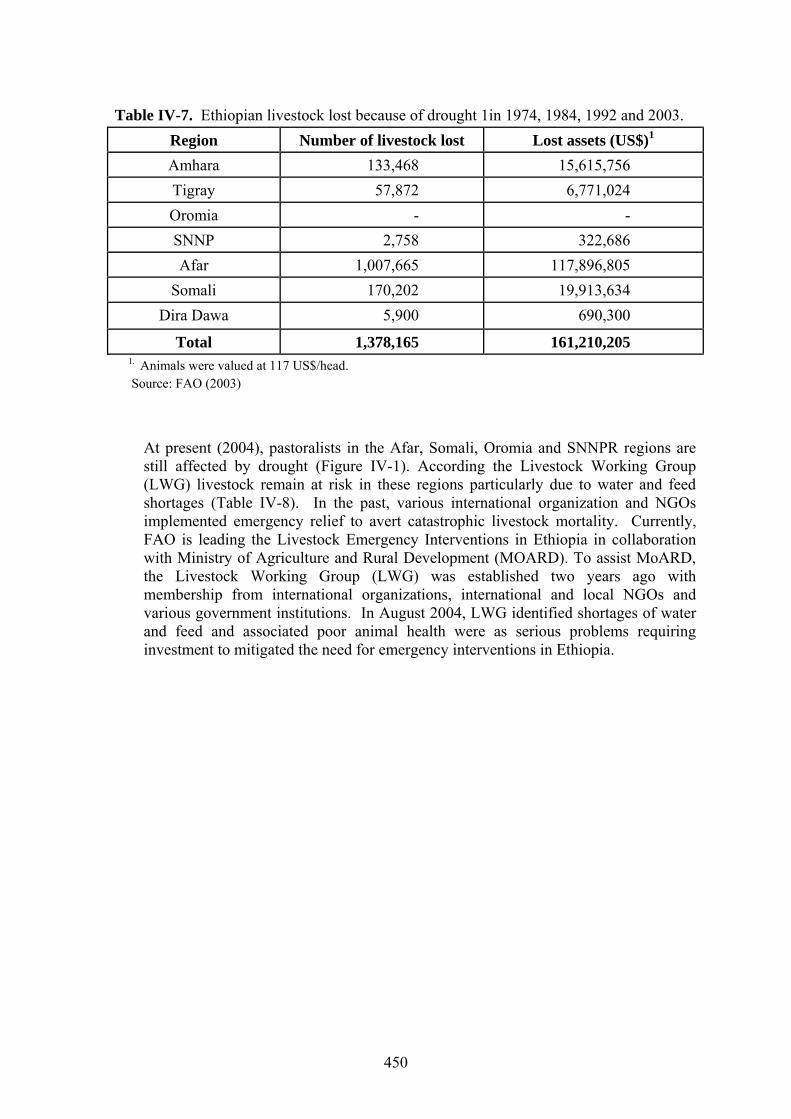
450
Table IV-7. Ethiopian livestock lost because of drought 1in 1974, 1984, 1992 and 2003. Region Number of livestock lost Lost assets (US$)1 Amhara 133,468 15,615,756 Tigray 57,872 6,771,024 Oromia - - SNNP 2,758 322,686 Afar 1,007,665 117,896,805
Somali 170,202 19,913,634 Dira Dawa 5,900 690,300
Total 1,378,165 161,210,205 1. Animals were valued at 117 US$/head. Source: FAO (2003)
At present (2004), pastoralists in the Afar, Somali, Oromia and SNNPR regions are still affected by drought (Figure IV-1). According the Livestock Working Group (LWG) livestock remain at risk in these regions particularly due to water and feed shortages (Table IV-8). In the past, various international organization and NGOs implemented emergency relief to avert catastrophic livestock mortality. Currently, FAO is leading the Livestock Emergency Interventions in Ethiopia in collaboration with Ministry of Agriculture and Rural Development (MOARD). To assist MoARD, the Livestock Working Group (LWG) was established two years ago with membership from international organizations, international and local NGOs and various government institutions. In August 2004, LWG identified shortages of water and feed and associated poor animal health were as serious problems requiring investment to mitigated the need for emergency interventions in Ethiopia.
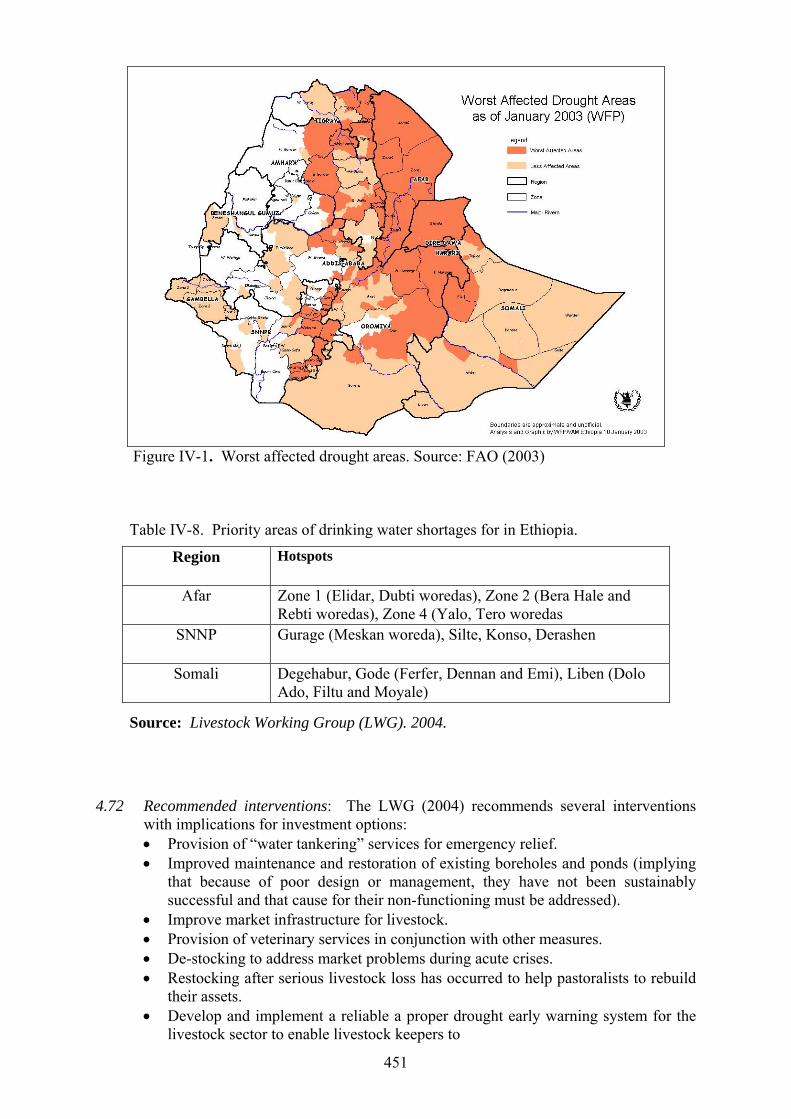
451
Figure IV-1. Worst affected drought areas. Source: FAO (2003)
Table IV-8. Priority areas of drinking water shortages for in Ethiopia.
Region Hotspots
Afar Zone 1 (Elidar, Dubti woredas), Zone 2 (Bera Hale and Rebti woredas), Zone 4 (Yalo, Tero woredas
SNNP Gurage (Meskan woreda), Silte, Konso, Derashen
Somali Degehabur, Gode (Ferfer, Dennan and Emi), Liben (Dolo Ado, Filtu and Moyale)
Source: Livestock Working Group (LWG). 2004.
4.72 Recommended interventions: The LWG (2004) recommends several interventions
with implications for investment options: • Provision of “water tankering” services for emergency relief. • Improved maintenance and restoration of existing boreholes and ponds (implying
that because of poor design or management, they have not been sustainably successful and that cause for their non-functioning must be addressed).
• Improve market infrastructure for livestock. • Provision of veterinary services in conjunction with other measures. • De-stocking to address market problems during acute crises. • Restocking after serious livestock loss has occurred to help pastoralists to rebuild
their assets. • Develop and implement a reliable a proper drought early warning system for the
livestock sector to enable livestock keepers to

452
• Capacity building to enable pastoralist to maintain watering facilities. 4.73 Water related policy:
Livestock and investments in agricultural water. In drought prone pastoral areas, investments in ponds and boreholes to provide drinking water for people and livestock are viewed as a better approach to long-term mitigation of water scarcity than the emergency aid approach of delivering water in tankers. Such ponds may also provide opportunities for limited irrigated feed and food crop production. Agricultural water reservoirs and supply systems in areas that are dominated by livestock production are susceptible to many of the constraints faced by farmers who adopt irrigation elsewhere. There is great need for investment strategies that improve design, prevent sedimentation and contamination of water supplies, control water-borne animal and human diseases, and increase collective management capacity of the water resources.
4.74 Complementary livestock policy:
• De-stocking and marketing. This case study confirms that in many of the pastoral lands, animal populations increase to levels that are unsustainable during times of inevitable drought. In the most severely affected areas, tankering water to thirsty livestock is a common relief measure. FAO and others now strongly advocate for de-stocking herds to levels that can be maintained during drought and that provide sufficient production to meet household demands for meet and milk and to satisfy the established market demand for animals and animal products. There is a related need for drought early warning systems and market price information to provide more opportunities for pastoralists to sell animals before they have lost so much weight that they no longer have market value. Some policy-makers suggest providing support to pastoralists to restock after devastating droughts. However, others caution that this will discourage livestock keeping communities from restraining growth in herds sizes during good years and aggravate subsequent losses when drought comes.
• Provision of veterinary services. This case study confirms views from others that provision of animal health services is a vital complementary policy to improve animal productivity particularly when animals are kept in or near water resources.
4.75 Key findings:
• The LWG’s recommendations appear to take a very traditional approach of encouraging re-stocking in good years and de-stocking in or immediately prior to drought years (See previous Borana Case Study), but increasingly it endorses FAO’s suggested strategy of shifting from continued emergency relieve to long-term sustainable measures. This will require investments in water harvesting and development of ground water for livestock drinking in areas where irrigation will not be practiced or will have minimal potential. These investments will target some of the poorest people in Africa but not emphasize short term market development.
• Investments in agricultural water to support the livestock sector in pastoral areas are particularly needed to cope with recurrent drought. These need to balance supply-side investment to provide more and better access to water with demand-side investments to limit animal production and promote marketing of live animals and livestock products.
453
H. DRINKING WATER SUPPLY FOR DAIRY PRODUCTION, KENYA
4.76 Methodology and information sources: Over the past eight years, ILRI has worked closely with a broad range of stakeholders to understand how Kenya’s notable dairy sector developed and to come up with policy, technology and practices to improve its impact on poverty reduction. This project included a survey of 2000 smallholder farmers in 16 districts of the country. Although information on water sources for livestock had been collected, the data were never analysed – an indication of how, in the past, livestock and water researchers have not given much consideration to the importance of livestock-water interactions. The information presented here resulted from the new analyses and was interpreted in the context of ILRI extensive knowledge of smallholder dairying in Kenya.
4.77 Dairy production in Kenya: “Dairy production in Kenya has grown 2.8 percent per year over the past two decades … and by the year 2000 nearly 70 percent of Kenyan smallholders produced milk ... to become their fastest growing income source” (Ngigi, 2004). Six hundred thousand smallholders produce 80% of the country’s milk. Dairy production is a complex but profitable means to help poor farmers climb out of poverty. Successful smallholder dairying requires many forms of inputs that may include improved breeds, readily available veterinary services, policy permitting sale of raw milk, promotion of market access including reducing travel time to points of sale and improving herd productivity through provision of feed and breeding.
4.78 Drinking water for dairying: Muli (2000) demonstrated (Table IV-9) that inadequate provision of drinking water greatly constrained milk production of cows in Kiambu District, Kenya. Labour costs of collecting water may be the causal factor. Farmers with on-farm water supply realized about 60% more milk production per cow than those that did not have it. Farms located less than 200 m from water realized 60% greater production per cow than those more than one km away.
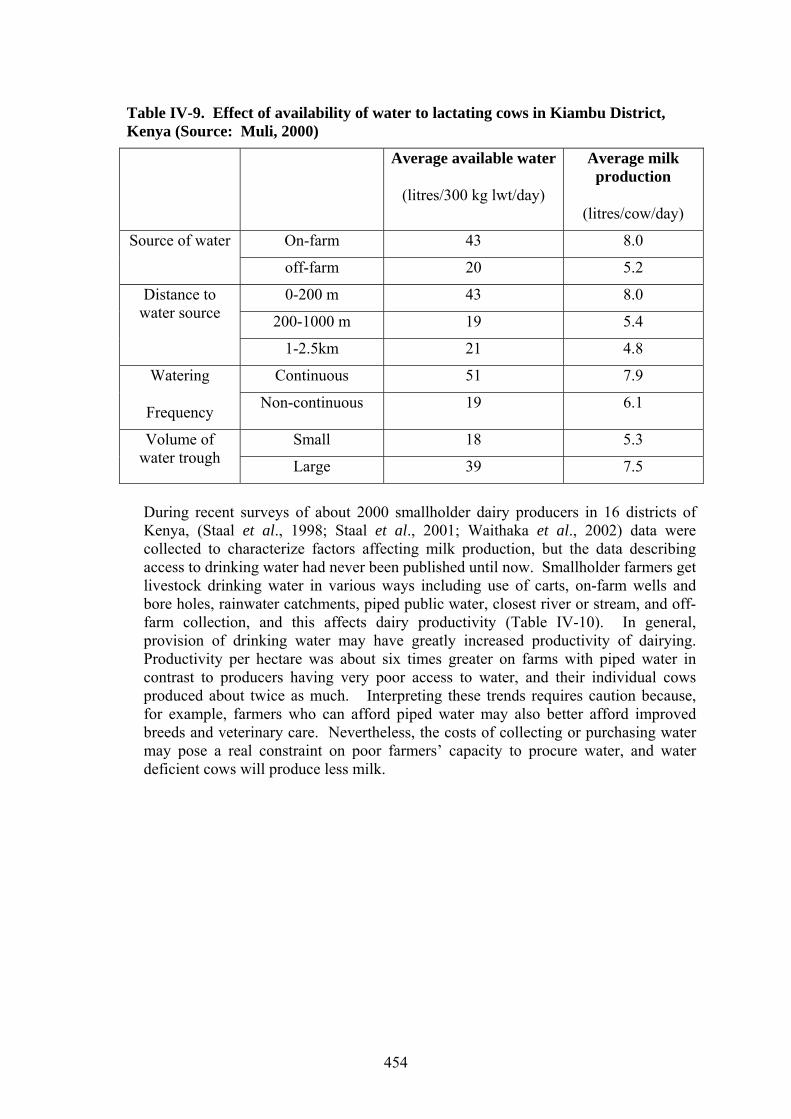
454
Table IV-9. Effect of availability of water to lactating cows in Kiambu District, Kenya (Source: Muli, 2000)
Average available water
(litres/300 kg lwt/day)
Average milk production
(litres/cow/day)
On-farm 43 8.0 Source of water
off-farm 20 5.2
0-200 m 43 8.0
200-1000 m 19 5.4
Distance to water source
1-2.5km 21 4.8
Continuous 51 7.9 Watering
Frequency Non-continuous 19 6.1
Small 18 5.3 Volume of water trough Large 39 7.5
During recent surveys of about 2000 smallholder dairy producers in 16 districts of Kenya, (Staal et al., 1998; Staal et al., 2001; Waithaka et al., 2002) data were collected to characterize factors affecting milk production, but the data describing access to drinking water had never been published until now. Smallholder farmers get livestock drinking water in various ways including use of carts, on-farm wells and bore holes, rainwater catchments, piped public water, closest river or stream, and off-farm collection, and this affects dairy productivity (Table IV-10). In general, provision of drinking water may have greatly increased productivity of dairying. Productivity per hectare was about six times greater on farms with piped water in contrast to producers having very poor access to water, and their individual cows produced about twice as much. Interpreting these trends requires caution because, for example, farmers who can afford piped water may also better afford improved breeds and veterinary care. Nevertheless, the costs of collecting or purchasing water may pose a real constraint on poor farmers’ capacity to procure water, and water deficient cows will produce less milk.
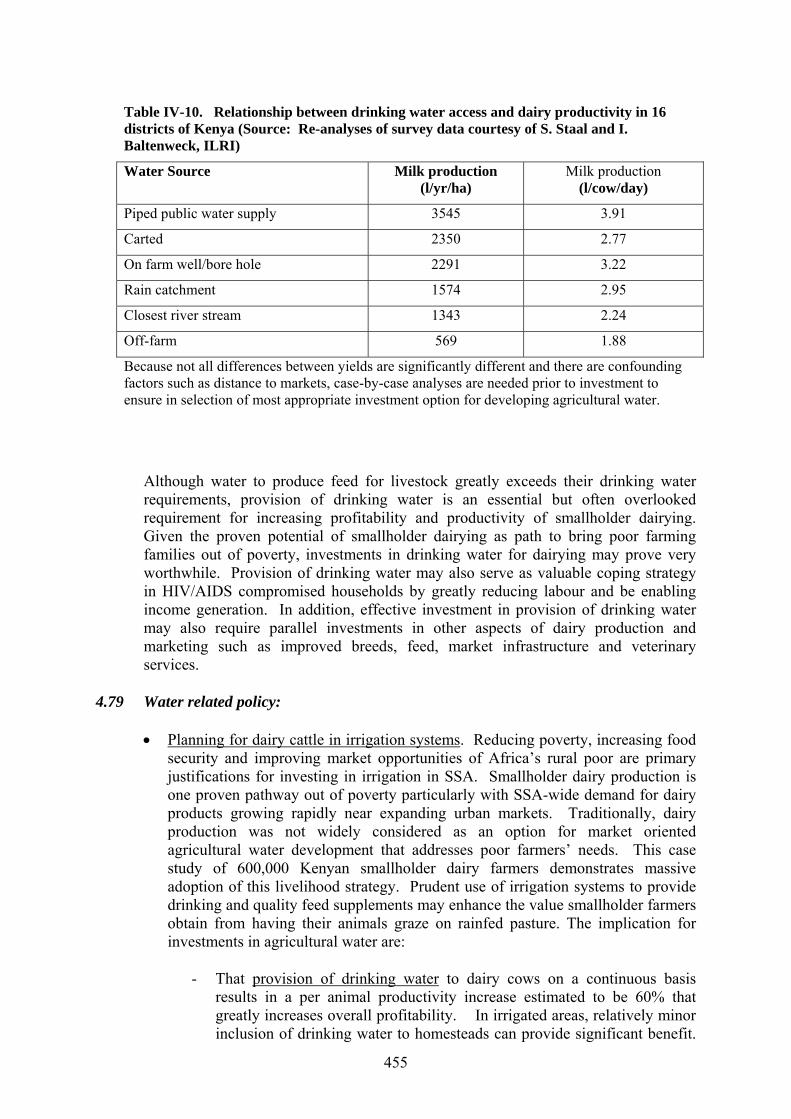
455
Table IV-10. Relationship between drinking water access and dairy productivity in 16 districts of Kenya (Source: Re-analyses of survey data courtesy of S. Staal and I. Baltenweck, ILRI)
Water Source Milk production (l/yr/ha)
Milk production (l/cow/day)
Piped public water supply 3545 3.91
Carted 2350 2.77
On farm well/bore hole 2291 3.22
Rain catchment 1574 2.95
Closest river stream 1343 2.24
Off-farm 569 1.88
Because not all differences between yields are significantly different and there are confounding factors such as distance to markets, case-by-case analyses are needed prior to investment to ensure in selection of most appropriate investment option for developing agricultural water.
Although water to produce feed for livestock greatly exceeds their drinking water requirements, provision of drinking water is an essential but often overlooked requirement for increasing profitability and productivity of smallholder dairying. Given the proven potential of smallholder dairying as path to bring poor farming families out of poverty, investments in drinking water for dairying may prove very worthwhile. Provision of drinking water may also serve as valuable coping strategy in HIV/AIDS compromised households by greatly reducing labour and be enabling income generation. In addition, effective investment in provision of drinking water may also require parallel investments in other aspects of dairy production and marketing such as improved breeds, feed, market infrastructure and veterinary services.
4.79 Water related policy:
• Planning for dairy cattle in irrigation systems. Reducing poverty, increasing food security and improving market opportunities of Africa’s rural poor are primary justifications for investing in irrigation in SSA. Smallholder dairy production is one proven pathway out of poverty particularly with SSA-wide demand for dairy products growing rapidly near expanding urban markets. Traditionally, dairy production was not widely considered as an option for market oriented agricultural water development that addresses poor farmers’ needs. This case study of 600,000 Kenyan smallholder dairy farmers demonstrates massive adoption of this livelihood strategy. Prudent use of irrigation systems to provide drinking and quality feed supplements may enhance the value smallholder farmers obtain from having their animals graze on rainfed pasture. The implication for investments in agricultural water are:
- That provision of drinking water to dairy cows on a continuous basis results in a per animal productivity increase estimated to be 60% that greatly increases overall profitability. In irrigated areas, relatively minor inclusion of drinking water to homesteads can provide significant benefit.
456
Provision of drinking water supplied from irrigation infrastructure to nearby non-irrigators can also generate addition milk production beyond irrigation scheme boundaries. This is particularly beneficial if these livestock keepers generate income as labourers within the irrigation schemes and elsewhere because they procure discretionary income to purchase animal feed rather than growing it.
- That irrigation systems can help provide animal feed to support smallholder dairying, but the choice must be made in seeking an optimal balance in the use of irrigated fodder crops, crop residues from both rainfed and irrigated farmers’ fields, and rainfed feed from grazing land.
4.80 Complementary livestock policy: A positive upward cycle of prosperity revolving around smallholder dairy production is based on more than provision of agricultural water. Complementary policy is needed to ensure provision of animal health services to maintain both productivity of animals and high quality milk production. Policy can also enhance benefits dairy producers receive from:
• Availability of credit often secured by having tenured land accepted as collateral,
• Effective extension services,
• Market access including proximity to markets, membership in dairy cooperatives and access to milk collection points,
• Off-farm income often associated with proximity to urban areas that can be used to purchase farm inputs including development of drinking water, veterinary services and supplemental feed. In other studies, livestock keepers have shown willingness to invest in their animals, and investment banks can support appropriate lending mechanisms.
4.81 Key findings:
• Year-round and over large areas of Kenya, drinking water for livestock is available, but the labour and time required to collected and carry it to their dairy cows discourages farmers from making it continuously available to their animals. Taking them to water sources also requires labour, diverts animal’s energy from production to walking, may expose animals to heat stress and does not permit continuous access for drinking.
• Restricting availability of drinking water has been shown to reduce milk production per animal even when all other conditions for good production have been met.
• With increased use of zero grazing for dairy production, large increases in milk production per animal for smallholder farmers are possible through provision of piped water.
• In areas of Sub-Saharan Africa where there is a growing market demand for dairy products, integration of drinking water supply for livestock with provision for other domestic purposes can greatly increase income for poor smallholder farmers. In Kenya, many heads of household are women, and typically, labour supply is a major constraint to improving agricultural production and livelihoods. Provision of piped drinking water for market-oriented dairy smallholder dairy production may be a good gendered strategy for reducing poverty.
I. WATER HARVESTING AND LIVESTOCK IN TIGRAY, ETHIOPIA

457
4.82 Methodology and information sources: Micro dams in Tigray were studied over the
past two year by ILRI under the Comprehensive Assessment of Agricultural Management in Agriculture an in partnership with Mekele University, Addis Ababa University, and the Ethiopian Agricultural Research Organization (EARO). This case study set out to assess the impact of community based irrigation on livestock keeping and production while addressing a number of other more traditional irrigation management issues. The following points draw heavily on this research that includes the thesis by Darout (2004). In addition, ILRI team members spent three days in August 2004 in detailed discussion with the Tigray Water Resources Development Bureau on the history, purpose and current management problems associated with the development and maintenance of micro dams in Tigray. We also met with and are grateful for the great help provided by the Water harvesting and Institutional Strengthening in Tigray (WHIST) project described below. Attempts to meet with Tigray Bureau of Agriculture failed. Some of the following information also came from these contacts and additional publications and grey literature.
4.83 Water harvesting experience in Tigray: In Tigray, surface irrigation includes spring development, river diversion, flood spreading, micro-dams and pond systems. Some evidence dating back to 500 BC shows that irrigation was practiced in the ancient village of Yeha in Adwa. However, the majority of investments in harvesting water and irrigation were made since 1991 (Girmay et al., 2000). Irrigated agriculture in the region consists of about river diversions, flood diversion and spreading, and micro-dams that support 4500, 5000 and 2018 ha of intensive cropping respectively.
4.84 Tigray developed a comprehensive rural development programme in 1994 with water harvesting given high priority. Plans were made to construct 500 earthen micro-dams (with storage capacities ranging from 50,000 to 2,000,000 m3) over 10 years to supply 200 thousand tonnes of grain to feed 930 thousand people (Mintesinot and Mitiku, 2003). The region established a commission, Sustainable Agriculture and Environmental Rehabilitation of Tigray (SAERT), mandated to increase crop production through construction of micro-dams and irrigation infrastructure. Lack of suitable sites for dams and resource constraints forced cutbacks, and only about 50 micro-dams and 11 diversions were constructed that now provide about 2000 ha of irrigated land (Fitsum et al., 1999). Of these fifty, many failed or suffered serious design and management problems.
4.85 Because of less than satisfactory success with micro-dams, SAERT recently adopted a strategy of "area based development", which focuses on whatever opportunities for exploiting water resources may exist—whether it be through dams, ponds, river diversions, wells, or other water harvesting structures—rather than focusing only on construction of micro-dams as originally envisioned (Fitsum et al., 1999). Consequently, SAERT constructed about 50,000 ponds in 22 food insecure woredas (local government jurisdictions) (Landell Mills, 2003) with financial support and expertise from the European Union, the Canadian funded Water Harvesting and Institutional Strengthening in Tigray (WHIST) project, NGOs and others.
4.86 WHIST is a six-year capacity building project funded by the Canadian International Development Agency (CIDA) and Agriculture and Agri-food Canada, and the Prairie Farm Rehabilitation Agency (PFRA, 2001) manages it CIDA. WHIST’s mandate is to increase water harvesting and the use of water for food production through strengthening the technical and management expertise of the Tigray Water Resources Development Bureau (TWRDB) and of the Bureau of Agriculture (BOA). To accomplish its task, WHIST is using a mentoring program that uses Canadian engineering and agronomy experts to build the capacity of TWRDB and BOA staff so that these two government agencies will be capable of moving the region towards food self sufficiency through new irrigation infrastructure development, improved

458
irrigated agricultural practices and better soil and water management (http://www.agr.gc.ca/pfra/international_e.htm). A key component of the WHIST project has been the introduction of materials analyses labs and appropriate engineering skills to ensure that micro dams are build on a solid footing to avoid previously problematic dam failure.
4.87 General lessons and challenges from water harvesting efforts in Tigray: This case study from Tigray revealed many issues of relevance to future investments in new micro-dams for agricultural water for rehabilitating existing ones:
• A typical micro dam consists of a reservoir with a storage capacity of about one million m3, a catchment area of about 10 km2 and a command area of about 100 ha. Generally, people and animals were excluded from catchment, and some households lost access to traditional cropland and pasture. It is not clear to what extent people’s losses were compensated through access to the command areas. After a period of exclusion, the vegetation cover is increasing in the catchments. There may now be an opportunity for controlled use of the catchment to produce animal feed and firewood.
• High valued crop production such as onion was the government’s priority in planning micro-dam construction, but many farmers preferred low valued maize because the crop residue provided highly needed animal feed. They often preferred crop options that carried less risk than ones requiring them take loans for purchase of agricultural inputs particularly if farmers anticipated difficulty in re-paying them.
• Most dams were constructed without prior rehabilitation of the catchments. Consequently, up-slope erosion contributed to increased sedimentation and reduced storage capacity of the reservoirs (Mintesinot and Mitiku, 2003). Soil salinity in command areas also increased.
• Apart from conflicts with grazing animals, disputes over allocation of water to plots within the command areas were common suggesting the need for better community-based institutions such as water users associations. Kamara and McCornick (2002) confirmed this view in a separate study.
• Female-headed households experienced significant labour shortages that constrained agricultural production.
• In the past, the Tigray Water Resources Development Bureau (TWRDB) planned and developed the micro-dams, but it had no major role in managing them. The Tigray Bureau of agriculture assumed management responsibility even though it had little input into design. Some environmentalists became frustrated because environmental impact assessment (EIA) recommendations were ignored. Although the EIA conducted assessments in the communities, the development process did not readily allow for consultation with the community about the purpose, design and management of the micro dams. A number of government, investor and project personnel recommended the need to improve communication and coordination among institutional stakeholders.
• Inadequate engineering resulted in failure of some dams and motivated the Ethiopian government to launch the previously mentioned WHIST project. WHIST established a new soils and materials testing laboratory with appropriate capacity building to ensure quality construction of future dams.
• Regional government priorities in water resource development have changed every two or three years. In the mid 90s, the priority was to build about 500 micro dams of about one million m3, but only 50 were built including some river

459
diversion schemes. Because of perceived failure, the priority shifted to small household pond and then shifted again to construction of “hand-dug well”. In the last year, the priority shifted back to micro dams because of concern that wells appear to deplete ground water. The TWRDB strives to build up human resource capacity to plan and develop water-harvesting systems in Tigray, but it reports that by the time skilled staff is in place, new skill are needed to meet the demands of a new water development priority.
• Malaria poses serious risk near micro-dams constructed at altitudes less than 2000 m.s.l., and lost labour constrains household livelihoods (Darout, 2004). Tedros et al. (1999) reported that the incidence of schistosomiasis increased to 39% for children and 48% for adults.
• Pender et al. (2000) indicated that returns on investment in micro-dams have been low and that several constraints limit dam success: - Construction costs were high, but often un-quantified. - Food for work programs put untrained people into constructing dams on an
unstable foundation leading to failure (Now being corrected by WHIST). - Inadequate extension services remain weak. - Poor marketing skills and lack of credit. - Conflicting goals of stakeholders. - Siltation of dams was common. - Increased salinity and soil infertility.
4.88 Water related policy:
• Planning for livestock in irrigation systems. Livestock are very important to households and communities that have received investments in agricultural water. In this case study, with very few exceptions, planning for livestock keeping in and around micro-dam based irrigation systems was largely lacking. Wilson (2002) noted that 70% of the cattle in Tigray are oxen kept for ploughing, and farmers use water and feed produced in these irrigation systems to help maintain them. However, dam design and associated agricultural policy has not provided for either feed production or drinking water. The potential benefit of producing animal products has been largely over looked in water harvesting development.
Some environmental impact assessments did estimate the drinking water requirements of livestock present in the communities before construction started, but this did not lead to providing drinking troughs, meeting demands for animal feed, or considering dairy production as a high valued output along with ubiquitously recommended onions and tomatoes. Because the newly developed irrigations systems were constructed near to some pastoral and grazing lands, the reservoir also became a point of attraction for livestock keepers who were not part of the targeted beneficiary group. As seen in other case studies, there is need for irrigation development policy that takes into account the reality that domestic animals are present, have multiple roles in the community, and will use and affect water resources whether planned for or not. One practical approach may be the development of a formalized process of including a livestock impact assessment in the planning phase of irrigation development. This assessment could:
- Identify pre-existing livestock populations and the service and productive roles that each plays within the local community.
- Assess the potential for conflict with pastoralists whose seasonally variable water and feed requirements may be affected by irrigation development.
460
- Project the opportunities for investments in irrigation to enable farmers to reduce poverty increase through animal production involving both household consumption and marketing of highly nutritious and valued animal products.
- Recommend irrigation designs that can provide safe drinking water to animals, produce feed for them from both the command and catchment areas and minimize animals impact arising from degradation and contamination of water resources and the catchment area that feeds water into the reservoirs.
- Recommend complementary policies, strategies and technologies to enhance the value of livestock production and keeping in and around micro-dams.
• Livestock drinking and irrigation. At the regional level, personnel responsible for investing in micro-dams understand that provision of drinking water facilities for livestock is not allowed or does not qualify for investors’ support. Consequently, animals simply enter the reservoir and canals and drink from them. Water development and rehabilitation policy could easily incorporate strategically placed watering points for livestock that reduce contamination and degradation of the water resources rendering it less useful to other users. Providing drinking troughs probably must include fences to restrict animal access to the community reservoir in order to reduce contamination and degradation of the water supply.
• Livestock health and irrigation. As seen in other case studies, Fasciolosis and other water borne animal and zoonotic diseases can increase with the introduction of irrigation particularly in arid and semi-arid areas such as Tigray. Complementary policy in support of measures to break cycles of parasite transmission or to provide veterinary services may be needed to promote human health and to increase animal productivity. This may involve inclusion of drinking troughs physically separated from the reservoir and creation of buffer exclusion zones around the micro-dams and reservoirs to prevent contamination and siltation.
4.89 Complementary livestock related policy:
• Land tenure: While land tenure has been improved by issuance of certificates to farmers, fears remain that land can be confiscated if farmers do not strictly follow official technology packages that dictate what crops can be grown. Consideration is needed to balance the wisdom and experience that packages explicitly offer with the need to encourage creative innovative entrepreneurial effort by individual farmers and communities.
• INRM and CBNRM: Water harvesting cannot be separated from management of the land from which water is harvested. Livestock keeping is a traditional part of catchment areas, and integrating livestock management with water resources management is essential. Inter-institutional collaboration is needed bring about coherent and sustainable agricultural development including integrated natural resources management (INRM) and community-based natural resources management (CBNRM) that balances the importance of top-down policy and provision of expertise with local knowledge, values and livelihood objectives and with promotion of equitable sharing of benefits and costs associated with use of water, livestock and other resources. Many of the most critical INRM issues require community-based management and institutions that can promote the collective common good while equitably allocating land and water resources to individuals. This requires enabling regional and national policy that has often been lacking. Lack of skills for implementing community-based natural resources management is widespread policy and investment in capacity building to correct this is warranted.
461
• Fish: An overlooked potential to improve return on investments is fish farming. A separate study is needed to evaluate this opportunity.
4.90 Key findings:
• Water harvesting is and will continue to be a priority in Tigray and other water stressed areas of Ethiopia and SSA.
• Planning, development and management must recognize that whether planned or not, livestock will be kept in and around community based irrigation infrastructure and that including them in the planning process can increase potential returns on investment and help ensure the sustainability of water harvesting and safeguard human and animal health. Apart from animal production, oxen remain critical for crop production, and planning must take into account their need for water and feed that depends greatly on water for its production.
• Major improvements to the planning, development and management of water harvesting systems are needed but the government with support from investors and implementing institutions are making progress in various areas. These include better engineering and planning including spatial analyses to identify optimal locations, hydrological sustainability and market opportunities. To date, however, this effort has not yet given serious consideration to integrating the needs of the livestock sector.
• One of the a major constraints to effective use of micro dams is the lack of community based institutions that enable collective action on common issues such as allocation of water and keeping livestock out of community water supplies. The challenge is to empower communities to take greater responsibility for managing not only the allocation of water to the command areas serviced by micro dams, but also to the safeguarding of the quality of the communities’ drinking water and the management of the catchment areas feeding into the dams.
462
J. REFERENCES: Asrat M. 2004. Infection prevalence of ovine fasciolosis in irrigation scheme along the Awash River basin and strategic anthelmentic treatment trial in a selected area in the upper stream. MSc Thesis submitted to Addis Ababa University.
Astatke A, Jabbar M, and Tanner D. 2003. Participatory conservation tillage research, an experience with minimum tillage on an Ethiopian highland Vertisol. Agriculture, Ecosystem and Environment 95: 401-415.
Berhe K. 2004. Land use and land cover changes in the central highlands of Ethiopia: The case of Yerer Mountain and its surroundings. MSc Thesis, Addis Ababa University.
Brook L. 1983. The seasonal occurrence of Fasciolosis and some other Helmentic disease of sheep in four-selected site of Ethiopia. M.Sc. thesis. AAU, Addis Ababa.
Central Statistical Authority (CSA). 1997. Agricultural sample survey of Ethiopia. Statistical Bulletin No. 171. Federal Democratic Republic of Ethiopia. Addis Ababa.
Coppock L. 1994. The Borana Plateau of Southern Ethiopia: synthesis of pastoral research, development and change, 1980-1991. ILCA, Addis Ababa, Ethiopia.
Cossins N. 1983. Production strategies and pastoral man (Online). [Accessed on 19-07-2004]. Available from http://www.fao.org/wairdocs;ilri/x5542b/x5542b0d.htm.
Darout G. 2004. The socio-cultural aspect of irrigation management: the case of two community-based small-scale irrigation schemes in the upper Tekeze Basin. MSc thesis, Addis Ababa University. 162 pp
Delgado C, Rosegrant M, Steinfeld H, Ehui S, and Courbois C. 1999. Livestock to 2020: The Next Food Revolution. Food, Agriculture, and the Environment Discussion Paper 28. IFPRI/FAO/ILRI (International Food Policy Research Institute/Food and Agriculture Organization/International Livestock Research Institute), Washington, DC.
Desta S. 2001. Cattle population dynamics in the southern Ethiopia rangelands. Global Livestock Collaborative Research Support Program, Univ. California-Davis. Research Brief 01-02-PARIMA.
DEVCO. 1984. Irrigation in Sudan since independence. Geogr. Rev. 74(2):127-144.
Ethiopian Valleys Development Studies Authority (EVDSA). 1989. Master plan for the development of surface water resources in the Awash Basin – Final Report. Addis Ababa.
Eyasu E. 2003. Case Studies - Genetic Diversity, Coffee and Soil Erosion in Ethiopia, Proceeding of the Roles of Agriculture Project International Conference (20-22 October 2003, Rome, Italy)
Fadlalla B. 1987. The dry Season Nutritional Status of Transhumanant Baggara Sheep, Sudan. Proc. International Conference on Animal Production in Arid Zones (ICAPAZ), Damascus, Syria, 7-12 September (1985). Part II, pp.834-844, organized by ACSAD and AOAD.
Fadlalla B. 2001. Agro-ecological Zonation of the Gezira Scheme. Animal Production study. Draft Report submitted to FAO (TCP/SUD/0065). Faki H, Mahgoub E, and Ismail M. 1993. Areas of development and investment in animal production in the Gezira Scheme. Paper presented in a workshop on current and future prospects of animal production in the Gezira within the National Comprehensive Strategy of Sudan, 19-20 July 1993, Barakat.
463
Fitsum H, Pender J, and Nega G. 1999. Land degradation in the Highlands of Tigray and Strategies for Sustainable Land Management in Jabbar M. (ed.). 1999. Livestock Policy Analysis Project, International Livestock Research Institute, Addis Ababa, Ethiopia. Socio-economic and Policy Research Working Paper 25
Food and Agricultural Organization (FAO). 2003. Livestock emergency interventions in Ethiopia: the way forward. Proceedings of the workshop. 30 September – 2 October 2003 Addis Ababa, Ethiopia.
Food and Agricultural Organization (FAO). 2004. Tropical Livestock Units (TLU). Livestock, environment and development initiative web page – Virtual livestock centre web page: http://lead.virtualcenter.org/en/dec/toolbox/Mixed1/TLU.htm.
Girmay T, Mitiku H, Berhanu G, Pender J, and Eyasu E. 2000. Small-scale irrigation in Tigray: Management and institutional considerations. in Jabbar M, Pender J, and Ehui S. (eds). 2000. Policies for sustainable land management in the highlands of Ethiopia: Summary of papers and proceedings of a seminar held at ILRI, Addis Ababa, Ethiopia, 22–23 May 2000. Socio-economics and Policy Research Working Paper 30. ILRI (International Livestock Research Institute), Nairobi, Kenya. 68 pp.
Hansen J, and Perry B. 1994. The epidemiology, diagnosis and control of helmintic Parasites of ruminants. Animal production and Health Div, FAO, ROME, ITALY.pp171.
Harrison M, and Jackson K. 1958. Ecological classification of the vegetation of the Sudan. Ministry of Agriculture, Sudan, Forestry Bull. 2.
Hurni H. 1990. Degradation and conservation of soil resources in the Ethiopian Highlands. in Messerli B, and Hurni H. (eds.). African mountains and highlands. Problems and perspectives. African Mountains Association (AMA), Marceline, Missouri. p. 51-63
Hunting Technical Services. 1974. Southern Darfur Land Use Planning Survey. Sudan Ministry of Agriculture, Food and Natural Resources. Khartoum.
Hunting Technical Services. 1976. Savanna Development Project, Phase II, Annex 1, Soils and vegetation. Boreham Wood (UK): HTS.
Kamara A, and McCornick P. 2003. Synthesis of research issues and capacity building in water and land resources management in Ethiopia. in McCornick G, Kamara B, and Tadesse G. (eds.). Integrated water and land management research and capacity building priorities for Ethiopia. Proceedings of a MoWR/EARO/IWMI/ILRI international workshop held at ILRI, Addis Ababa, Ethiopia, 2–4 December 2002.
Landell Mills. 2003. Evaluation of the water harvesting schemes component of the EC funded programmes IFSP 1998 and IFSP 2000. in Tigray Regional State. EU SCR Framework contract. Draft final report – Phase I, 22 October 2003.
Livestock Working Group (LWG). 2004. Ministry of Agriculture and Rural Development. Proceedings August 19, 2004 Addis Ababa, Ethiopia. Malek A. 1985. Snail Hosts of Schistosomiasis and other Snail-Transmitted Disease in Tropical America: A Manual. Scientific Publication no.478, Pan America Health Organization.
Ministry of Animal Resources – Khartoum. 2000. Statistical bulletin for animal resources. General administration for planning and animal resources economics, Issue #1.

464
Mintesinot B, and Mitiku H. 2003. Water harvesting in northern Ethiopia: Environmental, health and socio-economic impacts. in McCornick G, Kamara B, and Tadesse G. (eds). 2003. Integrated water and land management research and capacity building priorities for Ethiopia. Proceedings of a MoWR/EARO/IWMI/ILRI international workshop held at ILRI, Addis Ababa, Ethiopia, 2-4 December 2002. IWMI (International Water Management Institute), Colombo, Sri Lanka, and ILRI (International Livestock Research Institute), Nairobi, Kenya. 267 pp.
Mukhtar K, and Fadlalla B. 1988. Effect of Watering Interval on Desert Sheep Growth During the Summer in North Kordofan. Ann. Rep. El Obeid Research Station Western Sudan Agricultural Research Project (WSARP), El Obeid, Sudan.
Muli A. 2000. Factors affecting amount of water offered to dairy cattle in Kiambu District and their effects on productivity. BSc thesis, University of Nairobi (Range Management) Nairobi.
Ngigi M. 2004. Building on successes in African Agriculture: Smallholder dairy in Kenya. 2020 Vision Series for Food, Agriculture, and the Environment, FOCUS 12. Washington: IFPRI.
Okewole A, Ogundipe T, Adejinmi O, and Olaniyan A. 2000. Clinical Evaluation of three Chemo prophylactic Regimes against Ovine Helminthosis in a Fasciola Endemic Farm in Ibadan, Nigeria. Israel Journal Of Veterinary Medicine. 56 (1): 15-28
Palmer A 2000. Grazing Capacity Information System. Agicultural Research Council-Range & forage Institute, Grahmstown, South Africa: [http://www.ru.ac.za/institutes/rgi/gssa/gcis/rscourse.htm]
Pender J, Jagge P, and Berhanu G. 2000. Agricultural change and land management in the highlands of Tigray: Causes and implications. in Jabbar M, Pender J, and Ehui S. (eds). 2000. Policies for sustainable land management in the highlands of Ethiopia: Summary of papers and proceedings of a seminar held at ILRI, Addis Ababa, Ethiopia, 22–23 May 2000. Socio-economics and Policy Research Working Paper 30. ILRI (International Livestock Research Institute), Nairobi, Kenya. 68 pp.
Prairie Farm Rehabilitation Administration (PFRA), 2001. Project inception report, Water Harvesting and institutional strengthening Tigray (WHIST), Ethiopia. Ottawa: PFRA. 91 pp.
Salih M. 1985. Pastoralists in town: some recent trends in pastoralism in the north west of Omadurman District. Paper 20b Pastoral Development Network, ODI, London, Agricultural Administration Unit. Scheffer M, Carpenter S, Foley J, Folkes O, and Walker B. 2001. Catastrophic shifts in ecosystems. Nature 413:591-595. Staal S, Chege L, Kenyanjui M, Kimari A, Lukuyu B, Njubi D, Owango M., Tanner J, Thorpe W, & Wambugu M. 1998. Characterization of dairy systems supplying the Nairobi milk market: a pilot survey in Kiambu District for the identification of target groups of producers. Smallholder Dairy (R&D) Project. KARI/MoA/ILRI Collaborative Dairy Research Programme, ILRI, Nairobi, Kenya. pp. 85.
Staal S, Owango M, Muriuki G, Lukuyu B, Musembi F, Bwana O, Muriuki K, Gichungu G, Omore A, Kenyanjui B, Njubi D, Baltenweck I, and Thorpe W. 2001. Dairy systems characterization of the greater Nairobi milk shed. SDP Research Report Ministry of Agric and Rural Dev., Kenya Agric. Research Institute and International Livestock Research Institute. 68p.
465
Stone R, and Moore N. 1997. Control of soil erosion. Ontario Ministry of Agriculture and Food Fact Sheet 95-089
Tedros G, Mitiku H, Karen W, Asfaw G, Ambachew M, Mekonnen Y, Hailay D, Steven L, and Peter B. 1999. Incidence of malaria among children living near dams in northern Ethiopia. British Medical Journal 319:663–666.
Waithaka M, Nyangaga N, Staal J, Wokabi W, Njubi D, Muriuki G, Njoroge N, and Wanjohi N. 2002. Characterization of Dairy Systems in the Western Kenya Region. Smallholder Dairy (Research & Development) Project Research Report. 72p.
Wilson T. 2003. The environmental ecology of oxen used for draught power. Agriculture, Ecosystem and Environment Volume 97:21-37.
World Bank. 2000. Options for the sustainable development of the Gezira Scheme. Report No. 20398-SU.
World Bank. 2004. Transport policy program (SSATP). http://www.worldbank.org/afr/ssatp/rttp/3_1challenges.htm
World Health Organization (WHO). 1995. Control of food borne Trematode infections. Technical Report Series 849-61.

466
5
Agricultural Water Investments and Poverty Reduction Impacts in West Africa:
A review of Treadle Pumps with a Focus on Ghana and Niger
Kamara, A. B.a, Danso, G.a, Mahu, S. A.b, Cofie, O.a, Drechsel, P.a and Van Koppen, B.c a International Water Management Institute(IWMI), West Africa Office, Accra, Ghana.
b EnterpriseWorks Worldwide, Ghana Office, Accra, Ghana c International Water Management Institute(IWMI), South Africa Office, Pretoria, South
Africa.
467
TABLE OF CONTENTS
Synthesis……………………….……………………………………………………468 Acronyms and Abbreviations.……………………………………………………..470
Introduction…………………………………………………………………………471
Objectives and Scope of the Study………………………………………….…472 Study Methodology……………………………………………………………...473
Overview of EnterpriseWorks……………………………………………………..475
EnterpriseWorks’ Technology Package……………………………………...476 Strategies for Pump Manufacturing, Promotion and Marketing………….476 Outreach and Impacts…………………………………………………………..477
Selected Cases of Implementation and Impacts…………………………………...479
The Niyya da Kokari Pump in Niger………………………………………….479 The SOKA Pump Project in Ghana ………………………………………483
Detailed Study of the SOKA Pump in Ghana……………………………………..488
Study Methodology………………………………………………………………488 Socio-economic Characteristics of Sample Farmers……………………….488 Results and Discussion………………………………………………………….489 Conclusions from the SOKA Pump Experience in Ghana………………….499 Ways Forward with SOKA Pump in Ghana………………………………….500
Synthesis and Conclusions………………………………………………………….501
468
SYNTHESIS Finding sufficient water for irrigation is one of the challenges facing farmers in sub-Saharan Africa (SSA), where smallholder production relies on uncertain and highly variable rainfall. Experiences with traditional water lifting technologies (such as rope and bucket) have not only proved to be slow and cumbersome, but are too labour intensive to enhance production on a scale that will significantly enhance food security. Motorized irrigation pumps are more efficient but often too expensive for farmers to afford. For those who can afford, landholdings are sometimes too small to allow production on a profitable scale, while high running and maintenance costs and detailed technical and management requirements make such pumps hardly viable for operation by smallholders. The treadle pump has recently shown to significantly overcome these constraints in many parts of Africa, offering the first step towards more advanced pumps. The use of treadle pumps in West Africa started in the 1990s and is now perceived to be very prevalent in many parts of the sub-Region. While various institutions are involved in promoting the pumps with reasonable success, a systematic assessment of their actual poverty reduction and food security impact especially from a sustainability perspective remains a crucial task. This study is an effort in this direction, with a special focus on West African countries where EnterpriseWorks (EW) has been active in the past decade. The study is divided into four main sections. Section 1 presents the study background, objectives, and methodology adopted. Section 2 presents an overview of interventions promoted by EW, its strategies, activities and overview of outreach and impacts in West Africa. Section 3 discusses details of implementation processes of the EW-supported projects as evidenced by the experiences in Niger and Ghana. Among others, project rationale, implementation strategies and philosophy of pump promotion are discussed. Strategies of treadle pump promotion, target groups and monitoring and evaluation of impacts are also discussed, based on findings from secondary literature. Section 4 presents a detailed case study of the poverty reduction impacts of the SOKA pump in Ghana, focusing on various indicators that are developed in the context of the Millennium Development Goals (MDGs) and how they relate to the use of treadle pumps. The Ghana findings are discussed in the context of other experiences in West Africa, especially the Niger experience. This is supplemented by a ground level assessment of poverty reduction impacts of the SOKA pump. The final section gives a synthesis and conclusions from the study. There is evidence of some positive impacts of the SOKA pump in Ghana, as depicted by labour savings, expansion of farm sizes, diversification of crops, and intensification of input use. It however remains unclear whether the poor are actually benefiting from the pumps, since those who are actually using the pumps are not necessarily among the poor. The pumps are sold with little or no support in terms of credit or start-up capital. Those with start-up capital, most of whom are engaged in other businesses, acquire the pumps and are really benefiting from them. Lack of credit (individual or group) or any mechanism for the poor to acquire financial capital is a key constraint to achieving significant poverty reduction impacts. At the regional level, positive impacts on income are reported in a number of studies in nearly all countries of intervention in West Africa. However, there is strong evidence of low female participation both in pump ownership and in the provision of labour to operate the pumps. Thus, even though the pumps are proving to have an income enhancing potential, the benefits are to a great extent only accruing to men, especially those with start-up capital and

469
access to land. There is thus a concern that the poor, especially women may be precluded from the benefits of those interventions.
470
ACRONYMS AND ABBREVIATIONS
ADB Agricultural Development Bank ADRA Adventist Development and Relief Agency AGFUND Arab Gulf Programme for United Nations Development Organizations ANPIP Agence Nigérienne de la Promotion de l’Irrigation Privée ASNAPP Agribusiness in Sustainable Natural African Plant Products ATI Appropriate Technology International CARD Centre for Agriculture and Rural Development CAREX Centre for Advancement of Rural Extension CGIAR Consultative Group on International Research CSIR Centre for Scientific and Industrial Research DANIDA Danish International Development Agency DAP Development Assistance Program DFID Department for International Development EW Enterprise Works FAO Food and Agricultural Organization IFAD International Fund for Agricultural Development IPTRID/FAO International Program for Technology and Research in Irrigation and
Drainage (IPTRID/FAO) ITS Impact Tracking System IWMI International Water Management Institute KIP Kpong Irrigation Project KMA Kumasi Metropolitan Assembly MoFA Ministry of Food and Agriculture MOU Memorandum of Understanding NEPAD New Partnership for Africa’s Development NGOs Non-Governmental Organizations OICI Opportunities Industrialization Centres International PIP Petite Irrigation Privée SPFS Special Program on Food Security SSA Sub-Saharan Africa TNS Technoserve TV Television UNICEF United Nations Children's Fund USAID United States Agency for International Aid Development WB World Bank WI Winrock International WLR World Lutheran Relief

471
INTRODUCTION 5.1 There is a growing consensus that food insecurity in Africa, which owes it a lot to
adverse climatic factors particularly unreliable rainfall, could be significantly improved through increased irrigation and access to small scale water management technologies such as small motorized pumps, treadle pumps, drip kits, bucket kits (Shah et al., 2002; Kamara et al., 2002). The traditional system in most of sub-Saharan Africa (SSA) relies heavily on bucket lifting technologies to lift and distribute water from shallow open wells or to take water with watering cans from streams. Although the low capital requirement of these traditional technologies makes them advantageous and affordable, their low delivery capacity and labour-intensive nature make them highly unfavourable to African production conditions. Improved water lifting technologies, with relatively high efficiencies, such as motorized pumps, have also been tried but have largely been found to be favourable only to large farmers. For small-scale farmers, who usually irrigate relatively small plots of land and operate relatively small capital, such technologies are found to be unaffordable: the cost of buying, running and maintaining a motorized pump is too prohibitive for the majority of African smallholder farmers; for those who can afford it, it is usually uneconomical especially in the absence of scale effects due to small land holdings, and hence unsustainable. This lack of simple, affordable and well adapted water development technologies, suitable to the production conditions and needs of smallholder farmers in SSA, among others, is a serious handicap to efforts for achieving food security on the continent (Hyman et al., 1995; Brabben and Kay, 2000).
5.2 Therefore poverty-focused irrigation water development and investment initiatives
have to look at critical tradeoffs between efficiency (which creates a focus on engine-driven pumps) and affordability by small farmers, as well as their ability to manage technologies in a sustainable way (Chancellor, 2001; Kamara et al., 2002). Currently, this need is becoming recognized, as is widely reflected by various efforts in SSA to promote a broad range of low cost, plot-level technologies such as treadle pumps and drip kits, with efforts to make them accessible to smallholder farmers (Brabben and Kay, 2000; Van Leeuwen, 2001). Most of these efforts are specifically focused on the treadle pump97, which is proving to be very suitable and easily adaptable to African production conditions: it is a human-powered, low-lift, relatively high capacity pump, designed to overcome the limitations of the use of engine-driven pumps by small farmers – buying, running costs and management capacity, and the relatively low capacity of traditional ones (Neighbor and Sellen, 2002; IWMI, 2003).
5.3 Today a substantial variety of low-cost, affordable water development options exist,
including treadle pumps. Manufacturing, marketing and distribution campaigns of these devices, particularly the treadle pump, through development organisations, e.g. ApproTEC in East Africa, EnterpriseWorks in West Africa, etc., are beginning to increase the access of farmers to these technologies. In West Africa, for instance, the International Program for Technology and Research in Irrigation and Drainage (IPTRID/FAO) is promoting the use of treadle pumps and other technologies for wells as part of its small-scale irrigation project, so as to increase farmers’ income at low cost.
97 The treadle pump can lift five to seven cubic meters of water per hour from wells and boreholes to up to seven meter deep as well as from water sources such as lakes and rivers (Hyman et al., 1995). The pump can be designed, manufactured and maintained at low cost in rural workshops by locally trained people, using locally available material.
472
5.4 The World Lutheran Relief (WLR) and the Appropriate Technology International (ATI) [now Enterprise Works] have also been instrumental in promoting and disseminating small-scale water development technologies, especially treadle pumps, with notable successes since the early 1990s (Hyman et al., 1995). Other initiatives are, e.g., supported by International Development Enterprise (IDE).
5.5 EnterpriseWorks’ involvement in the promotion of treadle pumps in West Africa
began during the early 1990s. By 1995, dissemination had already begun in Senegal and Mali, and by the end of 1996, about 1,900 and 600 pumps had been produced in the two countries respectively (Perry, 1997). Currently, EW is engaged in Ghana, Niger, Guinea-Bissau, Benin, Cote d’Ivoire, Mali, Senegal and Burkina Faso, actively promoting projects and programs on oil seeds, staple food and vegetables through small scale irrigation particularly with treadle pumps and associated supported services so as to enhance food security and alleviate poverty. For a number of reasons however, the success of these initiatives remained limited to those intervention cases (by NGOs and other agencies), and replication elsewhere on a larger scale to achieve broader impacts still poses a real challenge.
5.6 Though there is a consensus that the limited success might mostly be related to
uncoordinated efforts between different pump supporting agencies, with little prospects for mutual learning, sharing of experience and replication of successes for broader impacts, many believe that there are real possibilities and opportunities to make treadle pumps available much more widely in West Africa, and to increase the access of the poor to the technology and achieve broader food security impacts (Alien and Perry, 1996; Brabben and Kay, 2000; Arbib, 2004). The focus on the treadle pump, a technology that is proving to be affordable to smallholders, is based on the fact that resource-poor smallholders are the most food insecure in the sub-region, and that overcoming poverty implies enabling smallholders to grow crops all the year round, which immediately translates into a need for securing access to sufficient water through water development technologies. A critical starting point for overcoming this challenge is to identify possible investment options in smallholder agricultural water technologies, identify success stories associated with particular technologies, and assert efforts for replicating them, followed by an assessment of their poverty reduction and food security impacts. The current study is a component of a larger project that seeks to address the above issues98.
Objectives and Scope of the study 5.7 The overall goal of the study on ‘Agricultural Water Investment in Africa’ is to
catalyse increased investments in agricultural water development for poverty reduction. This is to be achieved through enhancing a better understanding of the poverty reduction impacts of various types of agricultural water development efforts and technologies, so as to identify the most effective institutional approaches for achieving greater impacts on poverty and food security. This study is part of the Poverty Component of the larger study and specifically focuses on treadle pumps in West Africa, where it seeks to articulate its role in poverty alleviation in the context of diversified rural livelihood strategies, and to highlight associated multiplier effects
98 The broader study entitled ‘Investments in Agricultural Water Management in Sub-Saharan Africa: Diagnosis of Trends and Opportunities’ is a collaborative programme between the New Partnership for Africa’s Development (NEPAD), the African Development Bank (ADB), the Food and Agricultural Organization of the United Nations (FAO), the International Fund for Agricultural Development (IFAD), the International Water Management Institute (IWMI) and the World Bank (WB). All these institutions share the common goal of promoting sustainable economic growth and poverty reduction in Africa, through enhancing the productivity and profitability of agriculture.
473
where possible. Issues related to private sector involvement in treadle pump manufacture, dissemination (supply chain), backward and forward linkages from a farmer perspective (input provision and output marketing), and institutional and legal frameworks that enhance successes and overcome bottlenecks are given specific attention.
In this context, the specific objectives of the study are to: Generate a better understanding of the poverty reduction impacts of the treadle
pumps in West Africa, with a particular focus on Ghana and Niger, so as to identify the most effective institutional approaches to supporting this technology to facilitate access by poor farmers. This is to be achieved through literature review on treadle pumps in West Africa, supplemented by field studies in Ghana.
Derive lessons, based on identified successes and bottlenecks that will be useful for future investments and design of small-scale agricultural water development technologies, with a particular focus on the treadle pump.
Provide recommendations on ways forward with the promotion of treadle pumps for poverty reduction and food security in Africa, with a focus on West Africa.
Study Methodology 5.8 Assessing the poverty reduction impacts of particular technologies among
smallholders, who often have multiple livelihood strategies, is not as easy as may be assumed. Often, the technology is one among many production factors or inputs, whose aggregate effects may affect poor people’s wellbeing. It is common to evaluate the poverty reduction impacts of a particular technology in terms of changes in poor people’s gross value production, for the production process in which the technology is employed. These changes in production value could be assessed before or after the technology, or with and without technology. Each of these methods has its strengths and weaknesses. The ‘with and without’ comparison assumes a perfect similarity between the groups being compared (social, economic, agro-ecological, etc.), which is hardly given in reality, and assumes that the only thing that changes is the technology. The ‘before and after’ comparison deals with the same group of poor recipients whose performance is compared in terms of certain criteria that is used to measure the impact of the change observed. In many impact assessment studies, the common choice is to measure changes ‘before and after’, dealing with the same group, while making an effort to take into account other changes that may have occurred that affect observed outcomes (i.e. dealing with attribution).
5.9 As found in this assessment, most of the available literature seems to implicitly assume that treadle pump users are generally poor smallholders and that treadle pumps self-select the poor. Changes in net farm income derived from irrigation are generally used as indicators of the impact of treadle pumps. That is, the gross value of production less production costs for fixed and variable inputs. Smallholder irrigated agricultural production in West Africa is constrained by the labour intensive nature of traditional water-related technologies (bucket and rope, etc.), which is the main constrain to increased farm production and productivity. This is so especially during the dry season when water availability poses a key constraint, and water procurement utilises a considerable proportion of the available farm labour. Thus, even where property rights and other institutional arrangements may facilitate access to land, increasing farm sizes to enhance the utilisation of economies of scope and scale are sometimes constrained by labour availability, and thus dwindle the hopes of smallholders for increasing their incomes. Availability of labour-efficient technologies may also have a positive impact on crop choices in favour of high value crops to enhance market orientation, and increased cropping intensity to facilitate

474
production activities all the year round, with significantly positive income impacts. In some cases, due to increased economies of scale, production costs may be reduced significantly to enhance the profitability of certain crops, whose production would otherwise not be profitable. It is these aggregate effects that accrue to the observed increase in net farm income and profitable production that is often associated with the introduction of new technologies, with an effect on food security and other income indicators.
Poverty Indicators 5.10 Poverty indicators used in the detailed field study are developed in the context of
Millennium Development Goals (MDGs), which are now widely used as a basis for the planning and implementation of poverty reduction programmes. That is, poverty is understood as a state of multi-dimensional deprivation from basic human necessities such as food (food insecurity), shelter, access to health and education facilities, etc. Access to these key human necessities depends not only on availability of the services but especially on income, particularly farm income, e.g., from irrigation. Therefore the poverty reduction impact of interventions are understood from the perspective of the additional income that poor people make as a result of that intervention, so as to improve their income poverty situation and other key indicators of the MDGs. In particular, the goals of food security, which is inherent in the pledge to reduce by half the number of poor and hungry people, who live with less than one USDollar per day, by 2015 is critical. The MDGs on education, gender equity and women empowerment are also considered, in the context of investments that people make in these areas as a result of additional incomes generated from water-related technologies.
5.11 In the detailed field study therefore, a three-step approach is adopted. The first step
entails a classification of adopters according to poverty status. The poverty line used in this study is US$ 400 per capita per year, which is the minimum daily wage in Ghana set by the Government of Ghana in 2004 (Ministry of Finance). This is slightly more than the threshold set in the 'Ghana Poverty Reduction Strategy Paper 2003 -- 2005, which is $375 per adult per year (Government of Ghana, 2003)99. The second step is an assessment of the additional net income generated by farmers (classified according to a defined poverty status) as a result of adopting the treadle pump, while in the third step, the expenditure of this income on key poverty indicators is assessed. In this study, an effort is made to assess farmers overall incomes and the impact of the Soka pump on incomes, and to further understand how this income improvement translates into improvements in key MDGs, such as food security, education and shelter. Impacts on other key indicators of the MDGs such as health and environment are captured in other components of the ‘Investment Study’, and are beyond the scope of this assessment.
Study activities 5.12 The study consists of two main components: literature review on treadle pumps in
selected countries in West Africa with a focus on Niger, and detailed field studies in Ghana. The literature review comprises relevant project materials, grey literature and other documentation of concerned institutions, especially Enterprise Works, focusing on work done in West Africa. The detailed field survey was conducted in selected communities in Ghana, where Enterprise Works is currently engaged in pump promotion and dissemination. These reviews and field study in Ghana are designed to
99 The Ghana living standard survey defines the poverty line as the consumption expenditure needed to achieve minimum nutritional needs. Overall poverty in Ghana is based on a poverty line of 900,000 Cedis per adult per year in March 1999. With an exchange rate in 1999 of 2,400 Cedis to $1.0, this equals $375.
475
generate an understanding of costs, benefits, household food security, perceptions and opportunities for up-scaling of treadle pumps to achieve even broader poverty reduction impacts.
Sample Selection and Field Data Analysis 5.13 The field survey in Ghana covered 101 households owning and using treadle pumps
in the Brong Ahafao and Ashanti Regions of Ghana. The choice of country and sites was based on current activities of EnterpriseWorks (EW) in these regions. EW’s pump distribution activities are currently implemented in all the regions of the country. In total, about 630 pumps have been distributed, but outreach is highest in Brong Ahafao and Ashanti regions, which became a natural choice for the field studies. Questionnaires were designed and administered at the farmer level, focusing on various issues that relate to processes and impacts. Respondents were selected randomly from a list of pump users in the study regions, using simple random sampling techniques. Key informant discussions were also held with non-pump users, as well as pump manufacturers to get their perspectives of opportunities and bottlenecks along the supply chain of treadle pump distribution, as well as possibilities for scaling up.
5.14 The analysis was focused on various farm-level indicators whose improvement leads
to increased farm income. That is, savings in labour requirement, improved efficiency of material inputs use, expansion of farm size as a result of increased water availability, increased cropping intensity and improvements in yields. These are assessed before and after pump adoption, and their aggregate effect on net farm income is estimated. A further step is taken to evaluate impacts of these income changes in terms of expenditure on patterns on key indicators of wellbeing and their outcomes: food security (accessibility, affordability all the year round), expenditure on education and home improvement, etc. Field findings from this study in Ghana are compared with the findings of the literature review beyond Ghana.
OVERVIEW OF ENTERPRISEWORKS
5.15 EnterpriseWorks Worldwide (EW), formerly Appropriate Technology International (ATI), is a not-for-profit development organization that promotes sustainable, enterprise-oriented solutions to problems facing small-scale agricultural producers around the developing world. For over 20 years EW has undertaken strategic interventions in more than 60 countries, targeting production, processing, and marketing to enable farmers to improve productivity, tap broader markets, capture higher value of finished products, and better manage natural resources. EW categorises its interventions into six strategic sub-sectors: (1) Small-scale irrigation, (2) oilseeds and staple foods, (3) tree crops, (4) natural products, (5) livestock, and (6) energy. EW builds capacity from within, cooperating with local private-sector partners in applying its enterprise-oriented approach to development and conservation. Since 1993, EW interventions have generated $84 million in monetary benefits for over 250,000 subsistence-level farmers and households in 25 countries (EnterpriseWorks, 2002).
5.16 EW secures program support from a wide range of donors, including bilateral donors (USAID, DANIDA, DFID), multilateral donors (World Bank, Inter-American Development Bank), foundations (Ford, McKnight, Kellogg), and private companies (TransAlta Corp, Starbucks). EW maintains a close-knit network of 18 field and affiliate offices in Africa, Asia, and Latin America – enabling substantial knowledge

476
sharing and collaboration across countries and regions. EW’s approach to agricultural development is aimed at economic self-sufficiency. The techniques and technologies promoted have been developed and refined over the years to require the minimum of initial investment, yield the maximum in economic benefits, and be independent of ongoing assistance. This commercial strategy targets the private sector – micro, small, and sometimes medium-sized enterprises, including farmers and farm families. While many organizations promote technology transfer and the adoption of improved agricultural commodities and practices, EW, complements such technical activities with the development of the complete market for locally manufactured technologies and high-value processed goods. This demand-driven approach stems from the conviction that production without sales does not generate income or enhance sustainability.
5.17 EW has been active in the private irrigated agriculture sub-sector since the late
1980s100. In addition to its current collaborations with USAID in Senegal, Mali, Benin, Ghana and Tanzania, EW has worked with the World Bank and governments of Niger, Burkina Faso, and Côte d’Ivoire to develop this sub-sector in these countries.
EnterpriseWorks’ Technology Package 5.18 EnterpriseWorks has developed a portfolio of technologies and methods for
penetrating groundwater resources in various locales. Its technological package mainly consists of water lifting and distribution devices such as hand-drilled tube-wells, wrapped filters, and well-jetting techniques which maximize farmers’ access to water for the minimum cost – utilizing the private sector to ensure efficient and sustainable delivery. Applying its expertise in technology development, adaptation, and commercialisation, EW has introduced low-cost, high-performance irrigation equipment (especially treadle pumps) to low-income farmers in many countries in West Africa.
5.19 The treadle pump is a human-powered water pump that is used principally for
irrigating small holdings of land. There are two types: those that lift water from a lower level to the height of the pump commonly called suction pumps, and those that lift water both from a lower level and lift it to a height greater than the height of the pump known as pressure pumps. In all forms, water is pumped by two direct-displacement pistons, which are operated alternately by the stepping motion of the user. Details on the components and principles of operation of treadle pumps are not discussed in this report.
Strategies for Pump Manufacturing, Promotion and Marketing 5.20 The manufacturing of TP is entirely in the hands of locally trained manufacturers
owning workshops. The strategy of EW is to give the initial start-up support such as training, advertising skills, marketing strategy and after-sales care to enhance customer satisfaction and sustainability. EW promotes the technologies from a business point of view by encouraging beneficiaries to purchase the technologies at the full, unsubsidised price directly from local manufacturers or sales agents without
100 In 2002, the Arab Gulf Programme for United Nations Development Organizations (AGFUND) awarded EnterpriseWorks its First Prize for Pioneering Development Project, recognizing the organization’s achievements in small-scale irrigation in Niger (EnterpriseWorks, 2004).
477
the intervention of the project. This is to ensure sustainability, also after completion of the project.
Naugle (2000) summarizes that five main issues are considered relevant in EW’s philosophy of technology promotion to enhance commercialisation within the adopting population:
production as close as possible to the end user; affordability for the buyers; profitability for the producers; reliable functioning of the technology to enhance satisfaction of the customer;
and after-sales care to help buyers familiarize themselves with the product, and to
overcome preliminary problems associated with the adoption of new technologies.
5.21 In the area of marketing, EW employs strategies similar to private businesses, by
utilizing radio and television advertising, public, on-site and market demonstrations, and other techniques to disseminate information regarding the products, specifically to farmers in the irrigated horticulture sub-sector. Another mechanism for dissemination is farmer assisted sales. In this case an early adopter is encouraged to promote the technology among his or her neighbours in return for a sales commission from the manufacturer. This has been found to be an effective way of marketing due to the satisfaction that usually accompanies the irrigation technologies. Artisans eventually assume responsibility for the marketing after receiving training on these marketing techniques (EnterpriseWorks, 2004).
Outreach and Impacts of Treadle Pumps in West Africa 5.22 Outreach across West Africa, at the moment, is mostly limited to countries directly
reached by EW in its various treadle pump promotion programs. This includes Senegal, Mali, Niger, Cote d’Ivoire, Burkina Faso, Ghana and Benin. At a cost of between US $50 to $100 per unit, EW’s treadle pump helps farmers to increase annual income derived from vegetable production. EW’s assessment reports mention that incomes of small scale farmers have doubled in countries, due to labour savings, expansion of farm sizes and economies of scope and scale (EnterpriseWorks, 2004). The reports further state that about 2,000 irrigation pumps are currently sold yearly in EW’ project countries in Africa. Some country specific results in West Africa are summarized in Table 1 below.
Table 1: Summary of Impacts across West Africa *
Country Period of Activity
Duration (yrs)
# of pumps Sold
@ annual income per pump (US $)
Total economic benefits (million $)
Senegal 1990 – 2001 12 3048 584 8.9 Mali 1995 – 2001 7 2311 542 6.3 Niger 1997 – 2001 5 1340 289 1.9 Benin 1998 – 2001 4 771 479 1.8 Burkina Faso 2000 – 2001 2 504 306 0.8 Cote d’Ivoire 2000 – 2001 2 495 479 1.2 Ghana 2002 – 2003 >1 630 822 a Na West Africa 1990 – 2003 13 8469 b 349 b 20.9 b * = estimated life span of the pump is five years; na = not yet available; a = for vegetable growers only in
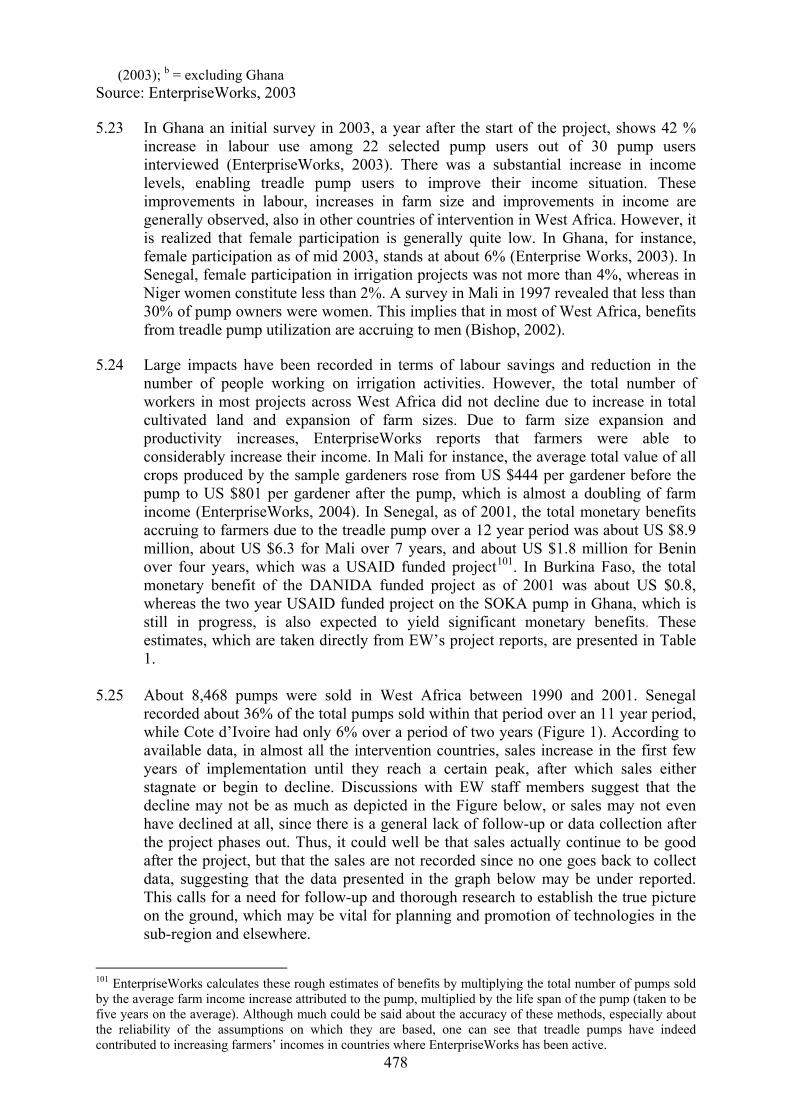
478
(2003); b = excluding Ghana Source: EnterpriseWorks, 2003 5.23 In Ghana an initial survey in 2003, a year after the start of the project, shows 42 %
increase in labour use among 22 selected pump users out of 30 pump users interviewed (EnterpriseWorks, 2003). There was a substantial increase in income levels, enabling treadle pump users to improve their income situation. These improvements in labour, increases in farm size and improvements in income are generally observed, also in other countries of intervention in West Africa. However, it is realized that female participation is generally quite low. In Ghana, for instance, female participation as of mid 2003, stands at about 6% (Enterprise Works, 2003). In Senegal, female participation in irrigation projects was not more than 4%, whereas in Niger women constitute less than 2%. A survey in Mali in 1997 revealed that less than 30% of pump owners were women. This implies that in most of West Africa, benefits from treadle pump utilization are accruing to men (Bishop, 2002).
5.24 Large impacts have been recorded in terms of labour savings and reduction in the
number of people working on irrigation activities. However, the total number of workers in most projects across West Africa did not decline due to increase in total cultivated land and expansion of farm sizes. Due to farm size expansion and productivity increases, EnterpriseWorks reports that farmers were able to considerably increase their income. In Mali for instance, the average total value of all crops produced by the sample gardeners rose from US $444 per gardener before the pump to US $801 per gardener after the pump, which is almost a doubling of farm income (EnterpriseWorks, 2004). In Senegal, as of 2001, the total monetary benefits accruing to farmers due to the treadle pump over a 12 year period was about US $8.9 million, about US $6.3 for Mali over 7 years, and about US $1.8 million for Benin over four years, which was a USAID funded project101. In Burkina Faso, the total monetary benefit of the DANIDA funded project as of 2001 was about US $0.8, whereas the two year USAID funded project on the SOKA pump in Ghana, which is still in progress, is also expected to yield significant monetary benefits. These estimates, which are taken directly from EW’s project reports, are presented in Table 1.
5.25 About 8,468 pumps were sold in West Africa between 1990 and 2001. Senegal
recorded about 36% of the total pumps sold within that period over an 11 year period, while Cote d’Ivoire had only 6% over a period of two years (Figure 1). According to available data, in almost all the intervention countries, sales increase in the first few years of implementation until they reach a certain peak, after which sales either stagnate or begin to decline. Discussions with EW staff members suggest that the decline may not be as much as depicted in the Figure below, or sales may not even have declined at all, since there is a general lack of follow-up or data collection after the project phases out. Thus, it could well be that sales actually continue to be good after the project, but that the sales are not recorded since no one goes back to collect data, suggesting that the data presented in the graph below may be under reported. This calls for a need for follow-up and thorough research to establish the true picture on the ground, which may be vital for planning and promotion of technologies in the sub-region and elsewhere.
101 EnterpriseWorks calculates these rough estimates of benefits by multiplying the total number of pumps sold by the average farm income increase attributed to the pump, multiplied by the life span of the pump (taken to be five years on the average). Although much could be said about the accuracy of these methods, especially about the reliability of the assumptions on which they are based, one can see that treadle pumps have indeed contributed to increasing farmers’ incomes in countries where EnterpriseWorks has been active.
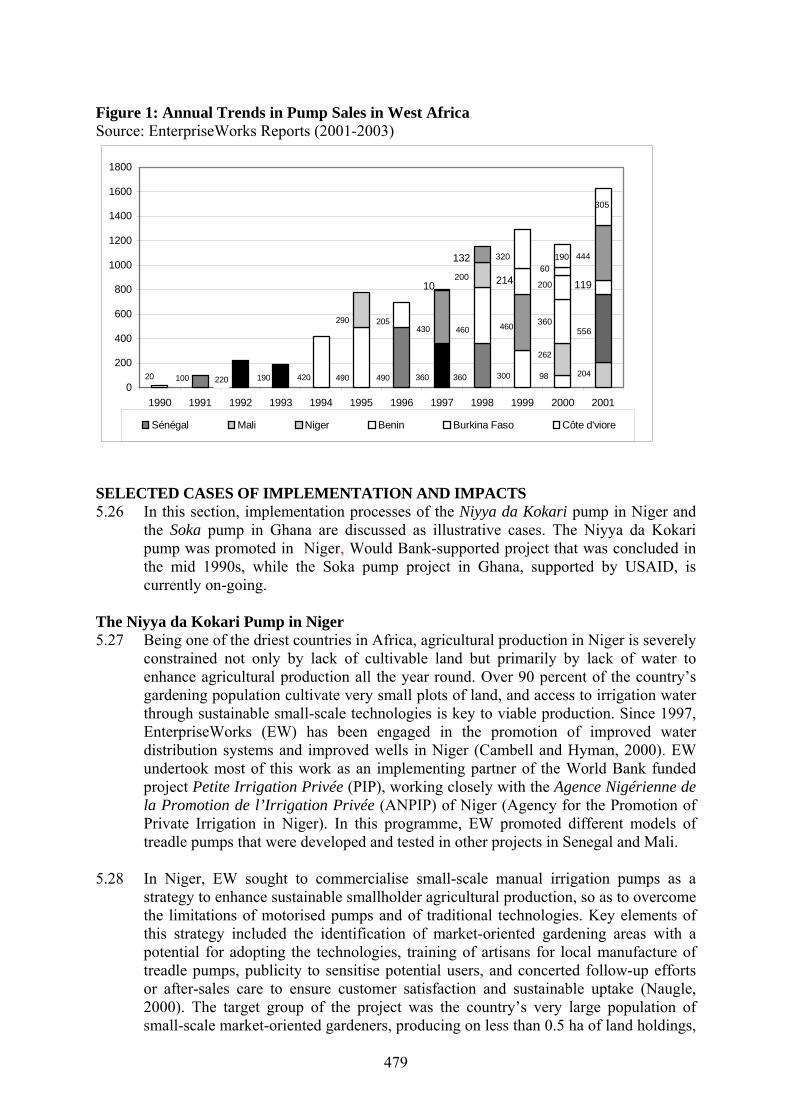
479
Figure 1: Annual Trends in Pump Sales in West Africa Source: EnterpriseWorks Reports (2001-2003)
20 100 220 190 420 490 490 360 360 300 98
290 205430 460 460
262
204
10
556360
214200119200
320132 44460
305
190
0
200
400
600
800
1000
1200
1400
1600
1800
1990 1991 1992 1993 1994 1995 1996 1997 1998 1999 2000 2001
Sénégal Mali Niger Benin Burkina Faso Côte d'viore
SELECTED CASES OF IMPLEMENTATION AND IMPACTS 5.26 In this section, implementation processes of the Niyya da Kokari pump in Niger and
the Soka pump in Ghana are discussed as illustrative cases. The Niyya da Kokari pump was promoted in Niger, Would Bank-supported project that was concluded in the mid 1990s, while the Soka pump project in Ghana, supported by USAID, is currently on-going.
The Niyya da Kokari Pump in Niger 5.27 Being one of the driest countries in Africa, agricultural production in Niger is severely
constrained not only by lack of cultivable land but primarily by lack of water to enhance agricultural production all the year round. Over 90 percent of the country’s gardening population cultivate very small plots of land, and access to irrigation water through sustainable small-scale technologies is key to viable production. Since 1997, EnterpriseWorks (EW) has been engaged in the promotion of improved water distribution systems and improved wells in Niger (Cambell and Hyman, 2000). EW undertook most of this work as an implementing partner of the World Bank funded project Petite Irrigation Privée (PIP), working closely with the Agence Nigérienne de la Promotion de l’Irrigation Privée (ANPIP) of Niger (Agency for the Promotion of Private Irrigation in Niger). In this programme, EW promoted different models of treadle pumps that were developed and tested in other projects in Senegal and Mali.
5.28 In Niger, EW sought to commercialise small-scale manual irrigation pumps as a
strategy to enhance sustainable smallholder agricultural production, so as to overcome the limitations of motorised pumps and of traditional technologies. Key elements of this strategy included the identification of market-oriented gardening areas with a potential for adopting the technologies, training of artisans for local manufacture of treadle pumps, publicity to sensitise potential users, and concerted follow-up efforts or after-sales care to ensure customer satisfaction and sustainable uptake (Naugle, 2000). The target group of the project was the country’s very large population of small-scale market-oriented gardeners, producing on less than 0.5 ha of land holdings,
480
and selling a significant proportion of their produce. Most of this target population could afford and were willing to pay for improved technologies that hold a promise of increasing farm income or reducing production costs (Naugle, 2000).
The treadle pumps promoted in Niger are of both suction and pressure types (see Section 2.1). The pumps are sold under the brand name Niyya da Kokari, a phrase meaning ‘willingness and courage’, which was devised as part of the overall promotion strategy. As reported by Cambell and Hyman (2000) two models of foot-powered pumps have been sold in Niger: a Bangladesh type suction-only treadle pump and a modified Bielenberg suction-pressure treadle pump. These are promoted along with one type of hand-powered suction-only pump. The modified Bielenberg treadle pump has a pressure feature that makes it possible to lift water into a storage reservoir at some distance from the pump, or transport water across fields for up to 50 meters on flat land.
Implementation processes 5.29The implementation process of pump promotion starts with the identification and adaptation of the pump types to sIn the Niger project, key characteristics of identified sites included depth of the water table which had to be within 6 m for the surface, recharge capacity of the aquifer (> 1 litre per second), concentration of market-oriented gardeners using traditional water-lifting technologies, and availability of adequate land for garden expansion (Naugle, 2000). Areas with a high concentration of gardeners were identified via market visits, discussion with vendors and tracing of products to the source of production and to the producers. Pump manufactures and supply chain 5.30 For the pump manufacture, skilled craftsmen were targeted, trained and encouraged to
market their products. As a condition, the target craftsmen must show some willingness to collaborate and to follow basic recommendations that enhance the production of quality products. Training of manufacturers is carried out by local EW field staff, and is done in the manufacturers’ own workshops over a period of ten days. The manufacturer’s cooperation is expected and encouraged to provide workshop space, tools and labour, while the project provides specialized parts of the pump and tooling to make sure that the pumps are well made. The training targets the production of three pumps of each model to familiarise them with the process. The manufacturer is then encouraged to produce ten pumps of the first model pump, which is then used to assess his expertise and ability to meet the quality standards of that model. The manufacturer is then trained in the next model following the same procedure. The training includes the choice of material, quality controls, installation and troubleshooting. After this basic training the manufacturer is set to produce the pumps and to adjust its production (quantity) to local demand.
5.31 The basic criteria for selecting potential manufacturers, based on the Niger experience,
are summarized by Naugle (2000) as: willingness to purchase most of the material to produce the first three pumps
produced during the training; willingness (and ability) to avail adequate selection of tools for the work; professed willingness to work closely with the project by following
recommendations, providing sales records and following established norms for pump production;
ownership of established business with five years’ production experience; having adequate number of skilled craftsmen in the workshop; ability to maintain a stock of pumps for sale; and an established rural clientele, evidenced by sales of ox carts or ploughs.

481
It is clear that these criteria only serve as an overall guide, as the difficulty of choosing manufacturers goes far beyond the simple satisfaction of the above criteria, with many other human factors that have to be taken into consideration. The supply chain of the pump thus consists of EW as trainer, supporter and provider of incentives to the manufacturers, the manufacturers producing the pumps based on quality standards that are controlled by EW, as well as field workers who visit manufacturers as well as end users at specified time intervals.
Marketing strategy 5.32The marketing strategy of the treadle pumps in Niger takes a proactive approach that entails various activities of prpumps are sold during this demonstration period, to prove to the manufacturers that the product has a good market potential (Naugle, 2000). Also, proceeds from these sales serve as a starting capital for the production of more pumps. Occasionally, more demonstration can be supported by EW through field staff, but manufacturers are generally encouraged to do demonstrations on their own. Besides field demonstration, other means of publicity and promoting the pump in Niger include multimedia publicity, television and radio. At some instance, a praise song in local languages (Hausa and Djerma) is composed to publicize the new name and promote the pump. Brochures and user manuals are produced in local languages but they become effective only after being recorded on audio cassettes, a copy of which is handed over to each gardener that buys the pump. Other spare parts such as pump leather, wrench for opening the pump and adjusting the pistons, and a spare PVC pipe for the suction side, are also supplied along with the pump. 5.33 In some cases, incentives are given to buyers through a hire-purchase agreement,
which is made between the manufacturer and the buyer. The contract agreed upon obliges the gardener to pay about 50% of the cost price up-front, and to pay the balance on a mutually agreed date. This contract is concluded in the presence of a witness, usually the village chief, or other responsible member of the community. If the gardener fails to pay the remaining amount, the agreement empowers the manufacturer to repossess the pump while the deposit is withheld as a hire fee. After-sales support is also given as encouragement to the gardeners, which includes at least three visits by EW field staff, together with a representative of the manufacturer. The first visit entails quality control of the pump (materials used, recommended procedures, etc) as well as installation and site-specific requirements to improve performance. This first visit is very important for the first few pumps at a new site and for new users. The second and third visits are to check the operation of the pump, and identify any technical problems that may hinder performance, such as worn out material (valve, leather, etc) which may not easily be detected by the a new and inexperienced user. After these visits, users are expected to make their own repairs, which may be supervised by field agents or manufacturer’s representatives.
5.34 Naugle (2000) reports that under the Petite irrigation privée (PIP), about 330 pumps
were sold between 1997 and 1999, following 44 market demonstrations and 109 site demonstrations, which was attended by over seven thousand people. A survey by Cambell and Hyman (2000) revealed that some of the manufacturers did far better than others. Out of five trained manufacturers covered in their sample, one of the manufacturers produced nearly half of the pumps (47%) covered in the survey, the second produced about 22%, and the third and fourth produced about 14% each, and the last produced 3%. Details of activities and successes of the Niger project are summarised in Table 2 below (Naugle, 2000).
Table 2:Implementation results of EnterpriseWorks activities in Niger (1997 – 1999)
Activities 1997 1998 1999 Total Price (US $)
Training activities: workshops 5 5 3 13 Na trained artisans 12 13 4 29 Na

482
Treadle pumps sold: pressure 14 55 12 81 100 Suction 8 70 50 128 100 Manual 4 86 31 121 130 Demonstrations: markets 21 14 9 44 Na Sites 53 61 5 109 Na People attending: >2800 >3000 >1500 >7300 Na
Source: Naugle, 2000 (pages 45–46); na = not applicable Impacts 5.35 Adoption of treadle pumps by farmers using traditional means of irrigation in Niger
has resulted in significant positive impacts, in terms of improvement of labour efficiency, increase in area under cultivation, cropping intensity and production volume, and increase in farm income. In the same survey, Cambell and Hyman (2000) found that about 18% of treadle pumps were used on market gardens where hired labour was employed, while the rest largely depended on unpaid family labour. Adoption of treadle pump improved the efficiency of labour by reducing both the number of required farm workers and working hours. In particular, labour time in lifting and distributing water decreased significantly. Before the pump, irrigation tanks required about 129 person-hours per week, which fell to about 76 after the pump, a reduction of 53 person hours per pump per week (Cambell and Hyman, 2000). This led to a 23% decrease of labour time for adults (men and women), and 25% and 29% for male and female youths respectively. Despite the decrease in labour requirements, daily wage rates for hired labour on the farms, which averaged at US $0.64 per person per day, did not change at all. This change in labour did not lead wage labourers to move away from the farms. The aggregate increases in farm sizes due to the pump created an avenue for absorbing the extra labour, which had an overall positive welfare effects both for the gardeners (increase in farm sizes and income) and for the wage workers (more wage work).
5.36 Cambell and Hyman (2000) also assessed impacts in terms of changes in farm size
(size of planted area), and recorded an increase of between 130% to over 200%. Despite the relative small sizes of cultivated areas, these increases in cultivated area had significant positive impacts on farm income. Farm sizes on the average increased by about 1.24 square meters, an average increase of about 140%. The aggregate effects of the introduction of treadle pumps on farm size and labour as assessed by Cambell and Hyman (2000) is presented in Table 3.
Table 3: Garden size, labour force and hours of work before and after pump Estimated averages values per pump 29 Market gardens, 31 pumps, pre-existing gardeners
VARIABLE Before the pump After the pump
Actual change
Percentage change (%)
Planted area (hectares) 0.076 0.183 0.108 142.1 Labour force (workers) 1.06 1.09 0.03 2.8 Labour (hours) 32.24 18.96 13.28 41.2 33 market gardens, 36 pumps, all gardeners Planted area (hectares) 0.067 0.180 0.113 168.7 Labour force (workers) 0.91 1.03 0.12 13.2 Labour (hours) 30.52 19.69 10.81 35.4 Source: Cambell and Hyman, 2000 5.37 Input use was also reported to have increased significantly, in most cases more than
100%. This is partly due to increased size of cultivated area which on the one hand

483
raised the need for more fertilizer, and on the other hand increased farm income to facilitate application of more farm inputs. Overall, farmers’ net income was reported to have increased by 130% to over 700% depending on whether or not the opportunity costs of family labour as well as other in-kind farm services were considered Cambell and Hyman (2000). That is, in all cases, farmers’ incomes were found to have doubled as a result of adoption of the treadle pump. The total annual income for gardeners generally increased from about $200 per year before pump adoption, to about $500 per year after the pump.
The Soka Pump project of in Ghana 5.38 Building on experiences elsewhere in West Africa, EW developed the local
manufacturing capacity of low cost treadle pumps branded in Ghana as SOKA pump. Funds for the two-year project were provided by USAID and implementation activities commenced in early 2002. The goal of the irrigated horticulture project is to alleviate poverty by increasing the income of small-scale market gardeners and artisans. Local small-scale engineering/artisan shop owners are trained in the manufacture of the pumps which are designed to make use of local materials and fabrication techniques. The pumps are marketed actively to a point where not only the project’s primary targets are met but to a level where, by the end of the project, demand for new pumps will be large enough to ensure the commercial viability and self-financed continuity of the supply chain in the areas targeted.
Principal project activities include:
• The selection of equipment manufacturers and their training in the production of the treadle pump
• Product promotion and commercialisation • Training of farmers in the use of pumps and in irrigated agricultural practices • Promotion and technology transfer through mass media, farm demonstrations etc • Environmental monitoring • Impact tracking system
5.39 To achieve the main project goal of increasing the income levels of small-scale
market gardeners through access to affordable irrigation technologies, the goal was set at the following targets to be met by end of 2004: sales of 450 SOKA pumps; increasing income levels of small scale gardeners by US $431 per pump per year; training 10 local artisans/metal fabricators in the manufacturing and marketing of the pumps; and conducting at least 100 on-farm demonstrations.
Implementation Process of the SOKA Pump Project 5.40 Three water-lifting options are currently available to the Ghanaian dry season
gardener – the traditional rope and bucket method, the motorized pump and the treadle pump (in particular the SOKA pump). Common water sources include wells, rivers and/or streams. The rope and bucket technique is very arduous and time consuming, allowing for a flow/distribution rate of only about 1,000 litres of water per hour. In the last 10 years, Ghana has experienced increases in the number of motorized pumps, although they are still limited in number due to the high capital and operating costs. A gasoline engine driven-pump of reasonable size (e.g. 4 HP) is currently commercialised in Ghana at a price at US$500, excluding suction and distribution pipes (EnterpriseWorks, 2004). The high operation costs and small land sizes further compromise the financial viability of such pumps in irrigated vegetable production. Maintenance and repair of such pumps also sometimes require travel over considerable distances in search of expertise and spare parts, especially engine parts, which are not always readily available (EnterpriseWorks, 2004).
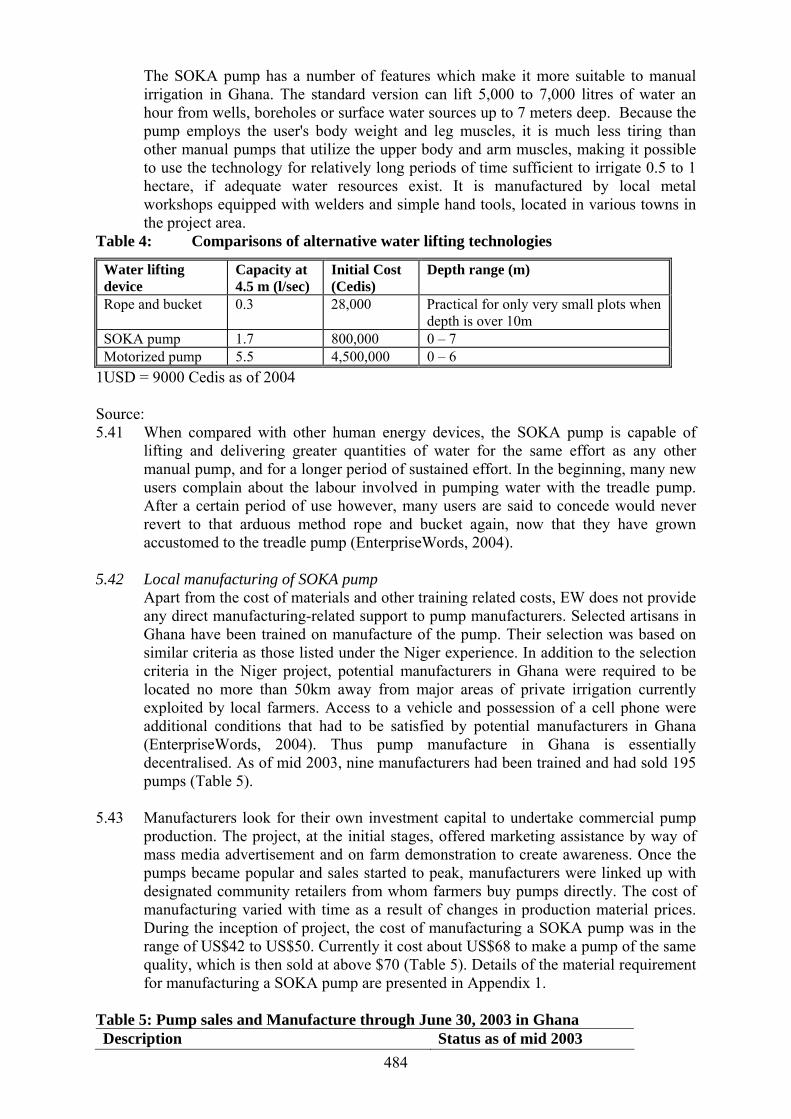
484
The SOKA pump has a number of features which make it more suitable to manual irrigation in Ghana. The standard version can lift 5,000 to 7,000 litres of water an hour from wells, boreholes or surface water sources up to 7 meters deep. Because the pump employs the user's body weight and leg muscles, it is much less tiring than other manual pumps that utilize the upper body and arm muscles, making it possible to use the technology for relatively long periods of time sufficient to irrigate 0.5 to 1 hectare, if adequate water resources exist. It is manufactured by local metal workshops equipped with welders and simple hand tools, located in various towns in the project area.
Table 4: Comparisons of alternative water lifting technologies
Water lifting device
Capacity at 4.5 m (l/sec)
Initial Cost (Cedis)
Depth range (m)
Rope and bucket 0.3 28,000 Practical for only very small plots when depth is over 10m
SOKA pump 1.7 800,000 0 – 7 Motorized pump 5.5 4,500,000 0 – 6
1USD = 9000 Cedis as of 2004 Source: 5.41 When compared with other human energy devices, the SOKA pump is capable of
lifting and delivering greater quantities of water for the same effort as any other manual pump, and for a longer period of sustained effort. In the beginning, many new users complain about the labour involved in pumping water with the treadle pump. After a certain period of use however, many users are said to concede would never revert to that arduous method rope and bucket again, now that they have grown accustomed to the treadle pump (EnterpriseWords, 2004).
5.42 Local manufacturing of SOKA pump
Apart from the cost of materials and other training related costs, EW does not provide any direct manufacturing-related support to pump manufacturers. Selected artisans in Ghana have been trained on manufacture of the pump. Their selection was based on similar criteria as those listed under the Niger experience. In addition to the selection criteria in the Niger project, potential manufacturers in Ghana were required to be located no more than 50km away from major areas of private irrigation currently exploited by local farmers. Access to a vehicle and possession of a cell phone were additional conditions that had to be satisfied by potential manufacturers in Ghana (EnterpriseWords, 2004). Thus pump manufacture in Ghana is essentially decentralised. As of mid 2003, nine manufacturers had been trained and had sold 195 pumps (Table 5).
5.43 Manufacturers look for their own investment capital to undertake commercial pump
production. The project, at the initial stages, offered marketing assistance by way of mass media advertisement and on farm demonstration to create awareness. Once the pumps became popular and sales started to peak, manufacturers were linked up with designated community retailers from whom farmers buy pumps directly. The cost of manufacturing varied with time as a result of changes in production material prices. During the inception of project, the cost of manufacturing a SOKA pump was in the range of US$42 to US$50. Currently it cost about US$68 to make a pump of the same quality, which is then sold at above $70 (Table 5). Details of the material requirement for manufacturing a SOKA pump are presented in Appendix 1.
Table 5: Pump sales and Manufacture through June 30, 2003 in Ghana Description Status as of mid 2003

485
Pumps sold 195 Pumps sold in southern region 84 Pumps sold in Northern region 111 Number of artisans manufacturing SOKA pump 9 Apprentices employed for pump manufacture 3 Average cost of one SOKA Pump 71 (US$) Total gross sales income to pump manufacturers 13,765 (US$)
Source: Annual report 2003, Enterprise Works Ghana Marketing 5.44 Initially the pumps were retailed at about US$67 per unit. However, increasing
production costs have raised the unit costs considerably to the extent that in early 2004, the SOKA pump was going for about US$88. In some cases however, middlemen are hired to assist in sales without further increases in retail price, while the manufacturers share their profit with the retailers. In certain areas however, e.g. around Kumasi, some agro-chemical shops retail the pumps at prices

486
Table 6: Evaluation processes and performance indicators Indicators
Type of indicator
Type of data
Source of data
Methodology
Data collection Frequency
Data collection, analysis, reporting
Change in annual income of small scale market gardeners
Performance
Quantitative
Farmers, extension agents
Formal surveys102 Seasonal Monitoring and Evaluation (M & E)a
Number of pumps sold Performance Quantitative Manufacturers Sales records103 Monthly Monitoring and
Evaluation a Selling price of pumps Performance Quantitative Manufacturers Sales records Monthly Gross income from sales Performance Quantitative Manufacturers Formal surveys Manufacturers trained and employment created
Processes and outputs
Quantitative Component manager, trainers manufacturers
Direct observation at training, formal interviews with pump manufacturers & component Manager
Monthly Monitoring and Evaluation (M & E)
Number of new gardeners employed during dry season
Performance
Quantitative
Farmers, extension agents
Farm Visit direct observation, formal farmer interviews
Monthly
M&E, extension agents
Number of Farm demonstration conducted
Process Quantitative Component manager, pump trainers
Direct observation, pump trainer, component manager
Monthly M&E in consultation with component manager
a consultation with component managers and extension agents Source:
102 An in-depth study to determine the average change in annual income per acre of irrigated farm as said to be in the pipeline as benchmark for impact studies. Secondary data on farm budget could be obtained from the Ministry of Food and Agriculture (MOFA) for comparative studies or non-adopters of EW pumps can be used as a control measure. 103 Stake holders need to understand the objectives of the project and the need to keep records and give reliable information. Establish permanent contract with farmers through extension –farmer linkages or EW staff-farmer linkages and regular farm visits.
487
that are as high as US$110 (EnterpriseWorks, 2004). Pricing of the SOKA pump is not strictly controlled by EW, though some effort is made to ensure that pumps are not too overcharged.
Monitoring and Evaluation 5.45 In a recent report, EW states that it uses an Impact Tracking System (ITS) for internal
and external reporting purposes (See Table 6). EW’s ITS report provides the organization with information to facilitate decision-making, and provides its donors with information to determine whether targets are being achieved or not. As part of the monitoring strategies, independent firms are hired to conduct independent surveys for EW. The tracking system shows how EW is capacitating increasing numbers of small-scale farmers and manufacturers to increase their income, disaggregating this information by gender when possible (EnterpriseWorks, 2004). EW-Ghana has completed its second impact survey of the key impacts of the proposed project by using a standard set of indicators to measure progress.
Staffing 5.46 EW irrigated horticultural project is primarily managed by a team which is made up of
a technical trainer, 3 marketing officers, a monitoring specialist and a project coordinator. Except for the marketing officers, two of whom are located in Kumasi and one Tamale, the rest are based in Accra. Initially, extension agents from the Ministry of Food and Agriculture (MoFA) were hired on commission-on sales basis and attached to manufacturers in their respective areas. They were tasked to conduct on-farm demonstrations, marketing and monitoring of pumps from manufacturers workshops as well as creating linkages between manufacturers and prospective buyers. However the program strategy had to change to improve upon sales performance. Full time permanent sales officers were then employed to embark on aggressive mobile marketing strategy and effective pump user monitoring efforts (EnterpriseWorks, 2004).
Quality control 5.47 EnterpriseWorks-Ghana has in place a comprehensive monitoring system for checking
the quality of pumps manufactured and sold. Monthly visits to all manufacturing shops and regular field visits to farmers using the pumps enable EW to check manufacturing shortcomings and offer the appropriate technical advice to correct them. Most manufacturers abide by EW’s quality codes and ensure that every pump from their outfits is rigorously tested and certified before being sold (EnterpriseWorks, 2004). During quality control monitoring, pumps that do not meet standards are withdrawn from shops or farms and returned to the manufacturer concerned for the appropriate corrections to be made.
Implementation Partners
5.48 EW has collaborated with several governmental organizations and other development partners involved in agricultural and other food security programs. Notable amongst these organizations are MOFA, OICI, WI and UNICEF. Collaborative partners are numerous and entail both national and international collaborators. An exhaustive list of partners and their respective roles in the implementation of the SOKA Pump project are presented in Appendix 2.
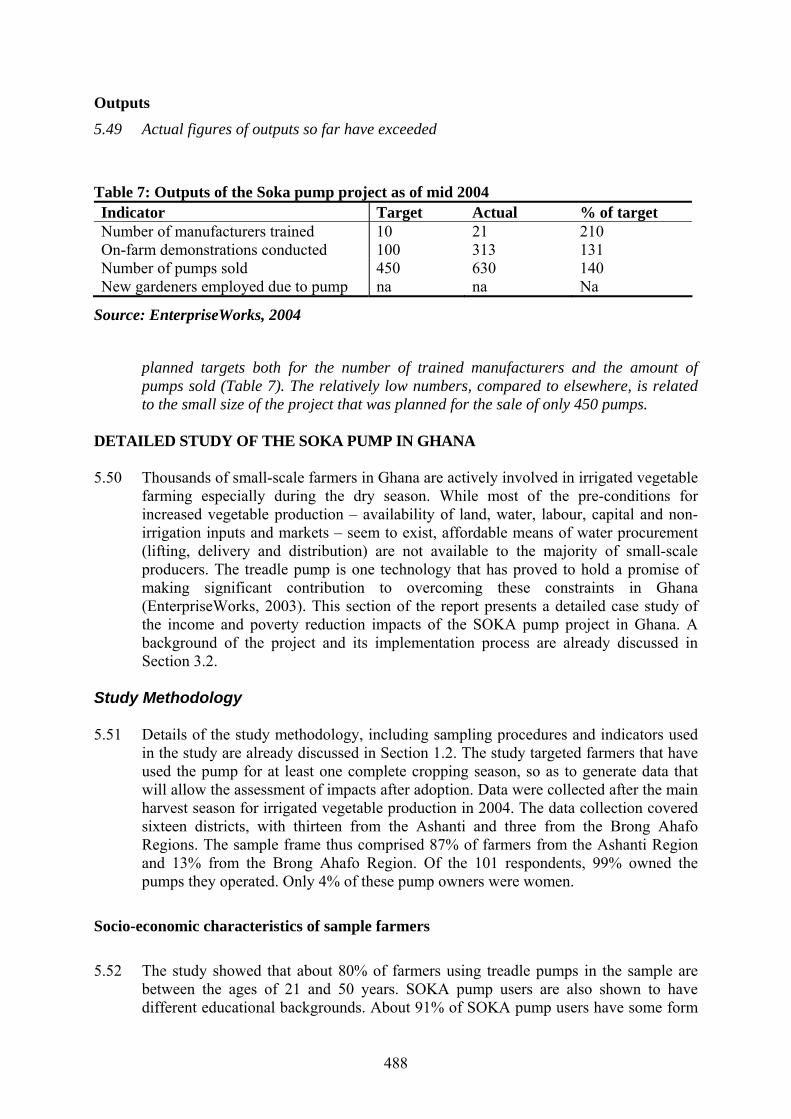
488
Outputs
5.49 Actual figures of outputs so far have exceeded
Table 7: Outputs of the Soka pump project as of mid 2004 Indicator Target Actual % of target Number of manufacturers trained 10 21 210 On-farm demonstrations conducted 100 313 131 Number of pumps sold 450 630 140 New gardeners employed due to pump na na Na
Source: EnterpriseWorks, 2004
planned targets both for the number of trained manufacturers and the amount of pumps sold (Table 7). The relatively low numbers, compared to elsewhere, is related to the small size of the project that was planned for the sale of only 450 pumps.
DETAILED STUDY OF THE SOKA PUMP IN GHANA 5.50 Thousands of small-scale farmers in Ghana are actively involved in irrigated vegetable
farming especially during the dry season. While most of the pre-conditions for increased vegetable production – availability of land, water, labour, capital and non-irrigation inputs and markets – seem to exist, affordable means of water procurement (lifting, delivery and distribution) are not available to the majority of small-scale producers. The treadle pump is one technology that has proved to hold a promise of making significant contribution to overcoming these constraints in Ghana (EnterpriseWorks, 2003). This section of the report presents a detailed case study of the income and poverty reduction impacts of the SOKA pump project in Ghana. A background of the project and its implementation process are already discussed in Section 3.2.
Study Methodology 5.51 Details of the study methodology, including sampling procedures and indicators used
in the study are already discussed in Section 1.2. The study targeted farmers that have used the pump for at least one complete cropping season, so as to generate data that will allow the assessment of impacts after adoption. Data were collected after the main harvest season for irrigated vegetable production in 2004. The data collection covered sixteen districts, with thirteen from the Ashanti and three from the Brong Ahafo Regions. The sample frame thus comprised 87% of farmers from the Ashanti Region and 13% from the Brong Ahafo Region. Of the 101 respondents, 99% owned the pumps they operated. Only 4% of these pump owners were women.
Socio-economic characteristics of sample farmers 5.52 The study showed that about 80% of farmers using treadle pumps in the sample are
between the ages of 21 and 50 years. SOKA pump users are also shown to have different educational backgrounds. About 91% of SOKA pump users have some form
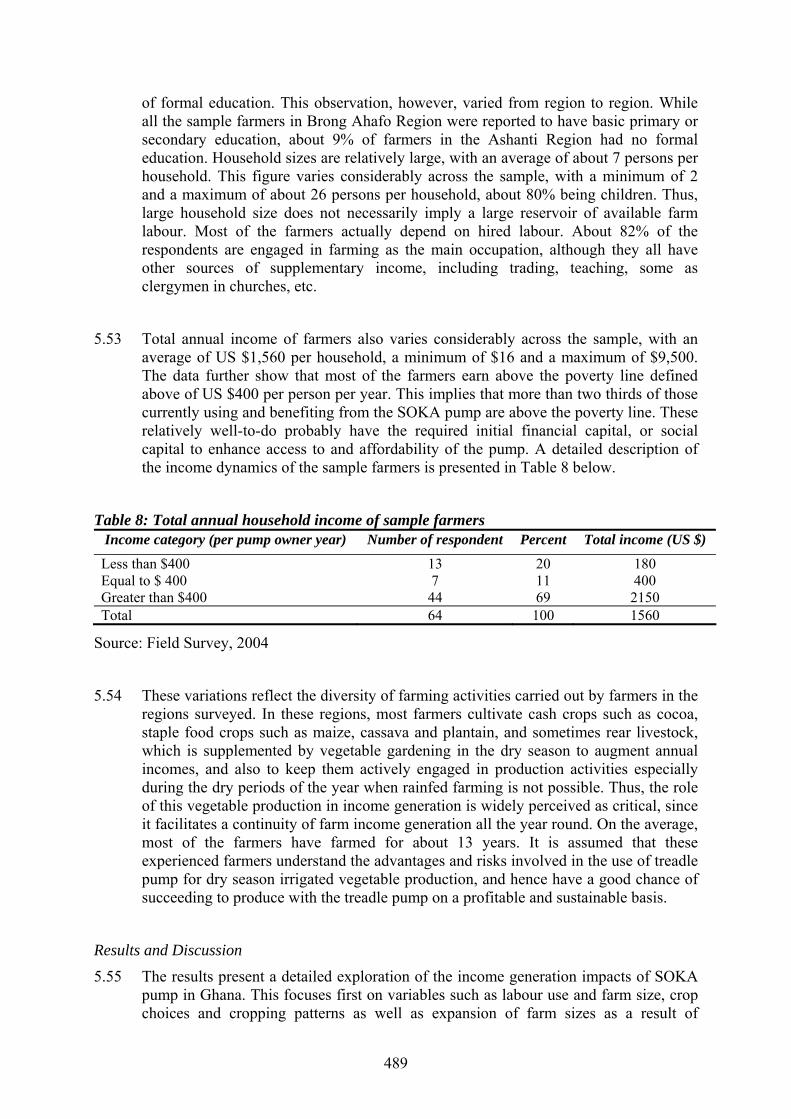
489
of formal education. This observation, however, varied from region to region. While all the sample farmers in Brong Ahafo Region were reported to have basic primary or secondary education, about 9% of farmers in the Ashanti Region had no formal education. Household sizes are relatively large, with an average of about 7 persons per household. This figure varies considerably across the sample, with a minimum of 2 and a maximum of about 26 persons per household, about 80% being children. Thus, large household size does not necessarily imply a large reservoir of available farm labour. Most of the farmers actually depend on hired labour. About 82% of the respondents are engaged in farming as the main occupation, although they all have other sources of supplementary income, including trading, teaching, some as clergymen in churches, etc.
5.53 Total annual income of farmers also varies considerably across the sample, with an average of US $1,560 per household, a minimum of $16 and a maximum of $9,500. The data further show that most of the farmers earn above the poverty line defined above of US $400 per person per year. This implies that more than two thirds of those currently using and benefiting from the SOKA pump are above the poverty line. These relatively well-to-do probably have the required initial financial capital, or social capital to enhance access to and affordability of the pump. A detailed description of the income dynamics of the sample farmers is presented in Table 8 below.
Table 8: Total annual household income of sample farmers Income category (per pump owner year) Number of respondent Percent Total income (US $)
Less than $400 13 20 180 Equal to $ 400 7 11 400 Greater than $400 44 69 2150 Total 64 100 1560
Source: Field Survey, 2004
5.54 These variations reflect the diversity of farming activities carried out by farmers in the
regions surveyed. In these regions, most farmers cultivate cash crops such as cocoa, staple food crops such as maize, cassava and plantain, and sometimes rear livestock, which is supplemented by vegetable gardening in the dry season to augment annual incomes, and also to keep them actively engaged in production activities especially during the dry periods of the year when rainfed farming is not possible. Thus, the role of this vegetable production in income generation is widely perceived as critical, since it facilitates a continuity of farm income generation all the year round. On the average, most of the farmers have farmed for about 13 years. It is assumed that these experienced farmers understand the advantages and risks involved in the use of treadle pump for dry season irrigated vegetable production, and hence have a good chance of succeeding to produce with the treadle pump on a profitable and sustainable basis.
Results and Discussion
5.55 The results present a detailed exploration of the income generation impacts of SOKA pump in Ghana. This focuses first on variables such as labour use and farm size, crop choices and cropping patterns as well as expansion of farm sizes as a result of

490
increased access to water. This is then followed by assessing costs and net benefits resulting from changes, as well as expenditure patterns of the additional income acquired from the pumps on indicators for wellbeing.
Channels of Pump Acquisition 5.56 The prevalent methods of irrigation in the Brong Ahafo and Ashanti Regions are
traditional, largely employing watering cans and bucket systems. Through the outreach initiative of EW, 52% of farmers in the study area have been able to acquire treadle pumps. Field demonstrations and media campaigns were the two main strategies used by EW in the regions to reach the target farmers. Another effective dissemination channels was informal discussion and conversation with neighbours (among farmers), through which about a quarter of the sample farmers claimed to have had the motivation to acquire the pumps. About 9% of farmers using the pump heard about it through agricultural extension agents, while 14% got to know about the pump from a combination of the above instruments.
5.57 Nearly all the farmers using treadle pumps claimed to have acquired them directly from EW at a cost of about US $140 per unit pump, of which 47% is the unit price of the pump. Since access to credit for farming activities in these regions is difficult even for large-scale farmers due to collateral demands, most of the farmers bought the pumps (cash) with the income generated from previous farming activities (72%). About 12% of pump owners acquired loans from friends or relatives to buy the pump, 10% took loans from financial institutions while 8% got the pumps from EW and paid by instalment, or took loans from local religious groups.
5.58 Almost all the farmers bought the pump for irrigation purposes, with specific reasons that relate to the easing of various irrigation activities. The specific reasons for acquiring the pumps as explained by the respondents are highlighted in Figure 2. About 71% of the farmers claimed to have bought the pump to reduce the high intensity of labour involved in irrigation, and to increase farm sizes so as to better respond to the high demand for vegetable during the dry season. These are reasonable explanations that further reflect the market-oriented nature of vegetable production in these regions. Only 10% of the farmers were found to be using motorized pumps.
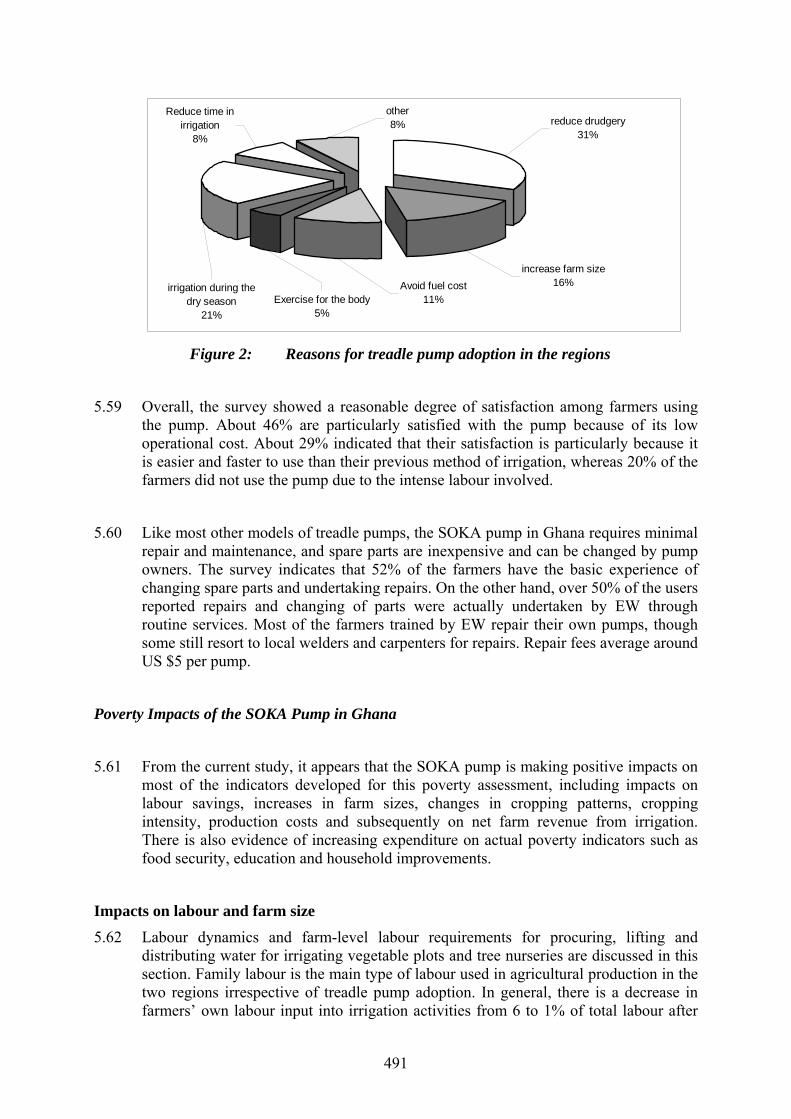
491
Exercise for the body5%
reduce drudgery31%
increase farm size16%Avoid fuel cost
11%irrigation during the
dry season21%
Reduce time in irrigation
8%
other8%
Figure 2: Reasons for treadle pump adoption in the regions
5.59 Overall, the survey showed a reasonable degree of satisfaction among farmers using the pump. About 46% are particularly satisfied with the pump because of its low operational cost. About 29% indicated that their satisfaction is particularly because it is easier and faster to use than their previous method of irrigation, whereas 20% of the farmers did not use the pump due to the intense labour involved.
5.60 Like most other models of treadle pumps, the SOKA pump in Ghana requires minimal repair and maintenance, and spare parts are inexpensive and can be changed by pump owners. The survey indicates that 52% of the farmers have the basic experience of changing spare parts and undertaking repairs. On the other hand, over 50% of the users reported repairs and changing of parts were actually undertaken by EW through routine services. Most of the farmers trained by EW repair their own pumps, though some still resort to local welders and carpenters for repairs. Repair fees average around US $5 per pump.
Poverty Impacts of the SOKA Pump in Ghana
5.61 From the current study, it appears that the SOKA pump is making positive impacts on
most of the indicators developed for this poverty assessment, including impacts on labour savings, increases in farm sizes, changes in cropping patterns, cropping intensity, production costs and subsequently on net farm revenue from irrigation. There is also evidence of increasing expenditure on actual poverty indicators such as food security, education and household improvements.
Impacts on labour and farm size 5.62 Labour dynamics and farm-level labour requirements for procuring, lifting and
distributing water for irrigating vegetable plots and tree nurseries are discussed in this section. Family labour is the main type of labour used in agricultural production in the two regions irrespective of treadle pump adoption. In general, there is a decrease in farmers’ own labour input into irrigation activities from 6 to 1% of total labour after

492
the adoption of the treadle pump (Figure 3). On the contrary, hired labour use is observed to record a 10% increase, due to the extra labour requirement to operate the pump, which is sought either from relatives or hired labour to supplement the existing labour force for irrigation.
05
10152025303540
Type of labour
perc
enta
ge
self family hired self &hired self&hired&family self&family
Figure 3: Type of labour use before and after pump adoption
5.63 Most farmers do not directly pay for family labour or labour from relatives, though
sometimes they do so in kind. Hired labour use to operate pumps is very common. Overall, about 65% of pump users employed hired labour to operate the pumps, with an average wage of about US$2 a day104. The SOKA pump had a significant positive impact on improving the efficiency of labour use. In general, a 34% decrease in the total number of hours used in irrigation after the adoption of the SOKA pump is noted. Due to expansion of farm sizes and cultivated area, this reduction had an overall positive welfare effect since the labour saved could be utilized to increase farming activities – increases in cultivated area and thus increase in the labour force required for irrigation. The dynamics of labour relations and requirements before and after the treadle pump, disaggregated by gender are highlighted in Table 9.
Table 9: Change in Average labour and farm size with and without Treadle pump
Averages before/after pump Changes t-values
Category N before N after actual % before after
Farm size 87 1.07 77 1.79 0.72 68 11.14 16.60a
Labour for irrigation: men 86 2.0 82 3.0 1.0 50 12.343 13.105a
Labour for irrigation: women
47 2.26 39 2.06 0.20 9 9.43 5.91a
Labour: person hours per day
79 6.85 81 4.54 2.31 34 6.848 4.623a
N = number of respondents a = 1% significant at level.
104 The average irrigation season for the treadle pump owners is about 7 months, with an average of 4 days per week.
493
5.64 Of the 77 pump users who cultivated vegetables during the year before they bought the pump, 67% actually expanded their farm sizes. The increase in farm size is what results in the increased demand for farm labour for irrigation and other activities such as land preparation, weeding and harvesting. Therefore an important income and poverty reduction impact of the adoption of SOKA pump in Ghana has thus been recorded in increased farm sizes for farmers, reduction in total labour time for irrigation (more efficient utilization of labour), and an aggregate increase in the demand for hired farm labour which actually translate into job opportunities for landless wageworker. That is, reallocation of saved time to other productive activities, and employment of more labour force in agriculture due to pump-enhanced production expansion.
5.65 Women are less often involved in SOKA pump operation, which was said to be due to the severity of work it requires. In the current survey, 70% of the farmers indicated that they did not involve women in irrigation because of the drudgery involved in SOKA pump operation, and found that pumping is too difficult for women. Female labour is mainly used for weeding and harvesting, and in general women receive a relatively lower daily wage than men. This may have important gender implications, both positive and negative. Positive because the pump facilitates expansion of cropped areas and hence creates more jobs (weeding and harvesting) which is done mostly by daily waged women, and negative because men get higher daily wages than women since their work of pump operation is often thought to be more arduous. Some of the women farmers owning SOKA pumps do not operate it themselves, but use male family members or hired male labour to operate the pump instead.
Impacts on crops and cropping pattern
5.66 Treadle pumps in the area are used to produce conventional vegetables, with few instances of exotic crops, and sometimes livestock. Overall, about 16 different crops are cultivated by treadle pump-users in the area (Figures 4), including vegetables and tree nursery, and some for livestock production. Most of the vegetables are cultivated all the year round. In the dry season however, the production of most water intensive vegetables is severely constrained without access to efficient water procurement, lifting, and distribution technologies, such as the treadle pump, helping farmers to diversify crops and intensify production even in the dry season.

494
garden eggs,tomaotoes,
okro,pepper,32%
indigenous1%
nursery8%
spring onions6%
okro3%
garden eggs2%
tomatoes4%
hot pepper3%
carrots2%
cabbage4%
lettuce,cabbage,green
pepper,carrots,spring onions
10%
indigenous&exotic25%
Figure 4: Crops cultivated with treadle pump
5.67 Overall, 50% of the farmers now cultivate at least two crops in the dry season, which is facilitated by access to waste water with the pump. Cultivation practices have also improved (e.g. row planting is adopted) as a result of pump adoption.
Impacts on production cost and revenues 5.68 The total cost of production prior to the pump adoption was estimated at prices
adjusted to current year prices. As a result, the net average revenues were calculated and adjusted to current year input prices. The calculation also assumed that the quantity of input use in previous years (per ha) is constant and thus proportional to cultivated area. From the assessment, land preparation recorded the highest seasonal average cost, followed by costs of chemical fertilizers. Overall, farmers increased their farm expenditure on inputs from US $273 to US $439 after the pump. This was largely due to expanded farm sizes and hence more need for inputs.
5.69 The results further indicate that access to treadle pumps has enabled most of the farmers to realize increased crop yields. The estimated gross revenues prior to the adoption of the pump reflects what the farmers would have earned if external factors (crops prices, yields, crop choices, etc.) remained constant. Before the pump, the average total gross revenue generated by irrigated vegetable farmers was US $454. With the advent of the SOKA pump, average gross revenue increased significantly to US $882 (see Table 10). This increase in farm income is seen as a direct opportunity for farmers to intensify production by investing in farm inputs, employ more labour for irrigation and land preparation, expand farm sizes and realize profit enhancing economies of scale. These effects have a considerable potential for creating avenues and opportunities for farmers to get out of poverty. Similar benefits have been reported in other countries where treadle pumps have been introduced, including other parts of

495
African and Asia (Polak et al., 2000; Polak, 2003; Shah, T. et al., 2002). In Niger for instance, the introduction of treadle pumps enabled farmers to increase their annual income by over 250% (Neighbor and Sellen, 2002). That is, from US $170 to about US $440, which is three times more than the average annual per capita income of Nigeriens. Farm sizes were also reported to have increased among treadle pump users in Niger by over 60% (Neighbor and Sellen, 2002).
5.70 In Senegal, Hyman et al. (1995) reported that expanded surface area under irrigation and greater yields have capacitated market-oriented Senegalese gardeners to realize net income gains of about US $850, a return of 750% on the original investment of US $100 in the treadle pump. The study on Senegal further indicated an increase in farm size of about 40% and a reduction in irrigation time from 12 person-hours per day to slightly more than 4 person-hours per day, which altogether had a remarkable impact on the profitability of more than 1,400 agricultural enterprises. Although income increases reported in the current study are not as high as those reported in Niger and Senegal, increases in gross revenues of over 100% resulting from the adoption of treadle pumps are very reasonable to have significant income generating impacts.
Table 10: Net revenue change before and after adoption of treadle pump
Farming system
Variable
Before treadle pump adoption
After pump adoption
Average gross revenues 454.14 (3.07a) 882.24(5.79a)
Average total cost 273.09 438.98
Vegetables
Production
Net revenues 181.05 443.26
Average gross revenues 1483.34(2.584b) 1605.56(3.530a)
Average total cost 238.72 477.43
Tree nursery
Net revenues 1244.62 1128.13
5.71 The extra revenue was largely reinvested by farmers into various activities such as
farm expansion, supporting family members and paying school fees for children. About 25% of the farmers invested in household improvements and assets, and some in the acquisition other farm assets. These investments in household improvements and additional farm assets should be seen as real indicators of positive impacts. Usually, it is only after saving over and above subsistence requirements that investments in household improvement get prioritised. Investment in other farm assets is also a positive indicator of farm capital accumulation, which will also generate returns on the long-term. Investment in education – paying school fees, etc. – is an investment in human capital creation, which in itself is an indicator of positive poverty impacts: access to education, and in some cases also health.
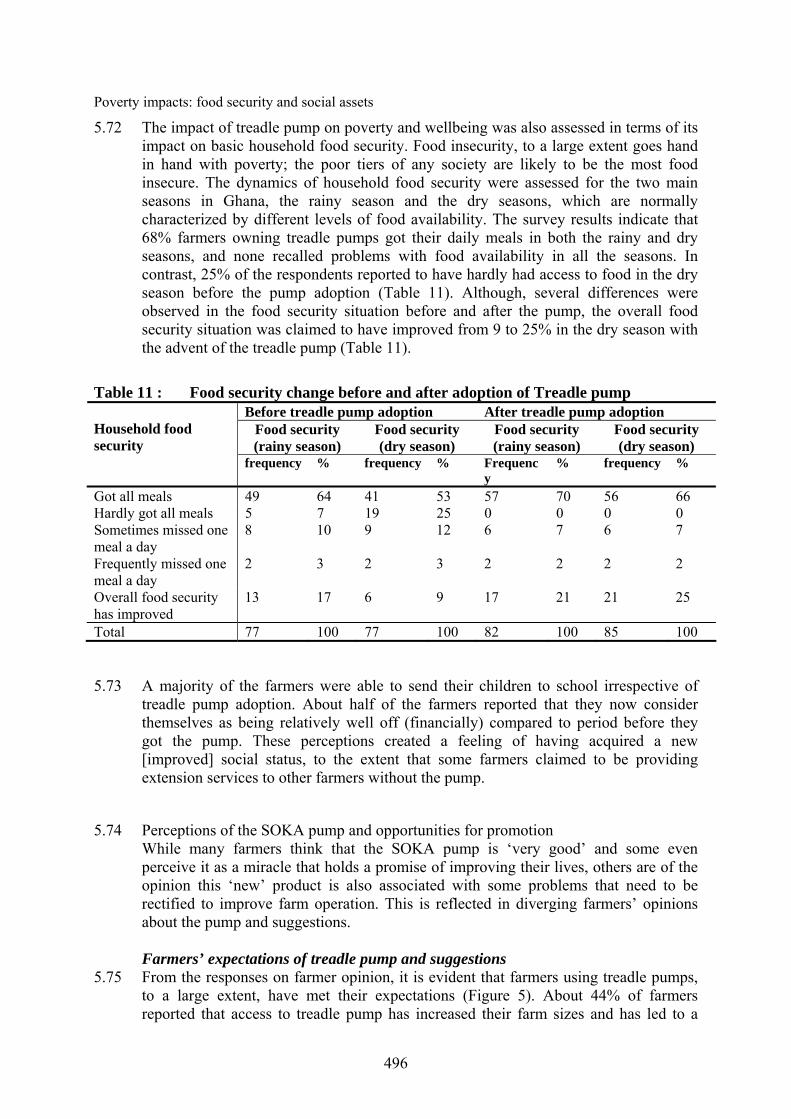
496
Poverty impacts: food security and social assets
5.72 The impact of treadle pump on poverty and wellbeing was also assessed in terms of its impact on basic household food security. Food insecurity, to a large extent goes hand in hand with poverty; the poor tiers of any society are likely to be the most food insecure. The dynamics of household food security were assessed for the two main seasons in Ghana, the rainy season and the dry seasons, which are normally characterized by different levels of food availability. The survey results indicate that 68% farmers owning treadle pumps got their daily meals in both the rainy and dry seasons, and none recalled problems with food availability in all the seasons. In contrast, 25% of the respondents reported to have hardly had access to food in the dry season before the pump adoption (Table 11). Although, several differences were observed in the food security situation before and after the pump, the overall food security situation was claimed to have improved from 9 to 25% in the dry season with the advent of the treadle pump (Table 11).
Table 11 : Food security change before and after adoption of Treadle pump
Before treadle pump adoption After treadle pump adoption Food security (rainy season)
Food security (dry season)
Food security (rainy season)
Food security (dry season)
Household food security
frequency % frequency % Frequency
% frequency %
Got all meals 49 64 41 53 57 70 56 66 Hardly got all meals 5 7 19 25 0 0 0 0 Sometimes missed one meal a day
8 10 9 12 6 7 6 7
Frequently missed one meal a day
2 3 2 3 2 2 2 2
Overall food security has improved
13 17 6 9 17 21 21 25
Total 77 100 77 100 82 100 85 100
5.73 A majority of the farmers were able to send their children to school irrespective of treadle pump adoption. About half of the farmers reported that they now consider themselves as being relatively well off (financially) compared to period before they got the pump. These perceptions created a feeling of having acquired a new [improved] social status, to the extent that some farmers claimed to be providing extension services to other farmers without the pump.
5.74 Perceptions of the SOKA pump and opportunities for promotion While many farmers think that the SOKA pump is ‘very good’ and some even perceive it as a miracle that holds a promise of improving their lives, others are of the opinion this ‘new’ product is also associated with some problems that need to be rectified to improve farm operation. This is reflected in diverging farmers’ opinions about the pump and suggestions.
Farmers’ expectations of treadle pump and suggestions
5.75 From the responses on farmer opinion, it is evident that farmers using treadle pumps, to a large extent, have met their expectations (Figure 5). About 44% of farmers reported that access to treadle pump has increased their farm sizes and has led to a
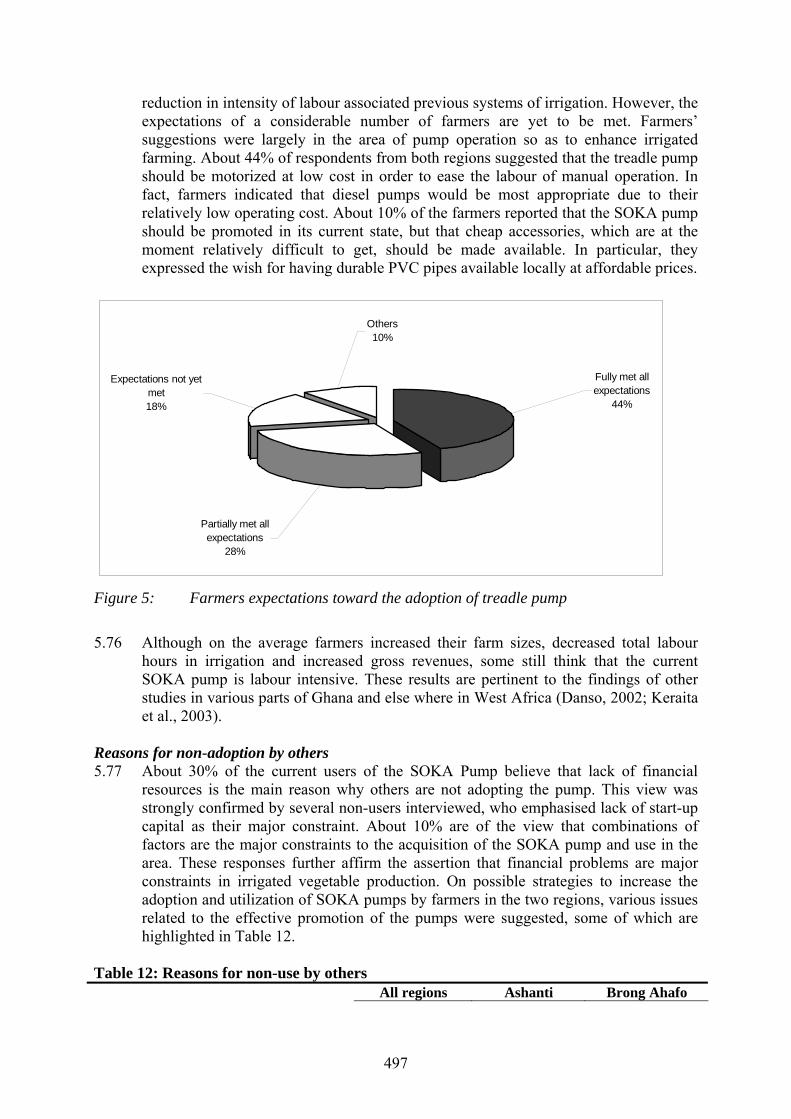
497
reduction in intensity of labour associated previous systems of irrigation. However, the expectations of a considerable number of farmers are yet to be met. Farmers’ suggestions were largely in the area of pump operation so as to enhance irrigated farming. About 44% of respondents from both regions suggested that the treadle pump should be motorized at low cost in order to ease the labour of manual operation. In fact, farmers indicated that diesel pumps would be most appropriate due to their relatively low operating cost. About 10% of the farmers reported that the SOKA pump should be promoted in its current state, but that cheap accessories, which are at the moment relatively difficult to get, should be made available. In particular, they expressed the wish for having durable PVC pipes available locally at affordable prices.
Fully met all expectations
44%
Partially met all expectations
28%
Expectations not yet met18%
Others10%
Figure 5: Farmers expectations toward the adoption of treadle pump
5.76 Although on the average farmers increased their farm sizes, decreased total labour
hours in irrigation and increased gross revenues, some still think that the current SOKA pump is labour intensive. These results are pertinent to the findings of other studies in various parts of Ghana and else where in West Africa (Danso, 2002; Keraita et al., 2003).
Reasons for non-adoption by others 5.77 About 30% of the current users of the SOKA Pump believe that lack of financial
resources is the main reason why others are not adopting the pump. This view was strongly confirmed by several non-users interviewed, who emphasised lack of start-up capital as their major constraint. About 10% are of the view that combinations of factors are the major constraints to the acquisition of the SOKA pump and use in the area. These responses further affirm the assertion that financial problems are major constraints in irrigated vegetable production. On possible strategies to increase the adoption and utilization of SOKA pumps by farmers in the two regions, various issues related to the effective promotion of the pumps were suggested, some of which are highlighted in Table 12.
Table 12: Reasons for non-use by others All regions Ashanti Brong Ahafo
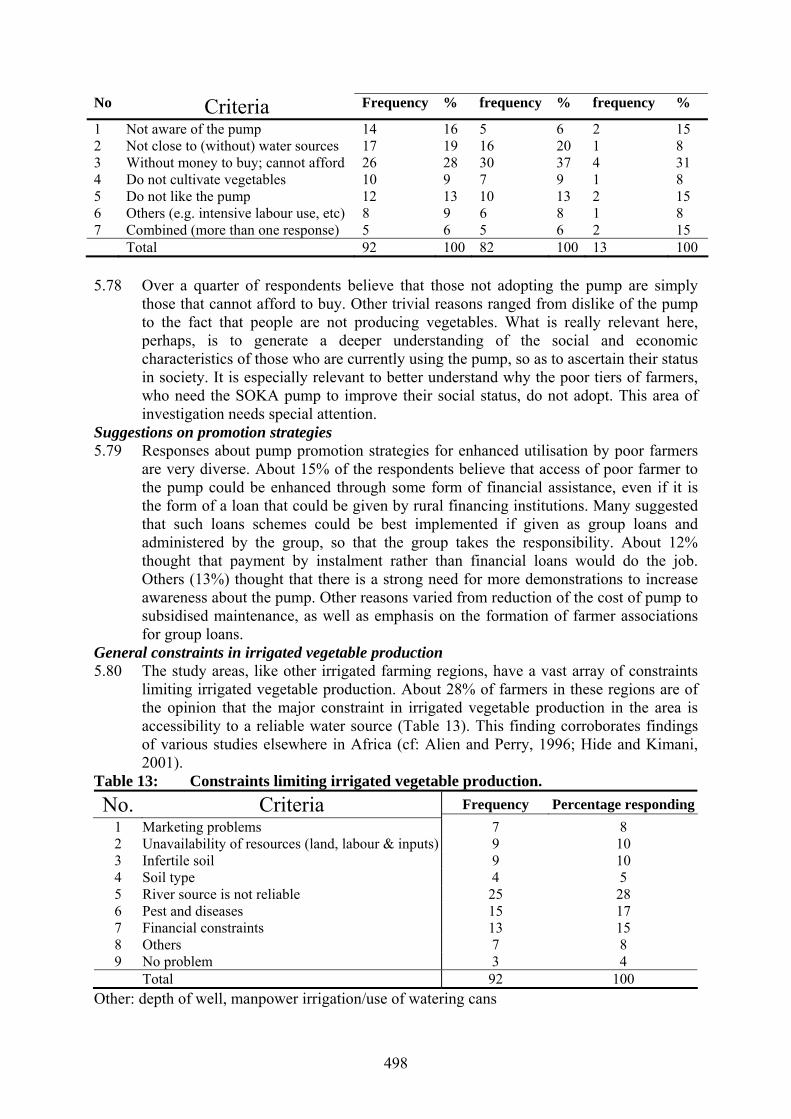
498
No Criteria Frequency % frequency % frequency %
1 Not aware of the pump 14 16 5 6 2 15 2 Not close to (without) water sources 17 19 16 20 1 8 3 Without money to buy; cannot afford 26 28 30 37 4 31 4 Do not cultivate vegetables 10 9 7 9 1 8 5 Do not like the pump 12 13 10 13 2 15 6 Others (e.g. intensive labour use, etc) 8 9 6 8 1 8 7 Combined (more than one response) 5 6 5 6 2 15 Total 92 100 82 100 13 100 5.78 Over a quarter of respondents believe that those not adopting the pump are simply
those that cannot afford to buy. Other trivial reasons ranged from dislike of the pump to the fact that people are not producing vegetables. What is really relevant here, perhaps, is to generate a deeper understanding of the social and economic characteristics of those who are currently using the pump, so as to ascertain their status in society. It is especially relevant to better understand why the poor tiers of farmers, who need the SOKA pump to improve their social status, do not adopt. This area of investigation needs special attention.
Suggestions on promotion strategies 5.79 Responses about pump promotion strategies for enhanced utilisation by poor farmers
are very diverse. About 15% of the respondents believe that access of poor farmer to the pump could be enhanced through some form of financial assistance, even if it is the form of a loan that could be given by rural financing institutions. Many suggested that such loans schemes could be best implemented if given as group loans and administered by the group, so that the group takes the responsibility. About 12% thought that payment by instalment rather than financial loans would do the job. Others (13%) thought that there is a strong need for more demonstrations to increase awareness about the pump. Other reasons varied from reduction of the cost of pump to subsidised maintenance, as well as emphasis on the formation of farmer associations for group loans.
General constraints in irrigated vegetable production 5.80 The study areas, like other irrigated farming regions, have a vast array of constraints
limiting irrigated vegetable production. About 28% of farmers in these regions are of the opinion that the major constraint in irrigated vegetable production in the area is accessibility to a reliable water source (Table 13). This finding corroborates findings of various studies elsewhere in Africa (cf: Alien and Perry, 1996; Hide and Kimani, 2001).
Table 13: Constraints limiting irrigated vegetable production. No. Criteria Frequency Percentage responding
1 Marketing problems 7 8 2 Unavailability of resources (land, labour & inputs) 9 10 3 Infertile soil 9 10 4 Soil type 4 5 5 River source is not reliable 25 28 6 Pest and diseases 15 17 7 Financial constraints 13 15 8 Others 7 8 9 No problem 3 4 Total 92 100
Other: depth of well, manpower irrigation/use of watering cans

499
5.81 A prevalence of this problem may have an influence on the up-take rate of the treadle pump in localities where these problems are observed. Other important constraints asserted were pests and diseases, which need to be given serious attention to enhance viable and profitable irrigated vegetable production. The issues of lack of water as a constraint and the incidence of pest and diseases remain controversial. While some farmers believe that the frequent watering of crops reduces the incidence of diseases, others argue that pest and disease constraints are a result of the frequent watering, since most disease-causing organisms thrive best in moist humid environments. Therefore better informing farmers to overcome these constraints is desirable and may contribute to increasing the sustainability of treadle pump use in the area. Availability of agricultural inputs is generally asserted as relevant, due to infertile soils and the increasing depth of the water table.
Conclusion from the Soka Pump Experience in Ghana 5.82 The poverty reduction impacts of the Soka Pump in Ghana have been assessed using
various indicators such as labour use efficiency, expansion of farm size, net farm income, food security and social issues. Overall there seems to be a positive impact of the introduction of the treadle pump on all these indicators, although the majority of adopters belong the relatively more privileged community members, who have the means of adopting the pumps. The gender implications of adopting the Soka Pumps also highlight limitations for potential female users.
The Soka pump and income 5.83 The study reveals that the economic benefits of introducing treadle pumps are
significant. Annual incomes of irrigated vegetable farmers have risen twice from an average of about US $454 achieved with watering cans and bucket irrigation on 1.07 acres of land, to about US $882 using treadle pumps. Similar trends are also observed with the few nursery farmers in the area, whose incomes increased by nearly two folds with the introduction of the treadle pump. These observations are a result of realized increases in productivity, expansion of irrigated area and hence larger harvests that generate more income and food for the household. The increased farm income also allows more farmers to intensify production by investing in better land preparation, labour for irrigation and more farm inputs (fertilizers, pesticides, high yielding seed varieties). Also, the availability of water and labour seem to have motivated farmers to take risks associated with the adoption of new crops, and to spare some time for other social activities – meetings, community gathering, etc, which lead to increased spheres of social networking, and subsequently generate high social capital for the community.
5.84 The additional income generated by farmers from using treadle pumps is reinvested in production activities, long-term creation of human capital (children education) as well as asset accumulation. Specifically, the additional income gained from the treadle pump is invested in: (1) farm expansion, (2) supporting other families members, (3) paying children’s school fees, (4) household improvement, and (5) farm assets. In addition, 25% of the farmers reported an overall improvement in their household food security in the dry season. The overall improvements in wellbeing also had some positive social implications, especially as regards status. Farmers who were able to augment their income and invest in the above areas had a feeling of having acquired a

500
new and better social status. As to how sustainable this new income improvement will be, requires a longer-term assessment.
Gender dimensions of the SOKA pump 5.85 On the impact of treadle pump operation on gender, about 70% of the farmers
indicated preference for male labour. About 30% of the farmers use both men and women in pump operation. When this happens, men usually pedal the pump while the women control the hose to apply water to the crops in the field. Female labour is mainly used for harvesting, whereby the women earn relatively lower daily wages. Also, even female pump-owners indicated their preference for male labour (family and/or hired) to operate the pump. Women indeed acknowledged that they find the SOKA pump difficult to operate. This difficulty also has cultural and ergonomic dimensions. Being elevated above the ground while operating the pump with an up-and-down-leg-motion often make women feel less comfortable, and in some cases makes them feel undignified especially in the presence of men. Moreover, in male-dominated farms men may prefer to carry out core tasks, such as technology related tasks, themselves. This phenomenon largely conforms to findings elsewhere, especially Zambia and Niger. In other countries, e.g. in Kenya, the pumps are mostly operated by women. Even though the pumps are bought by men, they are mostly managed and operated by women (Brabben and Kay, 2000). However, the extent to which the treadle pump should be modified to serve the interests of diverse users, including women, is yet to be given further exploration.
Multiplier effects 5.86 Being relatively new in the country, treadle pump use in Ghana may still require some
time before one can successfully trace multiplier effects across communities, and to other sectors of the economy. So far, there is evidence of some investment in education as result additional income generated by farmers using treadle pumps. However, it is difficult to ascertain the relative increase in the number of school going children due to treadle pumps. Even if it were possible to estimate numbers, it would be difficult to entirely attribute it to treadle pumps, given the diversity of economic activity, and the fact that some changes would still have occurred even without the pumps. There is anecdotal evidence of some investment in rainfed farming as a result of the acquisition of treadle pumps, as well as in local transportation especially in the Brong Ahafo Region. This evidence, however, currently remains limited only to a few farmers, and it is difficult to predict with any degree of certainty, how this will develop in future.
Way forward with the SOKA Pump in Ghana
5.87 Based on the review and field experiences with the SOKA pump in Ghana, the following issues require a serious consideration as regards efforts to achieve a wider dissemination of treadle pumps in the country, and to ensure that the poor get a share of the benefits generated by treadle pump use in rural communities.
1. EnterpriseWorks’ approach of creating awareness about the costs and benefits of treadle pumps through farmer-to-farmer contacts and field demonstrations is achieving significant results and should be strengthened. This combination of
501
methods seem to be doing particularly well in Ghana, due to the fact that doubts and scepticism of farmers that could not be cleared during field demonstrations could informally be crossed checked with neighbouring farmers through conversations and the like.
2. Treadle pump users should be given specific training on self-maintenance of the pumps rather than entirely relying on EnterpriseWorks, which is currently very much involved in such activities in Ghana.
3. Rural Banks and other financial institutions should be encouraged to support poor farmers to get access to the pump through various mechanisms. This approach will significantly overcome constraints to treadle pump use especially by poor people, who would otherwise not have means of acquiring the pump, and hence lose out on reaping the benefits of pump introduction.
4. Treadle pumps should be designed to reduce drudgery involved in its operation, and to make it suitable for use by both men and women.
5. Efforts should be made to explore the potentials of using groundwater sources close to the farms to enable farmers without access to other water sources (i.e. streams or rivers) to use treadle pumps. There are instances where farmers are not making efforts to acquire and use the pump simply because their farms are located too far away from water sources, while information on the dynamics of groundwater distribution in the area is lacking. Research on the distribution of groundwater or identification of suitable locations for groundwater development in these areas will encourage farmers to exploit the opportunities associated with the use of treadle pumps.
SYNTHESIS AND CONCLUSIONS 5.88 Low cost irrigation technologies like the SOKA Pump in Ghana and the Niyya da
Kokari in Niger have a significant potential to increase productivity and enhance rural livelihoods. Even though costs for these technologies may be relatively low compared to sophisticated ones, they are still only accessible to a relatively small proportion of farmers who can afford them. This synthesis of poverty impacts of treadle pumps in West Africa, supplemented by a detailed case study Ghana, reveals the existence of a huge potential for achieving real poverty impacts, as evidenced in almost all countries where the treadle pump has been tried in the sub-region. In Niger for instance, the adoption of treadle pumps by farmers using traditional means of irrigation resulted in significant improvements of labour efficiency, increased cultivated area, cropping intensity and increased farm income. Despite the relative abundance of family labour in Niger, adoption of treadle pump improved the efficiency of labour by reducing both the number of required farm workers and working hours. This led to significant savings of male labour (25%) and female labour (29%) labour, which was then reallocated to the expansion of farm sizes to boost household farm incomes for both farmers and landless wage workers. Similar trends are also observed elsewhere in West Africa. Though outreach across West Africa is significant, it is largely limited to the few countries of Senegal, Mali, Burkina Faso, Cote d’Ivoire, Ghana and Benin, where EW is active.
5.89 EW treadle pump initiatives in West Africa are creating the necessary conditions for
the market-driven manufacture, sale and use of treadle pump to continue in the project countries even after the project assistance has ended. Thus, the primary objective of
502
EW is ‘setting the pace’ and leaving the process to take off entirely by itself, rather than doing the entire dissemination. Using a private sector approach as a central element in replication efforts, EW promotes commercial dissemination of the treadle pump, focussing primarily on where conditions are favourable: existence of small scale traditional water management technologies, concentration of small scale farmers using these technologies with a desire for innovation and market-oriented production. Indeed, technologies such as the treadle pump can capacitate small farmers to respond well to market incentives, but the conditions for successful market-oriented production are often insufficiently investigated and need attention in most of the project countries in West Africa.
5.90 In its strategy of treadle pump promotion, EW incorporates NGO collaboration as a
central strategy in pump sales. Through memoranda of understanding in several countries, NGOs and their field staff act as sales agents while focusing on their core responsibilities. This form of collaboration has shown some successes at relatively lower costs, resulting in a win-win for both EW and supporting NGOs. This approach should also be extended to include micro finance institutions, with a view to facilitating the access of poor people to the pump, who would otherwise hardly meet the rather stringent criteria of local manufacturers. Therefore achieving real poverty impacts in West Africa through treadle pump interventions need to strongly consider supporting pro-poor micro-finance institutions that will increase the access of the poor to these technologies.
5.91 While the pump is believed to make a considerable impact in increasing incomes, direct poverty impacts are still limited, since the poor have less access to the pumps. This issue needs to be strongly considered in treadle pump promotion, especially given the fact that poverty alleviation is an important goal of intervening agencies. Another relevant issue for the realization of poverty reduction impacts of the introduction of the treadle pumps in the sub-region relates to gender. In Senegal for instance, proportion of female labour in treadle pump operation is not more than 4%. In Niger, the figure is even smaller and constitutes less than 2% of the entire treadle pump operators. By the same token, pump ownership is over 90% in the hands of men in most of West Africa, due to better access to land and capital. This low participation of women raises a new concern as to whether in fact leaving these issues un-addressed would create a new imbalance in the already skewed power relations between men and women, and aggravate the poverty situation further. Issues such as the difficulty of access to credit (for women), the dynamics of land rights, intensity of labour required to operate the pumps, etc. are among the reasons for the low participation of women in these programs. In Ghana, for instance, there is a strong evidence of differential wages for men and women wageworkers in operating the pumps, which further makes it difficult for female poor landless wageworkers to equally acquire the indirect benefits from treadle pump use.
503
REFERENCES Alien, H. and Perry, E. 1996. Human Powered Irrigation for Smallholders: Approach
to Implementation. CARE International and Appropriate Technology International. Addis Ababa.
Arbid, C. 2004. Increased Incomes and Expanded Irrigated Surface Area: Impact of the Soka Pump in Ghana. Enterprise Works Worldwide. Washington, D.C.
Bishop, C. P. 2002. An Assessment of the Social Impacts of EnterpriseWorks’ Interventions in Mali. EnterpriseWorks Report, Mali.
Brabben, T., and Kay, M. 2000. Treadle Pumps – A Viable Option for Africa? GRID, Issue 16. IPTRID Network Magazine. IPTRID/FAO
Campbell, J. and Hyman, E. L. 2000. Impact Analysis of the EnterpriseWorks Treadle Pump and Handpump on Market Gardners in Niger. Unpublished Report. EnterpriseWorks Worldwide. Washington, DC.
Chancellor,F. 2001. Women irrigators and operation and maintenance of small-scale smallholder schemes in Africa. In Private Irrigation in sub-Saharan Africa. Regional Seminar on Private Sector Participation and Irrigation Expansion in sub-Saharan Africa. Accra, Ghana. Edited by Hilmy Sally and Charles L. Abernathy.
Danso, G. 2000. The Use of Treadle Pumps as Compared to Other Irrigation Technologies by Small Framers in West Africa. IWMI, Ghana. Unpublished Report.
EnterpriseWorks Worldwide, 2002. Ghana Office report, unpublished. EnterpriseWorks Worldwide, 2003. Baseline Report: Irrigated Horticulture Project. 30. EnterpriseWorks Worldwide, 2004. www.enterpriseworks.org/about.asp Government of Ghana, 2003: Ghana Poverty Reduction Strategy Paper 2003 - 2005: An Agenda for Growth and Prosperity. Volume 1: Analysis and Policy Statement, February, 2003. Hide, J. M. and Kimani, J. 2001. Informal Irrigation in the Peri-urban Zone of Nairobi, Kenya.
Report OD/TN 98. Hyman, E. Lawrence, E. and Singh, J. 1995. The ATI/USAID Market Gardners
Project in Senegal. Appropriate Technology International (ATI), Washington, DC. DC.
IWMI research update, 2003. Fulfilling the promise of small-scale technologies. News of the progress and Impact of IWMI’s Research update, www.iwmi.org
Naugle, J. 2000. The Niger Experience. In: Kay, M. and Brabben, T. 2000. Treadle Pumps for Irrigation in Africa: A Report for the International Program for Technology and Research in Irrigation and Drainage (IPTRID). Knowledge Synthesis Report No. 1 – October 2000. IPTRID, FAO, Rome.
Neighbor and Sellen, 2002; Market-based irrigation reforms for smallholder farmers in Niger. Case study prepared for the Extension and Rural Development Workshop: A convergence of Views on International Approaches? Washington, DC
Kamara, A. B., van Koppen, B. And Magingxa, L. 2002. Economic Viability of Small-Scale Irrigation Systems in the Context of State Withdrawal: The Arabie Scheme in the Northern Province of South Africa. Physics and Chemistry of the Earth, 27: 815 – 823.
Keraita, B., Danso, G. and Drechsel, P. 2003. Urban Irrigation Methods and Practices in Ghana and Togo. UAM, Vol. 10. www.ruaf.org Neighbor, H. and Sellen, D. 2002. Market-based Irrigation Reforms for Smallholder Farmers in Niger. Case study prepared for Extension and Rural Development Workshop: A Convergence of Views on International Approaches? Washington, DC. Perry, E. 1997. Strengthening the Enabling Environment for Small Enterprise
504
Development through Improved Technology. Appropriate Technology International. Washington, D.C.
Polak, P., Nanes, B. and Sample, J. 2000. Opening Access to Affordable Micro-Plot Irrigation for Small Farmers. Working Paper International Development Enterprises (IDE), USA.
Polak, P. 2003. How IDE Installed 1.3 Million Treadle Pumps in Bangladesh by Activating the
Private Sector: The Practical Steps. pp. 101 – 108. SDC, Swiss Agency for Development and Co-operation, Berne.
Shah, T., van Koppen, B., Merrey, D., de Lange, M. and Samad, M. 2002. Institutional Alternatives in African Smallholder Irrigation: Lessons from International Experience in Irrigation Management Transfer. IWMI, Research Report 60.
Van Leeuwen, N.H. 2001. Affordable small- scale drip irrigation in Africa. Potential role of the private sector. In Private Irrigation in sub-Saharan Africa. Regional Seminar on Private Sector Participation and Irrigation Expansion in sub-Saharan Africa. Accra, Ghana. Edited by Hilmy Sally and Charles L. Abernathy. Pp.49-55.
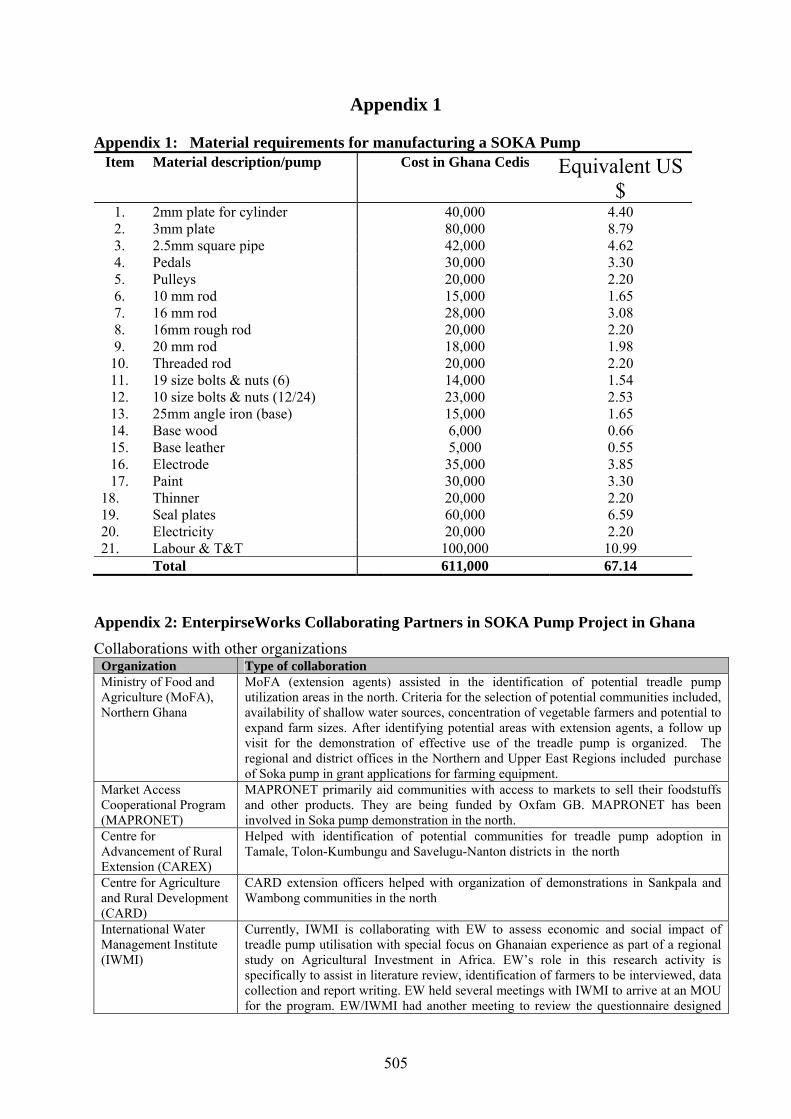
505
Appendix 1 Appendix 1: Material requirements for manufacturing a SOKA Pump
Item Material description/pump Cost in Ghana Cedis Equivalent US $
1. 2mm plate for cylinder 40,000 4.40 2. 3mm plate 80,000 8.79 3. 2.5mm square pipe 42,000 4.62 4. Pedals 30,000 3.30 5. Pulleys 20,000 2.20 6. 10 mm rod 15,000 1.65 7. 16 mm rod 28,000 3.08 8. 16mm rough rod 20,000 2.20 9. 20 mm rod 18,000 1.98
10. Threaded rod 20,000 2.20 11. 19 size bolts & nuts (6) 14,000 1.54 12. 10 size bolts & nuts (12/24) 23,000 2.53 13. 25mm angle iron (base) 15,000 1.65 14. Base wood 6,000 0.66 15. Base leather 5,000 0.55 16. Electrode 35,000 3.85 17. Paint 30,000 3.30
18. Thinner 20,000 2.20 19. Seal plates 60,000 6.59 20. Electricity 20,000 2.20 21. Labour & T&T 100,000 10.99 Total 611,000 67.14
Appendix 2: EnterpirseWorks Collaborating Partners in SOKA Pump Project in Ghana Collaborations with other organizations
Organization Type of collaboration Ministry of Food and Agriculture (MoFA), Northern Ghana
MoFA (extension agents) assisted in the identification of potential treadle pump utilization areas in the north. Criteria for the selection of potential communities included, availability of shallow water sources, concentration of vegetable farmers and potential to expand farm sizes. After identifying potential areas with extension agents, a follow up visit for the demonstration of effective use of the treadle pump is organized. The regional and district offices in the Northern and Upper East Regions included purchase of Soka pump in grant applications for farming equipment.
Market Access Cooperational Program (MAPRONET)
MAPRONET primarily aid communities with access to markets to sell their foodstuffs and other products. They are being funded by Oxfam GB. MAPRONET has been involved in Soka pump demonstration in the north.
Centre for Advancement of Rural Extension (CAREX)
Helped with identification of potential communities for treadle pump adoption in Tamale, Tolon-Kumbungu and Savelugu-Nanton districts in the north
Centre for Agriculture and Rural Development (CARD)
CARD extension officers helped with organization of demonstrations in Sankpala and Wambong communities in the north
International Water Management Institute (IWMI)
Currently, IWMI is collaborating with EW to assess economic and social impact of treadle pump utilisation with special focus on Ghanaian experience as part of a regional study on Agricultural Investment in Africa. EW’s role in this research activity is specifically to assist in literature review, identification of farmers to be interviewed, data collection and report writing. EW held several meetings with IWMI to arrive at an MOU for the program. EW/IWMI had another meeting to review the questionnaire designed

506
Organization Type of collaboration for the study, pre-test questionnaire and finally modify the questionnaire to be able to generate the necessary data and information. EW was also involved in the actual survey which was conducted in August 2004. A total of 100 treadle pump users were interviewed in the northern Zone (Ashanti and Brong Ahafo regions). Data is being analyzed. Plans are far advanced to conduct survey of pump manufacturers to ascertain the level of socio-economic impact made so far. IWMI is also involved in Soka pump promotion. Currently, has two demonstration plots in Kumasi; farmer and institutional managed. The performance of the pumps so far has been satisfactory, as revealed in a follow up visit by EW Ghana irrigation manager. EW has been collaborating with IWMI/CSIR on possibilities of exploring means of addressing environmentally related problems associated with use of polluted water for peri-urban vegetable production. One of the possible solutions considered is the use of tube wells. However, test drilling conducted in selected areas in Accra was not successful.
Adventist Develoment and Relief Agency (ADRA)
Helping in treadle promotional effort. Purchased four pumps for their farmers in Dangbe East district . ADRA in the north also purchased a number of pumps for farmer groups in the Northern and Upper West regions
Irrigation Development Authority (IDA) in Upper West Region (UWR)
IDA has initiated tube well test drilling activities in the flood plains of the Black Volta with some positive results. EW intends to work with IDA to explore the possibility of using Soka to lift water from tube wells in the area. The regional manager has been asked to present proposal for consideration.
Methodist Agric Station in Wa (UWR)
Have been very instrumental in Soka pump promotion in their outreach programmes. The station has purchased one pump for demonstration purposes and currently been introduced to the local manufacturer to facilitate sales.
Methodist Farms (Bolgatanga)
Methodist Farms Bolgatanga is also involved in treadle pump utilization promotion. Currently has a pump for demonstration purposes.
UNICEF A proposal on portable water in the Northern Ghana has been submitted to UNICEF for possible funding
Opportunities Industrialization Centres International (OICI)
EW intends to collaborate with OICI in implementing a proposed Development Assistance Program (DAP) in the area of Food Security. As part of the proposed arrangement, EW is supposed to collaborate with OICI to promote dry season gardening at selected dam sites in 6 districts in the Northern Region. In a letter of commitment signed by the two parties, EW will provide the following services;
• Technical training in Soka pump manufacturing –train at least one fabricator in each participating district
• Capacity building of OICI staff and participating farmers in pump usage and maintenance
• Provision of tooling support to manufacturers • Site selection, layout and irrigation design of farm managed demonstration
fields • Assist OICI to roll out treadle pump technology transfer successes to other
potential areas. The proposal is being considered for funding by USDA.
FAO/MOFA EW demonstrated the use of Soka pump at a workshop organized for the Program Development Officers on SPFS at Libga and Nakoli in the northern and Upper East regions respectively. EW also facilitated the construction of tube wells in Ejisu, under the FAO/MOFA Special Program on Food Security (SPFS). One pump has since been bought for demonstration purposes at Ejisu. The project manager paid a follow up visit to the Ejisu site in August 2004. In September, a visit was made again to Nakoli with SPFS project team member for the installation of deep well pumps in the area. Unfortunately this trip was not successful due to heavy rains at the time.
Winrock International (WI)
Winrock International is in a process of implementing a participatory action research program aimed at conducting trails with various micro irrigation systems including treadle pump in the northern region under its Community Affordable Micro-irrigation Promotion/Ghana Rural Water Project. So far EW has been involved in the following activities
• Pre-assessment survey aimed at identifying and selecting suitable communities in the northern region for participation in the program. Some of the potential
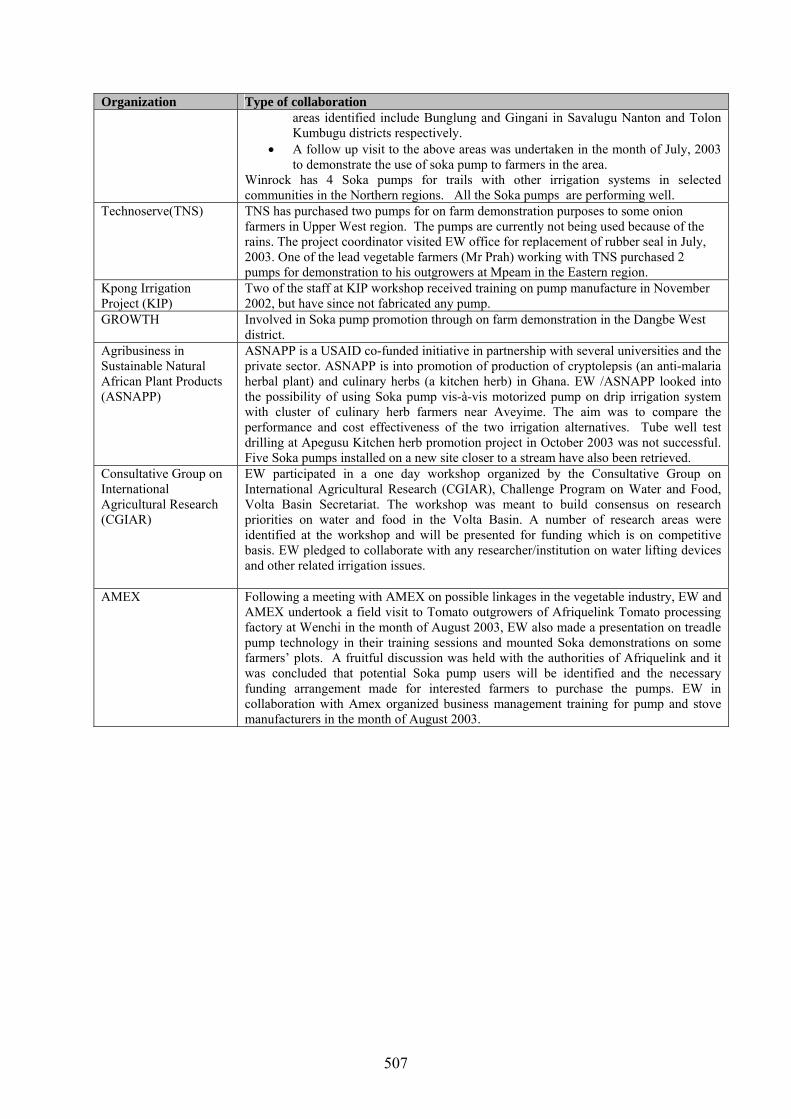
507
Organization Type of collaboration areas identified include Bunglung and Gingani in Savalugu Nanton and Tolon Kumbugu districts respectively.
• A follow up visit to the above areas was undertaken in the month of July, 2003 to demonstrate the use of soka pump to farmers in the area.
Winrock has 4 Soka pumps for trails with other irrigation systems in selected communities in the Northern regions. All the Soka pumps are performing well.
Technoserve(TNS) TNS has purchased two pumps for on farm demonstration purposes to some onion farmers in Upper West region. The pumps are currently not being used because of the rains. The project coordinator visited EW office for replacement of rubber seal in July, 2003. One of the lead vegetable farmers (Mr Prah) working with TNS purchased 2 pumps for demonstration to his outgrowers at Mpeam in the Eastern region.
Kpong Irrigation Project (KIP)
Two of the staff at KIP workshop received training on pump manufacture in November 2002, but have since not fabricated any pump.
GROWTH Involved in Soka pump promotion through on farm demonstration in the Dangbe West district.
Agribusiness in Sustainable Natural African Plant Products (ASNAPP)
ASNAPP is a USAID co-funded initiative in partnership with several universities and the private sector. ASNAPP is into promotion of production of cryptolepsis (an anti-malaria herbal plant) and culinary herbs (a kitchen herb) in Ghana. EW /ASNAPP looked into the possibility of using Soka pump vis-à-vis motorized pump on drip irrigation system with cluster of culinary herb farmers near Aveyime. The aim was to compare the performance and cost effectiveness of the two irrigation alternatives. Tube well test drilling at Apegusu Kitchen herb promotion project in October 2003 was not successful. Five Soka pumps installed on a new site closer to a stream have also been retrieved.
Consultative Group on International Agricultural Research (CGIAR)
EW participated in a one day workshop organized by the Consultative Group on International Agricultural Research (CGIAR), Challenge Program on Water and Food, Volta Basin Secretariat. The workshop was meant to build consensus on research priorities on water and food in the Volta Basin. A number of research areas were identified at the workshop and will be presented for funding which is on competitive basis. EW pledged to collaborate with any researcher/institution on water lifting devices and other related irrigation issues.
AMEX Following a meeting with AMEX on possible linkages in the vegetable industry, EW and AMEX undertook a field visit to Tomato outgrowers of Afriquelink Tomato processing factory at Wenchi in the month of August 2003, EW also made a presentation on treadle pump technology in their training sessions and mounted Soka demonstrations on some farmers’ plots. A fruitful discussion was held with the authorities of Afriquelink and it was concluded that potential Soka pump users will be identified and the necessary funding arrangement made for interested farmers to purchase the pumps. EW in collaboration with Amex organized business management training for pump and stove manufacturers in the month of August 2003.

508
6
REGIONAL DEMAND FOR PRODUCTS OF IRRIGATED AGRICULTURE:
ANALYSING THE DRIVERS OF DEMAND FOR WATER AND THE REGION’S COMPARITIVE ADVANTAGES IN IRRIGATED AGRICULTURE
DR. MICHAEL WESTLAKE (INTERNATIONAL COMMODITIES AND TRADE ECONOMIST) AND
PHILIP J RIDDELL (INTERNATIONAL CONSULTANT IN IRRIGATION AND WATER RESOURCES MANAGEMENT)
JULY 2004- ZERO DRAFT
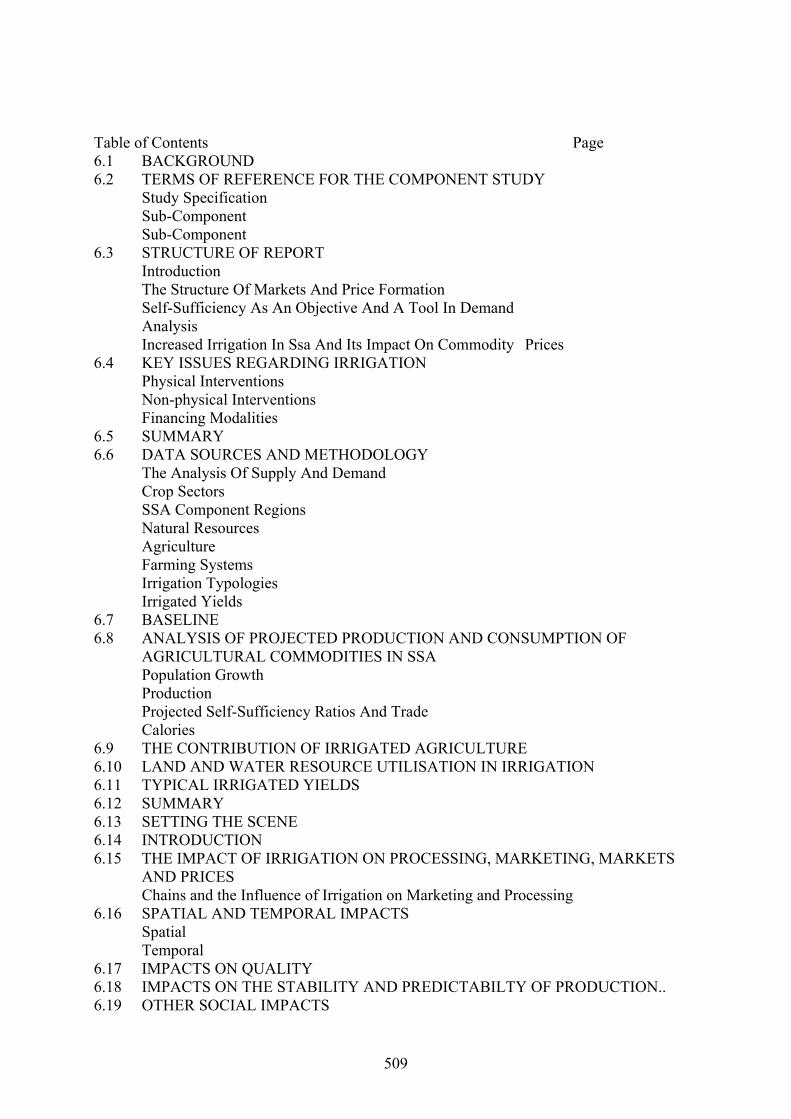
509
Table of Contents Page 6.1 BACKGROUND 6.2 TERMS OF REFERENCE FOR THE COMPONENT STUDY Study Specification
Sub-Component Sub-Component
6.3 STRUCTURE OF REPORT Introduction The Structure Of Markets And Price Formation Self-Sufficiency As An Objective And A Tool In Demand Analysis Increased Irrigation In Ssa And Its Impact On Commodity Prices
6.4 KEY ISSUES REGARDING IRRIGATION Physical Interventions Non-physical Interventions Financing Modalities
6.5 SUMMARY 6.6 DATA SOURCES AND METHODOLOGY
The Analysis Of Supply And Demand Crop Sectors SSA Component Regions Natural Resources Agriculture Farming Systems Irrigation Typologies Irrigated Yields
6.7 BASELINE 6.8 ANALYSIS OF PROJECTED PRODUCTION AND CONSUMPTION OF
AGRICULTURAL COMMODITIES IN SSA Population Growth Production Projected Self-Sufficiency Ratios And Trade Calories
6.9 THE CONTRIBUTION OF IRRIGATED AGRICULTURE 6.10 LAND AND WATER RESOURCE UTILISATION IN IRRIGATION 6.11 TYPICAL IRRIGATED YIELDS 6.12 SUMMARY 6.13 SETTING THE SCENE 6.14 INTRODUCTION 6.15 THE IMPACT OF IRRIGATION ON PROCESSING, MARKETING, MARKETS
AND PRICES Chains and the Influence of Irrigation on Marketing and Processing
6.16 SPATIAL AND TEMPORAL IMPACTS Spatial Temporal
6.17 IMPACTS ON QUALITY 6.18 IMPACTS ON THE STABILITY AND PREDICTABILTY OF PRODUCTION.. 6.19 OTHER SOCIAL IMPACTS
510
6.20 ENVIRONMENTAL IMPACT 6.21 ANALYSIS 6.22 BROAD MARKET PROSPECTS FOR THE MAIN CROP GROUPS 34
Cereals Non-Cereal Staple Food Crops Other Food Crops Livestock and Dairy Beverage and Industrial Crops Section Summary
6.23 REGIONAL DEMAND AND THE POTENTIAL FOR INTRA-REGIONAL TRADE IN MAIZE, WHEAT AND RICE
6.24 AN APPROPRIATE IRRIGATION SECTOR RESPONSE 6.25 CONCLUSIONS AND RECOMMENDATIONS ANNEX 1 ANNEX 2 ANNEX 3 ANNEX 4 ANNEX 5 ANNEX 6 ANNEX 7 ANNEX 8 ANNEX 9 ANNEX 10

511

512

513
7
ASSESSMENT OF POTENTIAL FOR IMPROVING AGRICULTURE WATER MANAGEMENT IN SUB-
SAHARAN AFRICA (IWMI): UPDATES
Charlotte de Fraiture (2004)
514
SYNTHESIS The study aims to provide an objective and scientifically sound basis to debates on water for food and environment, the International Water Management Institute (IWMI) and International Food Policy Research Institute embarked on a joint modelling exercise, resulting in the WATERSIM model. WATERSIM (Water, Agriculture, Technology, Environment and Resources Simulation Model) explores the impact of water and food related policies on water scarcity, food production, food security and environment. The model can assess the tradeoffs between irrigated and rain fed production in terms of resource requirements, crop prices and variability. It can track virtual water flows and look at the effect of trade policies on food prices and local water use. Further, it has the potential to explore the possible impact of climate change on agricultural production, crop prices and water use. For this study WATERSIM will provide three alternative future scenarios of water supply and demand for SSA and their policy implications for different countries.
1. Business as usual scenario, where present trends of investment in water related development continues in to the future,
2. More irrigation scenario, where increased investment is expected than at present, and
3. A scenario of more rain-fed yield and more trade between regions within SSA or more trade with regions outside the SSA.
MODEL STRUCTURE 7.1 Broadly speaking the model consists of two fully integrated modules: the ‘food
demand and supply’ module, which is adapted from IMPACT; and the ‘water supply and demand’ module which uses a water balance based on the Water Accounting framework underlying PODIUM combined with elements from the IMPACT-WATER model. To adequately reflect water availability and allocation, it makes most sense to use river basins as basic spatial unit. When it comes to food policy analysis, administrative boundaries should be used (trade and policy making happens at national level, not at river basins scale). Therefore, the food module divides the world into 115 economic regions, following administrative boundaries, of which 40 in SSA. The water module runs at major river basin scale, 125 for the globe and 18 in SSA. The interaction between food and water modules is facilitated by intersecting basins and regions into 282 Food Producing Units (FPU’s).
FOOD DEMAND AND SUPPLY 7.2 The backbone of the food demand and supply module is a world trade model that
connects the 115 economic regions through trade. Each region is characterized by demand and supply functions –one for each of the 20 commodities- which relate quantities to prices. Demand is influenced by changes in income, population and prices. Supply is shifted by changes in yields, areas and technology changes. The difference between supply and demand in each region generates an excess supply or demand which, when aggregated at global level, determines the world market clearing price. That is, at the equilibrium world price the total amount of imports is equal to the total amount of exports. In this way, both prices and trade volumes are endogenous to the model.
515
WATER DEMAND AND SUPPLY 7.3 Water demand is derived from three sectors -agriculture, domestic and industrial. At
basin level, water availability is simulated using a water balance approach, considering inflows, outflows, existing infrastructure and management practices. Where supply falls short of demand, water is distributed over the months to match demand patterns using an optimization formulation that maximizes the ratio demand over supply. Sub-basins are connected in such a way that outflow from the upstream becomes inflow into the lower sub-basin. In some basins during some years water availability limits agricultural production. In that case updated areas and yield are fed back into the food module.
INTEGRATION OF WATER AND FOOD MODULES 7.4 The basic assumption in the food module is that each year a partial economic
equilibrium for agricultural commodities is reached. The water module is based on a water balance approach. Both modules are connected through two variables: 1) agricultural area, which determines food supply and water demand; 2) crop price which determines food demand and crop profitability which in turn affects water allocation over crops (in case of water shortage, in allocating water more weight is given to more profitable crops). The model iterates between the modules until market equilibrium and water balance is reached.
ADVANTAGES OF THE WATERSIM MODEL METHODOLOGY 7.5 The Watersim methodology has a few advantages over other forecasts or scenario
tools, especially for the use to SSA.
1) Food demand –and hence water demand- is defined in an economic sense depending on prices, elasticities and income, as opposed to food requirements that are based on nutritional needs. The calorie intake in some countries in SSA remains below requirement because of low incomes. Defining food demand as a function of income thus provides a more realistic starting point for scenarios.
2) Crop areas and yields are defined as a function of input prices, technology and
investments. But also depend on crop prices. This captures the farmers’ incentive to raise production (for example by improved inputs or larger area allocated to a particular crop) if a crop becomes more profitable.
3) Crop areas and yields in irrigated and rain fed agriculture are defined as a function
of water supply (either from rain or irrigation). This allows for exploring the impact of rainfall variability on irrigated and rain fed yields.
4) Food production is split out in irrigated and rain fed agriculture (at the demand
side no such distinction is made). This allows for an assessment of the tradeoffs between irrigated and rain fed production in terms of investments, resource requirements, crop prices and variability. Since most of the production in SSA is under rain fed conditions this is an important advantage.
5) Iterating between food and water modules until both an economic equilibrium and
water balance are reached, the model includes feedback mechanisms that level off exponential trends and prevent variables to blow up. These feedback mechanisms

516
are an important feature of the WATERSIM model which distinguishes it from most other water and food projection models. For example, water shortage may lead to a reduction in food production. But this in turn leads to higher food prices, inducing a higher production in the next season and thus partly offsetting food shortage. Another example: higher food demand lead to higher water demand. But increased water demand may provide an incentive to improve on water use efficiency, thus offsetting part of the increased demand.
6) The modeling framework is flexible to explore a range of scenarios. For example,
policies on meeting environmental water requirements can be entered as hard constraint in which environmental requirements are always met, even if they are in conflict with food self-sufficiency policies. But environmental requirements can also enter as soft constraint to simulate a situation in which a certain degree of environmental damage is tolerated in extreme water short periods, giving priority to food production targets.
7) International trade and world market prices are important components of the
modeling framework, putting the SSA regional study in a global context.
STATUS OF THE WORK 7.6 Model coding and structure development are completed. The updated baseline year
(2000) will be completed by the end of October. Scenario analysis will be done in November.
517
8
IRRIGATION INVESTMENT COSTS
IN SUB-SAHARAN AFRICA: SYNTHESIS OF CASE STUDIES FOR Ghana, Kenya, Madagascar and Mali105
D. ROLLIN, H. SALLY, A. INOCENCIO AND AFRICAN CONSULTANTS
105 We acknowledge the financial support of the World Bank through its Bank-Netherlands Water Partnership Program.

518
INTRODUCTION
The case studies work was carried out in Madagascar and Mali with the knowledge that the planning and implementation and the IFAD poverty studies conducted case studies in these countries in order to optimize synergies and for the benefit of the overall synthesis work. The case studies in Kenya and Ghana were carried out as ‘pilot’ cases in 2003 confirmed that determinants of irrigation costs cited in reports from mid to late 1980s for parts of sub-Saharan Africa are still the same factors affecting costs almost two decades after. The work was carried out through interviews with key informants and resource persons including ministry and agency personnel, donor representatives, consulting and construction firms, and closely examining selected projects in terms of key determinants. RESULTS AND DISCUSSIONS
Variability in costs across schemes, projects, and countries
One important consideration in this study to take note is that there is considerable variability in costs, not only among the different projects that were studied, but also among schemes within a project. For supposedly similar projects across countries, differences can be accounted for by differences in country (physical, technical, institutional, political, etc.) conditions. The variability between projects can be due to differences in types of project and schemes within each project, e.g., schemes with pumping are more expensive than river diversion schemes. In Ghana, per hectare rehabilitation costs were higher for schemes using a combination of pump and sprinkler technologies compared to other combinations. The more expensive schemes are irrigating vegetables while the relatively cheaper ones (although still extremely high compared to averages in Asia) are primarily irrigating rice. Furthermore, as soon as the costs of land leveling are included, the costs increase a lot. The relatively lower investment costs in Madagascar can be attributed to this – with most irrigated schemes (and all schemes of the PPI projects) irrigated by gravity and leveling (and often the secondary and tertiary canal networks to bring water to the fields) is traditionally done by the beneficiaries. An analysis of 13 irrigation projects in Kenya show that the most expensive ones were those built in the 1980s, designed by international consultants and were foreign donor funded. More current estimates indicate lower costs ranging from less than $1000 to a maximum real unit cost of $3,500. This trend can be interpreted in two ways: (1) that these are rehabilitation projects with water sources such as dams already part of the sunk costs, or (2) that this can reflect a shift in government investment away from large and sophisticated to small and a lot less complex projects which can be less capital-intensive and therefore more affordable in the light of a cash constrained government and the shying away of foreign donors from irrigation. Given these wide variations in irrigation investment costs, one has to be careful in interpreting or generalizing results from the case studies.
What makes up irrigation investment costs? Primary network: Some substantial differences can appear depending on whether one takes into account or not the primary network. In Madagascar, the primary network accounts for most of the cost. In Mali, the least expensive projects are those that already benefit from a primary (and secondary) network. Such projects focus only on the tertiary level.
519
Flood protection embankments: The construction of protective embankments against flooding requires the execution of work (e.g. use of mechanical power, more capital-intensive technologies) that can only be achieved by a specialized enterprise. The associated costs are particularly high for schemes of small size, rising to as much as 80% of the scheme cost in some Malian schemes. The flood protection structures are generally designed on the basis of centennial rises in the water level. The acceptance of a higher degree of risk would theoretically allow a reduction of the construction cost of the embankment, but it is not certain if this could be justified economically, because of the relatively small differences between the centennial and decennial heights of rise in the water level. This is one of the reasons for the much higher cost of the rehabilitation of the Manandona irrigation system in Madagascar (double embankment on each bank of the river). Drainage: In some irrigation schemes in Madagascar or Mali, drainage systems are introduced whenever it is a necessary condition for the production or for achieving a better water control regime. On average, drainage accounts for more than US$ 650/ha when added to a project in Mali. User participation: To reduce demands from governments and donors, and also to ensure the involvement and buy-in of the beneficiaries, irrigation projects make provision for greater involvement and participation of the users who are called upon to contribute to labor and capital. In Mali, the contribution of the farmers reaches up to 30% of the total project investment costs. This involvement has two consequences for irrigation investments costs:
o where time is not a constraint, use of high labour intensity engineering solutions, compared to projects that call for firms using costly equipment and specialized skills, can lead to less expensive projects; and
o the involvement of the users is often not taken into account in the calculations of cost per hectare, for example, the unaccounted efforts of the beneficiaries to make their plots irrigable (carrying out land levelling in Madagascar) lead to underestimation of project costs.
• Accompanying measures and support services: A very large range of accompanying
measures can be incorporated in the costs of projects. These range from technical advice to catchment planning and may also include literacy programs and credit facilities. Often such measures are undertaken to improve the chances of success and sustainability of infrastructural improvement, but they could also dramatically increase the cost of the projects.
• Operation and maintenance costs: Depending on the size of the initial investment, the
recurrent costs can account for a relatively large proportion of the project costs. With large initial investments, the annual maintenance costs generally ranges from 5% to 10% of the initial investment. In the case of small investments, operation and maintenance expenses could be higher and infrastructure may have to be rebuilt more frequently. So the objective of reducing the overall costs of irrigation development could paradoxically imply an increase in the initial capital cost, assuming that more expensive projects (with higher initial capital costs) are of better quality, would last longer and would entail lower operation and maintenance costs.
520
Investment costs and quality of infrastructure
The costs of the investments in irrigation should be linked logically to the impact of the productivity increases expected from an improvement of water control.
• The degree of water control: In Mali, irrigation investment costs are strongly linked to the
scheme design and the level of water control. The costs of medium-sized total water control irrigated schemes (100 to 500 hectares) range from 5 to 7 million FCFA ($8780 to $12280) per hectare, mainly on account of the flood protection dykes. For the smaller schemes without safety embankments, the costs are lower (2 to 3 millions FCFA per hectare). The schemes under controlled submersion and, even more so, those under free submersion are a lot less costly to put in place but are also much less effective. At the other end of the scale, the failure of swamp management works (200 000 FCFA/ha) in Mali shows that inexpensive investments do not necessarily yield high returns when questions related to technical control, the problems of land tenure, and the difficulty for the maintenance of infrastructure in erosion-prone locations are not taken into account.
• Profitability and budget limitations: The search for adequate returns limits the permissible
level of investment for every perimeter. The physical design is sometimes adjusted to meet this constraint to the detriment of the quality and the durability of the infrastructure. This limitation constitutes the main reason for the need for frequent corrective measures, which ultimately increases the cost of the rehabilitation on the perimeter. High maintenance costs are not easily supported by the users (see also discussion on construction and O&M above).
• Standards for design and construction: One of the common problems met in all types of
schemes is the absence or the inadequacy of technical and economic norms for infrastructure design. This problem is particularly serious in the case of the small schemes where many intervening parties, sometimes without the requisite competence and experience, carry out work. The problem was especially obvious between the PPI1 project in Madagascar where work was carried out by big enterprises applying international norms and the PPI2 project where the project slicing allowed small engineering firms to bid. Due to a lack of coherent norms, the quality of the work is very variable. The lack of information and norms related to water requirements and infiltration losses, on which depends the layout of the irrigation network is particularly critical, often resulting in the over-design of channels, control structures and motor-pumps and hence a large increase in costs106.
Factors determining irrigation investment costs The many factors that influence irrigation investment costs can be regrouped in the following major categories:
106 From the start of rehabilitation in the early 1980s, a multitude of norms existed in the Office du Niger, with each project having its own approach. In 1989, efforts for harmonization led to the production of a document that would act as reference in the design of rehabilitation and new schemes. This document has been completed by (a) the technical norms of design and water management, DAH 1991 (b) the note on design options in the office of Niger, Molle.1992, as well as (c) the note on the harmonization of approaches for the rehabilitation and extension of rice plots within and outside the Office du Niger.
521
• Physical factors: The quality of the soils, nature of the topography, and the vulnerability to floods of the irrigation sites could have a more or less adverse effect on project costs. For example, in northern Ghana, where most irrigation schemes are located, the relatively flat topography make projects that include creation of storage facilities uneconomical -- there are few sites suitable for reservoirs, the dams that are built tend to be long, the volume of stored water would not usually justify the cost, and there would be high evaporation losses. In addition, in some projects the bulk of surface water cannot be used for irrigation in a cost-effective way, while average water yields of shallow tube-wells in pilot projects have been found to be low and only useable for drinking water and micro-scale irrigation.
• Project design:
o High level of infrastructure degradation: Sometimes, the amount of work involved in rehabilitation projects is comparable to a new project. In Madagascar, there is only rehabilitation, but the costs are often very high. In Mali, some rehabilitation projects are more expensive than new ones.
o Design mistakes: Changes in design during implementation because of lack of data at the time of project formulation, or underestimating the possible damage due to erosion and floods could cause a significant increase in the supplementary cost during construction. In addition to the over-design of canal networks and other infrastructure (already discussed above), the problem of over-design can also extend to the headworks. There are examples in Ghana where they are sometimes designed to serve almost four times the actual irrigable area, thereby increasing the cost per hectare when spread over the smaller actual command area. A review of individual smallholder (and pump-fed) irrigation clusters in Kenya highlighted problems with regard to choice of couplings for suction and delivery, use of wrong hydrant size, inappropriate length of hose pipes, and choice of pump and accessories without consideration of required lifting heads and discharges, among others. The reasons could be varied, ranging from limited technical knowledge on individual pump-fed systems among small farmers to lack of technical expertise among the non-governmental organizations (NGOs) helping to promote such technology.
o The inadequate consideration of the views of the users and of local social reality does not encourage the active and willing participation of users in operations and maintenance.
• Project planning and implementation:
o Among the reasons are the slow processing of required project documents or delays in meeting donor conditions, either because of lack of capacity in the irrigation agency or lack of commitment from the side of government.
o The tendering and procurement procedures, especially for large schemes, can take a long time. For instance, calling for tenders could take a minimum of one month while evaluation could extend from three to six months, and tender negotiation can take at least a month thereafter.
o Incorrect projections of inflation, aside from delaying the start of project implementation, can lead to substantial variations between final and bid prices. Similarly, poor tender specifications can also lead to high variations in costs.Weak competition between the bidders for design or construction contracts due to a small number of qualified bidders, or very onerous administrative requirements. For example, during the first phase of the PPI project in Madagascar, every scheme was
522
the subject of only one contract, which did not favor real competition by effectively eliminating the small and medium engineering enterprises.
o Poor supporting infrastructure: The poor state of transportation and basic
infrastructure in land-locked countries such as Ghana and Mali also contribute to the escalation of per hectare irrigation investment costs. As cited in Sijm (1993), Ghana’s transport infrastructure used to be among the best in Africa before it was hit by economic crises in the early 1970s and the mid 1990s. The transport sector suffered because of the lack of: (a) foreign exchange to import vehicles, spare parts and fuel; (b) funding for investments, repairs, and maintenance; and (c) experienced and well-motivated staff at the Ministry of Roads and Highways to manage and maintain the public transport system. In Kenya, it is reported (Samez Consultants, 1996) that many smallholder irrigation clusters were relatively inaccessible due to bad roads. This problem led to difficulties in repairing pumping plants and purchasing needed materials and inputs such as spares, fuel, and even lubricating oil. When population density is low (and land is abundant), high transport costs also result in spatial isolation.
o Supply and price of raw materials
Cement: In Madagascar the cost of concrete represents 17% of the duty-free cost of the cost of rehabilitation of the small irrigation schemes. This cost is made up 60% of cement, which is entirely imported. The locally manufactured cement is not suitable for use in concrete. A single company had the quasi-totality of the market for import and distribution of this product until now. The price of cement is relatively steady but the situation of quasi-monopoly generates some episodes of speculation following a rupture of stock. The frequency of provision also increases its cost because the companies do not maintain big stocks to avoid physical loss of quality and theft. Steel: In Madagascar, the cost of steel represents 8% of the total duty-free cost of rehabilitation. This material is all imported and 5 hardware companies in the capital city assure their import. Sometimes, origin clauses (AFD funds for example) don’t favor competition and could have some repercussion on the price. A survey carried out in Mali by Sofreco (2003) shows also that the prices of construction material have, on average, increased more than the price of paddy, on which the economic profitability of the scheme is calculated. Sofreco shows as well that sometimes considerable differences between some unit prices can exist depending on the financing sources, of the size of the contractors and the nationality of these enterprises. Evidence from Kenya shows that, although most materials used in construction of irrigation projects are locally available (e.g. cement, sand, gravel, timber, steel), construction equipment and specialized equipment (drip, sprinkler and fertigation units) are imported and are subject to government taxes and tariffs.
• Limited local input supply market: Local production of irrigation construction materials and equipment is handicapped by limited (and fragmented) demand for these products, relatively expensive labor, and high royalty payments for the technologies being produced. This results in continued importation of requirements. However, evidence from Kenya indicates that there is such a wide variety of pumps and engines imported by dealers and distributors that getting the right spare parts to complete a project is not easy.
523
Delays in obtaining spares and carrying out repairs adversely affected operations and even minimum maintenance. Suppliers either tend to stock only minor or cheap parts; major and relatively expensive parts are and imported on-demand. Related to this was the limited network of suppliers and service providers in close proximity to the irrigation schemes, which further hinders the acquisition of spare parts in a timely fashion, and also contributes to higher prices.
Fiscal policies: The impact of customs duties and taxes on irrigation investment costs is generally small where construction or rehabilitation is undertaken under the umbrella of specific projects that are exempted from these levies. However many materials necessary for the operation and maintenance of the schemes are imported and therefore subject to these duties and taxes. A similar situation applies to investments by the private sector. In some cases, donors insist that materials and equipment be sourced from their own countries, which also contributes to cost escalation: a 5 horsepower petrol engine driven pump-set from India capable of irrigating a 2 hectare piece of land costs US$ 359 while a pump to do similar work from Japan costs US$ 577; a 125mm sluice valve from Britain costs US$ 155 and a similar one from India is only US$ 40 (Muthee and Ndiritu 2003).
Planning and timing of operations is important
• Project management: Careful planning can help avoid unnecessary immobilization of plant and equipment (and idling personnel), such as during the rainy season, or redoing construction work that may not have attained its full strength before the beginning of rains. In relation to incentives for the users, the project must be described well and fully explained to the beneficiaries, who must be invited to express their priorities clearly and to identify their possible contribution to the project. It is therefore necessary to set apart an explicit phase of explanation and dialogue before the start of the project. There are numerous examples of structures that have been destroyed even before their first use because their utility was not either fully explained or accepted (devices for water flow regulation or measurement, for example). The period between this phase of explanation and the commencement of the project must not be too long to avoid loss of interest on the part of the beneficiaries. The interest of the users can be assessed by their contribution to the project. This is the concept of progressive execution of work put in place by the PPI2 project in Madagascar -- the starting point of a new phase of work on a scheme was bound to the completion of previous work by the beneficiaries or to the demonstration of good management of the existing infrastructure.
Administrative delay: The slowness of an overly centralized public administration in attending to delivery orders and payments of contractors could cause unnecessary expenses for the companies concerned (e.g. workers and equipment immobilized). The time lags between the signatures of contracts, the carrying out of work and the processing of payments by the administration don't always allow the expected calendar of payments to the companies to be respected. This could result in the companies seeking other more expensive modes of financing. Ultimately, these costs also get incorporated in the computation of their profit margins. Sometimes, very long delays between the studies and the actual implementation could even lead to restarting the studies because of changed conditions.
524
Launching work during periods of rain: During the rainy season, the contractors are obliged to stop work in order not to incur the risk of redoing them. This work stoppage gives rise to delay in the completion of work. Although this delay doesn't entail a change in the approximate cost of the contract, it is often taken into account in fixing the profit margins of the enterprises. Otherwise, the cost incurred on account of such work stoppages has an adverse effect on the quality of work. On the other hand, the approach of the rainy season could also force the contractors to use costlier devices expensive to accelerate work. CONCLUSION In considering the costs of irrigation projects, one should remember that this is only looking at one side of a coin. It is not that idea of this report that this single criterion be used in formulating an investment strategy. Ultimately, this consideration has to be balanced with potential trade-offs with costs of operating and maintenance, project profitability and sustainability. If the objective is to ensure greater sustainability by minimizing maintenance and operation costs to make them easily affordable to farmers and public institutions managing schemes, a relatively high initial investment cost can be justified. If donors and governments are concerned with irrigating a larger area and bigger number of farmers, then pursuit of relatively cheaper investment costs per hectare should be properly evaluated especially if it will mean potentially higher operation and maintenance which farmers are to shoulder. Project investment options will be determined by the various actors in a project and the ultimate choice may reflect the preference of the most dominant actor:
The users - The participation of the producers in the implementation of their schemes is an important factor of cost reduction. Their involvement from the stage of project design guarantees a better appropriation of the scheme by the population and creates an awareness of the needs and constraints related to their operation and maintenance. The tertiary networks and parts of the secondary networks as well as the leveling of their fields could be undertaken by the producers. However, this logic of user involvement must not be pursued to an extreme where use of manual labor results in poor quality work and eventually increased operational costs of the scheme. Users would have interest to pursue relatively more costly investments if it would mean lowered operating and maintenance costs for them. The State played a dominant role in irrigation in the past, but is now gradually disengaging from direct involvement in the management of irrigation schemes. However, it should continue to take responsibility for support services and infrastructure such as roads and markets, education, agricultural policies and institutions, including: • Creation of market incentives, promoting professionalism among the local enterprises and entrepreneurs, and facilitating dialogue between different actors in the domain of irrigation;
• Setting up technical and economic norms, quality controls, monitoring of transactions; and • Facilitating information exchange.
The private sector – The existence of banks, supply or marketing institutions, consulting and construction companies gives rise to a certain dynamism, competition, and transparency of interventions, which can all have an important influence on irrigation investments costs.

525
Remaining Questions Despite the contributions of the individual case studies, many questions remain unanswered. They cannot all be resolved in this report and would merit further (and perhaps separate) investigation or will be addressed in the full report with project data from the donor partners in this Collaborative Program:
• Among the factors identified, which are the key ones that if addressed, investment costs can meaningfully be reduced?
• Even if for projects where investment costs can be established to be relatively cheap, there is the question of sustainability and perhaps trade-offs such as higher recurrent costs which farmers are expected to shoulder which in turn can affect the project’s sustainability. To what extent should the cost reduction objective be pursued against other objectives or in what conditions should this goal be solely pursued?
• What is the importance of the farmers’ contribution in project costs and if this has any impact at all in reducing costs?
• Are there differences in maintenance and operating costs by producer/water user associations as against public institutions?
The above are some of the key questions which the case studies will only provide indicative answers which would be difficult to generalize.
526
9
AGRICULTURAL WATER DEVELOPMENT FOR POVERTY REDUCTION IN EAST & SOUTHERN AFRICA
KEY POINTS FROM IFAD-FUNDED STUDY
(ADVANCE DRAFT SUBJECT TO CLEARANCE BY IFAD – 07.10.04)107
107 This is a preliminary draft only and is subject to clearance by IFAD’s Management.
527
Agricultural Water Development and Poverty Reduction 9.1 The case studies have shown that investment in agricultural water development has a significant
impact on poverty reduction. In the cases studied, without the investment project108 the beneficiaries were living in absolute poverty – with an average income of less than USD1.00 per day per household109. Incremental income accruing to households as a result of direct participation in the projects averaged USD2.50 per day per household, representing an increase of 150%. Part of this income is spent on employing up to 100 person days of labour from outside the household, paid a cash or in kind equivalent of approximately USD1.00 per labour day. It is estimated that up to 1.6 additional households, over and above those directly participating, are able to secure their household food requirements in this way.
9.2 In addition to increased food supply, employment and incomes, interventions have generated a number of other tangible direct impacts on livelihoods in the project areas, including:
improved housing;
ability to accumulate assets (particularly livestock and farming equipment, such as ploughs);
ability to pay school fees;
improved diet and nutrition; and
ability to afford better clothing.
9.3 Although not quantified, the most visible and striking impact has been improved housing – and there is no doubt that this has been a direct impact of the interventions. Indirect impacts have included increased local trade and growth in ‘downstream’ industries (including small-scale and urban agro-processing as well as workshops for manufacturing farming equipment and architectural goods, such as windows and door frames). It is unlikely that any other type of intervention in the project areas – such as extension for rainfed agriculture or livestock development – would have had the same level of impact, although in some cases investment in rural roads would enhance impact by opening up trade.
9.4 However, the projects studied are not as successful as expected at design, or as reported in M&E set pieces (such as mid-term reviews and evaluations) or, indeed, as they could be.
Beneficiaries and Targeting 9.5 In general, the approach to targeting on IFAD-assisted projects has been to prioritise regions
within a country that contain high incidences of absolute poverty and, within that context, to define strata of the population to which project interventions can be targeted. How these strata are defined varies depending on the type of project the socio-economic characteristics of the project area. Some designs have specified that certain percentages of female-headed households, or youths or other disadvantaged groups must be included in those who are to directly benefit. However, it is recognised that the ‘poorest of the poor’ cannot always be directly targeted, often because it is not practical to do so with the available the available socio-economic information or because the poorest stratum does not have the resources required to successfully participate, no matter how limited these may be.
108 A distinction is made here between the cases of full scale investment projects and grant-assisted pilot projects such as the ‘Rural Enterprise and Agri-Services Promotion Project’ in Kenya and the various alternative agricultural water development projects in Kenya, Tanzania and Zimbabwe. 109 Note: per household, rather than per capita.

528
9.6 Nevertheless, the investment projects studied have included at least the numbers of the poorest stratum expected at appraisal. Moreover, poorer participants have clearly benefited from the resourcefulness and drive of better-off participants. Non-participating poorer households have also benefited from the inclusion of the better off, through direct employment and donations (e.g. at Maunganidze, Zimbabwe).
9.7 The case study on the Rural Enterprise and Agri-Business Promotion Project (REAP) in Kenya, in particular, has suggested that investment in agricultural water development for market-linked high value crop production by farmer-managed, commercially run business entities can provide opportunities for employment and profit-sharing by the poorest stratum. This is because, if properly done, such a model does not necessarily require that participants possess any significant own resources.
Cost Effectiveness 9.8 The unit cost of the various agricultural water development interventions considered in the case
studies, on a per hectare and per beneficiary household basis, is shown in Appendix A together with details of intended use, estimated incremental benefits and estimated benefit-cost ratio (calculated using discounted cash flow techniques). With two exceptions (Dombolidenje and Maunganidze, both in Zimbabwe), unit capital costs per hectare and per beneficiary household have fallen within the normal range of costs for IFAD-assisted agricultural water development projects. In that respect, therefore, the case studies can be taken as representative of IFAD’s portfolio. With one exception (Madagascar), the estimated benefit-cost ratios are marginal (assuming a minimum discount rate of 8%)110. They are also lower than expected at appraisal or as indicated by subsequent analyses (e.g. for sub-project feasibility studies, mid-term reviews and evaluations).
9.9 The main reason for lower than expected benefit-cost ratios was that productivity is lower than expected, although in one case (Dombolidenje, which required the construction of a new dam) capital costs were also much greater than expected. Productivity was lower than expected either because the targets set were unachievable (e.g. because of over-ambitious assumptions with regard to water supply, as in Madagascar and Tanzania) or because of sub-optimal
9.10 It is difficult to generalise, but the overwhelming impression was that there is a lack of awareness, among all stakeholders (and denial among some), of low productivity levels – and therefore a lack of direction in addressing the constraints.
Participation and Empowerment 9.11 The case studies included two projects in Zimbabwe on which contrasting approaches were
adopted towards participation. The decision to invest in Maunganidze was taken at national level; farmers did not know that an irrigation scheme would be constructed until the contractor arrived on site. On completion, however, farmers took full responsibility for management as well as O&M of the scheme and have managed their responsibility reasonably well so far, although the scheme could do better in terms of productivity. The decision to construct Dombolidenje Dam and Irrigation scheme was taken at district level, following a long process of capacity building and participatory planning. It has not been a very profitable investment. The conclusion from this is not that participation is a waste of time (although it does take time), but that other things may be as, or even more, important – such as accessing markets, ensuring physical and financial feasibility, as well as ensuring accountability for things that go wrong.
9.12 The case studies suggested that participation has gone only part of the way: smallholder farmers are being expected to commercialize, but they are not treated as commercial farmers. They can participate in logframe planning but they are not empowered to decide whether a proposed
110 In other words, assuming that the minimum acceptable IRR is 8%.
529
subproject is the best of the available options in financial terms, or whether the service provider is cost-effective, or to negotiate their way for fair prices or in river basin planning.
Market Linkages 9.13 The case studies included two projects for which grants had been provided to pilot innovative
market linkage interventions – one supporting Maunganidze, among other projects in Zimbabwe, and the other the Kenya REAP Project. The project in Zimbabwe was implemented by a national NGO and that in Kenya by an international NGO.
9.14 At Maunganidze, the project had facilitated contract growing and had guaranteed seasonal credit, as well as providing technical advice. However, it did not have an exit strategy. It was apparently unaware that yields were much lower than expected and it therefore made no attempt to address the problem. Moreover, it had apparently not noticed, in a highly inflationary environment, that the price being paid for the main commodity – canning tomatoes – was stale (USD0.02 per kg, or less than one percent of the retail price).
9.15 At REAP, the intention was to facilitate the entry of smallholder farmers into commercial horticultural export production. However, instead of facilitating it, the NGO took responsibility for production and marketing and later discovered that it was not fully competent to do so.
9.16 In both cases the rationale and basic design concept was sound, but not very detailed, and the outcome unexpected. The lessons from this experience are that, to obtain value from pilot projects such as these, (a) it would have been worth investing additional time and money in more explicit design and feasibility work, (b) NGOs should not be relied on to provide business skills (unless they are specialised to do so) and (c) better supervision is necessary to keep on track.
Profitability 9.17 Commercialization of smallholder agriculture, as a means of poverty reduction, is a strategic
thrust of most governments in the region. By definition, commercial smallholder irrigation means the profitable use of land, water, capital and labour. However, apart from that for manufacturing and distributing treadle pumps in Tanzania and Kenya, none of the projects studied, including the two market linkage support interventions in Kenya and Zimbabwe, was as profitable as it should have been. Overall, the concept of profit has not yet been mainstreamed in project design and implementation: a dependency syndrome prevails.
Alternative Agricultural Water Development 9.18 There has been growing interest within the region in recent years in ‘water harvesting’ as an
alternative to conventional irrigation, but there is little agreement on the definition of the term. For example, much of what would be considered as conventional irrigation by some (for example the construction of small storage dams – or Mara Bunds – for regulating water supplies to paddy fields under MaraFIP, Tanzania) is considered as water harvesting by others. Water harvesting is therefore not necessarily an alternative to irrigation.
9.19 However, the term ‘water harvesting’ is usually employed as an umbrella term describing a range of methods of collecting and concentrating various forms of rainfall runoff (rooftop runoff, overland flow, stream flow) for various purposes (agricultural, livestock, domestic and others). A substantial amount of interesting applied research has already been carried out under this umbrella – examples of which were visited during the field work. However, the work to date has not clearly demonstrated physical and financial feasibility.
9.20 For the time being, therefore, water harvesting does not offer any promise of alternatives, low cost or otherwise, to what is generally regarded as irrigation development. Stakeholders must make do

530
with what is known. One possible exception to this conclusion is conservation agriculture – i.e. in-situ moisture conservation for yield stability.
Treadle Pumps 9.21 The case study on a DFID-assisted intervention to establish a market chain for treadle pumps in
Kenya and Tanzania demonstrated that that well-designed pumps, manufactured and sold by the private sector, are affordable (at about USD85 per unit, or USD420 per hectare) and profitable investments for smallholders. It also demonstrated that a specialised NGO can be business oriented.
9.22 Although only a small sample of pumps in operation was visited, the common finding was that, where the pumps were used for irrigation, this is for the production of high value horticultural crops for the local market. Incremental farm income from such use can be as high as USD500 per year per pump. Furthermore, each pump can provide full time employment for at least two people (for pumping and crop production). Users expressed general satisfaction with the pump and a few indicated that they would buy another. However, pest and disease control is poor, yields are well below potential and farmers complained that they do not have access to technical advice on how to make optimum use of the pumps.
9.23 Approtec’s role in the intervention was to design the pump, facilitate manufacturing by the private sector and support market development (including, in some cases, the provision of credit to manufacturers, wholesalers and retailers). The cost of this support was some several millions of USD and it is unlikely that borrowers would consider investing loan funds to replicate such an enterprise elsewhere. However, if bilateral donors were willing to finance development and marketing of the pumps, they should also consider parallel support to integrating private sector crop production support services.
HIV/AIDS 9.24 Although not quantified, the impact of HIV/AIDS was apparent in most case studies and most
probably contributes significantly to low productivity. HIV/AIDS had not yet been ‘mainstreamed’ into the projects studied, all of which (apart from that for treadle pumps and that for alternative agricultural water development) had been appraised in the previous decade. It is however being mainstreamed in the new generation of IFAD-assisted agricultural water development projects, such as the Lower Usuthu Smallholder Irrigation Project (LUSIP – co-financed by AfDB, among others), which includes a substantial health component linked to irrigation development. LUSIP provides for awareness and education campaigns, the construction and staffing of a new, self-financing clinic and prophylaxis, as well as practical monitoring of proxy indicators (e.g. incidences of cases of STDs, respiratory problems, skin rashes and diarrhoea, at existing and proposed clinics).
Monitoring and Evaluation 9.25 Monitoring and evaluation has been poorly designed and executed throughout the cases studied:
there has been insufficient focus on the prime objective of income poverty reduction. Monitoring systems need to record the proxies for incremental income, i.e. irrigable areas (by season), cropping patterns, inputs, yields and prices. If commercialization of smallholder irrigation is the strategy, farmers should be maintaining their own M&E of these indicators anyway.
Sustainability 9.26 Simple, low cost, gravity fed irrigation of the type developed in Tanzania (PIDP and MaraFIP)
and Madagascar for rice production can be sustainable, as can pumped groundwater irrigation of the type developed at Maunganidze in Zimbabwe. However, the case studies have shown that
531
agricultural water development for smallholders can only be sustainable if (a) the physical works function as intended and (b) the investment is financially viable at the farm level.
Supervision, Quality Assurance and Implementation Support 9.27 That project outcomes have failed to meet expectations suggests either design faults or ineffective
implementation. However, little fault could be found with the design of the projects studied. This then brings implementation into question, in which case the quality of supervision is also questionable.
9.28 The case studies did not indicate that supervision missions had positively influenced the quality of project outcomes, or ensured sustainability. It would be unreasonable to think they could: they do not have sufficient resources to be strong enough technically to provide implementation support. What has been missing during implementation is access to sound technical and financial advice. But this needs to be provided as an integral part of the institutional arrangements for the project.
Mindset Change 9.29 Since development strategies are now based on commercialisation and profit, the case studies
suggest the need for mindset change among all stakeholders. Training for transformation (which appears to be relatively unknown outside Zimbabwe) would be a good starting point. Farmers would then begin to consider the concept of empowerment, about profit rather than welfare and whether the existing legal framework suits their purpose or change is necessary.

532