case studies of power quality surveys using model … studies of power quality surveys using model...
TRANSCRIPT

Case Studies of
Power Quality Surveys
using
Model 3196 Power Quality Analyzer
HIOKI E.E. CORPORATION
October 2004Rev. 3
Index
Power Quality Basics: Current Power Supply Environment Page 1
Power Quality Standards Page 1
Main Power Quality Parameters Page 2 to 4
Case Study 1: Inrush Current and Current RMS Value of a Dryer Page 5 to 6
Case Study 2: Switching of Power Factor ImprovementCapacitor Page 7
Case Study 3: Voltage Dip (Instantaneous Voltage Drop- at Receptacle
Page 8 to 9
Case Study 4: Voltage Dip (Instantaneous Voltage Drop)- at Distribution Panel
Page 10
Case Study 5: Transient Overvoltage Page 11
Case Study 6: Periodical Instantaneous Voltage Drop Page 12
Case Study 7: General UPS Switching Waveform Page 13
Case Study 8: Voltage Waveform Noise & UPS Switching Page 14 to 15
Case Study 9: Voltage Dip in a Factory Page 16 to 18
Case Study 10: Inflow and Outflow of Harmonics Page 19 to 22
Appendix: Power Quality Survey Procedures Page 23 to 24

- page 1 -
Power Quality Basics
Current Power Supply Environment
Power Quality Standards
Various factors can contribute to worsening power quality.
International
Power Quality
Deterioration
Open market
Tough competition tocut costs
Increase use of PCsand inverter devices
Connection with newenergy sources (wind,solar, gas turbine, etc.)
Connection with on-site power supply
Connectionmixes thedifferentpower
characteristics
Europe
U.S.A.
Standard Title Published Comment
IEC61000-4-7
IEC61000-4-15IEC61000-4-30
EN50160
IEEE 1159
IEEE 519
IEEE 446
ANSI C84.1
General guide on harmonics and inter-harmonics measurements andinstrumentation, for power supply systemsand equipment connected thereto
19912002 revised
Actualization of inter-harmonic concept (fromrevision)
Flicker meter - Functional and designspecificationsTesting and measurement techniquesPower Quality measurement methods
19972003 A1
2003
120V/60Hz added inamendment
New standard
Standard Title Published Comment
Standard Title Published Comment
Voltage Characteristics of electricitysupplied by public distribution systems
1995,1999 revised
General power qualitystandard
IEEE Recommended Practice forMonitoring Electric Power Quality
IEEE Recommended Practice andRequirementsIEEE Recommended Practice forEmergency and Standby Power Systemsfor Industrial and Commercial ApplicationsElectrical Power Systems and Equipment -Voltage Ratings (60Hz)
1995
1992
1995
1995
Anomaly voltageClassification of basictermsStandards for harmoniclimit values
Describes the CBEMAcurve
Voltage limit values

- page 2 -
ITIC (CBEMA) curveThe ITIC curve judges the allowable level ofvoltage RMS fluctuation from the voltage swell,voltage dip and interruption events.The analysis is made by the period and depth ofeach event according to the limit value of the ITICcurve.
The ITIC (Information Technology IndustryCouncil) curve is the most recent version of theolder CBEMA (Computer and BusinessEquipment Manufacturers Association) curve.Both were created by CBEMA. The originalCBEMA curve was widely used in the U.S.A.
Main Power Quality Parameters1. Transient overvoltage (impulse)
1) PhenomenonRadical changes in voltage with high voltagepeaks
2) Cause
3) Damage
4) Analysis
Lightning strikesPower circuit switchingClosure of inductive circuitsArc to the groundLoad switchingContact of a bouncing relay
Destruction of power supplies ofequipmentEquipment reset
Waveform (Maximum voltage level, Risetime, Phase angle, Fluctuation,Repeatability)The faster rise time means a closeroccurring point.
2. Voltage Dip1) Phenomenon
Instantaneous drop of RMS voltage2) Cause
3) Damage
Large inrush current by turning on heavyloadsAccident in the distribution network(Lightning, snow, ice, contact of birds/trees, effects of accidents)Short-circuit
Stop or equipment reset

- page 3 -
3. Voltage Swell1) Phenomenon
Instantaneous rise of RMS voltage2) Cause
3) Damage
Lightning strikesIntroducing heavy loads
Destruction of power supplies inequipment
4. Instantaneous Interruptions1) Phenomenon
Instantaneous or short/long term poweroutage
2) Cause
3) Damage
Accident on distribution network(Lightning, snow, ice, contact of birds/trees, effects of accidents)Short-circuit
Stop or equipment reset
5. Unbalance Factor1) Phenomenon
Imbalance of each phase in 3-phase system2) Cause
3) Damage
Imbalance of loads by 1-phase loadconnection (especially long distributionlines)Transformer capacity difference atreceptacle
Overheating of a 3-phase inductive motoror transformerStop equipment by 3E relay tripping (over-current, missing phase, reverse-phase)Uneven motor rotation

6. Harmonics1) Phenomenon
Voltage or current waveform distortion2) Cause
3) Damage
Thyristor powered conversion devicesInverter, Variable frequency drives
Overheating, burning, abnormal sounds orvibration sound caused by the inflow ofharmonic current to the equipmentMalfunctions due to the harmonics voltage(overheating or burning of reactor forphase advancing capacitor)
7. Flicker1) Phenomenon
Regularly repeated voltage impulses spanningone or more cycles which cause flicker in thelighting device
2) Cause
3) Damage
Arc/blast furnacesArc welding
Flicker in the lighting deviceEquipment malfunction
- page 4 -
- page 5 -
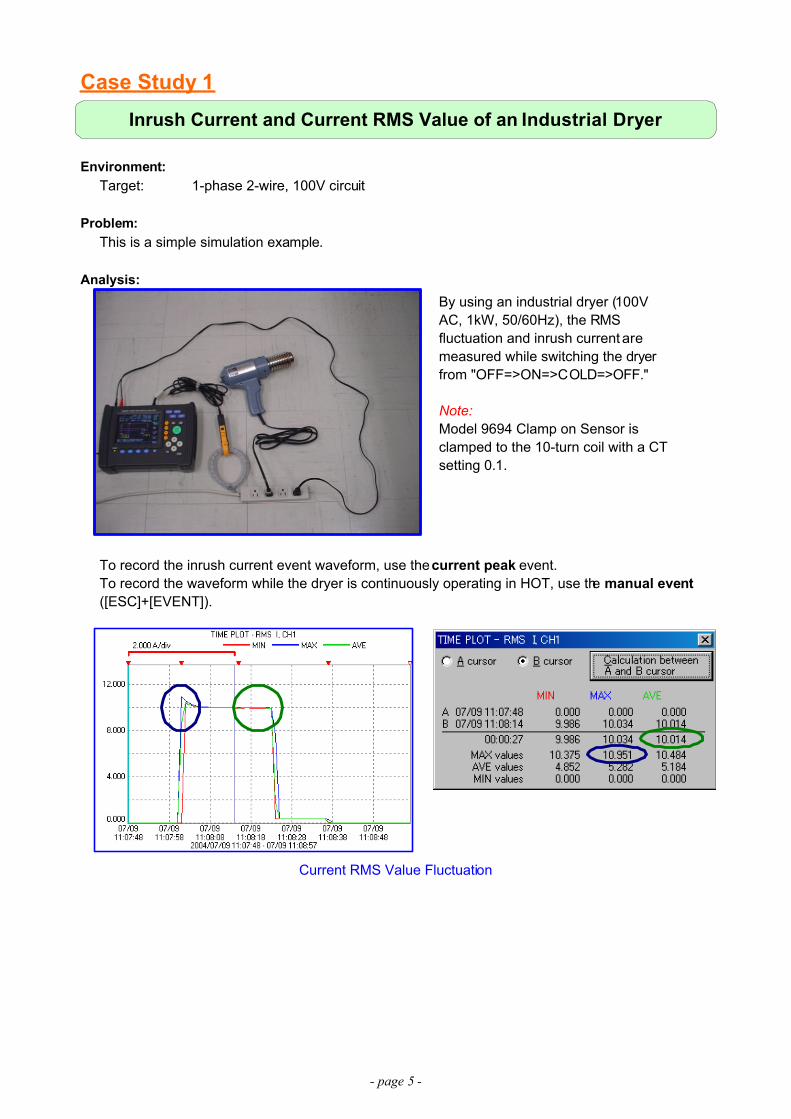
Case Study 1Inrush Current and Current RMS Value of an Industrial Dryer
Environment:
Problem:
Analysis:
Target: 1-phase 2-wire, 100V circuit
This is a simple simulation example.
By using an industrial dryer (100VAC, 1kW, 50/60Hz), the RMSfluctuation and inrush current aremeasured while switching the dryerfrom "OFF=>ON=>COLD=>OFF."
Note:Model 9694 Clamp on Sensor isclamped to the 10-turn coil with a CTsetting 0.1.
To record the inrush current event waveform, use the current peak event.To record the waveform while the dryer is continuously operating in HOT, use the manual event([ESC]+[EVENT]).
Current RMS Value Fluctuation

- page 6 -
Fluctuation of Current Waveform Peak (+) Fluctuation of Current Waveform Peak (-)
Fluctuation of Voltage RMS Value Fluctuation of Active Power RMS Value
A voltage drop of about 4Vrms is measured when the dryer is in operation.The maximum power is 1.1071kW
Inrush Current Waveform
- page 7 -
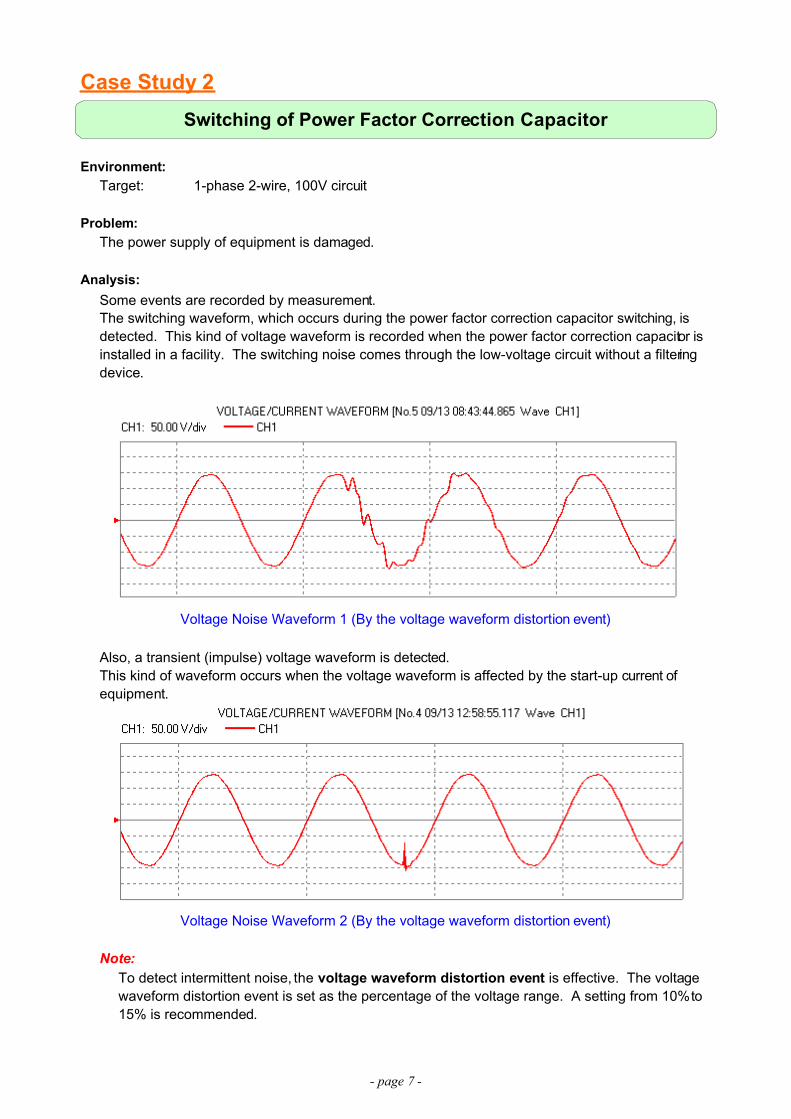
Case Study 2Switching of Power Factor Correction Capacitor
Environment:
Problem:
Analysis:
Target: 1-phase 2-wire, 100V circuit
The power supply of equipment is damaged.
Some events are recorded by measurement.The switching waveform, which occurs during the power factor correction capacitor switching, isdetected. This kind of voltage waveform is recorded when the power factor correction capacitor isinstalled in a facility. The switching noise comes through the low-voltage circuit without a filteringdevice.
Voltage Noise Waveform 1 (By the voltage waveform distortion event)
Also, a transient (impulse) voltage waveform is detected.This kind of waveform occurs when the voltage waveform is affected by the start-up current ofequipment.
Voltage Noise Waveform 2 (By the voltage waveform distortion event)
To detect intermittent noise, the voltage waveform distortion event is effective. The voltagewaveform distortion event is set as the percentage of the voltage range. A setting from 10% to15% is recommended.
Note:

- page 8 -
Case Study 3Voltage Dip (Instantaneous Voltage Drop) - at Receptacle
Environment:
Problem and Analysis:
Target: HIOKI headquarters building,3-phase 4-wire, 6.6kV receptacle, Secondary side of PT
While measuring for 1 year at the receptacle of a 3-phase 6.6kV circuit, a voltage dip is detectedonly during a lightning strike. This voltage dip occurred 6 times in 3 consecutive days (August 5 to7, 2003). The residual voltage is very low and a long period is detected on CH3 (T-R phase) as4.708kV for 109ms.
1 year from June, 2003 to May, 2004Measured period:
Voltage Fluctuation
Classification in EN50160 mode(Simultaneous event on 3 phases are counted as one.)
Voltage Dip Evaluation by ITIC Curve(plotted for each phase separately)

- page 9 -
Event Voltage Fluctuation of the Lowest Residual Voltage and the Shortest Period Voltage Dip
The high current of a lightning strike increases the electric potential of towers. The voltage appliedto insulators exceeds their withstanding voltage, thus damaging the insulators.
Instantaneous voltage dropPower outage
Protectiverelay
Transformer
Breaker
1. Lightning strike
2. Problem on distribution
3. Problem on network
4. Instantaneous voltage drop
5. Malfunction of equipment
Path of a Voltage Dip
Lightning strike
Earth

- page 10 -
Case Study 4Voltage Dip (Instantaneous Voltage Drop) - at Distribution Panel
Environment:
Problem and Analysis:
Target: HIOKI headquarters building, East side, 5th floor3-phase 3-wire, 200V distribution panel
4 voltage dips caused by lightning were detected during measurement (different period than CaseStudy 3). The distribution panel (1-phase 3-wire) was affected by the voltage dip that occurred atthe high voltage distribution network. The table below shows the residual voltage and period ofeach voltage dip. Voltage dips caused by the lightning are unpreventable by the power distributioncompanies. Therefore, users should take appropriate countermeasures such as connecting a UPSto their PCs.
From June 9, 2002 to August 9, 2002Measured period:
Residual Voltage Period1st voltage dip2nd voltage dip3rd voltage dip4th voltage dip
63Vrms47Vrms
82Vrms56Vrms
117ms109ms50ms
116ms
Event Voltage Fluctuation at the 2nd Voltage Dip
Voltage and Current Waveforms at the 2nd Voltage Dip

- page 11 -
Case Study 5Transient Overvoltage
Environment:
Analysis:
Target: Factory, 3-phase 3-wire, 200V circuit
A transient overvoltage was detected in all events occurring several times during themeasurement. However, the cause of the transient could not be determined, unfortunately.
Problem:The screen of equipment does not correctly display.
Analysis of transient waveformOccurred on all 3 phases (R-S, S-T, T-R) simultaneously.1)Occurred twice in 1 cycle of commercial waveform, and the interval between 2 events is820µs.
2)
The level is between 120V to 260V in peak-to-peak.3)The frequency is between 10kHz and 30kHz.4)
The threshold set at 1/2 of the waveform peak value is effective for the transient overvoltage.For example, set the threshold at 0.07kV for 100Vrms circuit, and 0.14kV for 200Vrms circuit.
Note:Analysis of Transient Overvoltage
U1 U2 U3Max. valueMin. valueTransientp-p value
-116.0V-329.3V
323.4V153.5V
98.4V-55.1V
213.3V 169.9V 153.5V

- page 12 -
Case Study 6Periodical Instantaneous Voltage Drop
Environment:
Analysis:
Target: Retail store, 1-phase 2-wire, 100V outlet
When analyzing the voltage RMS value fluctuation, the following two phenomena was observed.(The graph shows measurement during 12 hours in the night for a period of 2 weeks.)
Problem:No apparent trouble is detected, but the voltage fluctuation is big.
Maximum value: 106.70Vrms, Average value: 102.53Vrms, Minimum value: 93.25Vrms1)Instantaneous voltage drop occurred every 13 minutes.2)
Voltage Fluctuation
The cause of the instantaneous voltage drop every 13 minutes is assumed to be the electronicdevice connected to the line as this outlet is turned on or works periodically via a timer. The devicemay have a high inrush current - common in equipment such as laser printers, copy machines,electric heaters, etc. A laser printer consumes current periodically, and causes a voltage drop as aresult of its start-up current consumption. An electric heater also causes a voltage drop from theperiodic inrush current ON/OFF of the thermostat,
There are many instantaneous voltage drops, but the minimum voltage is 93.25Vrms which isabout 7% lower than the nominal voltage. Most equipment works normally at this voltage level.

- page 13 -
Case Study 7General UPS Switching Waveform
Environment:
Problem and Analysis:Most low cost UPS used for general purposes output a square wave. However, most peopleassume a sine wave is output. Here is a sample waveform output by the UPS.
UPS for a desktop PC sold in retail stores (1-phase 2-wire, 100V)
Low cost inverter (variable frequency drive) type1)Commercial purpose without the compensation function for the voltage distortion, etc.2)
Note that the voltage swell or dip occurs in switching if the UPS does not compensate for theperiod.
Event Voltage Fluctuation of UPS Output
Switching fromcommercialpower supply toUPS when thepower supplydrops.
Switching fromUPS tocommercialpower supplywhen the powersupply recovers.
Voltage Waveform when the Power Supply Drops(switching from commercial power supply to UPS)
Voltage Waveform when the Power Supply Recovers(switching from UPS to commercial power supply)
Target:

- page 14 -
Case Study 8Voltage Waveform Noise & UPS Switching
Environment:
Analysis:
Target: 1-phase 2-wire, 100V power supply circuit
68 "Wave (voltage waveform distortion)" events were recorded during an 18-day measurementperiod using the following settings on Model 3196. All events are of the same type.
Problem:Malfunction of equipment
Event Settings of Model 3196
Event List

- page 15 -
Next, the waveform of each "wave" event was checked, and 2 types of events were found.
We can assume that the events "switched to a sine wave after the waveform noise" were due to theswitching to the UPS output (stand-by system).
Not switched to a sine wave after the waveform noiseNo.1:Switched to a sine wave after the waveform noiseNo.2:
It appears that waveform No.1 has a higher noise level and should be switched to the UPS output.However, waveform No.2 shows a bigger difference in the current waveform when the voltagewaveform shows the noise. Therefore, we can assume that the transient overvoltage occurssimultaneously when this event occurs. Unfortunately, the transient overvoltage is not detected,because its threshold is set at 0.480kV (480V).
We propose setting the threshold at 1/2 of waveform peak (70V= 0.0718kV for 100V circuit)
No.1: Not Switched to the Sine Wave after the Waveform Noise
No.2 Switched to the Sine Wave after the Waveform Noise
Switched to the sine wave

- page 16 -
Case Study 9Voltage Dip in a Factory
Environment:
Analysis:
Target: A factory in Southeast Asia, 1-phase 2-wire, 100V circuit
Problem:Power supply is damaged.
Voltage fluctuation1.
The following power characteristics were concluded from this 2 week voltage fluctuation graph.
Voltage Fluctuation
No.1
No.2
No.3
Unfortunately, sufficient event data was not recorded in No.1 and No.2. , so that detailedanalysis was not possible. The important point to note is that a large voltage fluctuationoccurred between 9 p.m. and 9 a.m. everyday (No.3), and the fluctuation was about 50V(between 75Vrms and 125Vrms).
Event data2.The voltage dip (instantaneous voltage drop) occurred frequently at night. Only 5 voltagedips were detectable in a 1s period. The situation of voltage dip occurrence demonstratesthe same tendency.This is the analysis of one voltage dip event.
When the depth of the voltage dip reaches 90Vrms, the power supply is switchedfrom the commercial supply to the UPS.
(1)
When the power supply is switched to the UPS, the voltage RMS value increases to116Vrms (125Vrms maximum).
(2)
The voltage waveform changes from the sine wave to the square wave in the UPSsupply.
(3)
The square wave continues for about 1.25s(4)(5) The power supply is changed from the UPS to the commercial supply later. Upon
this switching, the voltage drops to 78Vrms (75Vrms minimum) for a short period.
123
Supply voltageMaximumMinimumAverage
Voltage fluctuation graphNo.1 (blue)
No.2 (green)
Voltage value131.67Vrms
0.15Vrms98Vrms

- page 17 -
Event Voltage Fluctuation at the Voltage Dip Occurrence
Voltage Waveform at the Start of the Voltage Dip
Voltage Waveform at the End of the Voltage Dip
(1)
(2)
(3)
(4)
(5)
(1) (2) (3)
(4) (5)

- page 18 -
Summary of analysis3.Worse power supply quality occurs frequently at night (9 p.m. to 9 a.m.).1)Worse power quality phenomena starts when the voltage dips.2)Voltage swell occurs when switching from the commercial power to the UPS due to thevoltage dip.
3)
The voltage dip occurs when the commercial power recovers and the power supply isswitched from the UPS to the commercial supply.
4)
Countermeasures4.Primary solution1)
Alternative solution2)
Frequent switching to the UPS because of a voltage dip is not favorable. It appearsthat overload current flows to the equipment due to the voltage dips and swells. Tosolve this problem without fail, the power supply should be stabilized to prevent avoltage dip occurrence.
The UPS used is as the "stand-by power system (SPS)." By changing it to analthough more costly "on-line UPS system", the dips and swells can be reduced duringUPS switching.
Charger Inverter
Battery
Charger
Commercialpower supply
Normal
Interruption
Battery
Inverter
Commercialpower supply
Normal
Interruption
Stand-By Power System
Charger Inverter
Battery
Transformer/ Charger
Commercialpower supply
Normal
Interruption
On-Line UPS System
Line-Interactive System
There are primarily 3 types of UPSavailable in the market: a stand-by powersystem, on-line UPS system and line-interactive system. Stability, reliability andpricing differ between each type.
The simplest type is a stand-by system. Itpasses the commercial power in normalmode and changes to inverter power fromits battery when a voltage drop or thevoltage exceeding the limit i s detected.
On the other hand, an on-line UPS systemalways supplies power via an inverter.The commercial power supply is convertedto DC once, and the back again to AC .The difference is that there is no time lagin battery switching when aninstantaneous power drop or a poweroutage is detected. A stand-by powersystem requires switching time to use thebattery power. This switching perioddiffers between models, but the averageswitching time is about 10ms or less. Thisis a very short period, but malfunctions arestill possible due despite such a shortperiod.
An line-interactive system is a versionbetween the stand-by power system andon-line UPS system. This type outputscommercial power under normalconditions, like the stand-by powersystem, but the voltage is stabilised byusing a transformer. The momentarypower outage still exists on this type inswitching.

- page 19 -
Case Study 10Voltage Dip in a Factory
Environment:
Analysis:
Target: 3-phase 3-wire (3P3W2M), 6.6kV circuit
This is an example of inflow and outflow judgement taken as a result of harmonics measurementUsing a 3-phase 3-wire set up, the overall inflow and outflow of a 3-phase installation are judgedby the harmonic voltage-current phase difference (θsum). When it is between -90 to 0 to +90degrees, it is inflow. Conversely, outflow is determined when the sum is in between -180 to -90 or+90 to +180 degrees.
Time Plot of Harmonic Voltage-Current Phase Difference (fundamental and 5th harmonic)
The fundamental wave (brown) is consumption (inflow) as shown below.Most of the 5th harmonic (green) is also inflow.
The 3rd harmonic (red) is outflow in the graph below. The 7th (blue) harmonic is outflow.The data shows with the vertical lines that the phase difference exceeds 180 degrees and returnsto -180 degrees (or vice versa).
Time Plot of Harmonic Voltage-Current Phase Difference (3rd and 7th harmonics)
Outflow
Outflow
Inflow
Outflow
Outflow
Inflow

OutflowOutflowInflowInflowInflowInflowInflowInflowInflowInflowInflowInflow
- page 20 -
Model 9624 PQA HiVIEW and Model 9624-10 PQA HiVIEW Pro show the harmonic time plotgraph by connecting the maximum and minimum values in each interval with a horizontal line.Therefore, a rapid change is reflected in the time plot graph.
However, the judgment of inflow and outflow is not easy to make using that time plot graph, so werecommend converting the data to CSV format and creating a graph with "AvePhasesum" of therelevant harmonics order only (without using "MaxPhasesum" and "MinPhasesum"), to determinethe inflow and outflow.
<Example 1>
-180
-90
0
90
180
Time
Pha
se d
iffer
ence
[deg
.]
<Example 2>
Red: 3rd harmonic, Green: 5th harmonic, Blue: 7th harmonic
Date
2004/9/32004/9/32004/9/32004/9/32004/9/32004/9/32004/9/32004/9/32004/9/32004/9/32004/9/32004/9/3
Time
6:50:006:55:007:00:007:05:007:10:007:15:007:20:007:25:007:30:007:35:007:40:007:45:00
AvePhasesum (5) Inflow /Outflow
-93.07-90.63-84.20-89.23-87.79-87.42-87.16-86.08-79.51-84.34-80.74-78.41
Calculation=IF(ABS(C2)>90,"Outflow","Inflow")

<Reference> Guideline for the harmonics of distribution ne twork (Japan)
- page 21 -
Official Report of the Ministry of Economics and Industries in Japan:"Guideline for Harmonics Deterrence Countermeasures on Demand-Side that receives High-Voltage or Special High-Voltage" (September 30th, 1994)
* The following shows the limit values which measurement instruments can detect.
-1.5% at 6.6kV system, 3% at special high-voltage system
-2.Upper limit values of harmonics outflow current (mA) per 1kW Contracted Power
Order
Voltage [kV]6.622336677110154220275500
5th 7th 11th 13th 17th 19th 23rdHigherthan23rd
3.51.81.20.590.500.350.250.170.140.07
2.51.3
0.860.420.360.250.180.120.100.05
1.60.820.550.270.230.160.110.080.060.03
1.30.690.460.230.190.130.090.060.050.02
1.00.530.350.170.150.100.070.050.040.02
0.90.470.320.160.130.090.060.040.030.02
0.760.390.260.130.110.070.050.030.030.01
0.700.360.240.120.100.070.050.030.020.01
<Reference> Concept of inflow and outflow of harmonics
Fundamentalwave
Load
Harmonics
Distribution
Measuringinstrument
Measuringthrough VT(PT) orCT for the highand extra-highvoltage network
Outflow
Inflow
Inflow
Outflow
Condition
The harmonics flowsfrom distribution to load
The harmonics flowsfrom load to distribution
CauseDistribution side(The harmonics generated by distribution isbigger than the harmonics generated by load.)Load side(The harmonics generated by load is biggerthan the harmonics generated by distribution.)
Harmonics Voltage (Total Harmonic Voltage Distortion)
Harmonics Current
Load
Distribution
Measuringinstrument
Measuringthrough VT(PT)or CT for the highand extra-highvoltage network

- page 22 -
<Reference> Harmonic Inflow/Outflow judgment on a measurement instrument
-1.Judge the inflow/outflow by the polarity of the harmonic (effective) power. (Judge eachphase and each order independently.)
Judgment by the harmonic power
-2.Judge the inflow or outflow by the harmonic voltage-current phase difference (differencebetween harmonic voltage phase angle and harmonic current phase angle).For 3-phase 3-wire (3P3W2M or 3P3W3M) installations, we recommend using the harmonicvoltage-current phase difference of "sum" value.
Judgment by the harmonic voltage-current phase difference
InflowOutflow
Harmonic power is + (positive).Harmonic power is - (negative).
ProblemThe higher the order, the smaller the harmonics power level.The smaller level makes it difficult to judge the polarity accurately, thusmaking it difficult to judge inflow and outflow.
InflowOutflow
-90 to 0 to +90 degrees-180 to -90 degrees, +90 to +180 degrees
Harmonic voltage-current phase angle
Problem
Judge to see if the high harmonic current level exceeds the limit. Donot watch the harmonic current amplitude level.Then, judge the inflow or outflow by watching the harmonic voltage-current phase difference.
LEAD
LAG
InflowOutflow
Voltage-CurrentPhase Difference
+90deg.
-90deg.
0deg.+/-180deg.

- page 23 -
AppendixPower Quality Survey Procedures
Power quality survey procedures
Step 1:Step 2:Step 3:Step 4:
PurposeLocation of problem (measurement target)Advanced confirmation at site (collecting the site information)Measure using a power quality analyzer
4-1.4-2.4-3.4-4.
Normal condition measurementTime plot recording for a certain periodSelecting the event parameters and thresholdsLong period measurement
Step1: Purpose
Clearly confirm the purpose of the investigation: Purpose 1 or Purpose 2?
1. Researching the condition of the power qualityThere is no specific problem with the power supply, but the condition of the powerquality at the site needs to be known.
Periodical power quality statistic researchResearch before installation of electric equipment
Step2: Location of problem
Specify where the problem is occurring (this becomes the measurement site)
If measurement at multiple sites is possible, detecting the cause of the problem can beeasier and faster.
1. Network circuit inside a substation(Power companies only)
2. Receptacle point (high/low voltage)3. Transformer panel, Distribution panel4. Power supply for electric equipment
(Outlet, etc.)
1. Frequency:50/60Hz
2. Wiring:1P2W/1P3W/3P3W2M/3P3W3M/3P4W
3. Neutral line measurement:ON/OFF (CH4)
4. Nominal voltage:100V to 600V
Points to confirm
2. Investigating the cause of a power abnormalityA quick solution needs to be found to counteract a problem with the power supply.

- page 24 -
Step3: Advanced confirmation at site (collecting the site information)
Collect as much site information as possible.
2
3
1 Details of powersupply problemPeriod of powersupply problem
Confirm the overallsite
Destruction, Damage, Malfunction
Constant, Periodic, Intermittent
Existence of other equipment having the power supply problem,Working cycle of main electric equipment, Added or replacedequipment in the site, Power distribution network check in thesite
Main electric equipment and power distribution network
2
1 Main electricequipment
Power distributionnetwork
Large copy machines, UPS, Elevators, Air-compressors, Air-conditioners compressors, Battery chargers, Cooling equipment,Air-handlers, Timer controlled lighting, Transmission driveequipment
Constant, Periodic, Intermittent
Step4: Measure using a power quality analyzer
Start measurement by using a power quality analyzer
2
3
1 Normal conditionmeasurement
Time plot recordingfor a certain period
Selecting the eventparameters andthresholds
Confirm the instantaneous value in the VIEW screen of 3196.
Voltage level, Voltage waveform, Current waveform, Voltagewaveform distortion (THD)Record the power supply fluctuation without setting events(15min to 1 day).
3196 settings
This can be omitted when urgent measurement is required.
Limit the number events to as few as possible at the beginning.
*Set the thresholds smaller and increase them gradually if toomany events are being recorded.
4 Load periodmeasurement
3196 settings
Power, MAX/MIN/AVE (recommended)P&Harm, MAX/MIN/AVE (to recordharmonic fluctuation
Rec.Data:
Minimum required eventsSwell: 110%Dip: 90%Interruption: 10%Waveform distortion: 5% to 15%Transient: 100V to 200V (for 100V circuit)*
*
MemoryFull: LOOPAutoSave: Binary


HEAD OFFICE: 81 Koizumi, Ueda, Nagano 386-1192, Japan TEL: +81-268-28-0562/FAX +81-268-28-0568 [email protected] www.hioki.co.jp
HIOKI USA CORPORATION 6 Corporate Drive, Cranbury, NJ 08512 U.S.A. TEL +1-609-409-9109 / FAX +1-609-409-9108 [email protected] www.hiokiusa.com
Shanghai Representative Office 1704 Shanghai Times Square Office 93 Huaihai Zhong Road Shanghai, 200021, P.R.China TEL +86-21-6391-0090,0092 FAX +86-21-6391-0360 [email protected] www.hioki.cn
All information correct as of October 31, 2004. All specifications subject to change without notice. Copyright © 2004 HIOKI E.E. Corporation