case school finance update - cde › sites › default › files › docs › cdefinance … ·...
TRANSCRIPT

CASESchool Finance Update
July 26, 2019

Gallagher Amendment - 1982
Intended to set the ratio of property taxes raised from both residential vs. business properties
• Split – 45% residential vs. 55% business – statewide• Residential assessment rate – resets every two years potentially
• 7.15% for 2019 (SB19-255)• 7.20% for 2018• 7.96% from 2003 to 2017 • 21% in 1985
• Under TABOR, this rate cannot rise without a vote of the people
Has had the impact of lower property taxes contributing to school funding Total Program

TABOR Amendment - 1992
Sets limits on the amounts of revenues that can be collected and retained by state and local governments including schools districts
Limits local property tax revenue growth
Requires voter approval for an increase in mill levies, or assessment rates
Most districts have received voter approval to retain excess revenues – the State has not

TABOR Amendment - 1992
Between 1994 and 2006, school district mill levies were decreasing since assessed values were increasing at a rate greater than what TABOR allowed – inflation plus student growth
This continued to cause the state portion of school funding to increase putting even greater pressure on the state budget
Senate Bill 07-199 froze mill levies for districts at the 2006-07 levels
• Total program mill levies cannot go higher than 27 mills – some districts may have levies lower than this

A TABOR SimileFrom Office of State Planning & Budgeting
TABOR Limit
TABOR Refund
General Fund
Cash Funds
Income and Sales taxes
Fees

Amendment 23 - 2000
Requires base per pupil funding to increase by inflation each year in addition to categorical funding
• Categorical funding is provided for programs such as exceptional students, transportation and English language learners
An additional one percent was included for 10 years to attempt to make up losses in funding in prior years
Creates additional pressures on the state budget with these requirements

School District Revenues
School Finance Total Program Funding
Categorical Funding
State Grants (~16 new/increased competitive grants this year)
Federal Grants
Mill Levy Overrides Revenues
Other Local Revenues

Total District Revenues and Expenditures
FY17-18 Total Revenue: $12.3 Billion
Local: 47%
State: 38%
Federal: 6%
Other: 9%
Most revenue to districts are provided through the School Finance Act of 1994: $6.6 Billion or 54% of total revenues

2020 Legislative Session
November 2019 Governor Submits Budget Request for 2020-21THIS IS ONLY A PROPOSAL/PLACEHOLDER!
December 2019 Joint Budget Committee Hearings with DepartmentThe JBC hears about the 2020-21 Budget Request from the Department and seeks additional information
January 2020 Governor Submits Supplementals for 2019-20Adjusts current year’s actual pupil counts, AVs, etc., including Full-Day Kindergarten enrollment
Governor Submits Budget Amendments for 2020-21Revises estimates for next year’s pupil counts, AVs, etc.
Spring 2020 JBC Develops State Budget Through Figure Setting General Assembly Passes the Long Bill based on current law (HB19-246 for School Finance)
Spring 2020 School Finance Bill Is Introduced and PassedAdjusts the Appropriation included in the Long Bill

Timeline for School Finance Payments
• July-November: Projections• Based on Legislative Council funding projections and will include
rescissions
• September-December: Student October Count data collection• October 1 (on or about): Pupil Enrollment Count Date• Mid-November: Duplicate Count Process• Early December: Data Finalized/Upload Supporting Documentation
• December-January: “True Up”• Pupil count and Assessed Valuations updated for the second half of the
year payments• Rescissions updated
• February and Beyond: Audit

Total Program Funding Formula
Total Program Funding
Equals (funded pupil count
times per pupil funding formula)
plus at-risk funding
plus multi-district online
plus extended high school funding
Budget Stabilization Factor is applied after total program is calculated

Factors that adjust base per pupil funding
Per Pupil Funding Formula adjusts for:
• Cost of living: Determined by a legislative study every two years. A higher cost of living equals a higher factor.
• Personnel and non-personnel costs: Personnel costs factor vary by school district based on enrollment. For all districts, employee salaries and benefits represent the largest single expense. As such, the formula directs funding based on these costs.
• Size of district: Similar to the personnel costs factor, the size factor is unique to each district and is determined using enrollment. Small districts have larger size factors than districts with higher enrollment.

Local Share Funding Sources
Local Funding Statewide –37% in FY18-19• Property Taxes – mill levies• Specific Ownership Taxes – vehicle registration fees
State Share Statewide– 63% in FY18-19• Funding from the state provided to each school district whose
Local Share is insufficient to fully fund its Total Program
The percentage split in specific districts varies
Previously, local share was 56% and state share was 44%
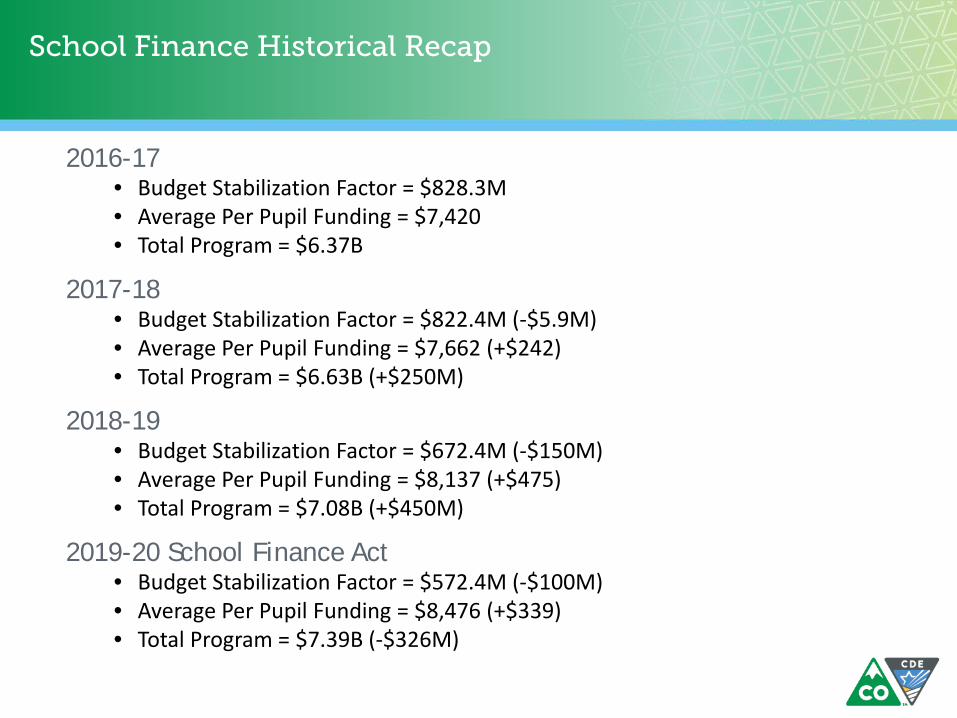
School Finance Historical Recap
2016-17• Budget Stabilization Factor = $828.3M • Average Per Pupil Funding = $7,420• Total Program = $6.37B
2017-18• Budget Stabilization Factor = $822.4M (-$5.9M)• Average Per Pupil Funding = $7,662 (+$242)• Total Program = $6.63B (+$250M)
2018-19• Budget Stabilization Factor = $672.4M (-$150M) • Average Per Pupil Funding = $8,137 (+$475)• Total Program = $7.08B (+$450M)
2019-20 School Finance Act• Budget Stabilization Factor = $572.4M (-$100M) • Average Per Pupil Funding = $8,476 (+$339)• Total Program = $7.39B (-$326M)

School Finance Act (SB 19-246)
Total Program decreased by $325.7M from FY18-19 PSFA to $7.39B
Local Share increased by $359.9M from FY18-19 PSFA
State Share decreased by $34.3M from FY18-19 PSFA
Budget Stabilization Factor was reduced by $100M (requested at a $77M decrease)- a decrease from $672.4M to $572.4M
Average Per Pupil Revenue After BSF increased by $339 to $8,476

School Finance Act (SB 19-246)
Funding for Rural Schools• $20 million
• Same allocation as prior years: 55% large rural and 45% small rural, based upon funded pupil count for the FY 2018-19
• Report required on specific expenditures and how the nonrecurring expenditures are related to improving student learning and the educational environment

School Finance Act (SB 19-246)
ELPA Professional Development and Student Support Program allocation change • Was 75% NEP/LEP and 25% Monitor 1/2
• Change to proportional based upon annual student counts for each group
• To be consistent with change to ELPA per pupil funding allocations made in 2018 School Finance Act
Ninth Grade Success Grant Program• $800,000
• 15% match for small rural, 25% match for other LEPS

School Finance Act (SB 19-246)
Funding for Behavioral Health Issues• $5 million
• $20,000 to each district and CSI
• Remaining amount to be distributed on per pupil basis using FY2018-19 counts (funded pupil count for districts and total enrollment for CSI)
Special Education Funding• $22 million for Tier B students

School Finance Act (SB 19-246)
Health and Wellness Through Comprehensive Quality Physical Education Instruction Pilot Program Grant• $1.1 million from MTCF
• 3 year pilot program grant
• 15 eligible schools or school districts
Student Re-engagement Grant Program • From MTCF

Full-Day Kindergarten Bill (HB 19-1262)
Increases full-day kindergarten funding from 0.58 to 1.0 FTE
Keeps funding for 0.58 for half-day programs
Repurposes current hold-harmless kindergarten funding
Frees up 5,136 Early Childhood At-Risk Enhancement (ECARE) slots for preschool
Transition from half-day to full-day programs is not mandatory; requires districts to submit a plan on how it could phase-in a FDK program
Addresses concerns for declining enrollment districts• Prior year miscoding will be corrected in supplemental

Full-Day Kindergarten Bill (HB 19-1262)
In SY18-19, 49,941 (79%) students were in full-day programs and 13,324 (21%) were in half-day programs
Of the students in full-day programs, 88.5% were funded part-time and 11.5% were funded full-time
Full-time funding has been provided for students:• Funded with ECARE slots
• Eligible students with an IEP
• Students retained because of a SRD
School districts cannot charge tuition for kindergarten students that are receiving funding equivalent to 1.0 FTE

Full-Day Kindergarten Bill (HB 19-1262)
Bill assumes 85% of half-day programs will transition to a full-day program• This equates to an additional 3,789 students transitioning to a
full-day K program next year
The anticipated implementation in SY19-20 represents approximately a 99% utilization/adoption rate for all kindergarten students
This will be trued up during the supplemental process

Full-Day Kindergarten Bill (HB 19-1262)
Planned implementation of Full-Day K:• SY19-20 for an estimated 414 schools representing 97% of the
13,324 students enrolled in half-day programs in SY18-19;
• SY20-21 in 5 schools representing 1% of students;
• SY22-23 in 2 schools representing 1% of students;
• SY23-24 in 1 school representing less than 1% of students; and
• Do not plan to implement full-day kindergarten in 2 schools representing less than 1% of students
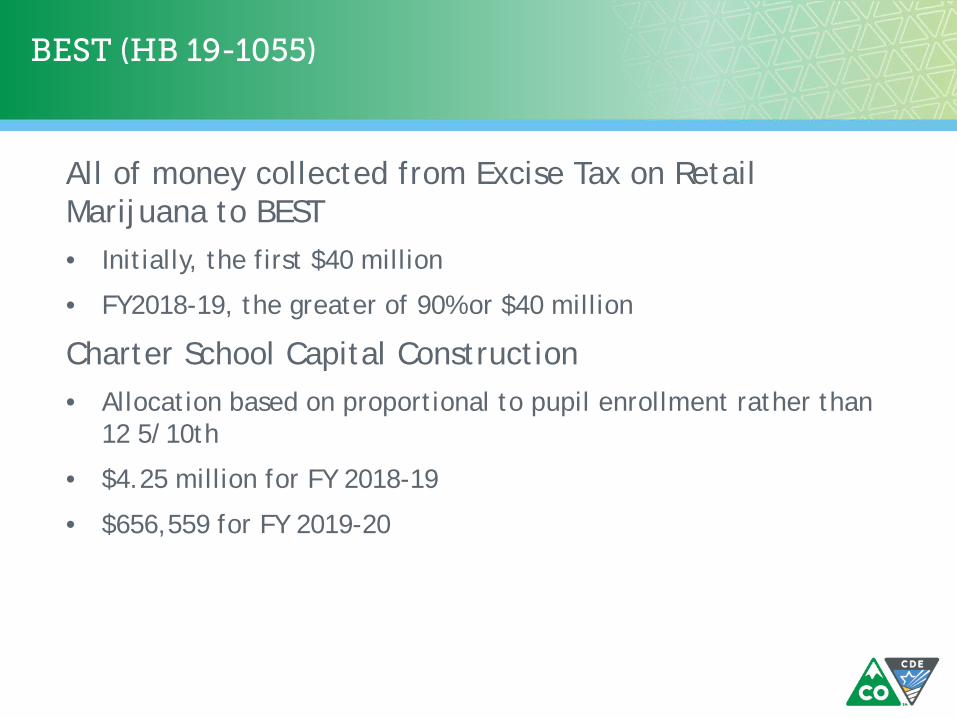
BEST (HB 19-1055)
All of money collected from Excise Tax on Retail Marijuana to BEST • Initially, the first $40 million
• FY2018-19, the greater of 90% or $40 million
Charter School Capital Construction • Allocation based on proportional to pupil enrollment rather than
12 5/10th
• $4.25 million for FY 2018-19
• $656,559 for FY 2019-20

BEST (HB 19-1055)
FY 2019-20 - +$5M Lease Payments
FY 2019-20 - +$50M for Matching Cash Grants
FY 2020-21 - $160M for Matching Cash Grants
Maximum total lease payments increased: • FY2017-18 and FY2018-19 - $100M
• FY2019-20 - $105M
• FY2020-21 - $110M

BEST/Full-Day K Capital Funding (HB 19-1055)
Provides $25 million in formula-based grants for furniture, fixtures, or equipment (FFE) to conduct a full-day kindergarten or a preschool educational program
Calculation incorporates: • Students Enrolled in FDK
• Per Pupil Funding
• Size factor
• FRL Percent
• SPED Percent
• ELL Percent

BEST/Full-Day K Capital Funding (HB 19-1055)
Of the 179 districts, 158 applied for the FFE grants and 21 did not apply. • 153 requested the district’s prorated share of the $25 million
• 5 districts request lesser amounts ranging from $2,800 to $30,000
Distributions: • Districts reviewed assumptions and calculations earlier this week
• Adjustments are being made based on feedback
• Distributions will be made later this week

READ Act (SB19-199)
READ Act per-pupil funding will be less for FY19-20 by approximately 20% compared to previous years• Distribution of funds is anticipated the week of Aug 12th
Modifies allowable funding uses for students with significant reading deficiencies (SRD):• Core reading instructional program on advisory list
• Tutoring services in reading
• Professional development for educators to teach reading
• Targeted, scientifically or evidenced-based intervention services
• Summer school Literacy Program
Webinar Recordings Available: • http://www.cde.state.co.us/coloradoliteracy

Categorical Program Revenues
Funding provided for specific programs that serve particular groups of students or student needs
State and federal revenues only covers a portion of the full cost of these programs
• English Language Proficiency Act (ELPA) – 21% of costs covered• Gifted and Talented Education – 34% of costs covered• Special Education – 37% of costs covered• Transportation – 24% of costs covered • Vocational Education – 30% of costs covered• Small Attendance Centers • Expelled and At-Risk Student Services• Comprehensive Health

Per-Pupil Expenditure Reporting
House Bill 10-1036 Public School Financial Transparency Act
House Bill 14-1292 required development of a financial transparency website
• Translates expenditures for major categories into a format that is readable by the layperson
• Designed to ensure the greatest degree of clarity and comparability by laypersons of expenditures among school sites, school districts, and BOCES
https://coloradok12financialtransparency.com

ESSA Per-Pupil Expenditure Reporting
ESSA requires state report card to include:
the per-pupil expenditures of Federal, State, and local funds, including actual personnel expenditures and actual non-personnel expenditures of federal, state, and local funds, disaggregated by source of funds, for each local education agency and each school in the state for the preceding fiscal year.
Federal reporting is optional for FY2017-18 and is required for FY2018-19
Colorado began reporting school level data for all school districts for FY2017-18 on July 1, 2019

ESSA Per Pupil Expenditures Reporting
Interstate
Financial
Reporting

ESSA Per Pupil Expenditures Reporting

Unpaid Meal Charges
Donations• Donated funds for unpaid meal charges must first be used to
offset bad debt• The use of donated funds should be fair and consistent (not
student specific)• Deposit donated funds outside of the food service fund
Coordination between Food Service, Student October, and Financial operations is critical • Accurate reporting of Free Lunch eligible students is critical for
accurate school finance funding and Title funding• Recommend doing analysis to confirm reasonability of data
before finalization of Student October data submission

School Transportation Unit
Assist districts/charters to maintain compliance of all federal and state regulations/laws pertaining to pupil transportation.
Federal
Federal Motor Carrier Safety Administration (FMCSA)
CDL Drug and Alcohol Training and Testing
CDL licensing/testing/training/physicals
State
State statutes
CDE Minimum Vehicle Standards 1 CCR 301-25
CDE Operation, Maintenance and Annual Inspection Rules 1 CCR 301-26

Federal Motor Carrier Safety Administration Rules
Entry Level CDL Training
• Effective February 2020
• Includes: • Training Provider Registry (TPR)
• Theory and Behind the Wheel
• Self-Certification – Trainer qualifications
• Electronic reporting/subject to audit
• Power Point Developed to Cover Required Theory

Federal Motor Carrier Safety Administration Rules
Drug and Alcohol Clearinghouse
• Effective February 2020
• Includes: • No change to testing procedures
• Pre-employment and Annual Requirements
• Electronic reporting
Seat Belts
• Potential federal legislation and/or federal regulations may be on the horizon