case network studies and analyses 279 - a wider europe: trade relations between an enlarged eu and...
TRANSCRIPT

S t u d i a i A n a l i z y
S t u d i e s & A n a l y s e s
C e n t r u m A n a l i z S p o ł e c z n o – E k o n o m i c z n y c h
C e n t e r f o r S o c i a l
a n d E c o n o m i c R e s e a r c h
2 7 9
Lúcio Vinhas de Souza
A Wider Europe: Trade Relations Between an Enlarged EU and the Russian Federation
W a r s a w , J u l y 2 0 0 4
Materials published here have a working paper character. They can be subject to further
publication. The views and opinions expressed here reflect the author(s) point of view and not
necessarily those of the CASE.
Paper was prepared for the World Bank’s ABCDE (Annual Bank Conference on Development
Economics)-Europe, Brussels, Belgium, 10-11 May, 2004. It was partially done using some of the
outputs produced for the USAID/IRIS-financed project n° 220/001.0-03-337, “Anal ysis of Monetary
and Trade Policy Questions for the Russian Federation”, of which the Author is the manager. The
institutional partners in this project, beyond the IfW, are the ICEG-EC, Hungary, and NES/CEFIR
(New Economic School-Center for Economic and Financial Research), the Russian Federation.
The publication was financed by Rabobank Polska S.A.
Keywords: macroeconomics, macro modeling, transition economics, trade and monetary
economics.
Acknowledgements:
The author thanks the comments of Marek Dabrowski, Daniel Gros and of the participants of the
ABCDE-Europe 2004 Meeting.
© CASE – Center for Social and Economic Research, Warsaw 2004
Graphic Design: Agnieszka Natalia Bury
ISSN 1506-1701, ISBN: 83-7178-342-6
Publisher:
CASE – Center for Social and Economic Research
12 Sienkiewicza, 00-944 Warsaw, Poland
tel.: (48 22) 622 66 27, 828 61 33, fax: (48 22) 828 60 69
e-mail: [email protected]
http://www.case.com.pl/

Contents
Abstract ........................................................................................................................................... 5
Introduction ..................................................................................................................................... 6
1. The GTAP Model ...................................................................................................................... 6
Trade Flows: An overview.......................................................................................................... 8
2. EU Enlargement ..................................................................................................................... 11
3. Russia’s WTO Accession...................................................................................................... 14
4. A Russia-Enlarged EU FTA ................................................................................................... 16
5. Conclusions ........................................................................................................................... 19
References..................................................................................................................................... 20
Annex ............................................................................................................................................. 22

Studies & Analyses No. 279 – A Wider Europe: Trade Relations Between …
4
Lúcio Vinhas de Souza
Lúcio Mauro Vinhas de Souza is a Portuguese citizen. He has a Ph.D. in Economics by the
Tinbergen Institute in the Netherlands, and a B.A. and M.Sc. degrees in Economics by the FE/UNL
in Lisbon, Portugal. Currently he holds the position of Economist at the renowned Kiel Institute for
World Economics (IfW) in Germany. He formerly held positions as Associate Economic Affairs
Officer at the United Nations Secretariat, as “Visiting Fellow” at the ECARES-Free University of
Brussels, the Central Banks of Estonia and Germany, and worked in and/or managed projects for
the European Parliament, the European Union, the World Bank and the USAID. He has a
considerable list of publications in several different languages, mostly in the fields of
macroeconomics, macro modeling, trade and monetary economics.

Studies & Analyses No. 279 – Lúcio Vinhas de Souza
5
Abstract
This paper aims to study the joint effects of the 2004 EU Enlargement and Russia’s entry into
the WTO, and the effects of an eventual Russia-Enlarged EU Free Trade Agreement (FTA). The
paper is organized as follows: in Section I, it starts with the brief description of the model used. The
effects of the 2004 EU Enlargement are estimated on Section II. In Section III, the effects of
Russia’s WTO Accession are simulated up on the benchmark of an Enlarged EU. Section IV
simulates different Russia-EU FTAs, again upon the benchmark of an Enlarged EU. The work ends
with a conclusion.
Studies & Analyses No. 279 – A Wider Europe: Trade Relations Between …
6
Introduction
This paper aims to briefly study the joint effects of the 2004 EU Enlargement1 and Russia’s
eventual entry into the WTO (World Trade Organization) and of the effects of an possible Russia-
EU Free Trade Agreement (FTA). The paper is organized as follows: in Section I, it starts with the
brief description of the model used. The effects of the 2004 EU Enlargement are estimated on
Section II. In Section III, the effects of Russia’s WTO Accession are simulated up on the
benchmark of an Enlarged EU. Section IV simulates different Russia-EU FTAs, again upon the
benchmark of an Enlarged EU. The work ends with a conclusion.
1. The GTAP Model
The framework used in the estimations of this paper is the GTAP model and Database 5.1
version. The GTAP (Global Trade Analysis Project) is a Computable General Equilibrium (CGE)
multi-region global trade model, where inter-regional linkages come mostly from bilateral trade
flows, while input-output (IO) and Social Accounting (SAM) matrixes represent the different intra-
regional productive structure (see Hertel and Tsigas, 1997, for a comprehensive description).
Among its’ most basic assumptions are:It is a static model (the model is solved by the comparison
of the results for two static simulations, the dynamic adjustment path is effectively not
estimated);
• It has a neo-classical structure (i.e., it assumes perfect competition, constant returns to
scale and zero profits);
• It represents total regional consumption by an aggregate agent, called ‘Regional
Household’, whose utility function (Cobb-Douglas) is defined over three consumption
categories (private consumption, savings and government consumption: see Figure I
below);
• It uses the so-called ‘Armington’ assumption for import demand (i.e., goods are
differentiated by country of origin);
• Non-tariff barriers and domestic subsides are not included in the model2;
• World savings are collected by a single agent, called a ‘Global Bank’ (see Figure I).
Different closures possible: one assumes the regional shares of global investment as
fixed, other assumes that the global bank maximizes the rate of return on investment.
1As from May 1 2004, Cyprus, the Czech Republic, Estonia, Hungary, Latvia, Lithuania, Malta, Poland, Slovakia and
Slovenia will become full-fledged members of European Union, while Bulgaria and Romania have 2007 as an indicate Accession date from the European Commission.
2Such effects are potentially very important for Russia, given the subsides to domestic oil prices.

Studies & Analyses No. 279 – Lúcio Vinhas de Souza
7
Figure 1. Relation Flows within the GTAP Model
The current GTAP database has 66 sectors, which were aggregated to the smaller sector
composition described in Table I below. This reduced aggregation was chosen to make the
estimations directly comparable to the “in-house” CGE model built for the USAID/IRIS project at
the NES/CEFIR (see Alekseev et al., 2004).
Table 1. Sectors of the Model
Sector 1 Electricity and Heating Sector 9 Light industry
Sector 2 Oil and oil refinery Sector 10 Food processing
Sector 3 Gas and gas by-products Sector 11 Other manufacturing industries
Sector 4 Other fuels Sector 12 Agriculture
Sector 5 Ferrous metals Sector 13 Construction
Sector 6 Non-ferrous metals Sector 14 Trade and catering
Sector 7 Chemicals Sector 15 Communication and transports
Sector 8 Machinery and equipment Sector 16 Financial services and insurance
Sector 17 Other services
On the other hand, the complex Input-Output matrixes, tariff and tax data requirements of the
GTAP model implies that the regional disaggregation of the database (namely, “Russia” is
represented by a “Former Soviet Union” aggregate in the 5.1 database version, so these terms are
used interchangeably throughout the text3, and there is no complete regional disaggregation
neither for the EU, nor for the future EU members states in Eastern Europe and the Baltics: see
3This causes less distortion than one might imagine, as the Russia Federation is fully responsible for almost three
quarters of the total FSU (i.e., Armenia, Azerbaijan, Belarus, Georgia, Kazakhstan, Kyrgyz Republic, Moldova, Russian Federation, Tajikistan, Turkmenistan, Ukraine, Uzbekistan) GDP (using 2002 World Bank data).
RegionalHousehold
SavingsPrivate
HouseholdGovernment
Producer
Taxes Taxes
TaxesVOAEndw
PRIVEXP GOVEXP
SAVE
VDPA VDGA
NETINV
VDFA

Studies & Analyses No. 279 – A Wider Europe: Trade Relations Between …
8
Table II below). Some of these shortcomings will be reduced by the upcoming 6.0 version of the
database.
Table 2. Regions of the GTAP Model (Version 5.1)
Region Name Region Name Region Name
1 China 11 United States 21 Rest of the EU
2 Hong Kong 12 Mexico 22 Hungary
3 Japan 13 Venezuela 23 Poland
4 Korea 14 Argentina 24 Former Soviet Union
5 Taiwan 15 Brazil 25 Central Eastern
Europe
6 Indonesia 16 Finland 26 Turkey
7 Bangladesh 17 France 27 Middle East
8 India 18 Germany 28 Morocco
9 Sri Lanka 19 UK 29 North Africa
10 Canada 20 Italy 30 ROW
Trade Flows: An overview
The EU is the largest trade partner of all the future member states. In 2002, the average (non-
GDP weighted) of exports to the EU was 59% of their total exports (from a high of 75% in Hungary
to a low of 39% in Malta), while the EU was the source for 54% of their total imports (from a high of
68% in Slovakia to a low of 32% in Cyprus). Most of the adjustment of the trade flows away from
the formerly planned economies and towards Western Europe took place rather quickly, and was
actually mostly complete by the mid-1990s. In share terms, the growth of trade flows had already
stabilized by the end of the 1990s (see Figures II and III).
On the other hand, exports from the CIS to the EU actually decreased from the early 1990s to
the mid-1990s (reaching a low point of 16% of their total exports in 1996), them, similarly to the
New Member States, recovering until 1999 and stabilizing thereafter (average of 27% in 2002, from
a high of 61% in Azerbaijan –the country with highest accumulated growth in the last 4 years,
driven by the increase of energy commodities production and exports- to a low of 4% in the Kyrgyz
Republic; Russia stood at 35%). The picture concerning imports from the EU is similar, in terms of
time trends: the average in 2002 was 23%, from a low of 11% in Turkmenistan to a high of 40% in
Russia (see Figures IV and V). As one may see, Russia’s trade relations with the EU are
substantially above the CIS average.

Studies & Analyses No. 279 – Lúcio Vinhas de Souza
9
Figure 2. Exports of the New Member States to the E U
0.00
0.10
0.20
0.30
0.40
0.50
0.60
0.70
0.80
0.90
1992 1993 1994 1995 1996 1997 1998 1999 2000 2001 2002
Bulgaria Cyprus Czech Republic Estonia
Hungary Latvia Lithuania Malta
Poland Romania Slovakia Slovenia
Source: DOTS/IFS, calculations by the author.
Figure 3. Imports of the New Member States from the EU
0.000.100.200.300.400.500.600.700.800.90
1992 1993 1994 1995 1996 1997 1998 1999 2000 2001 2002
Bulgaria Cyprus Czech Republic Estonia
Hungary Latvia Lithuania Malta
Poland Romania Slovakia Slovenia
Source: DOTS/IFS, calculations by the author.

Studies & Analyses No. 279 – A Wider Europe: Trade Relations Between …
10
Figure 4. Exports of the CIS States to the EU
0.00
0.10
0.20
0.30
0.40
0.50
0.60
0.70
0.80
0.90
1992 1993 1994 1995 1996 1997 1998 1999 2000 2001 2002
Armenia Azerbaijan Belarus Georgia
Kyrgyz Republic Kazakhstan Moldova Tajikistan
Turkmenistan Ukraine Uzbekistan Russian Fed
Source: DOTS/IFS, calculations by the author.
Figure 5. Imports of the CIS States from the EU
0.00
0.10
0.20
0.30
0.40
0.50
0.60
1992 1993 1994 1995 1996 1997 1998 1999 2000 2001 2002
Armenia Azerbaijan Belarus
Georgia Kyrgyz Republic Kazakhstan
Moldova Tajikistan Turkmenistan
Ukraine Uzbekistan Russian Federation
Source: DOTS/IFS, calculations by the author.
As counterpart of those developments, exports from the CIS to Russia increased from the
early 1990 till 1997, collapsed in 1998, due to the substantial GDP fall and Ruble devaluation
observed in Russia after the crisis, and not really recovering until 2002 (the average for that year
was a mere 19% of total exports, from a high of 60% in Belarus to a meager 1% in Turkmenistan).

Studies & Analyses No. 279 – Lúcio Vinhas de Souza
11
CIS imports from Russia are more substantial and more stable in share terms, due to Russia’s role
as energy exporter to most of the grouping member countries or/and to their role as transit country
in the Russian energy trade (and even to Russia’s role as intermediate processer for countries with
similar energy exports): in 2002, they stood at 26% on average (from a high of 68% in loyal
Belarus to a low of 10% in Georgia).
Exports from the New Member States to Russia were already rather low, at 7% of the total, in
the early 1990s (bar the Baltic States, where the average was above 20%), but had fallen to an
average of 3% in 2002 (even in Baltics they were now below 10%). Their imports from Russia were
also low – roughly 10% of total imports- but rather stable, from a low of 2% in Slovakia to a high of
22% in Lithuania (for similar reasons to the CIS trade: the trade on energy commodities).
2. EU Enlargement
All the simulations here were done with the GEMPACK and RunGTAP software (see Harrison
and Pearson, 1996). As all the simulations presented on this paper will be based on a benchmark
of an Enlarged EU, it is useful to show the effects of the Enlargement before anything else.
Additionally, as the main concern of this analysis is with the EU and its immediate neighbors, I
show only the results for the EU itself, the new EU Member States, and for the most important
“New EU Neighbors”, the Former Soviet Union and Turkey.
Table 3. The Effects of the EU 2004 Enlargement Wav e
Regions
Changes in GDP
Volume (%)
Changes in GDP Value
(%)
Changes in Exports
Volume (%)
Changes in Exports
Value (%)
Changes in Imports
Volume (%)
Changes in Imports
Value (%) Changes in
ToT (%)
Finland 0.01 -0.0129 0.2333 0.2302 0.0908 0.149 -0.0614
France 0.0024 0.1096 0.2242 0.3254 0.1509 0.2115 0.0406
Germany 0.0287 0.2864 0.4567 0.6781 0.7228 0.7595 0.1847
UK 0.007 0.0531 0.1699 0.2117 0.0537 0.09 0.0054
Italy 0.0206 0.2545 0.4044 0.5935 0.4885 0.568 0.1096
Rest Current EU (REU) 0.0173 0.1242 0.1096 0.2015 0.096 0.1556 0.0323
Hungary 0.7143 0.3668 4.3794 3.6687 8.6251 8.7633 -0.8489
Poland 1.099 -1.9567 9.153 7.2983 10.7781 10.9259 -2.0024
Other NMS (plus Malta & Cyprus) 0.6435 4.5678 3.6474 6.4463 12.401 12.5881 2.6118
Former Soviet Union -0.0146 -0.2875 0.0589 -0.1512 -0.5393 -0.5254 -0.224
Turkey -0.005 -0.2069 0.1112 -0.0411 -0.3934 -0.3228 -0.223
In Table III, we have the percentage change effects on GDP, imports and exports, both in value
and volume terms, and on Terms of Trade (ToT), As one might see, the estimated effects for the
current EU are positive but rather small, at the scale of fractions of a percentage point (similar to the
Studies & Analyses No. 279 – A Wider Europe: Trade Relations Between …
12
outcomes observed in earlier studies, like Baldwin, Francois and Portes, 19974), and in some cases
so small as to be effectively non-differentiable from measurement errors. This is, of course, an
expected result, given the marginal size of the new EU member states (roughly 5% of the “old EU”
GDP) when compared to the Old Member States (OMS). Changes of comparably small magnitudes
are also traditional on static type of CGE as the GTAP (see Francois et al., 1996).
Conversely, the GDP results on the New Member States (NMS) themselves is orders of
magnitude larger, increasing, in the case of the aggregate of the smaller NMS, by almost 5%
(naturally, given that those are small economies experiencing a final “integration shock” with a
much larger trading partner, the EU, that is already responsible for, on average, almost 60% of
their total trade flows: see Fidrmuc and Fidrmuc, 2000). The imports and exports experience an
even larger increase, of over 10% in some cases. It is also interesting to observe the starkly
diverging GDP effects in volume and value terms for Poland, the largest NMS: this is due, of
course, to the “price shock” effects of Enlargement5. One has to stress here that those are merely
the static gains, with final outcomes likely much larger.
The effects on the new EU “periphery” are also intuitive, if one keeps in mind the differentiated
production and exports structure of the FSU (centered on primary commodities, specially energy)
towards the NMS (mostly manufactured products of middle technology) and the already highly
liberalized current trade relations with Turkey: they are mostly negative, but small, also on the
order of fractions of a percentage point (these results for “Russia” are starkly similar to the ones in
Alekseev et al., 2004, ibid, at -0.01%). Also noteworthy are the small positive outcomes in terms of
exports volume.
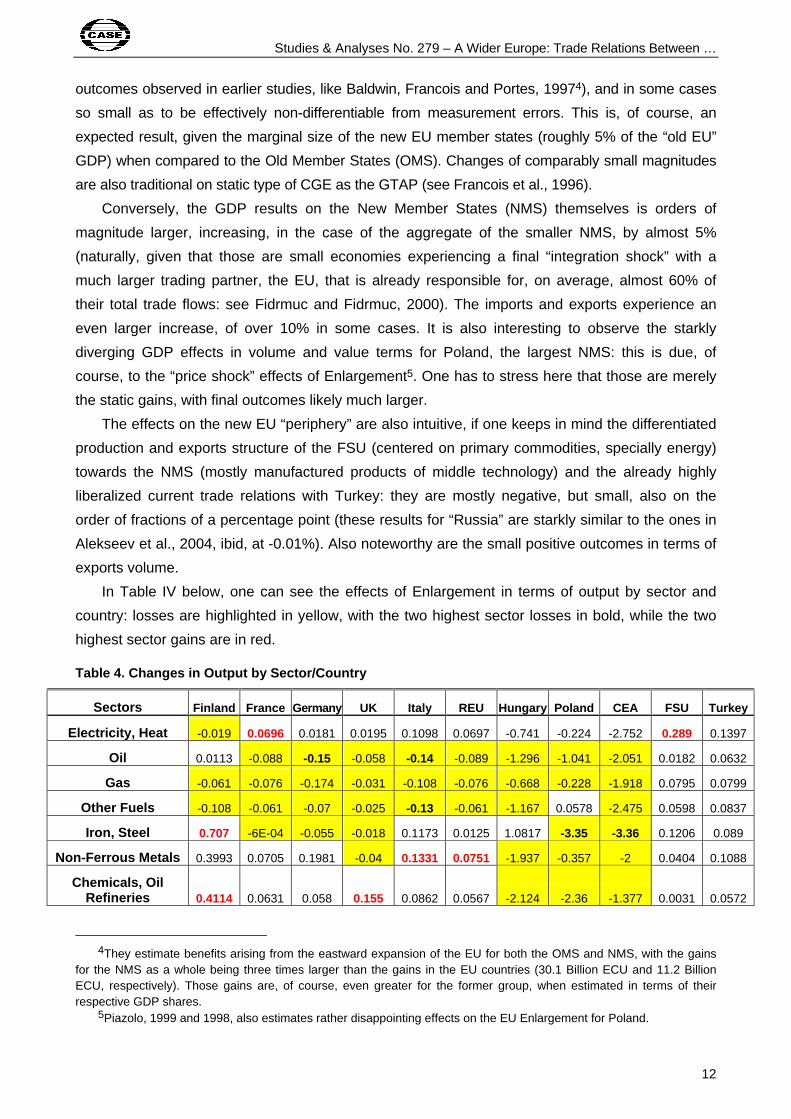
In Table IV below, one can see the effects of Enlargement in terms of output by sector and
country: losses are highlighted in yellow, with the two highest sector losses in bold, while the two
highest sector gains are in red.
Table 4. Changes in Output by Sector/Country
Sectors Finland France Germany UK Italy REU Hungary Poland CEA FSU Turkey
Electricity, Heat -0.019 0.0696 0.0181 0.0195 0.1098 0.0697 -0.741 -0.224 -2.752 0.289 0.1397
Oil 0.0113 -0.088 -0.15 -0.058 -0.14 -0.089 -1.296 -1.041 -2.051 0.0182 0.0632
Gas -0.061 -0.076 -0.174 -0.031 -0.108 -0.076 -0.668 -0.228 -1.918 0.0795 0.0799
Other Fuels -0.108 -0.061 -0.07 -0.025 -0.13 -0.061 -1.167 0.0578 -2.475 0.0598 0.0837
Iron, Steel 0.707 -6E-04 -0.055 -0.018 0.1173 0.0125 1.0817 -3.35 -3.36 0.1206 0.089
Non-Ferrous Metals 0.3993 0.0705 0.1981 -0.04 0.1331 0.0751 -1.937 -0.357 -2 0.0404 0.1088
Chemicals, Oil Refineries 0.4114 0.0631 0.058 0.155 0.0862 0.0567 -2.124 -2.36 -1.377 0.0031 0.0572
4They estimate benefits arising from the eastward expansion of the EU for both the OMS and NMS, with the gains
for the NMS as a whole being three times larger than the gains in the EU countries (30.1 Billion ECU and 11.2 Billion ECU, respectively). Those gains are, of course, even greater for the former group, when estimated in terms of their respective GDP shares.
5Piazolo, 1999 and 1998, also estimates rather disappointing effects on the EU Enlargement for Poland.

Studies & Analyses No. 279 – Lúcio Vinhas de Souza
13
Machinery 0.162 0.1197 -0.16 -0.023 -0.016 -0.094 12.28 1.5341 -0.368 -0.092 0.0541
Light Manufacturing -0.35 -0.16 -0.094 -0.16 0.0628 -0.45 -0.862 2.2224 4.9619 -0.116 -0.5
Processed Foods -0.035 0.0626 0.3621 0.122 0.1702 0.24 -4.58 -3.87 -0.497 -0.074 -0.223
Other Industries 0.1294 -0.108 0.0829 -0.094 0.0465 -0.11 -2.025 1.5555 -0.942 0.374 -0.102
Agriculture -0.119 0.0293 0.2356 0.1883 0.106 0.2357 -2.76 -3.281 -0.715 -0.106 -0.021
Construction -0.16 -0.13 0.0737 -0.126 -0.063 -0.049 11.927 7.487 8.69 -0.32 -0.235
Trade -0.028 -0.013 -0.005 0.0003 -0.008 -0.006 -0.5 0.1517 1.7992 -0.067 -0.069
Transport, Communication 0.0656 -0.017 -0.058 0.0298 -0.025 0.0629 -0.971 0.8562 -4.17 0.2261 0.203
Finance, Business 0.0409 -0.013 -0.073 0.0044 -0.052 -0.019 -1.27 0.5137 -0.994 0.0492 0.326
Other Services -0.021 -0.007 0.0078 -6E-04 -0.005 -0.003 -1.662 -1.227 0.461 -0.028 0.0632
For the OMS, some sector gains can be significant, specially in the Iron and Steel, Non-
Ferrous Metals and Chemicals sectors, and also on the Processed Foods and Agriculture ones,
while losses cluster on Machinery, Light Manufacturing and Construction. As one might see, for the
NMS gains are stronger on the Machinery, Light Industry and Construction Sectors (with, in some
cases, gains of over 10%), while losses are larger on the Iron and Steel, Processed Foods and
Agriculture sectors (or, in other terms, the less re-structured sectors of those economies). For the
new EU “periphery”, the pattern and scale of losses is similar to the one observed in the OMS,
while the gains are on Electricity and Heat and, surprisingly, some service sectors.
At Table V below, I show a decomposition of the welfare changes from EU Enlargement: as one
might see, they are positive for all, but naturally for the FSU and Turkey, and, surprisingly, for Finland
(this due to substantial ToT losses). The gains for the NMS are mostly driven by ToT gains, bar
Hungary and Poland, where allocative efficiency is the driver of the gains (one must note that when
there is an aggregate total welfare loss, the positive components enter with a negative share).
Table 5. Decomposition of Welfare Changes
Regions Allocative Efficiency
(%) Terms of Trade
(%) I-S Effect
(%) Total
(value equivalent)
Finland -1.20 2.44 -0.24 -9.73
France 0.18 0.88 -0.05 182.47
Germany 0.37 0.65 -0.02 1606.25
UK 0.76 0.10 0.14 118.98
Italy 0.44 0.65 -0.09 528.80
REU 0.53 0.44 0.03 649.07
Hungary 4.94 -3.33 -0.61 59.11
Poland 7.19 -3.64 -2.55 190.39
Rest of NMS (plus Malta & Cyprus) 0.30 0.63 0.07 3696.30
Former Soviet Union 0.24 0.86 -0.09 -353.10
Turkey 0.08 0.85 0.07 -122.12

Studies & Analyses No. 279 – A Wider Europe: Trade Relations Between …
14
3. Russia’s WTO Accession
The Russian Federation applied for membership in the WTO in 1993, over ten years ago.
Negotiations on the terms of Accession are still ongoing, but below we show estimations of the
effects a “tariff shock” from the Russian WTO entry, where the Russian agreed WTO tariff
“bindings” were taken from Alekseev et al., 2004, ibid, and estimated on an “Enlarged EU”
benchmark (those tariffs are shown on the Annex). The results are show on Table VI below.
Table 6. The Effects from an Eventual Russian WTO A ccession
Regions
Changes in GDP Volume
(%)
Changes in GDP Value
(%)
Changes in Exports
Volume (%)
Changes in Exports
Value (%)
Changes in Imports
Volume (%)
Changes in Imports
Value (%) Changes in
ToT (%)
Finland -0.0004 -0.0561 0.0782 0.0425 -0.0062 0.0067 -0.0486
France -0.0005 0.0675 0.0854 0.1448 0.1336 0.1441 0.0489
Germany 0.0052 0.0516 0.1419 0.1859 0.1913 0.1945 0.0409
UK 0.0008 0.0193 0.0497 0.0663 0.0343 0.0419 0.0091
Italy 0.0035 0.0639 0.1235 0.1728 0.1565 0.1752 0.0307
REU 0.0031 0.0153 0.033 0.0492 0.0224 0.0355 0.0032
Hungary 0.0152 -0.2885 1.4807 1.2056 1.9445 1.9782 -0.3088
Poland 0.1457 -1.6924 5.047 4.0083 3.6872 3.7356 -1.0871
Rest of NMS 0.0573 1.064 1.161 1.8722 3.0428 3.0835 0.6706
FSU -0.0007 -0.0607 0.022 -0.0255 -0.0666 -0.0959 -0.0182
Turkey -0.0013 -0.0697 0.0324 -0.0206 -0.1115 -0.09 55 -0.069
As one might see, the effects are rather marginal for Russia itself6, which reflects the small
size of its economy (roughly 3% of the Enlarged EU GDP), the concentration of Russian exports
and productive structure in mostly already liberalized sectors (namely, energy-intensive
commodities and sub-products are directly responsible for roughly 20% of the Russian GDP and
half of the trade with the EU) and the limited reductions of the proposed WTO tariff “bindings”. I
estimate a –0.06% GDP loss (again, starkly similar to Alekseev et al., ibid, 2004, who estimate a –
0.13 loss, and to Sulamaa and Widgren, 2002, and UNECE, 2003; Jesper et al., 2002,estimate
much larger gains, but only with the addition of somewhat ad hoc long run dynamics to a CGE),
with negligible effects for the OMS and for Turkey. On the other hand, changes in GDP are actually
positive for the aggregate of the smaller NMS, with losses in value (but gains in volume) observed
for Hungary and specially Poland. Both imports and exports increase significantly for all the NMS,
and ToT will also improve, again bar for Hungary and Poland. All in all, Russian WTO Accession
6One must remember that this “Russia” is actually an FSU aggregate. As an example of what could happen to the rest of the FSU if Russia entered the WTO alone, Vinhas de Souza, 2004, using a small CGE, estimates a GDP loss of 1.25% to the Republic of Belarus. The welfare loss is much smaller (-0.23%), as ToT gains partially compensate for the reduced domestic production (here, one must remember that, due to the Russia-Belarus FTA, Belarus does realizes ToT gains through Russia’s WTO Accession).

Studies & Analyses No. 279 – Lúcio Vinhas de Souza
15
will yield more benefits to most of the NMS than to Russia itself (bar Poland and, to a much lesser
degree, Hungary).
Again, on Table VII below I show the effects of Russia’s WTO Accession in terms of output
changes by sector/country.
Table 7. Changes in Output by Sector/Country
Sectors Finland France Germany UK Italy REU Hungary Poland CEA FSU Turkey
Electricity, Heat 0.0054 -0.003 0.0162 0.006 0.0312 0.0211 -0.2255 0.174 -0.89 0.0712 0.0356
Oil 0.045 -0.04 -0.0267 -0.0129 -0.035 -0.0133 -0.219 0.0712 -0.6491 0.0094 0.0287
Gas 0.0005 -0.0355 -0.039 -0.0101 -0.0294 -0.0145 -0.1381 0.0352 -0.5957 0.0124 0.0267
Other Fuels -0.0167 -0.04 -0.0107 -0.0104 -0.041 -0.0149 -0.1882 0.202 -0.8144 0.0068 0.0243
Iron, Steel 0.443 -0.0223 0.12 0.0053 0.085 0.0456 0.5681 0.6894 -2.302 0.072 0.0657
Non-Ferrous Metals 0.173 0.0088 0.129 -0.0063 0.0726 0.0318 -0.308 0.7218 -1.673 0.0181 0.0509
Chemicals, Oil Refineries 0.23 -0.0347 0.0069 0.0443 0.0047 0.0006 -0.3401 0.1063 -0.7732 0.0339 0.0329
Machinery 0.0122 0.085 -0.0179 0.0023 -0.036 -0.0894 2.893 1.3402 -0.9089 -0.0142 0.071
Light Manufacturing -0.125 -0.0071 -0.0262 -0.097 0.0684 -0.218 0.2999 2.878 1.3499 -0.0739 -0.1747
Processed Foods -0.117 0.04 -0.042 0.049 -0.0317 0.096 -1.192 -1.907 1.4997 -0.094 -0.104
Other Industries 0.0107 -0.068 0.0574 -0.0334 0.0551 -0.0178 -0.1777 0.4837 -0.7308 0.078 -0.0214
Agriculture -0.0453 0.0053 0.0811 0.14 0.079 0.171 -0.91 -2.178 -0.0595 -0.091 -0.0136
Construction -0.073 -0.0069 0.0041 -0.024 -0.012 -0.0184 2.0482 1.7129 1.886 -0.0582 -0.0635
Trade -0.0102 -0.0073 -0.0016 0 -0.0042 -0.0045 -0.2048 -0.2247 0.4073 -0.0097 -0.0197
Transport, Communication 0.0456 -0.0356 -0.0044 0.0036 -0.0026 0.034 -0.2253 0.4512 -1.0401 0.061 0.0669
Finance, Business 0.0304 -0.0124 -0.0147 -0.0041 -0.0174 0.0038 -0.2565 0.2546 -0.292 0.0132 0.096
Other Services -0.0128 -0.0035 -0.0004 -0.0014 -0.0041 -0.0018 -0.4973 -0.8341 0.0501 0.0001 0.0185
As one might see, even at a sector level, gains and losses for Russia are truly marginal. Also,
sector gains and losses are mainly marginal for most of the OMS and Turkey, bar Finland, which
has some significant gains in the Iron/Steel and Chemicals sectors, and some losses in the Light
Manufactures and Processed Foods sectors. For the NMS, on the other hand, significant gains can
be observed at the Machinery, Light Manufacturing, Construction and Processed Foods sectors,
while major losses are observed at the Agriculture and Processed Foods (Poland and Hungary)
and Metal sectors.
Table 8. Decomposition of Welfare Changes
Regions Allocative Efficiency
(%) Terms of Trade
(%) I-S Effect
(%) Total
(value equivalent)
Finland 0.02 1.15 -0.17 -18.4
France -0.04 1.10 -0.06 159.9
Germany 0.32 0.68 0.00 338.8

Studies & Analyses No. 279 – A Wider Europe: Trade Relations Between …
16
UK 0.21 0.64 0.15 45.95
Italy 0.32 0.77 -0.09 124.5
REU 0.61 0.30 0.09 98.99
Hungary -0.08 0.89 0.18 -83.2
Poland -0.40 0.91 0.50 -440
Rest of NMS (plus Malta & Cyprus) 0.12 0.75 0.13 846.9
Former Soviet Union 0.18 1.20 -0.37 -23.64
Turkey 0.07 0.86 0.07 -36.90
At Table VIII above, I show again a decomposition of the welfare changes from Russia’s WTO
Accession: as one might see, Russia registers a small welfare loss, as do Turkey and Finland. The
sizable gains for the NMS are again mostly driven by ToT gains, but Hungary and specially Poland
do show significant losses.
4. A Russia-Enlarged EU FTA
s part of the “Common European Space” EU project, some sort of free trade agreement (FTA)
with the Russian Federation is envisaged at some point in the future7. Therefore, in this section I
estimate the effects of such a potential FTA, assuming first a FTA limited to manufacturing sectors
but with a complete elimination of tariff barriers in those sectors, up on the benchmark simulation of
an Enlarged EU. Given the uncertainty concerning the timeframe of any eventual Russian WTO
Accession, I do no estimate such an FTA upon a benchmark composed of EU Enlargement plus
Russian WTO Accession, which also enable one to compare the potential specific gains of both
those strategies. The results are show on Table IX below.
Table 9. The Effects from an Eventual EU-Russia FTA
Regions
Changes in GDP
Volume (%)
Changes in GDP Value
(%)
Changes in Exports
Volume (%)
Changes in Exports
Value (%)
Changes in Imports
Volume (%)
Changes in Imports
Value (%) Changes in
ToT (%)
Finland 0.034 0.5168 0.2174 0.547 0.8352 0.8484 0.3164
France 0.0037 0.0688 0.0856 0.1477 0.0405 0.089 0.0136
Germany 0.0099 0.1789 0.1418 0.2866 0.246 0.293 0.0979
UK 0.0041 0.063 0.0909 0.1402 0.0638 0.0937 0.0194
7As agreed at the St. Petersburg Summit in June 2003. The legal basis for EU relations with Russia is the Partnership and Cooperation Agreement (PCA) of 1994, which came into force in December 1997, and is valid for an initial period of ten years: it was duly renewed in 2004. The PCA established a liberalisation of trade based on MFN treatment for most of the bilateral trade in goods (more precisely, most of the EU-Russia trade in goods benefits from the EU’s General System of Preferences -GSP). The EU has laid down its basic approach to relations with Russia in a “Common Strategy” of 1999, which will remain until June 2004. Technical assistance is also provided to support agreed objectives through the TACIS programme (which includes assistance towards WTO Accession). A number of specific trade agreements have also been concluded (namely, steel and textiles are the main industry sectors covered by bilateral trade agree-ments: the steel agreement entered into force in July 2002 and a textiles agreement was concluded in 1998).

Studies & Analyses No. 279 – Lúcio Vinhas de Souza
17
Italy 0.0062 0.1702 0.1247 0.2545 0.2044 0.2469 0.0872
REU 0.0077 0.1221 0.0575 0.145 0.0958 0.1418 0.0414
Hungary 0.0737 0.9658 0.0936 0.6041 0.9129 0.9833 0.4401
Poland 0.1757 1.5402 -0.0415 0.8962 1.6747 1.7522 0.8602
REST of NMS 0.0605 0.5811 0.2058 0.5571 0.8046 0.8717 0.2841
Former Soviet Union 0.2077 -1.069 4.0536 3.4754 6.6184 6.5635 -0.5233
Turkey -0.0102 -0.4515 0.0228 -0.3455 -0.5921 -0.59 44 -0.366
As one might see, the outcome now is much more significant for Russia: there is a rather small
but significant increase in GDP volume (and a much larger fall in GDP value, given the “price
shock” from liberalization and the ToT losses) and truly substantial increases in exports and
imports: this is explained by the comprehensive liberalization in manufactured goods trade with a
large economy which is already one of the major Russian trading partners, the EU. Naturally, for
the OMS the effects are still marginal but larger than in the WTO scenario, and are mostly positive.
Now they are also larger for Turkey, and unambiguously negative. The effects on the NMS are, of
course, substantially larger than for the OMS, given their productive structure and remaining trade
ties with Russia, and more unambiguously positive than at the WTO scenario, as Hungary and
Poland have both GDP volume and value increases, plus ToT gains, but the increases in exports
and exports are smaller than in the WTO scenario.
Again, on Table X below I show the effects of such a EU-Russia FTA in terms of output
changes per sector/country. Gains for Russia are greater at the Iron/Steel and Construction
sectors, while losses are larger on the Machinery and Light Industry ones. For Turkey, losses are
greater on the Light Manufacturing and Processed Foods, while gains are larger on Iron/Steel and
Finance. For the OMS, changes are, as one should expect, mostly marginal, bar for Finland, where
the Non-Ferrous and the Other Industries sectors have significant gains, and Iron/Steel and Light
Manufacturing the larger losses. For the NMS, significant losses are observed in the Metals,
Machinery and Light Manufacturing sectors, while the larger gains are on Processed Foods,
Construction and Machinery sectors.
Table 10. Changes in Output by Sector/Country
Sectors Finland France Germany UK Italy REU Hungary Poland CEA Russia Turkey
Electricity, Heat -0.246 0.008 -0.03 0.005 0.013 0.009 -0.049 -0.713 0.326 0.067 -0.019
Oil -0.132 -0.048 -0.094 -0.04 -0.093 -0.073 -0.264 -0.588 -0.286 0.263 0.147
Gas -0.251 -0.037 -0.105 -0.04 -0.073 -0.077 -0.287 0.048 -0.198 0.175 0.163
Other Fuels -0.227 -0.05 -0.062 -0.03 -0.087 -0.057 -0.354 -0.562 -0.308 0.279 0.077
Iron, Steel -0.51 -0.17 -0.14 -0.12 -0.17 -0.21 -0.891 -2.88 -1.05 1.91 0.37
Non-Ferrous Metals 1.42 -0.004 -0.048 -0.05 -0.034 -0.036 -1.16 -1.313 -0.065 0.497 -0.109
Chemicals, Oil Refineries 0.203 0.011 -0.11 0.005 -0.068 -0.11 0.182 0.52 -0.077 0.63 -0.147
Machinery 0.404 0.07 0.012 0.09 -0.064 0.031 0.833 -1.1 0.66 -3.08 0.171

Studies & Analyses No. 279 – A Wider Europe: Trade Relations Between …
18
Light Manufacturing -0.72 0.12 0.21 0.11 0.61 0.23 -1.24 0.21 -0.354 -1.63 -1.05
Processed Foods 0.959 0.051 0.19 0.036 0.03 0.14 1.82 1.35 0.012 -1.159 -0.29
Other Industries 1.56 -0.02 0.037 -0.019 -0.1 -0.105 -0.505 0.086 0.185 -0.175 -0.025
Agriculture -0.313 -0.005 -0.007 -0.01 -0.059 0.067 0.022 0.064 -0.107 -0.234 0.038
Construction 0.394 -0.07 -0.002 -0.05 -0.024 -0.003 0.84 0.85 0.45 2.25 -0.223
Trade 0.04 -0.005 0.003 8E-04 -0.002 -0.001 0.048 0.201 0.127 0.15 -0.096
Transport, Communication -0.259 -0.036 -0.066 -0.024 -0.056 -0.034 -0.287 -0.71 -0.4 0.452 0.294
Finance, Business -0.194 -0.013 -0.042 -0.013 -0.037 -0.036 -0.331 -0.376 -0.083 0.134 0.53
Other Services 0.025 -0.006 0.005 -0.005 -0.001 -0.007 -0.019 0.254 0.089 -0.135 0.086
Finally, at Table XI below, I show the decomposition of the welfare changes from Russia-EU
FTA: as one might see, Russia shows substantial welfare gains, driven mainly by increases in
allocative efficiency. All the other regions show significant gains, bar Turkey, who unambiguously
loses from a Russia-EU FTA.
Another simulation, with a comprehensive Russia-EU FTA (i.e., complete elimination of tariff
barriers in all sectors) was also performed, but as its results were qualitatively and quantitatively
similar to the ones of the partial FTA above (due to the previously indicated productive structure of
the Russian economy, which is biased towards energy commodities and certain industrial sectors).
Therefore, I do not show then here, but they are available from the author upon request.
Table 11. Decomposition of Welfare Changes
Regions Allocative Efficiency Terms of Trade I-S Effect Total
Finland 0.25 0.91 -0.16 158.92
France 0.61 0.72 -0.33 84.20
Germany 0.29 0.79 -0.07 713.60
UK 0.45 0.52 0.03 118.32
Italy 0.24 0.92 -0.16 289.52
REU 0.31 0.74 -0.05 494.95
Hungary 0.20 0.69 0.11 148.52
Poland 0.33 0.46 0.21 647.52
Rest of NMS (plus Malta & Cyprus) 0.25 0.59 0.16 439.61
Former Soviet Union 1.86 -1.13 0.27 635.35
Turkey 0.09 0.76 0.15 -208.84
Separating a Russia-EU FTA from the Russian WTO Accession is analytically correct, as it
enables one to compare the outcomes of the two alternatives, but from political point of view, it is
unlikely that the EU would consider even a limited FTA without WTO Accession. Therefore, the
same FTA (full and partial) liberalization “shocks” as above were estimated, but now upon the

Studies & Analyses No. 279 – Lúcio Vinhas de Souza
19
benchmark of an Enlarged EU and a Russia that is already a WTO member: remarkably, the
results are only marginally different from the ones estimated for FTA-only scenario above (again, I
do not show the results here, but they are available upon request). This again stresses the point
that a mere WTO Accession, under the current negotiating terms, will have marginal effects on
Russia, while a FTA with the EU yields potentially far greater gains for the country.
5. Conclusions
In this paper, estimations of the combined potential effects of the EU 2004 Eastern
Enlargement, the eventual Russian Accession to the WTO and different types of possible Russia-
EU FTAs were presented. The results show that i) the main beneficiaries of the 2004 EU
Enlargement will be the New EU Member states, with the other regions showing marginal gains or
losses, ii) Russian WTO Accession will have fairly marginal effects for Russia and for most other
regions, but will generate substantial gains for the New EU Member States and iii) even a limited
Russia-EU FTA will generate substantial gains for Russia (far above any gains from WTO
Accession, even when such an FTA is estimated upon a “Russia’s WTO Accession” benchmark8)
and will also be beneficial for all the EU Members, old and new. Nevertheless, other neighbor
states left out of such a possible FTA (like, for instance, Turkey) will be unambiguous losers in this
last scenario.
Of course, the estimations here presented are incomplete and partial, given the limitations of
the dataset used and the mostly static nature of the model, and can, therefore, be improved.
Nevertheless, the outcomes are sensible and similar to the ones obtained in comparable studies.
Additionally, one must remember that, given the static nature of the model, if anything, the
projected gains should be a lower bound of the potential long-run ones.
8Rose, 2003, estimated that WTO Accession has non-significant trade-creating effects, possibly due to the “lowest
common denominator” constraints of the WTO Accession negotiation process. As regional FTAs usually go much deeper towards liberalization amongst its members (like, for instance, the EU itself) the pay off is much greater.

Studies & Analyses No. 279 – A Wider Europe: Trade Relations Between …
20
References
Alekseev, A., Sokolov, D., Tourdyeva, N. and Yudaeva, K., “Estimating the Effects of EU
Enlargement, WTO Accession and the Formation of FTA with EU or CIS on the Russian
Economy”, NES-CEFIR, mimeo, 2004.
Bakanova, M., Vinhas de Souza, L., Kolesnikova, I. and Abramov, A., “Transition and Growth in
Belarus”, in Ofer, G. and Pomfret, R. (eds.), Transition and Long-Term Growth in the CIS,
Edward Elgar, United Kingdom, 2004.
Baldwin, R., Francois, J. and Portes, R., “The Costs and Benefits of Eastern Enlargement: The
Impact on the EU and Central Europe”, in Economic Policy, n° 24, pp. 125-176, 1997.
Belkindas, M. and Ivanova, O. (eds), “Foreign Trade Statistics in the USSR and Successor States”,
Studies of Economies in Transformation: paper no 18, 1996, The World Bank, Washington,
D.C.
Brenton, P., Tourdyeva, N and Whalley, J., “The Potential Trade Effects of an FTA Between the
EU and Russia”, in Weltwirtschaftliches Archiv,133, 1997, pp. 205-225.
Brown, D., Deardorff, A., Djankov, S. and Stern, R, “An Economic Assessment of the Integration of
Czechoslovakia, Hungary and Poland into the European Union”, in Europe’s Economy Looks
East, Black, S. (ed.), Cambridge University Press, United Kingdom, 1997
Fidrmuc, J. and Fidrmuc, J. “Integration, Disintegration and Trade in Europe: Evolution of Trade
Relations during the 1990’s”, ZEI Working Papers, B-3, Bonn, 2000.
Francois, J., B. McDonald, and Nordström, H., “Assessing the Uruguay Round”, in W. Martin and
A. Winters (eds), The Uruguay Round and the Developing Countries, Cambridge University
Press, 1996.
Gros, D. and Dautebande, D., “International Trade of Former Republics in the Long-run: an
Analysis Based on the ‘Gravity’ Approach”, CEPS Economic Working Documents, no 71, 1992,
Brussels.
Harrison, G., Rutherford, T. and Tarr, D. “Quantifying the Uruguay Round” in W. Martin and A.
Winters (eds), The Uruguay Round and the Developing Countries, Cambridge University
Press, 1996.
Jesper, J. Rutherford, T. and Tarr, D., “Economy-Wide Effects of Russia’s Accession to the WTO”,
SIDA-CEFIR Conference, June 24-25, 2002
Lejour, A., Mooij, R., Nahuis, R., “EU Enlargement: Economic Implications for Countries and
Industries” CPB Document, September 2001.
Lücke, M., “The Impact of the Accession to GATT on Trade-Related Policies of CIS Countries: The
Case of Belarus”, Kiel Working Papers, no 678, 1995, Institute for World Economics, Kiel.
Michalopoulos, C. and Tarr, D. (eds), “Trade in New Independent States”, Studies of Economies in
Transformation, paper no 13, 1995, The World Bank, Washington, D.C.

Studies & Analyses No. 279 – Lúcio Vinhas de Souza
21
Piazolo, D., “Welfare Effects versus Income Effects of Poland’s Integration into the European
Union”, Kiel Working Papers, n° 940, 1999.
_________, “Investment Behavior in Dynamic Computable General Equilibrium Models for
Transition Economies”, Kiel Working Papers, n° 879, 1998.
Rose, A., “Which International Institutions Promote International Trade?”, CEPR Discussion Paper
no 3764, 2003.
Sulamaa, P. and Widgren, M., “EU Enlargement and the Opening of Russia: Lessons from the
GTAP Reference Model”, The Research Institute of the Finnish economy. No.11, 2002.
Tarr, D., “The Terms-of-Trade Effects of Moving to World Prices on Countries of Former Soviet
Union”, Journal of Comparative Economics, Vol.18, 1994, pp.1-24.
UNECE (United Nations Economic Commission for Europe), Economic Survey of Europe, Geneva,
2003
Vinhas de Souza, L.,“Effects of Russian WTO Accession and EU Enlargement on Belarus: Initial
Estimations”, mimeo, IfW, 2004.
Vinhas de Souza, L. and Bakanova, M., “Trade and Growth under Limited Liberalization: The Case
of Belarus”, Tinbergen Institute Discussion Paper n° TI 2002-053/2, The Netherlands, 2 002.
Studies & Analyses No. 279 – A Wider Europe: Trade Relations Between …
22
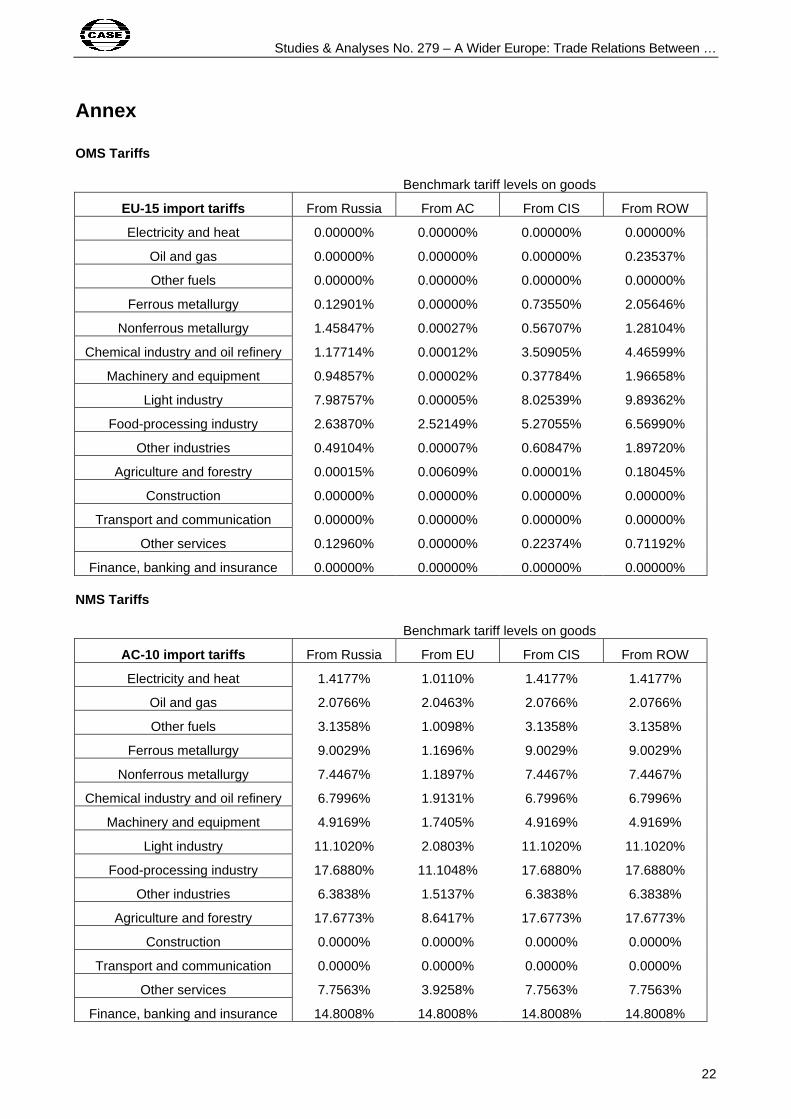
Annex
OMS Tariffs
Benchmark tariff levels on goods
EU-15 import tariffs From Russia From AC From CIS From ROW
Electricity and heat 0.00000% 0.00000% 0.00000% 0.00000%
Oil and gas 0.00000% 0.00000% 0.00000% 0.23537%
Other fuels 0.00000% 0.00000% 0.00000% 0.00000%
Ferrous metallurgy 0.12901% 0.00000% 0.73550% 2.05646%
Nonferrous metallurgy 1.45847% 0.00027% 0.56707% 1.28104%
Chemical industry and oil refinery 1.17714% 0.00012% 3.50905% 4.46599%
Machinery and equipment 0.94857% 0.00002% 0.37784% 1.96658%
Light industry 7.98757% 0.00005% 8.02539% 9.89362%
Food-processing industry 2.63870% 2.52149% 5.27055% 6.56990%
Other industries 0.49104% 0.00007% 0.60847% 1.89720%
Agriculture and forestry 0.00015% 0.00609% 0.00001% 0.18045%
Construction 0.00000% 0.00000% 0.00000% 0.00000%
Transport and communication 0.00000% 0.00000% 0.00000% 0.00000%
Other services 0.12960% 0.00000% 0.22374% 0.71192%
Finance, banking and insurance 0.00000% 0.00000% 0.00000% 0.00000%
NMS Tariffs
Benchmark tariff levels on goods
AC-10 import tariffs From Russia From EU From CIS From ROW
Electricity and heat 1.4177% 1.0110% 1.4177% 1.4177%
Oil and gas 2.0766% 2.0463% 2.0766% 2.0766%
Other fuels 3.1358% 1.0098% 3.1358% 3.1358%
Ferrous metallurgy 9.0029% 1.1696% 9.0029% 9.0029%
Nonferrous metallurgy 7.4467% 1.1897% 7.4467% 7.4467%
Chemical industry and oil refinery 6.7996% 1.9131% 6.7996% 6.7996%
Machinery and equipment 4.9169% 1.7405% 4.9169% 4.9169%
Light industry 11.1020% 2.0803% 11.1020% 11.1020%
Food-processing industry 17.6880% 11.1048% 17.6880% 17.6880%
Other industries 6.3838% 1.5137% 6.3838% 6.3838%
Agriculture and forestry 17.6773% 8.6417% 17.6773% 17.6773%
Construction 0.0000% 0.0000% 0.0000% 0.0000%
Transport and communication 0.0000% 0.0000% 0.0000% 0.0000%
Other services 7.7563% 3.9258% 7.7563% 7.7563%
Finance, banking and insurance 14.8008% 14.8008% 14.8008% 14.8008%

Studies & Analyses No. 279 – Lúcio Vinhas de Souza
23
Russian Tariffs
Benchmark tariff levels Russian tariff levels on goods from
EU AC CIS ROW
Russian WTO proposal
Electricity and heat 5.21% 0.00% 5.31% 5.30% 5.00%
Oil and gas 5.28% 5.29% 5.27% 5.28% 5.00%
Other fuels 5.24% 5.17% 5.26% 5.26% 5.00%
Ferrous metallurgy 10.38% 12.47% 7.79% 9.54% 8.00%
Nonferrous metallurgy 9.92% 12.42% 6.72% 9.81% 9.00%
Chemical industry and oil refinery 9.12% 11.17% 11.82% 9.61% 7.00%
Machinery and equipment 10.51% 11.87% 12.05% 11.11% 9.00%
Light industry 15.40% 12.82% 30.98% 20.99% 14.00%
Food-processing industry 13.77% 16.98% 25.88% 9.21% 9.00%
Other industries 10.80% 10.88% 15.03% 11.15% 10.00%
Agriculture and forestry 5.30% 5.38% 5.80% 5.22% 5.00%
Construction 0.00% 0.00% 0.00% 0.00% 0.00%
Transport and communication 0.00% 0.00% 0.00% 0.00% 0.00%
Other services 10.33% 12.98% 22.94% 13.35% 0.00%
Finance, banking and insurance 0.00% 0.00% 0.00% 0.00% 0.00%