case history high-resolution seismic reflection imaging...
TRANSCRIPT

GEOPHYSICS, VOL. 69, NO. 5 (SEPTEMBER-OCTOBER 2004); P. 1143–1154, 13 FIGS., 1 TABLE.10.1190/1.1801932
Case History
High-resolution seismic reflection imaging of a thin,diamondiferous kimberlite dyke
Philip T. C. Hammer1, Ron M. Clowes2, and Kumar Ramachandran3
ABSTRACT
Seismic reflection techniques are, for the first time, used toimage a thin, diamondiferous kimberlite dyke from subcropto depths greater than 1300 m. Geophysical explorationfor kimberlite deposits typically involves airborne poten-tial field surveys that are well suited for detecting verticaloutcropping pipes but often fail to reveal thin, subhorizon-tal dykes and sills. Because seismic techniques are espe-cially well suited for mapping structures that have shallowdips and strong impedance contrasts, a feasibility study andseismic reflection survey were undertaken on the diamon-diferous Snap Lake dyke (Northwest Territories, Canada)to evaluate the potential for using seismic techniques onthese targets. The dyke (average thickness 2–3 m) providesan excellent test site because a drilling program has de-fined the gross dyke geometry and provides core samplesfrom the kimberlite and host rocks. The feasibility study in-
volved measuring P-velocity and density of selected cores.Using these data, reflectivity and finite-difference syntheticseismogram techniques were used to explore the resolu-tion limitations and determine the acquisition parametersfor a reflection survey. The seismic survey included two 2Dlines designed to obtain comparative data sets from dif-ferent sources (explosives and vibroseis) and ground types(land or lake-ice). The explosive-source land data yieldeda superb image of the thin dyke. The vibroseis data, how-ever, detected the dyke only when sources and geophoneswere on land; the dyke was not imaged beneath the ice dueto reverberation and attenuation effects. Correlations areobserved between reflection attributes and dyke proper-ties (thickness, structure, and physical properties). The re-sults demonstrate that, in the appropriate situation, seismicmethods have great potential for use in kimberlite explo-ration, subsurface mapping, and detailed imaging for minedevelopment purposes.
INTRODUCTION
Seismic reflection techniques have been infrequently usedby the diamond exploration and mining industry. The primaryexploration targets are kimberlite pipes, which are effectivelydetected using airborne magnetic, electromagnetic, and gravitysurveys (e.g., Carlson et al., 1999). These potential field tech-niques succeed because of the strong contrasts in conductivity,susceptibility, and density between the host rocks and the near-vertical weathered pipes that outcrop or subcrop. However,intrusions such as dykes and sills can form thin, subhorizontalsheets that do not yield distinctive potential field anomalies be-
Manuscript received by the Editor February 28, 2003; revised manuscript received March 3, 2004.1University of British Columbia, Department of Earth and Ocean Sciences, Vancouver, British Columbia V6T 1Z4, Canada. E-mail:
[email protected] of British Columbia, Lithoprobe and Department of Earth and Ocean Science, Vancouver, British Columbia V6T 1Z4, Canada.
E-mail: [email protected] University of British Columbia, Department of Earth and Ocean Sciences, Vancouver, British Columbia V6T 1Z4, Canada; presently
Geological Survey of Canada, Pacific Geoscience Centre, Sidney, British Columbia V8L 4B2 Canada. E-mail: [email protected]© 2004 Society of Exploration Geophysicists. All rights reserved.
cause sharp lateral contrasts in physical properties are absent.As a result, these potentially valuable structures are likely tobe overlooked and are not well understood. Since reflectionseismic techniques are especially well suited for mapping sub-horizontal structures, some dykes and sills have the potentialto be excellent seismic targets.
One example of a diamondiferous dyke is the Snap Lakekimberlite in Canada’s Northwest Territories (Figure 1). Al-though the dyke averages only 2–3 m in thickness, the quan-tity (over 20 million Mt at approximately 2 carats/t) and qual-ity of the diamonds makes the intrusion extremely valuable;De Beers Canada Mining Inc. obtained regulatory approval
1143

1144 Hammer et al.
in 2003 to develop Canada’s first underground diamond mine.A substantial drilling program has been carried out to definethe gross geometry and value of the deposit. The dyke forms asheet that gently plunges (∼15◦) to depths greater than 1300 mand extends over approximately 25 km2 (McBean et al., 2003).Although the general structure has been roughly mapped bydrilling, investigations continue in order to obtain more de-tailed structural data for mine planning. Furthermore, follow-ing the dyke downdip may lead to a better understanding ofthe emplacement process associated with it.
Drilling has obvious limitations in spatial sampling, and thecosts are extremely high in this environment. This is partiallydue to the target depth and properties of the granitic andmetavolcanic host rock, but is exacerbated by the remote andlogistically challenging location. Shallow drillholes at the updipend of the dyke can be drilled economically, but at greaterdepths drilling large numbers of holes in order to define thelocation of the kimberlite is not cost-effective. For example,a single 1000-m hole costs US$200 000 (D. Clarke, personalcommunication, 2002). The number of future drillholes could
Figure 1. Geologic map of the Slave Province (modifiedfrom Bleeker and Davis, 1999). The Archean cratonic core isbounded by fault zones (bold lines), orogenic belts, and platfor-mal cover. Blue diamonds represent known kimberlite pipes,dykes, and sills. The study location at Snap Lake is noted.
be reduced by using seismic reflection techniques to map theintrusion, thereby providing guidance to the drilling program.Therefore, seismic reflection surveying was considered as apotential tool for exploration and for mapping characteristics(e.g., extent, continuity, and thickness) of the dyke.
Imaging thin kimberlite dykes and sills at depths exceed-ing 1 km is challenging for two reasons. First, resolving ordetecting a 1–3-m thick structure requires unusually high fre-quencies (>200 Hz) for imaging such a deep target. Second,guidance from other seismic reflection surveys of kimberlitedykes is extremely limited; no comparable exploration-scaleseismic surveys of thin kimberlite dykes have been reported.Working on a thicker target, Gendzwill and Matieshin (1996)successfully used seismic reflection techniques to identify thetop of a 100-m–thick extrusive kimberlite lens (crater facies)buried beneath approximately 100 m of sedimentary cover. Thefew published engineering-scale seismic surveys carried out onshallow (<100 m) dykes have had only limited success (e.g.,Hearst, 1998). Exploration for thin coal seams (e.g., Tselentisand Paraskevopolous, 2002) and thin-bed petroleum reservoirshas developed our understanding of reflection responses fromthin layers. However, there are significant differences betweendetecting these targets in a sedimentary environment and imag-ing kimberlites in an igneous host-rock setting. To evaluate thepotential for success of a seismic reflection survey proposed forthe Snap Lake dyke, a feasibility study was carried out. Physi-cal properties measurements of the Snap Lake kimberlite andhost rocks were made to estimate acoustic impedance. Then,the theoretical seismic responses of thin kimberlite dykes andthe optimal acquisition parameters for a seismic survey wereinvestigated.
The 2D reflection profiles over the Snap Lake dyke wereacquired to provide information that was locally useful to thecompanies involved and to address two questions with broaderimplications. First, is the seismic reflection method an effectiveand cost-efficient exploration tool for shallow-dipping kimber-lite dykes and sills in a hard-rock environment? Second, canseismic reflection studies image the kimberlite body and re-lated geology at scales that would prove useful for mine plan-ning and development (e.g., faults and detailed dyke topog-raphy)? The opportunity to ground-truth seismic results withdrillhole data makes the Snap Lake dyke a unique locale fortesting seismic reflection techniques on thin kimberlite dykes.
GEOLOGIC SETTING
Tectonic setting
The Slave Province of northwestern Canada is one of theprincipal Archean components of the North American cra-ton (Figure 1) (Bleeker and Davis, 1999). The Slave Provinceitself is comprised of interspersed Archean granitoid intru-sions, supracrustal sequences, and basement core complexes(Padgham and Fyson, 1992). The voluminous granitoid intru-sions dominate the Slave Province and were emplaced pre-,syn-, and post-deformation, with the last magmatic events as-sociated with the formation of the Slave completed by∼2.6 Ga.The Slave Province was incorporated into the North Ameri-can craton by the Proterozoic, leaving the Slave bounded byfault systems that have been inactive since 1.27 Ga. In addi-tion to large-scale tectonic deformation and modification, a

Seismic Imaging of Thin Kimberlite Dykes 1145
series of Proterozoic diabase dyke swarms sliced through theSlave. These include the Mackay dykes (2.21 Ga), the Lac deGras dykes (2.03 Ga), the prolific MacKenzie dykes (1.27 Ga),and finally the Franklin dykes (∼720 Ma) (LeCheminant et al.,1996). The only recorded magmatic episodes after the Franklinevent are the kimberlite intrusions.
The Slave Province is a classic setting for diamondiferouskimberlite pipes, but the discovery of such features is a tale ofthe 1990s. Pell (1997) provides an excellent review. The SlaveProvince has a stable and cool mantle root, a necessary char-acteristic for the development of the diamond stability field(e.g., Haggerty, 1986). The diamonds are entrained in mantle-derived kimberlite; these volatile-enriched, potassic, ultrabasicmagmas rise from depths greater than 150 km toward the sur-face where they are emplaced as small volcanic pipes, dykes,and sills. A fraction of the kimberlites are diamondiferous, andonly some of these are economically viable.
Typical pipes have diameters ranging from tens of meters tomore than 1000 m and can be envisaged as downward taper-ing cones with steep sides (80◦–85◦) and vertical extents of afew kilometers (e.g., Mitchell, 1995). Kimberlite dykes and sillsare smaller features that cut across existing structures or layers(dykes) or are emplaced between preexisting layers or alongzones of weakness (sills). Most of the kimberlite intrusions inthe Slave Province have been identified on the basis of a com-bined approach of tracing of diamond indicator minerals left bythe last glaciation, geophysical techniques (magnetic and elec-tromagnetic), and drilling. These techniques have not been suc-cessful at identifying subhorizontal dykes and sills. As a result,in the Slave Province more than 150 pipes were identified bythe late 1990s but only two dykes (Snap Lake and Munn Lake)have been discovered using traditional exploration methods.
Within the Slave Province, kimberlite pipes are much moreprevalent in the eastern segment, occurring principally in anarcuate zone which trends northwest from Lac de Gras in thecentral Slave for ∼135 km and northeast from the lake for∼100 km (Figure 1). However, isolated pipes exist both northand south of this zone. The central Lac de Gras kimberliteswere emplaced during both the Cretaceous and Tertiary, withages ranging from 97 to 52 Ma. However, other kimberlitesin the Slave province erupted as early as the Late Ordovicianto Cambrian (450–520 Ma) (Pell, 1997). The Snap Lake dykefalls into the latter age range with samples dated at 535± 11 Ma(Agashev et al., 2001) and 523± 6.9 Ma (Geospec Consultants,1999, De Beers Canada Mining Inc. internal report).
The Snap Lake kimberlite dyke: Geologic setting
Snap Lake is located within the Slave craton about 100 kmsouth of the main kimberlite field in the Lac de Gras region(Figure 1). The primary geological units are Archean intru-sive rocks, metavolcanic and allied rocks, and supracrustalrocks (Figure 2). The dominant intrusives belong to the De-feat pluton suite (2610–2590 Ma) and comprise granodiorite,tonalite, and monzogranite with locally abundant pegmatite.The intensely flattened mafic metavolcanic rocks are layeredamphibolites and are associated with synvolcanic gabbroic in-trusions. The supracrustals are primarily high-grade metatur-bidites and migmatite. Proterozoic diabase dykes cross thestudy area. Three main sets are recognized: the east-northeast–striking Mackay dykes, north-northeast–striking Lac de Gras
dykes, and the north-northwest–striking Mackenzie dykes(LeCheminant et al., 1996). They range in width from 100 m toa few meters. A detailed summary of the geology hosting theSnap Lake kimberlite can be found in Kirkley et al. (2003).
Kimberlites are hybrid rocks and consist of components de-rived from four distinct sources: primary mineral phenocrystsand matrix minerals from the kimberlite mantle magma,megacrysts or discrete nodules consisting of large (1–20 cm)
Figure 2. Seismic line locations on simplified geological map(M.P. Stubley, 1998, De Beers Canada Mining Inc. internal re-port). Drillhole locations closest to the seismic lines are noted.Intersection depth is color-coded, and dyke thickness is givenby circle diameter. Common-depth-point (CDP) bin centersare also labeled for comparison with the stacked sections. Themining camp and dyke subcrop location are noted by the redsquare.

1146 Hammer et al.
single crystals that could come from the kimberlite or othermantle magma, mantle-derived xenoliths and xenocrysts, andcrustal xenoliths and xenocrysts. The latter two rock types rep-resent material entrained in the magma as it moves upwardfrom its mantle source (e.g., Kirkley et al., 1991; Mitchell, 1995).Diamonds themselves are not genetically related to kimberlitebut are xenocrysts incorporated into the kimberlite magma inthe upper mantle. In general, kimberlites show a range of crys-tallization and textural properties. The hypabyssal Snap Lakekimberlite dyke is distinctive in the high proportion of coarse-grained macrocrysts (3–10 mm) (Kirkley et al., 2003). This isunusual when compared to kimberlite pipes, but may prove tobe typical of thin dykes.
The geometry and structure of the Snap Lake dyke is de-fined by drilling and the initial stages of undergound minedevelopment. Based on this spatially limited data, the dykeforms a sheet that dips from subcrop down to the northeast(Figure 2). Dip is approximately 15◦, but ranges from 5◦ to30◦. Dyke thickness is also variable; along the seismic profiles,drillcores document thicknesses from 3.4 to less than 0.5 m(Figure 2). Below 1000 m, the few cores yield intersections ofless than 1.6 m. In addition to variability in thickness, the drillintersections indicate that the dyke is complex in form, occa-sionally feathering into multiple strands or rapidly changingdip (McBean et al., 2003). Although most Slave Province kim-berlite pipes are localized along preexisting crustal structuresduring emplacement (e.g., lithologic contacts, faults), the SnapLake dyke appears to cut across all major features. The drill-cores also show that the dyke is accompanied by some relatedintrusions, fracturing, and alteration in the adjacent host rock.
Figure 3. P-wave velocity response of Snap Lake core samples.Velocities were recorded as pressure was increased from 0 to300 MPa and then reduced back to 0 MPa. Rapid changes invelocity between 0 and 5 MPa represent closure of the largercracks. Rock types are defined by symbol shapes; individualsamples denoted by symbol colors. The dashed line indicatesthe approximate pressure at 1 km depth; the gray-shaded zoneincludes the known depth extent of the dyke.
Thin kimberlite dykelets (1–10 cm) are usually encounteredwithin 10 m of the primary dyke. Strong alteration and contact-related carbonate veining usually extend less than 10 cm fromthe dyke (Kirkley et al., 2003).
PHYSICAL PROPERTIES
The physical properties of the kimberlite dykes and the hostrocks determine the impedance contrast to be detected by aseismic experiment. In addition to using published data (e.g.,Ji et al., 2002), compressional (P) velocity and density mea-surements were made on drillcore samples from Snap Lake(D. Schmitt, personal communication, 2001) The P-wave ve-locities (VP) were determined from 0 to 300 MPa (3 kbar or
Figure 4. Comparison between different dyke thicknesses. Pan-els show reflectivity synthetics for a horizontally layered modelfor kimberlite and 30-m–thick mafic dykes at depths rangingfrom 200 to 2000 m. True relative amplitude shot gathers areshown for the frequency range 120–500 Hz and for kimberlitedyke thicknesses of (a) 1 m, (b) 2 m, and (c) 6 m. Traces arecorrected for spherical divergence to facilitate comparison atgreater offsets.

Seismic Imaging of Thin Kimberlite Dykes 1147
Figure 5. FD modeling of a feathered kimberlite dyke. (a) Por-tion of model showing the kimberlite thinning from 5 to 1 mthickness. The sequence of shot gathers are all normal-moveout(NMO) corrected and displayed using true relative amplitudeand no correction for spherical divergence. Shot depth for allgathers is 0 m. Gathers are generated using a Ricker waveletsource centered at (b) 400 Hz, ( c) 200 Hz, and (d) 75 Hz. (e)For comparison with (c), a shot gather acquired from a modelwith a laterally continuous, 5-m–thick dyke.
∼10 km depth) at room temperature; density measurementswere made at laboratory pressure and temperature. Figure 3compares the VP of all tested samples; they exhibit a number ofconsistent characteristics. The kimberlite samples exhibit sig-nificantly lower VP (average 4.3± 0.1 km/s at 50 MPa) thanthose measured in the host rock (average 5.6± 0.2 km/s at50 MPa). The kimberlite densities (2.40 to 2.49 ±0.01 g/cm3
are consistently lower than those of the host rocks, whichranged from 2.66 to 2.95± 0.01 g/cm3. Thus, the impedancecontrast at vertical incidence between the kimberlite and hostrocks is large (∼0.2); significant reflected energy should begenerated. The single mafic dyke sample yielded velocity anddensity data (5.95 km/s at 50 MPa and 2.775± 0.011 g/cm3)that were surprisingly similar to that of the host rock. If thatsample is characteristic, then the mafic dykes should generate
Figure 6. Comparison of ground surface conditions. FD syn-thetics are modeled from a dipping kimberlite dyke and a hor-izontal mafic dyke. True relative-amplitude shot gathers aregenerated using a central Ricker source wavelet of 250 Hz.Traces are corrected for spherical divergence to facilitate com-parison at greater offsets. (a) Schematic of the model struc-ture; triangle shows source location. (b) Shot gather for vari-able thickness till layer at the surface with two pinch-outs tobedrock. (c) Shot gather for full bedrock exposure. Note thecorrespondence between the surface till and higher amplitudereflections with longer coda.
1148 Hammer et al.
lower reflection amplitudes than the kimberlites. In contrast,the physical properties of the pegmatite dyke (6.49 km/s at50 MPa and 2.579± 0.010 g/cm3) indicate that it could gener-ate reflections of similar amplitude to that of the kimberlites,but of opposite polarity.
MODELING AND EXPERIMENT DESIGN
Despite the large impedance contrast, the dyke representsa challenging target for a reflection survey because of thethinness of the sheet and the depth to which it extends. Asthe dyke thins, higher frequencies are required to resolve oreven detect it. For example, in order to resolve the 2-m thick-ness of a 4.3-km/s kimberlite dyke, wavelengths of less than8 m or frequencies of approximately 500 Hz are required(e.g., Widess, 1973). Efforts driven by the petroleum indus-try to detect thin-bed reservoirs show that tuning and thin-bedamplitude-variation-with-offset (AVO) effects can reduce thefrequencies required for target detection to as little as λ/20(e.g., Gochioco, 1991; Juhlin and Young, 1993; Lin and Phair,1993, Lin and Schmitt, 2003). Such estimates suggest that eventhe 1–2-m thick sections of the dyke could be detected if suf-ficient energy is returned above 200–250 Hz. Although fre-quencies of this range are commonly used in engineering-scalesurveys, there were no comparable surveys to provide a refer-ence for the unique combination of target thickness, depth, andunusual survey environment. Therefore, prior to conductingthe experiment, a study was carried out to explore attenuationeffects and resolution limitations, and to help determine theacquisition parameters for the survey. The primary questionsaddressed were (1) could the dyke be detected at all depths ofinterest? and (2) how much of the structural variability knownto exist along the dyke could be documented by reflection data?
Two modeling techniques were used. An elastic reflectivitycode (Fuchs and Mueller, 1971) provided fast, accurate calcula-tions of the full waveform response but is restricted to 1D mod-els. A 2D, viscoelastic finite-difference (FD) code (Robertssonet al., 1994), more computationally ex-pensive than reflectivity, was used tomodel laterally complex structures. Forall models, average densities and P-wave velocities based on the drill coremeasurements were used. Shear (S)wave velocities were calculated assumingVS=VP/(1.73). Attenuation (Q) was esti-mated to be QP= 400 and QS= 200 basedon crustal refraction experiments in crustdominated by granitic country rock. Forthe near-surface till layer, a QP of 50was used. Attenuation was considered tobe frequency independent, although en-ergy with frequencies greater than 100 Hzmay well be subject to higher attenuation(Mavko et al., 1979).
Evaluation of dyke reflection ampli-tudes requires a reference but there areno directly analogous surveys of kimber-lite dykes. However, a crustal-scale re-flection survey carried out across a till-covered, high-grade greenstone belt innorthwestern Ontario imaged a series of
mafic dykes (Zaleski et al., 1997). The dykes were subverti-cal and thicker (10–60 m) than the Snap Lake dyke, but theoffsets and hardrock environment were roughly analogous. Inaddition, the survey had acquisition parameters similar to thatenvisioned for the Snap Lake survey with reasonably high fold(60) and exploration-scale offsets (2.4 km). Explosive charges(0.34 kg) were used and, to reduce high frequency attenuation,the shotholes were drilled through the till into bedrock wherepossible. Reflected refractions from the dykes were recordedto beyond 1.2 s (∼3.6 km offset); frequency content ranged be-tween 40 and 120 Hz. These diabase dykes (VP of 6.8 km/s)provided a high impedance contrast (∼0.1) at vertical inci-dence relative to the greenstone host rocks (VP of 6.2 km/s)(Zaleski et al., 1997). The successful detection of dykes withhalf the impedance contrast and at over twice the range to thatexpected at Snap Lake provided encouragement. These maficdykes were used as a baseline in comparative modeling. A linkbetween these field data and our modeling results was madeby assuming that if synthetic reflection amplitudes from thinkimberlite dykes were within one order of magnitude of syn-thetic amplitudes generated by 30-m–thick mafic dykes (e.g.,Figure 4), there was a reasonable chance they could be dis-cerned in a survey.
Synthetic reflection gathers were generated using the reflec-tivity and FD codes to (1) test the AVO response of differentdyke thicknesses and source frequencies, and (2) consider theseismic response of laterally varying structures such as discon-tinuities in the dyke, dyke topography, and variations in thethickness of the till, water, and ice. These tests were under-taken to evaluate the potential for success of a field survey andto determine acquisition parameters, not to comprehensivelyinvestigate the reflectivity from thin beds of kimberlite.
The conclusions of the modeling study are based on the re-sults of many different tests run using both modeling codes.Three examples (Figures 4, 5, 6) illustrate some of the results.In Figure 4, the reflectivity code was used to generate shot gath-ers for a model with horizontal kimberlite dykes (1, 2, and 6 mthick) at 200, 500, 1000, and 1500 m depth and, for comparison
Table 1. Acquisition parameters.
Line 1 Line 2(land)—explosive (ice/land)—vibroseis
source and explosive source
Seismic SourcePentalite shots 460 shots @ 0.25 kg 23 shots @ 0.25 kg
Shot spacing 8 m (increasing to 12, 8 m16, 24 m along thenorthern third of the line)
Shot depth 1–3 m into bedrock 3–6 m into bedrockVibroseis None 222 vibe points
Shot spacing 8 mSweep characteristics Nonlinear 8× 10 s sweeps
from 100 to 500 HzRecordingSampling rate 0.5 ms 0.5 msRecord length 2 s 2 s (correlated)Geophone 28 Hz 28 HzArray size 816 phones (1 phone/group) 816 phones (1 phone/group)Phone/group interval 4 m, 2 m 4 m
(high-resolution section)Maximum offsets 3.264 km, 1.44 km 3.264 km maximum offset
(high-resolution section)Spread geometry Asymmetric split: Symmetric
300/516 downdip

Seismic Imaging of Thin Kimberlite Dykes 1149
with the Zaleski et al. (1997) data set, 30-m–thick mafic dykesat 750 and 2000 m depth. Using a 120–500 Hz source, the figureprovides a qualitative comparison of responses from differ-ent dyke thicknesses. As anticipated, thinner dykes at greaterdepths generate weaker responses.
The effectiveness of different source frequencies for reveal-ing laterally variable dyke structure are demonstrated in Fig-ure 5. In this example, the FD code was used to generate thesynthetic response from a kimberlite dyke at 300 m depth thatfeathers from 5 to 1 m thickness (Figure 5a). For this model,shot gathers were computed using a Ricker wavelet sourcecentered at 75, 200, and 400 Hz (Figures 5b, 5c, and 5d, re-spectively). The 400-Hz source generated data that resolvesthe thickness of the 5-m dyke and detects the lateral thin-ning. The 200-Hz gather (Figure 5c) provides some indicationof dyke feathering, primarily through a decrease in reflectionamplitude when compared with a gather from an unfeath-ered 5-m–thick dyke (Figure 5e). The 75-Hz source detectsthe 5-m–thick dyke, but amplitudes fall off significantly fromthe 1-m–thick dyke.
Figure 6 illustrates the effects of variable conditions in sur-face properties. This test is particularly relevant to the SnapLake region, which was subjected to Laurentide glaciation thatleft areas of polished bedrock interspersed with till-coveredareas of varying thickness. The laterally heterogeneous model(Figure 6a) includes a dipping kimberlite dyke of varying thick-ness (1–5 m, based on drillcore data) and, for reference, a hor-
Figure 7. (a) Explosive shot gather (peg 1169, CDP equivalent position is 880; see Fig-ure 2). The low-frequency ground roll dominates the record, obscuring the dyke reflec-tion. The noise between pegs 1410 and 1320 is due to recording on the ice covering ashallow lake. (b) The majority of the noise is removed by bandpass filtering (200–450 Hz).Several reflections including the dyke are visible.
izontal mafic dyke (30-m thick) at 350-m depth. Two separateshot gathers are shown to compare the effects with (Figure 6b),and without (Figure 6c) a thin layer of glacial till with variablethickness. Note the longer reflection coda associated with thepresence of a till layer relative to the model without the tilllayer.
The modeling demonstrated the feasibility of the proposedsurvey and provided insight for planning the acquisition geom-etry. The main conclusions of the study are:
1) At depths shallower than 500 m, sufficient energy in the200–400 Hz range is returned so that the likelihood of detect-ing a 1–2-m thick kimberlite dyke is high. As target depthsapproach 1000 m, weak amplitudes due to attenuation substan-tially increase the risk of failing to detect the target. Detectionis complicated by the laterally heterogeneous dip, thickness,and structure of the dyke. Furthermore, the deformed meta-morphosed host rocks and numerous subvertical dykes andfaults dissecting the region have the potential of generating acomplex reflected wavefield that could conceal the reflectionsfrom the thin target.
2) Dyke thickness and detailed structural variation are un-likely to be resolved. Despite this conclusion, detection of thesheet and mapping its surface topography were goals that con-tinued to drive the investigation.
3) Recording to large offsets (>1000 m) can yield useful re-flection amplitudes for imaging the dyke at depths greater than500 m (Figures 4 and 6). Longer offsets yield data uncontam-
inated by the significant ground roll gen-erated by the till and shallow water/icealong the line. In addition, thin-bed AVOeffects may increase reflectivity at greaterangles of incidence. This requires furtherstudy.
4) With an acquisition layout designedfor long offsets, small variations in the to-pography of the dyke (e.g., 5 m over a100-m distance at 300-m depth) will bedifficult to document. This scale of varia-tion is of interest for mine development,but its imaging is unrealistic for a seis-mic experiment of this type. Large gaps(>20 m) in the continuity of the dykesshould be detectable, but moderate noiselevels and 3D effects will likely masksmaller variations in continuity. Feather-ing of dykes (i.e., rapid changes in dykethickness over small distances on the or-der of tens of meters) will only be de-tected through variations in amplitude.
5) The requirement of high frequen-cies for detecting the dyke reinforces theneed to maximize signal-to-noise ratios(S/Ns) during acquisition (e.g., record-ing data with high fold and ensuringexcellent source and receiver coupling).In addition, the high-frequency reflec-tions require accurate statics corrections,a task made more complex by the largelateral velocity variations in the near-surface resulting from alternating ex-posed bedrock, glacial till (permafrost),and lakes.

1150 Hammer et al.
On the basis of these conclusions and other considerations,our industrial partners decided to proceed with a field experi-ment.
DATA ACQUISITION
The data acquisition layout was designed to achieve multiplegoals. In addition to imaging the dyke, the survey was to deter-mine the optimal acquisition parameters for potential futuresurveys. Therefore, the survey included explosive and vibroseissources, land and lake-ice coverage, and long offsets. Data wereacquired in May 2001 along two lines (Figure 2; Table 1). Line1 (5.86-km long) was positioned on land to profile downdip(dyke dipping from subcrop to more than 1300-m depth). Line2 (3.46-km long) was oriented approximately crossdip (dykedepth from 66 to 303 m) with the majority of the profile cross-ing Snap Lake. Maximum water depth along the seismic lineis 15 m, and the ice thickness during acquisition was approxi-mately 1 m.
In order to generate sufficient energy at the high frequen-cies required, small explosive shots detonated in holes drilledthrough the glacial till into bedrock were considered the opti-mal choice. However, drilling numerous shot holes in a graniticenvironment is costly and, in the sensitive ecology of the north,is accompanied by permitting difficulties. A vibroseis unit iscost-efficient, more easily permitted, and able to operate onboth lake ice and land. However, it was unclear if the poorercoupling associated with a minivibe inthis environment would limit the high-frequency energy produced. Therefore,both sources were tested (Table 1). Theinitial intent was to acquire coincidentdata sets along line 1 using both explosivesources and vibroseis for comparativepurposes. Unfortunately, deterioratingsurface conditions prevented the late-season use of vibroseis on land for envi-ronmental reasons. A direct comparisonof sources was achieved, however, alonga small portion of line 2, where 23 explo-sive shots were recorded in addition tothe vibroseis data.
The basic acquisition configuration wasthe same for both explosive and vibroseislines (Table 1). Data were recorded us-ing an I/O System 2000. The receiver ar-ray used single geophones spaced at 4-mintervals. However, to provide improvedspatial sampling at the shallow end of thedyke, geophone spacing was decreasedto 2-m intervals along the southwestern1.94 km of line 1 (Figure 2).
DATA PROCESSING
A relatively standard data process-ing flow was used. However, to enhancethe chances of imaging the thin target,considerable effort was applied to staticscorrections (refraction and residual) aswell as velocity and spectral analyses. Theinitial processing steps included field ge-
ometry, quality control (trace editing and muting), and first-break picking. Refraction statics analyses were accomplishedusing a 3D inversion algorithm that was applied to the first-break traveltimes to generate a layered velocity model (Hamp-son and Russell, 1984). The resulting model consisted of avariable weathering layer representing the till and sediments(520 m/s) overlying two granitic layers with velocities smoothlyincreasing from 5800 to 6100 m/s. Prestack processing includedband-pass filtering (120–450 Hz), f -k filtering, spherical di-vergence, spectral balancing, NMO, deconvolution, and resid-ual statics. Poststack processing included deconvolution, time-variant filtering, and finite-difference time migration.
RESULTS AND DISCUSSION
Reflections from the dyke were detected along both lines.The line 1 land profile acquired using explosive shots was spec-tacularly successful. The line 2 vibroseis profile had mixedsuccess: dyke reflections were recorded on land, but the ice ex-periment recorded poor quality data with no visible reflections.
Line 1—Explosive source on land
The quality of the data acquired along line 1 was reason-ably high even though the spring thaw had just begun, at timesdegrading geophone coupling. However, the S/N was sufficient
Figure 8. Migrated stacks of line 1: (a) the full profile with a thin black line tracingthe top of the dyke reflection package, (b) enlargement of box 2 in (a) showing thedyke reflections through a zone with significant variations in reflector amplitude and dip.Depths to kimberlite from nearby drillholes are indicated. In (b), dyke thickness is labeledfor each drillhole. For cores exhibiting significant feathering, the thickest kimberliteintersections are labeled. Note the correspondence between zones of low amplitudewith regions that are feathered or have significant crossdip. Approximate depths arecalculated assuming 6 km/s and are corrected to a 465-m datum.

Seismic Imaging of Thin Kimberlite Dykes 1151
that reflections from the dyke can be observed in many of theshot records. Figure 7 shows an example of a shot gather; thedyke reflection below the shot point is at 180 ms (∼550 m).Strong, low-frequency ground roll dominates the unfilteredpanel but was easily removed using a bandpass filter (200–450 Hz) (Figure 7b) or f -k filtering. The dominant frequencyof the explosive shots was approximately 100 Hz, with goodgeneration of high-frequency energy to well above 400 Hz. Thefrequency content of the dyke reflections was between 240 and350 Hz, with a broad range of dominant frequencies that gen-erally decreased with reflector depth due to attenuation. Thesefrequencies are high enough to be well into the predicted rangerequired to detect the dyke.
The dyke is superbly imaged from 30 ms (∼60 m) to 425 ms(∼1300 m) with faint reflections continuing to at least 520 ms(1650 m) (Figure 8). The coincident and near-coincident drill-hole data correlate well with the reflection image, but the seis-mic profile adds considerable detail to the known topographyof the dyke (Figures 8–10). Contrasting rather dramaticallywith reflection profiles in sedimentary environments, the targetis the only reflector present that has substantial lateral conti-nuity within the generally transparent granitic host rock. Al-though this enhances the dyke reflections, the lack of otherreflectors limits interpretations of fault locations and regionalgeological structure. In addition, techniques that benefit fromcomparisons between reflectors (e.g., semblance and waveletanalyses) are ineffective.
Throughout most of the profile, the reflective package com-prises 3–5 cycles (∼20 ms or ∼90 m) in both shot gathers andstacked sections (Figures 7 and 8). Clearly, the dyke thickness isnot resolved. The frequency content of the stacked reflections issomewhat lower than those in the gathers. Several factors likelycontribute to the exaggerated thickness and reduced frequen-cies of the reflection package along the profile. Multiples frominternal reflections within the dyke as well as those trappedwithin the thin, intermittent till layer could add cycles to thedyke reflections. This phenomenon is clearly visible in the syn-thetic models (Figure 6). Large offline variations in topographyand thickness of the kimberlite sheet will add complexity to thereflection package imaged beneath the 2D profile. Imperfectstatics corrections also could attenuate the high frequencies in
Figure 9. Enlargement of box 1 in Figure 8. Unmigrated stack images the dyke as it ap-proaches the surface at the southwest end of line 1. Black lines delineate interpreted topof the kimberlite dyke. Depths at which near-coincident drillholes intersect the top of thedyke are shown and kimberlite thicknesses are noted. Approximate depths are calculatedassuming 6 km/s and are corrected to a 465-m datum.
the stacked data and increase the effective seismic thicknessof the dyke. Finally, the drillcores indicate considerable vari-ability in the degree of feathering, small intrusions (dykelets),alteration, and fracturing adjacent to the dyke. In some regions,reverberations from small-scale layering could add to the re-flective coda. The nature and extent of the coda are the subjectof ongoing research.
Amplitudes of the dyke reflections vary considerably alongthe profile. Attributing these variations to specific dyke struc-ture is difficult because all of the factors that influence thethickness of the reflection package can also influence ampli-tudes. In addition, amplitude variations also may be influencedby compositional variation within the dyke; the unusually highproportion of brecciated material within the dyke itself is het-erogeneous, and this may influence reflectivity and tuning char-acteristics. However, two important observations can be made.
1) Several zones where reflection amplitudes drop and conti-nuity decrease correspond to places where drillcores indi-cate the dyke changes from a relatively simple planar sheetto a region with considerable 3D variation in topographyand thickness (e.g., CDP ranges 500–700 and 850–1250 inFigure 8). Several drillcores in these regions indicate thedyke becomes locally feathered, with many thin splays be-ing intersected. These correlations have important impli-cations for using the seismic data for mine development.The observations suggest that the amplitude data may beuseful for illuminating fine-scale structure and thus guidingfurther drilling to efficiently investigate complex zones thatmay present difficulties for mining.
2) Amplitudes decrease significantly below 0.35 s (∼1150 m).The few drillcores from these depths indicate the dyke thinsto less than 1.6–1.0 m (Figures 8 and 10). Similarly, reducedamplitudes are observed in other regions associated withdyke thicknesses of less than 1.3 m (Figure 8 and 9). Thismay correspond with attenuation or poor quality acquisi-tion and processing of the high frequencies required to de-tect the dyke at sub-1.5-m thicknesses. In addition, if tuningeffects are playing a role, their influence may be reduced asdyke thickness decreases below 1.5 m.
In order to understand the ob-served amplitude variations, addi-tional work is required to model thin-layer tuning effects in conjunctionwith the drillcore and seismic data.
The long offset data were importantfor imaging the dyke at depth. Testsusing selected offset ranges indicatethat, for exploration purposes, thindyke detection below 400 m improvedsignificantly as offsets were increasedto 1000 m. When the target depth ex-ceeded 1000 m, slight improvementswere observed using offsets exceed-ing 1000 m.
Line 2—Vibroseis source on lakeice and land
In contrast with the superb reflec-tion data acquired along line 1, the

1152 Hammer et al.
line 2 data set was decidedly inferior (Figure 11). Recordingconditions were ideal during acquisition, with no wind and ex-cellent geophone coupling due to cold temperatures freezingthe geophones in place. However, the reverberations and flex-ural wave energy generated by the Snap Lake ice, water, andtill layers contaminated the data with noise that proved difficultto remove. The same reverberations also affected the energyreturned from the dyke below. Furthermore, high frequencieswere attenuated, thereby decreasing the resolving and detec-tion potential of the data set. In the shot gathers acquired whenthe minivibe was operated on the lake ice, no reflections wereobserved from the dyke. Reverberations and ambient noisemasked any signal, including first breaks, beyond 1000-m offset.Efforts to enhance the dyke reflections were made more diffi-cult because the dyke lies between 20 and 100 ms (60–300 m)depth along the profile. Therefore, at near offsets, the signalwas buried in reverberatory noise; at more distant offsets, notenough energy was returned to detect the signal.
Although the majority of line 2 crossed Snap Lake, the north-west 600 m of the line were on land. Along this section, thevibroseis unit successfully detected the dyke with reflectionsapparent in the shot gathers (Figure 12a). Operation of the vi-broseis unit on the frozen ground effectively propagated high-frequency energy; the dominant frequencies of the shallowdyke reflections are approximately 330 Hz.
Figure 10. Enlargement of box 3 in Figure 8. Unmigrated stackshows the low-amplitude reflector at the north end of the pro-file. Although it may be a diffraction, the dyke may be imaged to1650-m depth; dip appears to increase below 1500 m. Drillcoreintersection with kimberlite was 600-m offline. Approximatedepths are calculated assuming 6 km/s and are corrected to a465-m datum.
Figure 11. Vibroseis ice shot gather (pegand CDP 515; see Figure 2). In this por-tion of the shot gather, the source and allgeophones are on the ice surface. Groundroll and reverberations dominate, and thesignal attenuates much more quickly thanwhen the geophones are on land (e.g., Fig-ure 7). The 140-Hz low-cut filter does littleto improve the S/N.
The stacked section shown in Figure 13 includes only theon-land vibroseis shots recorded into the array. If the on-icevibroseis shots are included, the image quality degrades signif-icantly. The dyke is imaged beneath the 600 m of the line onland but not beneath the lake ice.
Vibroseis and explosive source comparison
Although a minivibe was the primary seismic source alongline 2, 23 shots were detonated along the northwestern portionof the line. This provided an opportunity to directly comparecoincident vibroseis and explosive sources on land (Figure 12).The dyke reflection is present in both shot gathers. The fre-quency content of the shot data is only slightly higher thanthat of the vibroseis data. However, significantly more energywas output by the 0.25-kg charges. The fact that the minivibegathers did successfully record dyke reflections is an impor-tant observation considering the cost-efficiency and low envi-ronmental impact of vibroseis compared to bedrock-coupledexplosive shots.
Figure 12. Comparison between nearly coincident vibroseis (a)and explosive (b) shotpoints. These shotpoints are located onland where lines 1 and 2 intersect (Figure 2). The gathers arefiltered with a 160-Hz low-cut. S/N is better with the 0.25-kgshot than the vibroseis source. However, both sources detectthe shallow dyke, which lies 66 m below the shotpoints.
Seismic Imaging of Thin Kimberlite Dykes 1153
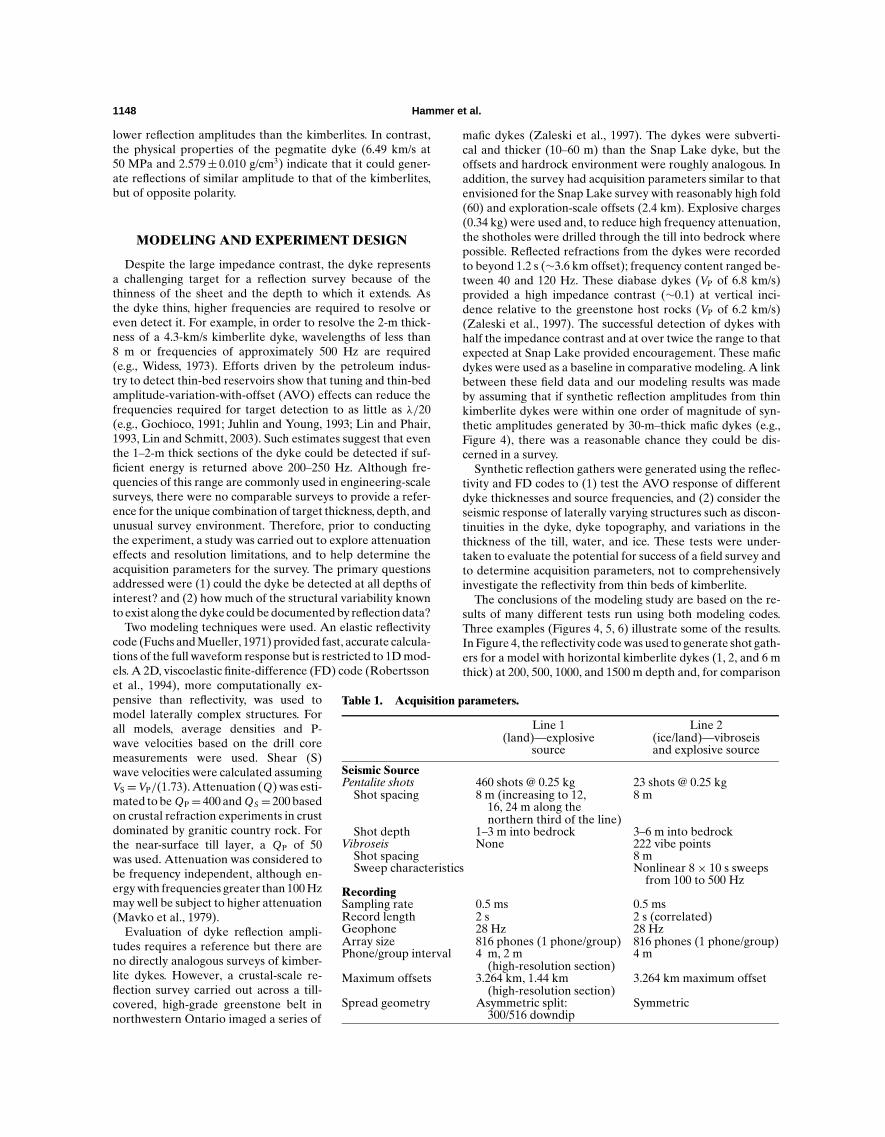
Figure 13. Migrated stack of the north-west quarter of line 2. Only vibroseis shotson land are included in the stack. CDPnumber denotes centers of 2-m bins. Near-coincident drillhole depths are approxi-mated using 6 km/s and are corrected toa 500-m datum.
SUMMARY
The Snap Lake experiment demonstrated that seismic reflec-tion surveying can be an extremely useful tool for explorationand deposit mapping of thin kimberlite dykes or sills. With anappropriate target, drilling programs that are limited by highcosts and poor spatial sampling could be significantly enhancedby the addition of seismic reflection profiles. As an exploration-scale tool for thin dyke detection, the bedrock-coupled dyna-mite data excelled. The limited success of the land-based vibro-seis data indicates that a vibroseis source could also produceacceptable results. Indeed, a subsequent survey clearly imagedthe dyke to more than 1300-m depth using a vibroseis source(Diamondex Resources Ltd., personal communication, 2002).
Unfortunately, the failure of the lake-ice vibroseis line is asignificant, if not unexpected, outcome because 30–40% of theSlave kimberlite zone is covered by water. Winter surveys havemany advantages in this region. Environmental permitting iseasier because the fragile terrain and sensitive lake ecosystemslimit activities during nonfrozen periods. Mobility is easy whenthe terrain is covered by snow and ice, but very limited other-wise. The negative results from the minivibe survey on lakeice indicate that alternative techniques for acquiring reflectiondata over lakes must be used. High-resolution marine surveysmay be the solution, but these would present their own tech-nical and permitting challenges.
The survey acquisition parameters and dyke thickness lim-ited the usefulness of the data for detailed mine planning.Dyke thickness was not directly resolved, and 3D structuremakes interpretation of fine-scale structure and continuity dif-ficult. However, this initial application of seismic techniqueshas raised a number of issues that, if addressed, suggest thatreflection data may be even more useful for deposit character-ization and more detailed mine-development applications. Inparticular, the variability in reflection attributes appears to becorrelated with dyke thickness and structure. In order to under-stand these observations, ongoing studies are directed towardsinvestigations of thin-layer reflectivity in conjunction with thedrillcore and seismic data.
Although subhorizontal kimberlite intrusions are not com-mon, the success of the reflection method at Snap Lake mayencourage use of vertical seismic profiling, crosshole tomogra-phy, and other seismic techniques to image the more prevalentnear-vertical kimberlite pipes. In principle, seismic methodscould be used to map the kimberlite pipe–host rock contact,providing an important new tool for characterizing kimberlitedeposits.
ACKNOWLEDGMENTS
This project could not have been completed without the col-laboration and funding provided by De Beers Canada MiningInc. and Diamondex Resources Ltd. In particular, the com-panies representatives, Melissa Kirkley and David Clarke, re-spectively, helped initiate and guide the project. Discussionswith Duncan McBean and constructive comments from Rod-ney Calvert and an anonymous reviewer also improved themanuscript. We thank the Snap Lake mine personnel for theircooperation and assistance in performing what was a rather un-usual experiment in that setting. We’re also indebted to DougSchmitt and his students at the University of Alberta for con-ducting the physical properties measurements on the drillcoresamples. Kinetex Inc. acquired the data and the seismic pro-cessing was completed using GLOBE Claritas and Hampson-Russell software. This project was funded in part by a NSERCCollaborative Research and Development Grant.
REFERENCES
Agashev, A. M., N. P. Pokhilenko, J. A. McDonald, E. Takazawa, M. A.Vavilov, N. V. Sobolev, and T. Watanabe, 2001, A unique kimberlite-carbonatite primary association in the Snap Lake dyke system, Slavecraton: Evidence from geochemical and isotopic studies: Presentedat the Slave-Kaapvaal Workshop.
Bleeker, W., and W. J. Davis, 1999, The 1991–1996 NATMAP SlaveProvince Project: Introduction: Canadian Journal of Earth Sciences,36, 1033–1042.
Carlson, J. A., M. B. Kirkley, E. M. Thomas, and W. D. Hillier, 1999, Re-cent Canadian kimberlite discoveries, in Gurney, J. J., Gurney, J. L.,Pascoe, M. D., and Richardson, S. H., Eds., The J. B. Dawson Vol-ume, 7th International Kimberlite Conference, Extended Abstracts,81–89.
Fuchs, K., and G. Mueller, 1971, Computation of synthetic seismogramswith the reflectivity method and comparison with observations: Geo-physical Journal of the Royal Astronomical Society, 23, 417–433.
Gendzwill, D. J., and S. D. Matieshin, 1996, Seismic reflection survey ofa kimberlite intrusion in the Fort a la Corne district, Saskatchewan,in LeCheminant, A. N., Richardson, D. G., Dilabio, R. N. W., andRichardson, K. A., Eds., Searching for diamonds in Canada: Geo-logical Survey of Canada Open File Report 3228, 251–253.
Gochioco, L. M., 1991, Advances in seismic reflection profiling in U.S.coal exploration: The Leading Edge, 10, 24–29.
Haggerty, S. E., 1986, Diamond genesis in a multiply constrainedmodel: Nature, 320, 34–37.
Hampson, D., and B. Russell, 1984, First-break interpretation usinggeneralized linear inversion: Canadian Journal of Exploration Geo-physics, 20, 40–54.
Hearst, R. B., 1998, Reflections on kimberlite: A seismic adventure:68th Annual International Meeting, SEG, Expanded Abstracts,780–783.
Ji, S., Q. Wang, and B. Xia, 2002, Handbook of seismic properties ofminerals, rocks and ores: Polytechnic International Press.
Juhlin, C., and R. Young, 1993, Implications of thin layers for amplitudevariation with offset (AVO) studies: Geophysics, 58, 1200–1204.

1154 Hammer et al.
Kirkley, M. B., J. J. Gurney, and A. A. Levinson, 1991, Age, origin andemplacement of diamonds: Scientific advances in the last decade:Gems and Gemnology, 27, 2–25.
Kirkley, M. B., T. Mogg, and D. McBean, 2003, Snap Lake trip guide,in Kjarsgaard, B. A., ed., 8th International Kimberlite Confer-ence, Slave Province and Northern Alberta Field Trip Guidebook,1-12.
LeCheminant, A. N., L. M. Heaman, O. van Breemen, R. E. Ernst, W.R. A. Baragar, and K. L. Buchan, 1996, Mafic magmatism, mantleroots, and kimberlites in the Slave craton, in LeCheminant, A. N.,Richardson, D. G., Dilabio, R. N. W., and Richardson, K. A., Eds.,Searching for diamonds in Canada: Geological Survey of CanadaOpen File Report 3228, 161–169.
Lin, T. L., and R. Phair, 1993, AVO tuning: 63rd Annual InternationalMeeting, SEG, Expanded Abstracts, 727–730.
Lin, Y., and D. Schmitt, 2003, Amplitude and AVO responses of a singlethin bed: Geophysics, 68, 1161–1168.
Mavko, G. M., E. Kjartansson, and K. Winkler, 1979, Seismic waveattenuation in rocks: Reviews of Geophysics and Space Physics, 27,
1155–1164.Mitchell, R. H., 1995, Kimberlites, orangeites, and related rocks:
Plenum Press.McBean, D., M. Kirkley, and C. Revering, 2003, Structural controls on
the morphology of the Snap Lake kimberlite dyke: 8th InternationalKimberlite Conference, Expanded Abstracts, 69–74.
Padgham, W. A., and W. K. Fyson, 1992, The Slave Province: a distinctArchean craton: Canadian Journal of Earth Sciences, 29, 2072–2086.
Pell, J. A., 1997, Kimberlites in the Slave craton, Northwest Territories,Canada: Geoscience Canada, 24, 77–90.
Robertsson, J. O. A., J. O. Blanch, and W. W. Symes, 1994, Viscoelasticfinite-difference modeling: Geophysics, 59, 1444–1456.
Tselentis, G.-A., and P. Paraskevopolous, 2002, Application of a high-resolution seismic investigation in a Greek coal mine: Geophysics,67, 50–59.
Widess, M. B., 1973, How thin is a thin bed?: Geophysics, 38, 1176–1180.Zaleski, E., D. W. Eaton, B. Milkereit, B. Roberts, M. Salisbury, and
L. Petrie, 1997, Seismic reflections from subvertical diabase dikes inan Archean terrane: Geology, 25, 707–710.