case-control genome-wide association study of attention ... · association study of attention-...
TRANSCRIPT

Case-Control Genome-Wide
Association Study of Attention-
Deficit/Hyperactivity Disorder
Benjamin M. Neale, Ph.D., Sarah Medland, Ph.D., Stephan Ripke, M.D., Richard J.L. Anney, Ph.D., Philip Asherson, M.R.C.Psych., Ph.D., Jan Buitelaar, M.D.,
Barbara Franke, Ph.D., Michael Gill, M.B., Bch, BAO, M.D., MRCPsych, F.T.C.D., Lindsey Kent, M.D., Ph.D., Peter Holmans, Ph.D., Frank Middleton, Ph.D.,
Anita Thapar, M.D., Klaus-Peter Lesch, M.D., Stephen V. Faraone, Ph.D., Mark Daly, Ph.D., Thuy Trang Nguyen, Dipl. Math. oec, Helmut Schäfer, Ph.D.,
Hans-Christoph Steinhausen, M.D., Ph.D., D.M.Sc., Andreas Reif, M.D., Tobias J. Renner, M.D., Marcel Romanos, M.D., Jasmin Romanos, M.D.,
Andreas Warnke, M.D., Ph.D., Susanne Walitza, M.D., Christine Freitag, M.D., M.A., Jobst Meyer, Ph.D., Haukur Palmason, Ph.D., Aribert Rothenberger, M.D., Ph.D.,
Ziarih Hawi, Joseph Sergeant, Ph.D., Herbert Roeyers, M.D., Ph.D., Eric Mick, Sc.D., Joseph Biederman, M.D., for the IMAGE II Consortium
Objective: Although twin and family studies have shown attention-deficit/hyperactivity
disorder (ADHD) to be highly heritable, genetic variants influencing the trait at a genomewide
significant level have yet to be identified. Thus additional genomewide association
studies (GWAS) are needed. Method: We used case-control analyses of 896 cases with
DSM-IV ADHD genotyped using the Affymetrix 5.0 array and 2,455 repository controls
screened for psychotic and bipolar symptoms genotyped using Affymetrix 6.0 arrays. A
consensus SNP set was imputed using BEAGLE 3.0, resulting in an analysis dataset of
1,033,244 SNPs. Data were analyzed using a generalized linear model. Results: No genomewide
significant associations were found. The most significant results implicated the following
genes: PRKG1, FLNC, TCERG1L, PPM1H, NXPH1, PPM1H, CDH13, HK1, and HKDC1.
Conclusions: The current analyses are a useful addition to the present literature and will
make a valuable contribution to future meta-analyses. The candidate gene findings are
consistent with a prior meta-analysis in suggesting that the effects of ADHD risk variants
must, individually, be very small and/or include multiple rare alleles. J. Am. Acad. Child
Adolesc. Psychiatry, 2010;49(9):906 –920. Key Words: ADHD, genetics, genome-wide association,
Imputation

Attention-deficit/hyperactivity disorder (ADHD) is among the most common childhood onset psychiatric disorders. The
worldwide prevalence of ADHD in children is 8% to 12%1 and the prevalence of ADHD in adults in the United States
is approximately 4%.2,3 Early studies found the risk of ADHD among parents of children with ADHD to be increased
by between two- and eightfold, with similarly elevated risk among the siblings of ADHD subjects (for a review of this
literature, see Faraone and Biederman 4). Faraone et al.5 extended these findings to families ascertained via adult
probands meeting criteria for either full DSM-IV ADHD or late-onset ADHD.
Adoption and twin studies are necessary to disentangle genetic from environmental sources of transmission observed
in family studies. Three studies found that biological relatives of ADHD 6 or hyperactive children 7,8 were more likely
to have hyperactivity than adoptive relatives. A more direct method of examining the heritability of ADHD is to study
twins: the extent to which monozygotic twins are more concordant for ADHD than dizygotic twins can be used to
compute the degree to which variability in ADHD in the population can be accounted for by genes (i.e., heritability).
Reviews of twin studies from the United States, Australia, Scandinavia and the European Union show heritability for
ADHD to be approximately 75%, which places it among the most heritable of psychiatric disorders.9–11
Candidate gene association studies have focused heavily on catecholaminergic pathways,16–20 the major target of most
pharmacotherapies for ADHD.21 However, genes within the serotonergic and neuro-developmental pathways have also
been examined. A meta-analysis found nominally significant (p < .05) associations at the following: SLC6A3/DAT1 (3'UTR
VNTR and rs27072), DRD4 (exon 3 VNTR and rs1800955), DRD5 (148-bp allele), SLC6A4/5HTT (5HTTLPR), HTR1B
(rs6296), and SNAP-25 (rs3746544)16; however, these effects, if present, are likely to be small and have not been
unequivocally confirmed by prior genome-wide association scans of ADHD.22–25
The present work continues the search for ADHD susceptibility genes by completing a new, independent, multi-site case-
control genome-wide association study (GWAS) of DSM-IV ADHD, using the Affymetrix 5.0 and 6.0 arrays.
In an attempt to find regions of chromosomes that might harbor genes for ADHD, several groups have conducted
genome-wide linkage scans. This approach examines many DNA markers across the genome to determine whether
any chromosomal regions are shared more often than expected among ADHD family members. These have produce
mixed results, with some reporting evidence of linkage 12,13 and others not.14 To determine whether there were any
significant linkage signals among these studies, Zhou et al.15 conducted a genome scan meta-analysis of these data.
They reported genome-wide significant linkage (pSR = .00034, pOR = .04) for a region on chromosome 16 between
64 Mb and 83 Mb. Although this finding is intriguing and worthy of follow-up, the lack of significant findings for other
loci suggests that many genes of moderately large effect are unlikely to exist, and that the method of association will
be more fruitful in the search for ADHD susceptibility genes.
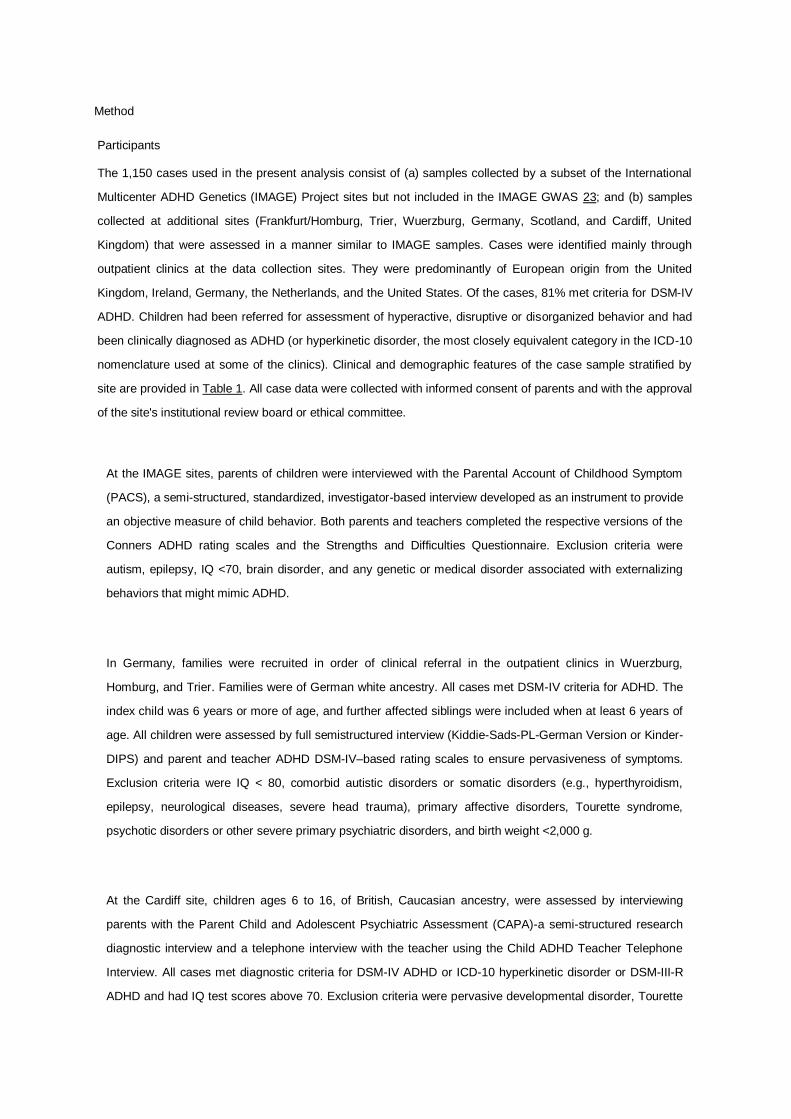
Method
Participants
The 1,150 cases used in the present analysis consist of (a) samples collected by a subset of the International
Multicenter ADHD Genetics (IMAGE) Project sites but not included in the IMAGE GWAS 23; and (b) samples
collected at additional sites (Frankfurt/Homburg, Trier, Wuerzburg, Germany, Scotland, and Cardiff, United
Kingdom) that were assessed in a manner similar to IMAGE samples. Cases were identified mainly through
outpatient clinics at the data collection sites. They were predominantly of European origin from the United
Kingdom, Ireland, Germany, the Netherlands, and the United States. Of the cases, 81% met criteria for DSM-IV
ADHD. Children had been referred for assessment of hyperactive, disruptive or disorganized behavior and had
been clinically diagnosed as ADHD (or hyperkinetic disorder, the most closely equivalent category in the ICD-10
nomenclature used at some of the clinics). Clinical and demographic features of the case sample stratified by
site are provided in Table 1. All case data were collected with informed consent of parents and with the approval
of the site's institutional review board or ethical committee.
At the IMAGE sites, parents of children were interviewed with the Parental Account of Childhood Symptom
(PACS), a semi-structured, standardized, investigator-based interview developed as an instrument to provide
an objective measure of child behavior. Both parents and teachers completed the respective versions of the
Conners ADHD rating scales and the Strengths and Difficulties Questionnaire. Exclusion criteria were
autism, epilepsy, IQ <70, brain disorder, and any genetic or medical disorder associated with externalizing
behaviors that might mimic ADHD.
In Germany, families were recruited in order of clinical referral in the outpatient clinics in Wuerzburg,
Homburg, and Trier. Families were of German white ancestry. All cases met DSM-IV criteria for ADHD. The
index child was 6 years or more of age, and further affected siblings were included when at least 6 years of
age. All children were assessed by full semistructured interview (Kiddie-Sads-PL-German Version or Kinder-
DIPS) and parent and teacher ADHD DSM-IV–based rating scales to ensure pervasiveness of symptoms.
Exclusion criteria were IQ < 80, comorbid autistic disorders or somatic disorders (e.g., hyperthyroidism,
epilepsy, neurological diseases, severe head trauma), primary affective disorders, Tourette syndrome,
psychotic disorders or other severe primary psychiatric disorders, and birth weight <2,000 g.
At the Cardiff site, children ages 6 to 16, of British, Caucasian ancestry, were assessed by interviewing
parents with the Parent Child and Adolescent Psychiatric Assessment (CAPA)-a semi-structured research
diagnostic interview and a telephone interview with the teacher using the Child ADHD Teacher Telephone
Interview. All cases met diagnostic criteria for DSM-IV ADHD or ICD-10 hyperkinetic disorder or DSM-III-R
ADHD and had IQ test scores above 70. Exclusion criteria were pervasive developmental disorder, Tourette
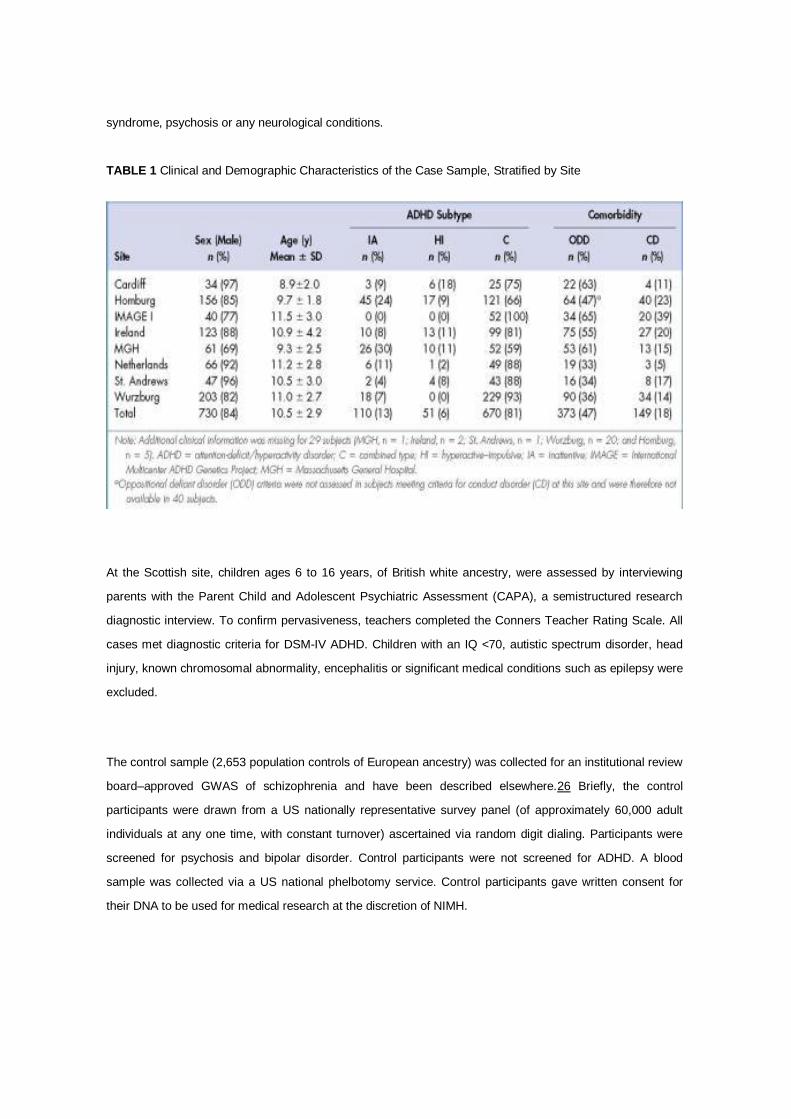
syndrome, psychosis or any neurological conditions.
TABLE 1 Clinical and Demographic Characteristics of the Case Sample, Stratified by Site
At the Scottish site, children ages 6 to 16 years, of British white ancestry, were assessed by interviewing
parents with the Parent Child and Adolescent Psychiatric Assessment (CAPA), a semistructured research
diagnostic interview. To confirm pervasiveness, teachers completed the Conners Teacher Rating Scale. All
cases met diagnostic criteria for DSM-IV ADHD. Children with an IQ <70, autistic spectrum disorder, head
injury, known chromosomal abnormality, encephalitis or significant medical conditions such as epilepsy were
excluded.
The control sample (2,653 population controls of European ancestry) was collected for an institutional review
board–approved GWAS of schizophrenia and have been described elsewhere.26 Briefly, the control
participants were drawn from a US nationally representative survey panel (of approximately 60,000 adult
individuals at any one time, with constant turnover) ascertained via random digit dialing. Participants were
screened for psychosis and bipolar disorder. Control participants were not screened for ADHD. A blood
sample was collected via a US national phelbotomy service. Control participants gave written consent for
their DNA to be used for medical research at the discretion of NIMH.

Genotyping
Cases were genotyped using the Affymetrix 5.0 array at the State University of New York Upstate Medical University,
Syracuse using the standard protocol issued by Affymetrix. The genotypes were called using both BRLMM-P and
BIRDSUITE,27 with any calling discrepancies coded as missing. Controls were genotyped using the Affymetrix 6.0
array, at the Broad Institute National Center for Genotyping and Analysis. Genotype calls were made with the
BIRDSEED program, a module of the BIRDSUITE package.
The control genotype data initially quality controlled by the National Center for Biotechnology Information (NCBI). The
quality control (QC) of the control data has been described in detail elsewhere.26 Briefly, the 2,653 control samples
used in the present analyses had call rates >97%, genders consistent with site reports, and 26% to 28.5%
heterozygous genotypes, and were of European ancestry (as evaluated by EIGENSTRAT). The prior data-cleaning
efforts for this set of genotypes include SNP call rate <95%, Hardy–Weinberg equilibrium, p value <10-6, MAF <1%,
plate effects, and removal of SNPs showing more than two Mendelian errors (from a set of trios that are not included
in these analyses) or discordant genotypes for duplicate samples.
QC and Statistical Analyses
As the cases and controls were genotyped using different platforms, we undertook additional QC checks before
conducting imputation. To ensure imputation quality, we applied more stringent QC exclusion thresholds and carefully
examined differences between cases and controls. Our key criterion for QC consideration was call rate at the sample
and SNP levels, as well as call rate differences between cases and controls. These sample and SNP exclusion criteria
are found in Table 2.
TABLE 2 Summary of Case and Control Quality Control (QC) Filtering and Exclusion Criteria, in Order of Operation

In the first stage of QC, the case and control samples were screened for low call rate, low MAF, allele frequency
differences relative to the European–American and Toscani Italian HapMap samples (CEU and TSI). The two
datasets were then merged, resulting in a dataset of 896 cases and 2,455 controls, genotyped on 340,536 SNPs
common to both samples. To define the set of SNPs which were included in the analysis, we conducted a first pass
case/control analysis in PLINK 28 and examined the distribution of association test statistics, with a particular focus on
the [lambda] statistic (defined as the observed median [chi]2 divided by the expected median [chi]2). We observed a
relatively high [lambda] of 1.20. A strong correlation was also observed between significance values and call rate. This
relationship was more pronounced for SNPs where call rate differences were observed between cases and controls.
Based on these results, we undertook a further round of QC excluding SNPs with a call rate <99%, call rate difference
case-control >0.5%, MAF <1. This led to the exclusion of an additional 76,334 SNPs. We also increased the
stringency of call rate at the individual level to 98%, which excluded an additional six cases. We chose these
exclusion thresholds because SNPs in the excluded categories had a much higher rate of missingness than other
SNPs, which could lead to spurious evidence for association. The resulting [lambda] was 1.16 with only little evidence
for technical inflation of test statistics, as indicated by further metadata such as call rate and Hardy–Weinberg
equilibrium p value.
With the merged dataset, before QC, we estimated genome-wide identity by descent using PLINK, which derives this
information from the pairwise identity-by-state patterns within the data. Based on these results, we excluded an
additional 52 cases (seven avuncular/halfsibs, 35 siblings, 10 identical). To further examine population substructure
within our sample, we applied the multidimensional scaling algorithm (MDS) in PLINK to a linkage disequilibrium
pruned sample, after cleaning. This MDS algorithm is numerically equivalent to the principal component analysis
implemented in Eigenstrat. These units represent the contribution of many hundreds to thousands of SNPs, which
share covariance induced by technical artifacts or, more commonly, population stratification. The main plot in Figure 1
shows the first two multidimensional scaling dimensions (PCA1 and PCA2). As shown in Figure 1, the majority of
subjects were tightly clustered, indicating that most of the subjects were of European ancestry. The following
exclusion criteria were applied based on visual inspection of the MDS plots: MDS dimension 1 > 0.01; MDS dimension
2 > 0.01 and < -0.01; and MDS dimension 4 < -0.02.

FIGURE 1 Population substructure within the case (red dots) and control (black dots) as assessed by multidimensional scaling. Note: PCA1 _ first multidimensional scaling dimension.
Based on these thresholds, an additional 274 (198 controls, 76 cases) samples were excluded from the analysis.
Thus the final sample consisted of 3,357 individuals (896 cases, 2,455 controls), genotyped on 226,110 SNPs. The
[lambda] value arising from a PLINK case-control analysis was calculated as 1.08, suggesting that the methodological
and technical confounds have mostly been accounted for. These data were then imputed using BEAGLE 3.0,29–31
using the HapMap 3 phased CEU and TSI samples as a reference (410 haplotypes).32,33 The imputation procedure
was conducted jointly on cases and controls.
To restrict the analysis to well imputed SNPs, we applied a threshold of 0.6 to the quality score, resulting in an
analysis dataset of 1,033,244 SNPs. The quality score was defined as the ratio of the variance of the dosages, as
compared with the variance that is predicted from the allele frequency. This can be interpreted as the proportion of
information generated by imputing versus genotyping the variant.
Statistical Analyses
After the QC, we conducted association analysis using a generalized linear model (GLM) in R, using the 10 principal
components from the MDS procedure as covariates. This model removes most of the effects of population
stratification and any residual technical bias, which helps to control for false-positive results. The p value reported is
the Wald statistic from the GLM, which is asymptotically distributed as a chi-square with 1 degree of freedom under
the null hypothesis.

Results
Because genotyping artifacts and ethnic differences between populations can confound GWAS analyses, it is
essential to show the absence of artifacts. We do this with the quantile–quantile (QQ) plot in Figure 2, which plots, for
each SNP, the observed versus expected p value. In the presence of spurious associations, evidence for association
would be seen across all SNPs, i.e., the plotted line would be above the diagonal line throughout the range plotted.
We see some inflation above the diagonal, but this is small as measured by a lambda statistic ([lambda]) of 1.08,
which is not much greater than the value of 1.0 expected when there is no inflation. Thus, the QQ plot suggests that
our QC procedures removed most association signals that could be attributed to either technical artifacts or population
stratification. We further examined the distribution of test statistics and [lambda] by imputation status (genotyped vs.
imputed) and by minor allele frequency (using 10 equally spaced bins). There was no obvious correlation of inflation of
test statistics with either MAF or imputation status. Similarly there was no relationship between quality score and the
distribution of the test statistic.
FIGURE 2 Quartile– quartile plot of genome-wide association of attention-deficit/hyperactivity disorder.
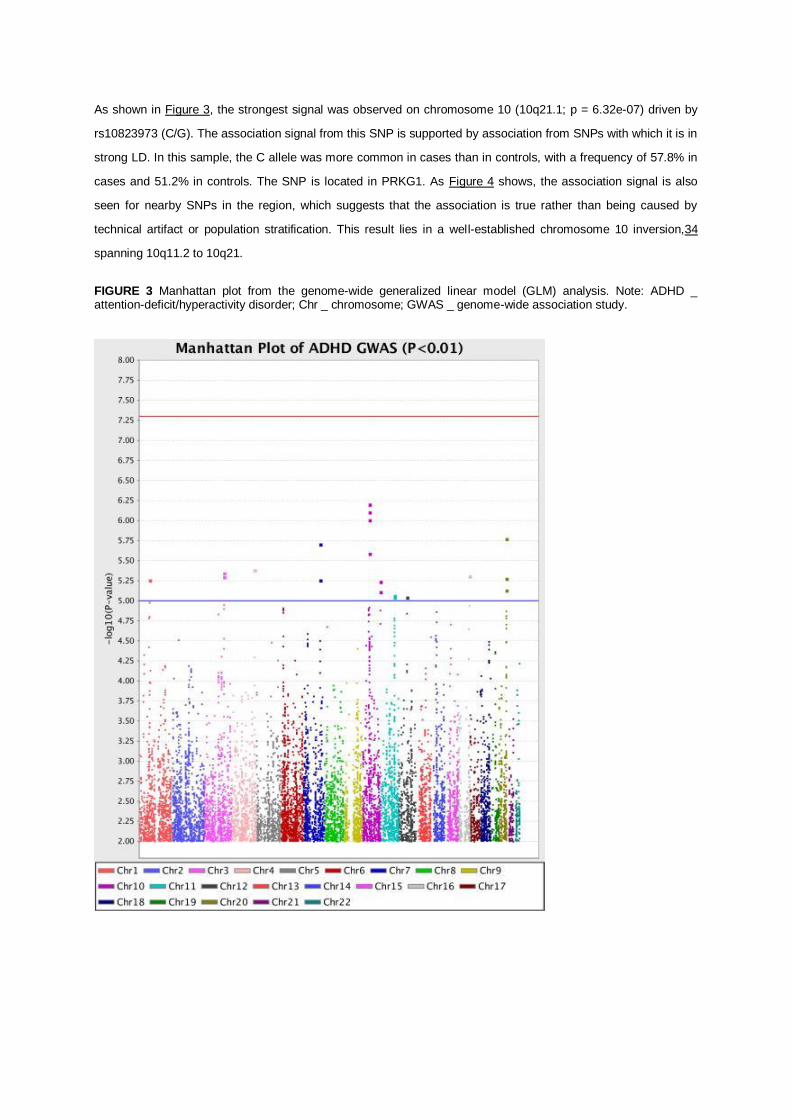
As shown in Figure 3, the strongest signal was observed on chromosome 10 (10q21.1; p = 6.32e-07) driven by
rs10823973 (C/G). The association signal from this SNP is supported by association from SNPs with which it is in
strong LD. In this sample, the C allele was more common in cases than in controls, with a frequency of 57.8% in
cases and 51.2% in controls. The SNP is located in PRKG1. As Figure 4 shows, the association signal is also
seen for nearby SNPs in the region, which suggests that the association is true rather than being caused by
technical artifact or population stratification. This result lies in a well-established chromosome 10 inversion,34
spanning 10q11.2 to 10q21.
FIGURE 3 Manhattan plot from the genome-wide generalized linear model (GLM) analysis. Note: ADHD _ attention-deficit/hyperactivity disorder; Chr _ chromosome; GWAS _ genome-wide association study.

FIGURE 4 Regional association and linkage disequilibrium (LD) plot for the 10q21.1 region. Note: The most associated genotyped single-nucleotide polymorphism (SNP) is shown in the diamond in bright red, and the color of the remaining markers reflects the linkage disequilibrium (r 2) with the top single-nucleotide polymorphism (SNP) in each panel (increasing red hue associated with increasing r 2). The recombination rate (right-hand y axis) is plotted in light blue and is based on the European–American (CEU) HapMap Phase III population.
The next strongest signals were located on chromosomes 20q13.33 (rs17729098, p= 1.68e-06) and 7q31.1
(rs2291567, p = 1.97e-06). The association signal on chromosome 20 is likely artifactual, as there are no other
SNPs in the region that show similar levels of association (Figure 5a), although this conclusion is limited by the
poor coverage of SNPs in the region. The chromosome 7 finding, on the other hand, does show a broad region of
association suggesting that this is not due to a technical artifact or population stratification (Figure 5b). We also
examined the results for SNPs in the 18 genes considered in a recent meta-analysis.16 However, none of these
SNPs were significant at a level of p <= .001.

FIGURE 5 (A) Regional association and linkage disequilibrium (LD) plot for 20q13.33 region. (B) Regional association and LD plot for 7q32.1 region.
Table 3 presents the top 100 hits based on p value significance in our imputed dataset. The table indicates the
gene name of the SNP fall within a gene. We and colleagues from three other GWAS Consortia have completed a
meta-analysis that includes the data presented in this paper.35 That meta-analysis comprised 2,064 trios, 896
cases, and 2,455 controls. In Table 3, we also give the p value for each SNP from the meta-analysis.

TABLE 3 Top 100 Single-Nucleotide Polymorphisms (SNPs) from Imputed International Multicenter ADHD Genetics Project (IMAGE) II dataset

Discussion
We have reported an independent genome-wide association scan of ADHD. None of the SNPs achieved
genome-wide significance (p < 5.0e-08), either in the sample reported here or in a meta-analysis or our results
with other samples.35 Given the extent to which ADHD is genetic, it is highly likely that within the set of SNPs
with p value <10-3
there are true associations for which we do not yet have sufficient power to unequivocally
detect.

Although no finding achieved genome-wide significance, several of our top findings deserve further comment.
The PRKG1 gene regulates neuronal migration, signal transduction, dendrite development, long-term
potentiation, and forebrain development.36–39 Thus, it is a reasonable candidate for a gene that might lead to
brain abnormalities and ADHD.
One of our top findings was in the CDH13 gene (p = 2.28E-05). CDH13 was implicated by a GWAS of 343
ADHD adults and 250 controls 22 and in the IMAGE GWAS of ADHD symptom counts.24,25 This gene lies
under a linkage peak implicated in a meta-analysis of ADHD linkage studies 15 and has been implicated in
substance use disorders,40 which co-occur with ADHD.41,42
Column 7 of Table 3 helps with the interpretation of our findings in the context of other ADHD GWAS. This
column gives the p value from a meta-analysis 35 that comprises the data in this paper and data from three
other consortia: IMAGE,23 PUWMa 43 and CHOP (unpublished data). As seen in Table 3, most SNPs show a
dramatically higher p value on the combined sample. No SNP increases in significance, and a few retain
significance levels <.0001. This does not create confidence in the idea that many of our top 100 SNPs are true
associations.
Our negative results indicating the existence of very small genetic effects when individual variants are
considered alone is not surprising. GWAS findings are now emerging for other psychiatric disorders. There have
been replicated copy number variation associations for schizophrenia 44,45 and for autism,46–48 a genome-
wide significant association for bipolar disorder,49 and a significant association from a schizophrenia–bipolar
dataset.50 These early GWAS results suggest that, because of the many statistical comparisons required to
scan the genome, large samples are needed to detect some genes, and extremely large samples are needed to
detect many genes.
For example, the successful bipolar disorder GWAS, which detected two loci at genome-wide levels of
significance, required 4,387 cases and 6,209 controls.49 Studies of this size and larger implicated several genes
for diabetes,51 but a pooled sample of 60,000 subjects was required to definitively implicate a large set of
genes.52 For type 2 diabetes and Crohn's disease, mapping of one or a small number of disease-associated
variants was successful in studies with sample sizes similar to that of the present study; however the vast
majority of findings have emerged with the incorporation of multiple scans involving sample sizes many times
larger than that presented here,52,53 and in most cases consisted of genetic loci conferring odds ratios in the
region of 1.1 to 1.4. The statistical requirement for large sample size for GWAS should not be interpreted as
meaning that the effects of individual genetic variants are very much smaller than the effects of individual
environmental variants; in fact, the latter are small as well.54
The general expectation from GWAS of complex disorders is for multiple genes of very small effect.55 Backward

power calculations on some of the initial true results from these diseases indicate that many of the identified
candidates were extremely unlikely to be detected from the initial study.55 Thus these initial studies were either
fortunate or many such effects (potentially 100 or more) with a similar effect size must exist. In this study we
have not been fortunate, insofar as we did not identify a variant above genome-wide significance, which we
define as 5 × 10-8.56,57 Concerning the existing candidate genes for ADHD, the genome-wide association data
do not provide genome-wide significant support for any of the previously postulated candidates. That is not to
say that these genes should be rejected from consideration, but rather that the effect sizes for each of these
variants must be small if they are real effects, which is consistent with the meta-analyses of candidate gene
studies.10,11,16
We have considered the pathophysiological and clinical implications of genetic effects so small that they cannot
be detected with our current sample size. Such small effects can arise for several potential reasons. First, it may
be correct that genetic risks for ADHD are due to numerous small additive effects of common risk variants;
however, it is also possible that multiple rare variants of small to moderately large effect size could account for
these findings.58 Alternative explanations include sample heterogeneity, the possible interaction of genetic
variants either within or between genes, and their interaction with environmental risk factors. Although the
heritability of ADHD is high, this does not give an indication of the underlying genetic architecture, although it
does imply that genetic influences are important for the etiology of the disorder. Recent modeling of complex
behavioral and biological traits in the mouse suggests that as heritability increases the number of genetic
variants involved increases, although effect sizes of individual variants remain small.59 For ADHD, our
expectation is that novel genes for ADHD will be identified from GWAS once sufficient whole-genome
association data have been accumulated from the analysis of 5,000 to 10,000 cases.
Given the expense of GWAS, it is reasonable to ask whether genes of very small effect are worth discovering.
Theoretical considerations suggest that the smallness of a gene effect should not be confused with the potential
importance of its discovery. For example, should we someday discover a rare variant or a common variant of
small effect that implicates a new biological pathway in ADHD, that pathway could then be searched for
biological targets that might yield treatments which are more efficacious than standard therapies for the disorder.
The discovery of such a variant would also focus research on the implicated gene and pathway, which could
lead the discovery of similar variants.
The need to search for DNA variants that lead to ADHD cannot be understood without placing the disorder in the
context of current knowledge. ADHD is a common disorder affecting up to 10% of children.1 In the majority of
cases, the disorder persists into adulthood 60 and is associated with serious impairments including traffic
accidents,60 increased health care use,60 substance abuse,60 unemployment,60 divorce,60 and risk behaviors
for acquired immunodeficiency syndrome (AIDS).61 Approximately 25% of ADHD patients do not respond well
to currently available therapies.62,63 Moreover, the currently preferred treatment for ADHD is stimulant
medication. Although medications for ADHD are effective in controlling symptoms for many patients, they do not

“cure” the disorder. Even those patients who are receiving treatment are at risk for adverse outcomes.64
Currently available treatments improve outcomes but leave patients with much residual disability and do not
markedly improve the executive dysfunction seen in many ADHD patients. These treatments also have adverse
effects, including delays in growth.65
The outcome of the present study may have been influenced by a number of limitations. Most notably is the
issue of power. We had 80% power for an odds ratio of 1.65, assuming a multiplicative model and a 10% minor
allele frequency. Thus we did not have sufficient power to detect smaller effects or the same effect at lower
allele frequencies. Much larger samples or meta-analyses of the current samples will provide a stronger strategy
for advancing knowledge regarding the molecular genetics of ADHD along with paradigms designed to search
for rare genetic variants. Another limitation of the current study was the differences in genotyping platforms used
to analyze case and control samples. This design limitation lead to the exclusion of numerous SNPs through
additional QC steps before imputation. Although it is possible that this might lead to artificial inflation of the test
statistics, it is unlikely that this had much influence on the outcome of the study, given the relatively low genomic
control value and the lack of significant results.
Imputation analysis, albeit extremely useful at generating estimates of association evidence at genetic loci that
have not been typed, is not perfect. The uncertainty inherent in these analyses reduces the effective sample
size, thus limiting power. Also, imputation, like genome-wide association, has limited capacity for the analysis of
rarer variation. These analyses used population-based controls that were not screened for ADHD. Although this
will have reduced power somewhat, given the prevalence of the disorder, we do not expect that this had much
impact on the results. Finally, ADHD very likely is genetically heterogeneous, such that many different genetic
architectures give rise to similar clinical presentations. This includes the possibility that rare variants account for
part of the disorder's heritability. Such genetic heterogeneity and complexity reduces power to detect significant
association.
In summary, although the current analyses have not identified any convincing results the sample is a useful
addition to the present literature and has made a valuable contribution to the current meta-analysis of ADHD
GWAS,35 which combines data from four ADHD GWAS.
We thank the patients and the family members who provided data and the research coworkers who helped
collect, manage and discuss data, especially Mick O'Donovan, Kate Langley, Michael Owen, Peter Holmans,
and Nigel Williams, all of Cardiff University.

REFERENCES
1. Faraone SV, Sergeant J, Gillberg C, Biederman J. The worldwide prevalence of ADHD: Is it an American condition? World Psychiatry. 2003;2:104-113.
2. Kessler RC, Adler L, Barkley R, et al. The prevalence and correlates of adult ADHD in the United States: Results from the national comorbidity survey replication. Am J Psychiatry. 2006;163:716-723.
3. Faraone SV, Biederman J. What is the prevalence of adult ADHD? Results of a population screen of 966 adults. J Attention Disord. 2005;9:384-391.
4. Faraone SV, Biederman J. Nature, nurture, and attention deficit hyperactivity disorder. Dev Rev. 2000;20:568-581.
5. Faraone SV, Biederman J, Spencer TJ, et al. Diagnosing adult attention deficit hyperactivity disorder: Are late onset and subthreshold diagnoses valid? Am J Psychiatry. 2006;163:1720-1729.
6. Sprich S, Biederman J, Crawford MH, Mundy E, Faraone SV. Adoptive and biological families of children and adolescents with ADHD. J Am Acad Child Adolesc Psychiatry. 2000;39:1432-1437.
7. Cantwell DP. Genetics of hyperactivity. J Child Psychol Psychiatry. 1975;16:261-264.
8. Morrison JR, Stewart MA. The psychiatric status of the legal families of adopted hyperactive children. Arch Gen Psychiatry. 1973;28:888- 891.
9. Freitag CM, Rohde LA, Lempp T, Romanos M. Phenotypic and measurement influences on heritability estimates in childhood ADHD. Eur Child Adolesc Psychiatry. 2010;19:311-323.
10. Faraone SV, Perlis RH, Doyle AE, et al. Molecular genetics of attention-deficit/hyperactivity disorder. Biol Psychiatry. 2005;57: 1313-1323.
11. Faraone SV, Mick E. Molecular genetics of attention deficit hyperactivity disorder. Psychiatr Clin North Am. 2010;33:159-180.
12. Asherson P, Zhou K, Anney RJ, et al. A high-density SNP linkage scan with 142 combined subtype ADHD sib pairs identifies linkage regions on chromosomes 9 and 16. Mol Psychiatry. 2008;13:514-521.
13. Zhou K, Asherson P, Sham P, et al. Linkage to chromosome 1p36 for attention-deficit/hyperactivity disorder traits in school and home settings. Biol Psychiatry. 2008;64:571-576.
14. Faraone SV, Doyle AE, Lasky-Su J, et al. Linkage analysis of attention deficit hyperactivity disorder. Am J Med Genet B Neuropsychiatr Genet. 2007;147B:1387-1391.
15. Zhou K, Dempfle A, Arcos-Burgos M, et al. Meta-analysis of genome-wide linkage scans of attention deficit hyperactivity disorder. Am J Med Genet B Neuropsychiatr Genet. 2008;147B:1392-1398.
16. Gizer IR, Ficks C, Waldman ID. Candidate gene studies of ADHD: A meta-analytic review. Hum Genet. 2009;126:51-90.
17. Kebir O, Tabbane K, Sengupta S, Joober R. Candidate genes and neuropsychological phenotypes in children with ADHD: Review of association studies. J Psychiatry Neurosci. 2009;34:88-101.
18. Brookes K, Xu X, Chen W, et al. The analysis of 51 genes in DSM-IV combined type attention deficit hyperactivity disorder: Association signals in DRD4, DAT1 and 16 other genes. Mol Psychiatry. 2006; 11:934-953.
19. Lasky-Su J, Banaschewski T, Buitelaar J, et al. Partial replication of a DRD4 association in ADHD individuals using a statistically derived quantitative trait for ADHD in a family-based association test. Biol Psychiatry. 2007;62:985-990.
20. Guan L, Wang B, Chen Y, et al. A high-density single-nucleotide polymorphism screen of 23 candidate genes in attention deficit hyperactivity disorder: Suggesting multiple susceptibility genes among Chinese Han population. Mol Psychiatry. 2009;14:546-554.
21. Kratochvil CJ, Vaughan BS, Barker A, Corr L, Wheeler A, Madaan V. Review of pediatric attention deficit/hyperactivity disorder for the general psychiatrist. Psychiatr Clin North Am. 2009;32:39-56.

22. Lesch KP, Timmesfeld N, Renner TJ, et al. Molecular genetics of adult ADHD: Converging evidence from genome-wide association and extended pedigree linkage studies. J Neural Transm. 2008;115: 1573-1585.
23. Neale BM, Lasky-Su J, Anney R, et al. Genome-wide association scan of attention deficit hyperactivity disorder. Am J Med Genet B Neuropsychiatr Genet. 2008;147B:1337-1344.
24. Lasky-Su J, Anney RJ, Neale BM, et al. Genome-wide association scan of the time to onset of attention deficit hyperactivity disorder. Am J Med Genet B Neuropsychiatr Genet. 2008;147B:1355-1358.
25. Lasky-Su J, Neale BM, Franke B, et al. Genome-wide association scan of quantitative traits for attention deficit hyperactivity disorder identifies novel associations and confirms candidate gene associations. Am J Med Genet B Neuropsychiatr Genet. 2008;147B:1345- 1354.
26. Shi J, Levinson DF, Duan J, et al. Common variants on chromosome 6p22.1 are associated with schizophrenia. Nature. 2009;460:753-757.
27. Korn JM, Kuruvilla FG, McCarroll SA, et al. Integrated genotype calling and association analysis of SNPs, common copy number polymorphisms and rare CNVs. Nat Genet. 2008;40:1253-1260.
28. Purcell S, Neale B, Todd-Brown K, et al. PLINK: A tool set for whole-genome association and population-based linkage analyses. Am J Hum Genet. 2007;81:559-575.
29. Browning BL, Browning SR. A unified approach to genotype imputation and haplotype-phase inference for large data sets of trios and unrelated individuals. Am J Hum Genet. 2009;84:210-223.
30. Browning BL, Browning SR. Haplotypic analysis of Wellcome Trust Case Control Consortium data. Hum Genet. 2008;123:273-280.
31. Browning SR, Browning BL. Rapid and accurate haplotype phasing and missing-data inference for whole-genome association studies by use of localized haplotype clustering. Am J Hum Genet. 2007;81: 1084-1097.
32. Thorisson GA, Smith AV, Krishnan L, Stein LD. The International HapMap Project Web site. Genome Res. 2005;15:1592-1593.
33. Gibbs RA, Belmont J, Hardenbol P, et al. The International HapMap Project. Nature. 2003;426:789-796.
34. Pierotti MA, Santoro M, Jenkins RB, et al. Characterization of an inversion on the long arm of chromosome 10 juxtaposing D10S170 and RET and creating the oncogenic sequence RET/PTC. Proc Natl Acad Sci U S A. 1992;89:1616-1620.
35. Neale BM, Medland SE, Ripke S, et al. Meta-analysis of genomewide association studies of attention-deficit/hyperactivity disorder. J Am Acad Child Adolesc Psychiatry. 2010;49:884-897.
36. Demyanenko GP, Halberstadt AI, Pryzwansky KB, Werner C, Hofmann F, Maness PF. Abnormal neocortical development in mice lacking cGMP-dependent protein kinase I. Brain Res Dev Brain Res. 2005;160:1-8.
37. Calabresi P, Gubellini P, Centonze D, et al. Dopamine and cAMPregulated phosphoprotein 32 kDa controls both striatal long-term depression and long-term potentiation, opposing forms of synaptic plasticity. J Neurosci. 2000;20:8443-8451.
38. Kleppisch T, Wolfsgruber W, Feil S, et al. Hippocampal cGMPdependent protein kinase I supports an age- and protein synthesisdependent component of long-term potentiation but is not essential for spatial reference and contextual memory. J Neurosci. 2003;23:6005-6012.
39. Werner CG, Godfrey V, Arnold RR, et al. Neutrophil dysfunction in guanosine 3’,5’-cyclic monophosphate-dependent protein kinase Ideficient mice. J Immunol. 2005;175:1919-1929.
40. Uhl GR, Drgon T, Liu QR, et al. Genome-wide association for methamphetamine dependence: Convergent results from 2 samples. Arch Gen Psychiatry. 2008;65:345-355.
41. Faraone SV, Adamson JJ, Wilens TE, Monuteaux MC, Biederman J. Familial transmission of derived phenotypes for molecular genetic studies of substance use disorders. Drug Alcohol Depend. 2008;92: 100-107.
42. Faraone SV, Adamson JJ, Wilens T, Monuteaux MC, Biederman J. Deriving phenotypes for molecular genetic studies of substance use disorders: A family approach. Drug Alcohol Depend. 2007;88:244- 250.
43. Mick E, Todorov A, Smalley S, et al. Family-based genome-wide association scan of attention-deficit/hyperactivity disorder. J Am Acad Child Adolesc Psychiatry. 2010;49:898-905.

44. Stefansson H, Rujescu D, Cichon S, et al. Large recurrent microdeletions associated with schizophrenia. Nature. 2008;455:232-236.
45. Stone JL, O’Donovan MC, Gurling H, et al. Rare chromosomal deletions and duplications increase risk of schizophrenia. Nature. 2008;455:237- 241.
46. Kumar RA, KaraMohamed S, Sudi J, et al. Recurrent 16p11.2 microdeletions in autism. Hum Mol Genet. 2008;17:628-638.
47. Marshall CR, Noor A, Vincent JB, et al. Structural variation of chromosomes in autism spectrum disorder. Am J Hum Genet. 2008;82:477-488.
48. Weiss LA, Shen Y, Korn JM, et al. Association between microdeletion and microduplication at 16p11.2 and autism. N Engl J Med. 2008; 358:667-675.
49. Ferreira MA, O’Donovan MC, Meng YA, et al. Collaborative genome- wide association analysis supports a role for ANK3 and CACNA1C in bipolar disorder. Nat Genet. 2008;40:1056-1058.
50. O’Donovan MC, Craddock N, Norton N, et al. Identification of loci associated with schizophrenia by genome-wide association and follow-up. Nat Genet. 2008;40:1053-1055.
51. Frayling TM. Genome-wide association studies provide new insights into type 2 diabetes aetiology. Nat Rev Genet. 2007;8:657-662.
52. Zeggini E, Scott LJ, Saxena R, et al. Meta-analysis of genome-wide association data and large-scale replication identifies additional susceptibility loci for type 2 diabetes. Nat Genet. May 2008;40:638- 645.
53. Rioux JD, Xavier RJ, Taylor KD, et al. Genome-wide association study identifies new susceptibility loci for Crohn disease and implicates autophagy in disease pathogenesis. Nat Genet. 2007;39:596-604.
54. Banerjee TD, Middleton F, Faraone SV. Environmental risk factors for attention-deficit hyperactivity disorder. Acta Pediatrica. 2007;96: 1269-1274.
55. Altshuler D, Daly M. Guilt beyond a reasonable doubt. Nat Genet. 2007;39:813-815.
56. Dudbridge F, Gusnanto A. Estimation of significance thresholds for genomewide association scans. Genet Epidemiol. 2008;32:227-234.
57. Pe’er I, Yelensky R, Altshuler D, Daly MJ. Estimation of the multiple testing burden for genomewide association studies of nearly all common variants. Genet Epidemiol. 2008;32:381-385.
58. Dickson SP, Wang K, Krantz I, Hakonarson H, Goldstein DB. Rare variants create synthetic genome-wide associations. PLoS Biol. 2010; 8:e1000294.
59. Flint J, Munafo MR. The endophenotype concept in psychiatric genetics. Psychol Med. 2007;37:163-180.
60. Biederman J, Faraone SV. Attention deficit hyperactivity disorder. Lancet. 2005;366:237-248.
61. Barkley RA, Murphy KR, Fischer M. ADHD in Adults: What the Science Says. New York, NY: Guilford Press; 2008.
62. Biederman J, Mick E, Prince J, et al. Systematic chart review of the pharmacologic treatment of comorbid attention deficit hyperactivity disorder in youth with bipolar disorder. J Child Adolesc Psychopharmacol. 1999;9:247-256.
63. Biederman J. Treatment of ADHD with an emphasis on stimulant medication. Paper presented at: The Evaluation and Treatment of ADHD in Pediatrics; October 28, 1997, Boston, MA.
64. Biederman J, Faraone SV, Milberger S, et al. Predictors of persistence and remission of ADHD: Results from a four-year prospective follow-up study of ADHD children. J Ame Acad Child Adolesc Psychiatry. 1996;35:343-351.
65. Faraone SV, Biederman J, Morley CP, Spencer TJ. Effect of stimulants on height and weight: A review of the literature. J Am Acad Child Adolesc Psychiatry. 2008;47:994-1009.