case control and cohort studies dr. hardeep kaur associate professor university college of nursing...
TRANSCRIPT

Case Control and Cohort studies
Dr. Hardeep KaurAssociate Professor
University College of Nursing
Faridkot

Over view
- One of the most significant triumphs of the case-control study was the demonstration of the link between tobacco smoking and lung cancer, by Sir Richard Doll
- Doll was able to show a statistically significant association between the two in a large case control study.
- Opponents argued (correctly) for many years that this type of study cannot prove causation,

contd.
But the eventual results of cohort studies confirmed the causal link which the case-control studies suggested, and it is now accepted that tobacco smoking is the cause of about 87% of all lung cancer mortality in the US.
- Till now case control studies have been used effectively for studies of many cancers, and other serious conditions such as cirrhosis of liver, lupus erythematous and congestive heart failure.

Introduction
• For medical interventions,
the 'gold standard' is the double blind randomized controlled trial, a specific type of experiment. While such trials may be ideal for testing the efficacy of (what are hoped to be) beneficial interventions, such as surgeries or drug treatments,
• There are many instances in which trials would be impossible, impractical, and/or unethical

Introduction
Studying infrequent events such as death from cancer using randomized clinical trials or other controlled prospective studies requires that large populations be tracked for lengthy periods to observe disease development
So ideal way for studying such events is
case control studies.

Study design in epidemiology

DISTINCT FEATURES OF CASE CONTROL STUDIES
The case control study has three distinct features:
Both exposure & outcome ( disease) have occurred before the start of the study
Study proceeds backwards from effect to cause and
It uses a control or comparison group to support or refute an inference


1) a population-based case-control studyBoth cases and controls are recruited from the
population.
2) a case-control study nested in a cohortBoth case and controls are members of the cohort.
3) a hospital-based case-control studyBoth case and controls are patients who are
hospitalized or outpatients.Controls with diseases associated with the exposure
of interest should be avoided.
Various types of case-control studies
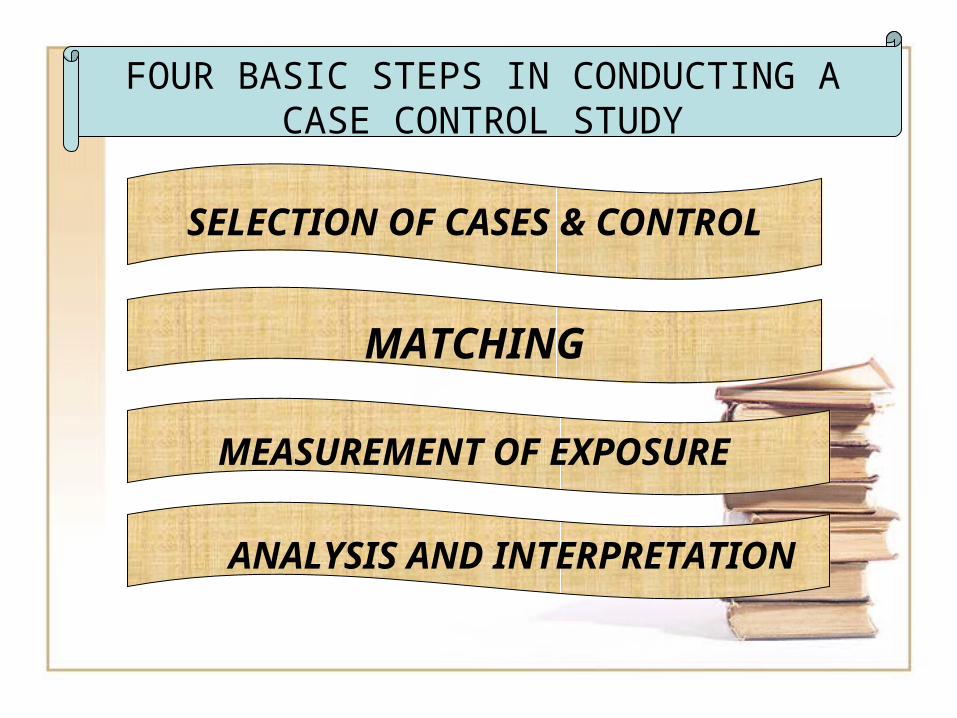
FOUR BASIC STEPS IN CONDUCTING A CASE CONTROL STUDY
SELECTION OF CASES & CONTROL
MATCHING
MEASUREMENT OF EXPOSURE
ANALYSIS AND INTERPRETATION

SELECTION OF CASES AND CONTROLS
SELECTION OF CASESDefinition of a Case• Diagnostic criteria• Eligibility criteria Sources Of Cases• Hospitals• General population
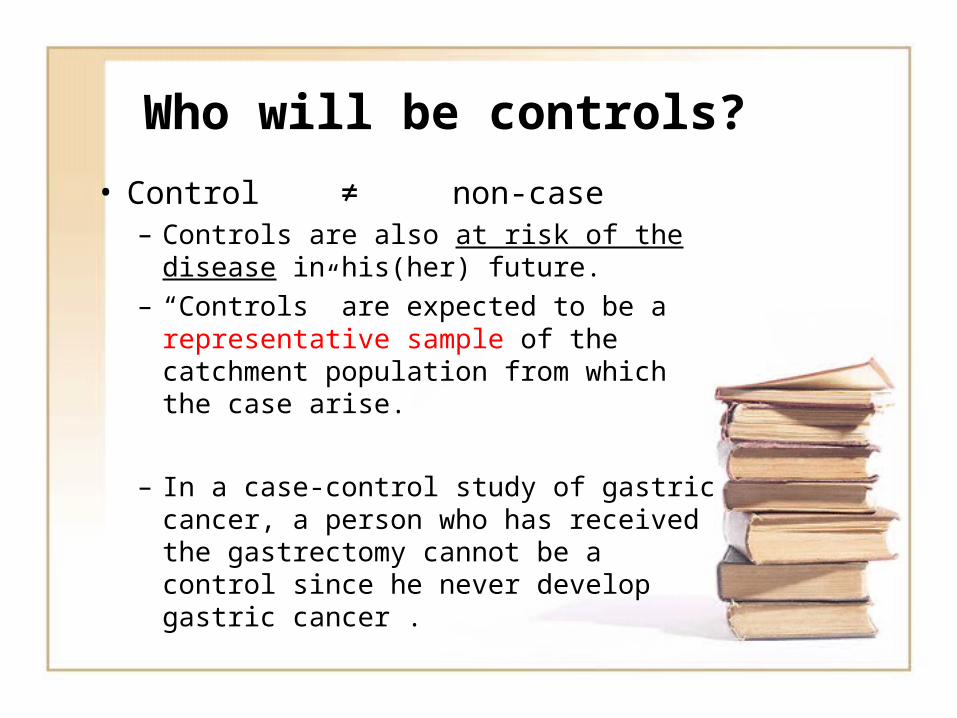
Who will be controls?
• Control ≠ non-case– Controls are also at risk of the disease
in his(her) future.– “Controls” are expected to be a
representative sample of the catchment population from which the case arise.
– In a case-control study of gastric cancer, a person who has received the gastrectomy cannot be a control since he never develop gastric cancer .

MATCHING Matching is defined as a process
by which we select controls in such a way that they are similar to cases with regard to certain pertinent selected variables( e.g. age) which are known to influence the outcome of a disease and which, if not adequately matched for comparability , could distort or confound the results.
MATCHING CONTD……
• While matching it should be kept in mind that suspected etiological factors or the variable we wish to measure should not be matched.
• Matching procedures- Group matching- Pairing( Matched pairs)

MEASUREMENT OF EXPOSURE• Definition & criteria about exposure are just as
important as those used to define cases & controls.• Information about exposure should be obtained
by in precisely the same manner both for cases & controls
• The information can be obtained by- Interviews- Questionnaire- Studying past records
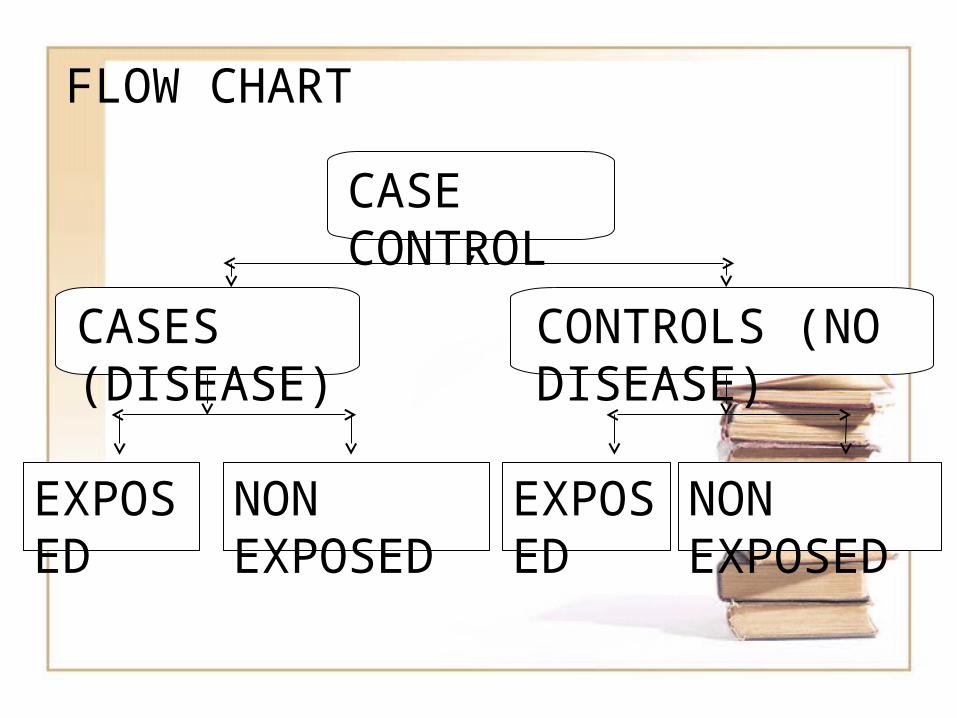
FLOW CHART
CASE CONTROL
CASES (DISEASE)
CONTROLS (NO DISEASE)
EXPOSED
NON EXPOSED
EXPOSED
NON EXPOSED
ANALYSISThe final step is analysis to find out
- Exposure rates among cases & controls to suspected factor
- Estimation of disease risk associated with exposure ( odd ratio)

APPROXIMATING THE RATE RATIO
DISEASE NO DISEASE TOTAL
EXPOSURE a b M1
NON EXPOSURE
c d M2
N1 N2 T
N1- with diseaseN2 – without disease
Two groups of subjects you use to start project in case control studies

Exposure RateDevelop CHD
Do not develop CHD
Totals Incidence of disease
Smoke cigarettes
84 2916 3000 84/3000
Do not smoke cigarettes
87 4913 5000 87/5000
Cases = a/a+c = 84/84+87 = 49.1 %
Controls = b/b+d = 2916/ 2916+4913 = 37.2%
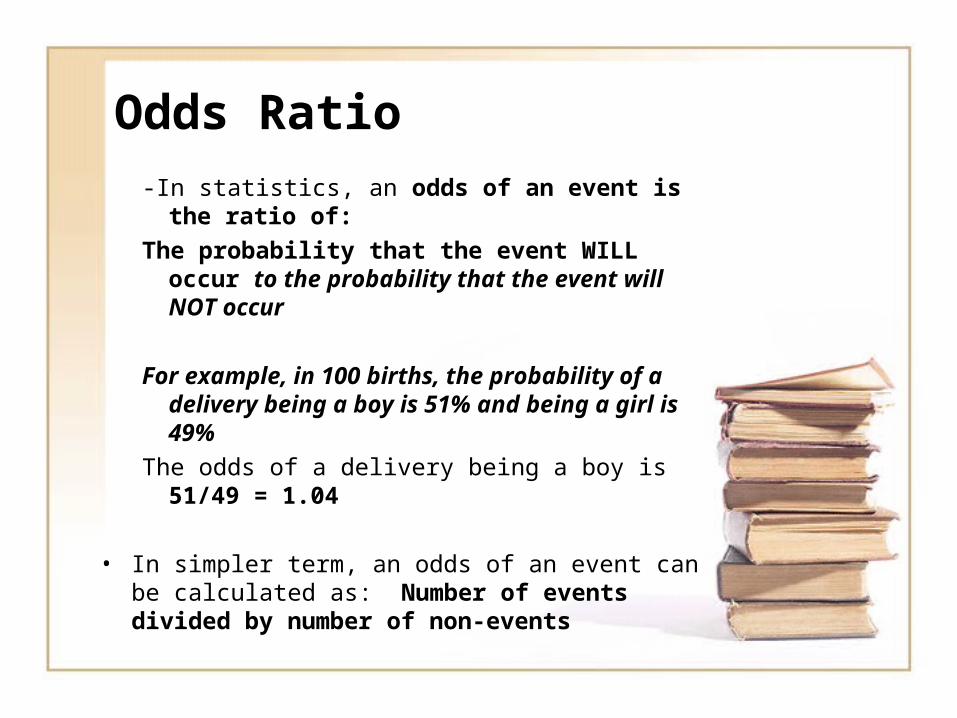
Odds Ratio
-In statistics, an odds of an event is the ratio of:
The probability that the event WILL occur to the probability that the event will NOT occur
For example, in 100 births, the probability of a delivery being a boy is 51% and being a girl is 49%
The odds of a delivery being a boy is 51/49 = 1.04
• In simpler term, an odds of an event can be calculated as: Number of events divided by number of non-events

APPROXIMATING THE RATE RATIO
DISEASE NO DISEASE TOTAL
EXPOSURE a b M1
NON EXPOSURE
c d M2
N1 N2 T
N1- with diseaseN2 – without disease
Two groups of subjects you use to start project in case control studies

DISEASE ODD RATIO (OR)
OR = Odds of disease in exposed group
Odds of disease in non exposed
OR = a/b+c/d=a*d/b*c

Odds Ratio
• Relative Risk = 50/75 ______ = 2 50/25 • Odds Ratio = 50 x 75 ______ = 3 50 x 25
Develop Disease
Do no develop disease
Exposed 50 50 100
Non-Exposed
25 75 100

Interpreting Odds Ratio of a Disease
• If OR = 1Exposure is not related to disease
• No association; independent
• If OR > 1Exposure is positively related to disease
• Positive association; ? causal
• If OR < 1Exposure is negatively related to disease
• Negative association; ? protective

Bias should be minimized
• Bias & Confounding– Selection bias– Detection bias– Information bias (recall bias)– Confounding
Confounding can be controlled by statistical analyses but we can do nothing about bias after data collection.

PROS & CONS OF CASE CONTROL STUDIES- Relatively easy to carry out- Rapid and inexpensive ( as
compared with cohort)- Require comparatively few
subjects- No risk to subjects- No attrition problem is present- Minimal ethical problems
On the other hand………
• Problem of bias relies on memory or past records, the accuracy of which may be uncertain
• selection of appropriate control group may be difficult or sometimes impossible
• These studies donot distinguish between cause & associated factors

COHORT STUDIES

MEANING OF A COHORT
• Ancient Roman military unit, A band of warriors.
• Persons banded together.
• Group of persons with a common statistical characteristic. [Latin]
E.g. age, birth date

INTRODUCTION
Cohort is another type of analytical (observational) study which is usually undertaken to obtain additional evidence to refute or support the existence of an association between suspected cause & disease.
- These studies are also called as longitudinal studies, incidence studies.

• A major limitation of cross-sectional surveys and case-control studies is difficulty in determining if exposure or risk factor preceded the disease or outcome.
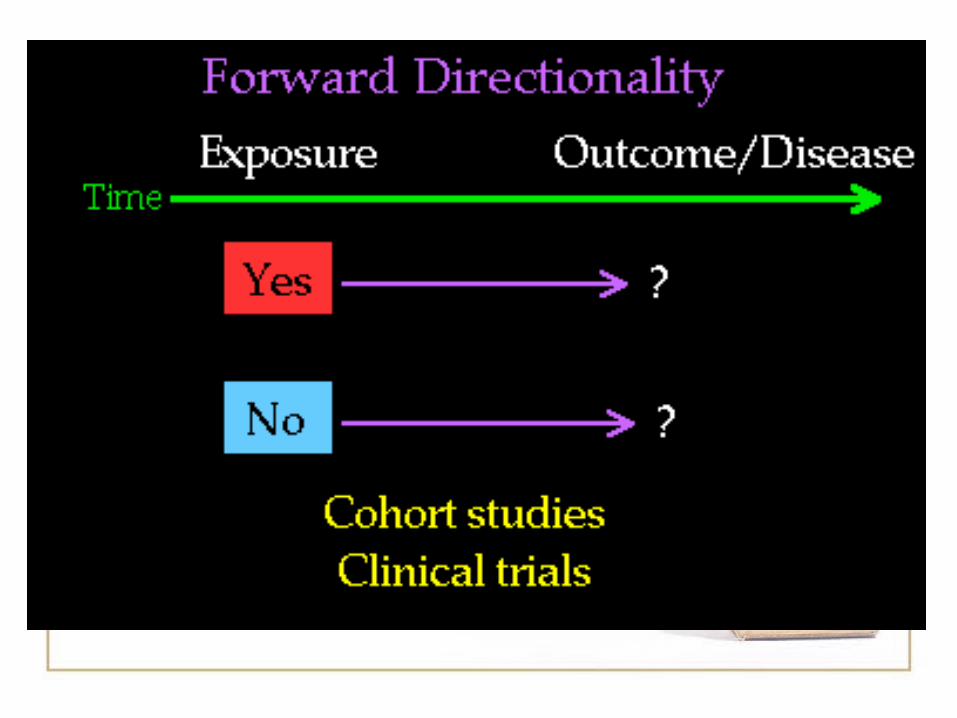
• In Cohort study the Key Point is:
INTRODUCTION CONTD……..
Presence or absence of risk factor is determined before outcome occurs.
INDICATION OF A COHORT STUDY
• When there is good evidence of exposure and disease.
• When exposure is rare but incidence of disease is higher among exposed
• When follow-up is easy, cohort is stable
• When ample funds are available
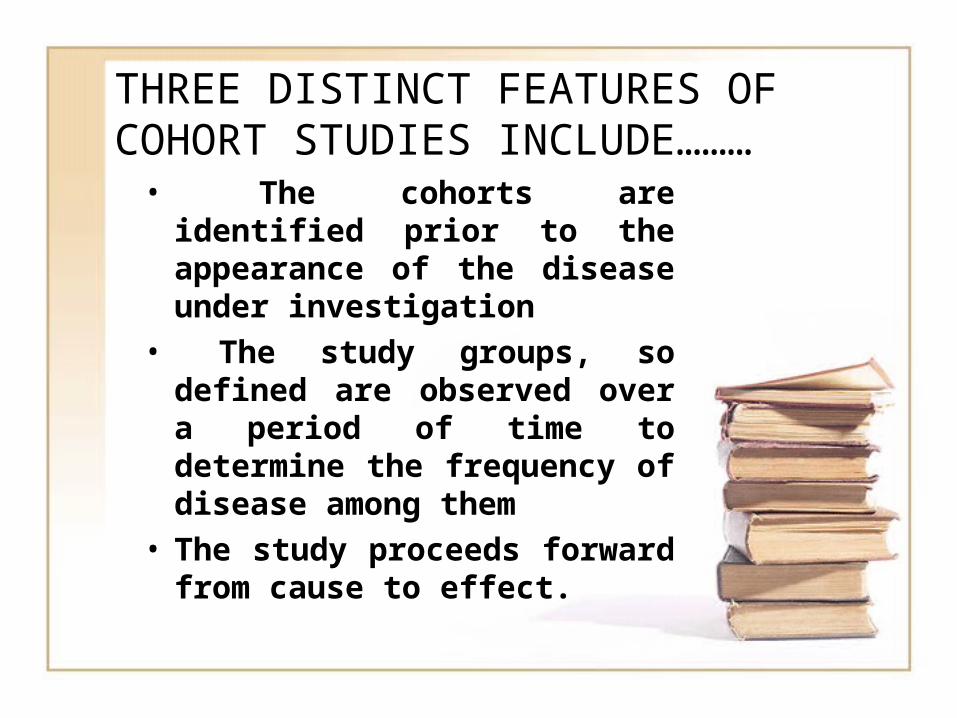
THREE DISTINCT FEATURES OF COHORT STUDIES INCLUDE………
• The cohorts are identified prior to the appearance of the disease under investigation
• The study groups, so defined are observed over a period of time to determine the frequency of disease among them
• The study proceeds forward from cause to effect.

b+d
Frame work of Cohort studiesFrame work of Cohort studies
cc+d
aa+b
Total Yes
Disease Status
Yes
No
Exposure Status
b
d
a+c N
No
Study cohort
Comparison cohort

General consideration while selection General consideration while selection of cohortsof cohorts
Both the cohorts are free of the disease.Both the cohorts are free of the disease.Both the groups should equally susceptible Both the groups should equally susceptible
to disease to disease Both the groups should be comparable Both the groups should be comparable Diagnostic and eligibility criteria for the Diagnostic and eligibility criteria for the
disease should be defined well in advance.disease should be defined well in advance.

Types of Cohort Study
Prospective cohort study
Retrospective (historical)
cohort study
Combination of Retrospective
and Prospective cohort study.

Elements of cohort study

Selection of study subjects• General population
- Whole population in an area
- A representative sample
• Special group of population– Select group
- occupation group / professional group (Dolls study )
– Exposure groups
- Person having exposure to some physical, chemical or biological agent (e.g. X-ray exposure to radiologists)

Obtaining data on exposure• Personal interviews / mailed questionnaire• Reviews of records • Medical examination or special test• Environmental survey By obtaining the
data of exposure we can classify cohorts as Exposed and non exposed and By degree exposure we can sub classify cohorts

Selection of comparison group
• Internal comparison- Only one cohort involved in study
• External comparison- More than one cohort in the study for the
purpose of comparison
• Comparison with general population rates– If no comparison group is available we can compare the rates of study cohort with general population.
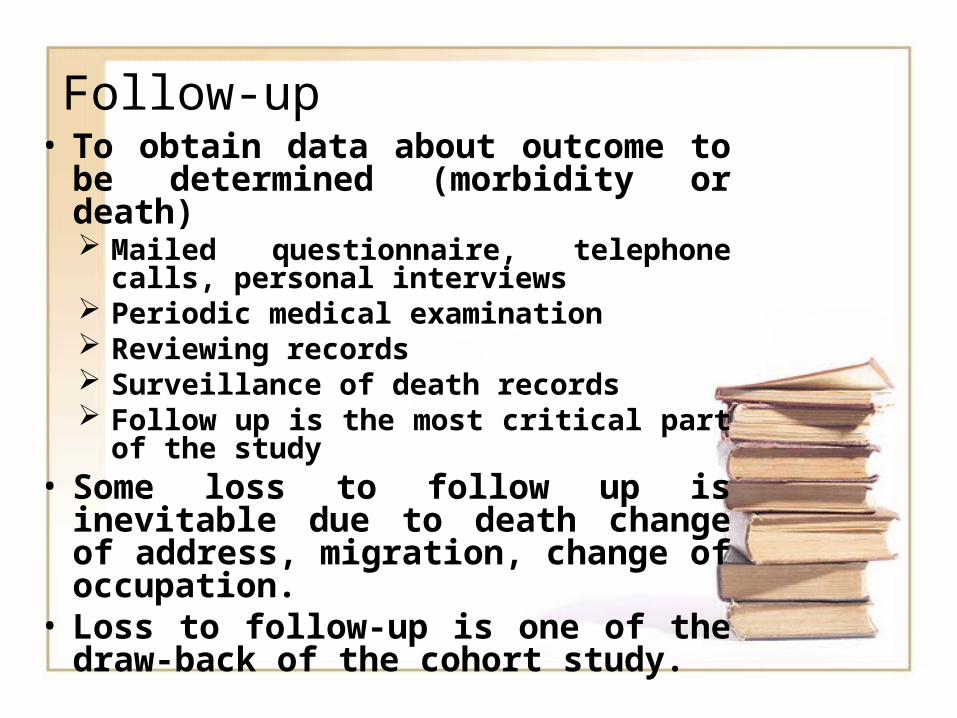
Follow-up • To obtain data about outcome to be
determined (morbidity or death)Mailed questionnaire, telephone calls,
personal interviewsPeriodic medical examinationReviewing recordsSurveillance of death recordsFollow up is the most critical part of the
study• Some loss to follow up is inevitable due
to death change of address, migration, change of occupation.
• Loss to follow-up is one of the draw-back of the cohort study.

ANALYSIS
• Calculation of incidence rates among exposed and non exposed groups
• Estimation of risk

Incidence rates of outcome
N
dc
ba
Yes No
Disease Status
Yes
No
Exposure Status
a+b
c+d
b+d a+c
Total
Study cohort
Comparison cohort
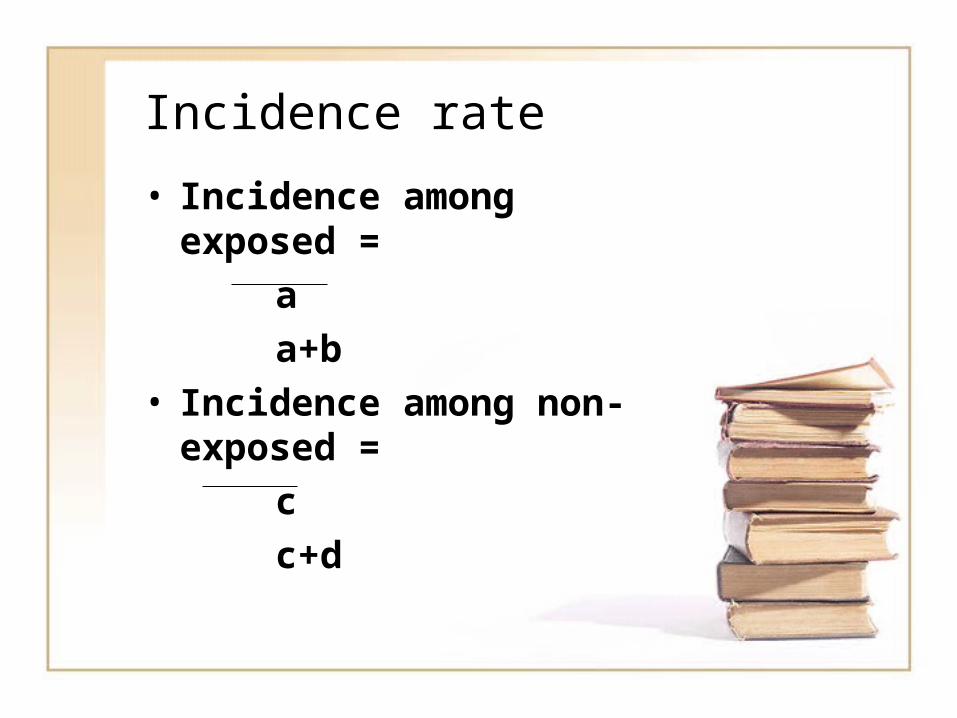
Incidence rate
• Incidence among exposed =
a
a+b• Incidence among non-exposed
=
c
c+d
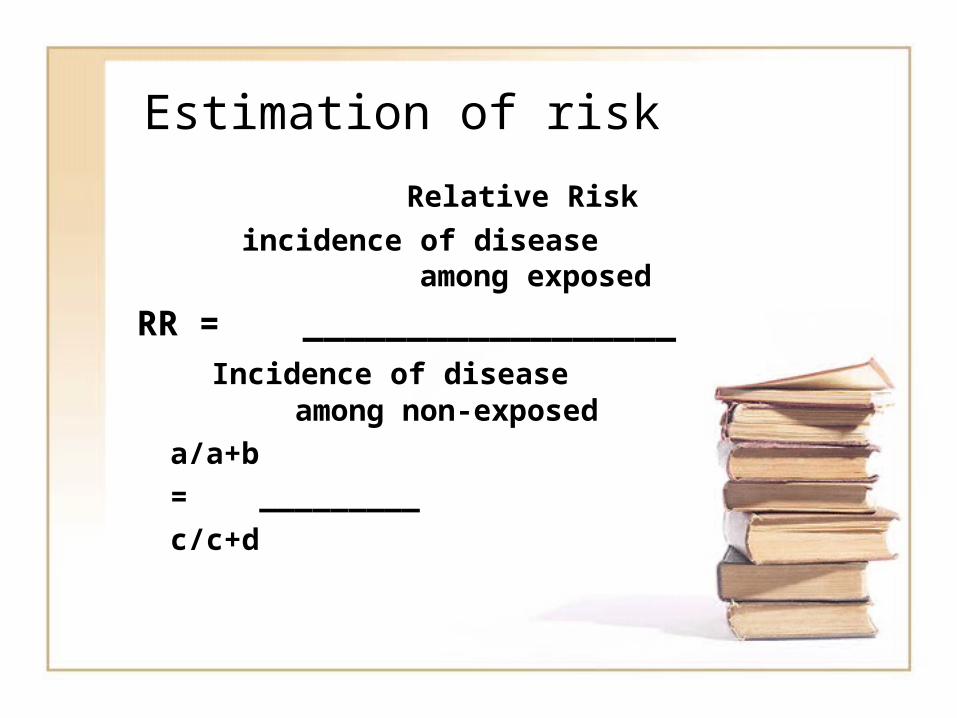
Estimation of risk
Relative Risk
incidence of disease among exposed
RR = __________________ Incidence of disease among non-
exposeda/a+b
= _________c/c+d

Estimation of Risk Contd…….
• Attributable RiskIncidence of disease among exposed – incidence of disease among non exposed
AR = __________________________ Incidence of disease among exposed
a/a+b – c/c+dAR = _______________
a/a+b

Comparison of the study design
Case-control Cohort
Rare diseases suitable not suitableNumber of disease 1 1<Sample size relatively small need to be largeControl selection difficult easierStudy period relatively short longRecall bias yes noRisk difference no available available
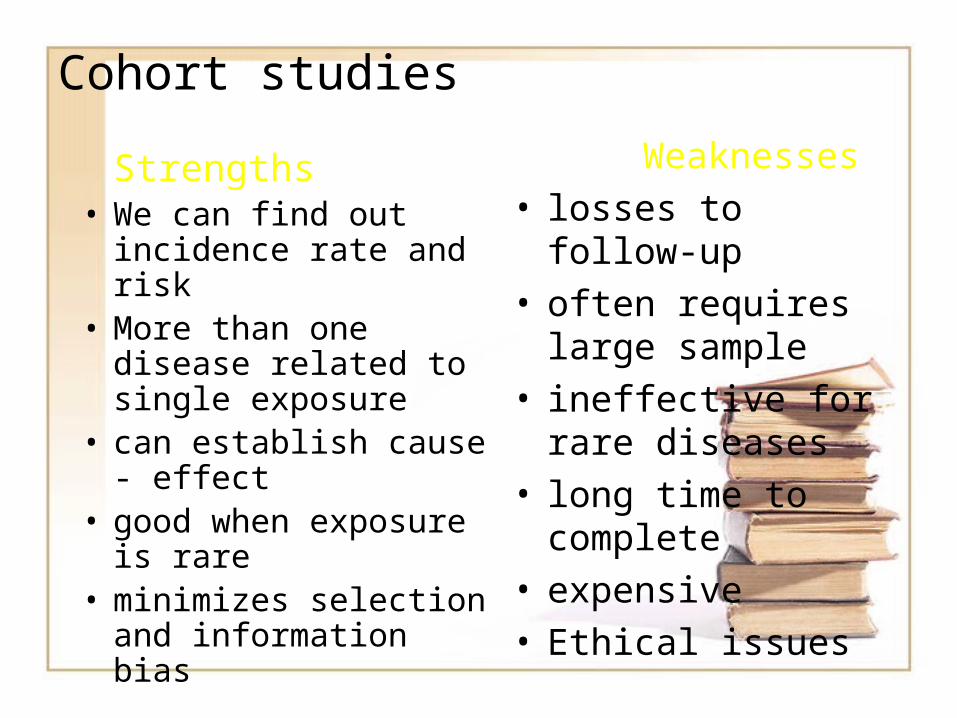
Cohort studies Strengths• We can find out
incidence rate and risk• More than one disease
related to single exposure
• can establish cause - effect
• good when exposure is rare
• minimizes selection and information bias
Weaknesses• losses to follow-up• often requires large
sample• ineffective for rare
diseases• long time to complete• expensive• Ethical issues

THANK YOU
THANKS