cartel damages to the economy: an assessment for ...cepr.org/sites/default/files/ivaldi -cartel...
TRANSCRIPT

Cartel Damages to the Economy:
An Assessment for Developing Countries
Marc IVALDI
Toulouse School of Economics and CEPR
Frédéric JENNY
ESSEC Business School, Paris
Aleksandra KHIMICH
Toulouse School of Economics
Abstract
To date, whether competition law enforcement is indeed beneficial for the economy still remains a
questionable topic. In the majority of jurisdiction collusive practices that aim at fixing either prices or market
shares are considered as damaging per se as firms get an opportunity to block the entry of new rivals or to
overcharge for their products or services without adapting the quality. Nevertheless, developing countries still
struggle to find the supportive evidence that would help them to create or reinforce their antitrust divisions -
research on the topic appears not to be not only limited, but also mainly of a qualitative nature. The principal
goal of the preset study is to provide the missing evidence by assessing the potential economic harm caused by
cartels in developing countries. For this purpose we have created a dataset that contains information on more
than 200 major ‘hard-core’ cartels prosecuted in more than 20 developing countries from 1995 to 2013. We
have also developed an original and relatively simple methodology that we employed to estimate the cartel’s
economic harm - in terms of price overcharges and consumers’ welfare losses - when sufficient data were
available. Obtained results confirm that cartels` economic impact can indeed be substantial. For example, in
terms of affected sales related to GDP the maximal rate reaches up to 6.38%. The actual harm in terms of
cartels’ excess profits resulting from price overcharges can also significant - with the maximal rate reaching
almost 1% when those profits are related to GDP. Furthermore, as we estimate the maximal annual probability of
uncovering an existing cartel to be around 24%, we suggest that the actual damage could appear at least 4 times
bigger.
Key words: hard core cartel, developing countries, damages, antitrust, cartel deterrence,
overcharge
JEL classifications: L12, L42, K22, B14, F29
This research project is funded by the CEPR PEDL program. It is as well recognized by the
UNCTAD RPP initiative. Any opinions expressed here are those of the author(s) and not
those of the CEPR or the UNCTAD.

___________________________________________________________________________________________
- 2 -
1. Introduction
Detecting and castigating cartels come first on the agenda of anti-trust authorities in
developed countries because of their potential harm to consumers' welfare and the economy
as a whole. Collusive practices are considered as damaging per se as firms overcharge their
customers for their products or services or block the entry of new rivals. From a sample of
international cartels in primary product markets covering the last twenty years, Connor
(2011a) shows that cartels’ prices have been at least twenty-five percent higher than their
competitive benchmark.
As implementation of the antitrust enforcement requires substantial investments, it can
be questioned to which extent those expenditures are compensated in terms of prevented
consumers’ damages. Especially this is relevant for developing competition authorities that
often experience tough budget constraints. Nevertheless, they often struggle to find the
supportive evidence that could advocate their efforts. The research on these questions in
developing countries is scarce and has mainly followed a qualitative approach. Among the
few relevant studies, e.g. those of Jenny (2006), Connor (2011a) and Levenstein, Suslow and
Oswald (2003), only the latter offers a relatively comprehensive quantitative assessment of
the aggregate economic impact of cartels’ agreements. Based on the international trade flows
data and a list of forty-two detected international cartels prosecuted in the U.S. and the EU in
1990s and operating on developing markets, authors estimated that imports affected by cartel
agreements constitute 3.4-8.4% of total imports. When those affected imports are compared
to the corresponding GDP, the percentage raises up to 0.6-1.7%. Due to hidden and
sometimes tacit nature of cartels and various methodological problems that did not allow
authors to take all the observations into account, it is suggested that the actual impact could be
much more significant.
Taking into account both international and local cartels and having measured the
aggregated cartel excess profits resulting from price overcharges could provide a clearer
picture of the actual damage suffered by consumers in developing countries. These
estimations can in turn be employed to advocate the introduction or reinforcement of the
antitrust control in the concerned economies. Present study aims at providing the required
evidence.
The paper will stick to the following outline. Section 2 comprises a description of the
data mining process and a discussion over the descriptive statistics of the collected sample of
___________________________________________________________________________________________
- 3 -
cartels. We also present our original methodology that was developed to recover the missing
price overcharges. While being quite simple and intuitive, its’ main advantage is that it
requires a very limited data to be implemented. In Appendix C we illustrate the application of
this methodology on one of the cases from our database. Overall, collected data do not bring
any strong evidence to the widespread idea that cartel overcharges in developing countries are
more significant than those in developed countries. We show, however, that the
anticompetitive impact in terms of price overcharges is at least of a similar scale, which calls
for adequate antitrust measures. We believe that stronger results are achieved by looking at
the aggregate measures of cartelization harm that we present in Section 3. We focus on
several aggregate indicators. To estimate the cartels’ impact on the country level, as in
Levenstein, Suslow and Oswald (2003) we find it appropriate to consider aggregated sales
affected by collusive practices and, more innovatively, aggregated cartels’ excess profits that
result from price overcharges. Both measures related to GDP. We find that in terms of
affected sales related to the GDP the maximal rate reaches up to 6.38%. The actual harm to
consumers in terms of cartels’ excess profits can be also significant, with the maximal rate
reaching almost 1% of the GDP. We supplement the discussion with a simplified cost-benefit-
like analysis of the antitrust enforcement by relating aggregated cartels’ excess profits to the
budget of the corresponding competition authority. Our results demonstrate that in majority of
considered countries price overcharges significantly exceed budget expenses aimed at
preventing them. Overall, obtained estimates reflect the very minimal bound for the economic
harm caused by collusive behaviour because data on detected cartels in developing countries
are very limited, but mostly because some of them remain uncovered. To assess how far (or
how close) our aggregated estimates are from the reality, in Section 4 we adopt the
methodology proposed in Combe et al (2008) to estimate the deterrence rate, i.e., the annual
probability of a cartel to be uncovered. We find that at least three out of four existing cartels
remain undetected. To our knowledge this is the first attempt to apply this methodology on a
sample of cartels detected in developing countries. Section 5 concludes the paper.
Competition authorities in developing countries could have a practical interest in the
respective results for the advocacy of their efforts. Furthermore, they may wish to take
advantage of the proposed methodology for their own cartel investigations as it will reduce
the data required to estimate the damages caused by cartelization, in terms of, for instance,
price overcharges and output losses.

___________________________________________________________________________________________
- 4 -
2. Collected data: cartels’ profile in developing countries
Data collection process
Our analysis is based on the original dataset containing information on 249 major ‘hard-
core’ cartels that were prosecuted in more than 20 developing countries from 1995 to 2013.1
In Appendix A we provide a reduced version of this dataset that contains the list of countries,
identified cartel cases and their respective periods of existence. We restrict our attention to the
chosen period because many of developing countries have established their competition
authorities just recently, if at all; hence no or very poor data could be collected for earlier
years. Nevertheless, we find it sufficiently long to obtain a representative sample.
The list of countries chosen to participate in the study was created according to the
active state of their competition authorities and sufficiency of their experience. For this reason
many of the developing economies were excluded from consideration. Nevertheless, they
could still profit of the current study results to advocate the introduction of the competition
law or its enforcement.
Given the complexity of possible reasons for collusive behavior and consequent welfare
effects, we only focus on so-called 'hard core' cartels, i.e. when cartel participants aim at
increasing their profits by the means of collective price or market share fixing. These
agreements between firms are assumed to be harmful for consumers per se and, therefore, are
illegal in the majority of antitrust jurisdictions. Hence, we do not include in the database
buyers’ cartels, collective predatory pricing cases or collusive agreements that were given an
exemption by competition authorities.2
For every defined ‘hard core’ cartel, we aimed at collecting quite substantial descriptive
data, including relevant market(s), number of colluding firms, cartel duration, cartel’s sales,
applied penalties and estimated price overcharges. Given the absolute lack of data on losses in
output or welfare, we have chosen price overcharges as a measure of the economic damage.
When a cartel operated on several relevant markets we considered those episodes separately,
if available data allowed doing so. When no exact date or month but only year of cartel’s
1The chosen countries are considered as developing economies according to the International Monetary Fund's
World Economic Outlook Report, April 2010. 2Collusive behavior could be given an exemption by competition authority if it is proven to be beneficial for
consumers or necessary in given economic conditions. This was, for instance, the case of the cartel in the mixed
concrete industry in South Korea in 2009.

___________________________________________________________________________________________
- 5 -
creation or breakdown was known, we assumed that cartel’s duration comprises the complete
year from January to December, similar for months. Cartel’s sales were calculated as revenues
of all colluding firms during the considered period on the relevant market only. Data on
penalties include all applied fines (both for companies and executives) as well as finalized
settlements. In some cases inputs were provided in different currencies. Therefore, when
needed, cartel’s sales were converted by using average exchange rates corresponding to the
period of cartel’s existence, while for penalties we used the exchange rate that corresponded
to the period when the final decision on the case was made. To be able to perform the cost-
benefit analysis we also looked for budgets of competition authorities.
The data were obtained from numerous sources such as competition authorities’
websites, companies’ annual reports, reports of international organizations such as OECD,
UNCTAD, etc. A significant piece of information came from the existing database on
international cartels.3 However, our sample would not be so rich without cooperation with
local competition authorities.4 For this purpose, they were asked to fill out a special
questionnaire. (See Appendix B.) In addition to the mentioned above target data this
questionnaire requests for some additional inputs required for our original methodology that
we developed to estimate the price overcharges. The minimal data that are necessary to for
this purpose are quite limited and include only prices, market shares and sales of colluding
companies at least for one period of cartel existence. All the other cartel-specific information
requested in the questionnaire is not mandatory to implement the methodology, but helps to
better calibrate market parameters and, eventually, improve the estimation results. We explain
the methodology in more detail and report obtained estimates later in the section.
Our database makes a substantial contribution in summarizing and, most importantly,
enriching the existing knowledge on price overcharges caused by cartels. It comprises not
only international cartels (as, for instance in Levenstein et al. (2003)), but also cartels formed
by domestic firms only. Cartels’ industrial profile in our sample is similar to the one described
extensively by Jenny (2006), therefore we do not go deeper in this aspect but instead focus on
the quantitative assessment.
3 Private International Cartels spreadsheet by John M. Connor, Purdue University, Indiana, USA (March 2009).
4We wish to thank for a fruitful cooperation competition authorities from Brazil, Chile, Colombia, Indonesia,
Peru, South Africa, Russia, Mexico,Ukraine, Pakistan, Zambia and South Koreaand Mauritius, as well as
UNCTAD RPP initiative coordinators.
___________________________________________________________________________________________
- 6 -
Descriptive statistics of the sample
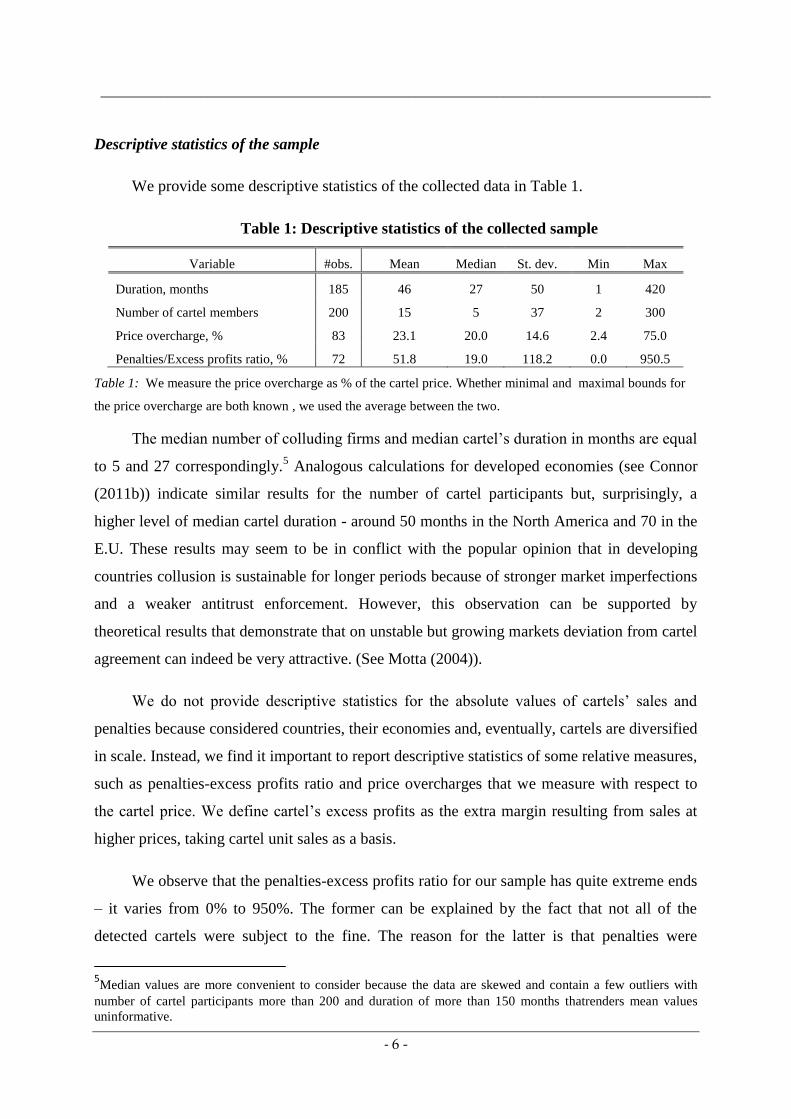
We provide some descriptive statistics of the collected data in Table 1.
Table 1: Descriptive statistics of the collected sample
Variable #obs. Mean Median St. dev. Min Max
Duration, months 185 46 27 50 1 420
Number of cartel members 200 15 5 37 2 300
Price overcharge, % 83 23.1 20.0 14.6 2.4 75.0
Penalties/Excess profits ratio, % 72 51.8 19.0 118.2 0.0 950.5
Table 1: We measure the price overcharge as % of the cartel price. Whether minimal and maximal bounds for
the price overcharge are both known , we used the average between the two.
The median number of colluding firms and median cartel’s duration in months are equal
to 5 and 27 correspondingly.5 Analogous calculations for developed economies (see Connor
(2011b)) indicate similar results for the number of cartel participants but, surprisingly, a
higher level of median cartel duration - around 50 months in the North America and 70 in the
E.U. These results may seem to be in conflict with the popular opinion that in developing
countries collusion is sustainable for longer periods because of stronger market imperfections
and a weaker antitrust enforcement. However, this observation can be supported by
theoretical results that demonstrate that on unstable but growing markets deviation from cartel
agreement can indeed be very attractive. (See Motta (2004)).
We do not provide descriptive statistics for the absolute values of cartels’ sales and
penalties because considered countries, their economies and, eventually, cartels are diversified
in scale. Instead, we find it important to report descriptive statistics of some relative measures,
such as penalties-excess profits ratio and price overcharges that we measure with respect to
the cartel price. We define cartel’s excess profits as the extra margin resulting from sales at
higher prices, taking cartel unit sales as a basis.
We observe that the penalties-excess profits ratio for our sample has quite extreme ends
– it varies from 0% to 950%. The former can be explained by the fact that not all of the
detected cartels were subject to the fine. The reason for the latter is that penalties were
5Median values are more convenient to consider because the data are skewed and contain a few outliers with
number of cartel participants more than 200 and duration of more than 150 months thatrenders mean values
uninformative.

___________________________________________________________________________________________
- 7 -
sometimes calculated as percentage of the total sales of cartel members instead of sales on the
relevant market only. Nevertheless, the average for developing countries ratio remains very
low compared to the U.S. level (19% against 57%) and is just slightly below the E.U. level of
26% (see Graph 1).
Graph 1: Comparison of penalty-excess profits ratios, %
Graph 1:In brackets we provide the number of observations used. Country-level data is given only when number
of observations is more than 2. Data on the E.U. and the U.S. is obtained from Connor (2011b).
Remarkably, even in developed countries competition authorities on average do not
recuperate excess profits gained by cartel members. Moreover, if one would appropriately
discount overcharges and penalties to account for money depreciation, those rates would be
even lower. According to Hammond (2005) and Connor (2011a) such a situation should be
characterized as ‘under-punishment’ because optimal deterrence of cartels formation requires
penalties to be higher than extra profits resulted from collusive arrangements. At the same
time, Allain et al. (2011) argue that the E.U. penalty rules can be considered as ‘optimal’,
even if eventual penalty–excess profits ratio is relatively low. They demonstrate that the
dynamic effects together with an appropriate estimation of price overcharges (i.e. corrected
for model and estimation error and publication bias) have a significant impact on the
determination of the optimal dissuasive penalties, i.e. penalties that wipe out all the expected
profits resulting from the anticompetitive infringement. The optimality of a penalty rule that
does not require a 100% recuperation of the excess cartel profits can be also supported by the
following intuition. On one hand, by imposing fines competition authorities try to deter
formation of cartels or make it more risky for existing collusion to continue, expecting that a
more severe penalty rule to result in a stronger deterrence effect. On the other hand, too high
penalty can undermine the firm’s ability to be an efficient market player that goes against the
57% (97) 26% (105)
19% (72) 3% (5)
9% (17) 9% (4) 11% (4)
28% (14) 31% (8) 33% (6)
82% (8) 89,77% (3)
0% 50% 100%
US (1990-2010)EU (1990-2010)
Developing coun.Pakistan
South KoreaSouth Africa
IndonesiaBrazilChile
MexicoPeru
Argentina

___________________________________________________________________________________________
- 8 -
initial goal of restitution of the fair competition. If cartel was operating on the market for
many years, it might be impossible for the firms to pay back all the extra profits that they have
obtained by overcharging. The fact that competition authorities try to balance these two
effects in different ways justifies the diversification of the penalty-excess profits ratios among
countries.
The present study does not aim at assessing whether penalty rules in developing
countries are optimal or not, nor it claims that they should follow the example of developed
antitrust jurisdictions. What we want to highlight here, is that factors that define the optimal
antitrust policy are quite numerous, starting from the very definition of the optimality that
every competition authority decides on its own. Therefore, the effective penalty rule indeed
can (and, most probably, should) be country-specific.
It could be expected that a weaker antitrust enforcement provides cartels with
incentives to set higher prices. Our collected sample does not provide any strong support to
this intuition. As can be seen from Table 2 below, the median price overcharge rate for our
sample is of the same range as the one experienced by the E.U. countries (20% versus 19.5-
22.48%) and is only slightly higher than 16.7-19% estimated for the U.S. and Canada.
Table 2: Comparison of cartel price overcharges from existing studies (in %)
Country/group # obs. Mean Median
Developing countries (our sample), 1990-20136 : 83 23.1 20.0
Developing countries (Connor (2010b)), 2000-
2009: 33 n/a n/a
China 2 17.42 17.42
Egypt 4 20.26 19.61
India 1 16.67 16.67
Korea 22 24.01 14.89
Mexico 1 15.25 15.25
Pakistan 1 42.53 42.53
Turkey 2 53.49 53.49
EU (Connor (2011b), 1990-2010 105 n/a 19.5
EU (Connor (2010b), 1990-2009 11 28.16 22.48
US (Connor (2011b), 1990-2010 97 n/a 19
US and Canada, (Connor, 2010b), 1990-2009 29 39.61 16.67
Table 2: Estimates from Connor (2010b) were originally provided with respect to a ‘but-for’ prices, therefore
6Our sample contains cases that were prosecuted from 199 0 to 2013, but could have existed before.

___________________________________________________________________________________________
- 9 -
they were recalculated with respect to the cartel price to be comparable with the other data from the table.
Estimation of price overcharges –methodology and results
In our study data on price overcharges constitute a departure point towards the
measure of the aggregated economic harm induced by cartelization. We acknowledge that in
the context of developing countries estimations of price overcharges appear to be very scarce.
One of the reasons is that this kind of estimations might be very demanding in terms of time
and expertise that represent a serious constraint for a young competition authority. Besides, to
condemn a cartel they mostly rely on the evidence on coordination activities (such as phone
calls, meeting notes etc.) rather than the economic one (such as parallel pricing or constant
market shares, etc.). To address this issue and to fill some of the missing estimates out, we
have developed an original methodology that is simple enough to implement while well
economically grounded.
The methodology employs the following approach that is applied on a case-by-case
basis. Based on the collected cartel data one first performs the calibration of the supply and
demand parameters on the cartelized market. If cartel operates on several markets calibration
should be performed for each of them separately, if collected data allow doing so. Having the
estimated parameters at hand, one then proceeds with the simulation of hypothetical
(counterfactual) competitive equilibrium, i.e. market state absent cartelization. Finally, by
comparing cartelized and counterfactual (competitive) states, one can calculate price
overcharges and corresponding losses in the output and the consumers’ welfare.
To perform the calibration of market parameters, we consider a model that describes
the equilibrium outcomes on the differentiated product market, where firms compete in prices
(differentiating product characteristics are assumed to be fixed). Demand and supply are
modeled separately in order to recover equilibrium outcomes.
Precisely, market demand is derived from a general class of discrete choice models of
consumer behavior. LOGIT specification that we have chosen is simple and good enough to
obtain the desirable structure of demand and, most importantly, it allows explicit calculation
of the consumers’ surplus in money terms. We assume that there are N potential consumers
on the market, each of them considers buying one unit of the product from one of J firms that
form a cartel. Consumer can also choose the so called ‘outside option’, denoted with index

___________________________________________________________________________________________
- 10 -
“0”. Outside option may represent a substitute offered by other firms (not participating in the
cartel) as well as consumer’s decision not to buy at all.
The utility of consumer i buying product j is defined as , where
are parameters of differentiation (e.g. quality of the product or services offered)
that are specific to each product and jp is the price of product j . is the marginal utility of
money common for all products and consumers that reflects the sensitivity of consumers to
the price relative to how they value quality. Higher would mean that consumers take their
decision mostly according to the price of the product, rather than its quality characteristic. ij
is the consumer i’s idiosyncratic utility component that is specific to product j . It is assumed
to be identically and independently distributed across consumers and products.
Consumer i chooses product j if it maximizes her expected utility, such that
. According to Berry (1994), demand associated with the alternative j can,
therefore, be represented by the following equation:
jjj ppsps ))(ln())(ln( 0 (1)
wherejs is a market share of the firm j and 0s is the share of the outside option and
),....,( 2,1 Jpppp is the price vector.
.
Or, eventually, by
Jj
p
pps
J
i
ii
jj
j ,1,
)exp(1
)exp()(
1
(2)
where the utility of the outside option is normalized to zero ( NiU i ,1,00 )
Note, that since the size of the market is fixed to N, market shares can be easily
interpreted in terms of sold quantities and vice versa.
In such framework, profit of each firm j is defined by the function
Npscpp jjjj *)(*)()( , wherejc are marginal costs that are assumed to be constant.
Further we employ several hypotheses that help to simplify the model and recover
unknown market parameters. We first presume that cartel participants act under perfect
collusion, choosing prices that maximize the joint profit of the cartel. Second, we assume that
i jjji j pU
Jjj ,1,
jjUU jii j

___________________________________________________________________________________________
- 11 -
cartel members agree to fix their gross margins to a certain value that is constant for all firms,
such that Jjconstcp jj ,1,)( . Under these assumptions, from the cartel’s joint profit
maximization problem it is easy to obtain the following cartel equilibrium condition:
Jj
scp jj ,1,1)(
0
(3)
System of equations that includes (2) and (3), therefore, fully describes the cartelized
market equilibrium Jjsp cartel
j
cartel
j ,1),,( . Cartel’s prices and market shares one can recover
from factual market data related to the period of cartelization. Note, however, that market
shares that are employed in the model ( cartel
js ) are not the same as those observed from the
market data (denoted ascartel
js ). The latter ones stand for the market shares within the cartel,
while the former take into account the presence of the outside option, such that
)1( 0s
ss
cartel
jcartel
j
and 11
J
j
cartel
js .
To be able to solve the system of equations composed of (2) and (3), and by doing so
recover the unknown market parameters, one would need to set two of them exogenously.
One of the parameters that we initially choose to fix is the gross cartel margin
Jjcp j
cartel
j ,1),( . Note, that this is equivalent to choosing the average cartel margin
cartel
j
j
cartel
jJ
j
cartel
jp
cpsAM
)(
1
.7 Because the latter is a relative measure and therefore can be
much easier to interpret we finally choose the average cartel margin as one of the exogenous
parameters for the calibration procedure. The second parameter is the share of the outside
option 0s.
Firms gross margins could be extracted from the colluding companies’ annual reports,
even if often only approximately. In contrast, it becomes much more complicated when it
comes to the estimates of the share of the outside option. There is no standard procedure to
define the potential market size, and methodology might differ significantly depending on the
7Recall that margin constant for all cartel participants is one of thebasic assumptions of the methodology.
Keeping this in mind, when market shares and prices are known, it is easy to recover average cartel margin from
the standard ones, and vice versa:
J
jcartel
j
cartel
j
jallfortcons
j
cartel
jcartel
j
j
cartel
jJ
j
cartel
jp
scp
p
cpsAM
1tan1
)()(

___________________________________________________________________________________________
- 12 -
product and market considered. However, independently on the procedure chosen, the sum of
all market shares, including the one of the outside option, must be always equal to one, i.e.
10
1
ssJ
j
cartel
j .
Having set exogenously average cartel margin and share of the outside option we first
recover parameter from equation (3):
0
1
0 )(
1
sAM
p
s
cps
J
jcartel
j
cartel
j
j
cartel
j
(4)
In the list of the parameters set exogenously one can choose to replace cartel’s margin
or the share of the outside option with marginal costs if they are known. In this case equation
(4) will remain valid and further steps of the methodology will not be affected.
Now we have all required information to recover the parameters of differentiation j
from equation (1). Marginal costs can , therefore, be recovered from the values of margins,
either average for the cartel or firm-specific gross margins.
While choosing values of exogenous parameters, one needs to make sure that obtained
values of marginal costs and parameter of sensitivity to the price are non-negative. Note,
that there are no sign restrictions to the values of j .
At this point, one is able to calculate the set of own- and cross-price elasticities
(correspondingly):
Jjsp cartel
j
cartel
jjj ,1),1( (5)
jiJijps cartel
i
cartel
iji ,,1,, (6)
Obtained estimates can be compared with existing ones from the other sources. This
may be seen as an additional cross-validation for the values of exogenous parameters and may
result in corresponding corrections.
At the end of the calibration procedure one has all missing market parameters
),1,,( Jjcand jj recovered. They are assumed to remain the same whether the market
is cartelized or not. And now we are ready to proceed with the simulation of the
counterfactual (competitive) state of the market.

___________________________________________________________________________________________
- 13 -
In the absence of collusion each firm would take a decision on its own price to
maximize own profits, taking into account own marginal costs and expected pricing strategy
of competitors. A standard solution for each firm’s profit maximization problem would be:
Jjs
cpj
jj ,1,)1(
1
(7)
while (2) remains valid.
As a solution of the system of equations (7) and (2) we obtain counterfactual
(competitive) prices and market shares . By comparing cartel’s and
competitive prices we can calculate price overcharge for every cartel member as well as
cartel’s average price overcharge:
100)(
%1
cartel
j
c
j
cartel
jJ
j
cartel
jp
ppsP (8)
Formula in (8) gives a price overcharge estimate in percentage, but it can easily be
transformed into money terms by multiplying firm specific price overcharges on the
corresponding cartel member sales.
Moreover, employed demand model allows explicit calculation of the consumers’
welfare (surplus) losses, both in percentage and in money terms. We make use of the formula,
proposed in Anderson et al. (1992)):
J
j
jj pCS1
)exp(1ln1
(9)
Hence, relative consumers’ welfare losses caused by collusive practices could be
calculated as following:
100
)(exp1ln
)exp(1ln)(exp1ln
(%)
1
11
J
j
c
jj
J
j
cartel
jj
J
j
c
jj
p
pp
lossesWelfare
(10)
On one hand, an obvious advantage of our methodology is that it requires very limited
data to be implemented: it can be employed only with information on prices and observed
market shares of colluding companies at least for one period of cartel existence. On the other
hand, it is based on a relatively simple model and uses a few assumptions that result in certain
Jjpc
j ,1, Jjsc
j ,1,

___________________________________________________________________________________________
- 14 -
limitations. We discuss them below.
First, demand is designed from a simple LOGIT model, which is quite flexible but has a
specific property of Independence of Irrelevant Alternatives. In a nutshell, this model
generates a particular consumers’ behavior pattern: motivated by a price increase consumers
would switch to the product with the maximal market share, but not the one with closest
quality characteristics. Indeed, it may not be a true behavioral pattern in reality.
Second, our methodology is based on assumption about the perfect collusion among
cartel participants while real level of coordination among firms could be much weaker. Under
these conditions, obtained estimates of price overcharge and consumers’ welfare losses are the
maximal ones for the assumed levels of cartel’s margin and share of the outside option.
Third, when one changes assumptions about cartel margin and/or share of the outside
option, then values of calibrated market parameters and, ultimately, final estimates of the
interest also change. For this reason it makes sense to consider not the exact values but rather
a reasonable range for each of exogenous parameters, based on the common sense and
available market data. Sensitivity of estimation results with respect to the parameters that are
set exogenously differs in each particular market. Considering reasonable ranges for external
parameters rather than exact values shall help in assessing the robustness of obtained results.
Additional market expertise, when available, could also help to narrow down the range of
calibrated market parameters and, eventually, obtain more precise estimations of price
overcharge and consumers’ welfare losses.
In the Appendix C we illustrate application of the proposed methodology on the price-
fixing cartel between civil airlines in Brazil.
It is unfortunate to acknowledge that competition authorities in developing countries
often do not possess even the minimal economic data required to employ the methodology.
Or, even if they do, it is often considered as confidential. Due to this reason, it was possible to
perform estimations only in eleven cases. Results are provided in Table 3.

___________________________________________________________________________________________
- 15 -
Table 3: Estimates of price overcharges and output losses obtained with the use of
the developed methodology
Industry (country) Period of
existence
Min
%p
Max
%p
Min
%q 8
Max
%q
Civil airlines (Brazil) Jan’99-Mar’03 3.20% 33.90% 10.00% 24.2%
Crushed rock (Brazil) Dec’99-Jun’03 3.40% 11.25% 15.69% 25.80%
Security guard services (Brazil) 1990-2003 4.80% 27.84% 14.93% 23.15%
Industrial gas (Brazil) 1998-Mar’04 4.12% 29.96% 5.00% 22.77%
Steel bars (Brazil) 1998-Nov’1999 5.49% 37.84% 10.99% 27.81%
Steel (Brazil) 1994-Dec’99 13.55% 40.13% 5.00% 29.22%
Medical gases (Chile) 2001-2004 37.50% 49.40% 2.00% 14.93%
Petroleum products (Chile) Feb’01-Sep’02 4.57% 9.90% 10.43% 23.35%
Construction materials (Chile) 20 Oct’06 47.78% 83.48% 7.24% 22.95%
Petroleum products II (Chile) Mar’08-Dec’08 1.78% 11.13% 9.63% 18.99%
Cement (Egypt) Jan’03-Dec’06 28.20% 39.3% 5.00% 10.00%
Average for the category 14.04% 34.01% 8.68% 21.94%
Average 24.02% 15.41%
Median 18.6% 16.9%
Table 3: Price overcharge is measured with respect to the cartelized price, while losses in the output with
respect to the counterfactual (competitive) state.
Obtained average and median price overcharge rate of 24.21% and 18.6%
correspondingly are of the same magnitude as for the rest of the sample (23.1% and 20%, see
Table 1). We acknowledge, however, that the difference between the estimated maximal and
minimal bounds of price overcharges and output losses is often large. A competition authority
that wants to implement the proposed methodology would certainly obtain a greater precision
provided it uses the best information on the input parameters. Further analysis in Section 3
includes these additional estimations.
3. Aggregated cartels’ effects
Overall, the descriptive statistics of the collected data demonstrate that the
anticompetitive impact in terms of price overcharges is at least similar to that in developed
countries, which calls for adequate antitrust measures. Young competition authorities, that
8Minimal and maximal estimated output losses can appear rounded. This is a results of some particularities of
the methodology employed , particularly because some parameters need to be set exogenously.

___________________________________________________________________________________________
- 16 -
often lack resources to efficiently fight against collusive practices are having hard times
lobbing for a greater budget and, therefore, are constantly looking for strong and motivating
evidence of the benefits that their existence brings. We believe that the latter could be
provided by looking at the aggregate measures of cartelization harm that we provide in this
section. The approach that we use consists in summing up the obtained cartel case-specific
impact estimates in money terms and assessing their significance on the macro-economic
level.
Precisely, in our analysis we focus on several aggregate indicators. First, inspired by
Levenstein, Suslow and Oswald (2003) we find it appropriate to consider aggregated sales
that were affected by collusive behavior, i.e. total revenues received by cartel members. More
innovatively, we also assess the aggregate cartel damage in terms of excess profits. Both
measures are summed up for all cartels in each particular country and related to the GDP. We
supplement the discussion with a sort of “cost-benefit” analysis of the antitrust enforcement
by relating the aggregated excess profits to the budget of the corresponding competition
authority (“CA Budget”).
In order to obtain more comprehensive aggregated estimates we first fill the remaining
data gaps in by applying an additional treatment to the originally collected data.
For those countries where competition authority sets maximal penalty as percentage of
cartel’s sales (like, for instance, in Brazil, South Korea, Ukraine, South Africa, etc.), we
approximate the missing cartel sales as the respective penalty in money terms divided by the
maximal penalty rate.9 Note that this approach provides an estimate of the minimal level of
cartel’s sales. The penalty in those cases is set based on the sales recorded in the year
preceding the one where the court decision on the case was made. Therefore, the minimal
approximated cartel sales need to be further multiplied by cartel duration in years. When price
overcharge was unknown and it was not possible to employ the proposed methodology to
estimate it, we roughly approximated the excess cartel’s excess profits by multiplying the
sample median overcharge rate and cartel sales. In case cartel sales were missing, we first
assumed the cartel’s excess profits as equal to applied penalties. Recall that, according to
Table 1, applied penalties do not in average compensate for the excess profits gained by cartel
9 For example, if a cartel was fined for 100 USD and the maximal penalty rate is 10% of cartel’s sales, then
minimal bound for cartel’s sales can be estimated as 100/0.1=1000 USD. Because percentage penalty rule is
sometimes applied to company’s total sales, we have employed, where needed and where possible, a coefficient
that corresponds to the share of sales on the relevant market in total company sales.

___________________________________________________________________________________________
- 17 -
members, therefore this approximation provides a minimal level of cartel’s excess profits.
Knowing the minimal level of cartel’s excess profits allowed, in turn, recovering back the
missing cartel sales by applying the median price overcharge rate.
Finally, to make the nominal values, such as sales, excess profits, penalties and
competition authorities’ budgets comparable among different years, we apply relevant
denominators to translate them into the currency of the last year of the considered period
(specific for each country).
Aggregated harm was calculated separately for countries with sufficient data, namely
Brazil, Chile, Colombia, Indonesia, South Africa, Mexico, Pakistan, Peru, Russia, South
Korea, Ukraine and Zambia. The selection criterion is basically the availability of quantified
impacts of cartels that represent a significant part of all detected cases in the country. Except
for Zambia, whose only quantified cartel had a tremendous economic impact.
For these countries in Table 4 below we provide the breakdown of recorded cartel cases
indicating the number of quantified ones. Information in brackets refers to number of cases
for which corresponding missing inputs were approximated by means of the above treatment.
We employ the term ‘allocated’ for those cartels when we were able to associate sales and
excess profits with a certain year, i.e. only those when at least cartel’s beginning or
breakdown year was known.
Table 4: Availability of quantified impacts of detected cartels (numbers)
Country (period) # of cartels
recorded
# of cartels with
data on sales
# of cartels with
data on overcharges
# of ‘allocated’
cartels
Brazil (1995-2005) 18 17(1) 17(3) 17
Chile (2001-2009) 17 16(6) 16(7) 16
Colombia (1997-2012) 18 17(17) 17(17) 17
Indonesia (2000-2009) 12 8(0) 8(1) 7
Mexico (2002-2011) 17 17(9) 17 (11) 17
Pakistan (2003-2011) 14 14(6) 14(9) 14
Peru (1995-2009) 11 10(2) 10(2) 10
Russia (2005-2013) 15 11(10) 11(11) 11
South Africa (2000-2009) 37 23(7) 23(18) 23
South Korea (1998-2006) 26 26(0) 26(8) 26
Ukraine (2003-2012) 7 7(6) 7(7) 3
Zambia (2007-2012) 7 1(0) 1(0) 1

___________________________________________________________________________________________
- 18 -
The two aggregated indicators of the interest we first calculate as an average for the
considered period. Looking at the year-to-year dynamics would be misleading because both
ends of the period have a high risk of not being representative - either because of a low
activity of the competition authority in the beginning or because the end of the period is often
characterized by multiple ongoing cartel investigations. Absent final decision made on the
case corresponding price overcharges and other data cannot be included into the database.
Because of these reasons even average for the period estimates can be biased, thus we find it
important to report also the maximal value together with the year that it corresponds to. Table
5 summarizes obtained results.
Table 5: Aggregated indicators
Country
Aggregated excess profits /
GDP, %
Affected sales/ GDP, % Aggregated excess
profits / CA Budget
Average Max (year) Average Max (year) Average Max (year)
Brazil (1995-2005) 0.21% 0.43% (1999) 0.89% 1.86% (1999) 308 1232 (1998)
Chile (2001-2009) 0.06% 0.23% (2008) 0.92% 2.63% (2008) 23 91 (2008)
Colombia (1997-2012) 0.001% 0.002%(2011) 0.01% 0.01% (2011) 7 36 (2006)
Indonesia (2000-2009) 0.04% 0.09% (2006) 0.50% 1.14% (2006) 29 58 (2004)
Mexico (2002-2011) 0.01% 0.02% (2011) 0.05% 0.11% (2011) 7 19 (2011)
Pakistan (2003-2011) 0.22% 0.56% (2009) 1.08% 2.59% (2009) 245 518 (2008)
Peru (1995-2009) 0.002% 0.007%(2002) 0.01% 0.023% (2002) 6.44 25 (2004)
Russia (2005-2013) 0.05% 0.12% (2012) 0.24% 0.67% (2012) 0.58 1.45 (2008)
South Africa (2000-2009) 0.49% 0.81% (2002) 3.74% 6.38% (2002) 124 214 (2005)
South Korea (1998-2006) 0.53% 0.77% (2004) 3.00% 4.38% (2004) 144 214 (2004)
Ukraine (2003-2012) 0.03% 0.03% (2011) 0.15% 0.16% (2011) 0.84 0.88 (2011)
Zambia (2007-2012) 0.07% 0.09% (2007) 0.18% 0.24% (2007) 11 27 (2007)
Average 0.14% 0.9% 76
Our results confirm that cartels` impact in developing economies can indeed be
substantial. In terms of affected sales related to GDP, it varies among countries from 0.01% to
3.74% on average for the considered periods, while its maximal value reaches up to 6.38% for
South Africa in 2002. Remarkably, calculations for Zambia are based on only one cartel for
which data are available (market of fertilizers, 2007-2012), but even taking this into

___________________________________________________________________________________________
- 19 -
consideration the impact is not negligible (0.24% of GDP in terms of affected sales). Actual
harm in terms of aggregated cartels’ excess profits is also significant, with maximal rates
reaching almost 1% in terms of GDP for South Korea in 2004 and South Africa in 2002.
The cost-benefit analysis performed for selected competition authorities demonstrates
that potential benefits of having an antitrust division (or alternative costs of not having it)
measured as aggregated cartel excess profits exceed the competition authorities’ budgets on
average 76 times and can reach up to 1232 times (see the last two columns in Table 5).10
Here we assume that a cartel would exist for at least as long as it already did before being
discovered. Data on budgets that we have collected comprise expenses for all activities of the
competition enforcement unit, including merger investigations that are traditionally highly
demanding in terms of resources. Therefore, the cartel-specific efficiency rate can turn out
significantly higher.
Our estimates can be considered as a very minimal bound for the economic harm
caused by collusive behaviour because of multiple reasons. First of all, the collected data on
detected cartels remain very limited. Even though some competition authorities agreed to
cooperate, we have to acknowledge that the list of prosecuted ‘hard – core’ cartels for every
country is still not complete, nor were all the required data obtained for each of the cases. Out
of 249 defined cases only 83 have data on price overcharges, 175 on applied penalties and 114
on cartel’s sales. As Table 4 above illustrates, many of recorded cases were excluded from
calculations of the aggregate effects because of missing data. On top of this there is another
reason, t hat may in fact be a principal one - some of the existing cartels remain uncovered.
10
Here we assume that when cartel breaks down then firms come back to their competitive equilibrium
strategies. As a consequence of this, firms are supposed to low down prices to a pre-cartel level. Evidence on
post-cartel behavior collected by Connor (2010a) and Sproul (1993) indicates that this assumption might not be
always valid. Given that for our sample very limited price data were available even for the period of cartel
existence, and no data at all are available for post-cartel periods, we should admit that this is almost impossible
to test whether the assumption in question holds for our sample of cartels.
Note that a high level of excess cartel profits related to the competition authority budget does not necessarily
witness for the efficiency of the antitrust enforcement. Firstly, a low level of the ratio in question can result
from a high efficiency of the competition authority if the latter focuses rather on cartel deterrence (education
through mass media or higher penalties, etc.) than cartel detection. Low number of detections or lower excess
profits can simply reflect the fact that there exist fewer cartels or that they are weaker. Second reason is that
competition authorities can ‘free ride’ on the experience of the other ones. By ‘free riding’ we mean a situation
when a cartel case already went through an examination in one of the competition authorities, and the others use
this fact to trigger its own investigation or even use the already extracted evidence. Therefore a competition
authority can win the case without investing too much. As the collected sample demonstrates, ‘free riding’ can
indeed take in place - the same cartels are often found in a large number of (often neighboring) countries. For
example, this is the case of industrial gas distribution cartels in Latin America or cement cartels in Africa.
Although, ‘free riding’ can potentially be considered as a sort of efficiency as it is a way of ‘economizing’ the
resources.

___________________________________________________________________________________________
- 20 -
To assess how far (or how close) we are from understanding the real scale of the damage, in
the next section we estimate the deterrence rate, i.e., the annual probability of a cartel to be
detected. To our knowledge this is the first attempt to do so on a sample of cartels detected in
developing countries.
4. Estimation of the deterrence rate
To estimate the deterrence rate we have adopted the approach proposed in Combe et al
(2008). We did not modify their methodology, therefore only a brief description of the main
idea and results of its application on our database will be provided. In a nutshell, authors
consider a markovian process with two elements that are related to the cartel birth and its’
death that is associated with detection. Cartels inter-arrival time and duration between their
birth and detection - are both random variables distributed exponentially and independently
across cartels.11
The model allows calculating instantaneous probability of cartel detection
through the maximum likelihood estimation method. Because the sample naturally contains
only cartels that were detected, the estimated probability is conditional on that the cartel will
be eventually detected. This value, in turn, represents the maximal bound of the global
instantaneous probability of cartel detection (the sought-for deterrence rate).
For our sample the estimated maximal annual probability of detection equals to 24%. It
is significantly higher than the upper bound of the same variable estimated by Combe et al.
(2008) for the E.U. cartels prosecuted from 1969 to 2007 (12.9-13.3%%) that apparently
witness for a more efficient antitrust enforcement in developing countries.12
A lower rate for
the E.U. can be explained by inclusion into consideration of earlier years that are
characterized with a weaker antitrust enforcement. An additional explanation can be also
offered. When cartel members are international corporations they often enter collusive
agreements in several, often neighboring developing countries. Apart of the famous vitamins
cartel, our sample includes, for instance, medical gas distribution cartels, prosecuted in
Argentina, Brazil, Chile, Colombia and Mexico in late 90s-early 2000s, or cement cartels that
11
Because the cartel duration in our database is often not precise (for example, the year only was reported) we
take the maximal duration for each of the cartels that contains complete months/years, unless a more precise
information is available. To see whether our data fit model assumption of independency and exponential
distribution we performed the same testing as in Bryant and Eckard (1991). Corresponding estimation results and
graphs are available upon request. 12
Estimates for the E.U. are taken from Combe et al (2008) and cover cartels prosecuted from 1969 to 2007. The
maximal bound for the annual deterrence rate of 13% - 17% was estimated with a similar methodology for a set
of U.S. cartels. (See Bryant and Eckard (1991).) However these result should not be compared with the one from
our study as situation in the antitrust enforcement has significantly changed since the period that was considered
by authors (from 1961 to 1988).

___________________________________________________________________________________________
- 21 -
took place over the last 30 years in South Africa, Argentina, Egypt, Korea, Mexico and other
developing countries. Evidence provided by other countries may serve as a trigger for local
investigations and can facilitate the cartel detection, increasing, therefore, the deterrence rate.
A maximal deterrence rate of 24% basically means that at least 3 out of 4 existing
cartels remain uncovered. Therefore, we suggest that the actual economic harm caused by
‘hard-core’ cartels in developing countries exceeds our estimations from the previous section
at least fourfold.
5. Conclusions and policy implications
The competition policy implementation and enforcement, including cartel
investigations, require substantial investments. Therefore, it is important to measure to which
extent those expenditures are compensated in terms of prevented consumers’ damages.
Especially this is relevant for developing competition authorities that often experience tough
budget constraints. To provide the required evidence we have collected an original dataset
that contains information on 249 major ‘hard-core’ cartels that were prosecuted in more than
20 developing countries from 1995 to 2013.
Descriptive statistics of our dataset of cartels do not bring any strong evidence to the
widespread idea that developing countries are exposed to a higher cartel price overcharges
than the developed ones. However, we do show that price overcharges are at least similar,
which calls for adequate antitrust measures. We also show that the aggregated impact can be
substantial. In terms of affected sales related to GDP the maximal rate reaches up to 6.38%
(South Africa in 2002). The actual damage in terms of cartels’ excess profits is also
significant, with maximal rates reaching almost 1% of GDP (South Korea in 2004 and South
Africa in 2002).
Study of Boyer and Kotchoni (2014) demonstrates on the sample from Connor
(2010b) that data on price overcharges obtained from different methodologies, sources and
contexts are asymmetric and heterogeneous, and therefore, are subject to a significant
estimation bias. Non-biased estimates are, in fact, lower than simple medians calculated from
the raw data. For example, bias correction reduces median price overcharge for the E.U.
countries from 22.48% to 14.04% and from 16.67% to 13.58% for the U.S. and Canada.13
13
Estimates from Boyer and Kotchoni (2014) were originally provided with respect to a ‘but-for’ prices,
therefore they were recalculated with respect to the cartel price to be comparable with the other estimates in the
paper.

___________________________________________________________________________________________
- 22 -
Therefore, ideally, our own sample would require similar corrections to be made. We,
nevertheless, insist that our aggregate damage estimates correspond to the very minimal
bound of cartels’ effects. This is so because of at least six reasons.
First, present study only takes into consideration cartel cases that are already closed. It,
therefore, does not take into account neither cases under investigation nor those for which
competition authority failed to prove its existence.
Second reason is that economic data on convicted cartels are very poor. This is so
because to condemn a cartel competition authorities rely mostly on the evidence of
coordination activities rather than the economic one. Coupled with confidentiality issues, this
reason resulted in elimination of multiple recorded cases from calculation of aggregate
effects.
Third, collusive practices harm consumers not only in terms of inflationary effects, but
also because they limit consumption. Our analysis demonstrates that, on average, a cartel
decreases the production level by about 15% on the concerned market (see Table 3). Taking
into account these output effects would provide more accuracy for our estimations. Our
methodology allows one to calculate the losses in consumers’ surplus that could serve to
measure both changes - in prices and in quantities. However, in our sample its’ application is
limited to only a few cartel cases with sufficient data.
On top of this, our estimates do not take into account neither price umbrella effects14
nor possible degradation in quality.15
Fifth reason is that many of the cartelized industries produce intermediary goods, such
as, for instant, cement or gas. Therefore the consequent price overcharge may proliferate
further on other economic sectors, increasing the final impact manifold. By employing the
country level input-output matrixes and corresponding industry pass-through rates together
with estimated cartel excess profits one would be able to i) assess the potential impact of
those proliferations, and ii) define a set of industries that have the highest damaging potential
and therefore deserve a special attention from the competition authority. We find it as a very
promising area for further development.
14
Cartels can potentially cause a price umbrella effect as remaining firmscould have more incentives to charge
higher prices facing a price increase from cartel members. 15
Even though our model does not allow the quality characteristics to change, the degradations in quality can
still appear as colluding firms may have less incentive to maintain it.

___________________________________________________________________________________________
- 23 -
The final, but probably the most important reason for our estimates to reflect only the
minimal bound, is the hidden nature of cartels. As we estimate the maximal annual probability
of uncovering an existing cartel to be around 24%, we suggest that the actual economic
damage resulting from collusive practices in developing countries is at least 4 times bigger
that suggested by our estimations.
We have also demonstrated that even this minimal estimated economic harm for the
majority of considered countries significantly exceeds the expenditures to maintain the
functionality of the relevant antitrust body. This may serve as a sought-for evidence for the
competition authorities who wish to justify the requirement for an additional budget to
improve the cartel deterrence and detection. More than that, developing competition
authorities may wish to take advantage of the proposed methodology for their own cartel
investigations as it will reduce the data required to estimate the economic damages. The
efficiency of the penalty rule can be then assessed by comparing the imposed fines with
cartels’ excess profits. Actual penalty - excess profits rates could be compared against
relevant benchmarks that are considered by the competition authority as optimal.
The last, but not the least, the created cartels database may be seen as a reference list
containing industries that are potentially vulnerable to collusive behavior. Cartel members
often enter into collusive agreements in multiple, often neighboring, economies. Therefore,
evidence from other countries can (and should) be employed by competition authorities in
local investigations. This may encourage countries to create a worldwide platform that would
allow sharing and maintaining the common cartel database, for instance, on the basis of the
International Competition Network (ICN).

___________________________________________________________________________________________
- 24 -
References
Aghion, P. and P. Howitt (2005), "Appropriate Growth Policy: A Unifying Framework",
paper presented at the OECD Conference on Global convergence scenarios: structural
and policy issues, Paris, January 2006.
Allain et al. (2011), “The Determination of Optimal Fines in Cartel Cases: The Myth of
Underdeterrence”, Available at SSRN: http://ssrn.com/abstract=1987107 or
http://dx.doi.org/10.2139/ssrn.1987107
Anderson et al. (1992),” Discrete Choice Theory of Product Differentiation”, MIT Press, 1992
Baker, J. B (2003), “The Case for Antitrust Enforcement”. Journal of Economic Perspectives,
Vol. 17, Number 4, Fall 2003, Pages 27-50
Berry, S.T. (1994), “Estimating Discrete-Choice Models of Product Differentiation, RAND
Journal of Economics, vol. 25(2), pages 242-262
Boyer, M. and R. Kotchoni (2014), “How Much Do Cartels Overcharge?”, previous
(published) version of the paper can be found at http://ssrn.com/abstract=2076055
Bryant, P. and E. W. Eckard (1991), “ Price Fixing: The Probability of Getting Caught”, The
Review of Economics and Statistics Vol. 73, No. 3 , pp. 531-536
Buccirossi, P. al. (2009), “Competition policy and productivity growth: An empirical
assessment”, CIG Working Papers with number SP II 2009-12.
Combe, E. et al. (2008), “Cartels: The Probability of Getting Caught in the European Union”,
available at SSRN: http://ssrn.com/abstract=1015061
Connor, J.M. (2005), “Price-fixing overcharges: legal and economic evidence”, Staff Paper
No. 04-17, Purdue University
Connor, J.M. (2010a) “Recidivism Revealed: Private International Cartels 1991-2009”,
available at SSRN: http://ssrn.com/abstract=1688508 or
http://dx.doi.org/10.2139/ssrn.1688508
Connor, J.M. (2010b), “Price-fixing Overcharges, 2nd Edition”, available at
http://papers.ssrn.com/sol3/papers.cfm?abstract_id=1610262
Connor, J.M (2011a), “Price Effects of International Cartels in Markets for Primary
Products”, materials of the Symposium on Trade in primary Product Markets and
Competition Policy" at the World Trade Organization, September 22, 2011.
Connor, J.M. (2011b), “Cartels portrayed” working papers series. The American Antitrust
Institute, working papers No. 11‐ 06, 11-03, 11-04, 11-05, 11-06 and 11-07.

___________________________________________________________________________________________
- 25 -
Connor, J.M. and Y. Bolotova (2006), “Cartel overcharges: Survey and meta-analysis”,
International Journal of Industrial Organization, 24, 1009-1137.
Crandall, R.W. and C. Winston (2004), “Does Antitrust Policy Improve Consumer Welfare?
Assessing the Evidence”, The Journal of Economic Perspectives, Vol. 17, No. 4
(Autumn, 2003), pp. 3-26
Griffith, R. and R. Harisson (2004), “The link between product market reform and macro-
economic performance,” European Economy - Economic Papers 209, Directorate
General Economic and Monetary Affairs, European Commission
Hammond, S.D. (2005), “Optimal Sanctions, Optimal Deterrence”, presented at ICN Annual
Conference, Bonn, Germany on June 6, 2005
Jenny, F. (2006), “Cartels and Collusion in Developing Countries: Lessons from Empirical
Evidence”, World Competition 29(1): 109-137, 2006.
Motta, M. (2004) “Competition Policy: Theory and Practice”, Cambridge University Press,
2004
Levenstein, M.C., V. Y. Suslow, and L. J. Oswald (2003), “Contemporary International
Cartels And Developing Countries: Economic Effects And Implications For
Competition Policy”, Working Paper #03-10
Nicoletti G. and S. Scarpetta (2003), “Regulation, productivity, and growth: OECD
evidence”, Economic Policy, CEPR & CES & MSH, vol. 18(36), pages 9-72, 04
Sproul, M. F. (1993), “Antitrust and Prices,” Journal of Political Economy, vol. 101(4), pages
741-54

___________________________________________________________________________________________
- 26 -
Appendix A - Major ‘hard core’ cartels prosecuted in selected developing
countries (1995-2013)
Argentina Chile (cont.)
Portland cement 1981-1999 Vehicles and spare parts
11 Aug’06 (bid
rigging)
Medical gases n/a-1997 Publishing services Mar’08-Apr’08
Healthcare services n/a Pharmaceutical (distribution) Dec’07-Apr’08
Liquid petroleum gas (S.C.
Bariloche) Jan'98-Dec'98 Public transportation Oct’06-Nov’07
Sand (Parana city) Jun'99-Jul'01 Radio transmission 2007
Liquid oxygen Jan'97-Dec'01 Tourism (agent services) 2008
Cable TV (Santa Fe city) Oct'97-Dec'01 Public transportation (maritime) 2009
Cable TV service (football
transmissions) Jan'96-Dec'98 Public transportation (bus) Feb’07-Mar’09
Brazil Flat Panel TV n/a
Civil airlines Jan’99-Mar’03 Colombia
Retail fuel dealers (Goiania) Apr’99-May’02 Cement Feb’06-Jan'10
Retail fuel dealers
(Florianopolis ) 1999-2002 Mobile phone services Apr’99-Aug’07
Retail fuel dealers ( Belo
Horizonte) 1999-2002 Green onions Feb"07-Jan'09
Retail fuel dealers (Recife) Apr’99-Feb’02 Pasteurized milk Jan’97-n/a
Generic drugs Jul’99-Oct’99 Green paddy rice Jan'04-Nov'06
Maritime hose Jun’99-May’07 Chocolate and cocoa products Oct’06-Oct'09
Crushed rocks Dec’99-Jun’03 Private security services Feb'11-Sep'12
Security guard services 1990-2003
Services of grade systematization
(Bogota District schools) Jun'08-Dec'09
Hermetic compressors 2001-2009 Milk processing n/a-2008
Industrial gas 1998-Mar’04 Health services Mar/09-Nov'11
Air cargo Jul’03-Jul’05 Oxygen supply May'05-Mar'11
Transportation Oct’97-Jan’01 Road paving Aug'10-Jan'12
Steel bars 1998-Nov’99 Sugar cane remuneration rates Feb'10-Aug'11
Construction materials (sand) 1998-Apr’03
Cars’ techno-mechanical and gas
review Mar'10-Oct'11
Steel 1994-Dec’99
Cars’ techno-mechanical and gas
review Mar'10-Dec'11
Blood products Jan’03-Dec’03 Feed ration service for prisons May'11-Sept'12
Toy manufacturers (imports
from China) 2006-2009
Cars’ techno-mechanical and gas
review Apr'10-Mar'12
Chile TV advertising market Apr'10-Apr'11
Petroleum products Feb’01-Sep’02 Egypt
Medical gases (oxygen) 2001-2004
Construction (Egypt Wastewater
Plant) Jun'88-Sept'96
Medical insurance plans 2002-2004 Cement Jan'03-Dec'06
Medical services May’05-May’06 El Salvador
Construction materials
(asphalt)
20 Oct’06 (bid
rigging) Petroleum products n/a-2007
Public transportation (bus) 2006 Indonesia
Public transportation (bus) Nov’07-May’08 Mobile phone services
Mar’03-
Nov’05
Petroleum products Mar’08-Dec’08 SMS Jan’04-Apr’08

___________________________________________________________________________________________
- 27 -
Indonesia (cont.) South Korea (cont.)
School books Jan’99- Dec’00 Elevators and escalators Apr’96-Apr’06
Cement n/a-Dec’09 Toilet roll manufacturing Mar’97-Jan’98
Airlines Jan’06-Dec’09 Coffee Jul’97-Jan’98
Pharmaceuticals n/a Kenya
Poultry (day old chicken) Jan’00-Dec’00 Coffee producers n/a
Sea cargo ( Jakarta-Pontianak) Jun’02-Oct’03 Fertilizers I n/a-2003
Sea cargo ( Surabaya-
Makassar) Jan’03-Sep’03 Beer (production) n/a-2004
Public transportation (city
bus) Sep’01-Oct’03 Soft drinks n/a-2004
Salt Trade ( North Sumatra) Jan’05-Dec’05 Transportation n/a
Sea Cargo (Sorong Seaport) Mar’00-Nov’08 Mechanical engineers services n/a
Kazakhstan Insurance (transportation sector) n/a-2002
Petroleum products (brokers) 2002-2005 Petroleum (retail) n/a-2004
South Korea Fertilizers II n/a-2011
Batteries manufacturing (auto) Jun’03-Sep’04 Tea growers n/a-2004
Beer Feb’98-May’99 Sugar n/a-2004
Cement Jan’02-Mar’03
Port Customs Department
auctions n/a
Construction machinery
(excavators) May’01-Nov’04 Malawi
Forklifts manufacturing Dec’99-Nov’04 Cotton farmers n/a
Petroleum products (military,
wholesale) 1998-2000 Tea growers n/a
Telecom services (local, land
line) Jun’03-May’05 Tobacco growers n/a
Telecom services (long-
distance, land line) Jun’03-May’05 Bakeries n/a
Telecom services
(international, landline) Jun’03-May’05 Beer n/a
Broadband Internet service Jun’03-May’05 Petroleum sector n/a
Detergent manufacturing 1998-2006 Mauritius
Telecommunications (mobile
services) I Jun’04-May’06 Travel agency 2010
Telecommunications (mobile
services) II Jan’00-Jul’06 Mexico
Gasoline and diesel (refining) Apr’04-Jun’04 Gas (liquid propane) Jan'96-Feb'96
Industrial motors 1998-2006 Chemicals (film development) Jan'98-Dec'00
Polyethylene (low density) Apr’94-Apr’05 Poultry Mar'10-Mar'10
Polypropylene (high density
polyethylene) Apr’94-Apr’05 Boiled corn and corn tortillas Mar'11-Jul'12
Movie tickets Mar’07-Jul’07 Corn mass and tortillas May'10-Aug'12
Trunked radio system devices Dec’03-Feb’06 Transportation (touristic sector) Jul'09-Mar'12
Petrochemicals Sep’00-Jun’05 Anesthesiology (services) May'03-May'09
Copy paper imports Jan’01-Feb’04 Auto transportation (cargo) I Jan'10-Sep'11
Soft drink bottling Feb’08-Feb’09 Maritime public transportation Jun'08-Jun'12
Gas (LPG) Jan’03-Dec’09 Auto transportation (cargo) II Sept'08-Jun'10

___________________________________________________________________________________________
- 28 -
Mexico (cont.) Russia (cont.)
Healthcare (medical drugs) 2003-2005
Laptop computer operating
systems n/a
Consulting services (real
estate) Jul'03-Apr'09
Fuel (petroleum, Krasnodarki
krai) Jan'05-Jul'05
Restricted TV signal Oct'02-Dec'08
Fuel (petroleum, Rostov-on-
Don) n/a-2005
Food vouchers Aug'05-Sept'05
Airlines (flights between
Nizhnevartovsk and Moscow) n/a-Dec'05
Consulting services (real
estate) II May'03-Jul'09
Railway transportation
(Kemerovo) Oct'11-Dec'12
Railway transportation (cargo) Nov'05-Jun'09 Soda cartel 2005-2012
Cable and cable products Feb'06-Mar'07 Polyvinylchloride cartel 2005-2009
Pakistan Pharmaceutical cartel 2008-2009
Bank interest rates Nov/07-Apr’08 Fish cartel (Norway) Aug'11-Dec'12
Cement Mar’08-Aug’09 Pollock cartel Apr'06-Dec'12
Gas (LPG) n/a-2009 Fish cartel (Vietnam) Jun'08-Sept'13
Jute mills 2003-Jan'11 Salt cartel May'10-May'13
High and low tension pre-
stressed concrete poles Aug'09-May'11 Sausage cartel Jun'09-Dec'09
Poultry and egg industry 2007-Aug'10 Military uniform supply 2010-Jun'12
Newspapers Apr'08-Apr'09 South Africa
Vessels handling(ships) 2001-Mar'11 Fertilizers (phosphoric acid) Jan’03-Dec’07
Port construction May'09-Jul'10 Airlines (fuel surcharge)
May’04-
Mar'05
Ghee and cooking oil Dec'08-Jun'11
Airlines (So. Africa-Frankfurt
routes) Jan’99-Dec’02
Accounting services Apr'07-Jan'13 Milk (farm and retail) n/a-Jul’06
LDI operators Sep'11-Apr'13 Bread and flour 1994-2007
GCC approved medical
centers Jan'11-Jun'12
Pharmaceuticals (wholesale
distribution) 1998-2007
Banking services (1-Link
Guarantee Ltd) Sep'11-Jun'12 Tire manufacturing 1998-2007
Peru Metal (scrap) Jan’98-Jul’07
Urban public transportation 1 Aug'08-Oct'08 Steel (flat) 1999-Jun’08
Urban public transportation 2 Aug'08-Oct'08 Cement I 1996-2009
Public notaries n/a Plastic pipes 1998-2009
Dock work Sep'08-May'09
Concrete, precast pipes, culverts,
manholes, & sleepers 1973-2007
Insurance 1 Dec'01-Apr'02 Fishing n/a-2009
Insurance 2 Oct'00-Jan'03 Cement II Jan'04-Jun'09
Poultry May'95-Jul'96 Construction n/a-2009
Wheat flour Mar'95-Jul'95 Steel distribution n/a-2008
Heaters/boilers etc.
manufacturing Oct'95-Mar'96 Steel (re-bars, rods & sections) n/a-2008
Oxygen distribution
(healthcare) Jan'99-Jun'04 Steel (wire, wire products) 2001-2008
Freight transport Nov'04-May'09 Crushed rock n/a-2008
Russia Bricks n/a-2008
Fuel ( gasoline and jet) Apr’08-Jul’08 Steel (tinplate)
Apr’09-
Oct’09

___________________________________________________________________________________________
- 29 -
South Africa (cont.) Turkey (cont.)
Steel (mining roof bolts) 2002-2009 Accumulators n/a
Flour milling 2009-Mar’10 Ukraine
Bitumen 2000-2009
Acquisition of raw timber
auctions (furniture) 2011
Poultry 2005-2009 Sale of poultry meat n/a
Polypropylene plastic 1994-2009 Sale of sugar n/a
Sugar 2000-n/a Sale of alcohol n/a
Taxi n/a Sale of buckwheat n/a
Auto dealers 2005-n/a Individual insurance markets 2003
Healthcare fees 2002-2007
Market of services on sale of
arrested property state 2004
Pharmaceuticals n/a-2002 Zambia
Motor vehicle
manufacturers/importers n/a-2006
Pipes, culverts, manholes and
pre-stressed concrete sleepers. n/a
Freight forwarding n/a-2007 Oil marketing 2001-2002
Energy/switchgear n/a-2008 Fertilizer 2007-2013
Fertilizer (nitrogen) 2004-2006
Grain procurement and
marketing (maize-meal) Mar'04-Jun'04
Steel (reinforcing mesh) 2001-2008 Public transport n/a
Soda ashes (imports) 1999-2008 Poultry 1998-1999
Tanzania Panel Beating Services Sep'11-Dec'11
Beer n/a Zimbabwe
Pipes, culverts, manholes and
pre-stressed concrete sleepers n/a-2009 Bakeries n/a
Petroleum sector n/a-2000
Turkey
Daily newspapers n/a
Traffic lights n/a
Public transportation (buses) n/a
Poultry n/a
Bakeries n/a
Beer n/a
Soft drink n/a
Maritime transport service n/a-2004
Mechanical engineers n/a
Insurance n/a-2003
Telecommunications n/a-2002
Architects' and Engineers'
services n/a-2002
Yeast n/a
Cement n/a
Cement (Aegean region ) 2002-2004

___________________________________________________________________________________________
- 30 -
Appendix B - Questionnaire
FIRST PART. General questions
1) Annual budget of the competition policy enforcement unit during the period 1995-
201316
(in local currency);
SECOND PART. Identification of cartels.
2) Please, provide a list of major “hard core” cartels for the period 1995-2013;
3) For each identified cartel, provide information on:
a. Relevant market (product, geography, etc);
b. Names of cartel members;
c. Period of existence of the cartel (beginning/termination);
d. Date of discovery of the cartel;
e. Date of entry of each company in the cartel coalition, if available;
f. Fines applied, if any (in local currency);
g. Price overcharge by cartel members, if available (percentage with respect to
the cartel price or money terms in local currency)
THIRD PART. Economic data on each cartel identified in the second section of the
questionnaire.
1) At least for one period (month/year) of cartel existence indicate the market
share/volume sold and price (in local currency) of the product/ products for each
colluding company;
2) If possible, give an estimation of the average margin for the cartel = (price-marginal
costs)/price;
3) Please, provide, whether available, the estimate of the volume of the relevant market
(in local currency), if not:
4) According to the good that is analyzed, please provide an estimation of the total
market share of the non-cartel members on the relative market;
16
Time period is subject to change depending on the date when the competition authority started to be functioning.

___________________________________________________________________________________________
- 31 -
Appendix C - Example of the calibration and estimation procedure
Four national airlines, namely Varig, TAM, Transbrasil and VASP, were convicted in
collusive price-fixing behavior on the civil air transportation market between Rio de Janeiro
(airport Santos Dumont) and San Paolo (airport Congonhas) during the year of 1999. We do
not go into details concerning the evidence that the Brazilian competition authority employed
to convict a cartel but will rather focus on the estimation of the economic harm to consumers
caused by this anticompetitive practice.
Table C-1 below provides the collected data regarding the observed one-way ticket
prices charged by cartel members, as well as their observed market shares (based on number
of tickets sold). These are the minimal data that are sufficient to implement our methodology
and recover the price overcharges.
Table C-1: Input data (as of July 1999)
Airline Observed market
share
Average price of a one
way ticket, in Reals17
VARIG 46.6% 129.32
TAM 41.5% 124.90
Transbrasil 6.5% 106.85
VASP 5.4% 108.03
Source: Conselho Administrativo de Defesa Econômica (the competiton authority of Brazil)
We recognize that it would be more correct to separate leisure and business segments of
the demand, which would obviously have different sensitivities to price (parameter ),
however available data did not permit us to do so. Given that the share of business segment on
the relevant market reaches up to 70%, we believe that recovered market parameters will
correspond mostly to this demand category.
As the developed methodology implies, to perform calibration of supply and demand
parameters we need to set the share of the outside alternative ( ) and average cartel margin
exogenously. We use additional data on the case to set the admissible ranges for these
parameters.
17
Real – Brazilian national currency

___________________________________________________________________________________________
- 32 -
Considered airports are the only ones situated close to the city centers of Rio de Janeiro
and Sao Paulo, which makes them especially relevant for business passengers. In addition,
there are no convenient substitutes, such as sufficiently fast trains or buses. Airlines that
formed the cartel perform nearly 100% of the flights between the mentioned airports.
Therefore, one can assume that share of the outside alternative for the business segment
cannot be too big. However, presence of the leisure segment and other airports serving the
same origin and destination markets suggests that 0s cannot be too low either. We arbitrary
choose the admissible range for the share of the outside option as 0s [10%,50%].
As for the second exogenous parameter – average cartel margin, we first make use of
the results of Betancor and Nombela (2001), who demonstrate that marginal costs of
American and European airlines are at least equal and at most twice higher than their average
costs. We assume further that Brazilian airlines’ cost structure is not much different from that
in Europe and the U.S. Having extracted average costs from the annual reports of the
colluding companies, we get 40% as a maximal value for the average margin (when marginal
costs are equal to average costs). Given that airlines’ activities include also those non-
cartelized, we assume that possible margin on the cartelized market could potentially have an
upper bound above 40%. After a final check with sign constraints for marginal costs and
price sensitivity parameter , we define a permitted range for the average cartel margin as
[10%, 45%].
When one changes level of external parameters, then calibrated market parameters also
change. Along with the minimal and maximal bounds, considering some intermediary values
might be also reasonable if an analyst has an idea about the most probable values of
exogenous parameters inside the chosen interval. Therefore, in Table C-2 we provide
calibrated price sensitivity depending on the average cartel margin and share of the outside
option: for minimal, maximal and some intermediary values of external parameters. These
dependencies are monotonic. We also report corresponding calibrated values of Jjj ,1, in
Table C-3.

___________________________________________________________________________________________
- 33 -
Table C-2: Calibrated price sensitivity parameter ( )
Average cartel margin
10% 20% 35% 45% S
ha
re o
f th
e
ou
tsid
e o
pti
on
(S_
0)
10% 0.80 0.40 0.23 0.18
20% 0.40 0.20 0.11 0.09
35% 0.23 0.11 0.07 0.05
50% 0.16 0.08 0.05 0.04
Source: Simulations
Table C-3: Calibrated parameters of differentiation (j )
Average cartel margin/ 0s
Airline 10%/10% 45%/10% 10%/50% 45%/50%
VARIG 105.22 24.42 20.02 3.86
TAM 101.66 23.62 19.19 3.58
Transbrasil 85.30 18.54 14.43 1.08
VASP 86.06 18.56 14.44 0.94
Source: Simulations
We observe that calibrated parameter and Jjj ,1, decrease when the share of the
outside option increases, margins being fixed. This dependence follows directly from
equations C-1 and C-4 and can be explained as following. Lower indicates that
preferences of consumers are mostly driven by the quality rather than prices. Lower j ,
therefore, results in a higher number of consumers who preferred the outside option as its’
utility is normalized and remains fixed. also decreases with higher cartel’s margin - when
consumers are less sensitive to the price, cartel members have more incentives to charge a
higher price.
For the set of calibrated market parameters we further perform the simulation of the
counterfactual (competitive) state.18
Tables C-4 and C-5 below report the average for the
cartel price overcharge rates (formula (8)), and consumers’ welfare losses (formula (10))
estimated for a given combination of values of exogenous parameters.
18
We solve the system of non-linear equations implied by proposed methodology with the use of SAS routines
and procedures.

___________________________________________________________________________________________
- 34 -
Table C-4: Estimated price overcharge rate (average for the cartel)
Average cartel margin
10% 20% 35% 45%
Sh
are
of
the
ou
tsid
e o
pti
on
(S0
)
10% 7.3% 14.7% 26.2% 33.9%
20% 4.5% 9.2% 13.6% 21.8%
35% 4.8% 8.7% 18.2% 20.8%
50% 3.2% 6.5% 14.2% 18.9%
Source: Simulations
Table C-5: Estimated consumers’ welfare losses, %
Average cartel margin
10% 20% 35% 45%
Sh
are
of
the
ou
tsid
e o
pti
on
(S0
)
10% 78.6% 78.6% 78.6% 78.6%
20% 66.1% 66.1% 65.8% 66.2%
35% 50.4% 48.0% 52.8% 49.5%
50% 35.0% 35.2% 41.2% 42.2%
Source: Simulations
Variations of the obtained estimations of price overcharges and welfare losses according
to the level of external parameters are intuitive. On one hand, when cartel margin is being
fixed, a high share of the outside option informs the analyst about a high elasticity of demand.
In these conditions, the ability of colluding firms’ to increase their prices is very limited.
Accordingly, welfare losses are also les significant. On another hand, keeping the share of the
outside option fixed, higher desired cartel margin naturally transforms into a higher price
increase. Though, no definite conclusion can be made concerning the relative change in
consumers’ welfare.19
We acknowledge that variations of the estimates in Table C-4 and C-5 are quite large. Price
overcharge varies from 3.2% to 33.9%, while the welfare losses estimates range from 42.2%
to 78.6%. A greater precision can be gained provided that more precise inputs are at hands.
19
Increase in cartel’s margin decreases calibrated values of marginal costs (cartel prices are given), and also
decreases calibrated price sensitivity (see equation (3)). Left-hand side of equation (1) remains constant,
therefore, to compensate the decrease in , j should decrease too. In competitive state we cannot predict
whether )( c
jj p will increase or decrease for every product, because all three parameters have lower values.
Equation (1) indicates that if market shares in competitive state will be relatively higher with respect to the share
of the outside option, then welfare level will be also higher, and vice versa.