carroll county public schools - · pdf filecarroll county public schools . ... • middle...
TRANSCRIPT

Final Report December 11, 2013
CARROLL COUNTY PUBLIC SCHOOLS FACILITY UTILIZATION STUDY

Report Outline • Current Situation
• Instructional programs • Non-instructional programs • School grade configuration, size, capacity and utilization • Attendance zones • Enrollment projections
• Demographics • Capacity and Utilization • Community Input • Recommendations • Supporting Recommendations

Instructional Programs Elementary
• PreK – 5 general classes • Special Education • Specialty classes
Middle School • Team teaching • Specialty classes
High School • Block schedule • Career and Technology program

School Grade Configuration, Size, Capacity &Utilization Adequate: 85% to 100% Approaching inadequate: Elementary – 101% to 105% of capacity Secondary- 101% to 110% of capacity Inadequate: Elementary – Greater than 105% of capacity Secondary – Greater than 110% of capacity Approaching inefficient: 75% to <85% Inefficient: < 75%
Elementary PreK-5, 600 students
Middle School 6-8, 750 students
High School 9-12,1200 students

CCPS Capacity &Utilization Elementary Schools
SCHOOL SRC
CAPACITY
2013 SRC
UTILIZATION
2017-18 SRC
UTILIZATION
2022-23 SRC
UTILIZATION
Carrolltowne 598 89% 77% 92% Charles Carroll 320 84% 85% 97% Cranberry Station 570 86% 73% 82% Ebb Valley 591 85% 79% 89% Eldersburg 570 86% 76% 87% Elmer Wolfe 548 72% 61% 71% Freedom 525 94% 93% 105% Friendship Valley 527 97% 86% 99% Hampstead 576 61% 54% 64% Linton Springs 731 86% 81% 91% Manchester 727 79% 77% 86% Mechanicsville 616 89% 77% 93% Mt. Airy 598 83% 72% 77% Parr's Ridge 610 74% 67% 86% Piney Ridge 571 107% 95% 108% Robert Moton 608 65% 58% 68% Runnymede 654 79% 78% 85% Sandymount 527 85% 78% 87% Spring Garden 593 90% 78% 88% Taneytown 570 77% 72% 79% Westminster 593 86% 80% 93% Wm. Winchester 591 108% 90% 105% Winfield 722 76% 66% 78% ES TOTALS 13,536 84% 76% 87%

CCPS Capacity &Utilization Middle & High Schools
SCHOOL SRC CAPACITY
FUNCTIONAL CAPACITY
2013 SRC
UTILIZATION
2013 FUNCTIONAL UTILIZATION
2017-18 SRC
UTILIZATION
2017-18 FUNCTIONAL UTILIZATION
2022-23 SRC
UTILIZATION
2022-23 FUNCTIONAL UTILIZATION
Mt. Airy 870 770 76% 86% 79% 79% 60% 67% New Windsor 540 430 70% 88% 81% 81% 57% 71% North Carroll 870 770 71% 80% 82% 82% 66% 74% Northwest 870 770 60% 68% 65% 65% 51% 58% Oklahoma Road 891 845 93% 98% 88% 88% 71% 75% Shiloh 891 845 75% 79% 74% 74% 62% 65% Sykesville 828 745 95% 105% 101% 101% 83% 92% Westminster East 848 790 83% 89% 92% 92% 75% 80% Westminster West 1,146 1,045 82% 90% 95% 95% 76% 84% MS TOTALS 7,754 7,010 79% 87% 85% 85% 67% 75% Century 1,297 87% 88% 82% Francis Scott Key 1,254 80% 75% 74% Liberty 1,138 93% 98% 84% Manchester Valley 1,297 59% 59% 61% North Carroll 1,159 65% 64% 61% South Carroll 1,339 81% 86% 76% Westminster 1,838 86% 81% 76% Winters Mill 1,297 85% 92% 89% HS TOTALS 10,619 - 80% - 80% 75%
DISTRICT TOTAL 31,909 81% 78% 78%

Building Condition

Attendance Zones Elementary Schools
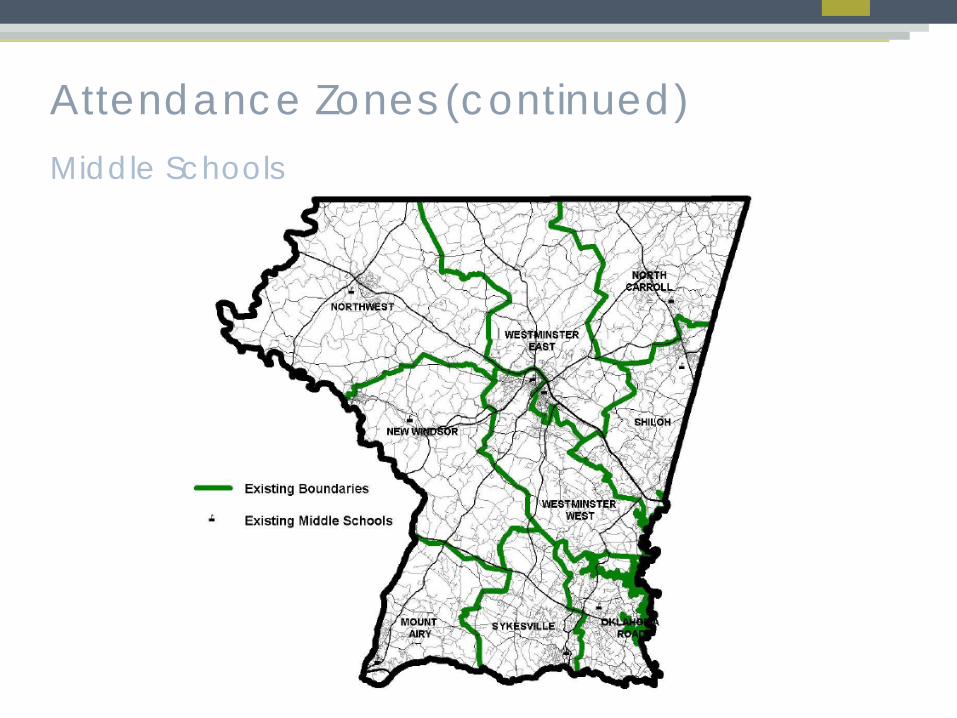
Attendance Zones (continued) Middle Schools

Attendance Zones (continued) High Schools
CENTURY HIGH
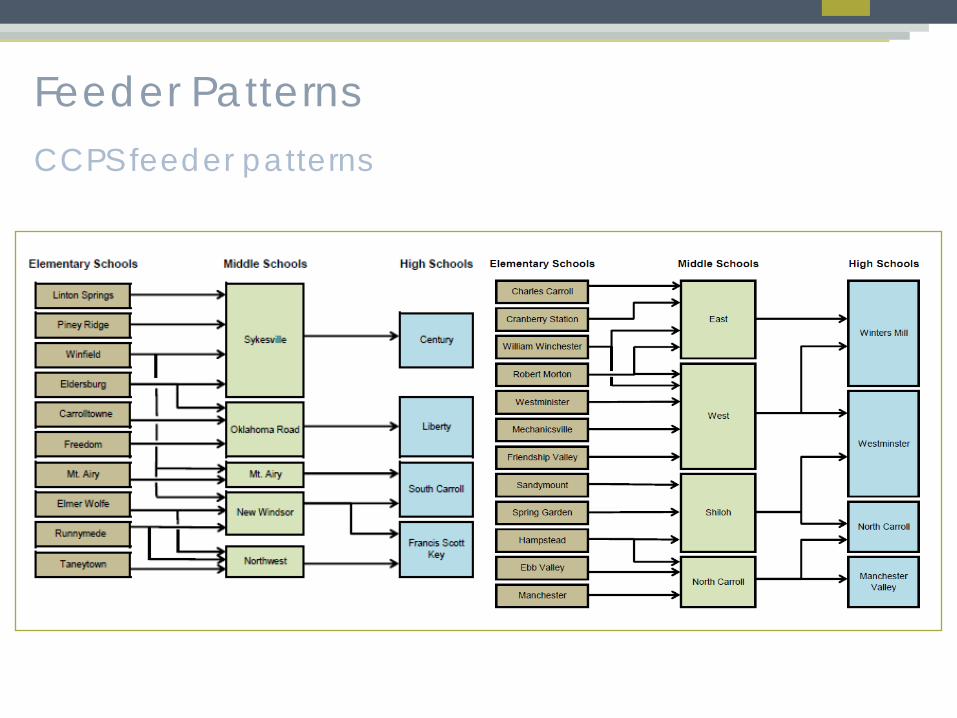
Feeder Patterns CCPS feeder patterns

CCPS Enrollment Projections Elementary Schools
SCHOOL ACTUAL 2013 ENROLLMENT
2017-18 PROJECTED
ENROLLMENT
2022-23 PROJECTED
ENROLLMENT
Carrolltowne 534 463 548 Charles Carroll 270 271 310 Cranberry Station 488 414 469 Ebb Valley 501 469 525 Eldersburg 489 432 495 Elmer Wolfe 395 336 389 Freedom 491 490 554 Friendship Valley 512 456 524 Hampstead 350 312 369 Linton Springs 627 592 662 Manchester 574 563 623 Mechanicsville 546 475 573 Mt. Airy 495 432 463 Parr's Ridge 451 411 525 Piney Ridge 610 545 618 Robert Moton 398 356 411 Runnymede 515 510 557 Sandymount 448 410 457 Spring Garden 534 462 524 Taneytown 439 408 448 Westminster 510 472 553 Wm. Winchester 639 533 618 Winfield 549 479 563 ES TOTALS 11,365 10,291 11,778

CCPS Enrollment Projections (continued) Middle & High Schools
SCHOOL ACTUAL 2013 ENROLLMENT
2017-18 PROJECTED
ENROLLMENT
2022-23 PROJECTED
ENROLLMENT
Mt. Airy 660 609 519 New Windsor 377 350 307 North Carroll 618 630 573 Northwest 522 500 447 Oklahoma Road 825 741 636 Shiloh 670 624 550 Sykesville 785 753 689 Westminster East 706 725 635 Westminster West 940 996 873 MS TOTALS 6,103 5,928 5,227 Century 1,128 1,141 1,058 Francis Scott Key 999 937 924 Liberty 1,061 1,117 960 Manchester Valley 761 760 797 North Carroll 751 745 713 South Carroll 1,091 1,156 1,011 Westminster 1,580 1,493 1,403 Winters Mill 1,102 1,188 1,150 HS TOTALS 8,473 8,537 8,016
DISTRICT TOTAL 25,941 24,755 25,021

MGT Enrollment Projections Elementary Schools
SCHOOL ACTUAL 2013 ENROLLMENT
2017-18 PROJECTED MGT
ENROLLMENT
2022-23 PROJECTED MGT
ENROLLMENT
Carrolltowne 534 471 443 Charles Carroll 270 270 244 Cranberry Station 488 442 429 Ebb Valley 501 454 435 Eldersburg 489 459 458 Elmer Wolfe 395 350 349 Freedom 491 469 479 Friendship Valley 512 433 420 Hampstead 350 370 375 Linton Springs 627 599 587 Manchester 574 591 570 Mechanicsville 546 471 506 Mt. Airy 495 430 440 Parr's Ridge 451 408 423 Piney Ridge 610 568 551 Robert Moton 398 341 374 Runnymede 515 501 501 Sandymount 448 410 410 Spring Garden 534 456 471 Taneytown 439 417 397 Westminster 510 469 489 Wm. Winchester 639 473 499 Winfield 549 499 536 ES TOTALS 11,365 10,348 10,384

MGT Enrollment Projections (continued) Middle & High Schools
SCHOOL ACTUAL 2013
ENROLLMENT
2017-18 PROJECTED MGT
ENROLLMENT
2022-23 PROJECTED MGT
ENROLLMENT
Mt. Airy 660 610 518 New Windsor 377 344 317 North Carroll 618 609 689 Northwest 522 497 438 Oklahoma Road 825 744 626 Shiloh 670 629 510 Sykesville 785 749 702 Westminster East 706 691 615 Westminster West 940 992 835 MS TOTALS 6,103 5,867 5,250 Century 1,128 1,150 1,055 Francis Scott Key 999 962 923 Liberty 1,061 1,123 955 Manchester Valley 761 798 825 North Carroll 751 703 669 South Carroll 1,091 1,150 978 Westminster 1,580 1,511 1,410 Winters Mill 1,102 1,142 1,080 HS TOTALS 8,473 8,540 7,893 DISTRICT TOTAL 25,941 24,755 23,528

Enrollment Projections Comparison CCPS and MGT grade-band totals
SCHOOL ACTUAL 2013 ENROLLMENT
2017-18 PROJECTED
ENROLLMENT
2022-23 PROJECTED
ENROLLMENT
CCPS ES Total 11,365 10,291 11,778
MGT ES Total 11,365 10,348 10,384
CCPS MS Total 6,103 5,928 5,227
MGT MS Total 6,103 5,867 5,250
CCPS HS Total 8,473 8,537 8,016
MGT HS Total 8,473 8,540 7,893
CCPS DISTRICT TOTAL 25,941 24,755 25,021
MGT DISTRICT TOTAL 25,941 24,755 23,528
MGT School Capacities Instructional Use Model
• Verification of existing inventory • Capacity as used • Applicable “scheduling factors”

CCPS/MGT School Capacities CCPS and MGT grade-band totals
SCHOOL SRC CAPACITY
FUNCTIONAL CAPACITY
MGT CAPACITY
ES Total 13,536 11,778
MS Total 7,754 7,010 6,170
HS Total 10,619 9,503
DISTRICT TOTAL 31,909 27,451

MGT Capacity and Utilization Elementary Schools SCHOOL MGT
CAPACITY 2013 MGT
UTILIZATION
2017-18 MGT PROJECTED
UTILIZATION
2022-23 MGT PROJECTED
UTILIZATION
Carrolltowne 496 108% 95% 89% Charles Carroll 282 96% 96% 86% Cranberry Station 520 94% 85% 83% Ebb Valley 542 93% 84% 80% Eldersburg 521 94% 88% 88% Elmer Wolfe 390 101% 90% 89% Freedom 474 104% 99% 101% Friendship Valley 501 102% 86% 84% Hampstead 483 73% 77% 78% Linton Springs 651 96% 92% 90% Manchester 607 95% 97% 94% Mechanicsville 521 105% 90% 97% Mt. Airy 503 98% 86% 88% Parr's Ridge 474 95% 86% 89% Piney Ridge 498 123% 114% 111% Robert Moton 525 76% 65% 71% Runnymede 561 92% 89% 89% Sandymount 456 98% 90% 90% Spring Garden 573 93% 80% 82% Taneytown 455 96% 92% 87% Westminster 542 94% 87% 90% Wm. Winchester 542 118% 87% 92% Winfield 664 83% 75% 81% ES TOTALS 11,778 96% 88% 88%

MGT Capacity and Utilization (continued) Middle Schools
SCHOOL MGT
CAPACITY
2013 MGT
UTILIZATION
2017-18 MGT PROJECTED
UTILIZATION
2022-23 MGT PROJECTED
UTILIZATION
Mt. Airy 722 91% 84% 72% New Windsor 394 96% 87% 80% North Carroll 698 89% 87% 99% Northwest 589 89% 84% 74% Oklahoma Road 722 114% 103% 87% Shiloh 651 103% 97% 78% Sykesville 698 112% 107% 100% Westminster East 751 94% 92% 82% Westminster West 945 99% 105% 88% MS TOTALS 6,170 99% 95% 85%

MGT Capacity and Utilization (continued) High Schools
SCHOOL MGT CAPACITY
2013 MGT
UTILIZATION
2017-18 MGT PROJECTED
UTILIZATION
2022-23 MGT PROJECTED
UTILIZATION
Century 1,189 95% 97% 89% Francis Scott Key 1,121 89% 86% 82% Liberty 975 109% 115% 98% Manchester Valley 1,163 65% 69% 71% North Carroll 1,046 72% 67% 64% South Carroll 1,189 92% 97% 82% Westminster 1,635 97% 92% 86% Winters Mill 1,185 93% 96% 91% HS TOTALS 9,503 89% 90% 83%
DISTRICT TOTAL 27,451 94% 90% 86%

Community Input Interviews with key staff and community leaders
• Budget issues generated by the decreasing enrollment. • Varied size of schools and/or school utilization. • Feeder patterns that are confusing and difficult for student
relationships. • The need for more space in the Career and Technology
Center. • Concerns about having equitable programs. • Age and condition of some of the buildings. • Lack of proper program spaces for career and technical
education. • The possibility of sharing space with some community
programs.

Community Input
Community at-large input • Feeder Patterns could/should be improved • Equitable and Accessible Facilities especially in places
where the facilities are not ADA accessible. • Safety is an issue. This is a general concern. • Community usage. Co-locate public facilities with
restrictions. • Process/procedures. Clear criteria and process for
decision making.

Conclusions
Utilization overall is 86%
Utilization at specific schools is an issue • Manchester Valley and North Carroll HS • Piney Ridge ES • Liberty HS
Condition at specific schools is an issue • Charles Carroll and William Winchester ES • East and West MS

Solutions Factors to consider in the development of solutions: • Total projected utilization at each school level falls within reasonable
levels • Elementary School 88% • Middle School 85% • High School 83%
• Individual schools at each level fall below and above reasonable utilization levels
• Condition / suitability issues have an effect on overall planning at some schools
• Capacity of schools varies a great deal at each level: • 282 – 664 elementary schools • 394 – 945 middle schools • 975 – 1,635 high schools
• Enrollment at the Career and Technology Center skews the overall utilization at high schools
• Feeder patterns are not consistent

Cut Points 2 Issues
Cut Points
Utilization Condition
First Priority >110% < 75% < 1400
Second Priority >100% < 85% <1500

Utilization Issues
First Priority:
Manchester Valley High School North Carroll High School Liberty High School Piney Ridge & Robert Moton Elem. Schools
Second Priority:
Mt. Airy, Northwest, Oklahoma Rd., Sykesville, & West Middle Schools Ebb Valley, Hampstead & Spring Garden Elem. Schools
Condition Issues
First Priority:
Charles Carroll Elementary School
Second Priority:
William Winchester Elementary School East Middle School West Middle School

First Priority Utilization Options Manchester / North Carroll
Close a HS • Counter to overall utilization
Leave as is • Continue to fill North Carroll with other programs
Redistrict • Align North Carroll HS with Shiloh MS • Align MVHS with North Carroll MS and some of WMHS

First Priority Utilization Options Liberty HS/Piney Ridge ES/Robert Moton ES
• Leave as is
• Redistrict
• Monitor over time

First Priority Condition Options Charles Carroll
Close and Redistribute Students • Counter to Community Desires
Renovate or Replace • Small Enrollment
Combine with Other Needs • Address Multiple Needs
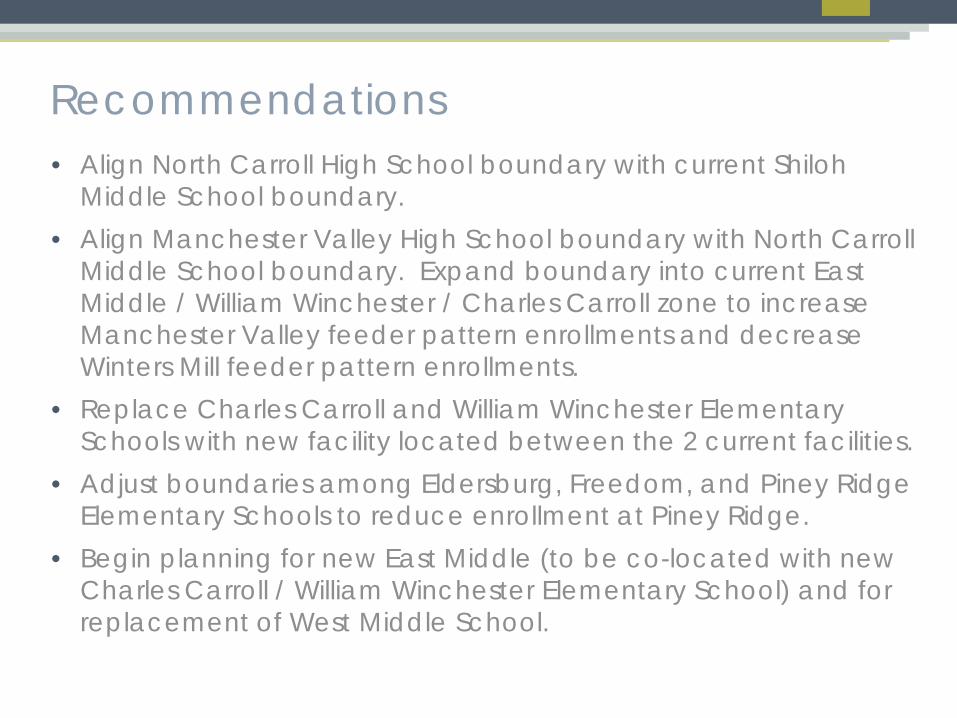
Recommendations • Align North Carroll High School boundary with current Shiloh
Middle School boundary. • Align Manchester Valley High School boundary with North Carroll
Middle School boundary. Expand boundary into current East Middle / William Winchester / Charles Carroll zone to increase Manchester Valley feeder pattern enrollments and decrease Winters Mill feeder pattern enrollments.
• Replace Charles Carroll and William Winchester Elementary Schools with new facility located between the 2 current facilities.
• Adjust boundaries among Eldersburg, Freedom, and Piney Ridge Elementary Schools to reduce enrollment at Piney Ridge.
• Begin planning for new East Middle (to be co-located with new Charles Carroll / William Winchester Elementary School) and for replacement of West Middle School.

Supporting Recommendations • Monitor utilization rates annually and adjust attendance boundaries
as necessary. • Coordinate attendance boundary adjustments to improve feeder
patterns. • Reduce number of relocatables in accordance with the
“Relocatable Utilization Plan 2012”. • Determine future delivery model of Career and Technology
programs. Plan for modernization of Career and Technology Center/Facilities.

Resulting Enrollment / Utilization School 2017-18 Enrollment 2017 -18 Utilization Manchester Valley HS 963 83% North Carroll HS 859 82% Westminster HS 1,325 81% Winters Mill HS 1,049 89% Shiloh MS 629 97% North Carroll MS 646 93% East MS 654 87% West MS 992 105%
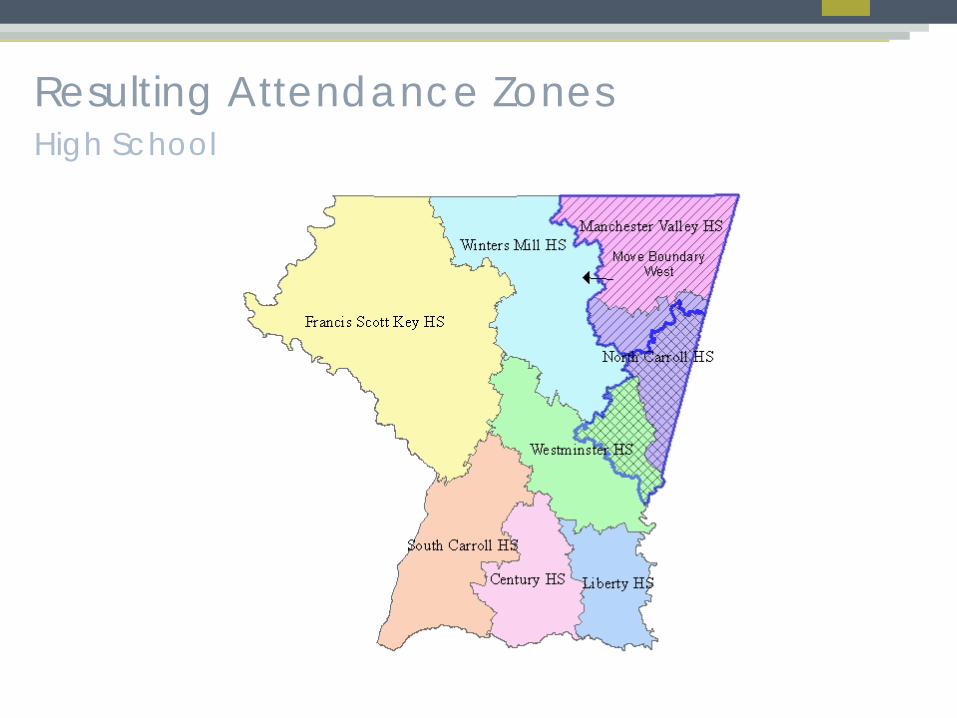
Resulting Attendance Zones High School

Thank you on behalf of MGT! Questions?