carrece o ?eociev10e - boem12 rfl/1iaeti2la carrece o ?eociev10e northern gulf of mexico ... pa...
TRANSCRIPT

LEX\12 rfl/1IAEti2LA carrEcE O ?EOCIEV10E
NORTHERN GULF OF MEXICOTOPOGRAPHIC FEATURES
STUDY
FINAL REPORT
VOLUME ONE
Submitted to theU.S. Department of the Interior
Bureau of Land ManagementOuter Continental Shelf Office
New Orleans, Louisiana
Contract No. AA551-CT8-35
Department of OceanographyTexas A&M UniversityCollege Station, Texas
. . Technical Report N“:. 81-2-T
Research Conductedthe Texas AGM Research
MARCH 1981
ThroughFoundation
,/


●
● “.
*
●
.
0.
NORTHERN GULF OF MEXICO
TOPOGRAPHIC FEATURES
STUDY
FINAL REPORT
VOLUME ONE
Submitted to theU .S. Department of the Interior
Bureau of Land Management -
Outer Continental Shelf OfficeNew Orleans, Louisiana
Contract No. AA551-CT8-35
Department of OceanographyTexas A&M UniversityCollege Station, Texas
Technical Report No. 81-2-T●
Research Conducted Throughthe Texas A&M Research Foundation
.
●✎
MARCH 1981

● ‘* * ● ● ● ● ‘ ● “ ●
.
B-.
8
●
● ✎
●
This volume has been reviewed by the Bureau of Land Management andapproved for publication. Approval does not signify that. the contentsnecessarily reflect the views and policies of the Bureau, nor doesmention of trade names or commercial products constitute endorsement orrecommendation for use.
.
●✎

‘*” ● ‘a “

●
CONTRIBUTORS
PROGRAM MANAGER
.
●
.
●
9
e
.
Joseph U. LeBlanc
PROJECT CO-DIRECTORS
Richard Rezak Thomas J. BrightGeological Oceanography Biological Oceanography
PRINCIPAL INVESTIGATORS
Thomas J. BrightLarry J. DoyleStefan GartnerChoo S. GiamThomas W.C. HildeThomas S. HopkinsJoseph U. Lef31ancDavid W. McGrail
ASSOCIATES “
Patrick L. ParkerBobby J. PresleyRichard RezakRichard S. ScalanWilliam W. SchroederJohn C. SteinmetzJ. Kenneth Winters
William BandyDan BoatwrightGreg BolandPaul BootheCindy B uddenbergYu-Hsin ChenChristopher CombsGeorge DennisGuy DenouxJan DonleyMary FeeleyFern HalperDale HarberJeff HawkinsSylvia HerrigDoyle HomeY. HrungDavid HuffJohn S. JenkinsMing-Jung Jiang
EDITOR
Rose Norman
James KendallCathy KnebelChao-Shing LeeArlette LevitanLarry AlartinGreg MinneryGrace NeffRose NormanJudy PateLinda PequegnatEric PowellDavid RischLauren SahlJohn S. Schofie!dGeorge SharmanJames StasnyRobert J. TaylorSusan WagnerSteve ViadaWei WangWaris Warsi

.● ’ a

● “ VOLUME ONETABLE OF CONTENTS
CONTRIBUTORS (Volumes One-F ice) . . . . . . . . . . . . . . . . . .
LIST OF FIGURES ● . ● . . . . . . . . ● ● ● ● . . . ● .*.. . . . . . . ● . ● . .
LIST OF TABLES . . . . . . . ● ● . . . ● . . . . . . . . . . . . . . . . . . . . ● .
LIST OF TABLES IN APPENDIX A . . . . . . . . . . . . . . . . . . . . .
Chapter
1.
Il.
1[1.
●
Iv.
v.
VI*
lNTRODU~lONSTUDIES ● ● ● ● ● ● * ● ● ● . ● ● ● ● * ● . . . . . ● ● . . . . . ..* . . . ● *..*BACKGROUND ● ● * .*CO ● ● ● ● ● .0 . . . . ● . . ● . . ● ● . ● .* . . . . . . .
PROGRAM MANAGEMENTINTRODLK710N . ● . . ● . . . . . . . . . . . . ● . . . . . . . . . . . .0 ● * , .PROJECT MANAGEMEMT ● . . * . ● . . . . ● . . . . . . . ● . .0 ● . ● *. .*DATA MANAGEMENT ● ● . . ● . . . . . . . . . ● . . . . . . . . . . . . . . . . .DISCUSSION ● ● . . . . . ● . . . . . . . . . . . . . . . . ● . . ● . . ● .** . .0RECOhMdENDAT IONS . . . . ● . . ● . . . ● ● . . . . . . . . . . . . . .* . . . .
GEOLOGYlNTRODU~lON . . ● ● . ● . . . . ● . . . ● . . . ● . . . ● . . , , . ● . . . . , ●
SALT DIAPIRISM . . . ● “ ● ● ● . . ● . ● ● . . . . ● ● . .* ● . ● . . . . , . .MECHANICS OF DIAPIRISM. . . . . . . . . . . . . . . . . . . . . . . . .ORIGIN OF CAP ROCK ● . . . . . . ● . . ● . . . . . . . . . . ● . . . . . .*EVIDENCE FOR CRESTAL COLLAPSE . . . . . . . . . . . . . . . . . .CLASSIFICATION OF SALT DOMES . . . . . . . . . . . . . . . . . . .SEDIMENTOLOGY . . . ..* . , . . . . ,. . . . . . . . ● . . . . . . . ● .**.
CATEGORIZATION AND ENVIRONMENTAL RANKING OFHARD-BOTTOM BIOTIC ZONES AND BANKS
lNTRODUCl_lON . . . . . . . . . ● . . , . . ● . . . ● , . . . ● .* ● . ● . . . . ,BANK CATEGORIES ● . , . . . . . . . . . ● . . . . . . , . * . . ...*.. . .ENVIRONMENTAL PRIORITY RATINGS . . . . . . . . . . . . . . . . .
WATER AND SEDIMENT DYNAMICSINTRODUCTION . ● . . . . , . . . . . . ● . . . . . ● . . . ● . ● . ● ● . ● . . . . ●
PERSPE~lVES FROM GEOPHYSICAL FLUIDDYNAM 1 CS . . . . . . , . , . . . . . ● . . ● ● . . . ,*** . ..* . ● , . . . .
THE EVIDENCE ● . ● ● . , . . . , ● ● . . ● . . ● . . . . . ● . . . ,. . . . . .*
SUMMARY AND RECOMMENDATIONSINTRODUCTION . . . ● . ● . . . ● . . . ● . . . . . . . . . ● ● . ● ● * ● ● . . . .EAST FLOWERG ARDENBANK.. ,. . . . . . . . . . . . . . . . . . . . .COFFEE LUhlP BANK . . . . . . . . . . . . . . . . . . . . ● . . . . . . . ● , . .FISHNET BANK . . . . . . . . . . . . . . . . , . . . . . . . ● . . . ● .**.**DIAPHUS BANK . ● . . . ● . . . * . . ● . . . ● . . ● **** . . . . . . * . . . ,
Page
iii
vi
viii
viii
12
6‘714 “1921
23232627282931
616163
66
6671
7474767677
“\

v
Chapter
VI* SUMMARY AND RECOMMENDATIONS (Continued)JAKKULA BANK . ..0..0.. . ..0..... .*. o* ,000 . . . . . . . . .ELVERS BANK .* ...*.. . . . . . . . . . . . ...0. . . . . . . . . ..*. O
GEYER BANK ● ● . ● . . . . ● ● . . ● ● ● ● ● ● . . . . . . . . ● . , . . ● *.. . . .REZAK-StDNER BANK ● * ● ● . ● ● ● . . ● . . . . ● ● * ● . ● * . . . . . . . . ●
ALDERDICE BANK . ● ● . . . . . . ● . . . ● . .0 . . ● ● . . . . ● * . . ● . , . .32 FATHOM AND APPLEBAUM BANKS . . . . . . . . . . . . . . . . . . .
REFERENCES: Volumes One-F ice . . . . . . . . . . . . . . . . . . . . . . . . . .
APPENDIX A ● ● . , ● . . . . ● . ● . . . ● ● . . . ● .* ● ● ● . . ● . ● ● * . . . 9 . ● . . . ● . .
Page “*
787879808081
82
A-1
●
●
.
●.

vi
LIST OF FIGURES IN VOLUME ONE
Figure PageCHAPTER [11
[11-1 Location map of topographic features mappedsince 1974 ● . ● . ● ● . ● ● . . . ● . . . . ● . ● . ● . . ● . ● ● . . . . . . . . . . 35
III-2
III-3
East Flower Garden Bank bathymetry . . . . . . . . . . . . . . 36
Three-dimensional perspective views, EastFlower Garden Bank . ● .*.... . . . . , . . . . . . . . . . . . . . . . ● 37
West Flower Garden Bank bathymetry . . . . . . . . . . . . . . 38●
III-4
III-5 Three-dimensional perspective views, WestFlower Garden Bank.... . . . . . . . . . . . . . . . . . . . . . . . . . . 39
III-6
III-7
Coffee Lump bathymetry. . : . . . . . . . . . . . . . . . . . . . . . . . 40
Three-dimensional perspective views, CoffeeLump . . . . . . . . . . . . . . . . . . . . . . . . . . . . . . . . . . . . . . . . . . . . 41.
III-8
III-9
Geyer Bank bathymetry. . . . . ● . . ● . . . . . ● . . . . . . . . . . . , 42●
Three-dimensional perspective views,Geyer Bank . . ● . . . . ● ● . . . . ● ● ● . . . . . ● . . . . . . . . . . . . ● . . . 43
Ill-1o
III-11
Elvers Bank bathymetry . . . . . . . . . . . . . . . . . . . . . . . . . . 44
Three-dimensional perspective views,EIvers Bank . . . . . . . . . . . . ● *. . . . . . ● . . . . . . . . . . . . . . . . 45
III-12
III-13
Rezak-Sidner Bank bathymetry . . . . . . . . . . . . . . . . . . . . 46
Three-dimensional perspective views,Rezak-Sidner Bank . ● . . . . . . . ● . . . . ● . . . . . . ● . ● . , ● . . . . 47●
III-14
III-15
Fishnet Bank bathymetry. . . . . . . . . . . . . . . . . . . . . . . . . 48
Three-dimensional perspective views,Fishnet Bank . . . . . . . . . . . . . . . . . . . . . . . . . . . . . . . . . . . . 49
11[-16
III-17
Al derdice Bank bathymetry. . . . . . . . . . . . . . . . . . . . . . . 50
Three-dimensional perspective views,Al derdice Bank . . . . . . . . . . . . . . . . . . . . . . . . . . . . . . . . . . 51
111-18
III-19
Jakkula Bank bathymetry. . . . . . . . . . . . . . . . . . . . . . . . . 52
Three-dimensional perspective views,Jakkula Bank . . ● . . . . . ● . . . . . . ● . ● O* . . . ● . . . . . . , ● . ● ● . 53
●

vii
F
I
gure
1-20
III-21
III-22
11 !-23
111-24
III-25
v-1
PageCHAPTER III (Continued)
Diaphus Bank bathyme try . . . . . . . . . ..a.. . . . . . . . . . . . 54
Three-dimensional perspective views,Diaphus Bank . . . . . . . . . . . . . . . . . . . . . . . . . . . . . . . . . . . . 55
32 Fathom Bank bathymetry. . . . . . . . . . . . . . . . . . . . . . . 56
Three-dimensional perspective views,32 Fathom Bank . . . . . . . . . . . . . . . . . . . . . . . . . . . . . . . . . . 57
Applebaum Bank bathymetry* . . . . . . . . ..0000 o.~. 0=.. 58
Three–dimensional perspective views,Applebaum Bank . . . . . . . . . . . . . . . . . . . . . . . . . . . . . . . . . . 59
CHAPTER V
Location of current meters, EastFlower Garden Bank..... . . . . . . . . . . ..s. .= . . ..as. ● . 73
“ ’
●
.
*
●

viii
●
●
Tabl e
11-1
!1-2
II-3
II-4
II-5
11 l-1
II I-2
lv-
IV-2
IV-3
111-1
II I-2
II I-3
II I-4
11 l-s
LIST OF TABLES \N VOLUME ONE
Pa g’eCHAPTER 1!
Reports and Plans Prepared for TAMRF & E3LM . . . . .
Breakdown of Contract Modif icat ion . . . . . . . . . . . . .
Pls, Associates, and Subcontractors . . . . . . . . . . . .
Changes in Period of Performance. . . . . . . . . . . . . . .
Summary of Cruises . . ..o . . . . . . . . . . . . . . . . . . . . . . . .
CHAPTER 111
Summary of Banks Studied: . . . . . . . . . . . . . . . . . . . . . .
Cl ass if icationof Salt Domes . . . . . . . . . . . . . . . . . . .
CaGu
CHAPTER IV
egories and Zones of Hard-Banks in thef of Mexico . . . . . . . . . . . . . . . . . . . . . . . . . . . . . . . . .
Priority Rankings of Biotic Zones ofHard-Banks in the Gulf of Mexico . . . . . . . . . . . . . . .
Priority Ratings For Each Bank (Listedin descending order of environmentalpriority) . . . . . . . . ..* . . . . ..****. . . . . . . ● * . . B . . . . .
LIST OF TABLES IN APPENDiX A
Sediment Particle Types and PercentCarbonate . . . . . . . . . . . . . . . . . . . . . . . . . . . . . . . . . . . . . .
X-ray Diffraction of Suspended Sediments . . . . . . .
X-ray Diffraction of Bottom Sediment< .clo2 mm . . . . . . . . . . . . . . . . . . . . . . . . . . . . . . . . . . . . . ●
X-ray Diffraction of Bottom Sediment> .062 mm . . . . . . . . . . . . . . . . . . . . . . . . . . . . . . . . . . . . . .
9
10
11
12
15
24
31
60
64
65
A-1
A-3 ~
A-Q
A-5
Bottom Sediment Texture. . . . . . . . . . . . . . . . . . . . . . . . A-6
●

●
“e
●
.
●.

I1
CHAPTER I
INTRODUCTION
J. LeBlanc
I
10
e-
STUDIES
This report was prepared to satisfy the tasks specified in theU .S. Department of the Interior (DO I} , Bureau of Land Management (BLM)Contract #A A551-CT8-35. The contract was awarded in August 1978 toTexas A&M University (TAMU) through the Texas A&M Research Foundation(TAMRF) . Subcontracts were subsequently awarded to the University ofAlabama at Birmingham (UAB] , Dauphin Island Marine Laboratory; the Uni-versity of Texas at Austin (UTA) , U.T. Marine Science Institute(UTMS1 ) ; the University of South Florida (USF) at Tampa; and severalprivate service organizations including LGL, Inc., Oceanonics, Inc.,Sealfleet Operations, Inc. , and Lorac Service Corp.
The main purpose of the study was to gather data from selectedareas and topographic features in the Gulf of Mexico, and then reduce,map, analyze, synthesize, integrate, and report findings and conclu-sions. Geological, chemical, physical, geophysical, and biologicaloceanographic data were collected from the Florida Middle Ground (offthe west Florida coast) and from twelve topographic features off theLouisiana-Texas coast: Alderdice, Applebaum, Coffee Lump, Diaphus,Elvers, East Flower Garden, Fishnet, Geyer, Jakkula, Rezak-Sidner, WestFlower Garden, and 32 Fathom Banks.
This report presents the findings of the work performed during the
●period August 1978 to November 1980 and extends the efforts begun in1961 by researchers from TAMU on a cruise to the West Flower GardenBank conducted by R. Rezak on the R/V HIDALGO.
●
[n previous BLM-funded studies, beginning in 1974, TAMU ocean-ographers characterized the geology and biology of 28 banks in thenorth w’estern Gulf of Mexico. The present study adds eight banks tothis list and provides additional information on four banks previouslystudied: Applebaum (previously called Little Sister), 32 Fathom, andthe East and West Flower Garden Banks.
Descriptive reconnaissance studies were completed in 1978 forthe Florida Middle Ground and Alderdice, Applebaum, Coffee Lump, Dia-phus, Elvers, East Flower Garden, Fishnet, Geyer, JakkuIa, Rezak -Sidner, West Flower Garden, and 32 Fathom Banks. These studies as-sessed the geology and biology of the banks as observed from the sub-mersible DRV DIAPHUS. In addition, a variety of special studies wereconducted at Alderdice, Coffee Lump, Diaphus, East and West Flower Gar-den, Fishnet, and Jakkula Banks. Chemical analysis of sediments fortrace metals, high molecular weight hydrocarbons, Delta C-13, and totalorganic carbon was conducted for Coffee Lump and the East and WestFlower Garden Banks. At the East and West Flower Garden Banks, chem-ical analysis of Spondylus and certain fish species for trace
●

metals and high molecular weightStudy of the size distribution and
2
hydrocarbonsmineralogy of
ments was done at Alderdice, Applebaum, Coffee
was also undertaken.the surrounding sedi-LumD. DiaRhus. East
Flower Garden, Fishnet, Jalskula, and 32 Fathom 13anks. Chemical analy-ses of the water column for nutrients, dissolved oxygen, and low molec–ular weight hydrocarbons were done at the East and West Flower GardenBanks. The study of the distribution of reworked fossil coccoliths onthe South Texas Outer Continental Shelf, initiated during 1976 underBLM Contract #A A550-CT6-18, was continued.
The East Flower Garden Monitoring study was continued and resultedin data in the following areas: coral and coral line algae populationestimates; growth and mortality of hermatypic corals; recruitment andearly growth of corals; coelenterate larvae and other zooplankton;leafy algae populations; and the brine seep.
Studies at the West Flower Garden Bank included mapping, hydro-carbon analysis, and monitoring. The new maps ( generated through moresophisticated techniques than were previously available) and the re-sults of hydrocarbon analysis are reported herein. The monitoringstudy, identical to that at ‘the East Flower Garden Bank, was initiatedunder the present contract, but reports on these studies were earmarkedfor BLM Contract #AA851-CTO-25.
This report is organized in six volumes. Volume One includes a—chapter on program management, special chapters on geological, biolog-ical, and hydrographic studies, and a summary and recommendations chap-ter. Volume Two contains a general methods chapter and chapters onchemical analyses and the fossil coccolith study. Volume Three is de-voted entirely to the East and West Flower Garden Banks, and VolumeFour reports the geological and biological characterization of tenother banks in the northern Gulf of Mexico, each one comprising a. sep-arate chapter. Volume Five includes all data from the Florida MiddleGround study, inciuding methods, mapping, physical and chemical ocean-ography, geology, and biology. The last volume is an Executive SummaryReport.
BACKGROUND
The U.S. Department of the Interior has been mandated by federalstatutes to conduct critical or information gathering studies in watersadjacent to the continent. The information from such studies is usedto make policy and management decisions on oil and gas related activi-ties in the open waters. The Office of Management and Budget (OMB) hasa priority system to rank all mandated and/or critical studies, and theGovernment Accounting Office (GAO) oversees the expenditure of fundsapproved by the United States Congress. The Bureau of Land R4anagement,U.S. Geological Survey (USGS), and others are responsible for the DO Istudies.
The Department of Transportation (DOT) has been mandated othersea-related responsibilities handled by the U.S. Coast Guard (USCG) .l-he Environmental Protection Agency (EPA), Department of Commerce
. .
●
.
-*
●
●
●

3
!9
●
.
● ✍
●
●✎
(DOC) , Department of Defense (DOD) , and others have also been mandatedresponsibilities related to pollution, marine environments, and marineresources. These mandated responsibilities are sometimes overlappingand have affected progress in some marine studies.
The relevant public laws, acts, or orders include:
Clean Air Act of 1963, 42 USC 1857 et seq., PL 88-206 (Agency:EPA); amended: 1966, 42 USC 1857c,
——18571, PL 89-675; 1970, 42 USC
1857b et seq. , PL 91-604; 1977, 42 USC 7401 et seq. , PL 95-95..—
Clean Water Act of 1977, 33 USC 1251 et seq. , PL 94-217 (Agency:EPA).
——
Coastal Zone Management Act of 1972, 16583 (Agency: DOC, National Oceanographic[NOAA] , and Office of Coastal Zone Management16 USC 1451,1453 et seq., PL 94-370.——
USC 1451 et seq., PL 92-and Atnlo~h~c Agency[OCZM]); amended: 1976,
Deepwater Port Act of .1974, 33 USC 1501, PL 93-627 (Agency: DOC,NOAA) .
Endangered Species Act of 1973, 16 USC 1531-43, PL 93-205 (Agency:DOI, Fish and Wildlife Service [FWS] ; and DOC, National Marine Fish-eries Service [NMFS] ).
Environmental Quality improvement Act of 1970, 42 USC 4371 etseq. , PL 91-224 (Agency: EPA).
—
Federal Water Pollution Controi Act of 1960, 33 USC 1251 et seq.,PL 92-500 (Agency: EPA); amended: 1961, 33 USC 466 et seq., pL 87-88;1972, 33 USC 1251 et seq., P1- 92-500.
.———
Fishery Conservation and Management Act of 1976, 16 USC 1801-1883,PL 94-265 (Agency: DOC, Regional Fishery Management Councils; DOT,USCG).
Land and Water Conservation Fund Act of 1965, PL88-578, 16 USC460d, 4601-4 et seq. (Agency: DOI, FWS).——
Marine Mammal Protection Act of 1972, 16 USC 1361 et seq. , PL 92–522 (Agency: Marine Mammal Commission; DOI, FWS; DOC, NMFS).
Marine Protection, Research, and Sanctuaries Act of 1972, 33 USC1401 et seq. , PL 92-532 (Agency: EPA)..—
Marine Resources and Engineering Development Act of 1966, 33 USC1101 et seq. , PL 89-454 (Agency: National Council on Marine Resources.—& Engineering Development; Commission on Marine Science, Engineering 8Resources) .
National Environmental Policy Act of 1969, 42 USC 4321 et seq., FL91-190 (Agency: Council on Environmental Quality [CEQI ).
●

4
. .
●
Natural Gas Act [Emergency), PL 95-2, 91 stat. 4 (Agency: FederalEnergy Regulatory Commission [FERC] ).
Natural Gas Act (Hinshaw) , 15 USC 717, 68 stat. 36 (Agency:FERC).
Natural Gas Policy Act of 1978, 92 stat. 3350, PL 95-621 (Agency:FERC).
“@
National Historic Preservation Act of 1966, 80 stat. 915 (Agency:Advisory Council on Historic Preservation; USGS); amended: 16 USC 470et seq. , PL 89-665.——
Natural Gas Pipeline Safety Act of 1968, 4990-481 (Agency: DOT, Technical Pipeline Safetyamended: 1976, 49 USC 1671, 1674, 1680. 1683 et49 USC 1674, 1684, PL 93-403.
—
USC 1671 et seq. , PLStandards ~o=ttee); 9seq. , PL 94-477; 1974,
Oil Pollution Act of 1961, 33 USC 1001 et seq. ,13ureau of Customs; DOT, USCG}; amended: 1973, 33
——
93-119.
Outer Continental Lands Act of 1953, 67 stat.BLM).
PL 87-167 (Agency:USC 1001 et seq., PL_— *
462 (Agency: DOI,.
Outer Continental Oil Shelf Lands Act of 1978, 43 USC 1331 etseq. , PL 95-372 (Agency: DOI, BLM).
— -*
Ports and Waterways Safety Act of 1972, 33 USC 1221, PL 92-340(Agency: USCG).
In addition to the above cited acts, international agree ment~ havealso been executed as a result of the 1954 international Convention forthe Prevention of Pollution of the Sea by Oil, the 1958 Geneva Conven-tion on the Continental Shelf, and others. These agreements and actsillustrate the complexities of actions and/or studies and the require-ments for executive level decisions on matters related to the oil andgas development process.
With few exceptions, the process includes: 1) exploration by pri-vate or public enterprises; 2) leasing by the BLM Outer ContinentalShelf (OCS) Office; 3] exploratory and development drilling by thelease owner; 4) completion of units, and production and distribution ofhydrocarbons by lease owner; and 5) distribution of funds as per leaseagreement.
During the exploration phase, survey cruises are deployed to theproposed OCS leased areas for gathering seismic and geological data.These data are reduced, processed, analyzed, and synthesized by poten-tial lease owners to determine the potential and economics of oii andgas production. To exploit these resources, potential lease owners mustbid for the proposed areas through BLM. Bidding is required before ex-ploratory drilling can commence on the federally owned OCS lands.
●✎
●

● 5
● “
●
Other requirements must also be met, including those of BLM, USGS, EPA,DOT, and NOAA.
Once these requirements are met, exploratory dri!ling can com-mence, with an average of four exploratory wells per tract beingdrilled. This exploratory process will confirm the quantity and qual–ity of hydrocarbons to determine the range and extent of the oil andgas reservoirs and also to determine optimal locations for productionplatforms. Then the lease owner prepares and submits development plansto the USGS and other agencies to determine compliance with safety andenvironmental specifications. These plans are approved, productionplatforms are emplaced, and production drilling commences, with thenumber of platforms and wells per tract dependent on the reservoirs.Normally, the lease owner will build two platforms and drill up toforty wells per tract (personal communication).
BLM is responsible for obtaining biological, geological, ecolog-ical, and other data for preparing an Environmental Impact Statement(E IS) prior to awarding a lease. The specific requirements of theaforementioned acts are considered in determining the type, quality,and quantity of data and information necessary. All required data thatare not readily available must be collected, reduced, analyzed, andsynthesized into meaningful information. This information is subse-quently used to make policy and management decisions on OCS matters.

‘o ‘ ● ● ● ‘ ● ’ ●

● “ 6
,.
16
.
9.
●
.
●✎
CHAPTER II
PROGRAM MANAGEMENT
J. LeBianc
INTRODUCTION
Project and data management. on this contract have been directlysupervised by the Program Manager, who is, in the words of the con-tract, Iiresponsibje for the administrative. logistical, financial, andscientific” work efforts and who holds ii~ufficient authority to insure
the timely, efficient, and competent accomplishment of all work. “ TheProgram Manager has worked directly with the two Technical Directors,one geological and one biological, as well as with all Principal inves-tigators (Pls) in satisfying the tasks or items specified in the State-ment of Work .
The requirements in the Statement of Work were specified in orderto obtain information that could be used by BLM and others in makingpolicy and management decisions, in developing Environmental ImpactStatements, lease stipulations, etc. , and in supporting other mandatedrequirements. For example, information in this report was used in Feb-ruary 1980 at a public hearing on the Flower Gardens Marine Sanctuary,in the EIS for lease sales 58A, 62A, and 62 (BLM, 1979a, b), in thedraft EIS on the Flower Gardens Marine Sanctuary (NOAA, 1979) , in theF3LM Fiscal Year Regional Studies Plan (BLM, 1978) , in the developmentof EPA and NOAA monitoring efforts, etc. Several Pls have also dis-cussed and shared findings and implications at professional and tech-nical conferences and meetings.
The Contractor was obligated to provide all necessary labor, ma-terial, supplies, equipment, facilities, and services to accomplish thespecified work items. These work items were as follows:
1. Develop and operate from a program management plan.2* Plan and conduct a field sampling program in the northern Gulf
of Mexico and the Florida Middle Ground.3. Plan and conduct submersible studies and mapping.4. Reduce, analyze, and synthesize data for the above tasks.5. Manage and archive scientific data.6. Prepare and submit plans, maps, and reports.
The Program Manager was also responsible for planning the worktasks and assessing and reporting to BLM the status in terms of ac–complishments, cost, and time. Table I l-l provides a list of the plansand reports prepared, and this final report provides the integrated ef-forts of all contributors. The Management Plan provided the frameworkfor planning and assessing performance in terms of accomplishments,time, and costs. The Logistics Plan provided a similar framework forplanning and assessing the field sampling program, submersible studies,mapping, and logistics. The fiscal and personnel resources, materials,

7 ●
facilities, and services were planned and coordinated so as to maximizeresults. Each Pre-Cruise Plan stated the objectives, expected results,and resources necessary to accomplish the stated objectives. Withinthirty days after each cruise, cruise reports were prepared and sub-mitted to BLM. I n each cruise report, the planned activities weredescribed and all deviations from the Pre- Cruise Plan were documentedand reported, with appropriate recommendations. Some recommendationswere approved by BLM and incorporated as contract modifications andscope changes. Scope changes were also initiated by BLM. Table 1!-2~rovides a breakdown of all contract modifications; all requirementshave been addressed in this report.
PROJECT MANAGEMENT
Introduction
To satisfy the requirements of the contract, theIished the BLM Program Office at TAAIU and assigned
Contractor estab-the necessary re-
sources. The Program Manager was delegated the responsibilities andauthority for logistical, financial, administrative, and contractual efunctions, as well as the responsibility for coordinating the scien-tific work of the Pls accountable for specific tasks.
The Program Manager and TAMRF developed and executed subcontractsand agreements for services, equipment, and materials. The ProgramManager and the Technical Directors, in addition to having PI responsi- .0bilities, were tasked with the technical review and acceptance of de-liverables from PIs and subcontractors.
Personnel, Contracts, and Logistics
Table 1 I-3 provides a list of PIs as well as their associates andsubcontractors. Table 11-4 tabulates contract modifications and theassociated period of performance for each P] . An analysis of these twotables tends to identify the management and logistics complexities ofthe contract, as amended. The original Statement of Work “was alteredwith ten contract modifications.modifications were as follows.
Briefly, the requirements in these●
Modification #1
University of Alabama [UABI sub-The Contractor and the Thecontractor were provided overrun funding tb complete the “recovery ofdata and samples from the Florida Middle Ground. Their schedu!edcruise had first been delayed by subcontract negotiations, and when thecruise did get underway, bad weather prevented accomplishment of two-thirds of the planned work.
●

8
‘o
e
.
h!odification #2
The Contractor and TAMU were provided overrun funding to completethe recovery of data and samples from the East Flower Garden Bank andother banks. Work had been delayed by bad weather.
~Modification #3
BLM extended the scope of the contract to include additional workat the East and West Flower Garden Banks. TAMU was required to conducta submersible and SCUBA diving cruise, collect seasonal data and sam-ples from the two banks, and map the West Flower Garden Bank. OnlyEast Flower Garden data were to be interpreted and included in the pre-sent final report. West Flower Garden” data were to be interpreted andreported on the succeeding contract (i.e. , #A A851-CTO-25) .
Modification #4
BLM extended the scope of work to include collection and analysisof post- lXTOC sediment samples at the East and West Flower GardenBanks.
Modification #5.
The Contractor and TAMU were provided overrun funding to completethe tasks added under Modifications 3 and 4. This work had been de–Iayed by hazardous atmospheric and oceanographic conditions.
Modification #6
The Contractor and UAB were provided overrun funding to complete“the recovery of data and samples from the Florida Middle Ground. Thecruise was shortened due to Hurricane Bob, and deployed instruments hadto be recovered.
Modification #7
BLM extended the scope of work to include several sampling, equip-ment recovery, and SCUBA diving cruises for the collection of seasonaldata and samples from the East and West Flower Garden Banks.
Modification #8
BLM extended the scope of work to include organizing andconducting a technical workshop in New Orleans, LA, and publishingthe proceedings of this workshop.
Modification #9
●✎
BLM extended the scope of work to compensate requirements not pro-perly covered in the original contract nor in subsequentmodifications.
9

9
‘*.
REPORTMANAGEMENT PLANLOGISTICS PLANQUARTERLY SUMMARY REPORTS
(1) Aug 78 -Nov78(2) Dec 78 -Feb 79(3) Mar 79 - Jun 79( 4 ) J u t 7 9 - O t t 7 9
PERFORMAfWE REPORTNov 79 - Jun 8 0
SPECIAL REPORT (COFFEE LLRIP)PRECRUISE PLANS
1st Mapping2nd Mapping
1st Submersible2nd Submersible
1st D i v i n g2nd Diving3rd Div ing4th Div ing5th Div ing
1st Moni tor ing2nd Monitoring3rd Moni tor ing4 t h 14mitoring
1st Seasonal2nd Seasonal3rd Seasonal
Summer Sampling
TABLE 11-1REPORTS AND PLANS PREPARED FOR TAMRF & BLM
(ConTract #AA551-CT8-35)
—.
DATESep 78Sep 78
Jan 79Mar 79Aug 79Dec 79
Jun 80Jan 7 9
%p 7 8Jul 7 9
%+p 7 8Aug 79
Sep 78kC 7 8Mar 79May 79Dec 7 9
%p 7 8Jan 79Apr 79Jut 7 9
Dec 78Mar 79May 79
May 79
REPORTCRUISE REPORTS
Mapping Cruise( 1 ) 12Aug- 40ct78(2) 29 JuI - 4 Aug 79
Submersible Cruises( 1 ) 2 6 sep - 1 5 tbV 7 8
. (2 ) 27 Aug - 26 Ot t 79Div ing Cru ises
( 1 ) 2 8 S e p - 20 Ott 78(2) 15 Jan - 4 Feb 79( 3 ) 26Mar - 30Mar 7 9(4) 18 Jun - 11 Jul 79(5) 15 Jan - 21 Jan 80
Moni tor ing Cru ises( 1 ) 25Sep - 20c’f_78(2) 7 Feb - 14 Feb 79( 3 ) 28May - 4 J u n 7 9(4) 27 Aug - 31 Aug 79
Seasonal Cruises(1) 11 - 18 Jan 79( 2 ) 1 8 - 30 Apr 79(3) 9 - 19 Jul 79
R e t r i e v a l C r u i s e(1) 31 May - 3 Jun 79
Summer Cruise( 1 ) 1 8 Jun - 28 Jun 79
PROCEEDINGS: GULF OFMEXICO INFORMATIONTRANSFER MEETiNG(12-13 May 80)
DATE
2 NOV 7 85 Sep 79
20 Feb 792 1 NW 7 9
15 Feb 799 M a r 79
25 Apr 7915 Aug 79
Jan 80
31 O t t 7 89 Mar 79
29 Jun 7928 Sep 79
13 Feb 7928 May 79
5 Sep 79
13 Jun 79
5 Sep 79
C& 8 0
*
●
e
●

“o, ● ● ● ●✎ ● ☛✌
T A B L E I I - 2BREAKDOWN OF CONTRACT MODIFICATION (03 STS/DESCRIPTION)
(BLM-TAMRF Contract #AA551-CT8-35)
Document I n i t i a t o r Descr ipt ion E f f e c t i v e D a t e Amount Subtota ls
Cont rac t#AA551-CT8-35
Mod. 1.
Mod. 2 .
Mod. 3 .
Mod. 4 .
Mode 5 ,
~Od, 6*
Mode la
~Ode 8.
Mod. 9 .
Mod . 10*
UAB *
TAMU
BLM
BLM
TAMU
UAB*
BLMTAMU
BLM
TAMU
TAMU
Contract let 26 Aug 78
(a) Overrun funding (weather)(b) Extend period of performance to Feb80
Overrun funding (weather)
(a)(b )
( a )(b )
Add a 79 summer monitoring cruise t’oEFG/wFGExtend period of performance to May 80
Add sample co l l ec t ion fo r I-IMWH analysisRedirect funds from Mod 2
Overrun
Overrun
(a) Add
funding (weather)
funding (weather and equipment recovery)
funds to continue monitoring(b) Replace current meters(c) Extend period of performance toDec80
Conduct workshop
Corrections to original contract and Mod. 3
5 Aug 78
17 Mar 79
28 Jun 79
13 Jul 79
30 Aug 79
28 Sep 79
2 Feb80
1 Dec79
1 May 80
28 Sep 80
T r a n s m i s s i o n o f STOCS da ta to Smi thson ian Ins t i tu te 1 Dec 80
$1,919,563
11,290
139,198
397,558
50,330-24,990
108,444
38,138
127,157
20,808
73,958
4,900
$1,919,563
1,930,853
2 , 0 7 0 , 0 5 1 ‘
2 , 4 6 7 , 6 0 9
2 , 5 1 7 , 9 3 92,492,949
2,601,393
2,639,531
2 , 7 6 6 , 6 8 8
2,787,496
2,861,454
2,866,354
●
*University of Alabama at Birmingham Subcontract #L800166

11
T a b l e I I - 3pi ,S, ASSOCIATES, A N D SuBco~RACTORS
1. T e x a s A8M Un ivers i ty (TAMU), C o l l e g e S t a t i o n , T Xa .
b.c .d.
e .f.
9*
h .
Joseph U . LeBlanc, P.E., C.D.P., P r o g r a m M a n a g e r(Rose Norman, Ph.D., Associate)R ichard Rezak , Ph .D . , P I and Co-Technica l D i rec torThomas J. Bright_, Ph.D., P I and Co-Technica l D i rec torC.S. Giam, P h . D . , P I ( S u b c o n t r a c t o r )( G r a c e Neff, Ph .D . , Assoc ia te )Stefan Gartner, P h . D . , P IT h o m a s Hilde, Ph.D., PI( G e o r g e Sharman, Ph .D . , Assoc ia te )D a v i d W . McGrail, Ph .D. , P I(Doy le Home, Assoc ia te )Bobby J . Pres ley , Ph .D . , P I( P a u l Boothe, P h . D . , A s s o c i a t e )
2 . University of Texas Marine Science Institute (UTMSI), Port Aransas,‘TX, Subcontract #L800167a. Patrick Parker, Ph.D., PI
(Dan Boatwright, Assoc ia te )b. R i c h a r d Scalan, Ph.D. , P Ic . K e n n e t h W i n t e r s , P h . D . , P I
3 . Un ivers i ty o f A labama a t B i rmingham (UAB), Dauphin Island SeaL a b o r a t o r y (DISL), Mob i le , AL , Subcont rac t #L800166a . Thomas Hopk ins , Ph .D . , P Ib. W.W. Schroeder , Ph .D . , P I
4 . Un ivers i ty o f South F lo r ida (USF), Dept . o f Mar ine Sc ience , Tampa ,F L ,a .b.
5 . LGLa .b,c .
Subcont rac t #L800165Lar ry Doy le , Ph .D . , P iJ o h n Steinmetz, Ph.D., PI
Eco log ica l Research Assoc ia tes , Bryan , TX , Subcont rac t #L800137Benny Ga l laway , Ph .D . , P res identG r e g Boland, D i v i n g S c i e n t i s tL a r r y R M a r t i n , D i v i n g S c i e n t i s t
6 . Oceanonics, Ine ( 0 1 ) , H o u s t o n , T X , P.O. #P36189a . J a c k O . H i l l , P r e s i d e n tb. L o u Andrus, Mar ine Opera t ionsc , T h o m a s S e l l e r s , H y d r o l o g i s t
7 . Sea l f l ee t Opera tors , Inc . (S01), G a l v e s t o n , T X , S u b c o n t r a c t #L800164a . J o h n Bissell, P r e s i d e n t
8 . Lorac S e r v i c e C o r p . , (LORAC), H o u s t o n , T X , P.O. #P36846a. Max Huff, President
“*
●
*
●
●

●
✘✍
●
●
CHANGES IN(TAMRF-BLM
12
TABLE I I -4PERIOD OF PERFORMANCE(3NTiRACT AA551-CT8-35)
F i n a lPer iod o f
P! s/co-Pi s Contract Modif ications Changing Scope Performance,12345 6 7 8 9 10 t?ug 7 8 t o
B r i g h t , T.J.
Doy le , L .
Gartner, S .
Giam, C.S.
Hopk ins , T .
Hiide, T .
LeBlanc, J.U.
McGrail, D.W.
P a r k e r , P .
P r e s l e y , B.J.
Rezak , R .
Scalan, R
Schroeder, W.
Steinmetz, J .
W i n t e r s , K .
x x x
x
X x x x x
X x x x
x
x
X x x x
x
x
x
x x
x
x
x x
x
X x x x
x x x
x
x
x x
x
x
x
x
x
x
x
x
x
x
x
x
x
Mar 81
Mar 81
Aug 80
Feb 80
Mar 81
Mar 81
Mar 81
Mar 81
Aug 80
Aug 80
Mar 81
Aug 80
Mar 81
Mar 81
Aug 80
.
●
13
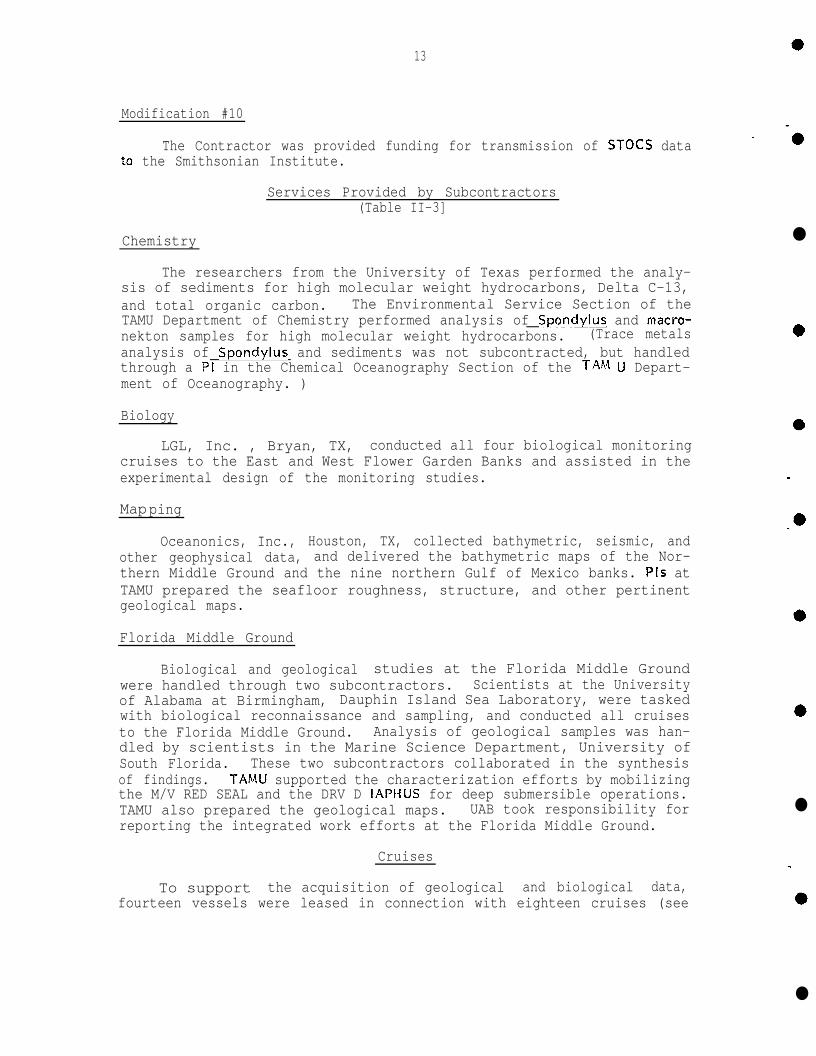
Modification #10
The Contractor was provided funding for transmission of STOCS datato the Smithsonian Institute.
Services Provided by Subcontractors(Table II-3]
Chemistry
The researchers from the University of Texas performed the analy-sis of sediments for high molecular weight hydrocarbons, Delta C-13,and total organic carbon. The Environmental Service Section of theTAMU Department of Chemistry performed analysis of Spondylus and macro-nekton samples for high molecular weight hydrocarbons. (Trace metalsanalysis of Spondylus and sediments was not subcontracted, but handledthrough a PI in the Chemical Oceanography Section of the TAh.l U Depart-ment of Oceanography. )
Biology
LGL, Inc. , Bryan, TX, conducted all four biological monitoringcruises to the East and West Flower Garden Banks and assisted in theexperimental design of the monitoring studies.
Mapping
Oceanonics, Inc., Houston, TX, collected bathymetric, seismic, andother geophysical data, and delivered the bathymetric maps of the Nor-thern Middle Ground and the nine northern Gulf of Mexico banks. Pls atTAMU prepared the seafloor roughness, structure, and other pertinentgeological maps.
Florida Middle Ground
Biological and geological studies at the Florida Middle Groundwere handled through two subcontractors. Scientists at the Universityof Alabama at Birmingham, Dauphin Island Sea Laboratory, were taskedwith biological reconnaissance and sampling, and conducted all cruisesto the Florida Middle Ground. Analysis of geological samples was han-dled by scientists in the Marine Science Department, University ofSouth Florida. These two subcontractors collaborated in the synthesisof findings. TAMU supported the characterization efforts by mobilizingthe M/V RED SEAL and the DRV D IAPHUS for deep submersible operations.TAMU also prepared the geological maps. UAB took responsibility forreporting the integrated work efforts at the Florida Middle Ground.
Cruises
To support the acquisition of geological and biological data,fourteen vessels were leased in connection with eighteen cruises (see
●
.
-e
●
●

. .
14●
e“.
●
i*
9
.
● ✍
●
Table II-5) . For TAMU cruises, the mobilization of each vessel wasaccomplished at the docks at TAh~U Marine Operations, TAM U/Galveston,Pelican Island, TX. Local welders, plumbers, and electricians, to-gether with TAM(J technicians, provided the necessary services. Otherfacilities in Galveston were used when necessary to satisfy mobiliza-tion and logistical requirements. Florida Middle Ground cruises weremobilized by the University of Alabama subcontractor.
Special Equipment
In the course of the contract, special equipment was obtained froma variety of vendors. Nine current meters, Mode! 550, were obtainedfrom Hydro Products, Inc. , San Diego, CA. Six LED transmissometerswere obtained from Sea Tech, Corvallis, OR, to be integrated with thecurrent meters (see Volume Two, Chapter VIII.
Time, Funds, Space
The period of performance for all work tasks was originally nego-tiated at eighteen months, ending in February 1980. Force majeure,changes in the scope of work, and other proposed changes extended theperiod of performance for some of the work tasks to h~arch 1981 (Table11-4, above). These changes increased the funding by approximately49% .
The !3LM Program Office was established in the Oceanography andMeteorology building at TAMU. Space was allocated for professional,technical, administrative, and support personnel. Data, records, andsamples were stored and processed in the various laboratories on theTAMU campus. The analytical processes leading to the integration and,synthesis of data into meaningful information were also performed inthese laboratories. The facilities include the following:
Atomic Absorption LaboratoryCartographic Services UnitCenter for GeodynamicsCenter for SedimentologyCenter> for Trace CharacterizationData Processing Center with Amdahl470 V-6 System
DRV DIAPt-l USElectron Microscopy LaboratoryElectronic Technician ShopGas Chromatography-Mass SpectronomyLaboratory
The management andto overall performance in
Geophysical LaboratoryHydrocarbon Chemical Anal ytical
LaboratoriesHydrology LaboratoryM/V GYREMachine ShopMar ine Operations CenterNuclear Science CenterPhotographic LaboratoryRudder Meeting CenterSedimentology LaboratoryX-Ray Diffraction Laboratory
1 ntroduction
processing of information and data are criticala contract. The data on this contract have
●

TA13LE I I -5SUMMARY OF CRUISES
CRUISE DATES AT SEA SHIP SITE CHIEF SCIENTIST REPORT DATE
1st Mapping Leg 1 12 Aug-29 Aug 78 JOYRO FMGLeg 2
Rezak30 Aug-16 Sep 78 JOYFKI FMG
Leg 3Hllde
1 7 Sep- 4 Ott 78 JOYR32 NOV 7 8
N W G u l f Rezak
2nd Mapping 2 9 Jul- 4 Aug79 PROTON WFG Rezak 5 Sep 79
1st Submersible Leg 1 2 6 Sep-20 Ot t 78 Gf RELeg 2
CT3F/EFG B r i g h t4 Ot t - 8 Ot t 78 GYRE EFG McGra i I 20 Feb79
Leg 3 9 Ot t -25 Ot t 78 G( RE 11 banks Rezak, B r i g h tLeg 4 4 Nov-13 N o v 7 8 RED SEAL FMG Hopkl ns
2nd Submersible L e g 1 5 Sep-18 Sep 79 BLACK SEAL EFG/WFG Rezak , McGrall&Boundary Layer Leg 2 21 Sep-28 Sep 79 BLA(I( SEAL EFG/WFG B r i g h t 21 NW 79
Leg 3 1 2 oct-21 Ott 79 I%3SS SEAL EFG/WFG Rezak, Home
1st Moni tor ing 2 5 Sep- 2 Ott 78 TONYA & JOE EFG M a r t i n (LGL). 31 Ott 782nd Monitoring 7 Feb-14 Feb79 TONYA & JOE EFG M a r t i n (LGL)3rd Monltorlng
9 M a r 7928 May- 4 Jun 79 TONYA & JOE EFG M a r t i n (LGL)
4th Moni tor ing 27 Aug-31 Aug 7929 Jun 79
TONYA & JOE EFG Martin (LGL) 28 Sep 79
1st Diving 2 8 Sep-20 Ott 78 BELLOWS FMG Hopkins2nd Diving
15 Feb7915 Jan- 4 Feb79 BELLOWS FMG Hopkins 9 Mar 79
3rd Div ing 26 Mar-30 Mar 79 i13UNSEFELL FMG Hopk I ns4th Div ing 1 9 Jun-11 Jul 7 9
25 Apr 79BELLOWS FMG
5th Div ingH o p k i n s 15 Aug 79
15 Jan-21 Jan 80 ROUNSEFELL FMG Lutz 3 Jan 80
1st Seasonal 11 Jan-18 Jan 79 BERING SEAL EFG Home2nd Seasonal 18 Apr-30 Apr 79
13 Feb 79MEDITERRANEAN SEAL EFG
3rd SeasonalMcGra i I 28 May 79
6 JuI-19 Jul 7 9 BERING SEAL EFG HomeSummer Sampling 18 Jun-28 Jun 79 BERING SEAL 6 banks Rezak 5 Sep 79
Current Meter 31 May- 3 Jun 79 PETE & SUE EFG Barrow 13 Jun 79R e t r i e v a l
Recovery/Deployment/ Leg 1 7 Dec 7 9 Gf RE EFG/WFG BarrowMoni tor ing Leg 2 16 Dec79 INVADER EFG/WFG McGrai I
Leg 3 15 Feb-23 Feb 80 BERING SEAHORSE EFG/WFG Viada May 80L e g 4 1 7 A p r - 1 8 A p r 8 0 COLD HARBOR aborted H o m eLeg 5 22 Apr-25 Apr 80 GfRE EFG/14FG Home
,9’ ● ‘o * Q ●
.,
● ‘ 9’

● ✎16
been voluminous and technical (e.g. , integrated current meter and● “ transmissometer time series data), complicated (e. g., biological data),
and crucial (e. g., bathymetric data) . The functions associated withthe management of data have included: total system planning, data andsample collection, data reduction, data and sample analysis, data inte~gration and synthesis, data evaluation and reporting, and data basegeneration and archiving. Once the data and samples were processed by
● the Pis, scientific techniques were applied, and, in a cognitive man-ner, data were integrated and synthesized into meaningful information—for this report.
● The functionsfold, including the
Data Manager
and responsibilities of the data manager were many-following:
1.
2.
9
.3.
4.
5.
●6.
Assisting Pls with data and information requirements.
Defining requirements associated with collection, reduction,analysis, reporting, quality and inventory control, man-machine interfaces, data integration and synthesis, and database structures for processing and archiving data.
Managing the digitizing of data and preparing acceptable tab-ular and graphical representations of analytical data.
Integrating data bases and preparing support computer programsand other software.
Assisting the Program Manager and Pls in selecting hardware,software, and firmware. *
Verifying the data bases and archiving them in the NOAA En-vironmental Data Information System (e.g. , NODC and NGSTDCformats).
These functions illustrate the need for total information system plan-
● ning so that components can be monitored and evaluated. The systemcomponents started with the field sampling efforts and culminated withreports and correct data bases.
Data/Sample Collection
To satisfy the field sampling program, vessels were mobilized anddeployed to collect samples and data. There were five types of datacollection cruises: mapping, submersible, monitoring, seasonal sam-pling, and diving.
*“Fjrmware” refers to hardware computer programs.
●
●

17
--
*
Field Mapp ing Tasks r
The field mapping effort consisted of collecting seismic, geo- ●physical, and bathymetric ,data to prepare maps of nine banks and theNorthern Middle Ground area. Lorac Service Corp. provided precisionnavigation, and Oceanonics, Inc. provided the vessel and survey equip-
.
ment under fixed price subcontracts. While performing the work tasks,several problems were encountered and were reported in
Submersible Tasks
The submersible tasks consisted of collecting data
cruise reports.*
and samples indeep waters. The TAMU submersible DRV DIAPHUS was used to collectphotographic and audio-video data and geological and biological samples(i.e., Spondyius, rocks, sediments, etc. ) . Water column data were alsocollected to help characterize the banks.
Scientists from TAMU collected geological and biological data andsamples from eight northern Gulf of Mexico banks, and scientists fromUAB and USF collected data and samples from the Florida Middle Ground.
Monitoring Tasks
The monitoring tasks consisted of seasonal SCUBA cruises to theFlorida Middle Ground and the East and West Flower Garden Banks to col-lect biological samples and photographic data and to service stationinstruments and arrays. These tasks are described fully with the dataand/or sample inventories in later chapters.
Seasonal Samplincj
Sampling for geological, biological, chemical, and h ydrographicoceanographic data was accomplished on cruises to the East Flower Gar-den Bank, during three seasons: fall, winter, and spring/summer. Toconduct required water column and bottom sediment sampling at CoffeeLump, Fishnet, Diaphus, Jakkula, and Alderdice Banks, a summer samplingcruise ‘was combined with the third seasonal cruise.
Diving at the Florida Middle Ground
Intensive sampling and observational activities were conducted onfour SCUBA diving cruises to the Florida Middle Ground. Diving activi-ties involved collection of biological samples and photographic data,as well as installation and servicing of instruments.
Sample Analysis
Samples were transferred to appropriate laboratories for analysis.The Spondylus were delivered to the TAMU Trace Metal Analytical Labor-atory for analysis by Drs. Bobby Presley and Paul 1300the and to theTAMU HMWH Analytical Laboratories for analysis by Drs. C.S. Giam andGrace Neff. Sediments were delivered to the TAMU laboratory for
●

● 18
1-
‘o
.
●
●
●✎
textural and mineralogy anaiysis by Dr. Richard Rezak and to the Uni-versity of Texas Marine Science Institute for HMWH, Delta-C-13, andtotal organic carbon analysis by Drs. Partick Parker., Kenneth Winters,i?. Scalan, and Dan Boatright. Water samples were analyzed at TAhl U byDr. James Brooks.
The analytical data were documented and delivered to the ProgramOffice for inclusion in this report.
Data Analvsis
Pls. were individually responsible for the analysis of data intheir field of s~ecialization. Techniques were applied and computer-ized where appi~cabie so as to processmeaningful graphic or tabular data.niques include:
Cartographic Projection/GridPrograms
Current Meter Data AnalysisGausian-Cascading Butter worth Filter
AnaiysisGrain Size AnaiysisGraphics and Plotting Programs
the volume-of data and arrive atSome of the computerized tech-
Report Generator ProgramRotary Spectral AnalysisSpectral AnalysisStandard Fourier Fast TranformStandard Statistical AnaiysisTime Series AnalysisVariance Tensor Analysis
The TAMU Data Processing Center and other computer facilities wereused in the reduction, analysis, and reporting processes. These pro-cedures are described in the appropriate chapters of this report.
Data Synthesis and Integration
Pls analyzed the data in their respective areas, synthesized, andintegrated the results, and then prepared Pi Reports. This informationwas coliected and interpreted by the Technical Directors to character-ize the areas and banks.
The Florida Middle Ground characterization was directed by UAB,and the characterization of banks in the northern Gulf of Mexico wasperformed by TAMU.
Data Archivinq
Once digitized and anaiyzed, the data were piaced on magnetictapes and/or microfilmed and mailed to the NOAA ED IS in an appropriateformat. Analog records were microfilmed to enhance the life of thedata.
Data and information Reporting
Table ii-1 (above) provides a complete list of documents preparedin this contract. Management plans provided the framework for report-ing. Progress reports provided data and information for the COAR andContract inspector to monitor the work efforts and provide feedback
●

19
. .
●
to the Program Manager and Pls. The progress reviews were held onschedule with positive information exchanges. Cruise reports providedup–to-the-minute status of the data/sample collectioti efforts with rec-ommendations as appropriate.
DISCUSSION
Introduction
Management of this multi-million dollar contract required sur-mounting factors and variables affecting the Period of Performance andthe associated costs and PI performance. The chief force majeure wasweather and its impact on the data collection efforts. Another forcemajeure was the IX TO C-1 oil and gas spill and its potential effect onthe Flower Garden Banks. Part of the FY 1980 monitoring efforts alsohad to be included as an amendment to satisfy urgent 1980 requirements,underestimated costs, and delays both in releasing the Request for Pro-posals (RFP) and in evaluating proposals.
Contracts Administration
Service agreements and subcontracts were executed during the con-tract period, but several tasks had to be initiated prior to obtainingfully executed subcontracts or service agreements. Such delays couldbe prevented with more advance planning and sufficient lead time toplan and execute these documents and actions.
Federal agencies often have time, fiscal, and other constraintsimposed on them which delay the timely award of contracts. It would behighly desirable to have RFPs and realistic estimates on-the-streetprior to the start of a fiscal year so as to evaluate proposals, nego-tiate agreements, and award contracts within a reasonable time afterthe start of the fiscal year. Each management plan, master schedule,sampling plan, and logistics plan must be prepared, coordinated, andaccepted in a minimum amount of time after a contract is awarded. Thetime is dependent on the size of the contract, and the initial 60 daysof a contract are crucial to the efficient scheduling needed to ensurea smooth-running project. For example, some of the reported problemswith the mapping tasks were traced to inadequate lead time for perform-ing the tasks and for evaluating and certifying results. S o m e o f t h er e p o r t e d p r o b l e m s w i t h t h e s u b m e r s i b l e t a s k s a r e a t t r i b u t a b l e t o i n a d e -quate lead time before the cruise. Complaints were also expressed re-garding the slow turnaround in obtaining approvals or subcontracts.These probiems could be reduced with adequate planning time and suffi-cient lead time to order, test, and install equipment, to mobilize anddeploy data collection efforts, to analyze samples, and to reduce, ana-lyze, integrate, and synthesize data. ResuIts would also be greatlyenhanced.
‘**
e
●

●
✘
9
●
20
Quality Control and Assurance
All samples and data were labeled, inventoried, and processed asper contractual requirements. Several check points were planned toevaluate performance of Pls and subcontractors and the quality of theintermediate products.
The bathymetric products were prepared by Oceanonics, Inc., andcontrol points were verified by TAMU geophysicists and cartographers.Several errors were discovered and corrected.
Intermediate results from Pls were discussed at progress meetingsand reported in the Quarterly Summary Reports. Corrective actions weretaken and reported in PI status reports whenever problems were identi-f ied.
Analytical results prepared and reported by Pls were reviewed andcritiqued by the Technical Directors. Corrections were made to the re-ports before submittal to BLM.
In the laboratories and in the field, equipment was calibratedaccording to the specifications. Tasks were performed, checks made,and appropriate corrections incorporated. As a result, the margin forerror of the data was minimized and the quality of the information wasgreatly enhanced. Planning and accomplishing quality control did, how-ever, require additional time and effort.
Planning, Scheduling, and Coordinating
The planning and controlling functions are critical to all pro-jects, especially one with limited resources and with seven sub-contractors and fourteen PIs located from Texas to Florida. Require-ments were defined and delegated, tasks were planned with successor- “predecessor relationships, expected time to complete the tasks wasestimated, and a schedule was prepared. Products were subsequentlyprepared throughout the contract and delivered on time.
The incremental scheduling of tasks along the critical path provedto be very successful except for unanticipated problems encounteredwith several PI reports. Some PIs performed below expectation, theirwork efforts were not properly coordinated, and the shortcomings im-pacted the time and efforts of other Pls, tt-te Technical Directors, andthe Program Manager. Other impacts to the period of performance werecaused by changes in the scope and by force majeure.
Amendments to the scope of the contract and force majeure resultedin ten modifications to the contract. Not all Pls were affected bythese modifications (Table 11-4, above). The major force majeure wasweather, especially during the winter and fall of 1979, when severaltropical storms and hurricanes (i.e. , 130b, Claudette, David, Elena,Frederic, Henri) caused delays in the data collection efforts. Otherforce majeure included the failure of components in some of the de-ployed instruments, the loss of deployed instruments and data; the
.

21
. “
9
loss of navigation and bathymetric data from the submersible cruise,etc. These created needs for additional time, efforts, and costs,especially to hand Ie the logistics.
Logistics Administration
The Logistics Plan established the framework for the field logis-tics. Several vendors were contacted for chartered vessels and navi-gational services, etc. , and the most cost-effective alternatives wereselected. Effective negotiating was also used so as to obtain theleast cost for the “best” equipment and services. Pis were successfulin ali deliberations.
RECOMMENDATIONS
To maximize the future work efforts, minimize costs and time, andobtain qualitative and quantitative resuits, severai recommendationsare in order. These inciude:
“*
1.
2.
3*
4.
5.
6,
7.
8.
9.
10*
Assign a Program Manager with technicai and managerial abili-ties and with sufficient authority over the resources for ac-
9
compiishing timeiy tasks.
Authorize the Program Manager to commit negotiated funds and .
resources for accomplishing ali contractual tasks without ad-ditional approvai of the Contracting Officer. ●
Minimize or eliminate dupiicate efforts of federai agencies,and aiiocate appropriated funds to maximize resuits.
Provide reaiistic estimates of time and costs for scopechanges.
tJse acceptable industrial engineering pianning and controllingtechniques in iieu of PERT.
Ailow a 60-day project establishment and pianning period afterietting a contract.
Provide archived data in a timeiy manner so as not to deiaythe efforts of Pis.
Piace more emphasis on data management by allocating necessaryresources for programming, anaiysis, archiving, etc.
Aiiow a 90-day period for analyzing data after the data havebeen processed and reduced to a form usabie by Pis.
‘Specify for completing ali data analysis “a period of at ieast’60 days before the draft finai report is due. ”
●
9

22
11.
12.
13.
14.
15.
Provide timelyand reports.
critiques and courses of action of all plans.
Schedule the draft Executive Summary “30 days after the draftFinal Report. ”
Prepare and schedule intermediate segments of the draft re-ports so as to level resource requirements.
Conduct bathymetric mapping tasks at least six months beforethe products are required.
Submit draft report for peer review when draft is submitted toE3LM; allow sufficient review time, and provide stipends forreviewers.
●
●

“a.
●
●
●
m
.
●
●

● “
* -
●
*
I
●
●
m
23
CHAPTER Ill
GEOLOGY
R. Rezak
INTRODUCTION
This chapter summarizes the geological observations and data thathave been acquired on TAMU/BLM contracts since 1975. During thisperiod, 38 banks have been mapped at a scale of 1:12000 and a two metrecontour interval, except for those banks that have high relief and verysteep slopes (Figure 111-1 and Table Ill-t) . Twenty-one of these bankshave been sampled for sediment analyses. Only two of the banks (Eastand West Flower Garden) have been sampled in sufficient detail to per-mit the construction of sediment distribution maps.
Twenty-six of the banks have been observed directly by use of sub-mersibles. Observations on these banks have been documented by videotapes and 35 mm still, color photos. All video tapes (both biologicaland geological] have been reviewed for geological content.
Side-scan sonar data have been acquired for all 38 of the mappedbanks. Sub-bottom seismic profiles have also been made for 23 of themapped banks. These data have been interpreted for only the eightbanks mapped under this contract.
General
Salt diapirism has been a recognized feature of the northwesternGulf of Mexico since the early days of petroleum exploration. Thesestructures are not unique to the Gulf of Mexico. They are also knownto occur in \Yest Germany and the Middle Eastr where there are thick de-posits of bedded salt beneath younger sedimentary sequences. With thedevelopment of seismic reflection techniques, much has been learned re-garding the “gross structural features created by the diapirs, and arather voluminous literature has appeared in the published record.This literature has been mainly descriptive and deals with the occur-rences of hydrocarbons associated with these structures.
The present study is based upon the published record, shallowseismic reflection profiles, side-scan sonar records made in the courseof mapping the banks described in this report, and direct observationsof diapiric structures on the seafloor from the submersible DRVDIAPHUS. All of the banks mapped during the present study are situatedon the diapiric structures. [n general, these diapirs have much incommon. However, there is great variability in the details of thephysiographic and structural expression of the diapirs, apparently dueto their varying geologic histories.
o

24
TABLE I l l -1SUMMARY OF BANKS STUDIED (1974-80)
‘oCONTRACT SAMPLING OBSERVATION SIDE- SUB-BOTTOM
BAN( YEAR(s) MAPPING FOR SEDIMENT FROM SCAN SEISMIC’STUDIED CRUISE ANALYSIS SUBMERSIBLE SONAR PROFILES
A l d e r d i c e (ALD)
AppIebaum (APL)( L i t t l e S i s t e r )
Aransas (ARA)
B a k e r (BAX)
Big Adam Rock (BAD)
Blackfish (BLA)
Bouma (BOU)
B r i g h t (BR1)
Clayplle (CLA)
Coffee Lump (COF)
Diaphus (DIA)
Dream (DRE
E a s t (EAS)
East Flower Garden (EFG)
Elvers (ELV)
Ewing (EWI)
F i s h n e t (FIS)
Four Rocks (4R0)
G e y e r (GEY)
Hosp i ta l Rock (HOS)
1978
1975& 78
1975& 7 6
1975
1975
1975& 76
1977
1977
1976& 7 7
1978
1978
1975
1975
1975-78
1978
1977
1978
1975
1978
1975& 76
Sep 78
May 75
Nov 74
Ott 74
Nov 74
Nov 74
May 77
May 77
Jun 77
Sep 78
Sep 78
Nov 74Jun 75
Nov 74
Jun 7 5Jul 7 6
Sep 78
May 77
Sep 78
May 75
Sep 78
t
x
x
x
x
x
x
x
x
X*
x
x
x x X**
●
x x
x
x x
x x
x xx x
x x x
x x
x x
x X** X**
x X** X**
x x
(no topographic expression)
x x x
x X** X**
x x x
x X** X**
(no topographic expression)
x X** X**
x x
i C h a r t p r e p a r e d in 1969 by Southwest Research institute - revised by TAMU 1974.* = Sed iment d is t r ibu t ion maD c o n s t r u c t e d
‘.
o
* * = i n t e r p r e t e d
●
●

●
● “
25
T A B L E Ill-1 (ConTlnued)
*
●
I!0
●
CONTRACT SAMPLING OBSERVATION SIDE- SUB-BOTTOMBAN( YEAR(s) MAPPING FOR SEDIMENT FROM SCAN SEISMIC
~UDIED CRUISE ANALYSIS SUBMERSIBLE SONAR PFtlFl LES
Jakkula (JAK)
Litt le Adam Rock (LAD)
M y s t e r i o u s (MYS)
N H o s p i t a l (NHO)
Parker (PAR)
Rezak-Sidner (RSI)
Sackett (SAC)
Small Adam Rock (SAD)
Sonnier (SON)(Three Hickey Rock )
South Baker (SBA)
S o u t h e r n (SOU)
S t e t s o n (STE)
West Flower Garden (WFG)
1 8 Fathcan (lSF)
28 Fathom (28F)
28 Fathom, SW Peak
2 9 Fathcxn (29F)
32 Fathom (32F}
1978
1975
1975
1975
1977
1978
1977
1975
1977
1975& 7 6
1975& 7 6
1975& 76
1978
1977
1975& 7 6
1976
1975
1975
Sep 78 x x X** )(**
Nov 74 (no topographic expression)
Nov 74
Nov 74
May 77 x
Sep 78 x
May 77 x
Nov 74
May 77 x
Ott 74 x
May 75 x
., .,, ,., .,Jut 7 6 x
Jut 7 9 X*
May 77
xOtt 74
Jul 7 6
0 c-t 74
May 75
% = Sed iment d is t r ibu t ion map const ruc tedH = I n t e r p r e t e d
x
x
x
x
x
x
x
x
x
x
x
x
x
x
x
)(**
x
x
x
x
x
x
X**
x
x
x
x
x
x
) ( **
x
x
x
x’
x
x
x
x
.
●

26
MECHANICS OF DIAPIRISM
●
During Jurassic time, the ancestral Gulf of Mexico was a slowlysubsiding shallow evaporite basin in which over 3,000 m of rock salt(Louann Salt) accumulated. By Middle-Late Jurassic time, salt deposi-tion had ended and deposition of shallow water, normal marine sedimentsbegan. Continued deposition of marine sediments during the Cretaceusand Tertiary built a broad continental shelf out into the Gulf ofMexico [Martin, 1978) burying the Louann Salt under nearly 15 km ofsediments in the vicinity of High Island, Texas. Near the shelf edge,the salt is approximately 10 km deep. The salt domes of the coastalplain and continental shelf originated as diapirs in the abyssal plainand continental rise. They developed their present form as the pro-graming weage of post-C setaceous sediments altered the bathymetry attheir location from lower slope, to upper slope, to shelf depositionalenvironments [Amery, 1978) . As early as 1934, Nettleton demonstratedthat salt diapirs act in accordance with the laws of fluid mechanicsand that they grow as sediments are deposited on arid around them.Humphris ( 1978) attributes the formation of sait diapirs on the conti-nental slope to lateral salt flowage resulting from the sediment load-ing on the shelf. Martin ( 1978) suggests that the salt diapirs areyoungest at the Sigsbee escarpment and most mature on the interiorcoastal plain.
The foregoing discussion is based upon seismic surveys using wide-ly spaced seismic lines. Clearly, the major forces acting upon thesalt diapirs are due to density differences between the salt and thesurrounding sediments. The result is an upthrusting of the diapir anddeformation of the surrounding and overlying sediments. The surveysconducted during the present investigation have closely spaced grids(approx. 275 m track spacing and 152 m between navigation fixes ontrack) , thus permitting a more detailed assessment of the structuralfeatures associated with the salt diapirs.
Faulting is the most common feature associated with salt tec-tonics, as can be readily seen on the seismic profiles in Chapters Xlthrough XVlll . Radial faults at the crests of diapirs are due to domaluplift of the overlying rocks and the production of tensional stressesduring the doming. Movement along these faults is probably minimalduring the upthrusting of the salt. The central graben has been at-tributed by some authors to the tensional stresses. However, the cen-tral graben is a collapse feature that is formed by annular faults thatintersect the radial faults and occurs later in the development of thesalt dome. Nettleton ( 1934) attributes circular faults to the cuttingoff of the supply of salt into the dome by the drop of the peripheralsink. Beyond this stage, further growth of the dome is at the expenseof the material already within the peripheral sink, and the cross- sec-tional area of the salt decreases. This decrease causes normal fault-ing around the salt to fill in the space relieved of salt. Nettleton’smodel does not fit the observed fault patterns associated with centralgrabens at the crests of domes. 1 nstead, these patterns indicate acollapse of the dome over the apex of the salt diapir.
“ ‘o
.0
.
●

27
.
9
.
●✎
Amery ( 1978) illustrates a crestal graben on a diapir locatedthe lower continental slo~e. A~~arentlv, the development of
onthe
crestal graben is related ‘ to the ‘ ~elative” ‘rates of sedi-mentation andupward movement of the salt. As the crest of the salt plug approaches “a depth of about 300 m below the sediment-water interface, dissolutionof salt by marine phreatic water begins.
Also associated with the shelf edge diapirs are regional faultsthat generally parallel the shelf break. These faults are gravity typestructures, probably due to a combination of 1) crustal loading andbasement tectonics, 2) siumping along the shelf edge as a result ofrapid sediment accumulation, 3) salt and shale flow into local struc-tures and systems of regional extent, and 4) differential compaction(Martin, 1978) . The faults occur as interdomal fractures, frequentlydisplacing the seaward portions of salt domes (see Volume Four, FiguresXI II-5 and 6).
Examination of the bathymetry on NOS charts NG 15-2 (GardenBanks), NG 15-3 (Green Canyon), NG 15-11 (Bouma Bank), and NG 15-12(Ewing Bank) shows N’/J-SE and NE-SW Iineations near the shelf break thatare accentuated by intrusions of salt. These may be the result of ac-tive basement fauit systems that create avenues for salt intrusion intothe overlying slope sediments. Documentation of one such fault is seenon the east side of Rezak-Sidner Bank (Volume Four, Figures XV II-3 and4).
ORIGIN OF CAP ROCK
Salt in the diapirs is a mixture of halide minerals having varyingvolubility. The two most abundant minerals are halite (NaCl) and an-hydrite (CaSO ) . As the crest of the salt diapir approaches the
:sediment surfa e (about -300 m) , marine phreatic water begins to dis-solve the more soluble halite and concentrate the less soluble an-hydrite. The anhydrite cap rock can attain thicknesses of several hun-dred feet. The presence of brines and unconsolidated anhydrite sandsalong the salt table of domes, the high concentration of NaCI in cap-rock waters, and the numerous periods of brecciation evidenced by caprock are all evidence that cap rock has been forming over an extendedperiod of time and is still forming (Feely and Kulp, 1957) .
Brecciation of the cap rock may occur due to the upward movement .of the salt or collapse of the cap rock into cavities left by the re-moval of NaC1. During periods of active upward movement, the saltbrecciates the cap rock and probably leaves fragments of it behind onthe flanks of the diapir as the salt bypasses it (Feely and Kulp,1957) .
On the basis of geologic evidence, limestone cap rock must be de-rived from the chemical reduction of the anhydrite cap rock. The pro-ducts of the biochemical reduction of anhydrite include calcium car-bonate (calcite] , H S, native sulfur, pyrite (FeS ) , gypsum
c~z # and methane. Feely and Kulp 2(1957] con-~~?e”f ~ 2~~~~~ of2 experiments using sulfate-reducing bacteria
●

(Desulfovibrio)
28
and natural crude petroleum to determine the rates ofsulfur production due to reduction of CaS04 by each agent. Their re-sults proved that sulfate is not reduced by petroleum at salt dome tem-peratures at a sufficiently rapid rate to produce sulfur deposits suchas those of the Gulf Coast in less than 150 million years. Sulfate-reducing bacteria, on the other hand, will reduce sulfate at a ratethat is sufficiently rapid to produce the Gulf Coast sulfur deposits inless than a million years.
. .9
.
EVIDENCE FOR CRESTAL COLLAPSE
General
There is accumulating evidence that normal faulting and grabenformation at the crests and on the flanks of salt domes may be cata-strophic in nature. Much of the evidence is indirect, but taken to-gether it indicates very strongly the probability of catastrophic move-ments on crestal faults. The evidence for catastrophic collapse in-cludes 1) the East Flower Garden (EFG) brine lake, 2) the nature ofrock outcrops at the crests of domes, 3) earthquakes, and 4) changes in ●
coral growth rates at the East Flower Garden.
East Flower Garden Brine Lake - .
A detailed description of the brine lake is presented in VolumeThree, Chapter X, and a graphic representation of the lake is shown on -e
Volume Three, Figure X-C-IS. Examination of the bathymetric chart ofthe East Flower Garden (Figure III-2) shows clearly that there is nocentral collapse feature. The West Flower Garden (WFG) has developed acentral graben (Figure 1 I 1-4) , and the bathymetry and sub-bottom pro-files on several of the banks show large scale normal faulting on their .crests.
The area of active brine seeps occurs on the southeastern flank ofthe East Flower Garden, filling a small brine lake. Seismic data indi-cate that the top of the salt lies within 30 m of the crest of the reefjust to the northwest of the brine lake. The brine results from dis-solution of the salt by normal marine phreatic water that permeates theporous reef rock. The dense brines (about 200 0/00 total salinity)then flow by gravity to the shores of the brine lake where they emergefrom the porous rock. The outflow of the lake has been calculated tobe about 864 m3/day, or 315,360 m3/year. The total amount of saltdissolved from the crest of the salt diapir over the period of a year,as evidenced by this series of seeps, is 24,200 m3. Other seeps areknown to occur at the East Flower Garden, so this is a minimum figurefor the removal of salt. One of the unknown variables is the rate ofupward flowage of the salt diapir. It seems unlikely that it is equalto or greater than the rate of removal of salt by dissolution. There-fore we may expect a collapse of the crest of the bank in the not toodistant future.
.
●

● ✍
●
●
●
29
Reef and Non-Reef Outcrops
One of the early pieces of evidence for Recent movement alongcrestal faults is the outcrop of basalt on Alderdice Bank (Volume Four,Chapter XVIII). The extremely thin encrustation by reef-building or-ganisms is an indication of rather recent exposure of this rock on theseafloor. Bare-rock outcrops occur on Sonnier and Claypile Banks, aswell as Geyer Bank, which has both well developedoutcrops within 300 m of each other. If these rockexposed since Late Pleistocene time, they would alltations of reef–building organisms by this time.
Earthquakes
reefs and bare-rocksubstrates had beenhave heavy encrus-
Several jack-up rigs and platforms have foundered in the vicinityof salt domes. During a recent conversation with a petroleum companystructural engineer, i was told that a platform in the vicinity of theEast Flower Garden had experienced an earthquake. The epicenter of thequake is not known, but it is possible that it could have been at thesite of a nearby salt dome.
There is evidence that the loci of upthrusting can be displaced.On the east side of Alderdice Bank, the central graben shows evidenceof uplift (Volume Four, Figure XV III–SC]. That figure clearly shows areversal in the direction of movement on the faults on either side ofthe graben, as evidenced by the fault-bounded uplift of the seafloorover the graben. As this profile is some distance from the crest ofthe dome, it is clear that seafloor instability due to upthrusting orcollapse is not restricted to the crest of the dome. Off-bank areas inthe vicinity of salt domes are also susceptible to theseinstabilities. ,
Coral Growth Rates
Growth rates of Montastrea annularis at the East Flower Gardenfrom 1907 through 1956 averaged 8.9 mm/year (Hudson and Robbin, 1980) .From 1957 until the present, the rate has been 7.2 mm/year. Hudson andRobbin examined possible causes of decline in growth rate, such as: 1)commercial shrimping, 2) dumping of chemical wastes (about 75 km westof the East Flower Garden, 3) temperature changes, and 4) air pollutionthat might reduce light levels. They concluded that no single causefor growth rate reducton can be demonstrated. Moreover, the effects ofthese possible causes would have been gradual, not abrupt. Shinn(personal communication) feels that a sudden, 10 m depth increase wouldbe enough to reduce the rate of growth by about 2 mm/year.
CLASSIFICATION OF SALT DOMES
Examination of the bathymetric maps and computer-produced perspec-tive diagrams of the banks (Figures Iii-l through 25) illustrates veryclearly the variety of physiographic expression of the banks. Thephysiography of the banks is controlled primarily by the sub-bottomstructure. Unfortunate y, on many banks the core of the dome is

30
seismically transparent. Any one or more of several factors may causethe lack of sub-bottom reflectors in these bank cores: 1 ) carbonatereefal growths might be thick enough to attenuate the return signalfrom any reflectors; 2) salt and/or cap rock may be very close to thesurface and no sub-bottom reflectors may be present; and 3) sedimentaryunits in the core may be nearly vertical.
In order to determine the nature of the core, both sub-bottom pro-files and side-scan sonar records must be examined critically. [naddition, submersible observations may give some clues to the nature ofthe core. “Both Fishnet and Alderdice Banks have seismically trans- “parent cores. The side-scan sonar records on both banks show outcroppatterns of nearly vertical beds. The side-scan sonar records fromGeyer Bank show very little in the way of nearly vertical outcrops.However, submersible observations on the northern part of the bank showextensive areas of vertically dipping sedimentary strata. On the EastFlower Garden Bank, no evidence of bedded outcrops in the core of thebank is displayed on the sub-bottom profiles or on the side-scan sonarrecords. However, submersible observations have revealed brine seeps
that indicate that salt in the core must be shallower than 71 m belowsea level. Consequently, the seismic transparency of the bank core isprobably due to a combination of coral reef growth and proximity of thesalt to the surface.
Because of the complex history of salt diapirs, it is difficult toclassify the structures in terms of age. All of these structures begangrowing when there was probably no more than 1000 m of sediment over-lying the source bed of the salt in the diapirs. Since that time therehave been repeated periods of sediment deposition alternating withperiods of upthrusting of salt, dissolution of salt, collapse of theoverlying beds, and exposure to subaerial erosion. .
“*
*
>
Terms such as “youth” and IImaturityll are rather meaningless unlessused with reference to specific features on the salt dome. A thicksedimentary sequence showing minor relief on the seafloor with minorfaulting over the crest might be referred to as a youthful dome. Noneof the banks studied under this contract fall into this category. How-ever, one example is provided by Tatum (1’379; see his Figure 10) .Youthful domes may have either high or low bathymetric relief. Domes ●of this type may be due to renewed upthrusting of sait following aquiescent period during which several hundred metres of sediment weredeposited over the crest. If the dome is subaerially exposed at thisstage, it could be truncated and result in a bank such as Coffee Lump(Figures II I-6 and 7, and Volume Four, Figure Xl-4) . Coffee Lump wasexposed during the Late Pleistocene and truncated by a stream that aflowed into the Gulf just to the west of the West Flower Garden Bank[Henry Berry hill, personal communication).
A mature dome is one that has been up!ifted, the sa[t at its crest .removed due to dissolution by marine phreatic waters, and block faultedat its crest to form a central graben. Examples of this type of dome ●are Diaphus (Figures 111–20 and 21, and Volume Four, Figure XIII-S),Jakkula (Figures III-18 and 19, and \/olume Four, Figure XIV-4) , Fishnet
.
(Figures III-14 and 15, and Volume Four, Figure XII-4) , and Elvers

.
● b
31
(Figures III-10 and 11, and Volume Four, Figures XV-4, 5, and 6).Previously surveyed banks ( 1977 contract) belonging to this categoryare: Claypile, Sonnier, Parker, Bright, 18 Fathom; Bo~ma, and Ewing(see Table III-2).
Rejuvenated domes are those that have been block faulted and/ortruncated and subjected to renewed upthrusting by the salt diapir.Most of these domes have a very thin cover of rock over the salt in thecrest of the diapir. Examples of this type of dome are the East FlowerGarden [Figures II I-2 and 3) , Geyer (Figures II I-8 and 9, and VolumeFour, Figures XV I-4 and 5) , and Alderdice (Figures III-16 and 17, andVolume Four, Figure XVIII-6) (see Table III-2). Alderdice is the onlybank where direct evidence of rejuvenation is displayed on the sub-bottom profiles. Moreover, on Alderdice there is evidence for a changeof the locus of upthrusting from the crest of the bank to the easternmargin.
TABLE II I-2CLASSIFICATION OF SALT DOMES
Young Mature Rejuvenated
Coffee Lump Elvers East Flower Garden
Rezak -S idner Fishnet Alderdice
32 Fathom Jakkula Geyer
Diaphus
Ciaypile
West Flower Garden .Sonnier
Parker
Bright
18 Fathom. ,
Bouma
Ewing
SEDIMENTOLOGY
General
The normal sediments on the OCS off the Texas and Louisiana coastsare primarily land-derived mud, sandy mud, or muddy sands with minoradmixtures of skeletal calcium carbonate derived from organisms thatlive in the water column, on the bottom, and within the bottom sedi-ment. Hundreds of banks are scattered over the OCS. These banks

32●
are located on shallow sub-sea salt domes that have dragged up withthem Tertiary age sandstones, siltstones, and shales. The rocks haveserved as a solid substrate upon which prolific calcium carbonate- ‘*~
producing communities of organisms have existed since Late PleistoceneI
time, and possibly before. The results of this growth are the livingreefs and the reef bank sediments that consist almost entirely of skel -etal calcium carbonate. These sediments surround the living reefs inthe form of aprons that slope gently away from the reefs and merge attheir lower extremities with the normal terrigenous sediments of the ●
OCS*
Classification of Sediments
Sediments may be classified according to texture, mineralogy, orgenesis. A textural classification is used to describe terrigenous *
sediments because they are subject to transport by moving fluids.Determination of the particle size distribution in such sedimentsal!ows for the interpretation of the process of transportation and thevelocities required to transport the sediment. A greater flow velocityis required to transport a sand than the velocity needed to transport asilt. ●
The classification of terrigenous sediments in general use bysedimentologists today is that of Folk ( 1974) . in his classification “scheme, Folk used the grade scale devised by Wentworth ( 1922) . Accord-ing to this grade scale, the diameters of the sediment particles are asfollows:
Grave 1 > 2.0 mSand 0.0625 - 2,0 mnSilt 0.0020
-i- 0.0625 rim
tid ‘Clay < 0.0020 Mn ] –
Folk places major emphasis on the presence of even minute quan-tities cf gravel because he feels that the proportion of gravel is afunction of the highest current velocity at the time of deposition.Consequently, even a trace of gravel (0.01%) is enough to term thesediment “slightly gravel ly. ” This emphasis on the importance of grav-el creates a problem when dealing with sediments that are mixtures ofland-derived sediment and locally produced skeletal matter. For ex-ample, suppose an echinoid living on the bottom dies and its skeletonis buried by mud. Sampling at that site would yieid a sediment con-sisting of mud and the dissociated plates of the echinoid skeleton. Inthe analysis, these plates could conceivably amount to 5 or 6% of thesediment, requiring that the sediment be classified a gravelly mud.Yet the presence of 6% gravel is in no way related to the current ve-locities at the time the sediment was deposited. Present studies indi-cate that the amount of gravel in the sediment on the OCS is not afunction of the highest current velocities at that site but ratherproximity ,to a reef, either living or drowned. This concept has notbeen understood by those who cite the presence of large amounts ofgravel at depths of 60-100 m as an indication of strong bottom
.
.*
e
●

●
● ✍
●
☛
●
✎
☛✍
☛
●
‘a
33
currents. The ramifications of this erroneous reasoninq have qreatbearing upon the theorized fate oftom boundary layer by shunting offorms.
In carbonate sediments, whichless in ~, textural analysis istion o~ the origin of the sediment.
pollutants introduced ~nto the ‘bot-cuttings and mud from drilling plat-
are produced and accumulate more orof little value in the interpreta-in this case, a knowledge of the
nature of the ‘constituent particles is basic to the understanding ofthe origin of the sediment. The sediment is intimately related to thefauna and flora from which it was derived. The name of the carbonatesediment facies is derived from the dominant skeletal component in thatfacies. Because of this, one might expect that sediment facies wouldcoincide with faunal and floral facies. However, this is not alwaysthe case. At the Flower Garden Banks, for example, some sediment ap-pears to be moving downslope due to the force of gravity.
Bank Sediments
The sediment facies that have been delineated at the West FlowerGarden (Edwards, 1971) and the East Flower Garden (Volume Three, Chap-ter X of this report) are typical of the banks studied during the pre-sent investigation. Because of the bathymetric control over the dis-tribution of biotic communities that are the sources of sediments onthe banks, there is a consequent bathymetric control over the distribu-tion of the carbonate sediment facies. Minor exceptions to this gen-eralization may be caused by 1) excessively steep slopes, 2) the fre-quent presence of a nepheloid layer, and 3) vertical movement of theseafloor due to salt tectonics. Excessively steep slopes, such asthose present on the southeast side of the East Flower Garden, are thecause of non–deposition of the Amphistegina Sand Facies, which n’ormal-ly occurs at those depths. The presence of a nepheloid layer on lowrelief banks such as Coffee Lump, Stetson, Fishnet, and others limitsthe growth of the coral reef biota and consequently limits the supplyof carbonate sediment. Alderdice Bank is the only bank where carbonateand terrigenous sediment distribution was observed to depart from thenormal depth zonation of sediment facies. The two anomalous stationsat Alderdice can only be due to relatively recent displacement of theseafloor due to salt tectonics.
The facies that are present at any given bank are dependent uponthe relief of the bank and the depth at the crest of the bank. Thosebanks with the greatest relief and shallowest peaks will have the fullsequence of sediment facies as displayed at the East and West FlowerGarden Banks. The deeper the crest of the bank and the lower the re-lief of the bank, the fewer the facies present on the bank.

34
Off-Bank Sediments
Bank carbonate sediments merge with the terrigenous off-bank sedi-ments through a transition zone that varies in width with the degree ofslope of the outer bank. At the East and West Flower Garden Banks thistransition takes place in the Quartz -Planktonic Foraminifers Facies andthe Molluscan Hash Facies. The lower boundaries of these facies areartificial boundaries that are due to the necessary change from car-bonate sediment classification (generic) to the terrigenous sedimentclassification (textural).
The dominant skeletal components of the off-bank sediments are:planktonic and benthic foraminifers, echinoderm fragments, molluscfragments, and bryozoans. The mineralogy of the off-bank sediments isquite uniform except where the samples are takenthose places, detritus from the banks affectsthe coarse fraction and the fine fraction ofupon the nature of the bedrock on the bank.
thethe
close to banks. Inmineralogy of bothsediment depending
“*
-*
.,
9
*

580
3O
lDIT
AT
23i
JOD
0
35
● ’
‘*
.--J
a:.-ln
C#
E
.I
—

“*.
●
*
1
‘
-*
.
Figure !1!-2. East Flower Garden Bank bathymetry.

●
I
*-
37
I .
.
AZIMUTH = 45
“WIDTH = 6.5o
ALTITUDE = 30
‘HEIGHT = 1.50
‘BEFORE FORESHORTENING
0.50 + -84.44
0.00 I -126.00
AZIMUTH = 315‘WIOTH = 6.50
vUeparlment Of oceanography
ALTITUDE= 30 Texaa il~~ University‘HEIGHT = 1.50
‘BEFORE FORESHORTENING
Figure III-3. Three–dimensional perspective views, East Flower GardenBank . (Arrow points toward nortil. )
●

fJ--
——
c----:-.ii,i-:------ii, i-- ‘----f~ ‘:% “‘- ~,+“”, ‘*
.J
4 +
Y [.( (. w- /’:. K- .1.- “ “ - - ‘-
.— .—
t
—— –—
I +
.1 ,~A= “ “ ~-
1. “ WEST Fti WDEN MUM+
‘~’d:
-,. -
&-40t . ..!s ,.” —.
Gb-1’f7 (k”- ,;.= s..” .-. c..”. - ->
. -. . .
- - - - - -&=-=, — — ,..
- “,, --. ,. —,,”. $-,.<
.*J
—, . .7 , .- - - -e—? ‘~
; ,.:; , .. ~...—— —————— __— — _— _ ._ —_ —-
Figure fll-4. West Flower Garden Bank bathymetry.
*
“*
*
.
*.

V/n
WEST FLOWER GARDEN BANK
*
o
.
● ✎ AZIMUTH = 70 ALTITUDE = 30“WIDTH E 6.50 ‘HEIGHT = 1.50
‘BEFORE FORESHORTENING
~ 1.30 -24.21
-
1
1.00 -51.51
B0.50 -97.16
~J 000.-14281
●
/)●
Prea#rod bv
as All M UnivglE!!x--l
.AZIMUTH = 3 3 0 ALTITUDE =30‘WIDTH = 6.50 ‘HEIGHT = 1.50
“BEFORE FORESHORTENING●
✎
Figure III-5. Three-dimensional perspective views, West Flower GardenBank . ( Arrow points toward nortil. ]
●
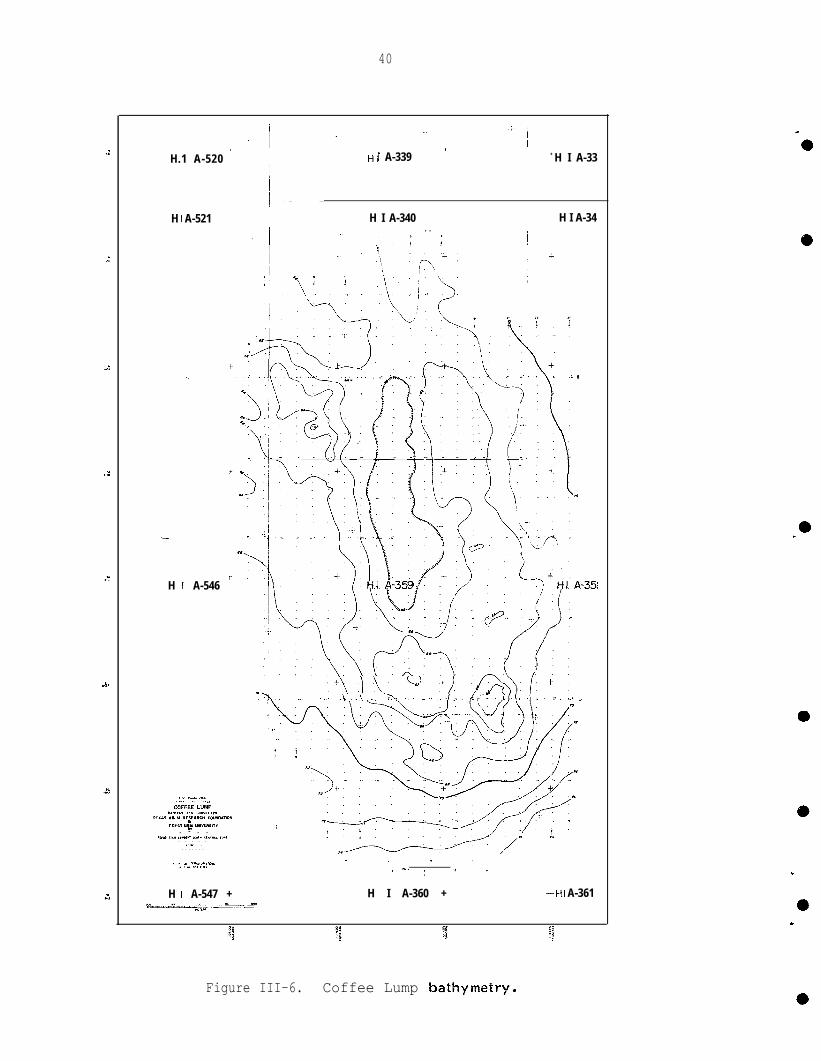
. iV23
,,;
,,:
“..,
40
.j. ””’”~.H.1 A-520 ‘ H i A-339 + H I A-33
I~1-------
H I A-521
t.,
+
:-
H [ A-546 ‘
. .. ,. A,’.’
.-, .> ...,COFFEE LUMP“.”..., r.. ,-”,, .“
,..., .8 M e,~.m.. WxuAwol’
,,... .* -as,,.. - . .
?,.. ‘“,, ,-. ~,. ,,.,... ,-. . . . .
.-. .. . . . . . .
H I A-340 H I A-34I . .
. . I+\ :\ \ Q )
-%... -. . .!...h... h
x’ +/
. . . .,. ”. . . . . . .. . . .
. . . ., ,.,, ,..
l“
H I A-547 + H I A-360 + THI A-361--=~,=– —A-=-
‘o
e
.0
.
.
Figure III-6. Coffee Lump bathytnetry.
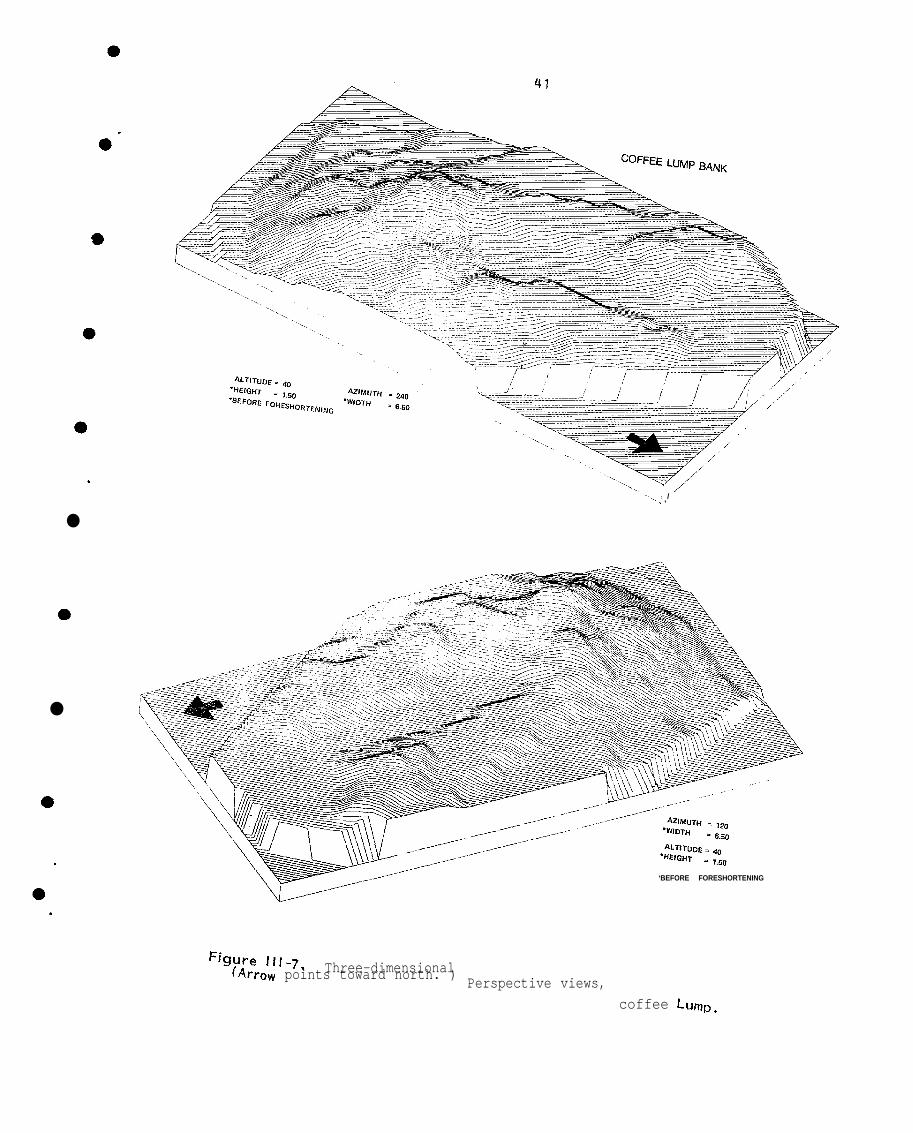
/ I--r r
*“
●
*
●
*
.
*.
‘igure 1//-7, Three-dimensional(Arrow points toward north. )
“ ..,’ , /
‘BEFORE FORESHORTENING
Perspective views,
coffee LumD.

193
105
.
149
107
151
195
. . . . .
.. ,.
2X . ,. . . . . . . . .- - - - -
Figure 11!-8. Geyer Rank bathymetry.
-0
.

.LGX2 VV4 flU!AGL2ADeb9L4weul o OcesuoL8bpA
L.btq p
*
43
● “.
GEYER BANK
.
● ✎
.
9.
/-’/ A Z I M U T H - ?20
.WIDTH = 6 5 0
A L T I T U D E = 40
‘ H E I G H T =150
‘BEFORE FORESHORTENING
Fiqure III-9. Three-dimensional perspective views, ~eyer Bank. (Arrowpoints toward north. )
●

‘o.
.. .,,
:.
. ’ .
,, ;.
~. ...
,. ,,:,
I ‘1,,. .109 I
k.”” 110,> ..1
\“-%
. . . . . - . . - “ . . .
,;+./.
.
+. I .
-. “.s . . .““. . . . . . .=, =..
ELvERS B4NK6, . . . . . . . . . . . . . . . .
,[.., .,. .,*,,.,” ,CUMWT,.”
.&. .-m,. = . . ...!- . . . . . .
I . . ,---
. “ . - ..-
m.rc.m .7,”., 4. u!,.,. . . . . ,,..
;“ .,, ..O -= . . . .
,,,
,::$
,
Fiqure 111-10. Elvers Bank bathymetry..

●45
*
* .
●
*
9
.
9.
A Z I M U T H = 3 0 0
‘WIDTH = 6.50
‘BEFORE FORESHORTENING
‘HEIGHT = 1,50 “WIOTH‘ 6’0 ~/
‘BEFORE FORESHORTENING
Figure [1[-11. Three-dimensional perspective views, Elvers Bank.Apparent cliffs near margins of blocks indicate limits of data.(Arrow points toward north. 1

AEB ciOd
-F
AE 22
46
.—
GB75 -%’4-2-%-. GB76
—
. .(
*’
GB 119
.— . ‘“.... . . .
+. . . . . . . . .
RELAI-SIDNER,.,.,”, ,,!, -..m m.
,.,,, . . . .,,,.,,. WW,ml
m .::—
G B }20 . . , .“ ‘l-.=- ,-w,, . . . .. . . . . -. . . .. .
. .
SB77
.
.
Figure III-12. Rezak-Sidner Bank bathyinetry.

-,
47
./
AZIMUTH=31O“WI DTH=6.W3ALTITUDE.41J“HEIGHT=l.50“BEFORE FORESHORTENING
\
~:,,, ‘“- - . - - - - ”. . .-
..=’~
Figure III-13. Three-dimensional perspective views, Rezak-Sidner Bank.(Arrow points toward north. )
,.. ,

.y,f9myrttsd ,lns8 f9nrlaiR .i'r-iI! siupiR
El I
48
.
,.; y,:
,.,,-$m.7
.,,.,( 39-3*
-60,0( 1,6s,
-:. –;.
+ ++
El. 335
+; .. ’.,..... ~~ -f’. . ”. . . . >.:,
.,. ,. . . . . . . . .
EI.336
-;-
+ +
El. 355
+ ,.,,”, !s,,., m.,,,“,, OF .,x,,. . , 0 ” . , , ” . +
FISHNET BANK
I 8ATHv ME TRt C SURVEY FOR
T E x A S A8M RE:EARc” FO”NCMT,ON
I TExas A a i UNIVERSITY
I OCEA!i&CS, ,.,.LO”lsmo. s.,, E LA.,,m, w,,. ,0”,
I .,. ,.O,. ,,.,-1I_. - - - - - - - _
I ,.. E“l” %8 34. !T0..
-1- .,*,RS +
.

\'JlIUMIjk HTGIW
= 3QUTITJA o.r = THOt3H
.L0X98 VV fluAo&ef4lDGbSL;woul 04 Oce9uodLbpA
●
4 9
● BEFORE FORESHORTENING--.1/”’
AZIMUTH = 80.— —-— -——. . _
.—-— —_
* W I D T H = 6.50
ALTITUDE = 40
● HEIGHT = 1.50
‘BEFORE FORESHORTENING&
Figure 111-15. Three–dimensional perspective views, Fishnet Bank.Apparent cliffs near margins of block are limits of data.
(Arrow
points toward north. 1

rcEoc
‘9.
1— — . . . . — — .
i-
SMI [70
J
SMI 171
“’ hY\ “’
I
I i i i
. . .!..
i
SMI 172
. / - ’ , - . . 1) 4 .J
1. ,.+ !‘/ ,: ., -.- -r!.., , ., ...,
~: .7”, . . ,,.. .
Figure 1!1-16. Alder dice Bank bath ymetry,
.
●

VDEBDICE RVL'lK
51
●
●
\// ALTITuDE = 40
‘HEIGHT = 1.50
N/-- ● BEFORE FORESHORTENING
ALTITUDE = 40
‘HEIGHT = 1.50
‘BEFORE FORESHORTENING
Figure III-17. Three-dimensional(Arrow points toward north.)
“--’-&
perspective views, Alderdice Bank.

gäaL6 ffl-j3 sqnj9 UK ppAw6p.A
52
7, 0,-2,,,50
E . 6 . 9 7 6
. % 6
1 I1 ’
El 382 {- .4. El 383 -
+—”:!.
~E.3975 :, , ,,
.E I
-t ‘:HRiaEr”’ :m
JAKKULCl BANKs.1tIvNE7Rlc WRUEY FOR
TEXAS Ae?.! RE:EARCH FOUNDATIOh
TEx@S A 8 hi,UNWERSITY.,
OCEANONZCS. INC.,O.!s} ..1 ST.T, ,’.,,.7 scum .0.!
. . . . . !“. . . !..,. . .. e, NC. ..s.
03.,0”, (m, . . . . ? es .C7E....7”. x. ,,”,.
.,> ,,,
G.C. 6.,, j !m . !... mm ,.m ..~,——” a,,,,,m.GC 5 —= ~ **==‘o” —~”
+ + +I I I,: 0.:i!’ g:
.0,
.03
,...
,.,,
9
,
.
*

If ii
\\
NN
:T // oa.a HTQW
= OOTtTJA oa.r = THI3H
-,
53
“ -J/ .HEIGHT = 1.50
● BEFORE FORESHORTENING
. - - ’
\\s’””/y””’ Pr*#orod byD.oartntent of Oc@anooraph Y
Figure III-19. Three-dimensional perspective views, Jakkula Bank.(Arrow points toward north. )

)ILIAS 2uHAIO
I
I i’ i II
., . - - T . , . ,
sT 314 +
1,
)’-””. . . . . ,., ,..— _,).
s.T 31:;,
. . ., . . . . . . ..,, , . .- ..- ~
.
,0
Figure 111-20. Diaphus Bank bathymetry.
●

I:
I *‘.
e
*
●
.
*.
55
Az IMUTH = 3 3 0
● WIDTH = 6.50
ALTITUOE = 4 0
● HEIGHT = 1.50
● BEFORE FoRESHORTENING
—-------—----- .._ --
AZIMUTH = 70 - _
● WIDTH = 6.50. .
ALTITUOE = 4 0
● HEIGHT = 1.50
● BEFORE FoRESHORTENING
F~g~re 111-21. Three-dimensional perspective views, Diaphus Bank.Apparent cliffs near margins of blocks indicate
limits of data.
(Arrow points toward north. )
m

i $
+
J.EXVS YgYl uCzwa4 tOI%OUJJOM
●
‘*.
,.-+ –.7,=.:. . . . . . . _+ + + +
; i. ..-. s. . .....1
..- 1.,
. .
.,, +,.’,..
+
. . .“r.”- -+
. .---- —
. . .
i:’:”;+:.:.::+ —.–L—J.
?
. . ’ .~,:==:
.
.-. .“%:.
. .“
.
.: ,
:,..
. .
,.:m
.;
+
t.
+
+—–.,.. , . .. ..#-—
+,
./ :
.1
+ i----ok’”“+-+” -::=z? mm W?(K
+
.-”.- - -.”. , .,,.
- . . . . . .-.6. . ..,ss., -.!
. ,-. . . ..,. ~... -
1
3
:
.
9.
II-22. 32 Fathom Bank bathymetry.

*
0“.
●
●
*
.
●
9
.
*.
57
1.15 52 .Sl~
1
I.oO 5 3 . 5 6
0.50 58.78
0,oo fj4.oo
32 FATHOM B~NK — - - - - - YAZIMUTH = 70
● wIDTH = 6.50
● B E F O R E F O R E S H O R T E N I N G., ._e_
● w]DTH = 6.50
● BEFORE FORESHORTENINGALTITUDE ‘ 40
,~E\GHT = 1.50
. 32 Fathom 13ankm
Figure 111-23* Three-dimensional PersPect~ve ‘lews.’ .
Apparent cliffs near margins of blocksindicate Ilmlts of data”
(ArroW points toward north ● )
BY I[
●

4
-a
58
.—
[
_—— _—— —-1- ,
..5s3 ,.,m+ t +:
II
“ +
,7.,
‘-+
“+
““+
“ +
“+
-g-
“4- +
+ +
t
+ +
,.. ,,.
? ,.
.;. .27.s
E ,,
+
t
+
+
+
+
+
----... s or .E.!m
A?PLEBAUM
+
M,. ”.tr.!c W@”E”
.“
TDOS & 8 h! RESEARCH FOUNDATION..,,,,,,., m
LOFI&C SERVICE wRPORaTlON
●
“*.
●
.
Figure 111-240 Applebaum Bank bathymetry.

Lxa Yg,i flUlAeLa,(A04
bLSbvieq
59
●
● “.
●
*
*
.
9“
I
I
!I*
.
●
.42
.62
,2.31
‘-----d/ ~.*(J.2m.ooAZ)MUTH=330A~lTuDE=40
BEFORE FORESHORTENINGWIDTH=6.50HEIGHT=I.50
.421.62
AppLEBAuM BANKAzlMuTH=~35ALTITUDE=40
BEFORE FORESHORTENINGWIDTH=6.50~E\GHT=l.50
Figure III-25. Three-dimensional
(ArroW pointstoward north ● )
perspective ‘iews’
0.50
t
-~52.3t.
0 . 0 0 -210.00
- ‘-
Applebaum Bank.

TABLE IV-ICATE(33RIES ANO ZONES OF HARD-BANKS IN THE GULF OF MEXICO
Bank Category* Zone Depth (m)F l o w e r G a r d e n ( W e s t ) A I 20-35
Bank CaTegory* Zone Depth (m)V I I * * 7Adam (Big)
Adam (Small)Alderdice
VI I**I v 55T67Trans . tt 67-79VI ?VI 57-70VI 56-70VI 59-70VII** ?
60-75~~ans. tt’ 7 5 - 8 4
A I l l 35-50Iv 4 6 - 8 8T r a n s . tt 8 8 - 8 9I v 60-98
Ac
ApplebaumAransasBakerBaker (South)BlackfishBouma
Geyer Av 37-52Trans . tt 9 8 - 1 2 3c
cD
Hosp i ta l (Nor th )Hospi’ral RockJakkula
VI 58-70VI 59-70I v 59-90T r a n s . tl’ 9 0 - 9 4VI I** ?I v 6 0 - 8 2
cAcDAc
tc
B r i g h t I l l 37I v 52-74
MysteriousParker
Trans . tt 74-?v 40-45VI 62-68VI 73-106VI 62-70I v 60-97Trans . tt 97-123Iv 56-72
~;ans. ?t%-%I 20-35II 28-46Ill 35-52I v 46-82Trans . tT 82-86
cClaypile ( 2 ) * * * BCoffee Lump cDiaghus t c
Trans. tt 8 2 - ?I v 55-93Rezak-SidnerT r a n s . tt 9 3 - 9 9VI 65-75
18-52!1 58-70v 20-52Ill 4 5 - 4 7I v 4 5 - 8 2T r a n s . tt 8 2 - ?Iv 6 6 - 9 2Trans . tt 9 2 - 1 0 8VI ?
SackettSonn i erSouthernStetson18 Fathom
Dream cE I vers
tEwing A
cF ishne t cF lower Garden (Eas t ) A
AAAc
BAAcA28 Fathom
32 Fathomcc
it A : Maximum protection=ommended; B: ProtectIon strongly recommended; C:recommended; D: protection not recommended.
P r o t e c t i o n
**
***
t
tt
Nepheloid zone probably envelops these banks entirely. ‘
Ree f -bu i ld ing i s poor ly deve loped o r a r res ted .
Not adequately explored; shallowest port ion of bank may harbor yet undetected reef-buildingpopulations.
T rans i t ion zone be tween A lga l -Sponge Zone and deeper , tu rb id -wa te r , lower tank zones.Comparable to an Antipatharian Zon&
● 9 * ‘o ‘ * a ● ‘ ● 4 ●*

e
*“.
●
●
e
.
●
61
CHAPTER IV
CATEGORIZATION AND ENVIRONMENTAL RANKING OF HARD-BOTTOMBIOTIC ZONES AND BANKS
T. Bright
INTRODUCTION
Results of the biological work performed are reported in Volumes .Three and Four, Chapters X-XX, and summarized in the Executive Summary.This chapter describes a method for biological categorization and“environmental ranking’i of biotic zones and banks which we think willbe useful for management purposes.
The categorization and ranking system presented below is an at-tempt to provide BLM with a more “tangible” means of assessing bioticzones and banks in the decision-making process. We have had frequentrequests from federa! employees concerning the “value” of one bank incomparison to others, and it has often been difficult to convey clearand simple opinions. The following should help ease the confusion con-cerning the “environmental priority” and the contemporary biotic zonesof the banks.
BANK CATEGORIES
In past reports we presented a system of bank categorization whichis now obsolete and should be replaced (Bright and Rezak, 1978a, b).The revised categorization is not meant to represent a final word onbenthic zonation on hard-banks in the northwestern Gulf of Mexico. Thesupposed !lAntipatharian Zme’l and II Nephe\oid Zone” are particularlyproblematic and may not be valid designations in the biological sense.Each surely represents several biotic assemblages of superficial simi-larity which could all ultimately be given separate zonal designations.However, such “hair splitting” is not feasible at present and wouldprobably serve little purpose in terms of “environmental prioritiza-tion. ”
I
The most appropriate means of categorizing the banks biologicallyinvolves the recognition of a number of distinct benthic biotic zonescharacteristic of hard-banks in the northwestern Gulf of Mexico, withan indication of the banks on which each zone occurs, and the zones’depth ranges on each bank. This system of categorization seems morefunctional than the previous one insofar as certain banks are more com-plex biologically than heretofore realized and cannot be easily accom-modated by the old system.
.
Seven characteristic benthic biotic zones have been identified.These are classified within four general categories describing degreeof reef-building activity. These four categories and the benthicbiotic zones within them are tabulated in Table IV-1 and describedbelow.
62
Category A consists of zones of major reef-building activity;maximum environmental protection is recommended. Category B consistsof a zone of minor reef-building activity; environmental protectionis strongly recommended. Category C consists of zones of negligiblereef-building activity yet containing populations of crustose coral linealgae; environmental protection is recommended. Category D con-sists of a zone of no reef-building activity and insignificant popula-tions of coralline algae; protection is not recommended.
The Category A zones are:
1.
Il.
Ill.
Iv.
Diploria-Montastrea-Porites Zone: A zone consisting of Iiv-ing, high diversity coral reefs.
Madracis Zone: A zone dominated by the small branchingcoral Madracis mirabilis, which is producing large amountsof carbonate sediment.
Stephanocoenia Zone: A zone consisting of living, low diver-sity coral reefs.
Algal-Sponge Zone: A zone dominated by crustose cora!line
●
“a.
*
●
algae activ~ly producing large quantities” of carbonate sub–stratum [considered here to extend downward, past the depth atwhich algal nodules diminish in abundance, to the greatestdepths at which coral line algal crusts are known to cover asubstantial percentage of the hard substratum) . This is theIargest of the reef-building zones in terms of area of seabottom.
The Category B zone is:
v. Mil Iepora-Sponge Zone: A zone where crusts of the hydrozoancoral Pfiillepora share the tops of siltstone and c!aystone out-crops with sponges and other epifauna.
The Category C zone is: .
VI* Antipatharian Zone: A zone where limited crusts of corallinealgae and several species of corals exist within a zonemarked by sizeable populations of antipatharians. Banks sup-porting Algal-Sponge Zones (A, IV above) generally possess azone comparable to an Antipatharian Zone as a transitionbetween the Algal-Sponge Zone and deeper, turbid-water, lowerbank zones. Such “transition” zones are indicated in Table ●Iv-1.
m●
9

63
.
● ✎
●
*
The Category D zone is:
VII* Nepheloid Zone: A zone located at the bases of all bankswherein high turbidity, sedimentation, resuspension of sedi-ments, and resedimentation dominate. Rocks and drowned reefshere are generally covered with veneers of fineEpifauna are depauperate and variable; deep-waterand solitary stony corals are often conspicuous.occurs in some form on lower flanks of all banksdepths indicated for Zone VI (Table IV-1, above) .
ENVIRONMENTAL PR1ORITY RATINGS
sediment.octocoralsThis zonebelow the
Any assignment of I’environmental priority” to the aforementionedbiotic zones is subjective. ‘ It is presumed that the considerations inassigning levels of concern for these zones are the degree of activereef-building in progress, biological diversity, aesthetics, rarity,and areal extent. Table IV-2 depicts subjective rankings given by theauthor to the various zones for each of these considerations. Thescale of 1 to 8 indicates lowest to highest ranks, respectively. Theaverage of all ranks for each zone is taken as a “priority index, ” withthe highest number representing the highest priority. A priorityrating for any individual bank may be obtained by summation of allappropriate priority indices for the zones occurring at the bank (TableIV-3).
It should be noted that the depth ranges for the ,41gal-SpongeZone (A, IV) , Antipatharian Zone (C, VI) , and the Nepheloid Zone {D,V II) vary from bank to bank depending on reiief, surrounding depth, andwater quality. Decisions concerning establishment of boundaries forno-drilling areas and regulations concerning shunting of drill efflu–erits to the bottom near any particular bank should take into considera-tion the specific depths of distribution of biotic zones to be pro-tected on that bank. For example, whereas the lower limit of theAlgal-Sponge Zone at the East Flower Garden Bank is 82 m, at Geyer Bankit is 91 m. !f specific measures were taken to protect the Algal-Sponge Zones at these two banks, this depth differential wou!d have tobe considered. We also point out that these depth estimates are basedon limited reconnaissance studies. More detailed observations mayincrease the known depth ranges somewhat.
●
.
●✎
●
. .

64
TABLE IV-2PRIORIIY RAM(ING OF BIOTIC ZONES ON HARD-BANKS IN THE
GULF OF MEXICO
1 = l o w e s t priori~y8 = h i g h e s t p r i o r i t y
BIOTIC RANKS ZONEZONE Degree of B i o l o g i c a l Area 1 PRIORITY IFJ)EX
Reef Bui ld ing D i v e r s i t y A e s t h e t i c s R a r i t y E x t e n t (Avg. Rank)
1 . D - M - P 8 8 8 7 6——— 7 . 4
I l . Madracis 7 6 6 8 8 7 . 0
!11. Stephanocoenla 6 5 5 6 7 5 . 8
I v . A lga l -Sponge 5 7 4 5 4 5 . 0
v . Mil Iepora 4 4 7 4 5 4 . 8
VI* AntIpatharlan 3 3 3 3 3 3 . 0
V1l. Nepheloid 2 1 2 2 2 1 . 8
SurroundingMud Bottom 1 2 1 1 1 1 . 2
KEY :
Degree o f Ree f -Bu i ld ing : ranking of relat ive amount of carbonate substratum produced per
B i o l o g i c a l D i v e r s i t y :
A e s t h e t i c s :
R a r i t y :
Areal E x t e n t :
Zone Pr io r i t y Index :
u n i t a r e a ( 8 = g r e a t e s t ) .
r a n k i n g o f a p p a r e n t r e l a t i v e b i o l o g i c a l d i v e r s i t y o f z o n e s( 8 = h i g h e s t d i v e r s i t y ) .
rank ing o f re la t ive va lue o f zone to spor t d ivers , f i shermen, ands c i e n t i s t s w i t h c o n c e r n fcr !Jvisual appealtt a n d !Iquality}! of thebenthic communi t i es ( 8 = most va luab le ) .
rank ing o f apparen t ra r i t y o f occur rence o f zones a t comparab lela t i tudes in the Weste rn Nor th A t lan t ic Ocean (8 = ra res t ) .
inverse rank ing o f zones in te rms o f a r e a of sea bottan o c c u p i e din nor thweste rn Gu l f o f Mex ico (8 = l eas t a rea ) .
average o f a l l r anks fo r each zone .
.
*
.
.9
*
.

BANKS
East F l o w e r G a r d e n
W e s t F l o w e r G a r d e n
1 8 F a t h o m
B r i g h t
Geyer
E I vers
28 F a t h o m
AlderdlceJakku la
Ewing
P a r k e r
Rezak-Sidner
Bouma
Sonnier
S t e t s o n
Claypile
F ishne tDiaphus%ckett32 FathomApplebaumCof fee LumpSouthernNorth HospitalHospital RockBakerSouth BakerAransasDreamBlackfishMysteriousBig AdamSmall Adam
TABLE IV-3PRIORITY RATINGS FOR EACH BANK
( L i s t e d i n d e s c e n d i n g o r d e r o f e n v i r o n m e n t a l p r i o r i t y )
ZONES AND ZONE PRIORITY INDICES BANK PRIORiTYRAT I NG
D-M-P M A D . STEPH. AL.SP. Ml LLEP. ANTIP. NEPH. Surrounding (Sum of Pr ior i tyI I I Ill I v v VI VI I Mud Bottom Ind ices )
7 . 4 7 5 . 8 5 . 0 4 . 8 3 . 0 1.8 1.2
x x x x
x x x xx x
x x
xxx
xx
xxxx
x
xxx
xxxxxx
xxxx
xxx
x
xx
xxxxxx
xxxx
xxxxxxxx
xxxxxxx
xxxxx
xxxxxxxxxxx
xxxx
xx
x
xx
xxxxxxxxxxxxx
xxxxxxxxx
363616.816.815.811111111111111117 . 87 . 87 . 866
:66
:66
:633
x x 3x x 3

*
.
●
*
9.
●

66
.
● ✎✌
.
9
CHAPTER V
WATEFt AND SEDIMENT
D. McGrail
DYNAMICS
INTRODUCTION
in t e r m s o f m a n a g e m e n t r e q u i r e m e n t s , t h e m o s t c r i t i c a l i s s u e a d -dressed by our hydrodynamic research concerns the Flower Garden Banks,in particular whether water from the base of the bank can flow up tothe living reef. This is significant in that if water from the base ofthe bank can reach the reef, so could material introduced into the bot-tom boundary layer during petroleum drilling operations. However, onthe basis of many lines of empirical evidence and the results of dynam-ical analysis, the possibility of such an occurrence is so remote as tobe negligible. Not only are the chances remote, but the circumstancesunder which water could flow up and over the bank from the sea bedwould be so catastrophic that no drill mud could come to rest on thereef and mechanical damage to the reef builders would be devastating.
The following is a discourse presenting the evidence leading tot!lese conclusions.
PERSPECTIVES FROM GEOPHYSICAL FLUID DYNAMICS
At first inspection, it may seem that the East Flower Garden Bankis a rather insignificant bump on the seafloor. It extends only about11 km from north to south and is 7 km across. However, most of thebank rises 50 m or more above the continental she!f. Expressed interms of dynamics, an analoque in the atmosphere would be a solitarymountain rising to half the ~hickness of the earth’s atmospherepeak at 80% of the height of the atmosphere.
No reasonably intelligent person should be surprised thatflow about such an obstacle is exceedingly complex. Each scaleand Ienqth oresents the possibility of some new mode of motion.
with a
oceanicof timeThese-.
range from the mean circulation “of the shelf waters to infinitesimallysmall random turbulence. It would be a formidable task indeed to at-tempt simultaneous analysis of all the superposed motions. Fortunate-ly, that is not necessary. Rather, it is the practice of physicaloceanographers to determine which of the many possible modes are actu-ally present, then analyze each mode separately.
In this case, the records from the moored current meters and themany profiles of salinity, temperature, current velocity, and transmis-sivity were used to determine which frequency bands in the range from10 cycles per hour (cph) to approximately 4 x 10⁻⁴ cph containedsignificant amounts of energy. These data also yielded information
●

c d d.
67
regarding the form of the important modes of motion and their dynamics. .
The pertinent geophysical fluid motions are “governed by the a
following equations:.
. Continuity - for an incompressible fluid (conservation of mass)
(1)
where
; =U+ vi-w
andu, v, w are the velocity components in the x, y, zdirections, respectively.
. Conservation of momentum (appropriately scaled and dimensionlessform)
whereP =i=t=
v =E =,, =
L=
f =
c=
F =
p r e s s u r eunit vector in z direction~imedifferential operator,trL-2f-1, the Ekman Number
kinematic viscosity of the fluida characteristic length scale of the flow
2W sin 0, the local vertical component ofrotation
I q I L-l f-l, the Rossby Number(T f)-l, ratio of characteristic time sca!eof flow (T ) to rotational frequency.
Density distribution is approximated by
P.pm–a. (T- Tm)+a~(S-Sm) (3)
●
.
9.
●

9n 9M 0 (2)
●
*’
68
where m denotes the mean value
P = mean densitya. = coefficient ofT = temperatureS = salinity
as = coefficient ofin sa!inity
An approximation for the pressure
of the fluidthermal expansion ~
density increase per unit increaseap
-7s-distribution is
wherea= the slope of the isopycnals against the geopotential
surface (depth dependent)
B = the slope of the sea surface against the geopotentialsurface (depth independent)
d = any given depth.
From these it is possible to estimate the height (h) to which aflow would rise if it struck a barrier. First, assume that the flow isentirely along one horizontal axis, x for example, and assume furtherthat the flow is constrained to remain two-dimensional in the x-zp[ane, The continuity equation becomes
Now assume thatis lost to friction atthe fluid is vertically
the fluid is inviscid (1) = O] , so that no momentumthe bounding surface of the barrier, and thatstratified
&az +0
Finally, assume that all of the vertically displacedaccommodated by accelerated flow over the barrier sosurface rtfs remains undisturbed (nfs = 0 at x,y, O) .
(6)
water can bethat the free
.
*.
9

69
One method of estimating h is to examine the instantaneousconversion of the kinetic energy of the flow into potential energy byraising a particle above its equilibrium
(7)
Since it was assumed that the free surface would remain rigid, theconversion to potential energyA is accomplished by raising the isopyc-nals or internal surfaces 01 = P where 6 is a constant density. Then
fi because that gives the relativeP in (7) may be replaced by h ~zdensity of a particle on nl at a position h above its equilibriumlevel in a fluid with stratification ~ . Then (7) becomes
az
(8);32 2 aPF
= gh ~~
apUsing the mean density gradient observed in April 1979 for ~
(2 x 10⁻⁷ gm/cm4) and 100 cm/sec for ~, (8) yields a value of5.05 x 103 cm, or 50.5 m for h.
A physical example of this situation would be a 100 m deep channelcapped by a rigid lid with a 70 m high barrier representing the EastFlower Garden Bank somewhere in the channel. A 100 m wall of inviscidfluid having the density structure of the water column observed at theEast Flower Garden in April would be run down the channel and into thebarrier. Fluid from the base of the column would rise 50 m as itskinetic energy was converted to potential energy. The lowest 20 m offluid would be completely blocked by the barrier and the remaining 50 mof the fluid striking the barrier would be accelerated through the 30 mgap at the top of the barrier. Since the fluid is assumed to be incom-pressible, the velocity through the gap would be 100 cm/sec “(1 + 50/30), or 267 cm/sec (5.3-knots). - -
Notice that even under these absurdlyfrom the bottom boundary layer still couldliving reef.
If the fluid were viscid, flow over the
adverse “conditions, fluidnot reach the height of the
reef would be retarded andthe fluid could not move horizontally fast enough to accommodate thatdisplaced from below. This of course would reduce the vertical dis-tance that the lowest level fluid could rise because of the adversepressure gradient created. If the rigid lid restriction were removed,some of the excess displaced fluid could be accommodated by raising thefluid surface. As shown in (7) , however, the elevation of the fluidsurface would require approximately 20% of the flow’s kinetic energyfor each 1 cm of rise. Thus, the addition of viscosity to the problemleads inevitably to a reduction in the height (h) to which the bottomwaters could rise.
‘*
*
.
70●
I .
*
Removing the stricture against three-dimensional motion would fur-ther reduce h. The build up of dense water on the upstream side of thebank would produce a pressure gradient which would cause a divergenceof the flow around the hank. That portion of the flow so divertedwould not be available for conversion to vertical motion.
[n summary, under the worst conceivable conditions the flow atthe East Flower Garden Bank could not rise from the seafloor to theheight of the living reef. A reasonable expectation would be that:the flow would rise 15 to 20 m along the upstream face of the bank;flow over the top of the reef would be sharply accelerated to accommo-date the excess volume; and a pressure gradient would be created on theupstream side of the bank that would split the flow and cause it tomove horizontally around the bank. In the lee of the bank one mightexpect some downward flow from the bank crest and either closure of theflow along the bathymetric contours or separation of the flow with thed e v e l o p m e n t o f e d d i e s .
Note that this analysis does not require recourse to argumentsinvolving the conservation of vorticity or strong stratification.
A large body of literature regarding orographic effects in geo-physical fluid dynamics has evolved, but the range of parametersstudied is not applicable to the problem at hand. Studies of orogra- “phic effects in the atmosphere, such as that of Kasahara (1980) ,, forexample, are inapplicable because the fluid is compressible. McCartney( 1975) analyzed theoretical studies of obstacles in both rotating androtating stratified f[uids. In the nine investigations summarized, theRossby number, c , was assumed to be zero or <<1, the Ekman Number, E,was assumed to be zero, and the stratification parameter,
where
S_9fi AP ~2 ~2
‘f2~o L2 = fz
l-l = thea~ater depthAP = H=
S = H/l
L = horizontal length scale of the obstacle
and
N = Brunt-V aisala frequency
was assumed to be < 1. It was also assumed in these studies that, hothe height of the o~stacle, was <<H.
In the case at hand, s = 3.68, ho = .7H E <<1 and S = 25.8.For problems in which the parameters are sui{ably sm~ll, the obstaclewould be isolated in the flow by closed streamlines known as a Taylor
●

71
Column. If stratification is important (S - 1) , the column becomes acone (Hogg, 1980) . The key parameter according to Hogg ( 1980) is
He shows that for PT stilaller than 1, no Taylor column can form. Forthe East Flower Garden Bank in April, PT was found to be approximately2 x 10-1. Greenspan ( 1969) states that the pluglike flow of theTaylor column is a consequence of upward propagating waves over theobstacle and that if the Rossby number were large, the waves would beadvected downstream so that the column could not form. Hogg’s criteri-on (pT) would indicate that, for velocities of up to about 27 cm/see, aTaylor Column or cone could develop over the East Flower Garden Bankfor flow of sufficient duration for rotational effects to be important(approximately 24 hours) . Still, the stratification is so strong, evenin April, that the cone would be compressed to the height of the bank.However, flow around the bank would still be completely two-dimensionalin horizontal planes.
Some have argued that mixing from surface gravity waves during thepassage of storms could raise sediment from the bottom to the height ofthe living reef. If one considers a wave with a 10 m height and a20 second period–-a monster wave for the Gulf--and employs Airy wavetheory, it is found that the maximum orbital diameter at 90 m depthwould be only about 60 cm.
‘*
o
.
THE EVIDENCE
9Several lines of evidence clearly show that sediment from the base
of the bank does not rise above the 75 to 80 m isobath. Rezak (thisreport) has shown that fine sediment (silt and clay) are nearly absentfrom the bank substrate above approximately 80 m on the EaSt FlowerGarden Bank. Bright (this study) has demonstrated significant bioticzonation at about 80 m, above which clear water fauna exist and belowwhich they are missing.
aIn all of the transmissivity profiles taken at the East Flower
Garden Bank since the inception of the monitoring studies, no signifi-cant suspended sediment has been found above about 75 m in the watercolumn. In all of the temperature profiles taken at the East FlowerGarden Bank, no water with a temperature equivalent to that at the baseof the bank has been found above about 80 m depth. The maximum dis-placement on an isothermal surface during any one survey at the bankdid not exceed about 20 m.
The analysis of variance for current meter records described byFreeland, Rossby, and Rhines ( 1975) was performed on the records fromthe meters moored on Arrays 1 and 2 (Figure V-1) . This analysis deter-mines the major and minor axes of variance relative to true northi The
●
.
9

A
II
no
/S
,1
/
1 /
E21 cOE CDE 'Z ,/ ,/ \oo.i, ,
'0 - 01
S.
"FI
72
*. .
9.
Figure V-I. Location of current meters, East Flower Garden Bank.

73
results were that the records from all of the meters at array 2 showedstrong polarization along the local isobaths. Even the meter at 60 mdepth showed very little cross-i sobath flow. The meters at 94 m and96 m showed even stronger topographic steering and an accelerationcommensurate with that required to accommodate the excess volume offlow b[~cked by the bank. That is, instead of flowing across the iso-baths, the flow accelerated laterally.
The velocity profiles obtained in July 1979 clearly demonstratethe expected topographic steering. The flow split near the middle ofthe bank with northerly flow along the isobaths north of the split andsoutherly flow south of the split. The maximum displacement on theisotherms at station 26, where water in the upper portion of the watercolumn was flowing across the isobaths, was only 15 m. No elevatedsuspended sediment concentrations were observed in any transmissivityprofiles above 80 m on the bank, even with strong flow from the westduring the July 1979 sampling cruise.
The evidence from the field observations, therefore, strongly sup-ports the conclusions reached from theoretical considerations. Waterfrom the base of the East Flower Garden Bank cannot flow up to theIeve! of the living reef= Therefore, material introduced into the bot-tom boundary layer in the vicinity of the East Flower Garden Bank couldnot reach the reef -building organisms.
.
8

74
.
● ✎
CHAPTER VI
SUMMARY AND RECOMMENDATIONS
R. Rezak
INTRODUCTION
Eleven .banks (East Flower Garden, Coffee Lump, Rezak-Sidner, Dia-phus, Jakkula, Alder dice, Elvers, Geyer, 32 Fathom, and Applebaum) werecharacterized biologically and geologically using observations and sam-ples taken by surface vessel, research submersible, and rock dredge.Six of the banks (East Flower Garden, Coffee Lump, Fishnet, Diaphus,Jakkula, and Aiderdice) were also subjected to water and sediment dy-namics studies. A strong correlation was found between biotic zona-tion, nature of the substrate, and depth at the top of the nepheloidlayer.
Five banks bear reef-building popula~ions of coralline algae with-in well developed Alga! –Sponge Zones on their crests (Elvers, Geyer,Jai{kula, Rezak-Sidner, and Alderdice). These banks also display thenormal carbonate sediments such as algal reef rock, algal gravels, andcarbonate sands associated with biogenic reefs. The crests of allthese five banks lie above the normal depth of the nepheloid layer.Diaphus Bank may also have an Algal-Sponge Zone, but its crest is nearthe lower depth limit of the Zone at the Flower Garden Banks. Theother four banks (Coffee Lump, Fishnet, 32 Fathom, and Applebaum) bearless diverse benthic assemblages adapted to chronic turbid water condi–tions.
EAST FLOWER GARDEN BANK
Geology
P-lo significant normal faulting has occurred at the East FlowerGarden Bank. The crests! graben which is typical of most of the banksexamined has not yet developed. However, the dissolution and removalof prodigious amounts of salt from the crest of the diapir have beendocumented, and graben formation at this bank cannot he far in the fu-ture. At that time, radial faults that may extend some distance awayfrom the bank can develop. Therefore, it would be unwise to emplaceany permanent structures in close proximity to the bank. It isstrongly recommended that sensors be emplaced at several sites on theEast Flower Garden so that the amount and direction of movement at thecrest may be measured.
Living coral covers 50 toMontastrea-Porites Zone (high
B io!ogy
62% of the hard-bottom in the Diploria-diversity coral reef) at the East Flower

75
Garden Bank . Montastrea annularis is the most dominant coral, covering23 to 37% of the hard bottom. No apparent changes have been observedin the population levels of corals or in their dominance ranking duringthe years 1978 arid 1979.
Current accretionary growth of M. annularis may average7 . 2mm/yr. . and that of Stephanocoenia in~ersepta, 5.8 mm/yr. Thereappear to have been no changes in rate of accretionary growth of thesetwo dominant corals over the past decade. Rates of encrusting coralgrowth and coral mortality are highly variable, but there is no indica-tion that encrusting growth has been generally impaired nor that mor-tality has substantially increased during 1978 and 1979.
Settling of larval corals and early growth and development havetaken place during 1978 and 1979 at a rate which is believed to be nor-
9
real.
Leafy algae populations were greater in the spring of 1979 than infall, winter, or summer. The genera Dictyota, Pe~onnelia, andLobophora dominated throughout the year, with seasonal changes in rela-tive abundance. *
There was no obvious change in “health” of benthic communitiessoutheast of the main coral reef at the East Flower Garden. The condi- .
tion of corals and coral line algae within the Algal-Sponge Zone ap-peared similar in 1978 to ti~at of previous years. There were no signsof mass mortalities on any conspicuous component of the community. **
The effects of a natural brine seep on benthic biota at the EastFlower Garden were found to be restricted to an area within a few n~e-tres of the brine and recognizable brine-seawater mixture.
In general, there is no indication of a significant change in 3benthic community structure or condition during 1978 and 1979.
Water and Sediment Dynamics—
Water column data taken during 1980 clearly indicate that the wa-ter from the base of the East Flower Garden Bank cannot flow up to the o
level of t!le living reef. This conclusion is supported by severallines of evide”nce. Rezak (this report) has shown that silt and clay arenearly absent from the bank above about 80 m and that the movement ofsediment on the banks is mainly by gravity. Bright (this study) hasclemonstrated a significant biological zonation at an approximate depthof 80 m, above which clear water fauna exist and below which they aremissing. Sediment from the base of the bank cannot rise above the 75to 80 m isobath. We recommend that water column monitoring be ex-tended for another year. Data taken during 1979 were anomalous dueto the excessive amount of run-off caused by heavy rains in the Missis-
*
sippi em bayment.@
●
76●
● ✍
✎
☛
●
●
COFFEE LUMP
Geology
Coffee Lump is a relatively inactive bank, underlain by a salt di -apir that has not moved upward appreciably since Late Pleistocene time.The removal of salt by phreatic marine waters from the crest of thebank has been minimal, as evidenced by the low relief at the crest ofthe bank.
The bank is continuallyfauna and flora of the bankfishing banks, which are also
immersed in a nepheloid layer, and theare similar to those of the South Texasimmersed in a nepheloid layer.
Biology
Preliminary analysis of community structure indicates that above68 m, at least, Coffee Lump harbors a soft-bottom macro-epifaunal com-munity which is distinctly bank-related and differs substantially fromsoft-bottom epifaunal communities found adjacent to banks in the north-western Gulf of Mexico. The upper Coffee Lump soft-bottom communitiesappear to be more diverse and to harbor a greater abundance of organ-isms than is typical of off-bank, soft-bottom communities.
Biotically, the hard-bottom is an Antipatharian Zone, harboring anassemblage’ of organisms very similar in composition to those of theSouth Texas fishing banks. The distribution of such hard-bottom epi -benthic communities on Coffee Lump is probabiy coincident with the bot-tom irregularities detected in side-scan sonar records.
Coffee Lump should be classified as low priority, requiring norestrictions to hydrocarbon exploration and production activities.
Water and Sediment Dynamics
Coffee Lump is completely enveloped in a nephetoid layer most ofthe time. Topographically accelerated flow wiIi inhibit the accumula-tion of fine sediment on the uppermost parts of the bank.
FISHNET BANK
Geology
Evidence for Recent activity of faults on and in the immediate vi-cinity of Fishnet Bank suggests that areas in close proximity to thebank may be subject to seafloor instability. Care should be taken toavoid emplacement of structures on the bottom in areas of severe normalfaulting that does not appear to intersect the seafioor but shows sub-tle signs of recent movement.
●

77
B iolocjy
Fishnet Bank does not appear to support clear-water, reef-building ●
communities at the present time, probably due in part to chronic tur-bidity and sedimentation. The benthic community on the bank is presum- .
ably adjusted to such conditions, being comparatively low in diversityand numbers. Nevertheless, snappers and certain other potentially com-mercial and game fishes are numerous. This bank should be assignedto low priority for protection from drilling activities.
●
Water and Sediment Dynamics
Even thoughing the extremelyservations of thesediment samples,this bank.
an extensive nepheloid layer was not encountered dur-Iimited period of hydi-ographic sampling, direct ob -bottom (Rezak, this report) and the texture of the *
indicate that the nepheloid layer frequently envelops
Typical of shelf-edgetinue in the developmentalong the major east-west
DIAPHUS BANK
Geology
banks, Diaphusof its normalfault should be
Biology
Bank may be expected to con- “faults. Continued movementexpected.
The apparent lower diversity and abundance of epibenthic biota andfishes below the break in slope is probably related to depth, lightpenetration, water turbidity, and sedimentation. Overall, the diver-
*sity and abundance of benthic biota on Diaphus Bank are low compared tothose of many other shelf-edge banks in the northwestern Gulf. Thismay be due to the somewhat deeper crest depth of Diaphus Bank and/orits closer proximity to the Mississippi River outfall.
Water and Sediment Dynamics
A well developed nepheloid layer was encountered at all stationsexcept the shallowest one. The presence of coarse sediment at thecrest of the bank and the apparent low diversity of the biota indicatethat the bank may be frequently enveloped in a nepheloid layer but thatfine sediment does not accumulate at the crest, due to topographicallyaccelerated flow.
,

78
JAKKULA BANK
Geology
*
.
●✎
Activeand lack ofwarrant the
faults, as evidenced by those that intersect the seafloor,evidence for collapse of the central portion of the bankdesignation of Jakkula Bank as one which may have a very
unstable crest that should be monitored.
~
At the crest of the bank the presence of a large area designatedas the Algal–Spongeshunting stipulationsBanks.
Zone warrants the protection of this bank bysimilar to those required at the Flower Gardeh
Water and Sediment Dynamics
The hiqh relief on this bank prevents the bank from being envel -—oped by the nepheloid layer. Sediment distribution and the b-iologicalzonation indicate that the nepheloid layer does not rise above a depthof about 90 m.
ELVERS BANK
Geology
Most of the faults on Elvers E3ank displace the seafloor, indi-cating that it is a tectonically active bank. Extreme caution shouldbe exercised prior to placing any kind of structure on this bank.
Biology
The distribution of benthic biota on Elvers Bank, particularly thegreat depths to which algal populations extend, indicates a somewhatdifferent balance of environmental factors influencing populations atthis bank compared to banks bearing similar communities slightly closerto shore (28 Fathom, 18 Fathom, East and West Flower Garden Banks,etc.). The obvious physical difference is Elvers Bank’s greater basedepth and consequent greater relief. Also to be noted is the failureto detect substantial turbidity in the bottom water at Elvers duringthe reconnaissance dive, even at 180 m. Simplistically, biologicalconditions at Elvers and Geyer Banks seems to imply that the greaterthe relief of the bank , the less likely it is for turbid water layersto occur at mid or shallow depths on the bank.
We can only speculate concerning the ecological significance ofinterrelationships between light, water clarity, turbulence, circula-tion, sediment suspension, sedimentation, turbidity, geological struc-ture and other environmental factors. That baIances occur betweenthese naturaI factors greatly influencing hard-bank benthic populations
●

79
is, however, certain. Careful observation and study of the afore-mentioned factors and processes relating to them at several selectedbanks could do much to “clarity critical aspects of natural physical-geologica! -biological interrelationships on and around the banks.
GEYER BANK
Geology
Geyer Bank lies on an active salt diapir on the upper continentalslope. Because of its great relief and evidence for Recent movement onfaults at the crest of the bank, one would expect accelerated dissolu-tion of salt and continuing activity of faults on the crest and alongthe margins of the bank. Emplacement of large structures on thecrest of the bank or in close proximity to its flanks should be dis-couraged.
It is strongly recommended that additional work be conducted atGeyer Bank. As can be seen in Volume Four, Figure XVI-1, only a verysmall part of the bank has been observed from the submersible. Addi-tional submersible observations are needed to characterize the biota,to determine the nature of the bedrock outcrops, and to observe theIineations shown on Figure XV I-2 (Volume Four) in order to determinewhether or not they represent recently active faults. Geyer Bank wouldbe an excellent site for emplacing sea-bottom sensors to record tec-tonic activity on the bank. The major tectonic activity observed onthe sub-bottom profi!es is the upward movement of the salt diapir. Thepresence of both bare bedrock outcrops and well developed reef growthat the crest of the bank indicates Recent and possibly continuing move-ment along normal faults that will eventually develop into a centralgraben.
Biology
Geyer Bank possesses four distinct biotic zones characterized bydifferences in substratum, depth and structure of biotic communities:Miliepora-Sponge Zone (37-61 m, bedrock outcrops) ; Algal-Sponge Zone(61-87 m, algal nodules, algal reefs extending to 97 m, carbonate sedi-ment) ; Bank Slope Zone (approximately 87-189 m, carbonate sand, gravel,nodules and fines at top, grading to mud with carbonate gravel at bot-tom); and the Mud Zone (189-213+ m) .
.
b
.0
The Algal-Sponge Zone harbors by far the most diverse and abundantpopulations and is overwhelmingly dominated by frame-building coralline aalgae, with substantial local contribution by small branching herma -typic corals. Probably because of the bank’s great relief, coral linealgae are significant to depths of 113 m or so and occur as deep as123.5 m.
.
The great depth to which coralline algae grow at Geyer Bank[123.5 m, observed) is a feature held in common with Elvers Bank
●

80
10
(122.5 m, observed) but not other shelf -edge banks. Physiographically,Geyer and Elvers Banks rise from greater surrounding depths (215 m ormore) than do the others. As indicated in the description of ElversBank, we speculate that the survival and growth of corailine algae pop-ulations at great depths on Geyer and Elvers Banks is related to thebanks’ high relief and the relief’s influence on bottom hydrography andsedimentation on and adjacent to the banks. I n effect, compared tobanks of lesser relief, clearer water favoring algal growth exists atgreater depths on the flanks of high relief banks. Water clarity wasgood even at depths over 185 m at both banks during reconnaissancedives.
The presence of large areas characterized by the Millepora-SpongeZone and the Algal-Sponge Zone biotic communities warrants the protec-tion of Geyer Bank. These unique communities should be protected bystipulations similar to those in use at the East and West Flower GardenBanks.
Rezak-Sidner Bank
REZAK-SIDNER BANK
Geology
appears to be a geologically active structurethat has been created by a deep-seated salt diapir. Although there isevidence of repeated exposure of the bank during the Pleistocene epoch,there is no normal faulting within the bank proper that would indicateremoval of salt from the crest of a diapir by dissolution. In general,the movement of the bank has been in an upward direction and will prob-ably continue to be so for some time to come.
Biology
Biologically, Rezak-Sidner is similar to Geyer, Elvers, and 28Fathom Banks. The upper part of the bank (above 100 m) is compa~ableto the Algal-Sponge Zone at the East and West Flower Garden Banks.The biota of this zone should be protected.
*
ALDERDICE BANK
Geology
.
●✎
Alderdice Bank is another tectonically active bank. Faulting iscommon both on the crest of the bank and on its flanks. The shift inthe locus of upthrusting by the sa!t diapir, as illustrated by FigureXV II I-6C (Volume Four) creates potentially dangerous conditions on andaround the bank. If the locus of the greatest upward movement hasactually shifted and dissolution of salt is continuing beneath thepresent crest, then an increased rate of collapse of the crest may beex petted. This situation on Alderdice Bank indicates that instabilityof the sea-bottom due to tectonism is not restricted to the crest of
o

the bank but may occur some distance away from the crest in areas thatotherwise may appear stable.
B iO]O~y
Because of the existence of clear-water reefal communities on atleast one, and probably all, of the major topographic peaks at Alder-dice Bank, and because of the presence of spectacular basalt outcropsbearing a diverse asserrrbiage of epibenthic organisms and fishes, itis recommended that Alderdice Bank be classified as a top priority bankfrom the standpoint of environmental protection.
Water and Sediment Dynamics
The flow observed at Alderdice Bank stations was strongly depthand time dependent and was topographically steered. B e c a u s e o f t h e l o wr e l i e f o f t h e b a n k a n d o b s e r v a t i o n s o n t h e v e r t i c a l e x t e n t o f t h e neph-eloid layer at other banks, it is reasonable to expect that fine sedi-ment is advected over the broad platform of Alderdice Bank. I t seemshighly unlikely that fine sediment would reach the crests of the peaksthat rise above the platform surface.
32 FATHOM AND APPLEBAUM BANKS
Geo[ogy
Bathymetric profiles, side-scan sonar records and the limited num-ber of rock dredge samples on these banks indicate that 32 Fathom Bankis similar to Coffee Lump in its structure. and sediments. Withoutsub–bottom profiles, it is impossible to determine if the bank has beenplaned by erosion during the Pleistocene or if the bank is a series ofconformable sedimentary rocks that has been broadly bowed upward by adeep-seated diapir.
Lineations in the bathymetry on the north and west sides of Apple-baum Bank indicate the possibility of faulting in those areas. D r e d g ehauls on the main peak recovered carbonate rocks that may representdrowned Pleistocene coral gal reefs.
o
Biology
Dredge samples taken at 32 Fathom Bank were inadequate for inter-pretation of biotic communities. The limited biota recovered suggeststhat it is similar to Coffee Lump in biotic community development. ●
Applebaum Bank bears areas of carbonate hard-bottom with an assem-blage of organisms resembling that found on some of the SoutlI TexasBanks (e. g., Southern Bank and South Baker Bank) .
.
*

●.
REFERENCES
*

“e
●
✎
“e
●
9
●
.
●.
0

82
REFERENCES
●
● “
●
I
‘9
Abbott, R. E., 1975. The Faunal Composition of the Algal-Sponge Zoneof the Flower Garden Banks, Northwest Gulf of Mexico. M.S. thesis.Department of Oceanography, Texas A&M University, College Station,TX, 205 pp.
, 1979. Ecological Processes Affecting the Reef Coral Popula-tion at the East Flower Garden Bank, Northwest Gulf of Mexico.Ph.D. thesis. Department of Oceanography, Texas A&M University,College Station, TX, 154 pp.
and T.J. Bright, 1975. Benthic Communities Associated withNatural Gas Seeps on Cat-bonate Banks in the Northwestern Gulf ofMexico. Report for Study of Naturally Occurring Hydrocarbons inthe Gulf of Mexico, 191 pp.
Abbott, R. T., 1974. American Seashells. 2nd ed. Van NostrandReinhold Co., New York, 450 pp.
Abe, N., 1937. Ecological survey of Lwayama Bay, Palao. Palao Trop.Biol. Stn. Stud., 1, 217-324.
Abele; L. G., 1976. Comparative species richness in fluctuating andconstant environments: Coral-associated decapod crustaceans. Sci-ence, 192, 461-463.
Aleem, M., 1975. Biochemical reaction mechanisms in sulfur oxidationby chemosynthetic bacteria. Plant Soil, 43, 587-607.
Alevizon, W.S. and M.G. Brooks, 1975. The comparative structure of twowestern Atlantic reef-fish assemblages. Bull. Mar. Sci. , 25, 482-490.
American Public Health Association, 1971. Standard Methods for the Ex-amination of Water and Waste Water. 13th ed. American PublicHealth Association, Inc., New York.
Arnery, G. B., 1978. Structure of continental slope, northern Gulf ofMexico. In Bouma, A. H., G.T. Moore, and J.M. Coleman, eds., Frame-work, Facies, and Oil Trapping Characteristics of the Upper Conti-nental Margin, AAPG Studies in Geoi., 7, 141-153.
Anderson, J. B., R.R. Schwarzer, R.B. Wheeler, and C.L. Hokanson, 1978.Sedimentology and trace metal concentrations in sediments andorganisms. In Jackson, W. B., cd., Environmental Assessment of anActive Oil FieId in the Northwestern Gulf of Mexico 1977-1978,NOAA/ NMFS/SEFC Galveston Laboratory.
●✎

Antoine, J.W., 1972. Structure of the Gulf of M}exico. In Rezak, R.and V.J. Henry, eds.., Contributions on the Geological and Geo-physical Oceanography of the Gulf of Mexico, Texas A&M UniversityOceanographic Studies, Volume 3, Gulf Publishing Co., Houston,PP “ 1-34.
and J.L. Hardin, 1965. Structure beneath continental shelf,northeastern Gulf of Mexico. AAPG Bu!l., 49, 157-171.
, RiG. Martin, Jr. , T.G. Pyle, and W.R. Bryant, 1974. Conti-nental Margins of the Gulf of Mexico. In Burk, C.A. and C.L.Drake, eds. , The Geology of Continental Margins, Springer-VerIag,New York, pp. 683-693.
Armstrong, F. A. V., C.R. Stearns, and J.D. H Strickland, 1967. The meas-urement of upwelfing and subsequent biological processes by meansof the Technicon Autoanalyzer and associated equipment. Deep-SeaRes., 14, 381-389.
Armstrong, R., 1978. Seasonal Circulation Patterns. In Jackson, W. B.,cd., Environmental Assessment of an Active Oil Field in the North-western Gulf of Nlexico 1977-1978, NOAA/ NM FS/SEFC Galveston Lab-oratory.
Atoda, K., 1947. The larva and postiarval development of some’ reef-building corals. I I . Stylophora pistil lata (Esper). Sci. Rpts.Tohoku University, 4th Ser. [Biology) , 18(1) , 48-65.
, 1951a.building corals
——__-__f lgslb”building corals
Austin, f-f. and J.
The larva and postlarval development of the reef-111. Acropora brugg eman’ni. J. Morph., 89, 1-15.
The larva and postlarval development of the reef-Iv. Galaxea aspera. J. Morph. 89, 17-35.
Jones, 1974. Seasonal variations of physical ocean-ographic parameters of the Florida Middle Ground and their relationto zooplankton biomass on the West Florida Shelf. Quat. Jour. Fla.Acad. Sci., 37, 16-32.
Austin, H.hfl. , 1971. Ecology of fishes on Florida’s Middle Ground.M.S. thesis. Department of Oceanography, Florida State University,Tallahassee, FL, 56 pp.
Back, R. M., 1972. Recent Depositionai Environments of the FloridaMiddle Ground. M.S. thesis. Department of Oceanography, FloridaState University, Tallahassee, FL, 237 pp.
Baird, R., D. Wilson, and O. Milliken, 1973. Observations ofBregmaceros nectabanus Whitley in the anoxic, sulfurous water ofthe Cariaco Trench. Deep-Sea Res. , 20, 503-504.
‘o
●
.
.
0
e
●✎

e 84
,-
‘*
.
●
●
.
●✎
Bak, R. P.M. and G. van Eys, 1975. Predation of the sea urchin Diademaantillarum Philippi on living coral. Oecologia (Berl. ), 20, 111-115.
Bandy”, O. L., 1956. Ecology of foraminifera in northeastern Gulf ofMexico. U.S. Geol. Survey, Prof. Paper 274-6, 125-204,.
Bassin, N. J., 1975. Analysis of Total Suspended Matter in the Carib-bean Sea. Ph.D. thesis. Texas A&M University, College Station,TX, 106 pp.
Bergantino, R. H., 1971. Submarine regional geomorphology of the Gulfof Mexico. GeoI. Sot. Am. Bull., 82, 741-752.
Berger, W. and H. Thierstein, 1979. On phanerozoic mass extinctions.Naturwissenschaften, 66, 46-47.
Bernard, B. B., J.M. Brooks, and W.M. Sackett, 1976. Natural gas seep-age in the Gulf of Mexico. Earth Pianet. Sci. Lett., 3.1, 48-54.
Berry, W. and P. Wiide, 1978. Progressive ventilation of the oceans:an explanation for the distribution of the iower Paleozoic biackshaies. Am. J. Sci. r 278, 257-275.
i3etzer, S.6., 1977. Trace metals in benthic organisms. In BaselineEnvironmental Survey of the Mississippi, Aiabama, Fiorida (MAFLA)Lease Areas, 1974/1975. Finai Report to U .S. Dept. of interior,Bureau of Land Management, Contract 408550 -CT4-l 1; prep. by StateUniversity Systems of Fiorida, Institute of Oceanography.
and R.R. Sims, Jr. , 1977. Trace metais in benthic macrofauna.in Baseline Monitoring Studies of the MAFLA Lease Areas, 1975/ 1976.Finai Report to U.S. Dept. of interior, Bureau of Land Management, .Contract #08550 -CT5-30.
Bienfang, P. and K. Gundersen, 1977. Light effects on nutrient-Iimited, oceanic primary production. Mar. Bioi. , 43, 187-199.
Birdsali, B. C., 1978. Eastern Guif of Mexico, continental shelf phos -phorite deposits. M.S. thesis. University of South Florida,Tampa, FL, 87 pp.
i3irkeland, C., A.A. Reimer, and J.R. Young, 1976. Survey of MarineCommunities in Panama and Experiments with Oii. EPA-600/3/76-028,177 pp.
Eliscaye, P. E., 1964. Distinction between kaolinite and chiorite in Re-cent sediments by x-ray diffraction. Am. Mineralogist, 49, 1281-1289.
, 1965. Mineralogy and sedimentation of percent deep-sea clayin the Atiantic Ocean and adjacent sea and ocean. Geoi. Sot. Am.Buii., 76, 803-832.

85
Blake, N. J., 1979. Nlacroinfaunal molluscs. Chapter 14, Vol. II A. InMississippi, Alabama, Florida (MAFLA) Outer Continental ShelfBaseline Environmental Survey 1977/1978. Dames and Moore, Final “e
Report to U.S. Dept. of Interior, Bureau of Land Management, Con-tract #AA550-CT7-34, 30 pp.
130bb, W., R. Roland, F. Hermann, J. O’Meara, W. Savage, W. Rinne, andC. Gransee, 1971. Model studies of outfall systems for desalina-tion plants (Part II - Estuary models] . Office of Saline Water Re- ●
search and Development progress report #736, 183 pp.
Bock, W. D., 1977. Foraminifera of the MAFLA area. In MAFLA MonitoringStudy, 1975/1976. Final Report to U.S. Dept. of Interior, Bureauof Land hflanagement, Contract #08550 -CT5-30.
●
i30ck, W. D., 1979. Foraminifera of the MAFLA area. Chapter 12, Vol.II-A. In Mississippi, Alabama, Florida (hfAFLA) Outer ContinentalShelf Baseline Environmental Survey 1977/ 1!378. Dames and Moore,Final Report to U.S. Dept. of Interior, Bureau of Land Management,Contract #AA550-CT7-34, 13 pp.
●
Bouma, A. H., W.R, Bryant, and D.K. Davies, 1969. Topics and Tech-niques, Gulf of Mexico. U. S. G.S. Contract 14-08-0001-10866, De-partment of Oceanography, Texas A&M University, Technical Report “ 4
#69-5T.
Braun-Blanquet, J. , 1951. Plant Sociology: The Study of Plant Commu- ~e
nities. G.D. Fuller and H.S. Conrad, trans., McGraw-Hill, NewYork, 439 pp.
F3ray, E.E. and E.D. Evans, 1961. Distribution of n-paraffins as a clueto recognition of source beds. Geochim. et Cosmochim. Acts, 22,2-15.
Bray, J.R. and J.T. Curtis, 1957. An ordination of the upland forestcommunities of southern Wisconsin. Ecol. Monogr. , 27, 325-349.
E3rehler, B., 1978. Cadmium crystal chemistry. In Wedepohl, K.H. ,ed.,Handbook of Geochemistry, Springer-V erlag, New York, 11/4, 48-A-1to 48-A-7.
Brewer, P.G. and J.P. Riley, 1966. The automatic determination of sil-icate silicon in natural waters with special reference to seawater.Anal. Chim. Acts, 35, 514.
Bright, T. J., 1977. Coral reefs, nepheloid layers, gas seeps and brineflows on hard-banks in the northwestern Gulf of Mexico. P roc.Third lnt. Coral Reef Symp. , Univ. Miami, Rosenstiel School of Ma-rine and Atmospheric Science, 1, 39-46.
e

.
● “
●
86
, P.A. LaRock, R. 13. Lauer, and J.M. Brooks, inseep at the East Flower Garden Bank, northwestern
press. A brineGulf of Mexico.
lnt. Revue ges. Hydrobiol.
and L.H. Pequegnat, eds. , 1974. B iota of the West FlowerGarden Bank . Gulf Publishing Co., Houston, 435 pp.
, E. Powell, and R. Rezak, 1980. Environmental effects of anatural brine seep at the East Flower Garden Bank, northwesternGulf of” Mexico. In Geyer, R. A., cd. , Marine Environmental Pollu–tion (Vol. 1, Chap. 10), Elsevier, New York, pp. 291-316.
and R. Rezak, 1976. A Biological and Geological Recon-naissance of Selected Topographical Features on the Texas Conti-nental Shelf. Final Report to U.S. Dept. of interior, Bureau ofLand Management, Contract #08550 -CT5-4, 377 pp.
and R. Rezak, 1977. Reconnaissance of reefs and fishing banksof the Texas Continental Shelf. In Geyer, R. A., cd., Submersiblesand Their Use in O c e a n o g r a p h y , Elsevier, New York, pp. 113- Iso.
and R. Rezak, 1978a. South Texas Topographic Features Study.Final Report to U.S. Dept. of Interior, Bureau of Land Management,Contract #AA550-CT6-”18, 772 pp.
and R. Rezak, 1978b. Northwestern Gulf of Mexico TopographicFeatures Study. Final Report to U.S. Dept. of Interior, Bureau ofLand Management, Contract #AA550-CT7-15, 629 pp.
J.W. Tunnell, L.H. Pequegnat, T. E. Burke, C.W. Cashman, D.A.Cr~pper, J.P. Ray, R.C. Tresslar, J. Teerling, and J.B. Willis,1974. Biotic zonation. In Bright, T.J. and L.H. Pequegnat, ecis,,
13iota of the West Flower Garden Bank, GuIf Publishing, Houston,pp. 4-54.
Brindley, B. W., 1961. Chlorite minerals. In Brown, G., ed. The X-rayIdentification and Crystal Structures of Clay Minerals. Miner-alogical Society, London, pp. 242-296.
Brooks, H. J., 1962. Observations on the Florida Middle Ground (Ab-stract) . Geol. Sot. Am. Sp. Pub]. 63, 65-66.
Brooks, H. K., 1973. Geological oceanography, Section E. I n Jones,J. I., R.E. Ring, M.O. Rinkel, and R.E. Smith, eds. , A SummarY ofthe Knowledge of the Eastern Gulf of Mexico, State UniversitySystem of Florida, Institute of Oceanography, St. Petersburg, FL,IIE, 1-49.
Brooks, J. M., 1974. General and geotechnical characteristics of thesurficial deposits on the West Florida Shelf. In Smith, R. E., cd.,Procedures in Marine Environment, Implications of Offshore Dril-ling, Eastern Gulf of Mexico, State Univ. Syst. Fla. Inst. ofOceanography, St. Petersburg, FL, pp. 301-307.

87
, 1975. Sources, Sinks, Concentrations and Sublethal Effectsof Light Alip’hatic and .Aromatic Hydrocarbons in the Gulf of Mexico.Ph.D. thesis. Texas A&M University, College Station, TX.
T.J. Bright, B. Bernard, and C. Schwab, 1979. Chemicalaspec’ts of a brine seep at the East Flower Garden Bank, north-western Gulf of Mexico. Limnol. Oceanogr. , 24(4) , 735-745.
Brown, D., 1954. Methods of surveying and measuring vegetation, Bul-letin 42; Commonwealth Bureau of Pastures and Field Crops, Hurley,Berks Commonwealth Agricultural Bureau Farnham Royal, Bucks,England, 223 pp.
Bruland, K. W., K. Bertine, IA. Koide, and E.D. Goldberg, 1974. Historyof metal pollution in the southern California coastal zone. En-vironmental Science and Technology, 8, 425-432.
Bryant, W. R., A.A. Meyerhoff, N.K. Brown, Jr. , M. Furrer, T.E. Pyle,and J.W. Antoine, 1969. Escarpments, reef trends and diapiricstructures. Eastern Gulf of Mexico, AAPG Bull., 53(12), 2506-2542.
Bureau of Land Management (U.S. Department of the Interior), 1978.A Regional Studies Plan for the Gulf of Mexico and South Atlantic.New Orleans Continental Shelf Office, New Orleans, LA, 271 pp.
, 1979a. Final Environmental Impact Statement, Proposed 1979Outer Continental Shelf Oil and Gas l-ease Sale 58A, 428 pp.
, 1979b. Final Environmental Impact Statement, Proposed 1980Outer Continental Shelf Oil and Gas Lease Sales A62 & 62, 116 pp.
Butler, J. R., 1953. The geochemistry and mineralogy of rock weather-ing. 1. The Lizard area, Cornwall. Geochim. Cosmochim. Acts, 4,157.
Cain, S. A., 1938. The species area curve. Am. MidI. Nat. Monogr., 19,573-581.
Canfield, R. H., 1941. Application of the line intercept method in sam-pling range vegetation, J. Forestry, 39, 388-394.
“a.
.*
Cantelmo, F. R., M.E. Tagatz, and K.R. Rae, 1979. Effect of barite onmeiofauna in a flow-through experimental system. Marine Env. Res. , ●2(4), 301-309.
Carpelan, L. , 1967. Invertebrates in relation to hypersaline habitats.Contr. Mar. Sci., 12, 219-229.
Carroll, D., 1970. Clay Minerals: A Guide to Their X-Ray identifica-tion. Geol. Sot. Am. , Spec. Paper #126, 80 pp.
*.
●

● 88
● ✜
●
.
● ✍
●
Carsey, J. B., 1950. Geology of Gulf Coast coastal area and continentalshelf. AAPG But!., 34, 361-385.
Carver, R. E., cd., 1971. Procedures in Sedimentary Petrology. Wiley-Interscience, New York, 653 pp.
Center for Natural Areas, 1979. Draft Fishery Management Plan forCorals. Prepared for the NOAA Gulf of Mexico, Fishery ManagementCouncil, St. Petersburg, Florida.
Chace, F. A., Jr., 1972. The shrimps of the Smithsonian-B redin Expedi-tions with a summary of the West Indian shallow-water species( Crustacea: Decapoda: Natantia) . Smithsonian Contributions toZoology, 98, 1-179.
Chapman, G. and G. Newell, 1949. The distribution of Lugworms(Arenicola marina L.) over the flats at Whitstabie. J. Mar. BioI.Ass. U. K., 28, 627-634.
Cheney, D.P. and J.P. Dyer, Ill, 1974. Deep-water benthic aigae of theFlorida Middle Ground. Mar. Biol. , 27, 185-190.
Cintron, G., W. Maddux, and P. E3urkholder, 1970. Some consequences ofbrine pollution in the Bahia Fosforescente, Puerto Rico. Limnol.Oceanogr. , 15, 246-249.
Clark, R. C., Jr. , 1974. Methods for establishing levels of petroleumcontamination in organisms and sediment as related to marine pollu-tion monitoring. In NBS Spec. Publ. 409, Marine Pollution Monitor-ing (Petro!eum) , Proceedings of a Symposium and Workshop held atNSB, Gaithersburg, MD, pp. 189-194.
Cloud, P., 1976. Beginnings of biospheric evolution and their bio-geochemical consequences. Paleobiology, 2, 351-387.
Cohen, Y., W. Krumbein, M. Goldberg, M. Shilo, 1977a. Solar Lake(Sinai) 1. Physical and chemical Iimnology. Limnol. Oceanogr. ,22, 597-608.
, 1977b. Solar Lake (Sinai) 2. Distribution of photosyntheticmicroorganisms and primary production. Limnol. Oceanogr. , 22,609-620.
9 , 1977C. Solar Lake (Sinai) 3. Bacterial distribution and pro-duction. Limnol. Oceanogr. 22, 621-634.
Collins, A., 1967. Geochemistry of some Tertiary and Cretaceus ageoil–bearing formation waters. Environ. Sci. Technol., 1, 725-730.
● , 1970. Geochemistry of some petroleum-associated waters fromLouisiana. U.S. Dept. of the Interior, Bureau of Mines report of.investigation #7326, 31 pp.
●

89
1975. Geochemistry of Oilfield Waters. Elsevier ScientificPublishing Company, Amsterdam, 496 pp.
Connell, J. H., 1973. Population ecology of reef-building corals. InJones, Q.A. and R.E. Endeau, eds., Biology and Geology of CoralReefs. Volume II : Biology 1, Academic Press, New York, pp. 205-245.
Continental Shelf Associates, 1975. East Flower Garden Bank Environ-mental Survey. Report No. 1, Vol. 1, and Report No. 2, Vol. 1,prepared for Mobil Oil Corp.
1978a. Monitoring Program for Wells #3 and #4, Lease OCS-G2759: Block A-389, High Island Area, East Addition, South Exten-sion, Near East Flower Garden Bank. Technical Report for Mobil OilCorp, Sept. 14 - Dec. 15, 1977, Vol. !, 163 pp.
1978b. Monitoring Program for Well #1, Lease OCS-G 3487,1310ck’A-367, High Island Area, East Addition, South Extension, NearEast Flower Garden Bank. 2 .VOIS. Report to American Natural GasProduction Co.
Co~eland, B., 1967. Environmental characteristics of hypersaline la-goons. Contr. Mar. Sci. , 12, 207-218.
and R. Jones, 1965. Community metabolismwaters. Tex. J. Sci. , 17, 188-205.
and S. Nixon, 1974. Hypersaline laqoons.
in some hypersaline
in Odum, H., B.Copeland, and E. ~flcMahan, ids. , Coastal-Ecological Systems of t}~eUnited States, The Conservation Foundation, Washington, D. C.,pp. 312-330.
Corcoran, E. F., 1973. Chemical oceanography. Section C. In Jones,
●
J.I .,” R. Ring, Ad. Rinkel, and R. ~mi~hi eels. ,Knowledge of the Eastern Gulf of Mexico. Stateof Florida, Institute of Oceanography, St.pp. ii-C-l through 86.
Corliss, J.B. and R.D. Ballard, 1977. Oases of lifeNational Geographic Msg., 152(4) , 440-453.
Corliss, J., J. Dymond, L. Gordon, J. Edmond, RBallard, K. Green, D. Williams, A. Bainbridge,v a n Andel, 1 9 7 9 . Submarine thermal springs inScience, 203, 1073-1083.
A Summary of theUniversity SystemPetersburg, FL,
in the cold abyss.
. Von I-lerzen, R.1<. Crane, and T.the Galapagos rift. ●
Cottam, G. and J.T. Curtis, 1956. The use of distance measures in phy -toscciological sampling.
.Ecology, 37, 451-460.
aCraig, H., 1953. The geochemistry of the stable carbon isotopes.
Geochim. et Cosmochim. Acts, 3, 53-92..
●

●
●
.
●
, 1957.tion factors
90
Isotopic standards for carbon and oxygen and correc-for mass -spectrometric analysis of carbon dioxide.
Geochim. et Cosmochim”. Acts, 12, 133-149:
, 1969. Geochemistry and origin of the Red Sea brines. InDegens, E. and D. Ross, eds. , Hot Brines and Recent Heavy Metal 13e-posits in the Red Sea. Springer-Verlag, New York, pp. 208-2L12.
Culver, D. and G. f3runskill, 1969. Fayetteville Green Lake, New York.v. Studies of primary production and zooplankton in a meromicticmarl lake. Limnol. Oceanogr., 14, 862-873.
Curray, J. R., 1960. Sediments and history of Holocene transgressions,continental shelf, Northwest Gulf of Mexico. In Shepard, F. P., etal. , eds. , Recent Sediments, Northwest Gulf of Mexico, AAPG, Tuis~~K, pp. 221-266.
, 1965. Late Quarternary history, continental shelves of theUnited States. In kYright, H, E., Jr. and D.G. Frey, eds., the Qua-rternary of the United States, Princeton Univ. Press, princeton, NJ,pp. 728-736.
Czeczuga, B., 1968. An attempt to determine the primary production ofthe green sulphur bacteria Chlorobium Iimicola Nads (Chlorobacteri -aceae) . Hydrobiologia, 31, 317-333.
Dames and Moore, 1978. Drilling Fluid Dispersion and Biological Studyfor the Lower Cook Inlet COST Well. Report fcr the Atlantic Rich-field Co.
, 1979. Mississippi, Alabama, Florida (MA FLA) Outer Conti-nental Shelf Baseline Environmental Survey, 1977/ 1978, ExecutiveSummary: Volume 1, Program Synthesis Report; Volume 11, Compendiumof Work Element Reports. Final Report to U.S. Dept. of Interior,Bureau of Land ~!anagement, Contract #AA550-CT7-34, 1379 pp.
Dan, K., 1968. Echinoderms. In Rums, M. and K. Dan, eds. , inverte-brate Embryology (Translated from Japanese) , NTIS TT56-58050,pp. 280-315.
Dardeau, M. R., D.L. Adkinson, J.K. Shaw, and T.S. Hopkins, 1980. Noteson the distribution of four caridean shrimps (Crustacea: Decapoda]in the northeastern Gulf of Mexico. Florida Scientist, 43(1) , 50-54.
Dean, B., 1978. The swimming of blood worms (.Glycera spp. ) at night,with comments on other species. Mar. Biol. , 48, 99-lo4.
●✎
Degens, E. and D. Ross, eds. , 1969. Hot Brines and Recent Heavy MetalDeposits in the Red Sea. Springer-Vet-lag, New York, 593 pp.
●

91 ●
Dennison, J.M. and W.W. Hay, 1967. Estimating the needed sampling areaof subaquatic ecologic studies. J. Sediment. Petrol., 41, 706-708. ‘a
Dornbois, D. and H. Ellenberg, 1974. Aims and Methods of Vegetation .Ecology . J. Wiley and Sons, Inc., New York, 547 pp.
Doyle, L. J., 1976. MAFLA baseline study. Standard sediment param-eters. In Baseline Monitoring Studies of the MAFLA Lease ●
Areas, 1975/1976, Final Report to U.S. Dept. of Interior, Bureau ofLand Klanagement, Contract #08550 -CT5-30 [not paginated] .
, 1977. Standard sediment parameters. In Baseline MonitoringStudies of the MAFLA Lease Areas, 1975/1976. Final Report to U.S.Dept. of Interior, Bureau of Land Management, Contract#08550 -CT5-30.
, T. Neurauter, and T. Pyle, 1980. Sands and sand transport ona palimpsest carbonate shelf. In Program with abstracts, AA PG/SEPM1980 Annual Meeting, Denver.
and T.N. Sparks, in press. Sediments of the Mississippi,Alabama, and Florida (MA FLA) continental shelf. J. Sediment.Petrol.
and T.N. Sparks, 1979. Surficial sediment characters and claymineralogy. Chapter 2, Vol. II A. In hflississippi, Alabama,F!orida (MA FLA) outer Continental Shelf Baseline EnvironmentalSurvey 1977/1978. Dames and Moore, Final Report to U.S. Dept. ofInteriot-, Bureau of Land Management, Contract #AA550-CT7-34, 35 pp.
Ecomar, Inc., 1978. Tanner Bank Mud and Cuttings Study. Technical Re-port for Shell Oil Co., Jan.-March, 1977, 495 pp.
Edwards, G. S., 1971. Geology of the West Flower Garden Bank. TexasA&M Sea Grant Pub. TAM U-S G-71-215, 199 pp.
Eglington, G. 1969. Organic Geochemistry Methods and Results.Springer-Verlag, New York, 828 pp.
●
☛
Eisler, R., G.W. Kissil, and Y. Cohen, 1974. Recent studies on bio-logical effects of crude oils and oil dispersant mixtures to RedSea macrofauna. Proc. Sem. Method. Monitoring the Mar. Environ.EPA 600/4-74-004, pp. 156-179.
●Elgershuizen, J.H. and H.A. de Kruijf, 1975. Toxic effects of crude
oils and dispersants to the stony coral Madracis mirabilis (Ab-stract) . Ecology conference, Bonaire, Netherlands Antilles, Sept.
—.. .— ——..,.——
25-28, 1975.
E1-Sayed, S., 1970. On the productivity of the Southern Ocean (At-lantic and Pacific sectors) . in Holdgate, M., cd., Antarctic Ecol-ogy, vol. I, Academic Press, London, 119-135.
●✎

●92
●
●
W.M. Sackett, L.M. Jeffrey, A.D. Fredricks, R.P. Saunders,P.s.’ Conger, G.A. Fryxeii, K.A. Steidinger, and S.A. Earle, 1972.Chemistry, primary productivity, and benthic aigae of the Guif ofMexico. In Bushnell, V. C., cd., Seriai Atlas of the Marine En-vironment, Folio 22, Amer. Geographical Sot.
Emery, K. O., J.1. Tracey, Jr. , and H.S. Ladd, 1954. Geoiogy of Bikiniand nearby atoiis. i. Geoiogy. Prof. Pap. U.S. Geoi. Surv., 260(A), 1-265.
Fager, E. W., 1972. Diversity: a sampiing study. Amer. Midi. Nat.,106(949), 293-310.
Fanning, K. A., 1974. Nutrient analysis. vol. ii. In Basei’ine En-vironmental Survey of the Mississippi, Aiabama, Fiorida {MA FLA)L ease A r e a s , C Y 1 9 7 4 . Fina! Report to LJ. S. Dept. of interior,Bureau of Land Management, Contract #08550 -CT4-l 1 ; prep. by StateUniversity System of Fiorida, institute of Oceanography, 8 pp.
Barrington, J. W., C.S. Giam, G.R. Harvey, P. Parker and J“. Teai, 1!372.Anaiyticai techniques for seiected organic compounds. MarinePo!lution Monitoring: Strategies for a National Program Workshopsponsored by NOAA at Santa Cataiina Marine Biological Laboratory,Oct. 25–28, pp. 152-176.
, J.h~. Teal and P.L. Parker, 1976. Petroieum hydrocarbons. InGoldberg, E. D., ed. , Strategies for Marine Pollution Monitoring,Wiiey Interscience, New York.
Fausak, L. E., 1979. Saiinity, temperature, and iight penetration ob-servations on the MAFLA Outer Continental Sheif. Chapter 20, Voi.Ii B. In Mississippi, Aiabama, Fiorida (MAFLA) Outer ContinentalSheif Baseline Environmental Survey 1977/1978. Dames and Moore,Finai Report to U .S. Dept. of interior, Bureau of Land Management,Contract #AA550-CT7-34, 41 pp.
Feeiy, H.W. and J.L. Kuip, 1957. Origin of Gulf Coast sait-dome sul-phur deposits. AAPG Bu!i., 41, 1802-1853.
Feidiausen, P. H., 1979. Finai Work Element Report (Draft) , Data Syn-thesis, Bureau of Land Management Contract #AA550-CT7-34,102 pp.
Fenchei, T. , 1969. The ecoiogy of marine microbenthos, iV : Structureand function of the benthic ecosystem, its chemicai and physicalfactors and the microfauna communities with speciai references tothe ciliated protozoa. Opheiia, 6, 1-182.
and R. Riedi, 1970. The suifide system: A new biotic com-munity underneath the oxidized iayer of marine sand bottoms.Mar. Biol. (Bert.), 7, 255-268.

93 ●
Fisher Scientific Company, 1971. Instruction Manual for the JarreIl-Ash Model 810 Atomic Absorption Spectrophotometer (Engineering Pub.#82-810) .
~Jarrell-Ash Division, Waltham, MA, 54 pp. ●
, 1972. Atomic Absorption Analytical Methods. Jarrell-Ash Di-vision, Waltharn, MA.
Folk, R. L., 1965. Petrology of Sedimentary Rocks. Hemphill Publica-tion Company, Austin, TX, 154 pp. ●
, 1974. Petrology of sedimentary rocks. Hemphill PublicationCompany, Austin, TX, 182 pp.
Frankenberg, D. and K. Smith, 1967. Coprophagy in marine animals.Limnol. Oceanogr. , 12, 443-450. *
Fredericks, A.D. and W.M. Sackett, 1970. Organic carbon in the Gulf ofMexico. J. Geophys. Res., 75, 2199-2206.
Freeland, H. J., P.B. Rhines, and T. Rossby, 1975.tions of the trajectories of neutrally buoyantAtlantic. J. Mar. Res. , 33, 383-404.
Garth, J. S., 1975. Decapod crustaceans inhabitingof Ceylon and the Maldive Islands. Journal ofcal Association of India, 15(1), 195-212.
Statistical observa-floats in the North ● .
reef-building corals ~ .the Marine B ioIogi -
“eGartner, S. and J. Keany, 1978. The terminal Cretaceus event, a geo-
logical problem with an oceanographic solution. Geology, 6, 708-712.
Gearing, P., F.E. Plucker, and P.L. Parker, 1977. Organic carbon iso-tope ratios of continental margin sediments. Mar. Chem., 5, 251-266.
Gerlach, S. , 7977. Means of meiofauna dispersal. MicrofaunaMeeresboden, 61, 89-103.
Giam, C. S., H.S. Chan, G.S. Neff, and Y. Hrung, 1979. High molecularweight hydrocarbons in benthic macroepifauna and macronekton. InFlint, R.W. and N.N. Rabalais, eds. , Environmental Studies, SouthTexas Outer Continental Shelf, 1975-1977. Submitted to BLM by theUniversity of Texas. Vol. 11, Chapter 5.
, 1978a. High molecular weight hydrocarbons in macronekton andSpondylus samples. Northwestern Gulf of Mexico Topographic Fea-tures Study, Final Report to RLM, Contract #AA550-CT7-15. TexasA&M University, Chapter Vlll.
, 1978b. High molecular weight hydrocarbons in macronekton andSpondyIus samples. South Texas Topographic Features Study, FinalReport to BLM, Contract #AA550-CT6-18. Texas A&Al University, Chap-ter V.
●

94
a
Gibbs, R. J., 1971. X-ray diffraction mounts. In Carver, R. E., cd.,Procedures in Sedimentary Petrology, Wiley -lnterscience, New York,pp. 531-539.
Gionella, J., 1972. A rotary component method for analysing meteoro-logical and oceanographic vector time series, Deep-Sea Res. , 19,833-846.
Girardi, L. and E. Sabbioni, 1968. Selective removal of radio-sodiumfrom neutron-activated materials by retention on hydrated antimonypentoxide. J. Radio. Anal. Chem. , 1, 169-178.
Gleason, !-I. A., 1922. On the relation between species and area. Ecol-ogy, 3, 158-162.
Glynn, PO W., 1973. Ecology of a Caribbean coraf reef: The Poritesreef-fiat biotope: Part II : Plankton community with evidence fordepletion. Mar. Biol. , 22, 1-21.
Goedicke, T. R., 1955. Origin of the pinnacles on the continental shelfand slope of the Gulf of Mexico. Texas Jour. Sci., 7, 149-159.
Goldberg, E. D., V.T. Bowen, J.W. Barrington, G. Harvey, J.H. Martin,P.L. Parker, R.W. Risebrough, W. Robertson, E. Schneider, and E.Gamble, 1978. The mussel watch. Environmental Conservation, 5(2) ,101-125.
Goldberg, W. M., 1970. Some Aspects of the Ecology of the Reefs offP a l m B e a c h County, F l o r i d a , with Emphas is on the Gorgonacea andTheir Bathymetric Distribution. M.S. thesis. Florida AtlanticUniversity, Boca Raton, Florida, 108 pp.
Goldhaber, M.B. and I.R. Kaplan, 1974. The sulfur cycle, In Go]dberg,E ., cd. , The Sea, Vol. 5, Marine Chemistry, John Wiley and Sons,New York, pp. 569-655.
Goodall, D. W., 1952. Quantitative aspects of plant distribution.Biol. Rev. Carob. Philos. Sot. , 27, 194-245.
Goreau, T. F., 1959. The ecology of Jamaican coral reefs: 1. Speciescomposition and zonation. Ecology, 40, 67-90.
Gorlenko, V. , M. Vainstern and V. Kacha]kin, 1978. Microbiologicalcharacteristic of Lake Mogilnoye. Arch. Hydrobiol., 81, 475-492.
Gould, G. and B. Moberg, 1979. Macroepifauna and demersal fish tracemetal analyses. In Mississippi, Alabama, Florida (MAFLA] OuterContinental Shelf Baseline Environmental Survey, 1977/1978. Damesand Moore, Final Report to U.S. Dept. of Interior, Bureau of LandManagement, Contract #AA550-CT7-34, pp. 406-422.

95
Gould, H.R. and R.H. Stewart, 1955. Continental terrace sediments inthe northeast Gulf of Nlexico. In Finding Ancient Shorelines. Sot.Econ. Paleo. Mineral. Spec. Pub. 3, Tulsa, OK, 3-20.
Grant. E. M., 1970. Notes on an experiment upon the effect of crude oilon live corals. Fisheries Notes”, I(n. s.),- 3.
Grant, J.B. 1979. Marine data managed. Geotimes,
Green span, H. P., 1969. The Theory of Rotating Fluids.Press, Cambridge, 328 pp.
Greig-Smith, P., 1957. Quantitative Plant Ecology.inc. , New York, 198 pp.
May, 26-27.
Cambridge Univ.
Academic Press,
1964. Quantitative Plant Ecology. 2nd ed. f3utterworth,Londo’n, 242 pp.
, 1965. Notes on the quantitative description of humid tropi-cai forest. [n Symposium on Ecological Research in Humid TropicsVegetation, Kuching, Sarawek. Tokyo Press Co. , Habashi, Tokyo,pp. 227-234.
Greiner, G. O.G. 1970. Distribution of major benthonic formaniferalgroups in the Gulf of Mexico continental shelf. Micropalaeonto].,16, 83-101.
Griffin, G. M., 1962. Regional clay minerals facies: Products ofweathering intensity and current distribution in the northeasternGulf of Mexico. Geol. Sot. Am. Bull., 7-3, 737-768.
1971. Interpretation of x-ray diffraction data. In Carver,R. E.: cd. , Procedures in Sedimentary Petrology. Wiley lnter-science, New York, pp. 541-569.
Grim, R. E., 1968. Clay Mineralogy. McGraw Hill, New York, 596 pp.
“*
●, R.H. Bray, and W.F. Bradley, 1937. The mica in argillaceoussediments. Am. Mineralogist, 7, 813-829.
Grimm, D. E., 1978. The Occurrence of the Octocorallia (Coelenterata:Anthozoa) on the Florida Middle Ground. M..S. thesis. Departmentof Biology, University of Alabama, University, AL, 85 pp.
aand T.S. Hopkins, 1977. Preliminary characterization of the
octocorallian arid scleractinian diversity at the Florida MiddleGround. Proc. Third lnt. Coral Reef Symp., Univ. Miami, RosenstielSchool of Marine and Atmospheric Science, 1, 135-141.
Guille, A. and J. Soyer, 1968. La fauna benthique des substrats ●meubles de 13anyuls-sur-Mer. Premieres donnees qualitative etquantitative. Vie Milieu, 19(2 B), 323-360.

96*
● ✍
●
10
●
●
●
Gunter, G., 196$’. Vertebrates in hypersaline waters. Contr. Mar.Sci., 12, 230-241.
Hall, J., 1971. Evolution of the prokaryotes. J. Theor. Biol., 30,429-454.
Hallam, A . , 1 9 6 5 . E n v i r o n m e n t a l c a u s e s o f s t u n t i n g in living a n d f o s -s i l m a r i n e benthonic i n v e r t e b r a t e s . P a l e o n t o l o g y , 8 , 1 3 2 - 1 5 5 .
Harper, D. E., Jr. , 1970. Ecological Studies of Selected Level-BottomMacroinvertebrates off Galveston, Texas. Ph.D. thesis, Texas Ash!University, College Station, TX, 300 pp.
Hastings, R. W., 1972. The Origin and Season ality of the Fish Fauna ona New Jetty in the Northeastern Gulf of Mexico. Ph.D. thesis.Florida State University, Tallahassee, FL, 555 pp.
Heard, R.\i?. , 1979. Macroarthropods from the MAFLA Box Core Program(Summer 1977-Winter 1978). Chapter 16, Vol. II A. [n Mississippi,Alabama, Florida [MAFLA) Outer Continental Shelf Baseline Environ-mental Survey 1977/1978. Dames and Moore, Final Report to U.S.Dept. of Interior, Bureau of Land Management, Contract#AA550-cT7-34, 39 pp.
Hedgpeth, J. W., 1953. An introduction to zoogeography of the north-western Gulf of Mexico with reference to the invertebrate fauna.Publ. Inst. Mar. Sci. Univ. of Tex. , 3, 107-224.
Hittelman, A.M. , Chairman, MGD77 Task Group, 1977. The Marine Geo-physical Data Exchange Format--’’,MGD77° {Bath ymetry, Magnetics, andGravity) , Key to Geophysical Records Documentation No. 10. Na-tiona! Geophysical and Solar - Terrestrial Data Center, Boulder,Coio, 18 pp.
Hobson, E. S., 1968. Predatory behavior of some shore fishes in theGulf of California. Res. Rep. U.S. Fish Wild]. Serv., 73, 1-9.
1973. Diel feeding migrations in tropical reef fishes.Helgolan’der wiss. Meeresunter, 24, 361-370.
I-togg, N . G . , 1980. E f f e c t s o f b o t t o m t o p o g r a p h y o n o c e a n c u r r e n t s . I nO r o g r a p h i c E f f e c t s in P l a n e t a r y F l o w s , G A R P Publications series No.
23, WMO-ICSU Joint Scientific Committee, pp. 169-207.
Holmes, CO W., 1973. Distribution of selected elements in surficiai ma–rine sediments of the northern Gulf of Mexico continental shelf andslope. U.S. Geol. Survey Prof. Pap. 814, 7 pp.
Helm-Hansen, O., C.J. Lorenze, R.W. HoImn and J. D.H. Strickland, 1965.Fluorometric determination of chlorophyll. J. Conseil, ConseilPerm. Interm. Exploration Mer. , 30, 1-15. -.
●

97
and C.R. Booth, 1966. The measurement of ATP in the ocean andits ecological significance. Limnol. Oceanogr. , 11, 510-519.
and H.W. Paerl, 1972. The applicability of ATP determinationfor estimation of microbial biomass and metabolic activity. Men.Ist. Ital. Idrobiol. 29, 149-168.
Holser, W., 1977. Catastrophic chemical events in the history of theocean. Nature, 267, 403-408.
Hopkins, T, S., 1974a. Observations on the Florida Middle Groundthrough the use of open-circuit SCUBA. In Smith, R. E., cd. , Pro-ceedings of Marine Environmental Implications of Offshore Drilling,Eastern Gulf of Mexico, State Univ. Syst., Fla. Inst. of Ocean-ography, St. Petersburg, FL, pp. 227-228.
, 1974b. Characterization of the epifaunal and epifloral ben-thic communities in the MAFLA lease areas. vol. v. In BaselineEnvironmental Survey of the Mississippi, Alabama, Florida (MAFLA)Lease Areas, CY 1974. Final Report to U.S. Dept. of Interior,Bureau of Land Management, Contract #08550 -CT4-l 1; prep. by StateUniversity System of Florida, Institute of Oceanography, 46 pp.
1976. Epifaunal and epifloral benthic communities in theMAFL~ year 02 lease area. Final Report to U.S. Dept. of Interior,Bureau of Land Management, Contract #08550 -CT5-30 [notpaginated] .
, 1979. Characterization of the macroepifaunal assemblages inthe MALFA OCS. Chapter 17, Vol. II A. In Mississippi, Alabama,Florida [MAFLA) Outer Continental Shelf Baseline Environmental Sur-vey 1977 /1978. Dames and Moore, Final Report to U.S. Dept. of in-terior, Bureau of Land Management, Contract #AA550-CT7-34, 45 pp.
D.R. Blizzard, S.A. 13rawley, S.A. Ear[e, D.E. Grimm, D.K.Gilb~rt, P.G. Johnson, E.H. Livingston, C.H. Lutz, J.K. Shaw, andB.B. Shaw, 1977a. A preliminary characterization of the biotic. components of composite strip transects on the Florida MiddleGround, Northeastern Gulf of Mexico. Proc. Third Int. Coral ReefSymp. , Univ. Miami Rosen stiel School of Marine and Atmospheric Sci-ence, Volume 1, 31-37.
D.R. Blizzard, S.A. Brawley, S.A. Earle, D.E. Grimm, D.K.Gilb~rt, P.G. Johnson, E.H. Livingston, C.H. Lutz, J.K. Shaw, andB.B. Shaw, 1977b. The molluscan fauna of the Florida Middle Groundwith comments on its zoogeographical affinities. Northeast Gulf.Sci., l(l), 39-47.
and D.E. Grimm, 1977. Preliminary characterization of theoctocoral lian and scleractinian diversity of the Florida MiddleGround. Proc. Third Int. Coral Reef Symp. Univ. Miami, RosenstielSchool of Marine and Atmospheric Science, 1, 135-141.
“a
. . .
●

98
Howey, T. W., 1976. Zooplankton of the Gulf of Mexico: Distribution ofDisplacement Volume, Occurrence of Systematic Groups, Abundance andDiversity among Copopods. Ph.D. thesis. Louisiana State Uni-versity, Baton Rouge, LA, 93 pp.
Huang, W. H., 1975. Use of local minerals in the treatment of radio-active waste, Technical Report Series No. 136. I nternationa!Atomic Energy Agency, Vienna, 113 pp., Am. Mineral, 60, 492.
, 1976. Genesis of kaolin”ite in swamp environment. inter-national Geologic Congress, Sydney, Australia.
L.J. Doyle, and W.A. Chiou, 1975. Clay mineral studies ofsurf~ce sediments from the shelf of the northeastern and easternGulf of Mexico. In Bailey, S. W., cd., Proceedings of 1975 inter-national Clay Conference, Mexico, pp. 55-70.
Hubbard, F. G., 1977. A Quantitative Analysis of Benthic PolychaetousAnnelids from the Northwestern Gulf of Mexico. M.S. thesis. TexasA&M University, College Station, TX, 85 pp.
Hudson, H.J. and D.M. Robbin, 1980. Effects of drilling mud on thegrowth rate of the reef-building coral, htontastrea annu!aris. InGeyer, R. A., cd. , Marine Environmental Pollution, Vol. I , Hydro-carbons, 455-470.
Huff, D.W. and D.W. McGraiI, 1978. Large scale turbulence and resuspen-sion of sediment on the Texas continental shelf. (Abs. ) Trans.Amer. Geophys. Union, 59, 1110.
Hulings, N. C., 1955. An Investigation of the E3enthic InvertebrateFauna from the Shallow Waters of the Texas Coast. M.S. thesis.Texas Christian Univ. , Fort Worth, TX, 77 pp.
, 1967. A review of the recent marine podocopid and platycopidostracods of the Gulf of Mexico. Publ. Inst. Mar. Sci. Univ. Tex. ,12, 80-100.
Hurnphris, C. C., Jr. , 1978. Salt movement on continental slope, north-ern Gulf of Mexico. In Bouma, A. H., G.T. Moore, and J.M. Coleman,eds. , Framework, Facies, and Oil Trapping Characteristics of theUpper Continental Margin, AAPG Studies in Geology, 7, 69-85.
Huntsman, G.R. and I.G. Maclntyre, 1971. Tropical coral patches inOnsiow Bay. Underwater Naturalist Bulletin of the AmericanLittoral Society, 7 [2) , 32-34.
Huntsman, S. and R. Barber, 1977. Primary production off northwestAfrica: The relationship to wind and nutrient conditions. Deep-Sea Res., 24, 25-33.
Hurlbert, S. H., 1971. The nonconcep~ of species diversity: a critique ““and alternate parameters. Ecology, 52, 577–586,
*

99
Hylleberg, J., 1975. Selective feeding by Arenico!a ~fica withnotes on Abarenicola ragahunda and a concept of gardening in lug-.—worms. Ophefia, 14, 113-137.
Hyman, L. H., 1940. The Invertebrates: Protozoa Through Ctenophora.McGraw-Hill Book Co. , New York, 720 pp.
1974. The Invertebrates: Protozoan through Ctenophora.McGra~-Hi[l, New York, 726 pp.
Jackson, M. L., 1956. Soil Chemical Analysis--Advanced Course. Dept.of Soil Science, Univ. of Wisconsin, Madison, W] , 991 pp.
Jansson, B. and F. Wulff, 1977. Ecosystem analysis of a shallow soundin the northern Baltic --A joint study of the Asko Group. Contract#18, Asko Lab. Univ. of Stokholm, Sweden.
Jeffrey, L.M. 1979. Water column dissolved and particulate organiccarbon. Chapter 26, Vo!. 11 B. In Mississippi, Alabama, Florida(MAFLA) Outer Continental Shelf Baseline Environmental Survey1977/1978. Dames and Moore, Final Report to U.S. Dept. of in-terior, Bureau of Land Management, Contract #A A550-CT7-34, 1161-1167.
‘m
*
.
Jelen, F. C., cd. , ?979. Project and Cost Engineer’s Handbook.American Association of Cost Engineers, Morgantown, WV, 6-3 and6-4. >0
Johannes, R. E., 1975. Poliution and degradation of corai reef communi-ties. in Wood, E. J.F. and R.E. Johannes, eds., Tropicai MarinePollution, Elsevier Scientific Publishing Co. , New York, pp. 13-51.
and S.B. Betzer, 1975. lMarine communities respond differentlyto poilution in the tropics than at higher iatitudes. In Wood,E. J.F. and R.E. Johannes, eds. , Tropicai Marine poiiution, EisevierScientific Publishing Co., New York, p. T-12.
J. Maragos, and S.1. Coies, 1972. Oil damages cot-ais exposedto ;ir. Mar. Poilut. Buii., 3, 29-30.
Johns, W.D. and R.E. Grim, 1958. Clay minerai composition of recentsediment from the Mississippi River deita. J. Sediment. Petrol. ,28, 186-199.
, R.E. Grim, and W.F. Bradley, 1954. (.quantitative estimationof ciay m,inerais by diffraction metilods.242-251,
J. Sediment. Petrol., 24,
Jones, R.S. and M.J. Thompson, 1978. Comparison of Florida reeffishassemblages using a rapid visuai technique. i3uii. Mar. Sci.,2S(1], ?59-172.
-.
●
*
a
e.

100
● ✎
●
Jordan, C.L., 1973. The physical environment of the MAFLA shelf. InJones, J. !., R.E. Ring, M.O. Rinkel, and R.E. Smith, eds. , A Sum-mary of Knowledge of the Eastern Gulf of Mexico, State UniversitySystem of Florida, Institute of Oceanography, St. Petersburg, FL,PP “ 11-A-01 through II-A-14.
Jordan, G.F, 1952. Reef formation in the Gulf of Mexico off Appalachi -cola Bay, Florida. Geol. Sot. Am. Bull., 63, 741-744.
Jorgensen, B ., 1977a. The sulfur “cycle of a coastal marine sediment(Limfjorden, Denmark) . Limnol. Oceanogr., 22, 814-832.
, 1977b. Distribution of colorless sulfur bacteria (Beqgiatoaspp. ) in a coastal marine sediment. Mar. Biol., 41, 19-28.
, 1977C* Bacterial sulfate reduction within reduced micro–niches of oxidized marine sediments. i’dar. Biol., 41, 7-17.
and Y. Cohen, 1977. Solar Lake (Sinai) . 5. The sulfur cycleof the benthic cyanobacterial mats. Limnol. Oceanogr. , 22, 657-666.
and T. Fenchel, 1974. The sulfur cycle of a marine sedimentmodel system. Mar. Biol., 24, 189-201.
Kamphake, L. J., S.A. Hannah, and J.hfi. Cohen, 1967. Automated analysesfor nitrate by hydrazine reduction, Water Research, I , 206.
Karl, D., P. LaRock, and D. Shultz, 1977. Adenosine triphosphate andorganic carbon in the Cariaco Trench. Deep–Sea Res. , 24, 105-113.
Kasahara, A., 1980. Influence of orography on the atmospheric generalcirculation. In Orographic Effects in Planetary Flows, GARP Publi-cations Series No. 23, WMO-ICSU Joint Scientific Committee,pp. 4-52.
Kawaguti, S., 1969. Electron microscopy of the fluorescent green ofreef corals with a note on mucus cells. 13iol. Jour. Okayama Univ. ,12, 11-21.
Keeney, \Y., 1980. Unpublished data. Texas A&M University, CollegeStation, TX.
Kepkay, P., R. Cooke and J. Novitsky, 1979. Microbial autotrophy. Aprimary source of organic carbon in marine sediments. Science,204, 68-69.
Kidder, G.M. 1977. Pollutant Ievels in bivalves: A data bibli-ography. Report to the U.S. Environmental Protection Agency,Washington, D. C., Contract #R-80421501.

101
Kinne, O., 1964. The effects of temperature and salinity on marine andbrackish water animals Il. Salinity and temperature salinity com-binations. Oceanogr. Mar. E3io!. Ann. Rev., 2, 281-339.
Kissling, D. L., 1965. Coral distribution on a shoal in Spanish Harbor,Florida Keys. Bull. Mar. Sci. , 15, 600-211.
Knauer, G.A. and C.C. Aller, 1974. Particulate and dissolved organiccarbon concentrations in the MAFLA lease areas. Vol. II. In Base-line Environmental Survey of the Mississippi, Alabama, Florida(MAFLA) Lease Areas, CY 1974. Final Report to U.S. Dept. ofInterior, Bureau of Land Management, Contract #08550 -CT4-l 1; prep.by State University System of Florida, Institute of Oceanography,11 pp.
, 1976. A survey of particulate and dissolved organic carbonalong the continental shelf of the northeastern Gulf of Mexico. InBaseline Monitoring Studies of the IVIAFLA Lease Areas, 1975/1976.Final Report to U .S. Dept. of interior, Bureau of Land Manage~~nt,Contract #08550 -CT5-30 [not paginated] .
, 1977. A survey of particulate and dissolved organic carbonalong the continental shelf of the northeastern Gulf of Mexico. InBasel!ne Monitoring Studies of the MAFLA Lease Areas, 1975/1976.Final Report to U.S. Dept. of interior, Bureau of Land Management,
.
Contract #08550 -CT5-30, 48 pp..0
Kriebel, Harley J., R.J. Conomas, and J. Commeau, 1977. Clay mineralvariability in the sediments of San Francisco Bay system,California. J. Sediment. Petrol., 47, 229-236.
Kornicker, L.S. and D.W. Boyd, 1962. Shallow water geology and en-vironment of Alacron reef complex, Campeche Bank, Mexico. AAPGBull., 46, 640-673.
●
, F. Bonet, R. Cann, and C.M. Hooker, 1959. Alacran Reef,Campeche Bank, Mexico. Bull. Inst. Mar. Sci. , Univ. Texas, 6,
.1-22.●
Krumbein, W.., Y. Cohen, and M. Shilo, 1977. Solar Lake (Sinai). 4.Stromatolitic cyanobacteriai mats. Limnol. Oceanogr., 22, 635-656.
Land, B., 1974. The Toxicity of Drilling Fluid Components to AquaticBiological Systems: A Literature Review. Fisheries and Marine ●Service, Technical Report No. 487, Environment Canada, Fisheriesand Marine Service, 32 pp.
Lang, J., 1971. Interspecific aggressionThe rediscovery of Scolymia cubensisRuil. Mar. Sci., 21(4), 952-959.
by scleractinian corals. 1.(Milne-Edwards and Haime) .
●. . .
102
1.●
‘*
a
0.
●
.
●✎
, 1973. Interspecific aggression by scleractinian corals. 2.Why the race is not only to the swift. Bull. M a r . Sci. , 2 3 ( 2 ) ,2 6 0 - 2 7 9 .
Lankford, R. R., 1959. Distribution and ecology of foraminifera fromeast Mississippi Delta margin. AAPG Bull., 43(9) , 2068-2099.
LaRock, P., P. Lauer, J. Schwarz, K. Watanabe, and D. Wiesenburg, 1979.Microbial biomass and activity distribution in an anoxic hyper-saline basin. Appl. Environ. Microb., 37, 466-470.
Lax ton, J.H. and W.J. Stablum, 1974. Sample design for quantitativeestimation of sedentary organisms of coral reefs. Biol. J. Linn.Sot. , 6, 1-18.
Leach, J., 1970. Epibenthic algal production in an intertidal mudflat.Limnol. Oceanogr. , 15, 514-521.
Lehner, Peter, 1969. Salt tectonics and Pleistocene stratigraphy oncontinental slope of northern Gulf of Mexico. AAPG Bull., 53(12),2431-2479.
Levert, C.Fi and H.C. Ferguson, Jr., 1969. Geology of the FlowerGarden Banks, northwest Gulf of Mexico. Trans. Gulf Coast Assoc.Geological Sot. , 19, 89-100.
Lewis, J. B., 1964. Feeding and digestion in theDiadema antillarum Philippi. Can. J. ZOOI. , 42,
, 1971. The effect of crude oil and oilreef corals. Mar. Pollut. Bull., 2, 59-62.
tropical sea urchin549-557.
spill dispersant on
, 1974. The settlement behaviour of planulae larvae of thehermatypic coral Favia fragum (Esper) . J. Exp. Mar. Biol. Ecol.,15, 165-172.
Livingston, E. H., 1979, Observations of Sponge-Dwelling Fishes on theF l o r i d a M i d d l e G r o u n d s . M.S. t h e s i s . D e p a r t m e n t o f B i o l o g y . Uni-versity of A labama, Un ivers i ty , AL, 64 pp.
Livingston, H.D. and G. Thompson, 1971. Trace element concentrationsin some modern corals. Limnol. Oceanogr. , 16, 786.
Logan, B. W., 1969. Coral reefs and banks, Yucatan shelf, Mexico. InLogan, B. W., et al. , Carbonate Sediments and Reefs, Yucatan Shelf,——Mexico, AAPG Mere. 11, 129-98.
J.L. Harding, W.M. Ahr, J.D. Williams, and R.G. Snead, 1969.Lat~ Quaternary carbonate sediments of Yucatan Shelf, Mexico. InLogan, B. W., et al. , Carbonate Sediments and Reefs, Yucatan Shelf,Mexico, AAPG Mere., 11, 5-128.
. .
103
Lowman, S. W., 1949. Sedimentary facies in Gulf Coast. AAPG Bull.,33(12), 1939-1997.
Loya, Y., 1972. Community structure and species diversity of herma-typic corals at Eilat, Red Sea Mar. !3iol., 13, 100-123.
, 1975.structure of
1976.catastrophes
Possible effects of water pollution on the communityRed Sea corals. Mar. Biol., 29, 177-185.
Recolonization of Red Sea corals affected by naturaland man–made perturbations. Ecology, 57, 278-289.
.
●
, 1978. Plotless and transect methods. In Stoddart, D .R. andR.E. Johannes, eds. , Coral Reefs: Research Methods, UNESCO, Paris,pp. 197-217.
and B. Rinkevich, 1979. Abortion effect in corals induced byoil pollution. Marine Ecology --Progressive Series, 1, 77-80.
and L.i3. SIobodkin, 1971. The coral reefs of Eilat (Gulf ofEilat, Red Sea] . Symp. Zool. Sot. London, 28, 117-39. inStoddart, D.R. and C*M. Yonge, eds. , Regionai Variation in Indian
. Ocean Coral Reefs, Academic Press, London and New York, 58~i pp.
l_uckhurst, B.E. and K. Luckhurst, 1976. Some infaunal fishes asso-ciated with the scleractinian coral Madracis mirabilis. Can. J.Zool., 54, 1395-1397.
Ludwick, J.C. and Walton, W. R., 1957. Shelf-edge calcareous prom-inences in northeastern Gulf of Mexico. AAPG ~U[l., 41, 2054-2101.
Mackin, J.r 1971. A Study of the Effect of Oil Field Brine Effluentson Biotic Communities in Texas Estuaries. Texas A&M Research Foun-dation Reports, Project 735, 73 pp.
1973. A Review of Significant Papers on Effects of OilSpills ~nd Oil Field Brine Discharges on Marine Biotic Communities.Texas A&M Research Foundation Reports, Project 737, 87 pp. ,0
h4AFLA, 1977.” MAFLA Monitoring Study, 1975/1976. Final Report to U.S.Dept. of Interior, Bureau of Land Management, Contract#08550 -CT5-30, 6 vOIS.
Manteim, F. T., J.C. Hathaway,, F.J. Flanagan, and J.D. Fletcher, 1!376. eMarine mud, MA C-1 , from the Gulf of Maine. ! n Descriptions andAnalyses of Eight New USGS Rock Standards, U .S. Geol. Survey Prof.Papek 840, pp-. 25-28.
Manton, S. M., 1935. EcologicalGreat Barrier Reef Exped.,
surveys of coral reefs. Sci. Repts.,1928-29, 3, 273-278. 0
. . *

104
.
● ✎
●
.
Margalef, D. R., 1958. Information theory in ecology. General Systems,3, 36-71.
Marine Technical Consulting Service, 1976. Ecological Assessment ofDrilling Activities, Well No. 1, Block 584, High Island. TechnicalReport for Union Oil Co. of California.
Martin, J. H., K.W. 13ruland, and W.W. Broenkow, 1976. Cadmium transportin the California Current. In Windom, H. and R. Duce, eds. , MarinePollutant Transfer, D.C. Heath, New York, pp. 159-184.
Martin, R. G., 1978. Northern and eastern Gulf of Mexico continentalmargin: Strati graphic and structural framework . In Bouma, A. H.,G.T. Moore, and J.M. Coleman, eds. , Framework, Facies, and OilTrapping Characteristics of the Upper Continental Margin, AAPG”Studies in Geology, 7, 21-42.
Mathis, B . and T. Dorris, 1968. Community structure of benthic macro-invertebrates in an intermittent stream receiving oil field brines.Am. Midl. Nat., 80, 428-439.
Maul, G. A., 1974. The Gulf Loop Current. In Smith, R. E., cd. , Pro-ceeding of Marine Environment, Implications of Offshore Drilling inthe Eastern Gulf of Mexicof State Univ. Syst., Fla. Inst. of Ocean-ography, St. Petersburg, FL, pp. 87-96.
Mayor, A. G., 1924. Structure and ecology of Samoan reefs. PapersDept. Mar. Biol. Carnegie Inst., 19, 1-25.
McCartney, M. S., 1975. Inertia! Taylor columns on a beta plane. J.Fluid Mech. , 68 (l), 71-95.
McDermott, J., 1973. Drilling Mud and Fluid Additives. Noyes DataCorp. , Park Ride, NJ, 305 pp.
McEwen, G. F., M.W. Johnsonr and T.R. Folsom, 1954. A statistical anal-ysis of the performance of the Folsom plankton sample splitter,based upon test observations. Arch. Met. Geophys. u. Klimatol.,Ser. A, 7, 502-527.
McGrail, D. W., 1977. Shelf edge currents and sediment transport in thenorthwestern Gulf of Mexico. (Abs. ) Trans. Amer. Geophys. Union,58, 1160.
turbi~Union,
(Abs:)Assoc.
1978. Boundary layer processes, mixed bottom layers, andlayers on continental shelves. (Abs. ) Trans. Amer. Geophys.59, 1110.
1979. The role of air-sea interaction in sediment dynamics.Abstracts of Papers at the 145th National Meeting, Americanfor the Advancement of Science, p. 45.
●

105
and Doyle Home, 1979. Currents, thermal structure and sus-pended sediment distribution induced by internal tides on the TexasContinental Shelf. Paper presented at the spring meeting of theAmerican Geophysical Union SANDS Symposium.
and D.W. Huff, 1978. Shelf sediment and local fiow phenomena:in situ observations. (Abs. ) Program, AA PG–SEPM Annua[ Convention,.—p. 93.
and R. Rezak, 1977. internal wavescontinental shelf in the Gulf of Mexico.Geological Sot., 27, 123-124.
and the nepheloid layer onTrans. Gulf Coast Assoc.
.
4
.
Mclntyre, G. A.; 1953. Estimation of plant density using line tran-sects. J. Ecol., 41, 319-330. 0
Menzies, R.J. and D. Frank enberg, 1966. Handbook on the Common MarineIsopod Crustacea of Georgia. Univ. Georgia Press, Athens, 93 pp.
and P.W. Glynn, 1968. The Common Marine lsopod Crustacea ofPuerto Rico. Studies on the Fauna of Curacao and other Caribbean 8Islands, Vol. 27, Netherlands, 133 pp.
Menzel, R. and S. Hopkins,Effects of Oil Well Bi-ineOil Field. Texas A&ivl130 pp.
Midd!editch, B.S. and D.L.
1951. Report on Experiments to Test the .or “Bleedwater” on Oysters at Lake BarreResearch Foundation Reports, Project 9,
.0
West, 1979. Hydrocarbons, biocides, andsulfur. In Environmental Assessment of an Active Oi! Field in theNorthwestern Gulf of Mexico, 1978-1979. Final Report to theNational Marine Fisheries Service, SEFC Galveston Laboratory.
Milliman, J. D., 1973. Caribbean coral reefs. [n Jones, Q.A. andR.E. Endeau, eds., Biology and Geology of Coral Reefs, Vol. 1, Aca-demic Press, New York, 1-50.
, 1974. Marine Carbonates.375 pp.
Moore, D. R., 1958. Notes on Blanuuilla
Springer-Verlag, New York,
Reef, the most northerly coral
●
formation in the western Gulf of Mexico; Publ. Inst. Mar’. Sci.Univ. Texas, 5, 151-155.
Morisita, M., 1959. M e a s u r i n g o f i n t e r s p e c i f i c a s s o c i a t i o n a n d sim- 0ilarity between communities. Mere. Fat. Sci. Kyushu Univ. Ser. E.Biol., 3, 65-80.
Moseley, F. and B . Copeland, 1974. i3rine pollution system. In Odum,.
H B . Copeland, and E. McMahan, eds. , Coastal Ecological Systemsof* ‘the United States. The Conservation Foundation, Washington, ●D. C., pp. 342-352. .

D
●
● ✎
●
D
.
B.
106
Motoda, S.. 1959. Devices of sim~le P[anktOn a~Raratus. Mere. Fat.Fish. Hokkaido Univ., 12(1-2);
Mullin, J.B. and J.P. Riley, 1956.water and in marine organisms103.
. .73~94.
The occurrence of cadmium in sea-and sediments. J . M a r . R e s . , 1 5 ,
Murphy, J. and J.P. Riley, 1962. Athe determination of phosphateActs, 27, 30.
M y e r s , A . , 1 9 7 9 . Summer and winter
modified single solution method forin natural waters. Anal. Chim.
burrows of a mantis shrimp, Squillaempusa, in Narragansett Bay, Rhode Island [USA) . Est. Coast Mar.Sci., 8, 87-98
National Oceanic and Atmospheric Administration [U.S. Department ofCommerce) , 1979. Draft Environmental Impact Statement on theProposed East and West Flower Garden Marine Sanctuary. Office ofCoa”stal Zone
Nettleton, L.L. ,1175-1204.
Management, Washington, D. C., 330 pp. -
19:4. Fluid mechanics of salt domes. AAPG Bull. , 18,
1957. Gravity survey over a Gulf Coast continental mound.Geoph~sics, 22, 630-642.
Neumann, A. C., 1958. The configuration and sediments of Stetson Bank,northwest Gulf of Mexico. Texas A&M Univ. , Dept. of Oceanography,Tech. Rept. #58-ST, 125 pp.
Nichols, J., 1976. The effect of stable dissolved-oxygen stress on ma-rine benthic invertebrate community diversity. Int. Revue ges.Hydrobiol., 61, 747-760.
Nowlin, W. D., Jr. and H.J. McLelian, 1967. A characterization of theGulf of Mexico waters in winter. J. Mar. Res. , 25(l), 29-59.
O ’ B r i e n , D . a n d F . Birkner, 1 9 7 7 . K i n e t i c s o f o x y g e n a t i o n o f r e d u c e dsulfur species in aqueous solution. Environ. Sci. Technol., II,1114-1120.
Odum, E., 1971. Fundamentals of Ecology. 3rd ed. W.B . Saunders COm-
pany, Philadelphia, 574 pp.
Odum, H.T. and E.P. Odum, 1955. Trophic structure and productivity ofa windward coral reef community on Eniwetok Atoll. EcoI. Monog. ,25, 291-320.
Oseid, D. and L. Smith, 1974. Factors influencing acute toxicity esti-mates of hydrogen sulfide to freshwater invertebrates. Water Res.,8, 739-746.
P

107
Ostarello, G. L., 1976. Larvai dispersal in the subtidal hydrocora!California allopora. In Mackie, G. E., cd., Coelenterate Ecologyand Behavior, Plenum Press, New York, pp. 331-337.
Ott, B., 1975. Quantitative Analysis of Community Pattern and Struc-ture on a Coral Reef Bank in Barbados, West Indies. Ph.D. thesis.McGill University, 156 pp.
Ott, J., B. Fuchs, R. Fuchs, and A.biology of Callianassa stebbingiRisso and their effect upon the8, 61-79.
Malasek, 1976. Observations on theBorrodaille and Upogebia litoralissediment. Senckenberg. Maritima,
Park, E. T., 1979. Zooplankton Project. In Flint, R.W. and C.W.Griffin, eds. , Environmental Studies, South Texas Outer ContinentalShelf, Biology and Chemistry, Final Report to the U.S. Bureau ofLand Management, Contract #AA550-CT7-l 1, Chapter 14, 14-1 to14-58.
Parker, P. L., 1954. Distribution of the foraminifera in the north-eastern Gulf of Mexico. 13u11. Harvard Mus. Comp. ZooI. , 111(10),453-588.
, Emw, Behren~, JOA. Ca]der, and D. s~hult~, 1972, stable car-bon isotope ratio variation in the organic carbon from Gulf ofMexico sediments. Contr, Mar. Sci., 16, 139-147.
, et al. , 1976. Environmental Studies, South Texas Outer——Contifiental SheIf, 1975, Biology and Chemistry. Final Report toU*S. Dept. of Interior, Bureau of Land Management, Contract#08550 -C T5-17, 598 pp.
, R.S. Scalan, and J.K. Winters, 1979. Biology and chemistry.In Flint, R.W. and C.W. Griffin, eds. , Environmental Studies, SouthTexas Outer Continental Shelf, Biology and Chemistry, Final Reportto Bureau of Land Management, Washington, D. C., Contract#AA550-cT7-11.
Parker, R.H. and J.R. Curray, 1956. Fauna and bathmetry of banks oncontinental shelf, northwest Gulf of Mexico. AAPG Bull. , 40, 2428-2439. “
Parsons, T. R., M. Takahashi, and B. Hargrove, 1977. Biological Ocean-ographic Processes. 2nd ed. Pergamon Press, New York, 332 pp.
Pearse, A. S., 1932. Inhabitants of certain sponges at Dry Tortugas.Paps. Tortugas Lab., 7, 119-124.
, 1!350. Notes on the inhabitants of certain sponges at 13imini.Ecology, 31(1), 149-151.
.
9
.
9
9
.
.4
9
9

108
● ✍
●
P e q u e g n a t , L.H. and J.P. Ray, 1974. Crustaceans and other arthropods.In Bright, T.J. and L.H. Pequegnat, eds., B iota of the West FlowerGarden Bank, Gulf Publishing Co. , Houston, pp. 231-288.
Perkin-Elmer Corporation, 1974. Analytical Methods for Atomic Absorp-tion Spectroscopy Using the HGA-21OO Graphite Furnace (#990-9972) .Norwalk, CT, 43 pp.
Pfennig, IN. , 1975. The phototrophic bacteria and their role in thesulfur cycle. Plant Soil., 43, 1-16.
Phleaer, F. B., 1954. Ecoloqy of foraminifera and associated micro--- -,organisms from Mississippi Sound and environs. AAPG Bull.,584-647.
, 1955. Ecology of foraminifera in southeastern MissDelta area. AAPG Bull. , 39(5), 712-752.
18(4),
ssippi
, 1960. Sedimentary patterns of microfaunas in northern Gulfof Mexico. 1 n Recent Sediment, Northwest Gulf of Mexico, AAPG,267-381.
, 1977. Foraminiferal and ecological processes in St. LuciaLagoon, Zululand. lst. Int. Symp. on Benthonic Foraminifera ofContinental Margins. Part A: Eco!ogy and Biology. Maritime Sedi-ments Spec. Pub. , 1, 195-204.
Pielou, E. C., 1969. An Introduction to Mathematical Ecology. Wiley,New York, 286 pp.
, 1974. Population and Community Ecology: Principles and Me-thods. Gordon and Breach, New York, 424 pp.
, 1975. Ecological Diversity. Wiley, New York, 165 pp.
Pierce, W. E., 1967. Flower Garden Reef. Texas Parks and WildlifeMsg., 25(12),6-9.
Pincince, A. and E. List, 1973. Disposal of brine into an estuary. J.Wat. Pollut. Contr. Fed., 45, 2335-2344.
Pomeroy, L., 195’3. Algal productivity in salt marshes of Georgia.Limnol. Oceanogr. , 4, 386-397.
Porter, J. W., 1972a. Ecology and species diversity of coral reefs onopposite sides of the Isthmus of Panama. In Jones, fiA. L., cd., ThePanama Biota: A Symposium Prior to the Sea Level Canal. Bull.Biol. Sot. Wash., 2, 89-116.
1972b; Patterns of species diversity in Caribbean reef cor-als. ‘ Ecology, 53, 745-748.
●

109
Potts, D. C., 1977. Suppression of coral populations by filamentous al-gae within damselfish207-216.
Powell, D., L.M. Dwinell,of the fish referenceural Resources Marine36, 179 pp.
territories. J. Exp. Mar. E3iol. Ecol., 28,
and S.E. ~winell, 1972. An annotated listingcollection at the Florida Department of Nat-Research Laboratory. Spec. Sci. Rep, FDNR,
Powell, E., 1977. Particle size selection and sediment reworking in afunnel feeder, Leptosynapta tennis (1-folothuroidea, Synaptidae).Int. Revue ges. Hydrobiol., 62, 385-408.
, M. Crenshaw, and R. Rieger, 1979. Ada tations to sulfide inthe meiofauna of the sulfide system. 1. 3gS-sulfide accumula-tion and the presence of a sulfide detoxification system, J. Expo
Mar. Biol. Ecol., 37, 57-76.
Presley, B.J. and P.N. Boothe, 1977. Trace metals in epi-fauna, zoo-plankton and macronekton from the South Texas Outer ContinentalShelf. F i n a l R~POi-t to the Bureau o f L a n d M a n a g e m e n t , W a s h i n g t o n ,D . C . , C o n t r a c t # A A550-CT6-17, 1 8 - 1 t o 1 8 - 4 9 .
and P. IN. Boothe, 1978. Trace metals in macronekton and >on-
M sa~ples from the Texas outer continental shelf TOPo~raPh~CHigh Study (1976) . lnBright, T. J.and R. Rezak, South Texas Topo-graphic Features Study, Final Report to the Bureau of Land Manage-ment, Washington, D. C., Contract #AA550-CT6-18, 484-.505.
, P.N. Boothe, and J.S. Schofield, 1978. Trace metaIs in ma-cronekton and Spondylus. In Bright, T.J. and R. Rezak, North-western Gulf of Mexico Topographic Features Study, Final Report to *the Bureau of Land hllanagement, Washington, D. C., Contract#AA550-CT7-15, pp. VIII-27 to -57.
Pulley, T. E., 1963. Texas to the tropics. Bull. Houston Geol. Sot.,6, 13-19.
Pyle, T. E.,*
W.R. Bryant, and J.W. Antoine, 1974. Structural frameworkof the West Florida Shelf and recommendations for further research.In Smith, R. E., cd., Proceedings of Marine Environmental implica-tions of Offshore Drilling, Eastern Gulf of Mexico, State Univ.Syst. Fla., Inst. of Oceanography, St. Petersburg, FL,pp. 295-300. 0
V.J. Henry, J.C, Carthy, R.T. Giles, and T.W. Neurauter,1977: Geophysical investigations for biolithologic mapping of theMAFLA lease area. (including a Review of the Shallow Structure andPo~t-Miocene Sedimentary ~rame~ork of t}~e central West FloridaShelf. ) vol. v, Gee. Physical Investigation. In Baseline *Monitoring Studies of the MAFLA Lease Areas, 1975/1976. FinalReport to U.S. Dept. of Interior,
sBureau of Land Management.
Contract #08550 -CT5-30, 192 pp.
●

I110
● ✎
Rau, G. and J. Hedges, 1979. Carbon-13 depletion in a hydrothermalvent mussel : Suggestion of a chemosynthetic food source. Science,203, 648-649.
Reed, J. H., 1977. Barium and vanadium determination by neutron activa-tion analysis --a study of procedures. Report to the Bureau of LandManagement, Washington, D .C., Contract #AA550-CT7-38, 84 pp.
Reimer, A. A., 1975. Effects of crude oil on corals. Mar. Poll. Bull.,6(3) , 39-43.
Fleimers, T . , 1 9 7 6 . A n o x i s c h e L e b e n s r a u m e Strukture and Entwicklung derMikrobiozonose an der Grenzflache Meer/Meeresboden. Ph.D. thesis.Christian-A lbrechts - Universitat, Kite, 134 pp.
Report to Federal Energy Administration Strategic Petroleum ReserveProgram Salt Dome Storage, 1977. Analysis of !3rine Disposal in theGulf of Mexico. 1. Bryan Mound, 129 pp.
Rezak, R., 1977. West Flower Garden Bank, Gulf of Mexico. Studies inGeology, 4, 27-35.
and W, F?. Bryant, 1973. West Flower Garden Bank. Trans. GulfCoast Assoc. of Geol. Sot. 23rd Annual Conv. (Ott . 24-26] ,pp. 377-382.
and G.S. Edwards, 1972. Carbonate sediments of the Gulf ofMexico. Texas A&M Univ. Oceanographic Stud., 3, 263-280.
Rhoads, D., 1974. Organism sediment relations on the muddy sea floor.Ocean. Mar. Biol. Ann. Rev. , 12, 263-300.
● and J. Morse, 1971. Evolutionary and ecologic significance ofoxygen-deficient marine basins. Lethaia, 4, 413-428.
●
Ricker, W. E., 1973. Linear regressions in fishery research. J. Fish.Res. Board Can. , 30(3) , 1+09 -43fI.
Rinkel, M. O., 1975. Compilation and Summation of Historical and Exist-ing Physical Oceanographic Data from the Eastern Gulf of Mexico.State University System of Florida Final Report, Contract#08550 -CT4-16, 97 pp.
Risk, M, J., 1972. Fish diversity on a coral reef in the VirginIslands. Atoll. Res. Bull. , 193, 1-6.
Roberts, J. and Roberts, T. C., 1978. Use of the 13utterworth low-passfilter for Oceanographic data. Jour. of Geophysical Res. , 83(Cll), 5510-5514.
Robichaux, T. J., 197s. Bactericide Used in Drilling and CompletionOperations. Tretolite Division, Petrolite Corp., St. Louis, Mo,11 pp.

111
Robinson, M. I<., 1973. Atlas of iMonthly Mean Sea Surface and Sub- Sur-face Temperature and Depth of the Top of the Thermocline Gu!f ofMexico and Caribbean Sea. Scripps Institute of Oceanography. Ref.73-8, 105 Pp.
Rosenberg, R., 1977. Elenthic macrofaunal dynamics, production, anddispersion in an oxygen deficient estuary of west Sweden. J. Exp.Mar. 13iol. EcOl., 26, 107-133.
Roy, A. and P. Trudinger, 1970. The Biochemistry of Inorganic Com-pounds of Sulphur. University Press, Cambridge, England, 400 pp.
Rutzler, K. and W. Sterrer, 1970. Oii pollution damage observed intropical communities along the Atlantic seaboard of Panama. B io-science, 20, 222-224.
Ryan, W. and M. Cita, 1977. Ignorance concerning episodes of ocean-wide stagnation. Mar. Geol., 23, 197-215.
Sackett, W. M., 1975. Evaluation of the effects of man-derived wasteson the viability of the Gulf of Mexico. Texas A&M University,Oceanography Dept. Technical Report, Ref. 75-8-T, National Science~o~ndation 1.!3. O.E. grant GX-37344, 27 pp.
Sammarco, P. W., 1978. The Effects of Grazing by Diadema antillarumPhilippi on a Shallow-water Coral Reef Community.
————Ph.D. thesis.
State University of New York at Stony Brook, 371 pp.
, 1980. Diadema and its relationship to coral spat morta!ity:—Grazing, comp~ition, and biological disturbance. J. .Exp. Mar.!3iol. Ecol., 45, 245-272.
Sanders, H. L., 1968. Marine benthic diversity: A comparative study.Am. Nat., 102, 243-282.
●
.e
Sca!in, R.S. and J.E. Smith, 1970. An improved measure of the odd-evenpredominance in the normal alkanes of sediment extracts and petro-leum. Geochim. et Cosmochitm. Acts, 34, 611-620.
*
Schlueter, D. J., 1972. HEVESY, a general activation analysis computerprogram. Report TEES 9002-1972-1. Texas A&M University, CollegeStation, TX, 41 pp.
Shannon, C.E. and W. Weaver, 1949. The Mathematical Theory of Communi-cation. University of Illinois Press, Urbana, 125 pp. *
Shaw, J.K. and T.S. Hopkins, 1977. The distribution of the familyHapalocarcinidae (Decapoda, E3rachyura) on the Floricla Middle Groundwith a description of Pseudocryp tochirus ~ypostequs new species.Proc. Third Int. Coral—Reef Symp. , Univ. Miami, Rosen stiel School
●of Mlarine and Atmospheric Science, 1, 177-183. .
●

●
●
● ✎
e
*
Sheldon, R.W. and W .H . Sutc!iffe, 1969. Retention of marine particlesby screens and filters. Litnnol. Oceanogr. , 14, 441-444.
She~ard. F. P.. 1937. Salt domes related to hlississi~~i submarine
Sh
Sh
‘trou”gh. Geol. Sot. Am. Bull., 40, 2428-2489. “ “
deler, G. L., 1976. Textural distribution of sea floor sediments,South Texas outer continental shelf. Jour. Research U.S. Geol.Survey, 4(6), 703-713.
raki, K., 1978. Chromium. In Wedepohl, K.H. , cd., Handbook of Gee-chemistry, Vol. 11/3, 5pringer-Verlag, New York, 24-B-1 to 24-O-1 i
Shipp. R.L. and S.A. Bortone, 1979. Demersal fish. Chapter 19, Vol.II B. In Mississippi, Alabama, Florida (MAFLA) Outer ContinentalShelf Baseline Environmental Survey 1977/1978. Dames and Moore,Final Report to U .S. Dept. of Interior, Bureau of Land Management,Contract #AA550-CT7-34, 28 pp.
Shokes, R. F., 1976. Rate-Dependent Distributions of Lead-210 andInterstitial Sulfate in Sediments of the Mississippi River Deita.Ph.D. thesis. Texas A&M University,’ College Station, TX, 122 pp.
, P. Trabant, B. Presley, and D. Ried, 1977. Arloxic, hyper- .saline basin in the northern Gulf of Afiexico. Science, 196, 1443-1446.
Shore, R., J. Post, M. Allen, L. Levin, and W. Taffel, 1977. A Studyof the Environmental Benefits of Proposed BATEA and NSPS EffluentLimitations for the Offshore Segment of the Oil and Gas ExtractionPoint Source Category. U.S. Environmental Protection Agency Officeof Water Planning and Standards, 440/1–77-011, 375 pp.
Sisson, R. F., 1973. Life cycle of a coral. National Geographic,143, 780-793.
Slobodkin, L. El. and L. Fishelson, 1974. The effect of the cleaner-fishLabroides dimidiatus on the point diversity of fishes on the reeffront at Eilat. Amer. Nat., 108(961), 369-376.
Smith, F. G. W., 1971. Atlantic Reef Corals: A Handbook of the CommonReef and Shallow-water Corals of Bermuda, Florida, the West Indies,and Brazil. Univ. Miami Press, Coral Gables, FL, 164 pp.
, 1972. Atlantic Reef Coral. Univ. Miami Press, Coral Gables,FL, 164 pp.
Smith, G. B., 1976. Eco!o”gy and distribution of eastern Gulf of Mexicoreef fishes. Fla. Mar. Res. Pub., 19, 1-78.
*

113” 9
and L.H. Ogren, 1974. Comments on the nature of the FloridaMiddle Ground reef ichthyofauna. In Smith, R. E., cd., Proceeding .
of Marine Environmental Implications of Offshore Drilling, Eastern ●Gulf of Mexico, State Univ. Syst., Fla. Inst. of Oceanography, St.Petersburg, FL, 222-232.
, H.M. Austin, S.A. 130rtone, R.W. Hastings, and L.H. Ogren,1975. Fishes of the Florida Middle Ground with comments on ecologyand zoogeography. Fla. Mar. f?es. Pub., 9, 1-14. ●
Smith, N. P., 1980. Ors the hydrography of sheJf waters off CentralTexas Gulf Coast. Jour. Phys. Oceanography, 10 (5) , 806-813.
Sorensen, R. H., L.W. Snodgrass, J.H. Rebman, R.R. Murchison, C.R.Jones, and R.G. Martin, 1975. Preliminary Bathymetric Map of Gulf ●
of Mexico Region. U.S. Geological Survey, 1:2,500,000, 91 x 83 cm,Open Fife Map #75-140.
Spears, R., 1971. An evaluation of the effects of oil, oil field brineand oil removing compounds. American Institute of Mining, Metal-lurgical and Petroleum Engineers (A IME,) Environmental Quality Con- *ference, 199-206.
Stearns, S. D., 1973. ‘Digital Filter Design Routines. Report “ -
#S LA-73-0871, Sandia Laboratories.
Stenhagen, E., S. Abrahamsson, and F. McLafferty, 1969. Atlas of Mass .0
Spectral Data. 3 VOIS. Wiley and Sons, New York.
, 1974. Registry of Mass Spectral Data. 4 VOIS. John Wileyand Sons, New York.
Stetson, H. C., 1953. The sediments of the western Gulf of Mexico, partl--The continental terraces of the western Gulf of Mexico: Itssurface sediments, origin, and development. Papers in” PhysicalOceanography and Meteorology, Mass. Inst. Tech. ,o~eanog. Inst. , 12[4), 1–45.
Stimson, J. S., 1978. Mode and timing of reproductionhermatypic corals of Hawaii and Enewetak . Mar.184.
and Woods” Hole
in some commonBiol. , 48, 173-
Stoddart, D. R., 1969. Ecology and morphology of recent coral reefs.Biol. Rev. Carob. Philos. Sot., 44, 433-498.
, 1972. Field methods in the study of cora! reefs. Proc.Symp. Corals and Coral Reefs, Mar. Biol. Assoc. India, 71-80.
, P.S. Davies, and A.C. Keith, 1!?66. Geomorphology of AdduAte!!. Atoll Res. Bull., 116, 13-41.
Storr, J. F., 1964. Ecology and oceanography of the coral reef tract,Abaco Island, Bahamas. Geol. Sot. Am. Spec. Paper, 79, 9-98.
●
9
*

114
.
●Strickland, J. D.H. and T.R. Parsons, 1972. A pratical handbook of sea-
water analysis. Bull. Fish. Res. Ed. of Canada, 167 (2nd edition),310 pp.
Strong, C. W., 1966. An improved method of obtaining density from linetransect data. Ecology, 47, 311-313.
Tagatz, M.E. and M. Tobia, 1978. Effect of barite (BaS04) on devel-opment of estuarine communities. Estuar. Coastal Mar. Sci., 7,401-407:
Takahashi, M. and S. Ichimura, 1970. Photosynthetic properties andgrowth of photosynthetic sulfur bacteria in lakes. Limnol.Oceanogr. , 15, 929-944.
Tatum, T. E., Jr., 1979. Shallow Geological Features of the Upper Con-tinental Slope, Northwestern Gulf of Mexico. Technical Report79-2-T, Department of Oceanography, Texas A&M University, 60 pp.
Technicon Auto Analyzer l!, 1973. Industrial Method No. 186-72W/Tentative. Technicon Industrial Systems, Tarrytown, NY, 1973.
Theede, H., A. Ponat, K. Hiroki, and C. Schlieper, 1969. Studies onthe resistance of marine bottom invertebrates to oxygen deficiencyand hydrogen sulfide. Mar. Biol. (Berl .), 2, 325-337.
Thierstein, H. and W. Berger, 1978. Injection events in ocean history.Nature, 276, 461-466.
Thompson, J.H. and T.J. Bright, 1977. Effects of drill mud on sedimentclearing rates of certain hermatypic corals. Proc. of Oil Spill
● Conference (Prevention, Behavior, Control, Cleanup) , New orleans,LA, March 8-10, 495-498.
*
, E.A. Shinn, and T.J. Bright, in press. Effects of drillingmud on seven species of reef-building corals as measured in thefield and laboratory. In Geyer, R.A. , ed. , Marine EnvironmentalPollution, Vol. 1, Part B, Elsevier, New York.
Thompson, M.J. and T.W. Schmidt, 1977. Validation of the species/timerandom count technique sampling fish assemblages at Dry Tortugas.P roc. Third Int. Coral Reef Symp., Univ. Miami, Rosenstiel Schoolof Marine and Atmospheric Science, 1, 283-288.
Trefry, J. H., A.D. Fredericks, S.R. Fay, and M.L. Byington, 1979.Heavy metal analysis of bottom sediment. In Mississippi, Alabama,Florida (MAFLA) Outer Continental Shelf Baseline Environmental Sur-vey, 1977/1978. Dames and Moore, Final Report to U.S. Dept. of in-terior, Bureau of Land Management, Contract #AA550-CT7-34.
9

1?5
and B.J. Presley, 1976. Heavy metals in sediments from SanAn~onio Bay and the northwest Gulf of Mexico. Envir. Geol, 1,283--294.
Tresslar, R. C., 1974. Corals. In Bright, T.J. and L.H. Pequegnat,eds. , Biota of the West Flower Garden Bank, Gulf Publishing Co.,Houston, TX, pp. 116-139.
Truper, H., 1975. The enzymology of sulfur metabolism in phototrophicbacteria: A review. Plant Soil, 43, 29-39.
Turekian, K.K. and }(. H. Wedepohl, 1961. Distribution of the elementsin some major units of the earth~s crust. Geol. Sot. Am. Bull.,72, 175.
Turner, 3. S., 1973. Buoyancy Effects in Fluids. Cambridge UniversityPress, London, 367 pp.
Tyler, J.C. and J.E, Boehlke, 1972. Records of sponge-dwelling fishes,primarily of the Caribbean. Bull. Mar. Sci., 22(3), 601-542.
Uebelacker, J. M., 1977. Cryptofaunal special/area relationship in thecoral reef sponge Ge!liodes digitalis. Proc. Third Int. Coral ReefSymp., Univ. Miami, Rosenstiel School of Marine and AtmosphericScience, 1, 69-73.
U.S. Department of Commerce, National Ocean Survey, 1978. Tidal Cur-rent Tables 1979; Atlantic Coast of North America. U.S. GovernmentPrinting Office, Washington, D. C., 218 pp.
Vaughn, T.W. andand genera of1-363.
J.W. Wells, 1943. Revision of the suborders, familiesthe Scleractinia. Spec. Pap. Geol. Sot. Am., 44,
,
●
Venrick, E., J. McGowan, and A. Mantyfa, 1971. Deep maxima of photo-synthetic chlorophyll in the Pacific Ocean. Fish Bull., 71,41-52.
Vine, P. J., 1974. Effects of algal grazing and aggressive behavior of *the fishes Pomacentrus Iividus and Acanthurus solial on coral reef.—ecology. Mar. !3iol, 24, 131-136.
Vittor, B. A., 1979. Abundance, diversity and distribution of benthicpolychaetons anrielids in the Eastern Gulf of Mexico. Chapter 15.Vol. II A. [n Mississippi, Alabama, Florida (MA FL.A) Outer Conti- *nental Shelf Baseline Environmental Survey 1977/1978. Dames andM o o r e , Final R e p o r t t o iJ. S . E)ept. o f Interior, B u r e a u o f Land M a n -a g e m e n t , C o n t r a c t #AA550-CT7-34, 7 4 8 p p . .
●●

● “.
●
●
.
0.
.
●
.
*●
APPENDIX ARAW DATA TABLES
●

,●
9
●
●
6
●
.
*9
●

C C)O'-1 0
L4
rTP°I
ItTP
G8
MO
LJJJ
A-1
TABLE I l l -1SEDIMENT PARTICLE TYPES AND PERCENT CARBONATE
● ’.
S a m p l e
.
● ✎
● ✎
●
coG+waJu
mu(n
3l-i
isEFG1-lGEFG2-lGEFG3-lGEFG4-lGEFG5-lGEFG6-lGEFG7-lGEFG8-lGEFG9-lG
EFG1O-1GEFG1l-lGEFG12-lGEFG13-lGEFG14-lGEFG15-lGEFG16-lGEFG17-lGEFG18-IGEFG19-lGEFG20-lGEFG21-lGEFG22-lGEFG23-lGEFG24-lGEFG25-lGEFG26-lGEFG27-lGEFG28-lGEFG29-lGEFG30-IGEFG31-lGEFG32-lG
z-1z - 2z -3z - 4z-.5z - 6
DS1-lG1DS 1 -2G 10S1 -3G1DS 1 -4G1DS1-5G1DS1-6GIDS1-7GlDS 1 -8G1
6 2 . 66 8 . 2
1 . 613.32 4 . 2
9 . 30 . 09.19 . 4
5 0 . 57 9 . 66 5 . 74 1 . 25 0 . 74 0 . 25 7 . 76 0 . 011.117.53 . 80 . 50 . 92 . 43 . 31 . 00 . 01 . 00 . 09 . 2
10.37 . 88 . 00 . 00 . 50 . 50 . 00 . 00 . 0
4 3 . 337*33 9 . 53 1 . 94 4 . 33 0 . 43 6 . 93 2 . 5
2 0 . 08 . 05 . 5
10.27.12 . 01 . 47.17 . 4
12.57 . 6
2 3 . 52 0 . 415.520.116.92 0 . 0
4 . 55 . 59 . 63 . 63 . 01.65.13 . 90 . 51 . 00 . 64.18 . 4
11.18 . 80 . 01 . 51 . 00 . 00 . 00 . 5
3 2 . 03 0 . 32 9 . 52 5 . 63 6 . 62 2 . 52 5 . 23 2 . 0
0 . 50 . 08 . 70 . 00 . 00 . 0
1 3 . 00 . 50 . 00 . 00 . 00 . 00 . 00 . 00 . 00 . 00 . 00 . 50 . 00 . 00 . 0
16.21.64 . 5
1 5 . 04 4 . 5
1 . 54 1 . 5
0 . 01 . 04 . 50 . 4
2 3 . 60 . 50 . 00 . 00 . 00 . 00 . 00 . 00 . 00 . 00 . 00 . 50 . 00 . 0
2.5 2.0 0.5 0.0 0.0 0.08.0 2.0 0.5 0.0 0.0 0.07.1 35.0 4.4 3.3 7.1 4.4
14.8 15.3 9.7 0.0 5.6 5.18.1 11.4 6.2 0.0 0.0 0.01.5 5.9 0.0 0.0 0.5 1.0
12.6 22.7 22.7 1.0 3.4 5.89.1 35.5 22.8 0.0 1.0 2.57.4 25.1 9.9 0.0 1.0 1.52.9 5.8 0.0 0.0 0.0 0.02.4 3.8 0.9 0.0 0.0 1.44.4 2.0 0.0 0.0 0.0 0.02.4 3.8 0.0 0.0 0.0 0.02.4 6.3 3.4 0.0 0.0 0.02.5 3.5 5.0 0.0 0.0 1.03.5 2.5 0.5 0.0 0.0 0.07.0 1.0 0.0 0.0 0.0 ().04.0 9.1 1.5 0.0 1.5 ().05.5 2.5 0.5 0.0 0.5 0.03.8 33.5 2.9 1.4 4.8 1.04.6 27.6 0.0 0.0 0.0 0.02.1 11.9 3.4 0.0 ‘2.6 1.7
12.4 25.1 1.2 0.4 6.fJ 8.010.3 54.7 6.5 0.0 7.0 0.5
9.2 33.8 8.2 0.0 3.4 1.91.8 4.5 2.3 0.0 0.9 2.7
11.8 51.8 7.2 2.1 4.6 4.65 . 7 0.0 11.4 4.0 1 . 7 1 0 . 24.1 4.6 4.1 0.0 0.5 0.02.0 6.9 3.4 0.0 0.0 ().0
13.5 33.2 3.3 8.2 8.2 6.17.3 36.4 26.1 0.8 1.5 0.04.4 12.1 52.7 1.6 0.0 4.40.5 0.0 0.0 0.0 0.() 0.00.0 0.0 0.0 0.0 ().() 0.()0.5 0.0 0.0 0.0 0.0 (lOr)
25.0 0.0 0.0 0.0 0.0 ().()0.0 0.0 0.0 0.0 ().() O.IJ6.4 1.0 0.0 0.0 0.0 0.58.0 6.5 2.0 0.0 0.0 O.(I2.3 5.0 0.0 0.0 ().IJ 0.03.9 3.9 0.0 0.0 0.0 0.()7.7 8.8 0.O ().0 I)*() O*O8.8 16.7 3.4 1.5 5.9 7.4
10.3 7.9 0.0 0.0 0.0 I)*97.1 5.6 0.0 0.0 ().0 1.()
0 . 00 . 0
2 3 . 06 . 65 . 2O*O
17.40 . 00 . 00 . 00 . 01 . 00 . 01.40 . 02 . 50 . 05 . 67 . 0
16.36 2 . 85 8 . 34 0 . 6
6 . 52 3 . 24 0 . 510.82 0 . 5
7,17 . 40 . 05 . 01.1O*O0 . 00 . 00 . 00 . 03 . 01 . 01.41.40 . 00 . 00 . 00 . 0
0 . 013.3
0 . 010.234.17 6 . 6
0 . 010.23 4 . 52 6 . 0
3 . 32 . 5
2 9 . 91 7 . 924.112.48 . 5
56.15 6 . 518.2
1 . 00 . 00 . 00 . 00 . 50 . 50 . 01.7
6 6 . 359.1
3 . 75 . 7O*O
9 5 . 49 7 . 09 7 . 5
0 . 09 8 . 513.814.92 2 . 33 3 . 3
2 . 62 . 0
18.72 1 . 8
2.00 . 00 . 09 . 23 . 83 . 40 . 02 . 03 . 92 . 40 . 91 . 02 . 42 . 43 *54 . 03 . 56 . 14 . 54 . 80 . 00 . 00 . 81 . 40 . 02 . 33 . 62 . 80 . 01 . 50 . 40 . 00 . 01 . 51 . 52 . 0
7 5 . 01 . 00 . 00 . 00 . 00 . 00 . 01 . 00 . 00 . 0
18.12 0 . 05 9 . 872.112.53 4 . 49 1 . 327.15 9 . 72 2 . 216.817.418.41 9 . 019.216.619.32 4 . 32 6 . 46 7 . 43 9 . 87 2 . 27 3 . 38 3 . 792.193.18 4 . 29 0 . 937.12 3 . 96 4 . 07 0 . 49 8 . 8
5 . 25 . 42 . 95 . 43 . 40 . 00 . 00 . 0o* o0 . 00 . 00 . 00 . 0

3UO
91U
JI93
2IM
rocJ
isD
TA8LE 11 l - 1 ( C o n t i n u e d )
Sample
DS1-901DS1-1021DS1-ll G1DS1-12G10S2-1DS2-20S2-3DS2-4DS2-50s2-6DS2-70S2-8DS2-90s2-1 o0S2-1 10 s 2 - 1 2JAK 1JAK 3JAK 4DIA 1DIA 2DIA 3DIA 4ALD 1ALD 2ALD 3ALD 4FIS 1FIS 2FIS 3FIS 4COF ?COF 2COF 3COF 432F 132F 232F 432F 5AFP
4 0 . 852.26 7 . 45 0 . 728.12 9 . 32 6 . 12 8 . 24 5 . 52 0 . 63 8 . 04 3 . 61 6 . 91 6 . 94 0 . 323.130.16 5 . 4
9 . 85 . 4
1 2 . 06 5 . 75 1 . 8
6 . 34 . 03 . 78 . 6
1 6 . 710.26 . 1
1 1 . 01 . 02 . 50 . 50 . 00 . 51 . 00 . 00 . 5
18.1
mcdc1+4$
wo-l
2 8 . 015.410.22 0 . 52 2 . 616.213.82 3 . 631 ● 51 1 . 32 7 . 72 7 . 03 6 . 22 3 . 43 5 . 014.67 . 4
2 7 . 72 . 63 . 45 . 2
18.214.43 . 22 . 56 . 01 . 99 . 77.16 . 67 . 31 . 01 . 50 . 00 . 5T*Oo. !50 . 00 . 07 . 3
0 . 00 , 00 . 00 . 00 . 00 . 00 . 00 . 00 . 02 . 00 . 00 . 00 . 0O*O0 . 03 . 01.40 . 0
17.52 3 . 9
2 . 60 . 00 . 54 . 22 . 50 . 9
2 0 . 51.10 . 01.01 . 00 . 0o* o0 . 00 . 00 . 00 . 00 . 00.0
18.1
13.7 7.6!5.4 1 1 . 41 0 . 7 7 . 02 2 . 0 6 . 3
4 . 5 1 4 . 62.3 5.04 . 9 1 3 . 32.1 3.22 . 8 1 0 . 34 . 9 1 9 . 16.1 3.87 . 6 !3.77 . 7 1 2 . 93 . 0 2 5 . 95.8 9.75 . 0 3 7 . 25 . 1 3 1 . 03.7 2.17.7 6.74 . 9 17.17 . 3 2 8 . 85.1 4.56.7 9.7
1 2 . 2 2 0 . 11 4 . 1 1 3 . 68 . 3 2 4 . 9
1 0 . 0 1 6 . 71 . 6 2 6 . 34 . 6 3 6 . 03 . 0 2 5 . 44 . 2 1 6 . 2O*5 3.01.0 4.00.5 4.00.5 3.50.5 2.01.5 5.00.0 3.50.0 2.57 . 8 2 3 . 3
o* o0 . 02 . 30 . 00 . 52 . 30 . 08 . 21.41 . 50 . 00.50 . 91 . 00 . 07 . 0
11.10 . 5
4 6 . 42 6 . 82 4 . 6
4 . 58 . 7
2 7 . 53 9 . 217.5
9 . 512.4
4 . 65.17 . 30.O0 . 50 . 00 . 00 . 50 . 00 . 00 . 06 . 2
0 . 00 . 00 . 00 . 00 . 00 . 00 . 00 . 00 . 00 . 50 . 00 . 00 . 00 . 00 . 00 . 00 . 00 . 00 . 00 . 00 . 00 . 00 . 03 . 21.50 . 01 . 00 . 0o* o0 . 00 . 00 . 00 . 00 . 00 . 00 . 00 . 00 . 00 . 0I .0
0 . 00 . 00.00 . 50 . 00 . 50.00 . 0o“ o0 . 0o* o0 . 00 . 01 . 00 . 01 . 51 . 40 . 02 . 6
14.16 . 30 . 02 . 67 . 98 . 58 . 8
15.23 . 8
10.27 . 6
11.50 . 00.00 . 50 . 00 . 51 . 00 . 00.52 . 6
0.0 0.02.0 0.02.3 0.0O*O 0.00.0 0.00.5 0.01.5 0.01.1 0.00.0 0.51.0 0.00.5 2.80.0 0.00.0 0.00.0 1.00.0 1.05.0 0.03.7 0.00.0 0.03.1 3.13.4 0.08.9 1.60.5 0.03.6 0.0
lt.6 0 . 02.5 5.53.2 6.5
15.2 0.02 . 2 1 5 . 12.0 2.04.1 7.65.8 6.80.0 f.50.5 1.00.5 0.00.0 0.00.0 0.01.0 0.01.0 0.00.5 0.05.7 0.0
5 . 23 . 5O*O0 . 0
2 7 . 64 1 . 9
.39.432.1
7 . 53 8 , 721.1
7 . 615.52 7 . 9
9 . 21 . 50 . 00.50 . 0O*50 . 01.52.10 . 04 . 56 . 50 . 03 . 8
12.75.18 . 9
9 0 . 588.19 1 . 59 4 . 59 5 . 09 0 . 09 5 . 59 6 . 0
5 . 2
,
u
0 . 00 . 00 . 00 . 02 . 02 . 31 . 01 . 40 . 50 . 50 . 00 . 00,00 . 0o* o2 . 08 . 80 . 00 . 50 . 52 . 60 . 00 . 03 . 7}.5
1 3 . 81.47 . 5
10.72 8 . 419.92 . 51.02 . 51 . 00 . 00 . 00 . 00 . 04 . 7
0 . 00 . 0
●
0 . 00 . 00 . 0O*O0 . 00 . 00 . 00 . 00 . 00.0 “ -0 . 00 . 00.0 .00 . 0
7 0 . 614.89 2 . 48 7 . 753*41 4 . 92 2 . 68 3 . 05 8 . 35 0 . 77 8 . 25 3 . 93 4 . 45 7 . 82 8 . 712.92 1 . 84 0 . 23 6 . 7
0 . 00 . 00 . 00 . 00.0
●
o
●

● * ● ●✌
TABLE I I I -2X-RAY DIFFRACTION OF SUSPENDED SEDIMENTS (Tenneco)
%EXPANDABLE $ EXPENDABLESAMpLE %SMECTITE MlxED L A Y E R CLAyS %ILLITE gKAOLINITE %CHLORITE S A M P L E zsMEcTITE M I x E D L A Y E R cLAyS jILLITE jKAOLINITE %cHLoRITE
STA- 1STA-2STA-3STA-4EFG- 1EFG-2EFG-3EFG-4EFG-5EFG-6EFG-7EFG-8EFG-9EFG-10EFG-1 1EFG-12EFG-13EFG-14EFG-15EFG-16EFG-17EFG-18EFG-19EFG-20
27 - - 38 3537 — 31 3236 - - 34 3042 - - 39 1942 - - 27 3131 - - 28 42
NOT ENOUGH SAMPLE, BUT K > I > S- - 17 37 4638 - - 32 2047 - - 26 2741 — 31 28
NOT ENOUGH SAMPLE, BUT I > K (NO SMECTITE)45 — 29 2653 - - 27 2043 - - 31 2629 --- 33 4852 - - 28 2047 - - 30 2334 33 3339 - - 38 2342 27 3141 - - 37 2231 . . - 35 3441 - - 42 17
“-
TRTRTRTR—
------
------
TR
----TRTR
EFG-21EFG-22EFG-23EFG-24EFG-25EFG-26EFG-27EFG-28
z - lz -2z - 3z - 4 - 1z-4-1 Iz - 5Z - 6
COF-1COF-2COF-3COF-4ALD-1ALD-2ALD-3ALD-4FIS-4
16421415201630—
103
39- -
1325
8362932- -
543729 ‘2335
--
--
8
----12—
--
33--
2728444126363842!32553655504258414731453038434041
57304244544832%38422533373334232437221625283724
TR------—TRTR
--
TR
--T R ”TRTRTR
-.TRTRTR
TR
?’w

An6
TABLE II I-5BOTTOM SEDIMENT TEXTURE c
*
SAMPLE Q?AVEL SAND SILT CLAY MEAN MEDIAN STD DEV SKEWNESS KURTOSIS
JAI(-1 9 . 9 5 7 2 . 8 3 5 . 0 6 12.17 1.79 n 7 9 3 . 2 9JAK-3JAK-4DIA-ID IA-2D I A-3D IA-4ALD-1ALD-2ALD-3ALD-4FIS-1F I S-2FIS-3F I S-4COF-1COF-2COF-3COF-432F-132F-232F-432F-5LIS-1EFG1-lGEFG ~ -2GEFG2-lGEFG2-2GEFG3-lGEF83-2GEFG4-lGEFG4-2GEFG5-GEFG6-GEFG7-GEFG8-GEFG9-GEFG1O-GEFG1 1-GEFGi2-GEFG13-GEFG14-GEFG15-GEFG16-GEFG17-GEFG18-GEFG 19-GEFG20+EFG21 -GEFG22-GEFG23-GEFG24-GEFG25-GEFG26-G
0 . 0 71 4 . 2 712.6215.440 . 7 20 . 7 9
3 0 . 5 72 8 . 2 252.412 6 . 1 614.24
7 . 5 819.594 6 . 2 9
0 . 2 41 3 . 5 63 2 . 4 7
0 . 5 88 . 9 6
14.423 . 0 93 . 9 92 . 3 80 . 00 . 00 . 00 . 0 2
2 3 . 8 83 4 . 9 6
0.111 . 6 50 . 01 . 6 90 . 1 00 . 0O*O0 . 1 60 . 00 . 00 . 0 40 . 0 80 . 1 00 . 00 . 00 . 0 20.312 . 4 24 . 1 06.21
5 0 . 1 84.310 . 1 5
3 0 . 7 0
1.638 4 . 2 38 6 , 5 05 6 . 5 611.622 0 . 6 968.044 6 . 0 427.817 3 . 4 34 2 . 7 43 6 . 5 443.8410.398 6 . 3 06 7 . 0 24 9 . 3 29 8 . 0 57 3 . 6 671.9196.228 9 . 0 02 2 . 5 5
2 . 5 20.014 . 0 05 . 5 5
52.024 0 . 2 48 8 . 4 786.53
0 . 0 466.169 6 . 4 88 6 . 7 38 5 . 2 0
9 . 8 50 . 0 70 . 03 . 2 44 . 7 35 . 0 00 . 0 27 . 2 2
6 0 . 5 33 2 . 3 07 7 . 0 73 4 . 8 26 9 . 4 62 9 . 7 38 2 . 8 69 8 . 3 56 9 . 1 9
56.520 . 4 00 . 3 0
13.674 8 . 0 83 7 . 2 8
0 . 5 214.058 . 8 20 . 2 4
15.553 3 . 9 315.802 4 . 4 0
8.2112.358 . 3 70 . 6 66 . 5 44 . 2 10 . 2 21.60
31*194 5 . 8 232.743 9 . 0 244.81
5 . 8 25 . 6 63 . 3 05 . 2 7
2 6 . 1 75 . 9 00 . 8 22 . 9 24 . 0 8
3 6 . 3 32 5 . 1 73 0 . 8 24 4 . 9 94 2 . 1 32 8 . 7 951.983 2 . 9 315.132 3 . 0 2
7 . 3 92 4 . 6 2
9 . 9 97.317 . 3 30 . 5 40 . 0 4
4 1 . 7 71.100 . 5 8
14.333 9 . 5 84 1 . 2 4
0 . 8 611.6910.960.18
2 7 . 4 72 1 . 9 52 0 . 7 618,925 . 2 57 . 0 89 . 8 50 . 7 2
10.859 . 4 60 . 4 75 . 4 0
4 3 . 8 851.6667.2456.984 9 . 6 218.2819.14
8 . 1 26 . 5 6
7 3 . 8 02 6 . 2 5
2 . 6 010.3510.7253.667 4 . 7 66 9 . 1 851.7453.0766.1148.005 9 . 8 524.324 4 . 3 813.1236.4614.3412.79
5 . 4 90 . 9 60.07 -
7.510 . 1 60 . 0 42 . 2 96 . 6 66 . 5 60 . 0 31.880 . 9 30 . 0 93 . 6 24 . 2 22 . 8 82 . 5 53 . 1 92 . 5 91.722 . 3 33 . 1 52 . 6 92 . 2 52 . 8 06 . 3 37 . 9 38.%7 . 9 67 . 5 92 . 0 81 . 9 62 . 6 82.618 . 6 64 . 6 72.113 . 4 83 . 3 97 . 6 28 . 7 38 . 5 47 . 8 67 . 8 58 . 2 67 . 9 07 . 9 54 . 7 86 . 5 72.615 . 3 72.511.192 . 6 81.69
.0.31
U.IL
7 . 6 70 . 0 50 . 0 20 . 8 77.317 . 5 6
- 0 . 1 60 . 6 0
- 1 . 0 80.011 ● 794 . 4 41.21
- 0 . 0 62 . 7 72 . 6 71.222 . 2 92 . 5 22 . 4 52 . 3 52 . 4 57 . 4 68 . 0 68 . 6 38 . 3 47 . 9 80 . 4 20 . 3 82 . 0 62 . 0 98 . 8 23 . 6 21.722 . 8 32 . 4 78 . 1 79 . 0 38 . 7 68 . 0 78 , 1 38.617 . 9 28 . 4 73.217 . 5 61.516 . 6 01.04
- 1 . 0 12 . 2 81.62
- 0 . 3 4
1.731.42?.153 . 6 72 . 7 43.111.613 . 6 43 . 6 91.334 . 2 93 . 7 44 . 1 24 . 4 81.762 . 7 63 . 4 30 . 8 72 . 7 52 . 9 01.132 . 0 03 . 4 71.701.371.96
, 2 . 1 03 . 9 84 . 0 92 . 2 52 . 2 31.223 . 1 21.542.212 . 3 42 . 2 21.351.401.811.921.871.522 , 1 03 . 0 63.013 . 1 43 . 8 73 . 4 33 . 8 52 . 1 51.081.06
1.48- 0 . 8 1
3 . 3 43*540 . 9 2
- 0 . 6 9- 0 . 9 0
2 . 1 00 . 9 61.390 . 9 60 . 2 90 . 0 40 . 5 70 . 4 22 . 4 40 . 6 61.003 . 5 00 . 8 90 . 7 6
- 0 . 1 71 . 4 5
-o ● 70- 1 . 0 0- 0 . 6 0- 0 . 8 4- 0 . 6 8
1 . 0 00 . 9 42 . 0 81.80
- 0 . 6 60 . 4 92 . 8 41.911.80
- 0 . 9 2- 0 . 9 5- 0 . 7 7- 0 . 8 9- 1 . 1 5- 1 . 6 1- 0 . 1 4- 1 . 0 1
0 . 5 6- 0 . 3 9
1 . 2 9- 0 . 3 4
1.091.241.523 . 8 00 . 7 9
0.911.48
19.452 7 . 0 0- 0 . 5 4- 0 . 2 5- 0 . 4 0
9 . 1 8- 0 . 3 4
0.514 . 2 3
- 1 . 5 8-1 ● 33- 1 . 2 3- 1 . 5 3
6 . 8 50 . 7 00 . 1 5
3 4 . 7 30 . 9 20 . 6 8
10.064 . 5 4
- 0 . 8 01 ● 99
- 0 . 2 50 . 1 4
- 0 . 1 5- 0 . 5 4- 0 . 7 2
3 . 6 53 . 2 3
- 0 . 0 4- 0 . 9 510.912 . 6 02 . 0 20 . 2 90 . 4 60 . 1 01.091.773 . 2 4
- 0 . 8 80 . 3 0
- 1 . 2 4- 1 . 2 2
0 . 3 6- 1 . 3 7- 0 . 2 4
0 . 0 63 . 4 8
2 5 . 7 64 * 5 5
●
●
e
●
s

J*
●
9.
&7
TA8LE III-5 (Continued)
SAMPLE G?AVEL SAND SILT CLAY MEAN MEDIAN STD DEV SKEWNESS KURTOSIS
EFG27-GEFG29-GEFG30-GEFG31 -GEFG32-GDS1-lGIDS1-1G2DS1-2G1DS 1 -2G2DS 1 -3G1DS1-3G2DS1-4G1DS1-4G2DS1-5G1DS1-5G2DS 1 -6G1DS 1 -6G2DS1-7G1DS 1 -7G2DS1-8G1DS 1 -8G2DS 1 -9G 1DS 1 -9G2DS1-1OG1DS1-IOG2DS1-llGIDS1-11G2DS1-12G1DS1-12G2DS2-1-2GDS2-2-2GDS2-3-2GDS2-4-2GDS2-5-2GDS2-6-2GDS2-7-2GDS2-8-2GDS2-9-2GDS2-10-2GDS2-11-2GDS2-12-2G
z - Iz - 2z - 3z - 4z - 5Z - 6
0.190 . 3 80 . 1 8
17.6410.47
0 . 00 . 1 90 . 00 . 0 40 . 00 . 0 70 . 3 90 . 8 80 . 2 90 . 1 72 . 9 29 . 4 40 . 2 70 . 00 . 3 60 . 5 30.120 . 00.210 . 0 60 . 0 80 . 0 20 . 7 20 . 00 . 0 60 . 5 41 . 2 62 . 7 60 . 0 5
4 8 . 4 81.920 . 3 50 . 9 59 . 1 20 . 0 8
3 7 . 0 548.31
0 . 2 00.110 . 0 5
11.630 . 0 2
9 4 . 4 37 5 . 2 53 0 . 6 64 8 . 0 763.77
0 . 0 34 . 4 80 . 02.010 . 1 03 . 4 33 . 0 75 . 7 83 . 5 33*93
2 8 . 0 44 2 . 9 0
3.710 . 0 66.617 . 6 81 . 5 90 . 0 23.112.212 . 7 51.572 . 5 90 . 0 23 . 6 9
15.0510.6116.82
2 . 0 03 4 . 5 618.028 . 4 92 . 0 2
2 5 . 0 63 . 7 4
39.414 9 . 9 06 2 . 3 471.7958.446 9 . 1 010.35
2 . 7 210.223 2 . 7 015.2111.623 0 . 5 925.684 7 . 9 54 2 . 8 33 8 . 4 929.7354.553 2 . 0 84 4 . 3 832.403 0 . 8 817.414 2 . 8 73 4 . 4 953.393 5 . 5 25 0 . 5 051.323 2 . 9 332.143 5 . 1 228.242 9 . 2 64 1 . 3 94 7 . 4 24 0 . 2 43 6 . 4 635*944 0 . 3 3
6 . 4 22 7 . 8 73 5 . 9 63 4 . 3 52 7 . 1 64 0 . 1 4
8 . 3 81.24
13.249 . 8 0
18.588 . 1 6
3 3 . 3 6
2 . 6 614.153 6 . 4 519.0814.156 9 . 3 869.6552.0555.1261.416 6 . 7 64 1 . 9 96 1 . 2 551.8063.503 8 . 1 630.2453.156 5 . 4 539.6456.2647*794 8 . 6 563.746 5 . 5 86 2 . 0 570.176 7 . 4 358.594 8 . 8 34 4 . 1 651.674 4 . 4 857.6210.545 2 . 2 055.196 2 . 6 838.6656.0415.160 . 5 4
2 4 . 2 218.312 2 . 9 311.1156.27
2 . 3 43 . 9 36 . 3 23 . 2 62 . 7 68:628.418.018 . 0 88 . 3 48 . 3 670518 . 0 27 . 8 48 . 1 55.844 . 3 87.918 . 4 77 . 2 37 . 7 67 . 7 87 . 8 88 . 2 78 . 3 58 . 2 58 . 5 48 . 3 28 . 2 37 . 7 97 . 0 87*446.818 . 1 40.817 . 0 37.718.195 . 5 87 . 9 71.50
- 0 . 7 44 . 8 94 . 4 04 . 8 73 . 1 27 . 6 9
2 . 1 43 . 1 07 . 0 92 . 1 51.808 . 7 28 . 8 48 . 0 88.218 . 4 48 . 6 57 . 6 48 . 4 98 . 0 78.517 . 3 22 . 8 48 . 1 38 . 5 77*438 . 2 37 . 9 07 . 9 48.518.618 . 4 88 . 7 38 . 8 08 . 3 37 . 9 67 . 6 98 , 0 77.718 . 2 7
- 0 . 9 18.118 . 2 38 . 4 67 . 1 58.21
- 0 . 3 1- 0 . 9 6
3 . 3 43 . 0 63 . 4 22 . 6 88 . 2 6
1.582 . 6 32 . 8 93.913 . 4 71.251.931.481.681.401.781.932 . 2 51.901.963 . 7 64 . 1 01.961.362 . 2 42 . 2 91.751.571.791.721.741.501.981.451.752.612 . 5 93 . 0 91.623 . 6 33 . 1 32 . 3 41.863 . 9 71.824 . 0 21.362 . 8 92 . 6 22 . 8 22 . 9 02 . 1 8
2 . 5 71.11
- 0 . 4 00 . 4 30 . 8 2
- 0 . 4 7- 1 . 9 9- 0 . 2 5- 1 . 1 2- 0 . 4 4- 1 . 8 5-1.07- 1 . 9 0- 1 . 4 4- 1 . 6 0- 0 . 6 4
0 . 0 9-1.54- 0 . 5 7- 1 . 0 3- 1 . 6 7- 0 . 8 2- 0 . 2 0- 1 . 9 4- 1 . 5 4- 1 . 5 4- 1 . 6 0- 2 . 0 1- 0 . 3 9- 1 . 2 6- 1 . 0 2- 1 . 4 8- 1 . 1 5- 1 . 3 0
1.53- 1 . 1 6- 1 . 5 1- 2 . 2 7-o ● 57- 1 . 5 7
1.144 . 1 60 . 6 71.140 . 6 60 . 7 2
- 0 . 9 6
9 . 2 00 . 1 9
- 1 . 0 9- 1 . 2 0- 0 . 5 3- 0 . 4 8
5 . 1 8- 0 . 7 7
2 . 8 0- 0 . 4 9
5.112.614.313 . 6 03 . 3 5
- 1 . 1 2- 1 . 5 4
3 . 8 6- 0 . 1 5
1.483 . 0 01.71
- 0 . 8 46 . 0 03 . 8 74 . 0 34 . 8 55.86
- 0 . 6 43 . 0 50 . 4 51.920 . 3 93 . 5 70 . 8 70 . 2 22 . 2 78.31
- 1 . 2 03.91
- 0 . 3 524.60- 1 . 0 9- 0 . 2 0- 1 . 1 3
0 . 4 90 . 0 2

< .00s wwX-RAY DIFFRACTION
S A M P L E SMEC I L L K A O L CHL=TAK-1 74 18 8 --JAK-2 ALGAL NODULE GRAVELJAK-3 7 6JAK-4 69DIA-1 73DIA-2 61DIA-3 70DIA4 71ALD-1 61ALD-2 7 0ALD-3 7 5ALD-4 71FIS-1 75FIS-2 71FIS-3 71FIS-4 74COF-1 68COF-2 6 9COF-3 7 9COF-4 7 0
16 820 1117 1018 2119 1121 828 1121 917 818 1116 920 919 1015 1119 1310 2112 918 12
--
TRTR----
TRTRTR—
TR.-
TR.-
TRnlTR
z-1 ALL COARSE MATERIALZ-2 65z-3 70z-4 59z-5 75Z-6 69
32FM-I 3 032FM-2 2 33 2 F M - 3 3 332FM-4 2 9
EFG-1 65EFG-2 7 0EFG-3 7 5EFG-4 71EFG-13 7 4EFG-14 7 3EFG-15 7 7EFG-16 7 3EFG-17 7 3
232026112139403336222016191717161717
12101514103137343513109
109
107
1010
----
TR--
TR
—
--
TRTRTR--
TRTRTRTRTR
T A B L E I I I - 3OF f30TTCWl SEDIMENT
SAM?LE SMEC ILL KAOL C H L O R,,
EFG-18 76 15 9 TRTREFG- 19
EFG-20EFG-21EFG-22EFG-23EFG-24EFG-25EFG-26EFG-27EFG-28EFG-29EFG-30EFG-31EFG-320S 1-20S 1-30s 1-4DS1-50S 1-6DS 1-70S 1-8DS 1-9DS1-10DS1-110S1-120S2- 10S2-2DS2-30S2-40S2-50S2-6DS2-70S2-8DS2-9DS2-10DS2-1 10S2-12
72777175686467617467847377625566646966616868646769706775696368676766636368
18121815202219241720121815262621191523201922212119182014202418211919242321
10111110121414159
13498
121913171611191310151212121311II1314121415131411
TRTRTRTRTR,TRTRTR
TRTRTR—
TRTRT RTRTRTRTRTRTRTRT RTRTRTRTRTRTRTRTRTRTRTRTR
,.

nudA
evIl6
le5l
nia6
e,3e
Onf
lal
6len
iMflO
It81
0a16
03O
n
nOit3
61O
16O
3O
fl
tp<
0M-w
O!6
16<
olob
<<
<M
-woI
<M
-r11
d<
tp<
<M
-woI
616M
-dlt1
<bI
e<
M-w
ol<
tpbe
<S
16<
<2M
-rIfi
i6<
M-w
o<
M-d
Irt
<itp
M-ii
is1
<bl
et<
pM-w
ol<
tp<
blot
<tp
<M
-woI
p66
<tp
<<
M-w
ol <<
M-w
oI <pM
-wol
ea,6
O00
ea1s
oon
ea,6
03on
ea16
OO
n
wol
<tp
wol
<tp
wol
<tp
<pM
-ilr
< <pM
-r1I
rl<
M-r
tIr1
<M
-t1i
d< <
M-t
iIr1
<
<M
-r1i
r1oI
ob<
bIe
<tp
<M
-woI
<M
-rit1
<bI
e<
M-w
oI<
tpitp
<M
-wo
<66
<
olob
<itp
<M
-wo
<
EEC-?S
EEC-21
EEC-20
EE
C-SB
EEC-SB
Eee-S
EE
C-SQ
EEC-SQ
EEC-54
EEC-S2
EEC-SS
EEC-Si
EEC-SO
EEC-1
EEC-
18
EEC-i.
EEC-i2
EEC-i
EEC-
14
EEC-i
2
EEC-IS
EEC-i
I
EEC-
10
EE
e-E
EC
-BEEC-S
EEC-Q
EEC-
EEC-2C
I
EEC-SC
I
EEC-iCi
pnia
6o1e
Oiii
)ai
enIM g6
18<
M-r
Iti1
M-w
oI<
bto
<<
tpbt
e<
<tp
bIo
<<
tpM
-woI
<bI
e<
<tp
flOitZ
6e1
6OO
On
5i6
<M
-wo
<pM
-r1i
r1st
p<
<<
M-d
pIt1
0000
0
=bb
?3L-S
?S
E-
COE-
COE-2
COE-S
COE-J
El2-?
E125
E12-1
V1D-
yb-?
vrD-S
vbD-
DIV-
Dlv-?
DIV-S
Div-I
'IVK-
1VK-S
1VK-I
-Q
gwbio
p516
<<
xtp
0616
<bl
e<
tçno
it3s1
not&
i'r
noIto
&-it
-i10M
0616
<btsM
-<
bte
<
<p5
15<
0M-r
I0id
<
tp<
0616
<0M
-wol
tp<
<pM
-wol
p516
<pM
-wol
fp<
618M
-wC
Ip6
16<
0M-w
ol<
M-w
oI<
tp<
0616
<0M
-wol
xtp
<
<<
<M
-woI
<M
-woI
<pM
-drI
p616
<2M
-wo
<M
-rpM
tp<
<M
-woI
<M
-r1I
1<
M-W
OItP
<<
tp<
M-r
Ir1
<M
-woI
tp<
p516
<M
-wot
<
<M
-woI
<
tp<
M-w
ot<
<
tp<
<M
-woI
<
tp<
<M
-iir1
<pM
-wol
<tp
<<
<M
-woI
<tp
<<
M-d
ir$<
pM-w
oltp
<pM
-i1ri
<<
m-w
oI<
M-w
oI<
bIe
<<
tprM
-woI
<<
tphi
bIe
<M
-woI
<<
tpvi
Jii
<<
tpbe
<<
<tp
2M-w
ot<
be<
p516
<<
tp2M
-wol
<be
<<
<tp
M-w
oI<
<<
<be
<<
itpM
-Ii
<tp
e5I6
0fl1
1161
03M
-rtir
I<
tptir
iot
bsrb
nsd
EE
mwo.A
c1
Uulm—tutuOLLw-maA A A
A-5
o