carpenter thesis - accepted
TRANSCRIPT
IMPACT OF ULTRAVIOLET ENERGY ON STRAWBERRY SHELF LIFE
by
Christopher E. Carpenter
B.S., Southern Illinois University, 2007 M.S., Institution, 2009
A Thesis Submitted in Partial Fulfillment of the Requirements for the
Master of Science Degree
Department of Plant, Soil and Agricultural Systems
In the Graduate School Southern Illinois University at Carbondale
August 2009
THESIS APPROVAL
IMPACT OF ULTRAVIOLET ENERGY ON STRAWBERRY SHELF LIFE
By
Christopher E. Carpenter
A Thesis Submitted in Partial
Fulfillment of the Requirements
for the Degree of
Master of Science Degree
in the field of Agricultural Systems Technologies
Approved by:
Dr. W.D. Shoup, Chair
Dr. Alan Walters
Dr. Dwight Sanders
Graduate School Southern Illinois University Carbondale
August 2009
i
AN ABSTRACT OF THE THESIS OF
Christopher E. Carpenter, for the Master of Science degree in Agricultural Systems Technologies, presented on May 4, 2009, at Southern Illinois University Carbondale. TITLE: IMPACT OF ULTRAVIOLET ENERGY ON STRAWBERRY SHELF LIFE MAJOR PROFESSOR: Dr. W.D. Shoup
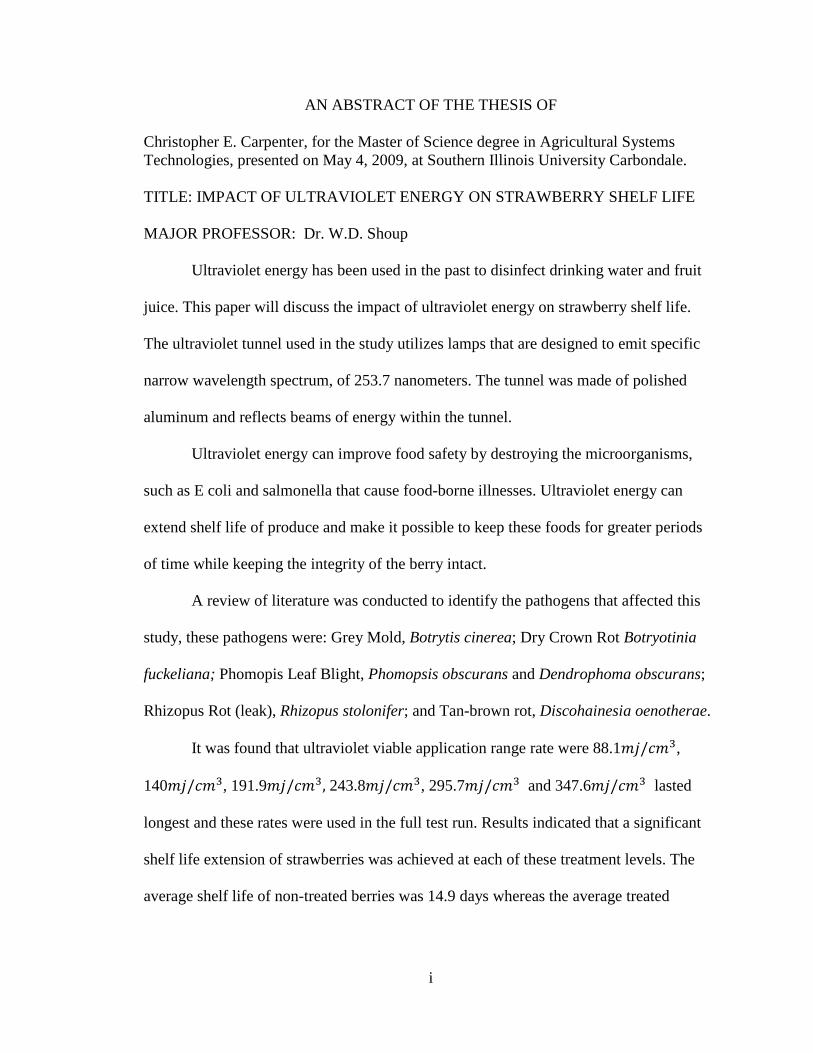
Ultraviolet energy has been used in the past to disinfect drinking water and fruit
juice. This paper will discuss the impact of ultraviolet energy on strawberry shelf life.
The ultraviolet tunnel used in the study utilizes lamps that are designed to emit specific
narrow wavelength spectrum, of 253.7 nanometers. The tunnel was made of polished
aluminum and reflects beams of energy within the tunnel.
Ultraviolet energy can improve food safety by destroying the microorganisms,
such as E coli and salmonella that cause food-borne illnesses. Ultraviolet energy can
extend shelf life of produce and make it possible to keep these foods for greater periods
of time while keeping the integrity of the berry intact.
A review of literature was conducted to identify the pathogens that affected this
study, these pathogens were: Grey Mold, Botrytis cinerea; Dry Crown Rot Botryotinia
fuckeliana; Phomopis Leaf Blight, Phomopsis obscurans and Dendrophoma obscurans;
Rhizopus Rot (leak), Rhizopus stolonifer; and Tan-brown rot, Discohainesia oenotherae.
It was found that ultraviolet viable application range rate were 88.1��/���,
140��/���, 191.9��/���, 243.8��/���, 295.7��/��� and 347.6��/��� lasted
longest and these rates were used in the full test run. Results indicated that a significant
shelf life extension of strawberries was achieved at each of these treatment levels. The
average shelf life of non-treated berries was 14.9 days whereas the average treated
ii
strawberries range from 17.25 to 20.9 days. A lowest level of treatment was reached at 15
seconds or 88.1��/���.
A statistical relationship between application rates and shelf life was determined.
Using an ANOVA table at 95% confidence interval, it was determined when all samples,
as individuals, were considered that the shelf life was extended by exposure to ultraviolet
energy. Another ANOVA table was used for each treatment group versus the control
group, all treatment groups showed a significant difference opposed to the control group.
In conclusion, this study shows that applying ultraviolet energy to strawberries
significantly improves shelf life. There was not a significant benefit to exposing the
strawberries to added ultraviolet energy.
iii
DEDICATION
I dedicate this thesis to: my father, Gordon Carpenter; and my brother, A.J.
Triano; my late grandparents Gordon Carpenter and Marietta Carpenter who instilled a
love and dedication for Agriculture; and my late mother, Dr. Sherry Hill, who has helped
me in spirit for the last 11 years.
iv
ACKNOWLEDGMENTS
I would like to formally thank Dr. W.D. Shoup for his dedication and advice
through this thesis project. I would also like to thank Dr. Brian Klubek for his assistance
with the graduate assistantship; Dr. Alan Walters and Dr. Dwight Sanders for serving on
my committee; Myron Albers for his guidance in the last 3 years; Mr. Jim Clark and Mr.
Ron Fields for their help with the Graduate Assistant’s Union; and the assistance I
received from my peers in the graduate office.
v
FOREWORD
The purpose of this study was to determine if there was a significant difference
between the shelf life of untreated strawberries and those berries treated with ultraviolet
energy berries. A preliminary test was used to determine which ultraviolet treatment
levels should be used for the data run. There are photos from this preliminary test in the
Appendices of this thesis.
vi
TABLE OF CONTENTS ABSTRACT ......................................................................................................................... i
DEDICATION ................................................................................................................... iii
ACKNOWLEDGMENTS ................................................................................................. iv
FOREWORD ...................................................................................................................... v
LIST OF TABLES ........................................................................................................... viii
LIST OF FIGURES ........................................................................................................... ix
LIST OF PHOTOS ............................................................................................................. x
CHAPTER 1 - INTRODUCTION ...................................................................................... 1
CHAPTER 2 - LITERATURE REVIEW ........................................................................... 3
CHAPTER 3 - METHODS AND PROCEDURES .......................................................... 11
TUNNEL SPECIFICATIONS ...................................................................................... 11
ESTABLISHING A CALIBRATION CURVE ........................................................... 12
REDUCING HEAT ...................................................................................................... 13
PRELIMINARY TEST DATA..................................................................................... 13
BERRY SELECTION .................................................................................................. 14
DATA COLLECTION ................................................................................................. 16
CHAPTER 4 - RESULTS ................................................................................................. 19
CHAPTER 5 - CONCLUSION ........................................................................................ 26
CHAPTER 6 - CONTINUING RESEARCH ................................................................... 28
BIBLIOGRAPHY ............................................................................................................. 29
APPENDICES ......................................................................................................................
APPENDIX A - IMPORTANT IRRADIATION EVENTS ......................................... 31
APPENDIX B - IRRADIATION SYMBOL ................................................................ 35
APPENDIX C - TIME/ENERGY CALIBRATION CURVE ...................................... 36
APPENDIX D - COMMON NAMES OF PLAT DISEASES ..................................... 37
APPENDIX E - PRELIMINARY RUN PHOTOS ....................................................... 45

vii
APPENDIX F - LAB PHOTOS .................................................................................... 56
APPENDIX G - LAB NOTES ...................................................................................... 64
VITA ................................................................................................................................. 84
viii
LIST OF TABLES
Table 1 - Exposure rates for each test group measured in both mj/〖cm〗^3 and seconds . 19
Table 2 - ANOVA for all samples treated individually at the 95% confidence interval.
This table is significant ...................................................................................... 21
Table 3 - All F-values were significant at the 95% confidence interval for this ANOVA
of each treatment versus the Control ................................................................. 22
Table 4 - Dunnett's t (two sided) shows difference between means between individual
treatments and the control. Treatments 88.1 mj/〖cm〗^3, 191.9 mj/〖cm〗^3, 243.8
mj/〖cm〗^3 and 347.6 mj/〖cm〗^3 are all different than the control using this test.
............................................................................................................................ 23
Table 5 - LSD Test shows which levels are both homogeneous and best treatments. The
treatments of 243.8 mj/〖cm〗^3, 88.1 mj/〖cm〗^3, 191.9 mj/〖cm〗^3 and 347.6
mj/〖cm〗^3 all showed the best results. The treatments of 295.7 mj/〖cm〗^3 and
140 mj/〖cm〗^3 showed the ne ........................................................................... 23
Table 6 - Student-Newman-Keuls Test shows which treatment levels are homogeneous.
There are three homogeneous levels, 243.8 mj/〖cm〗^3, 88.1 mj/〖cm〗^3, 191.9
mj/〖cm〗^3 and 347.6 mj/〖cm〗^3 make up the first, the second is 295.7
mj/〖cm〗^3 and 140 mj/〖cm〗^3 seconds ............................................................ 24
Table 7 - Paired Samples t-test shows a paired means significance for each sample versus
all the other samples........................................................................................... 25
Table 8 - History of food irradiation ................................................................................. 31
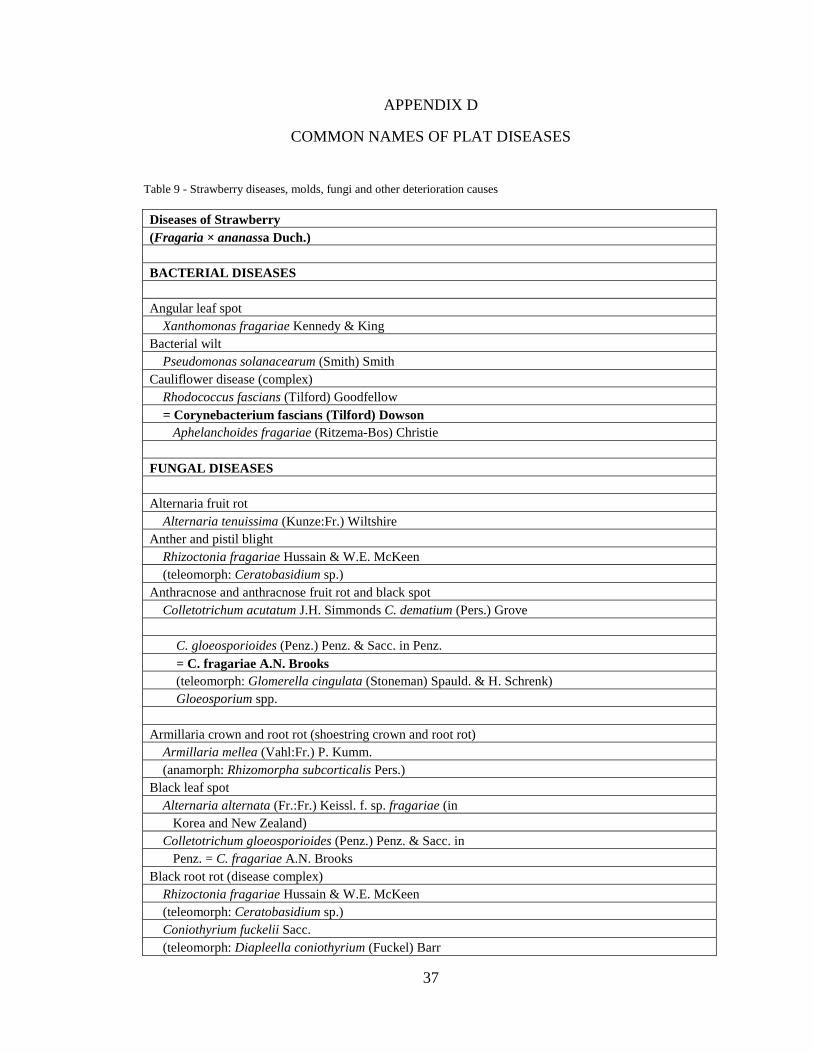
Table 9 - Strawberry diseases, molds, fungi and other deterioration causes .................... 37
ix
LIST OF FIGURES
Figure 1 - Strawberry selection ......................................................................................... 14
Figure 2 - Average shelf life in days for various UV treatment levels ............................. 20
Figure 3- Radura symbol .................................................................................................. 35
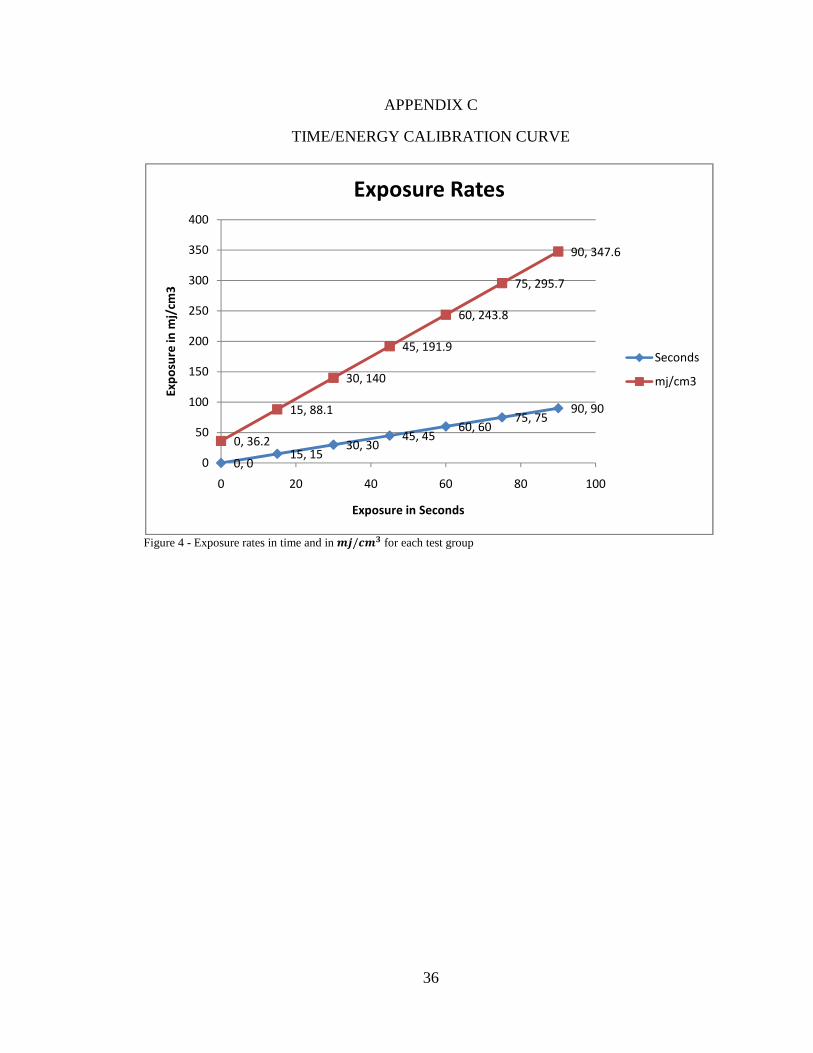
Figure 4 - Exposure rates in time and in ��/��3 for each test group ............................. 36
x
LIST OF PHOTOS
Photo 1 - UV on/off switch ............................................................................................... 11
Photo 2 - Ten-inch secondary fan ..................................................................................... 11
Photo 3 - Primary fan on top of the UV tunnel ................................................................. 12
Photo 4 - Digital scale ....................................................................................................... 13
Photo 5 - Ventilated plastic bags ...................................................................................... 15
Photo 6 - Treated berries in the refrigerator ...................................................................... 15
Photo 7 - Taking the UV tunnel internal operating temperature ...................................... 17
Photo 8- 36.2 ��/��3 ...................................................................................................... 45
Photo 9 - 88.1 ��/��3 ..................................................................................................... 46
Photo 10 - 140 ��/��3 .................................................................................................... 47
Photo 11 - 191.9 ��/��3 ................................................................................................. 48
Photo 12 - 243.8 ��/��3 ................................................................................................. 49
Photo 13 - 295.7 ��/��3 ................................................................................................. 50
Photo 14 - 347.6 ��/��3 ................................................................................................. 51
Photo 15 - 405.5 ��/��3 ................................................................................................. 52
Photo 16 - 463.5 ��/��3 ................................................................................................. 53
Photo 17 -695.2 ��/��3 .................................................................................................. 54
Photo 18 - 926.9 ��/��3 ................................................................................................. 55
Photo 19 - Sorting the strawberries ................................................................................... 56
Photo 20 - Strawberries that was not acceptable .............................................................. 56
Photo 21 - More unacceptable strawberries ...................................................................... 56
Photo 22 - 160 acceptable strawberries ............................................................................ 57
xi
Photo 23 - Strawberries resting on the product placement table ...................................... 57
Photo 24 - Turning the strawberries.................................................................................. 57
Photo 25 - Placing ten strawberries on the product placement table for treatment .......... 58
Photo 26 - Exhaust fan in operation .................................................................................. 58
Photo 27 - Setting up the refrigerator to receive treated strawberries .............................. 58
Photo 28 - Placing treated strawberries into the refrigerator ............................................ 59
Photo 29 - Product placement table .................................................................................. 59
Photo 30 - Storing untreated strawberries ......................................................................... 59
Photo 31 - Unventilated plastic bag for preliminary run .................................................. 60
Photo 32 - Turning on the ultraviolet tunnel ..................................................................... 60
Photo 33 - Ultraviolet tunnel warming up ........................................................................ 60
Photo 34 - Ultraviolet tunnel off ....................................................................................... 61
Photo 35 - Digital laser thermometer ................................................................................ 61
Photo 36 - Lab notebook ................................................................................................... 61
Photo 37 - Stop watch ....................................................................................................... 62
Photo 38 - UV cream, face shield, glasses and gloves ...................................................... 62
Photo 39 - UV protective gear .......................................................................................... 62
Photo 40 - Well-Pict and Green Giant quart strawberry containers ................................. 63
1
CHAPTER 1
INTRODUCTION
Strawberry shelf life is shortened because of bacteria and fungi on the surface of
the berry. As organisms grow deterioration of appearance, texture, smell and flavor
occur. Bruising or skin lesions speed the growth of fungi and bacteria. The deterioration
impacts the grower, marketer and customer because it causes loses. This deterioration can
cause losses in yield, quality and nutrient value.
Yield loss accounts for physical loss both in the field as well as post harvest
processing. Yield loss is a valid concern for producers but is not the topic of this research.
Post harvest losses due to pathogens result in produce that can be unfit for wholesale or
retail as well as juice production. The reproduction of pathogens on and around the
production equipment only compounds the problem of post harvest loss by spreading or
inoculating non-infected fruit. Uncontrolled temperature of the fruit or storage room
temperature often compounds microbial losses.
Revenue loss occurs due to a reduction in the tonnage sold. Post harvest losses
due loss of water can impact marketability to the producer as well as affecting the range
of the economy of size that the producer ranked in. Damaged berries cannot be sold to
wholesalers or retailers because the quality is poor. Depending on the severity of the
damages from pathogens, the grower may or may not lose the entire crop.
Treatment cost to prevent or prohibit pathogenic growth throughout the harvested
produce is an added cost of doing business. Treatment of post-harvest strawberries varies
from grower to grower but one idea is common and that is to reduce the handling steps of
2
the berries. Excess handling of strawberries increases the risk of bruising or damage the
flesh of the berries. Typical treatments are rinsing the berries and reducing field heat as
soon as possible.
Quality or nutrient value loss happens when there is physical breakdown of the
cells within the strawberry resulting in juice loss as well as physical deterioration of the
flesh of the berry. This breakdown creates an ideal microbial growth environment.
Spoilage of the berries speeds with infiltration of oxygen into the flesh of the berry.
Maturation and senescence are natural deterioration processes however; pathogenic
activity that results in nutrient loss can be prevented.
Ultraviolet energy, UV, can reduce pathogenic population. Proper application
rates can extend shelf life. Ultraviolet energy has been used in the past by agriculture for
its insecticidal and germicidal properties. Another use has been by municipalities for the
process of purifying drinking water. It is thought that new UV tunnel designs might
improve the effectiveness of UV applications.
The overall objective of this study was to establish the impact of a new UV tunnel
design on the shelf life of strawberries. Specific goals were: One, identify common
pathogens that attack strawberries in storage via a review of literature. Two, establish
viable application rates. Three, establish a statistical difference between UV tunnel
application treatments and versus a control. Four, establish any statistical relationship
between application rates and shelf life.
3
CHAPTER 2
LITERATURE REVIEW
There are four types of diseases that affect the strawberries post harvest in this
study. These diseases are Botrytis Fruit Rot (Gray Mold), Phomopsis Soft Rot, Tan-
Brown Rot and Rhizopus Rot (Leak).
B. cinerea is the anamorph of Botryotinia fuckeliana (Maas, 1998). The anamorph
references the anamorphic asexual reproduction stage, which are often mold-like and
apply to the life cycle of fungi. These are listed in Appendix C, Figure 4.
The inoculation of the berries with Botrytis may or may not have been a result of
field practices. Processing, transportation and storage would be a more likely cause. A
visible symptom of Botrytis would be the generation of hyphae which resemble hair-like
structures. The berry color turns light brown with no sharp border with healthy tissue, and
then becomes covered by velvety grey growth (Iowa State University Extension, 2000).
Grey Mold is visible to the human eye when the population becomes large. Maas (1998)
indicates that this organism prefers temperatures between the ranges of fifteen to twenty-
five degrees Celsius.
Cultural control of Botrytis is described by Maas (1998):
“…Traditional controls for Botrytis in spray forms have been used for
many years. References that the chemical Captan© is primarily used in North
America. Harvest and post harvest measures are being developed, such as the
advent of biological control using antagonistic fungi to control Botrytis fruit
rot…”
4
Diseases are discussed by Maas (1998) as:
“…Phomopsis Soft Rot, Phomopsis obscurans, occurs in fruit during
maturation. Early stages are marked with skin lesions that are water-soaked and
flush with the surface, later the lesions may turn tan or brownish and may become
crusty towards the center…”
“…Tan-Brown rot is caused by Discohaninesia oenotherae, syn. Pezizella
oenotherae, sacc; its anamorph is Hainesia lythri. Tan-Brown rot is tanish or
brownish in color and often occurs irregularly in the field. On mature or ripening
fruit, this rot will form small roundish areas on fruit and the rot will extend deeper
into the flesh then the surface diameter. The affected part of the core of the fruit is
consumed and replaced by fungus mycelium and becomes dry and spongy. In
culture young hyphae of H. lythri are septate, branched and hyaline. The
mycelium is white at first and then changes to pinkish or brownish and becomes
zonate in older cultures. Cultural practices, such as mulching, plant debris
removal and weed control can curb the growth of Discohaninesia oenotherae…”
“… Rhizopus spp., chiefly R. stolonifer, R nigricans and occasionally R
sexualis cause Rhizopus rot of strawberry. Rhizopus spp. are cosmopolitan and
cause rots of various fruit and vegetable crops. Physiological specialization has
not been determined. Rhizopus Rot, also known as ‘Leak,’ is most commonly
found in the field but can occur post-harvest. Fruit infected with Rhizopus rot are
slightly discolored and gradually turn light brown. The flesh rapidly softens and
juices leak out as the cells collapse. Under humid conditions, the fruit is soon
5
covered with a dense, fluffy, white mycelium, which bears long, stiff
sporangiophores terminating in large, black sporangia...”
Strawberries are considered mature when at least, one-half to three-quarters berry
surface showing red or pink color (Mitcham, Crisosto, & Kader, Recommendations for
Maintaining Postharvest Quality, 2006). The optimum temperature for storing
strawberries is stated at, “Zero plus or minus one-half degree Celsius (thirty two degrees
Fahrenheit plus or minus one degree Fahrenheit)” (Rivera & Tong, 1993). Cooling should
begin within one hour of harvest (Talbot & Chau, 2002). Controlled atmosphere (CA) is
also an option for post-harvest storage of strawberries. A level of “ten to fifteen percent
carbon dioxide,” is desirable (Rivera & Tong, 1993).
The USGAO (2000) indicates:
“…Food irradiation is the process of exposing food, either prepackaged or
in bulk, to controlled levels of ionizing radiation. Ionizing radiation is a type of
energy similar to radio and television waves, microwaves, and infrared radiation.
However, the high energy produced by ionizing radiation allows it to penetrate
deeply into food, killing microorganisms without significantly raising the food’s
temperature…”
The tunnel that is utilized in this experiment, heat can be an issue due to the
enclosed environment that exists within the laboratory itself. This laboratory protocol was
designed solely for batch processes but alterations can be made to provide a continuous
operation. Strawberry production is typically seasonal since there are shelf life
limitations. According to Otagak (1967-1971) cost benefit analysis has shown that it is
feasible to irradiate strawberries.
6
Products that have been irradiated using ionizing irradiation are stamped with a
symbol depicting that it has been irradiated. This symbol can be found in Appendix A,
Figure 3 (USDA, 2007). The dose of the irradiation directly affects both the positve and
negative effects on the specified fruit. Strawberries are sensitive to over exposure and the
skin of the berry tends to break or liasons form due to over exposure.
Hunter (2003) states a number of alternative preservation techniques are:
“…Ozone can be used to disinfect foods as well as the water and
equipment used in processing foods. One benefit of using Ozone to purify
drinking water is that it can kill bacteria such as Escherichia coli and Salmonella
as well as parasites, viruses and fungi. Sanitizing agent, ozone is replacing
chlorine in many applications because although chlorine is effective, it can form
toxic trihalomethanes (THMs) and become an environmental contaminant…”
“..Carbon Dioxide is yet another non-thermal technique that uses
suspended gas to keep foods safe called dense phase carbon dioxide. This is used
primarily with fruit juices. The dense phase carbon dioxide, a liquid, is mixed
with fresh raw juice and pressurized. Then this mixture is held in a holding tank
and brought back down to atmospheric pressure which converts the liquid carbon
dioxide into a gaseous state. This preserves the taste and the nutrients of the juice,
and has been approved for the GRAS status…”
“…Lowering pH is another technique to preserve foods. Lowering pH is
accomplished by using acids. Some acids are: sorbic acid, soluble salts, potassium
sorbate, propionic acid and its soluble salts calcium and sodium propionate, lactic
acid and sodium or potassium lactate. Acetic acid is derived from lactic acid
7
bacterium along with ethanol, hydrogen peroxide, diacetyl, free fatty acids,
benzoate, antibiotics, and bacteriocins…”
“…A form of non-thermal treatment, high hydrostatic pressure can also
help maintain fresh-like qualities in food. This lowers pathogens that contaminate
the food. High hydrostatic pressure can be used in conjunction to modified
atmosphere control using carbon dioxide…”
“…Cellular matrix manipulation is a technology that is currently being
explored for treatment of seafood. The technique is stated to, use peroxygen, a
colorless, odorless and tasteless compound that breaks down basically into water
and vinegar…”
“…Natural antimicrobials are substances that are currently being assessed
to become alternatives to harsher physical and chemical food preservation
techniques. Some natural antimicrobial substances that are suggested by Hunter
are: Chitosan, a proteinaceous compound derived from freeze dried egg yolk, and
essential oils from plants such as oregano, rosemary, mints and cinnamon…”
“…Bacteriocins are antibacterial substances produced by one strain of
bacteria that can harm another strain of bacteria within the same family, and
bacteriocins from protein and protein-based compounds act as antimicrobials.
Other bacteriocins include: nisin, natamycin also known as pimaricin, lysozyme
and lactoferrin…”
The ultraviolet tunnel used in this experiment kills the bacteria, fungus and molds
on the surface of the berries but cannot destroy the microorganisms below the surface of
the skin. The reason for the limited effective depth is due to the limited exposure of
8
energy used in the tunnel. The greater the exposure to the fruit in front of the ultraviolet
lamps, the greater the chance of damage to the surface of the berries by way of skin
leasions. An ultraviolet disinfection system transfers electromagnetic energy from a
mercury arc lamp to an organism’s genetic material (DNA and RNA).
The EPA (1999) indicates when ultraviolet radiation penetrates the cell wall of an
organism, it destroys the cell’s ability to reproduce. Food borne pathogens, spoilage
microorganisms, insects, parasites and plant tissues are deactivated or killed, then this
provides promise to extending the shelf life of strawberries by reducing the likelyhood of
external contaminants in the deteriation process or senessance. When left uninhibiited,
microbial growth doubles every 20 minutes for every increase in temperatuer by 10
degrees Celcius.
Ultraviolet technologies have been used in the past to treat wastewater and Hunter
(2003) states, “fruit juices and drinking water. Combining ultraviolet light along with
ozone effectively disinfects.” The EPA (1999) indicates “disinfection is considered to be
the primary mechanism for the inactivation/destruction of pathogenic organisms to
prevent the spread of waterborne diseases to downstream users and the environment.”
The process to treat wastewater is similar to the process used to treat strawberries in this
study. Both use mercury arc lamps, a reactor and ballasts. Ultraviolet rays are part of the
light that comes from the sun. The ultraviolet spectrum is higher in frequency than
visiable light and lower than x-rays. Specifically, low-pressure lamps emit
monochromatic light at a wavelength of 253.7 nanometers, the wavelength targeted in
this study (Tchobanoglous, 1998). Medium-pressure lamps are stated to have, fifteen to
twenty times the germicidal ultraviolet intensity of low-pressure lamps as stated by (EPA,
9
1999). The optimum wavelength to effectively inactivate microorganisms is in the range
of two hundred and fifty nanometers to two hundred and seventy nanometers (EPA,
1999). The intensity of the radiation absorbed by the object reduces as the distance from
the lamp increases. Other uses for ultraviolet energy include pathogen reduction for juice,
pathogen reduction in potable water. Juice pathogen reduction requires “turbulent flow
through tubes with a minimum Reynolds number of 2200,” (United States Food and Drug
Administration, 2000). The use for juice pathogen reduction is for surface microorganism
control. Potable water requires “without ozone production; coefficient of absorption, 0.19
per cm or less; flow rate, 100 gal/h per watt of 2.537 A. radiation; water depth, 1 cm or
less; lamp operating temperature, 36 to 46 deg Celsius,” (United States Food and Drug
Administration, 2000). The intended use is the sterilization of water used in food
production.
Since lamp intensity decreases with use, lamp replacement is a key maintenance
consideration with ultraviolet disinfection. It is not uncommon for a new lamp to lose
twenty percent of its intensity within the first one hundred hours of operation, although
that level is maintained for the next several thousand hours according to Wagenett and
Lemley (1994).
Advantages of using ultraviolet energy for disinfection purposes and those are as
stated by the EPA (1999); ultraviolet disinfection is effective at inactivating most viruses,
spores and cysts. Ultraviolet disinfection is a physical process rather than a chemical
disinfectant, which eliminates the need to generate, handle, transport, or store
toxic/hazardous or corrosive chemicals. There is no residual effect that can be harmful to
humans or aquatic life. Ultraviolet disinfection is user-friendly for operators. Ultraviolet
10
disinfection has a shorter contact time when compared with other disinfectants
(approximately twenty seconds to thirty seconds with low-pressure lamps). Ultraviolet
disinfection equipment requires less space than other methods.
Disadvantages of using ultraviolet energy for disinfection purposes as stated by
the EPA (1999) are: Low dosage my not effectively inactivate some viruses, spores and
cysts. Organisms can sometimes repair and reverse the destructive effects of ultraviolet
through a repair mechanism, known as photo reactivation, or in the absence of light
known as dark repair.
11
CHAPTER 3
METHODS AND PROCEDURES
TUNNEL SPECIFICATIONS
The DDK Scientific Corporation UV tunnel used in this study was designed to
sterilize packages up to 23 inches wide and 12 inches tall by 36 inches long. The tunnel
housing is comprised of a polished aluminum mirror finish that maximizes the amount of
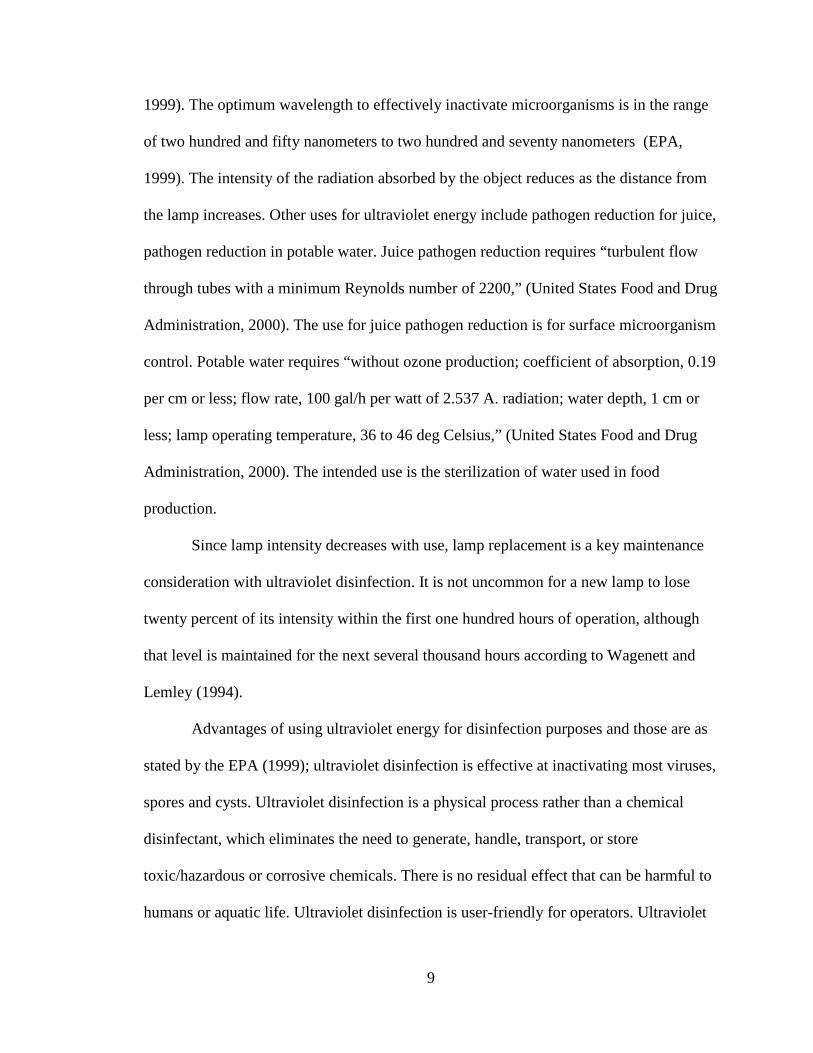
ultraviolet reflection. There are eight indicator lights that show the working status of the
light lamps on the control panel. If the UV light lamp malfunctions in the tunnel, the
corresponding indicator lights will illuminate. The ultraviolet tunnel electrical
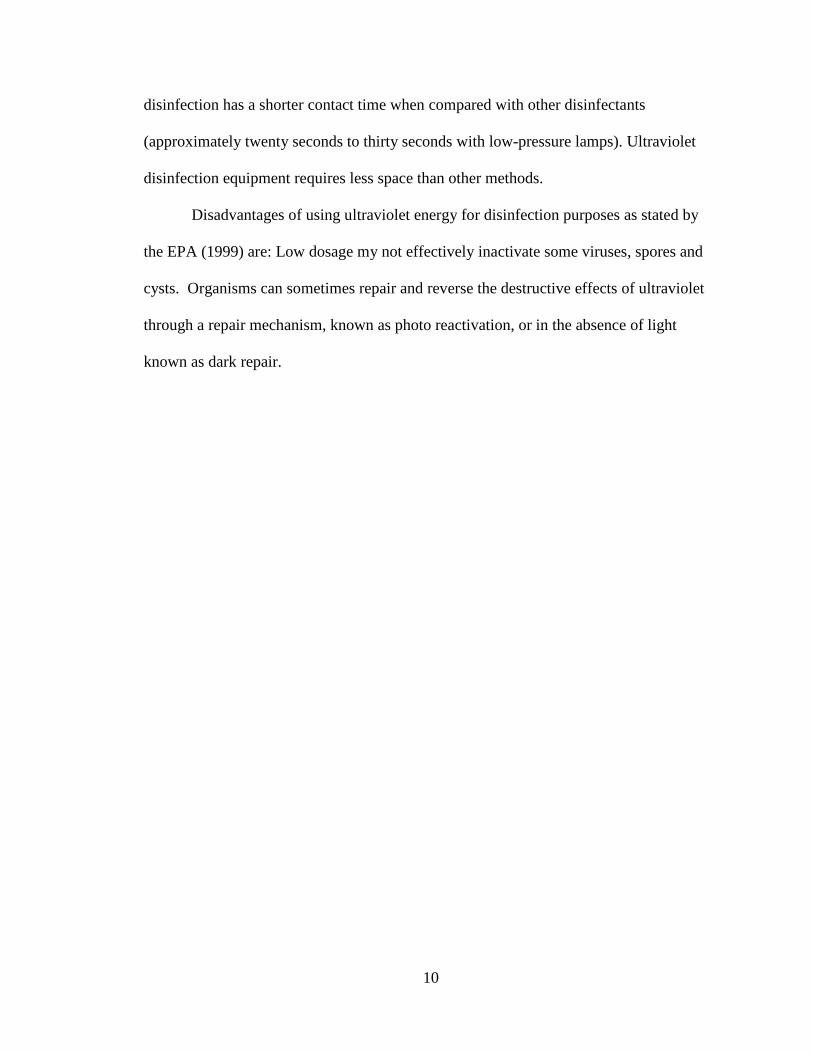
Photo 2 - Ten-inch secondary fan
Photo 1 - UV on/off switch
12
requirements are single phase, 60 Hz, 6 Amps at 220V (Duarte, 2005). Components of
this system are: mercury arc lamps, a reactor, ballasts, and control panel (Holloway,
2006). Ultraviolet sources for the tunnel can either be, as stated by Holloway, either
“low-pressure or medium-pressure mercury arc lamps.” Standard lengths, as stated, of the
low-pressure lamps are 0.75 and 1.5 meters with diameters of 1.5 to 2.0 cm. Also stated
is that the ideal lamp temperature is between 95 and 122 degrees Fahrenheit. Operation of
the ultraviolet tunnel is simple due to its design. There is a standard on/off switch located
on the control panel. This switch is shown in Photo 1. This on/off feature ensures that
when the unit is off, accidental ultraviolet light exposure is prevented.
ESTABLISHING A CALIBRATION CURVE
A calibration curve to correlate time in tunnel with total energy was established.
This calibration was established with a UV radiometer. Ultraviolet energy within the
tunnel was tested in a previous study with an EIT UV PowerMap instrument. This
instrument reads UVA, UVB, UVC and UVV plus the temperature the object gains while
exposed to the UV energy. Its specification was guaranteed within acceptable limits by
the Ultraviolet Plus Co by Dr. Raul Duarte.
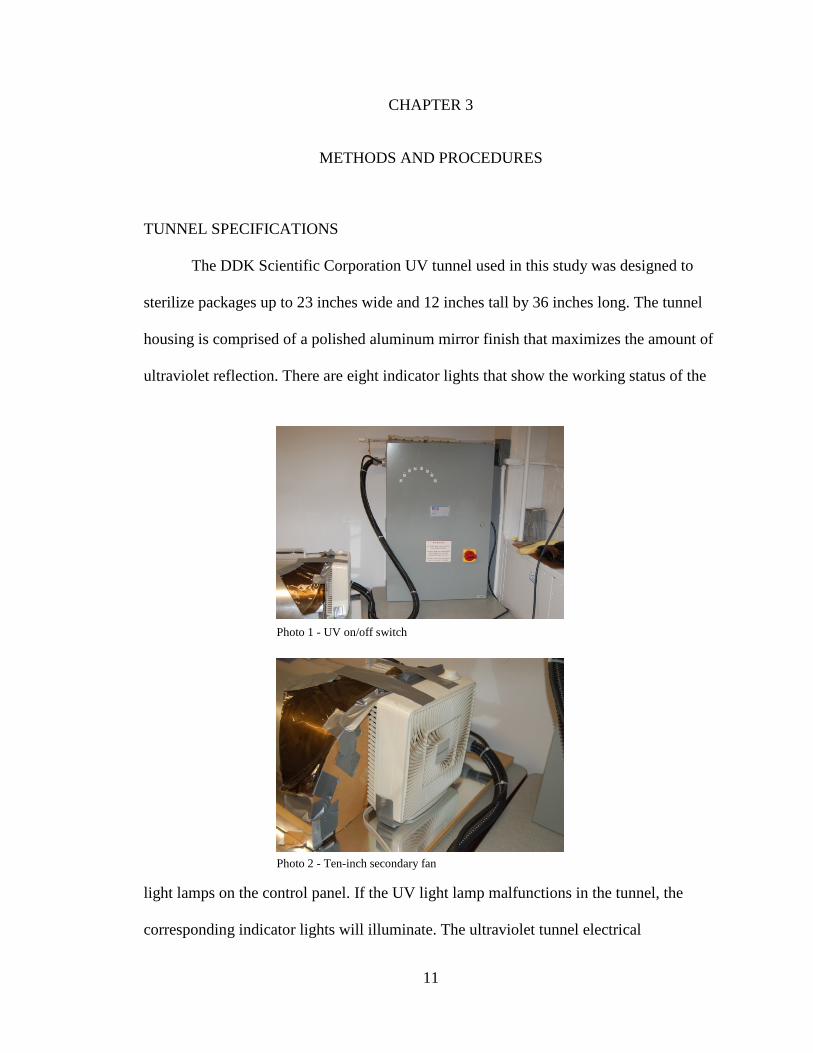
Photo 3 - Primary fan on top of the UV tunnel
13
REDUCING HEAT
Two fans were used to reduce the heat inside of the UV tunnel during operating
procedures, see Photo 2 and Photo 3. The fans increase airflow through the tunnel which
in turn allowed the strawberries to remain in the tunnel longer without overheating. A
larger secondary fan was placed directly on one end of the tunnel to pull a volume of air
through the tunnel. The smaller exhaust fan produced a horizontal wind speed inside the
tunnel of 3.2 M.P.H. (281.6ft/min). The secondary fan was a ten-inch Versatile Fan
which produced a wind speed inside the tunnel of 4.3 M.P.H. (378.4ft/min). The
combined wind speed was measured at 2.8 M.P.H (246.4ft/min) with both fans operating
simultaneously. Wind speed was measured with a Nielsen Kellerman, Kestrel 4000
aerometer. Lowering the temperature inside the ultraviolet tunnel to boost the ultraviolet
intensity was critical; this entitled the strawberries to receive more intense UV energy.
PRELIMINARY TEST DATA
A preliminary data test was conducted to determine treatment levels free of
heating damage. There were ten specific test groups and one control group. The control
group was not exposed to any ultraviolet light. The ten test groups were exposed for the
following times on both sides of the strawberry: 36.2��/���, 88. 1��/���, 140��/
Photo 4 - Digital scale
14
���, 191.9 ��/���, 243.8 ��/���, 295.7 ��/��� and 347.6 ��/���, 405.5 ��/���,
463.5 ��/���, 695.2 ��/��� and 926.9 ��/���.
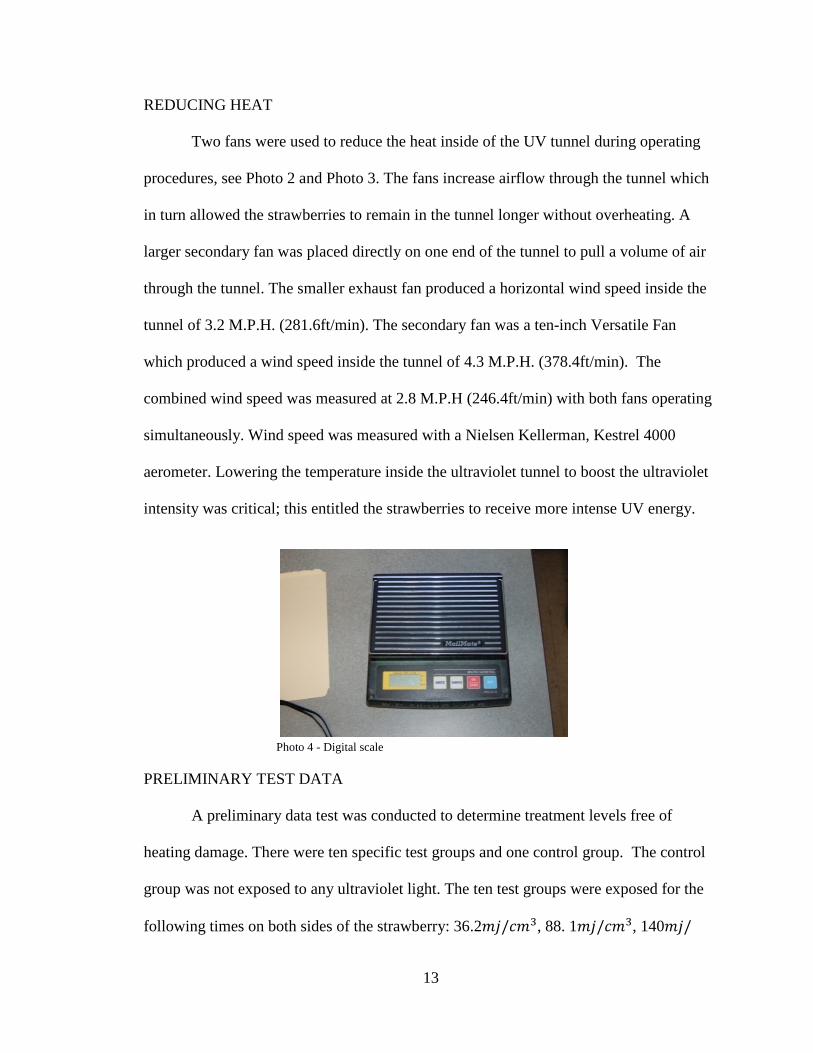
Berries of near identical weight and mass were used. Berries were weighed using
a digital scale set to grams. All berries ranged from 16 to 30 grams. See Photo 4.
A procedure was established for ensuring a sterile environment. The fresh
strawberries were tested at various intensity levels of ultraviolet energy two days after
purchase. The strawberries were obtained from a local grocery store and the damaged or
bruised strawberries were removed. Forty-eight pints were purchased for the experiment,
only seven pints were removed. There were two different brands offered at the store.
BERRY SELECTION
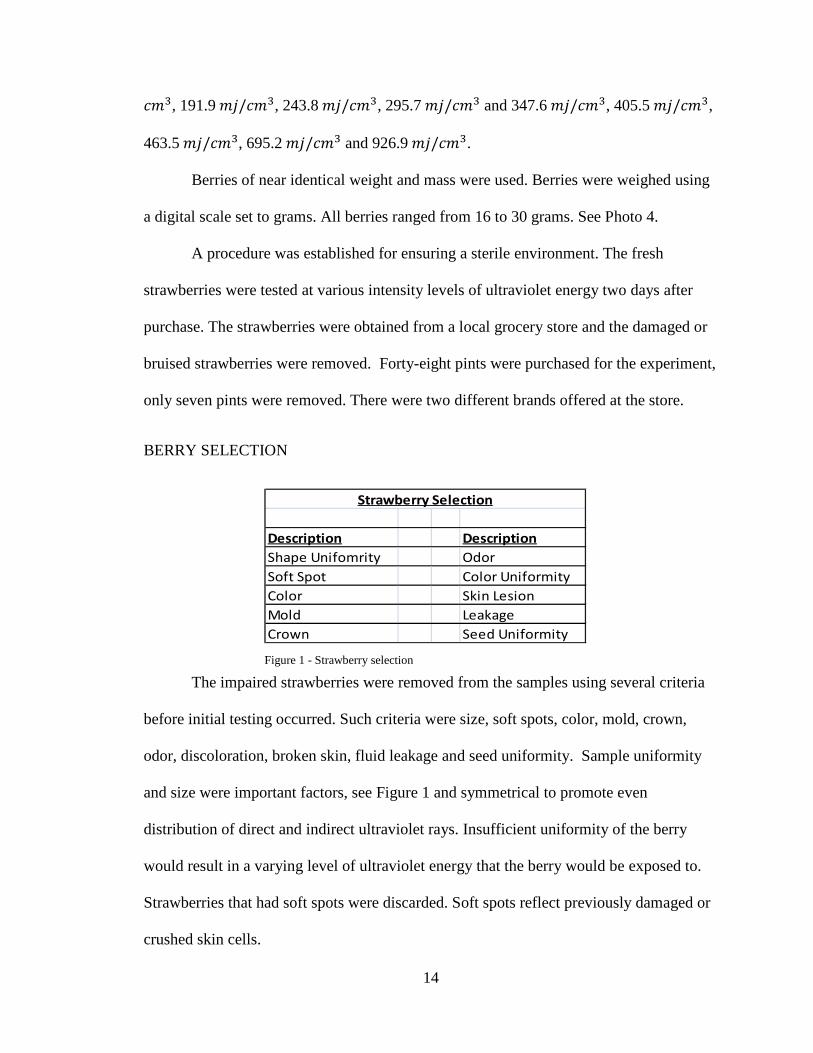
The impaired strawberries were removed from the samples using several criteria
before initial testing occurred. Such criteria were size, soft spots, color, mold, crown,
odor, discoloration, broken skin, fluid leakage and seed uniformity. Sample uniformity
and size were important factors, see Figure 1 and symmetrical to promote even
distribution of direct and indirect ultraviolet rays. Insufficient uniformity of the berry
would result in a varying level of ultraviolet energy that the berry would be exposed to.
Strawberries that had soft spots were discarded. Soft spots reflect previously damaged or
crushed skin cells.
Description Description
Shape Unifomrity Odor
Soft Spot Color Uniformity
Color Skin Lesion
Mold Leakage
Crown Seed Uniformity
Strawberry Selection
Figure 1 - Strawberry selection
15
Mold was also a variable in the initial screening. It was found that in a few of the
pints, one or more berries already had visible Grey Mold contamination. These berries
were removed from the study.
The Crown or cap wholeness of the berry was an important consideration due to
consumer preference. Each berry retained had a whole, healthy cap.
Odor was tested. Odor can also indicate signs of deterioration of the berry due to
the physical break down of the cells. Odor is also a deterrent for producers of fruit juice.
Berries were selected that had no distinct “off odors”.
Color uniformity was considered. Lack of color uniformity can be an indicator of
improper formation of the berry on the vine. Color could be an indication of a
Photo 5 - Ventilated plastic bags
Photo 6 - Treated berries in the refrigerator
16
physiological imperfection. The color of the berry indicates the level of maturation. A
chart was established for use in evaluation.
Broken Skin was an important factor; breaks can provide an access point for
pathogens that can harm the berry. Broken skin is also associated with skin lesions that
occur due to over exposure of ultraviolet light. Fluid Leakage is a direct variable of
broken skin. If the cells that make up the skin and the flesh of the berry are broken then
the fluid or juice will leak out. This creates an ideal environment for pathogens to breed.
Seed uniformity was a physiologically important factor. Seed uniformity is a way
to check to see if the berry filled out uniformly and also to see how rough the berry has
been handled. If the seeds are missing then that is a good indication of stress.
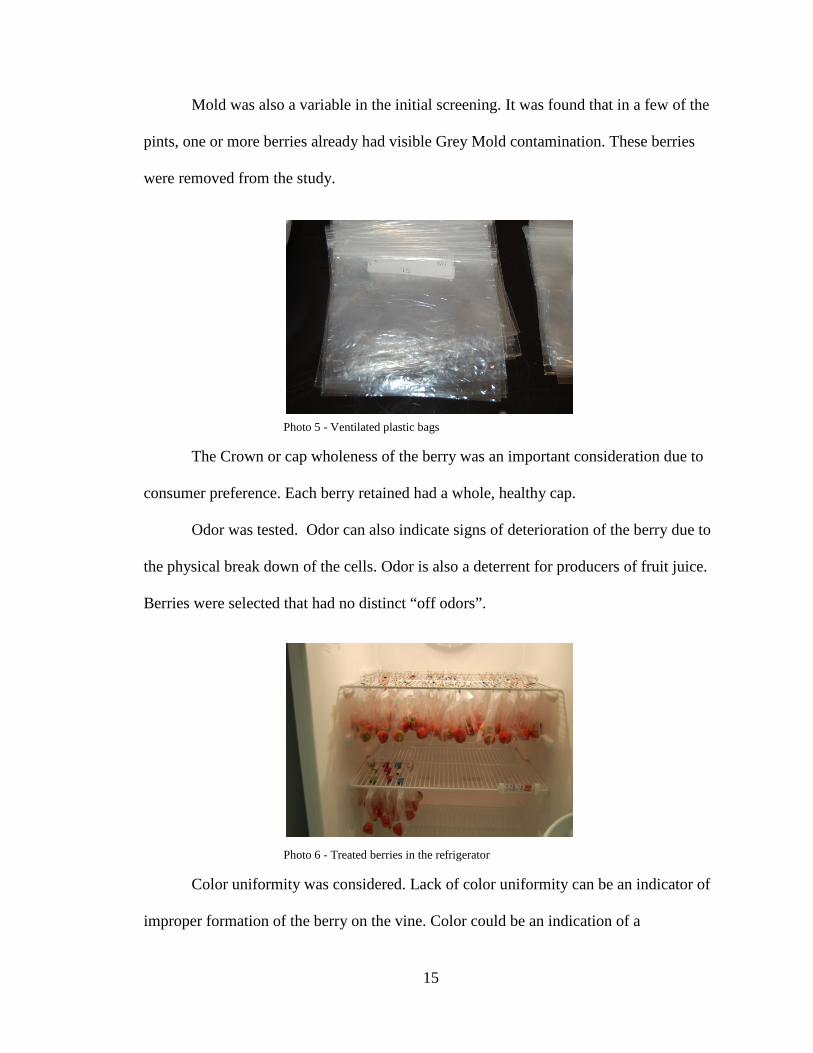
Once the strawberries were tested they were placed one-by-one in Ziploc bags and
stored in the refrigerator. These bags were not vented. Each bag was hung individually on
a rack in the refrigerator. The preliminary data run established that the working UV levels
for data collection would be 36.2��/���, 88. 1��/���, 140��/���, 191.9 ��/���,
243.8 ��/���, 295.7 ��/��� and 347.6 ��/���.
DATA COLLECTION
Berries were bought for the second data run, which was intended to be the full
scale data collection test, that were placed in a sterile refrigerator for overnight storage.
Berries were sorted based the Strawberry Selection Chart established in Figure 1.
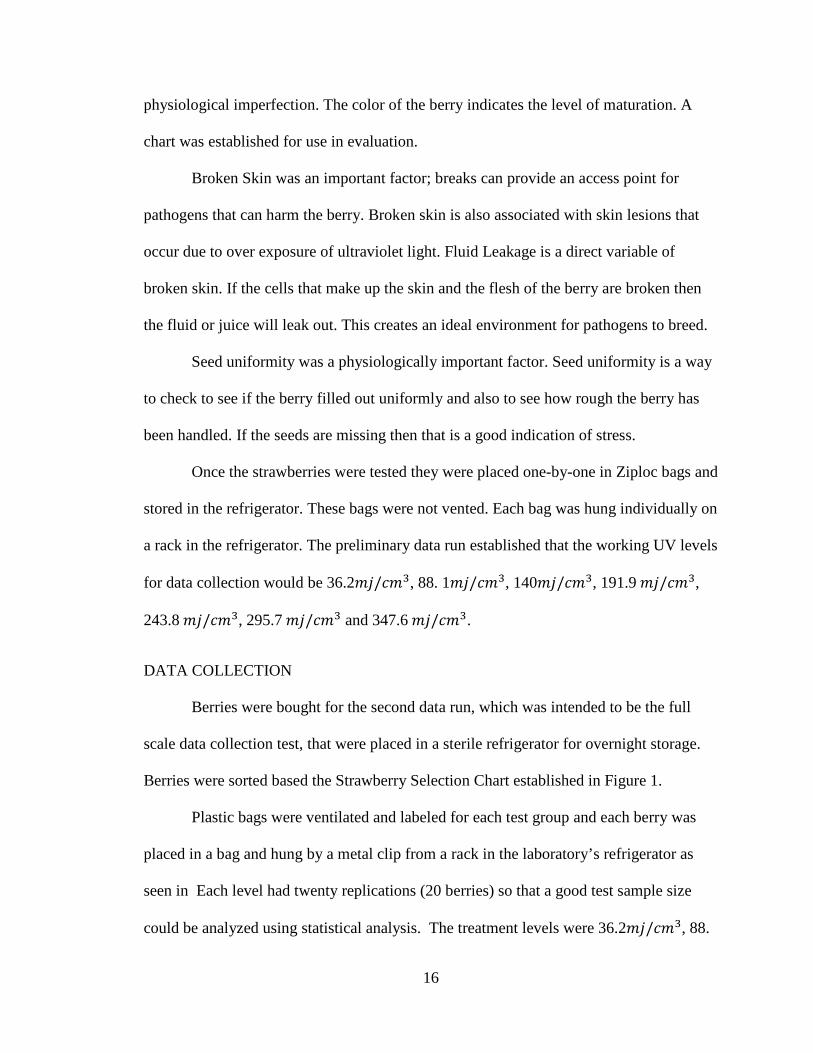
Plastic bags were ventilated and labeled for each test group and each berry was
placed in a bag and hung by a metal clip from a rack in the laboratory’s refrigerator as
seen in Each level had twenty replications (20 berries) so that a good test sample size
could be analyzed using statistical analysis. The treatment levels were 36.2��/���, 88.
17
1��/���, 140��/���, 191.9 ��/���, 243.8 ��/���, 295.7 ��/��� and 347.6 ��/
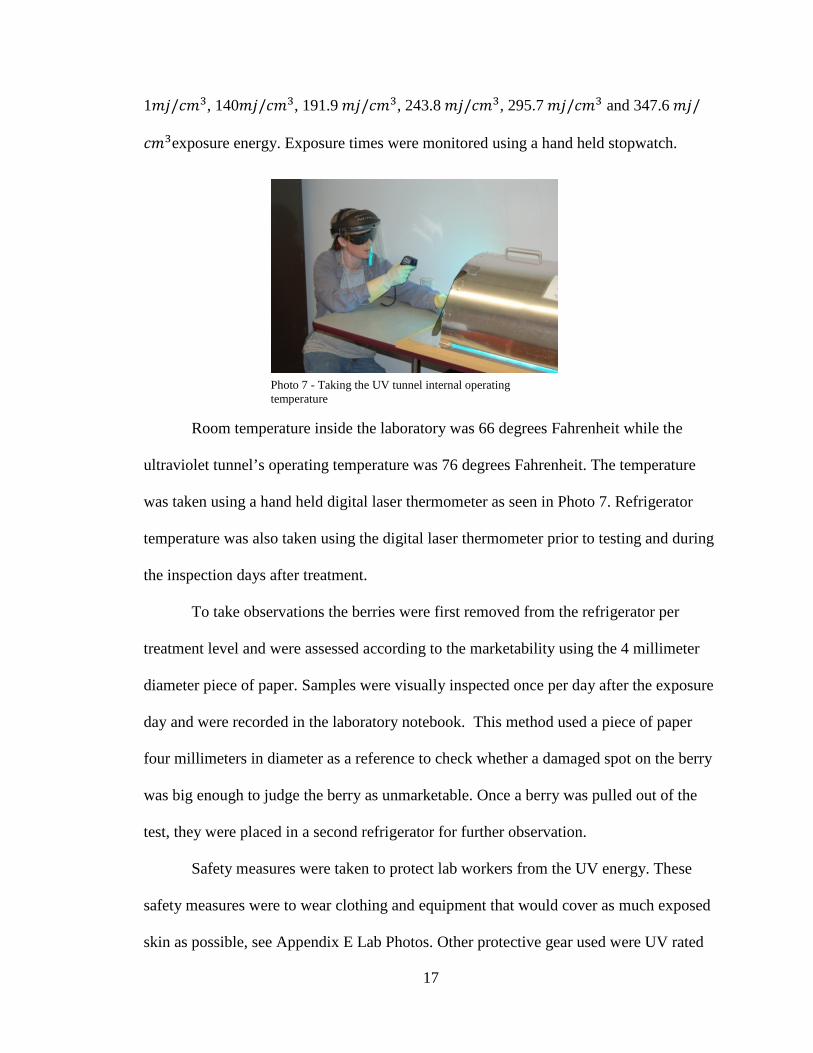
���exposure energy. Exposure times were monitored using a hand held stopwatch.
Room temperature inside the laboratory was 66 degrees Fahrenheit while the
ultraviolet tunnel’s operating temperature was 76 degrees Fahrenheit. The temperature
was taken using a hand held digital laser thermometer as seen in Photo 7. Refrigerator
temperature was also taken using the digital laser thermometer prior to testing and during
the inspection days after treatment.
To take observations the berries were first removed from the refrigerator per
treatment level and were assessed according to the marketability using the 4 millimeter
diameter piece of paper. Samples were visually inspected once per day after the exposure
day and were recorded in the laboratory notebook. This method used a piece of paper
four millimeters in diameter as a reference to check whether a damaged spot on the berry
was big enough to judge the berry as unmarketable. Once a berry was pulled out of the
test, they were placed in a second refrigerator for further observation.
Safety measures were taken to protect lab workers from the UV energy. These
safety measures were to wear clothing and equipment that would cover as much exposed
skin as possible, see Appendix E Lab Photos. Other protective gear used were UV rated
Photo 7 - Taking the UV tunnel internal operating temperature
18
goggles, a UV rated face shield and UV protective cream. The UV protective cream was
applied to all exposed skin. Blue latex gloves and UV rated gloves were also used. The
blue latex gloves were sterile so that handling the berries prior to testing wouldn’t cross
contaminate the samples. The UV gloves, yellow gloves, would be sterilized between
samples by exposing them directly to the UV light being emitted by the end of the tunnel.
19
CHAPTER 4
RESULTS
Identify common pathogens that attack strawberries in storage. A review of
literature was conducted to identify common diseases. Information was attained from Dr.
Alan Walters and literature review. Major observed pathogens are: Grey Mold, Botrytis
cinerea; Dry Crown Rot Botryotinia fuckeliana; Phomopis Leaf Blight, Phomopsis
obscurans and Dendrophoma obscurans; Rhizopus Rot (leak), Rhizopus stolonifer; and
Tan-brown rot, Discohainesia oenotherae. A complete list of pathogens can be found in
Appendix C.
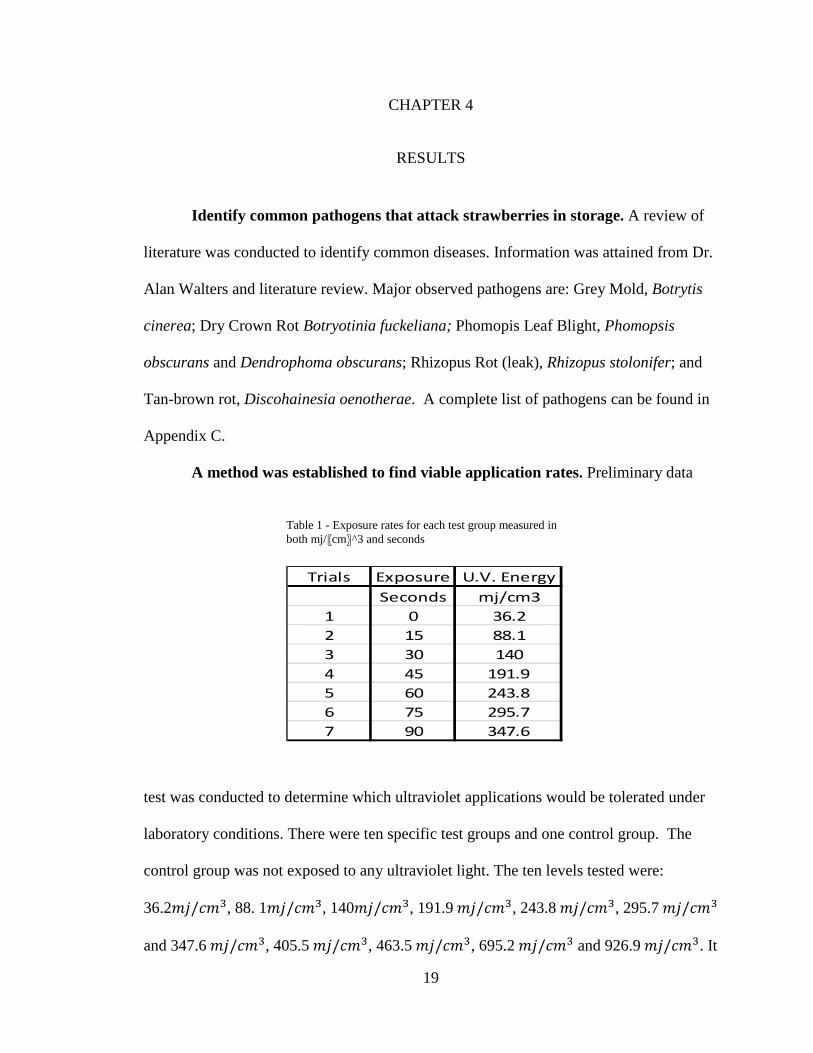
A method was established to find viable application rates. Preliminary data
test was conducted to determine which ultraviolet applications would be tolerated under
laboratory conditions. There were ten specific test groups and one control group. The
control group was not exposed to any ultraviolet light. The ten levels tested were:
36.2��/���, 88. 1��/���, 140��/���, 191.9 ��/���, 243.8 ��/���, 295.7 ��/���
and 347.6 ��/���, 405.5 ��/���, 463.5 ��/���, 695.2 ��/��� and 926.9 ��/���. It
Trials Exposure U.V. Energy
Seconds mj/cm3
1 0 36.2
2 15 88.1
3 30 140
4 45 191.9
5 60 243.8
6 75 295.7
7 90 347.6
Table 1 - Exposure rates for each test group measured in both mj/〖cm〗^3 and seconds
20
was found that the range of UV tolerance (lack of cell damage) was from88.1��/��� to
347.6 ��/��� . A series of photos were taken of all the berries after forty-nine days from
the preliminary data run. The photos support successful treatment in levels 140 ��/���,
191.9 ��/��� and 295.7 ��/���.
Treatment levels 140 ��/���, 191.9 ��/��� and 295.7 ��/��� had little to no
deterioration after forty-nine days post treatment. These berries were as firm and supple
as the day they were treated with little to no cell lesions and water loss. The rest of the
berries were covered with different molds such as Grey Mold. These berries also had cell
lesions and water loss, cell deterioration with noticeable flaccid skin tone and berry
discoloration. In testing the control versus treated samples all the berries were selected
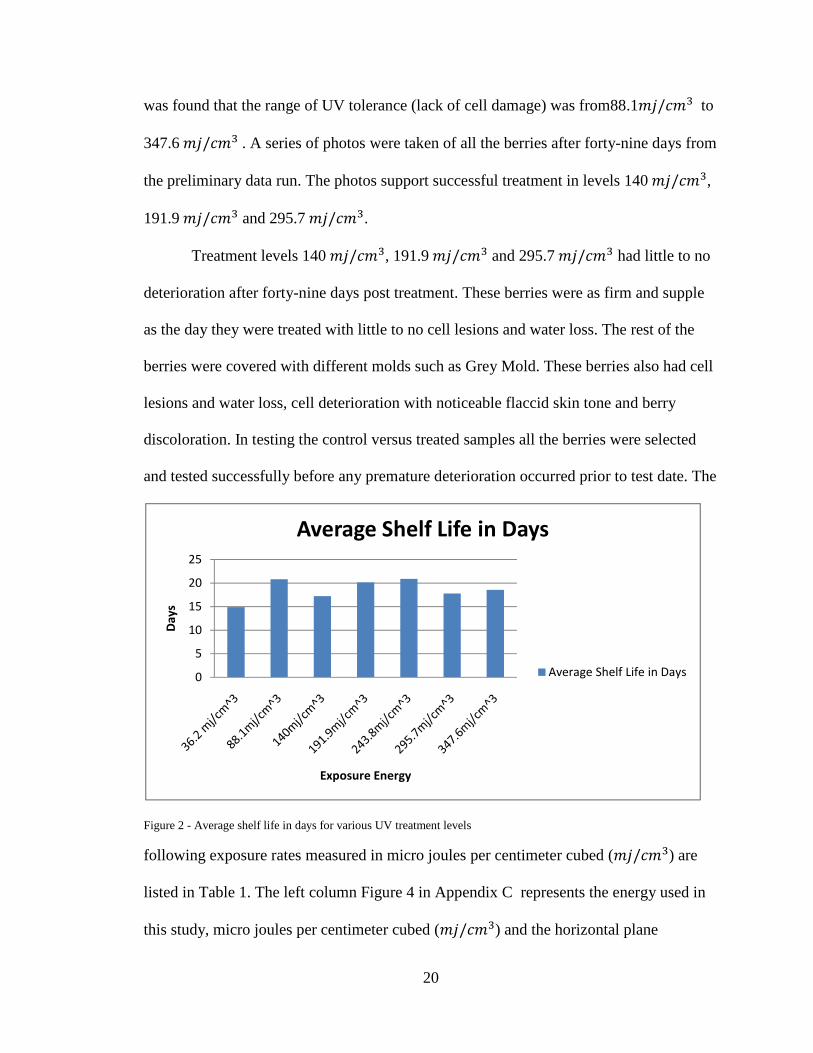
and tested successfully before any premature deterioration occurred prior to test date. The
Figure 2 - Average shelf life in days for various UV treatment levels
following exposure rates measured in micro joules per centimeter cubed (��/���) are
listed in Table 1. The left column Figure 4 in Appendix C represents the energy used in
this study, micro joules per centimeter cubed (��/���) and the horizontal plane
0
5
10
15
20
25
Da
ys
Exposure Energy
Average Shelf Life in Days
Average Shelf Life in Days
21
represents the time exposed in seconds. The red line in Figure 4 in Appendix C represents
the energy has two sets of numbers under each point, these numbers are comma delimited
in this fashion; (time in seconds, exposure rate). The blue line in Figure 4 in Appendix C
states the duration of exposure. As shown in Figure 2, all treatments above the control are
showing greater average shelf life extension days. There were three treatment levels
resulting in 20 days shelf life.
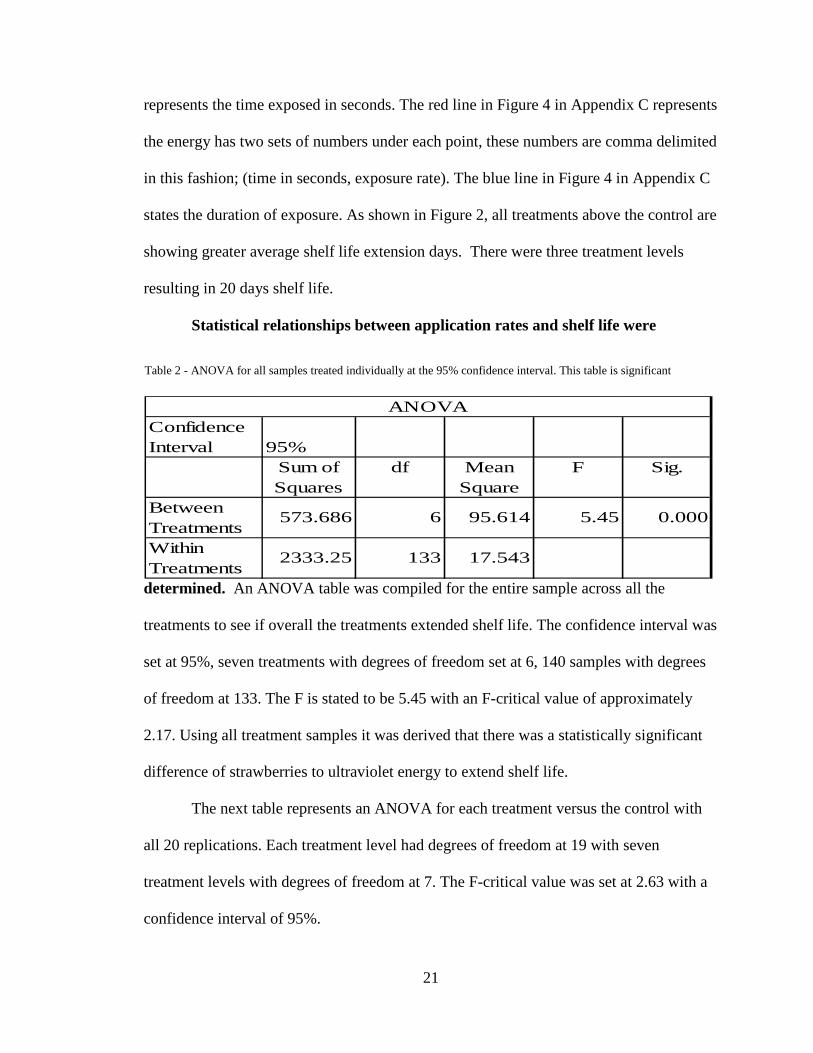
Statistical relationships between application rates and shelf life were
determined. An ANOVA table was compiled for the entire sample across all the
treatments to see if overall the treatments extended shelf life. The confidence interval was
set at 95%, seven treatments with degrees of freedom set at 6, 140 samples with degrees
of freedom at 133. The F is stated to be 5.45 with an F-critical value of approximately
2.17. Using all treatment samples it was derived that there was a statistically significant
difference of strawberries to ultraviolet energy to extend shelf life.
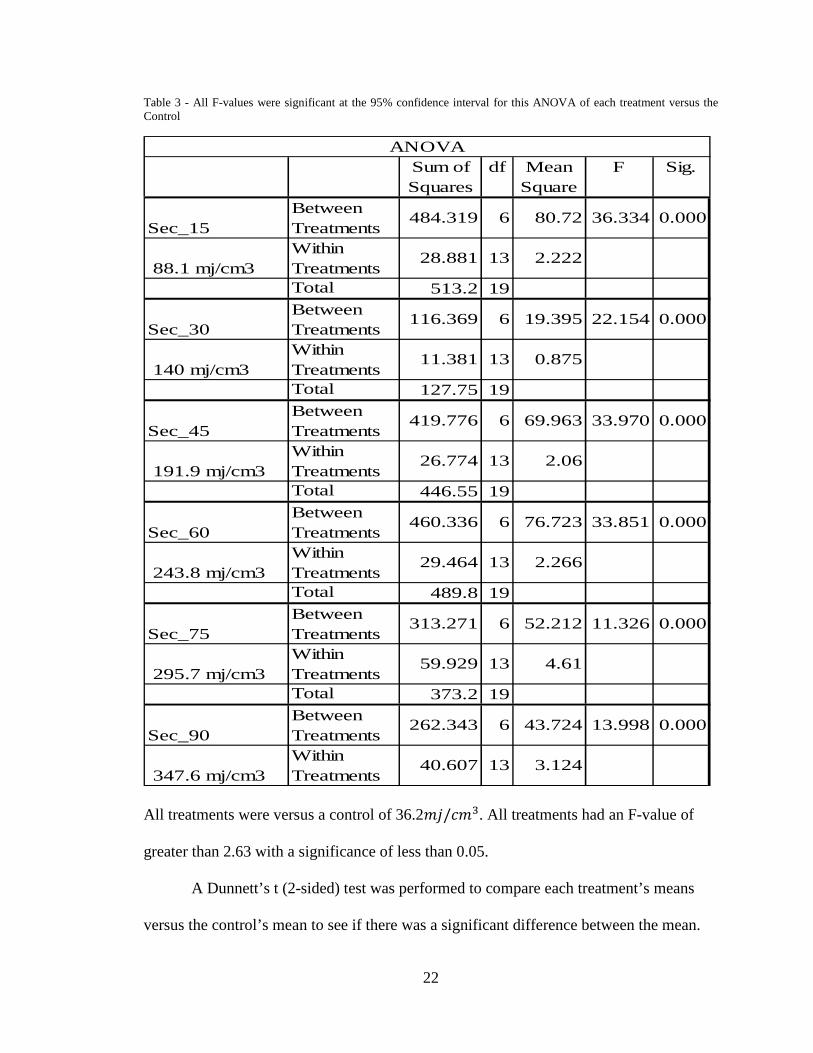
The next table represents an ANOVA for each treatment versus the control with
all 20 replications. Each treatment level had degrees of freedom at 19 with seven
treatment levels with degrees of freedom at 7. The F-critical value was set at 2.63 with a
confidence interval of 95%.
Confidence Interval 95%
Sum of Squares
df Mean Square
F Sig.
Between Treatments
573.686 6 95.614 5.45 0.000
Within Treatments
2333.25 133 17.543
ANOVA
Table 2 - ANOVA for all samples treated individually at the 95% confidence interval. This table is significant
22
Table 3 - All F-values were significant at the 95% confidence interval for this ANOVA of each treatment versus the Control
Sum of Squares
df Mean Square
F Sig.
Sec_15Between Treatments
484.319 6 80.72 36.334 0.000
88.1 mj/cm3 Within Treatments
28.881 13 2.222
Total 513.2 19
Sec_30Between Treatments
116.369 6 19.395 22.154 0.000
140 mj/cm3 Within Treatments
11.381 13 0.875
Total 127.75 19
Sec_45Between Treatments
419.776 6 69.963 33.970 0.000
191.9 mj/cm3 Within Treatments
26.774 13 2.06
Total 446.55 19
Sec_60Between Treatments
460.336 6 76.723 33.851 0.000
243.8 mj/cm3 Within Treatments
29.464 13 2.266
Total 489.8 19
Sec_75Between Treatments
313.271 6 52.212 11.326 0.000
295.7 mj/cm3 Within Treatments
59.929 13 4.61
Total 373.2 19
Sec_90Between Treatments
262.343 6 43.724 13.998 0.000
347.6 mj/cm3 Within Treatments
40.607 13 3.124
ANOVA
All treatments were versus a control of 36.2��/���. All treatments had an F-value of
greater than 2.63 with a significance of less than 0.05.
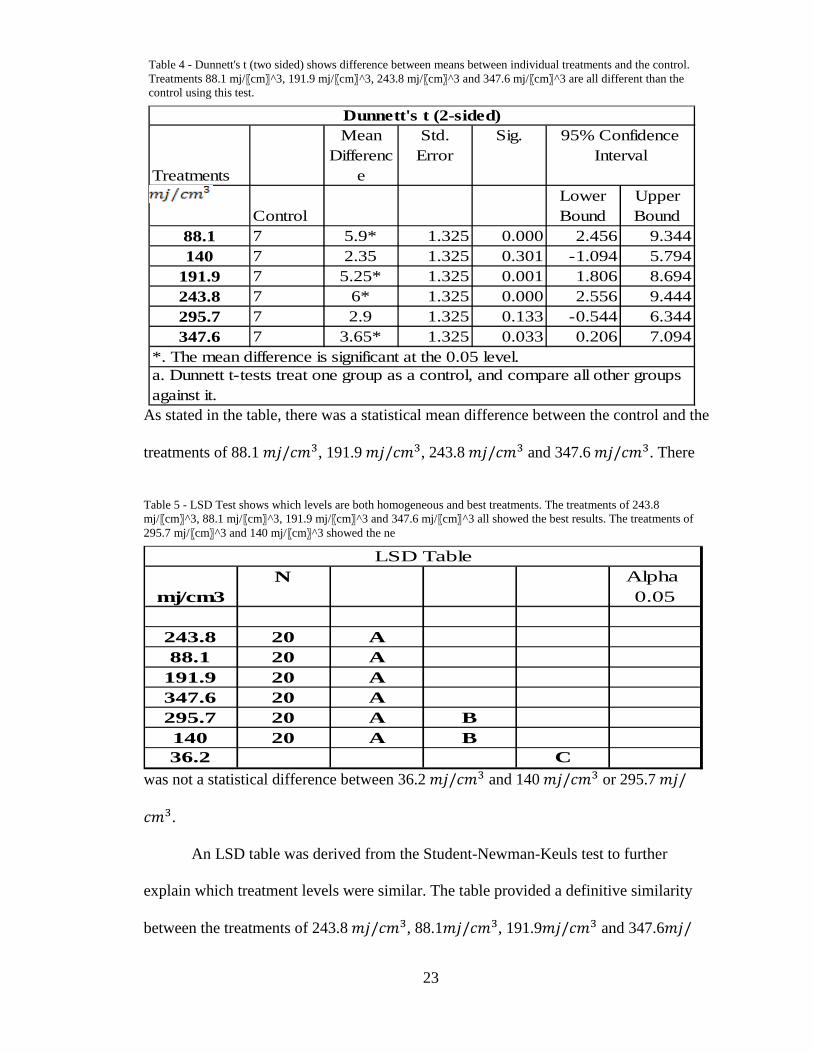
A Dunnett’s t (2-sided) test was performed to compare each treatment’s means
versus the control’s mean to see if there was a significant difference between the mean.
23
As stated in the table, there was a statistical mean difference between the control and the
treatments of 88.1 ��/���, 191.9 ��/���, 243.8 ��/��� and 347.6 ��/���. There
was not a statistical difference between 36.2 ��/��� and 140 ��/��� or 295.7 ��/
���.
An LSD table was derived from the Student-Newman-Keuls test to further
explain which treatment levels were similar. The table provided a definitive similarity
between the treatments of 243.8 ��/���, 88.1��/���, 191.9��/��� and 347.6��/
Treatments
Mean Differenc
e
Std. Error
Sig.
ControlLower Bound
Upper Bound
88.1 7 5.9* 1.325 0.000 2.456 9.344140 7 2.35 1.325 0.301 -1.094 5.794
191.9 7 5.25* 1.325 0.001 1.806 8.694243.8 7 6* 1.325 0.000 2.556 9.444295.7 7 2.9 1.325 0.133 -0.544 6.344347.6 7 3.65* 1.325 0.033 0.206 7.094
Dunnett's t (2-sided)95% Confidence
Interval
*. The mean difference is significant at the 0.05 level.a. Dunnett t-tests treat one group as a control, and compare all other groups against it.
mj/cm3 N Alpha
0.05
243.8 20 A 88.1 20 A 191.9 20 A 347.6 20 A 295.7 20 A B 140 20 A B 36.2 C
LSD Table
Table 4 - Dunnett's t (two sided) shows difference between means between individual treatments and the control. Treatments 88.1 mj/〖cm〗^3, 191.9 mj/〖cm〗^3, 243.8 mj/〖cm〗^3 and 347.6 mj/〖cm〗^3 are all different than the control using this test.
Table 5 - LSD Test shows which levels are both homogeneous and best treatments. The treatments of 243.8 mj/〖cm〗^3, 88.1 mj/〖cm〗^3, 191.9 mj/〖cm〗^3 and 347.6 mj/〖cm〗^3 all showed the best results. The treatments of 295.7 mj/〖cm〗^3 and 140 mj/〖cm〗^3 showed the ne
24
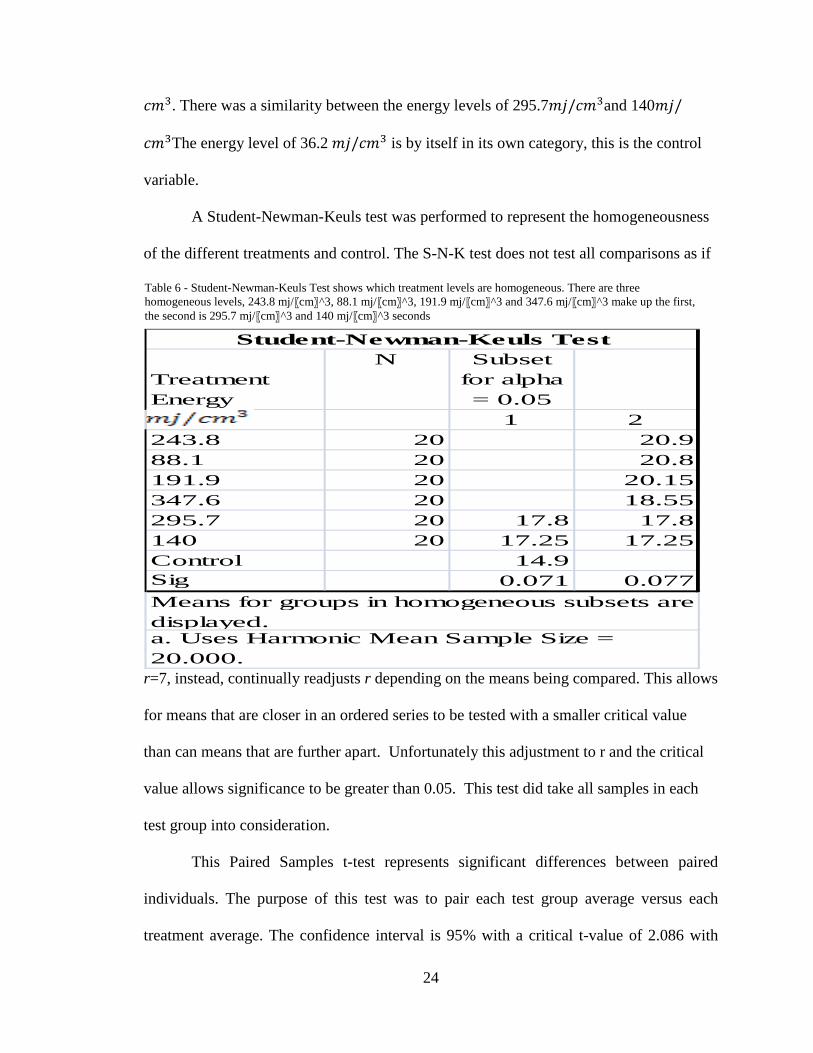
���. There was a similarity between the energy levels of 295.7��/���and 140��/
���The energy level of 36.2 ��/��� is by itself in its own category, this is the control
variable.
A Student-Newman-Keuls test was performed to represent the homogeneousness
of the different treatments and control. The S-N-K test does not test all comparisons as if
r=7, instead, continually readjusts r depending on the means being compared. This allows
for means that are closer in an ordered series to be tested with a smaller critical value
than can means that are further apart. Unfortunately this adjustment to r and the critical
value allows significance to be greater than 0.05. This test did take all samples in each
test group into consideration.
This Paired Samples t-test represents significant differences between paired
individuals. The purpose of this test was to pair each test group average versus each
treatment average. The confidence interval is 95% with a critical t-value of 2.086 with
Treatment Energy
N Subset for alpha = 0.05
1 2243.8 20 20.988.1 20 20.8191.9 20 20.15347.6 20 18.55295.7 20 17.8 17.8140 20 17.25 17.25Control 14.9Sig 0.071 0.077
Student-Newman-Keuls Test
Means for groups in homogeneous subsets are displayed.a. Uses Harmonic Mean Sample Size = 20.000.
Table 6 - Student-Newman-Keuls Test shows which treatment levels are homogeneous. There are three homogeneous levels, 243.8 mj/〖cm〗^3, 88.1 mj/〖cm〗^3, 191.9 mj/〖cm〗^3 and 347.6 mj/〖cm〗^3 make up the first, the second is 295.7 mj/〖cm〗^3 and 140 mj/〖cm〗^3 seconds
25
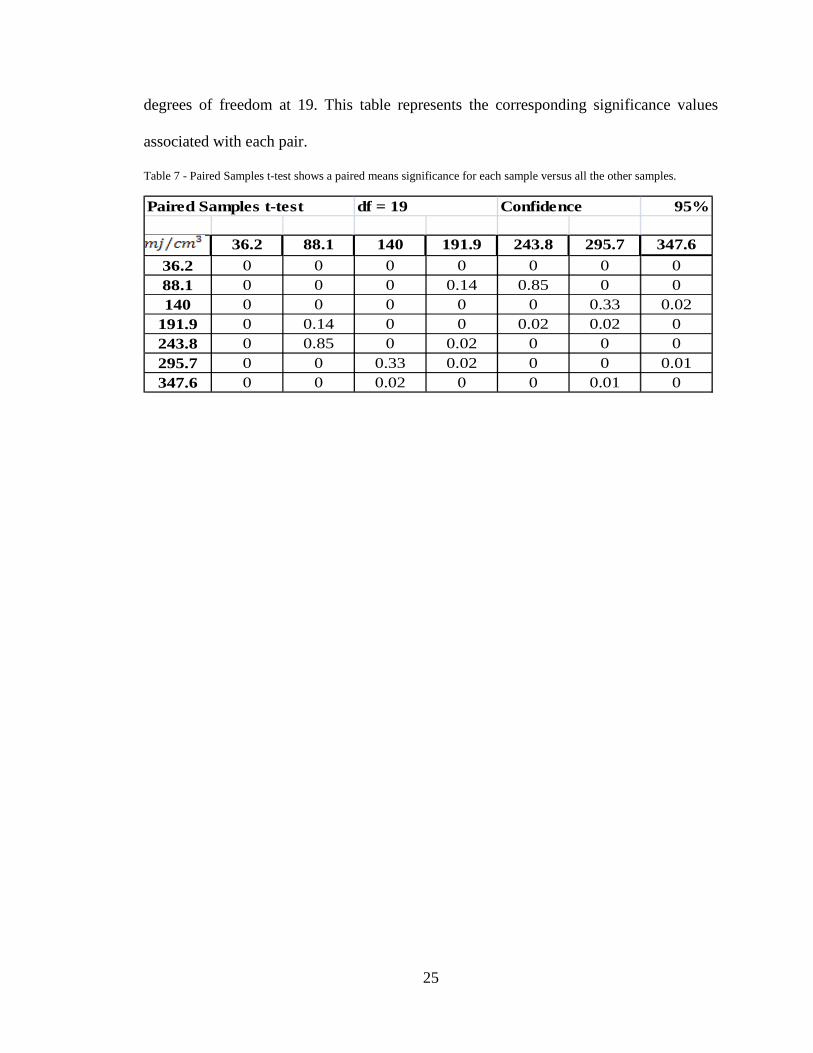
degrees of freedom at 19. This table represents the corresponding significance values
associated with each pair.
Table 7 - Paired Samples t-test shows a paired means significance for each sample versus all the other samples.
95%
36.2 88.1 140 191.9 243.8 295.7 347.636.2 0 0 0 0 0 0 088.1 0 0 0 0.14 0.85 0 0140 0 0 0 0 0 0.33 0.02
191.9 0 0.14 0 0 0.02 0.02 0243.8 0 0.85 0 0.02 0 0 0295.7 0 0 0.33 0.02 0 0 0.01347.6 0 0 0.02 0 0 0.01 0
Paired Samples t-test df = 19 Confidence
26
CHAPTER 5
CONCLUSION
The following conclusions were based on this study:
1. Established the impact of a new UV tunnel design on the shelf life of
strawberries. There were identifiable differences between the exposed treatment
rates versus the control treatment.
2. Identified common pathogens that attack strawberries in storage via a review in
literature . Major observed pathogens are: Grey Mold, Botrytis cinerea; Dry Crown
Rot Botryotinia fuckeliana; Phomopis Leaf Blight, Phomopsis obscurans and
Dendrophoma obscurans; Rhizopus Rot (leak), Rhizopus stolonifer; and Tan-brown
rot, Discohainesia oenotherae.
3. Established viable application rates. According to treatment levels 88.1 ��/���,
140 ��/���, 191.9 ��/���, 243.8 ��/���, 295.7 ��/��� and 347.6 ��/��� all
showed an increased number of shelf life days over the Control (36.2 ��/���� test
group.
4. Established a statistical difference between UV tunnel application treatments
and versus a control. Analysis for significance for the complete group yielded a
correlation between different test groups. As shown in the table, there are statistically
significant correlations between pairs 140 ��/��� – 347.6 ��/���, 191.9 ��/���
– 243.8 ��/��� and 295.7 ��/��� to 347.6 ��/��� at the 95% confidence interval
that suggests these pairs are not correlated. Alternatively, pairs that have either zero
value correlation or correlation greater than 0.05 were not significant. This shows that
27
there was a statistical difference between strawberries that were treated with U.V.
energy versus strawberries that were not tested with U.V. energy.
5. Established statistical relationships between application rates and shelf life.
There was a significant difference between ultraviolet energy and the entire sample
base. There was a significant difference between all treatment means and the control
mean. Treatments 88.1 ��/���, 191.9 ��/���, 243.8 ��/��� and 347.6 ��/���
were all significantly different when compared to the Control (36.2 ��/����.
Treatments 243.8 ��/���, 88.1 ��/���, 191.9 ��/��� and 347.6 ��/��� were all
homogeneous. Treatments 295.7 ��/��� and 140 ��/��� are also similar. Control
(36.2 ��/���� is by itself. A comparative correlation between all treatments and that
only the treatment pairs of: 88.1 ��/��� and 191.9 ��/���, 88.1 ��/��� and
243.8 ��/��� and 140 ��/��� and 295.7 ��/��� are statistically different from
the control. All the other treatment pairs are different.
An overall conclusion is that using ultraviolet energy to treat strawberries has
proved statistical difference in shelf life days then no treatment. A treatment level of 15
seconds or 88.1��/��� would be sufficient to treat strawberries to prolong shelf life in
this study.
28
CHAPTER 6
CONTINUING RESEARCH Further research can expand the possibilities of using UV energy to expand the
shelf life of fruits. This research focuses on strawberries and the previous research
conducted by Mr. Willie Holloway was focused on common table grapes. Fruits that
could have their shelf life expanded could include oranges, grapefruit, apples,
blueberries, gooseberries, cranberries, plums, bananas and apricots.
29
BIBLIOGRAPHY
Answers.com. (2008). Strawberry. Retrieved September 8, 2008, from Answers.com: http://www.answers.com/topic/strawberry Carpenter, C. E. (2008). [Graduate Student]. Carbondale: School of Agriculture at Southern Illinois University. Center for Food Safety and Applied Nutrition. (2000, November 30). FDA Approves the Use of Ultraviolet Radiation for Juice. Retrieved April 17, 2009, from Food Safety Initiative: http://www.cfsan.fda.gov/~dms/fsiupd22.html Duarte, R. (2005). CEO DDK Scientific Corp, Belleville, Illinois 62223-0952. EPA. (1999, September). Wastewater Technology Fact Sheet Ultraviolet Disinfection. Gubler, W. D., & Converse, R. (1993, April 19). Common Names of Plant Diseases. Retrieved June 23, 2008, from The American Phytopathological Society: http://www.apsnet.org/online/common/names/straberry.asp Holloway, W. D. (2006). Ultraviolet Tunnel Treatment as Applied to Table Grapes. Master's Thesis, Carbondale. Hunter, B. T. (2003, July 1). Food Safety: Alternatives to Irradiation: Bypassing a Controversial Technique. Consumers' Research Magazine . Iowa State University Extension. (2000, March). Production Guide for Commercial Strawberries. Iowa, United States of America: Iowa State University. Maas, J. L. (1998). Compendium of Strawberry Diseases. St. Paul: The American Phytopathological Society. Mitcham, E. J. (2008, July 6). Strawberry. Davis, California, United States of America. Mitcham, E. J., Crisosto, C. H., & Kader, A. A. (2006, June 15). Recommendations for Maintaining Postharvest Quality. Retrieved July 6, 2008, from Strawberry Produce Facts: http://postharvest.ucdavis.edu/Produce/ProduceFacts/Fruit/strawberry.shtml Molins, R. (2001). Food Irradiation: Principles and Application. Otagak, K. K. (1967-1971). Subcommittee Report on Fruit and Vegetable Technology. Hawaii State Department of Agriculture. Rivera, A., & Tong, C. (1993). Commercial Postharvest Handling of Strawberries (Fragaria spp.). Retrieved June 23, 2008, from University of Minnesota Extension: http://www.extension.umn.edu/distribution/horticulture/DG6237.html
30
Shoup, W. D. (2008). [Professor of Agricultural Systems Technology]. Carbondale: Southern Illinois University. Talbot, M. T., & Chau, K. V. (2002, July). Precooling Strawberries. Flordia, USA. Retrieved July 6, 2008, from University of Flordia. Tchobanoglous, R. C. (1998). Small and Decentralized Wastewater Management Systems, Wastewater Disinfection. Retrieved from EPA Office of Research and Development: http:www.epa.gov/owm/mtb/uv.pdf#search='Ultraviolet%20Disinfection%20%20A%20Clean%20Technology' United States Department of Agriculture. (2008, June 2). USDA Pomological Watercolor Collection . Retrieved February 9, 2009, from NAL Collection: http://www.nal.usda.gov/speccoll/collectionsguide/mssindex/pomology/berries/childpages/6663.shtml United States Food and Drug Administration. (2008, April 1). Center for Devices and Radiological Health. Retrieved April 17, 2009, from U.S. Food and Drug Administration: http://www.accessdata.fda.gov United States Food and Drug Administration. (2000, November 29). Irradiation in the Production, Processing, and Handling of Food. Retrieved 17 2009, April, from Food and Drug Administration: http://www.fda.gov/ohrms/dockets/98fr/112900a.htm USDA. (2007, January 10). Food Safety and Inspection Service. Retrieved August 19, 2008, from United States Department of Agriculture: http://www.fsis.usda.gov/News_&_Events/FSIS_Images/index.asp USGAO. (2000). Several Processes are used to Irradiate Food. In U.S.G.A.O., Food Irradiation: Available Research Indicates that Benefits Outweigh Risks. United States General Accounting Office. Wagenett, L., & Lemley, A. (1994, April 1). UV Radiation for treating drinking water. (Ultraviolet light as a germicide). Consumer's Research Magazine .

APPENDICES
31
APPENDIX A
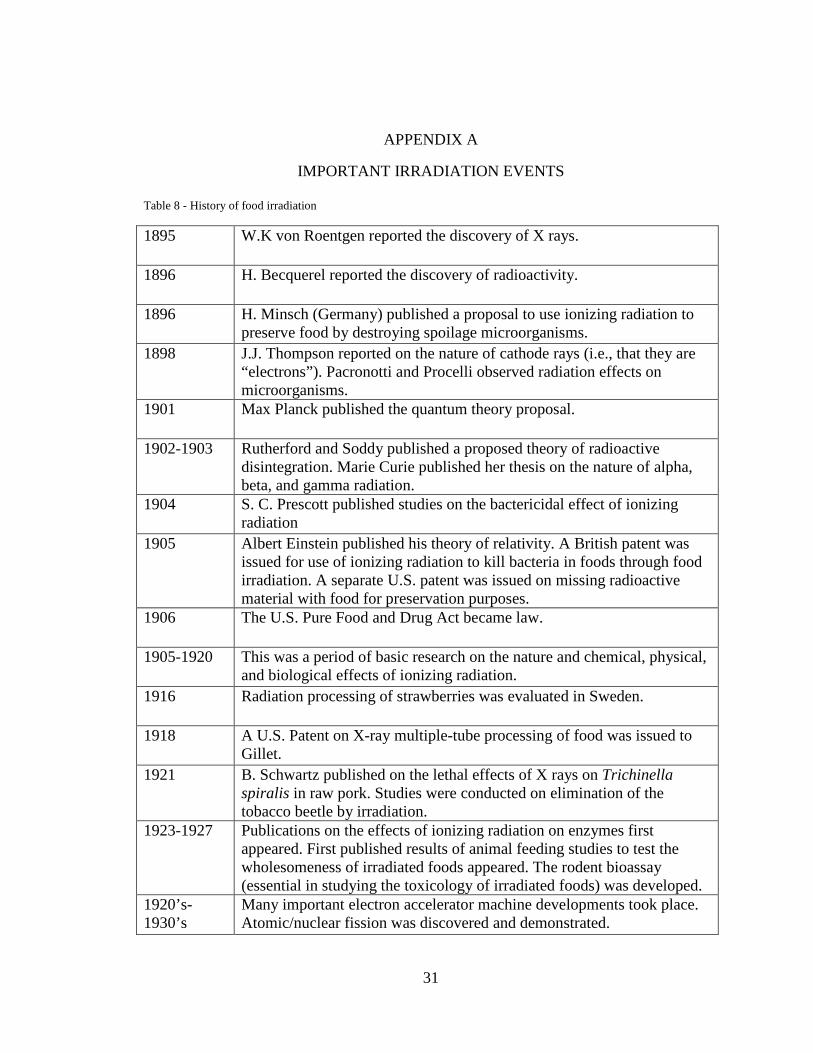
IMPORTANT IRRADIATION EVENTS
Table 8 - History of food irradiation
1895 W.K von Roentgen reported the discovery of X rays.
1896 H. Becquerel reported the discovery of radioactivity.
1896 H. Minsch (Germany) published a proposal to use ionizing radiation to preserve food by destroying spoilage microorganisms.
1898 J.J. Thompson reported on the nature of cathode rays (i.e., that they are “electrons”). Pacronotti and Procelli observed radiation effects on microorganisms.
1901 Max Planck published the quantum theory proposal.
1902-1903 Rutherford and Soddy published a proposed theory of radioactive disintegration. Marie Curie published her thesis on the nature of alpha, beta, and gamma radiation.
1904 S. C. Prescott published studies on the bactericidal effect of ionizing radiation
1905 Albert Einstein published his theory of relativity. A British patent was issued for use of ionizing radiation to kill bacteria in foods through food irradiation. A separate U.S. patent was issued on missing radioactive material with food for preservation purposes.
1906 The U.S. Pure Food and Drug Act became law.
1905-1920 This was a period of basic research on the nature and chemical, physical, and biological effects of ionizing radiation.
1916 Radiation processing of strawberries was evaluated in Sweden.
1918 A U.S. Patent on X-ray multiple-tube processing of food was issued to Gillet.
1921 B. Schwartz published on the lethal effects of X rays on Trichinella spiralis in raw pork. Studies were conducted on elimination of the tobacco beetle by irradiation.
1923-1927 Publications on the effects of ionizing radiation on enzymes first appeared. First published results of animal feeding studies to test the wholesomeness of irradiated foods appeared. The rodent bioassay (essential in studying the toxicology of irradiated foods) was developed.
1920’s-1930’s
Many important electron accelerator machine developments took place. Atomic/nuclear fission was discovered and demonstrated.
32
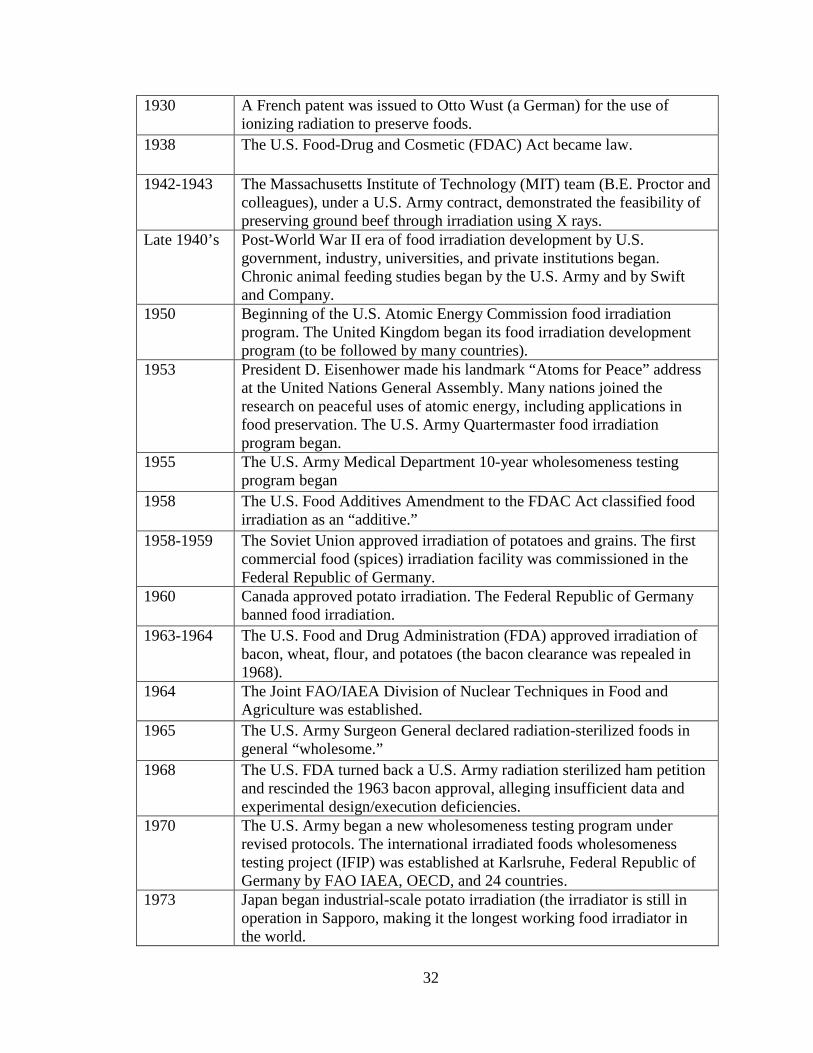
1930 A French patent was issued to Otto Wust (a German) for the use of ionizing radiation to preserve foods.
1938 The U.S. Food-Drug and Cosmetic (FDAC) Act became law.
1942-1943 The Massachusetts Institute of Technology (MIT) team (B.E. Proctor and colleagues), under a U.S. Army contract, demonstrated the feasibility of preserving ground beef through irradiation using X rays.
Late 1940’s Post-World War II era of food irradiation development by U.S. government, industry, universities, and private institutions began. Chronic animal feeding studies began by the U.S. Army and by Swift and Company.
1950 Beginning of the U.S. Atomic Energy Commission food irradiation program. The United Kingdom began its food irradiation development program (to be followed by many countries).
1953 President D. Eisenhower made his landmark “Atoms for Peace” address at the United Nations General Assembly. Many nations joined the research on peaceful uses of atomic energy, including applications in food preservation. The U.S. Army Quartermaster food irradiation program began.
1955 The U.S. Army Medical Department 10-year wholesomeness testing program began
1958 The U.S. Food Additives Amendment to the FDAC Act classified food irradiation as an “additive.”
1958-1959 The Soviet Union approved irradiation of potatoes and grains. The first commercial food (spices) irradiation facility was commissioned in the Federal Republic of Germany.
1960 Canada approved potato irradiation. The Federal Republic of Germany banned food irradiation.
1963-1964 The U.S. Food and Drug Administration (FDA) approved irradiation of bacon, wheat, flour, and potatoes (the bacon clearance was repealed in 1968).
1964 The Joint FAO/IAEA Division of Nuclear Techniques in Food and Agriculture was established.
1965 The U.S. Army Surgeon General declared radiation-sterilized foods in general “wholesome.”
1968 The U.S. FDA turned back a U.S. Army radiation sterilized ham petition and rescinded the 1963 bacon approval, alleging insufficient data and experimental design/execution deficiencies.
1970 The U.S. Army began a new wholesomeness testing program under revised protocols. The international irradiated foods wholesomeness testing project (IFIP) was established at Karlsruhe, Federal Republic of Germany by FAO IAEA, OECD, and 24 countries.
1973 Japan began industrial-scale potato irradiation (the irradiator is still in operation in Sapporo, making it the longest working food irradiator in the world.
33
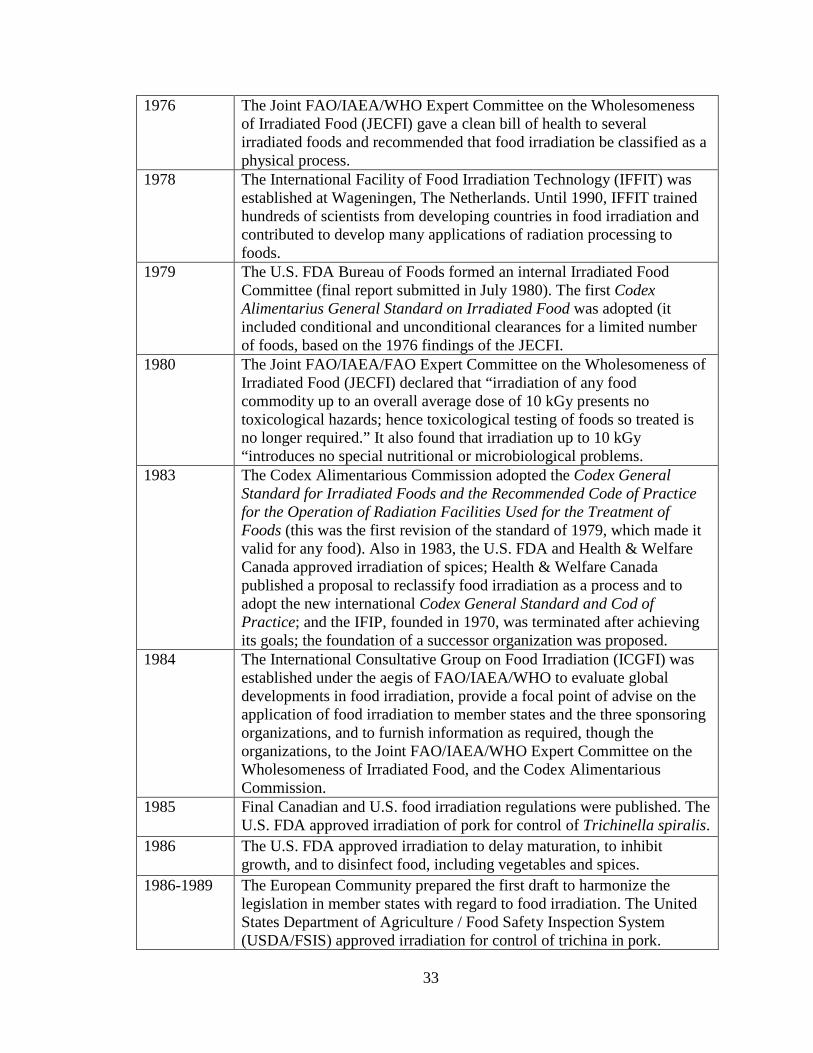
1976 The Joint FAO/IAEA/WHO Expert Committee on the Wholesomeness of Irradiated Food (JECFI) gave a clean bill of health to several irradiated foods and recommended that food irradiation be classified as a physical process.
1978 The International Facility of Food Irradiation Technology (IFFIT) was established at Wageningen, The Netherlands. Until 1990, IFFIT trained hundreds of scientists from developing countries in food irradiation and contributed to develop many applications of radiation processing to foods.
1979 The U.S. FDA Bureau of Foods formed an internal Irradiated Food Committee (final report submitted in July 1980). The first Codex Alimentarius General Standard on Irradiated Food was adopted (it included conditional and unconditional clearances for a limited number of foods, based on the 1976 findings of the JECFI.
1980 The Joint FAO/IAEA/FAO Expert Committee on the Wholesomeness of Irradiated Food (JECFI) declared that “irradiation of any food commodity up to an overall average dose of 10 kGy presents no toxicological hazards; hence toxicological testing of foods so treated is no longer required.” It also found that irradiation up to 10 kGy “introduces no special nutritional or microbiological problems.
1983 The Codex Alimentarious Commission adopted the Codex General Standard for Irradiated Foods and the Recommended Code of Practice for the Operation of Radiation Facilities Used for the Treatment of Foods (this was the first revision of the standard of 1979, which made it valid for any food). Also in 1983, the U.S. FDA and Health & Welfare Canada approved irradiation of spices; Health & Welfare Canada published a proposal to reclassify food irradiation as a process and to adopt the new international Codex General Standard and Cod of Practice; and the IFIP, founded in 1970, was terminated after achieving its goals; the foundation of a successor organization was proposed.
1984 The International Consultative Group on Food Irradiation (ICGFI) was established under the aegis of FAO/IAEA/WHO to evaluate global developments in food irradiation, provide a focal point of advise on the application of food irradiation to member states and the three sponsoring organizations, and to furnish information as required, though the organizations, to the Joint FAO/IAEA/WHO Expert Committee on the Wholesomeness of Irradiated Food, and the Codex Alimentarious Commission.
1985 Final Canadian and U.S. food irradiation regulations were published. The U.S. FDA approved irradiation of pork for control of Trichinella spiralis.
1986 The U.S. FDA approved irradiation to delay maturation, to inhibit growth, and to disinfect food, including vegetables and spices.
1986-1989 The European Community prepared the first draft to harmonize the legislation in member states with regard to food irradiation. The United States Department of Agriculture / Food Safety Inspection System (USDA/FSIS) approved irradiation for control of trichina in pork.
34
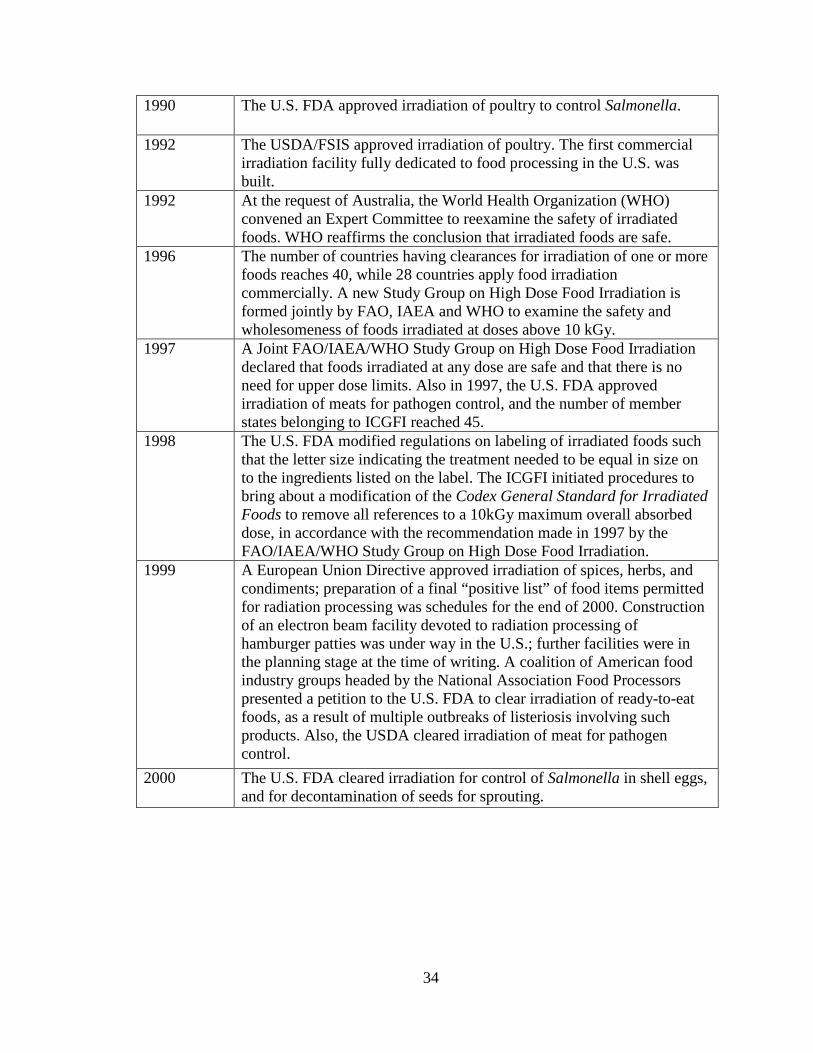
1990 The U.S. FDA approved irradiation of poultry to control Salmonella.
1992 The USDA/FSIS approved irradiation of poultry. The first commercial irradiation facility fully dedicated to food processing in the U.S. was built.
1992 At the request of Australia, the World Health Organization (WHO) convened an Expert Committee to reexamine the safety of irradiated foods. WHO reaffirms the conclusion that irradiated foods are safe.
1996 The number of countries having clearances for irradiation of one or more foods reaches 40, while 28 countries apply food irradiation commercially. A new Study Group on High Dose Food Irradiation is formed jointly by FAO, IAEA and WHO to examine the safety and wholesomeness of foods irradiated at doses above 10 kGy.
1997 A Joint FAO/IAEA/WHO Study Group on High Dose Food Irradiation declared that foods irradiated at any dose are safe and that there is no need for upper dose limits. Also in 1997, the U.S. FDA approved irradiation of meats for pathogen control, and the number of member states belonging to ICGFI reached 45.
1998 The U.S. FDA modified regulations on labeling of irradiated foods such that the letter size indicating the treatment needed to be equal in size on to the ingredients listed on the label. The ICGFI initiated procedures to bring about a modification of the Codex General Standard for Irradiated Foods to remove all references to a 10kGy maximum overall absorbed dose, in accordance with the recommendation made in 1997 by the FAO/IAEA/WHO Study Group on High Dose Food Irradiation.
1999 A European Union Directive approved irradiation of spices, herbs, and condiments; preparation of a final “positive list” of food items permitted for radiation processing was schedules for the end of 2000. Construction of an electron beam facility devoted to radiation processing of hamburger patties was under way in the U.S.; further facilities were in the planning stage at the time of writing. A coalition of American food industry groups headed by the National Association Food Processors presented a petition to the U.S. FDA to clear irradiation of ready-to-eat foods, as a result of multiple outbreaks of listeriosis involving such products. Also, the USDA cleared irradiation of meat for pathogen control.
2000 The U.S. FDA cleared irradiation for control of Salmonella in shell eggs, and for decontamination of seeds for sprouting.

35
APPENDIX B
IRRADIATION SYMBOL
Figure 3- Radura symbol
36
APPENDIX C
TIME/ENERGY CALIBRATION CURVE
Figure 4 - Exposure rates in time and in � /��� for each test group
0, 015, 15
30, 3045, 45
60, 6075, 75
90, 90
0, 36.2
15, 88.1
30, 140
45, 191.9
60, 243.8
75, 295.7
90, 347.6
0
50
100
150
200
250
300
350
400
0 20 40 60 80 100
Ex
po
sure
in
mj/
cm3
Exposure in Seconds
Exposure Rates
Seconds
mj/cm3
37
APPENDIX D
COMMON NAMES OF PLAT DISEASES Table 9 - Strawberry diseases, molds, fungi and other deterioration causes
Diseases of Strawberry (Fragaria × ananassa Duch.)
BACTERIAL DISEASES
Angular leaf spot Xanthomonas fragariae Kennedy & King
Bacterial wilt Pseudomonas solanacearum (Smith) Smith
Cauliflower disease (complex) Rhodococcus fascians (Tilford) Goodfellow = Corynebacterium fascians (Tilford) Dowson Aphelanchoides fragariae (Ritzema-Bos) Christie
FUNGAL DISEASES
Alternaria fruit rot Alternaria tenuissima (Kunze:Fr.) Wiltshire
Anther and pistil blight Rhizoctonia fragariae Hussain & W.E. McKeen (teleomorph: Ceratobasidium sp.)
Anthracnose and anthracnose fruit rot and black spot Colletotrichum acutatum J.H. Simmonds C. dematium (Pers.) Grove
C. gloeosporioides (Penz.) Penz. & Sacc. in Penz. = C. fragariae A.N. Brooks (teleomorph: Glomerella cingulata (Stoneman) Spauld. & H. Schrenk) Gloeosporium spp.
Armillaria crown and root rot (shoestring crown and root rot) Armillaria mellea (Vahl:Fr.) P. Kumm. (anamorph: Rhizomorpha subcorticalis Pers.)
Black leaf spot Alternaria alternata (Fr.:Fr.) Keissl. f. sp. fragariae (in Korea and New Zealand) Colletotrichum gloeosporioides (Penz.) Penz. & Sacc. in Penz. = C. fragariae A.N. Brooks
Black root rot (disease complex) Rhizoctonia fragariae Hussain & W.E. McKeen (teleomorph: Ceratobasidium sp.) Coniothyrium fuckelii Sacc. (teleomorph: Diapleella coniothyrium (Fuckel) Barr
38
= Leptosphaeria coniothyrium (Fuckel) Sacc.) Hainesia lythri (Desmaz.) Hohn. (teleomorph: Discohainesia oenotherae (Cooke & Ellis) Nannf.) Idriella lunata P.E. Nelson & K. Wilhelm Pyrenochaeta sp. Pythium spp. P. ultimum Trow
Cercospora leaf spot Cercospora fragariae Lobik C. vexans C. Massal.
Charcoal rot Macrophomina phaseolina (Tassi) Goidanich = Botryodiplodia phaseoli (Maubl.) Thirumal.
Common leaf spot Mycosphaerella fragariae (Tul.) Lindau (anamorph: Ramularia brunnea Peck)
Coniothyrium diseases Coniothyrium fuckelii Sacc. Coniella fragariae (Oudem.) B. Sutton = coniothyrium fragariae Oudem.
Dematophora crown and root rot (white root rot) Rosellinia necatrix Prill. (anamorph: Dematophora necatrix R. Hartig)
Diplodina rot (leaf and stalk rot) Phoma lycopersici Cooke = Diplodina lycopersici Hollos (teleomorph: Didymella lycopersici Kleb.)
Downy mildew Peronospora potentillae de Bary = P. fragariae Roze & Cornu
Fruit rots (in addition to those appearing elsewhere in this listing) Aspergillus niger Tiegh. Cladosporium spp. Mucor mucedo P. Mich. ex Saint-Amans M. hiematis Wehmer M. hiemalis Wehmer f. sylvaticus (Hagen) M.A.A. Schipper M. piriformis E. Fisch. Penicillium aurantiogriseum Dierckx = P. cyclopium Westling P. expansum Link P. glabrum (Wehmer) Westling = P. frequentans Westling P. purpurogenum O. Stoll
Byssochlamys rot* Byssochlamys fulva Olliver & G. Sm. (anamorph: Paecilomyces fulvus R.A. Samson)
Brown cap
39
Foliar pathogens which attack cap-drying Fruit blotch
Fusarium sambucinum Fuckel (teleomorph: Gibberella pulicaris (Fr.:Fr.) Sacc.) Penicillium purpurogenum O. Stoll Peronospora potentillae de Bary Sphaeropsis malorum Beck. (teleomorph: Botryosphaeria obtusa (Schwein.) Shoemaker = Physalospora obtusa (Schwein.) Cooke) Sclerotium rolfsii Sacc. (teleomorph: Athelia rolfsii (Curzi) Tu & Kimbrough = Corticium rolfsii Curzi Schizoparme straminea Shear (anamorph: Coniella castaneicola (Ellis & Everh.) Sutton = Pilidiella quercicola (Oudem.) Petr.
Gray mold leaf blight and dry crown rot Botrytis cinerea Pers.:Fr.
(teleomorph: Botryotinia fuckeliana (de Bary) Whetzel) Hainesia leaf spot
Hainesia lythri (Deamaz.) Hohn. Hard brown rot
Rhizoctonia solani Kühn (teleomorph: Thanatephorus cucumeris (A.B. Frank) Donk) Macrophomina phaseolina (Tassi) Goidanich = M. phaseoli (Maubl.) Ashby = Rhizoctonia bataticola (Taub.) E.J. Butler
Leaf blotch Gnomonia comari P. Karst. (anamorph: Zythia fragariae Laibach) G. fragariae Kleb.
Leaf rust Phragmidium potentillae (Pers.:Pers.) P. Karst = Frommea obtusa (F. Strauss) Arth.
Leaf scorch Diplocarpon earlianum (Ellis & Everh.) F.A. Wolf (anamorph: Marssonina fragariae (Lib.) Kleb. = M. potentillae (Desmaz.) Magnus)
Leather rot Phytophthora cactorum (Lebert & Cohn) J. Schröt P. citricola Sawada P. citrophthora (R.E. Sm. & E.H. Sm.) Leonian P. nicotianae Breda de Haan var. parasitica (Dastur) G.M. Waterhouse = P. parasitica Dastur
Lilac soft rot Pythium sp.
Pestalotia fruit rot Pestalotia laurocerasi Westend.
40
P. longisetula Guba Phomopsis leaf blight
Phomopsis obscurans (Ellis & Everh.) Sutton = Dendrophoma obscurans (Ellis & Everh.) H.W. Anderson
Postharvest rots Botrytis cinerea Pers.:Fr. Mucor mucedo P. Mich. ex Saint-Amans Pichia membranefaciens Hansen Pichia subpelliculosa Kurtzman = Hansenula subpelliculosa Bedford nom. nud. S. cerevisiae Meyen ex Hansen S. kluyveri Phaff et al. Zygosaccharomyces bailii (Lindner) Guillierm. = Saccharomyces bailii Lindner Z. florentinus Castelli ex Kudriavsev = S. florentinus (Castelli ex Kudriavsev) Lodder & Kreger-van Rij
Powdery mildew Sphaerotheca macularis (Wallr.:Fr.) Lind = S. humuli (DC.) Burrill
Phytophthora nicotianae var. parasitica rot Phytophthora nicotianae Breda de Haan var. parasitica (Dastur) G.M. Waterhouse = P. parasitica Dastur
Phytophthora crown and root rot Phytophthora sp. P. cactorum (Lebert & Cohn) J. Schröt. P. citricola Sawada P. citrophthora (R.E. Sm. & E.H. Sm.) Leonian P. megasperma Drechs. (associated Calif. only) P. nicotianae Breda de Haan var. parasitica (Dastur) G.M. Waterhouse
Other root rots
Botrytis crown rot Botrytis cinerea Pers.:Fr.
Gray sterile fungus root rot Phoma terrestris E.M. Hans. = Pyrenochaeta terrestris (E.M. Hans.) Gorenz. et al.
Idriella root rot Idriella lunata P.E. Nelson & K. Wilhelm
Macrophomina root rot Macrophomina phaseolina (Tassi) Goidanach
Olpidium root infection Olpidium brassicae (Woronin) P.A. Dang
Synchytrium root gall Synchytrium fragariae Zeller & L. Campbell

41
Purple leaf spot Mycosphaerella louisianae Plakidas
Red stele Phytophthora fragariae C.J. Hickman
Rhizoctonia bud and crown rot, leaf blight, web blight, fruit rot Rhizoctonia solani Kühn R. fragariae Hussain & W.E. McKeen
Rhizopus rot (leak) Rhizopus stolonifer (Ehrenb.:Fr.) Vuill.
Sclerotinia crown and fruit rot Sclerotinia sclerotiorum (Lib.) de Bary
Septoria hard rot and leaf spot Septoria fragariae (Lib.) Desmaz. = Septogloeum potentillae Allesch. Septoria aciculosa Ellis & Everh. S. fragariaecola Lobik
Stunt (Pythium root rot) Pythium ultimum Trow Pythium spp. P. acanthicum Drechs. P. debaryanum Auct. non R. Hesse P. dissotocum Drechs. P. hypogynum Middleton P. irregulare Buisman P. middletonii Sparrow = P. proliferum deBary P. myriotylum Drechs. (Japan) P. perniciosum Serbinow P. rostratum E.J. Butler P. sylvaticum W.A. Campbell & J.W. Hendrix
Southern blight (Sclerotium rot) Sclerotium rolfsii Sacc.
Stem-end rot Gnomonia comari P. Karst.
Tan-brown rot (of fruit) Discohainesia oenotherae (Cooke & Ellis) Nannf.
(anamorph: Hainesia lythri (Desmaz.) Hohn. = Patellina fragariae Stevens & Peters.)
Verticillium wilt Verticillium albo-atrum Reinke & Berthier V. dahliae Kleb.
MISCELLANEOUS DISEASES OR DISORDERS
Pith necrosis and crown death Unknown, Scotland only
Rapid death Unknown, resembles P. cactorum
42
Slime molds Diachea leucopodia (Bull.) Rostr. Physarum cinereum (Batsch) Pers.
NEMATODES, PARASITIC
Bulb and stem Ditylenchus dipsaci (Kühn) Filipjev
Dagger Xiphenema spp.
Dagger, American Xiphenema americanum Cobb
Lesion Pratylenchus coffeae (Zimmerman) Filipjev & Schuurmans-Stekhoven P. penetrans (Cobb) Filipjev & Schuurmans-Stekhoven P. pratensis (De Man) Filipjev P. scribneri Steiner
Root-knot Meloidogyne spp. M. hapla Chitwood
Spring dwarf (crimp) Aphelenchoides fragariae (Ritzema-Bos) Christie A. ritzemabosi (Schwartz) Steiner & Buhrer
Sting Belonolaimus longicaudatus Rau B. gracilis Steiner
Summer dwarf (crimp) Aphelenchoides besseyi Christie
VIRUS, VIRUS-LIKE AGENT or mycoplasma-like organism (MLO), abbreviation, and group relationship:
APHID-TRANSMITTED:
Strawberry chlorotic fleck Strawberry chlorotic fleck (graft-transmissible agent of unknown relationship)
Strawberry crinkle Strawberry crinkle virus (SCV) (cytoplasmic rhabdovirus)
Strawberry latent C virus in Fragaria Strawberry latent Cvirus (SLCV) (nuclear rhabdovirus)
Strawberry mild yellow-edge Strawberry mild yellow-edge virus (SMYEV) (plus an unnamed potexvirus)
Strawberry mottle Strawberry mottle virus (SMV) (Relationship unknown)
Strawberry pseudo mild yellow-edge Strawberry pseudo mild yellow-edge virus (SPMYEV) (carlavirus)
Strawberry vein banding
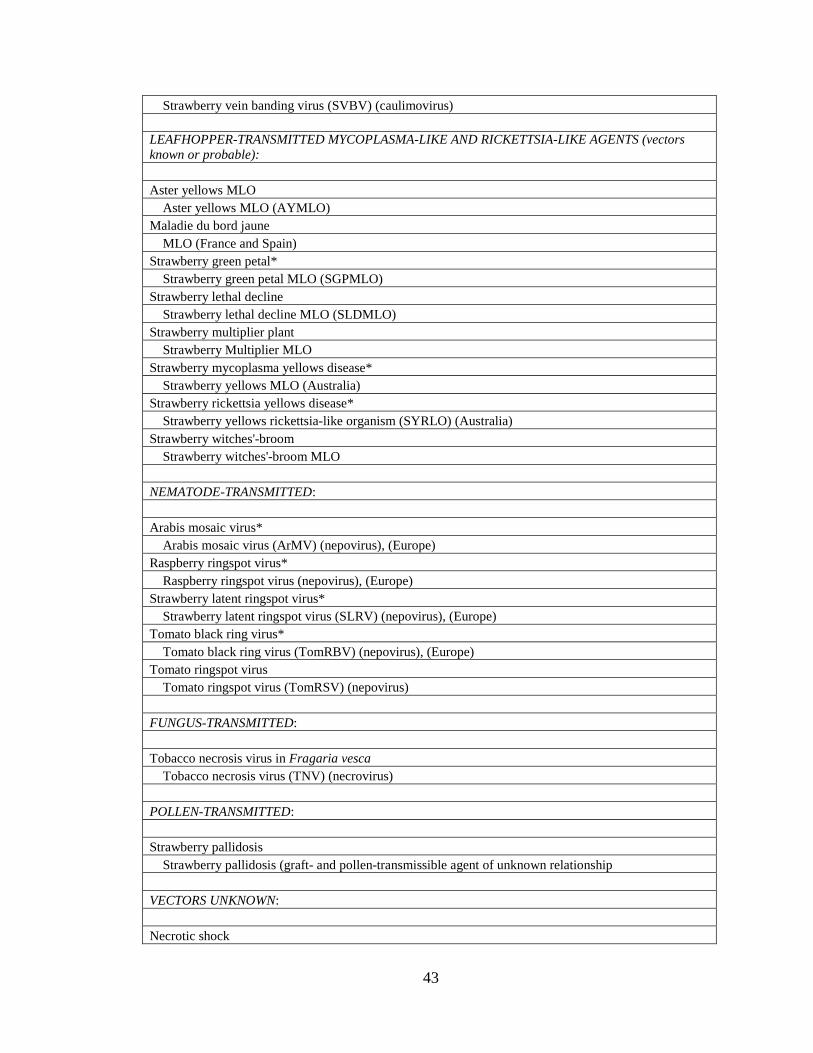
43
Strawberry vein banding virus (SVBV) (caulimovirus)
LEAFHOPPER-TRANSMITTED MYCOPLASMA-LIKE AND RICKETTSIA-LIKE AGENTS (vectors known or probable):
Aster yellows MLO Aster yellows MLO (AYMLO)
Maladie du bord jaune MLO (France and Spain)
Strawberry green petal* Strawberry green petal MLO (SGPMLO)
Strawberry lethal decline Strawberry lethal decline MLO (SLDMLO)
Strawberry multiplier plant Strawberry Multiplier MLO
Strawberry mycoplasma yellows disease* Strawberry yellows MLO (Australia)
Strawberry rickettsia yellows disease* Strawberry yellows rickettsia-like organism (SYRLO) (Australia)
Strawberry witches'-broom Strawberry witches'-broom MLO
NEMATODE-TRANSMITTED:
Arabis mosaic virus* Arabis mosaic virus (ArMV) (nepovirus), (Europe)
Raspberry ringspot virus* Raspberry ringspot virus (nepovirus), (Europe)
Strawberry latent ringspot virus* Strawberry latent ringspot virus (SLRV) (nepovirus), (Europe)
Tomato black ring virus* Tomato black ring virus (TomRBV) (nepovirus), (Europe)
Tomato ringspot virus Tomato ringspot virus (TomRSV) (nepovirus)
FUNGUS-TRANSMITTED:
Tobacco necrosis virus in Fragaria vesca Tobacco necrosis virus (TNV) (necrovirus)
POLLEN-TRANSMITTED:
Strawberry pallidosis Strawberry pallidosis (graft- and pollen-transmissible agent of unknown relationship
VECTORS UNKNOWN:
Necrotic shock
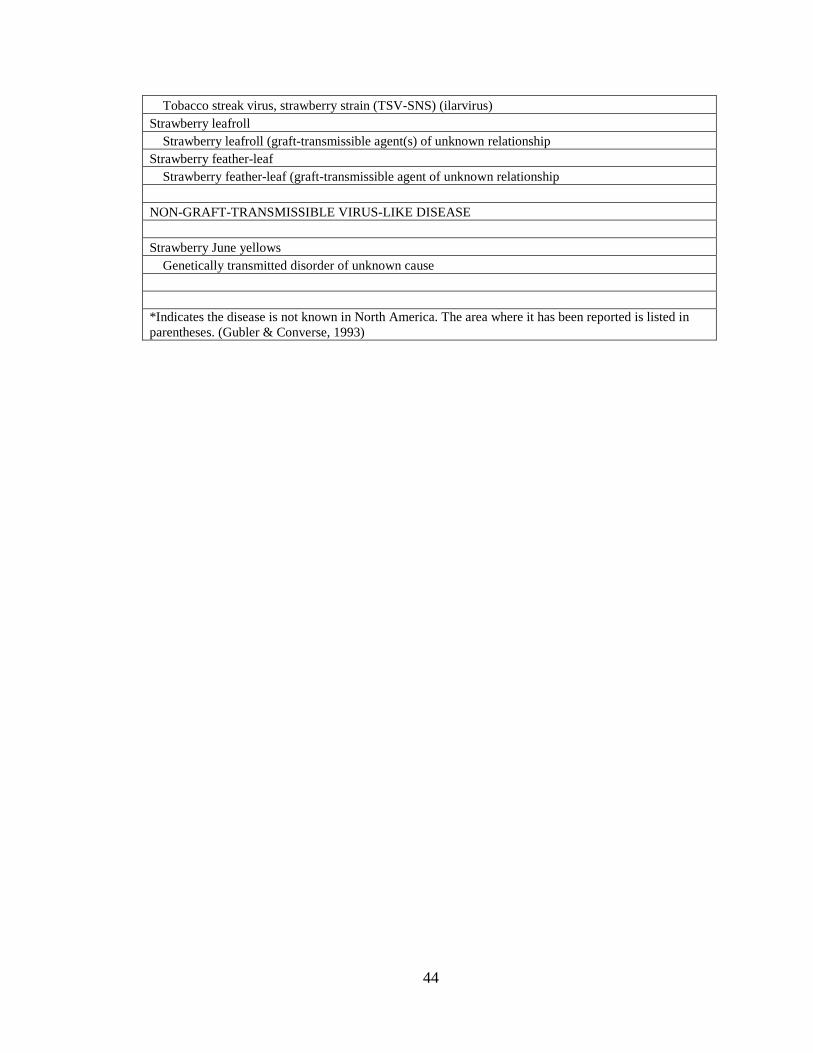
44
Tobacco streak virus, strawberry strain (TSV-SNS) (ilarvirus) Strawberry leafroll
Strawberry leafroll (graft-transmissible agent(s) of unknown relationship Strawberry feather-leaf
Strawberry feather-leaf (graft-transmissible agent of unknown relationship
NON-GRAFT-TRANSMISSIBLE VIRUS-LIKE DISEASE
Strawberry June yellows Genetically transmitted disorder of unknown cause
*Indicates the disease is not known in North America. The area where it has been reported is listed in parentheses. (Gubler & Converse, 1993)
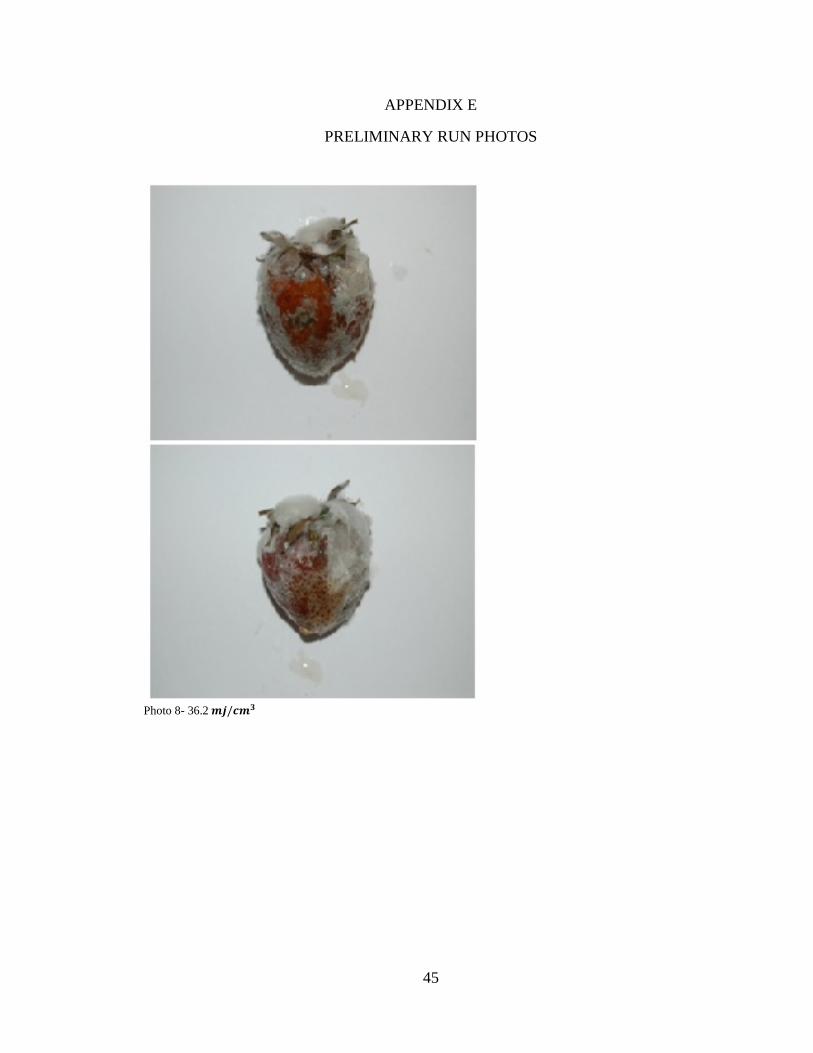
45
APPENDIX E
PRELIMINARY RUN PHOTOS
Photo 8- 36.2 � /���
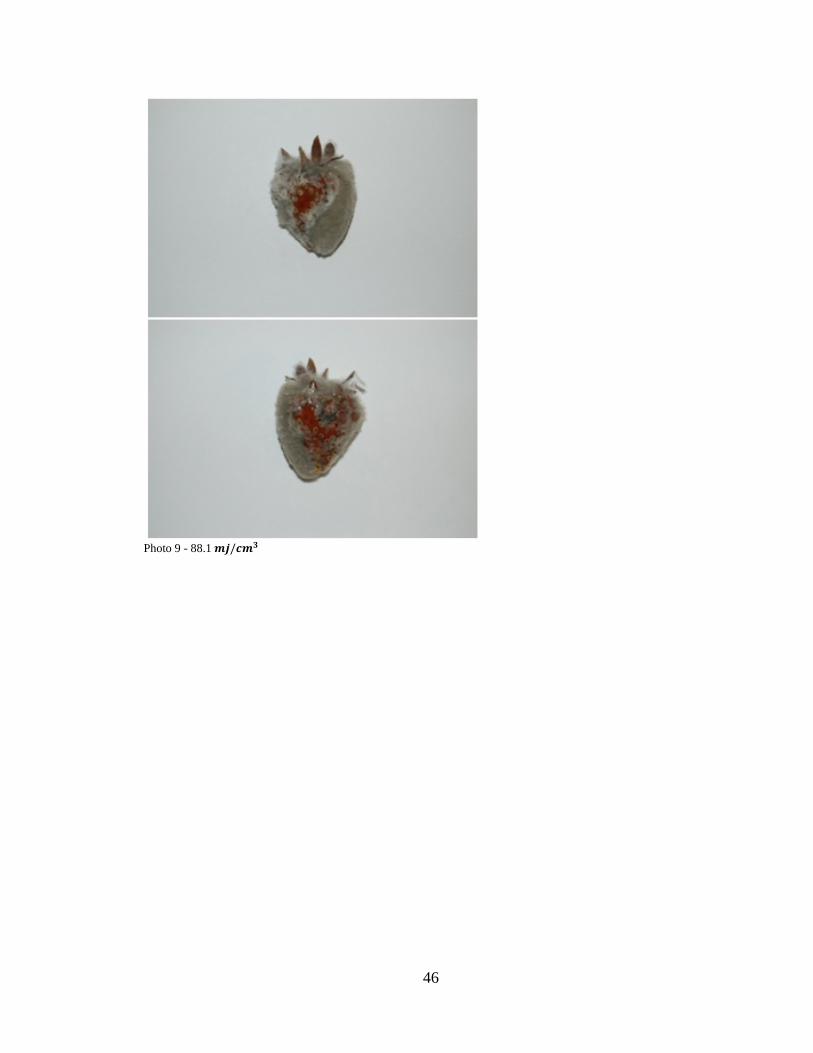
46
Photo 9 - 88.1 � /���
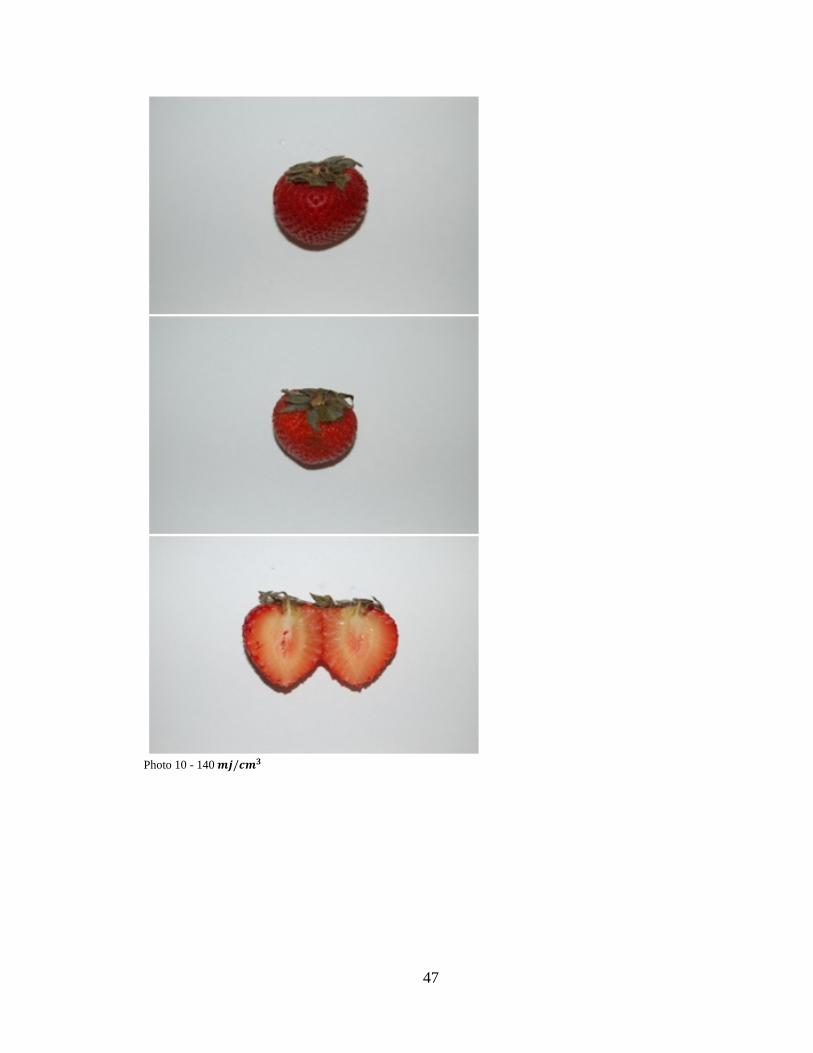
47
Photo 10 - 140 � /���
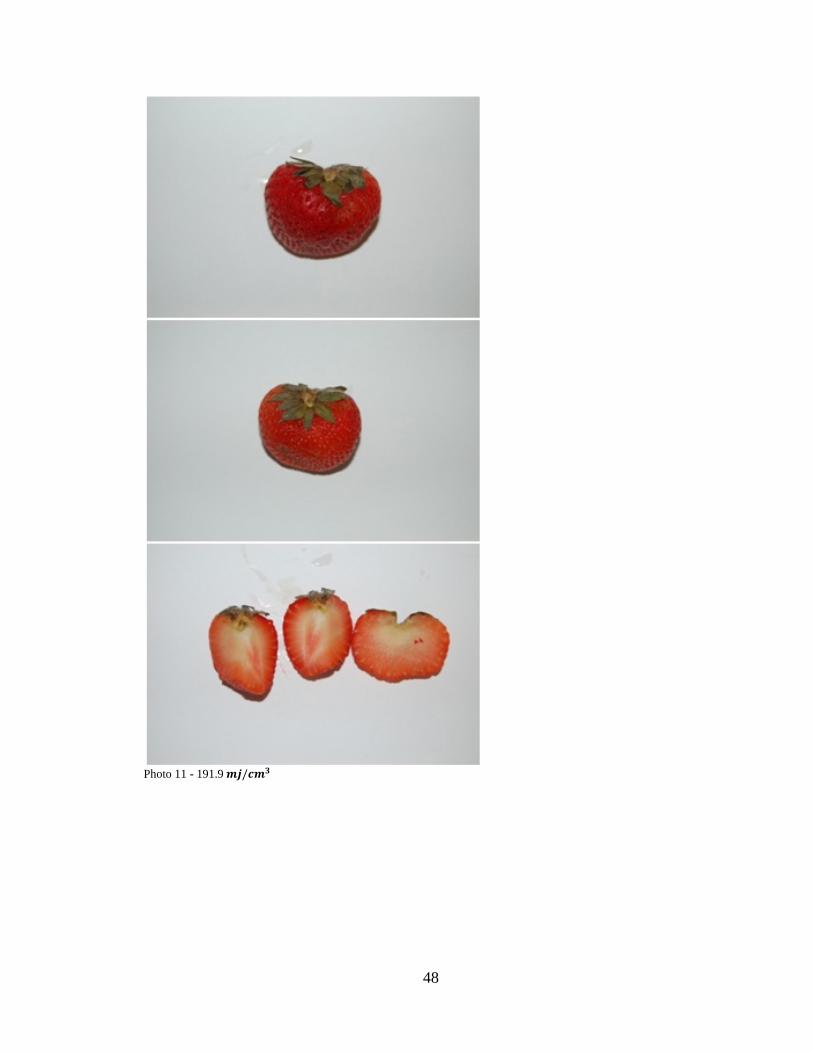
48
Photo 11 - 191.9 � /���
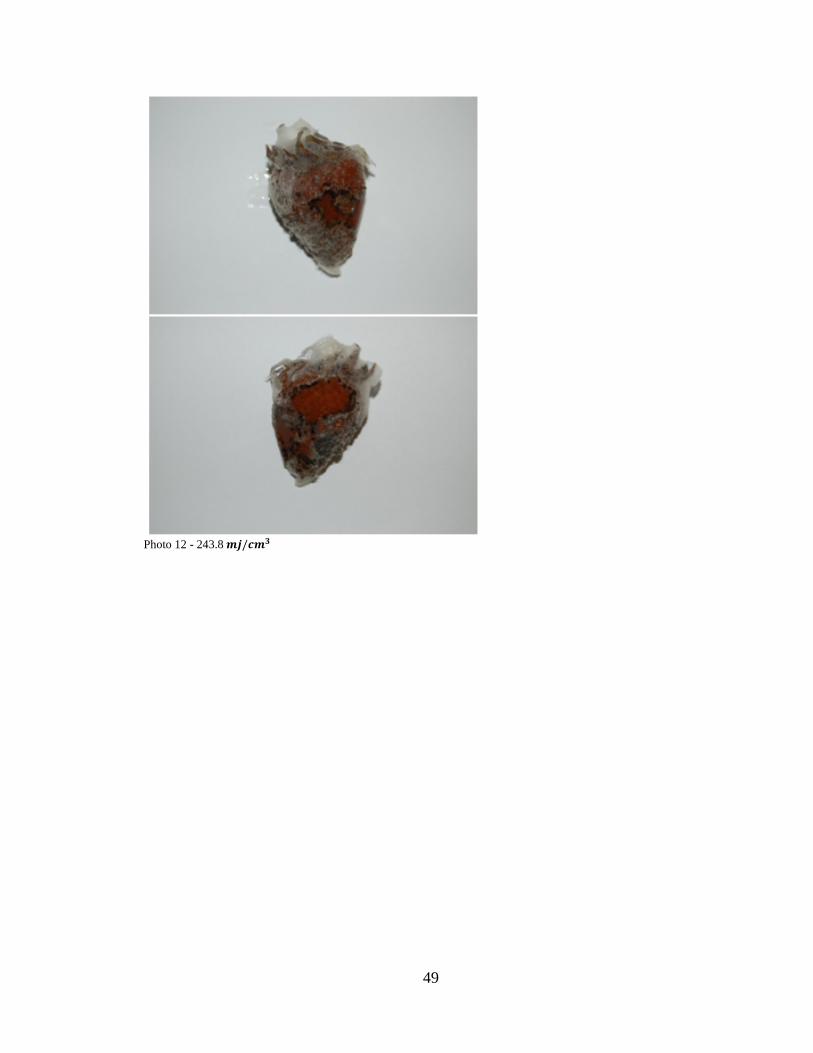
49
Photo 12 - 243.8 � /���
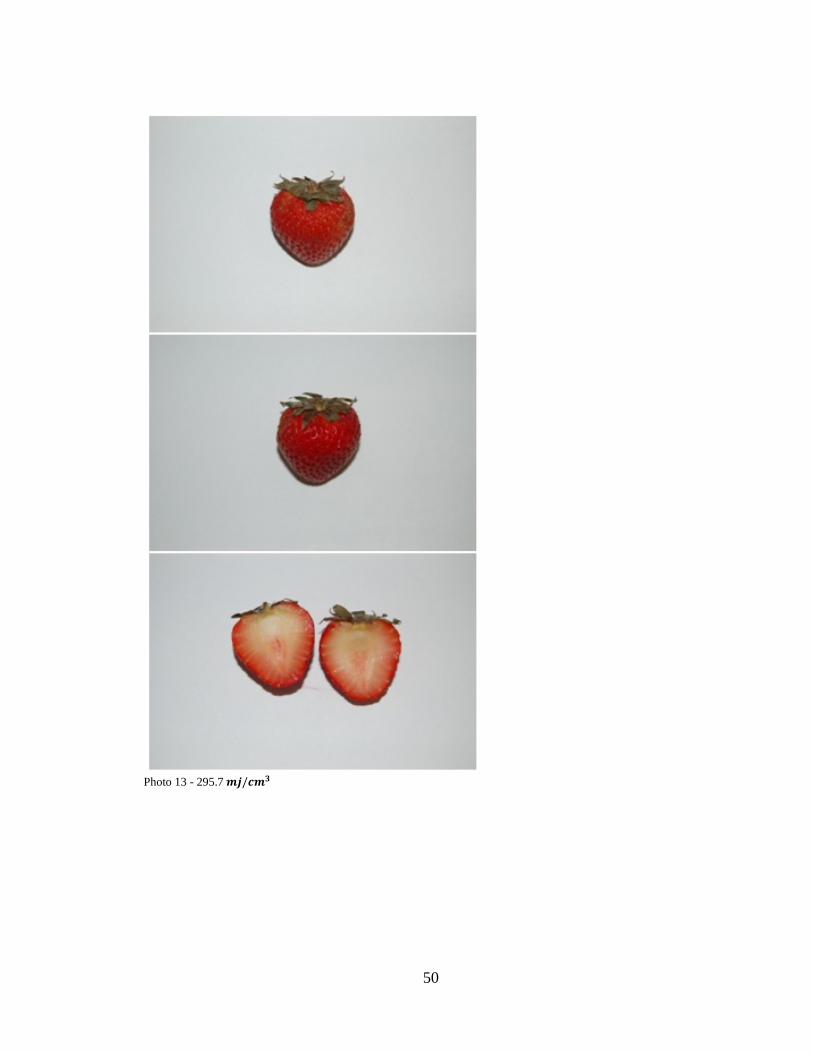
50
Photo 13 - 295.7 � /���
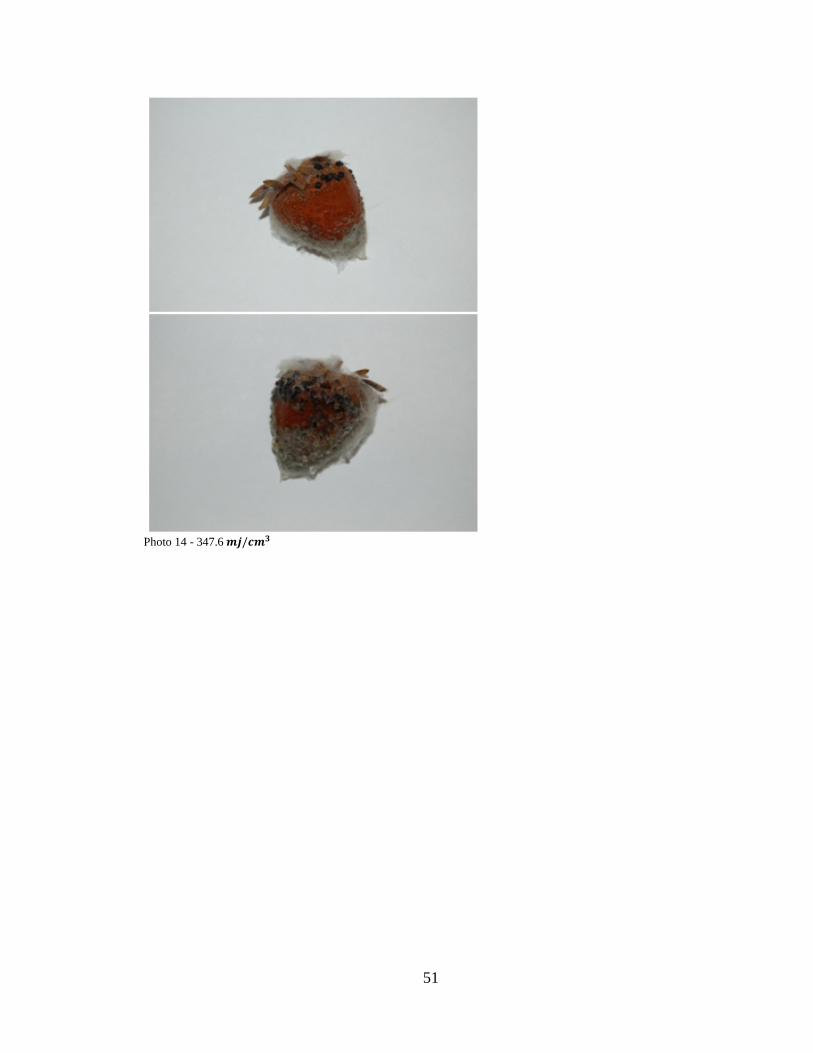
51
Photo 14 - 347.6 � /���
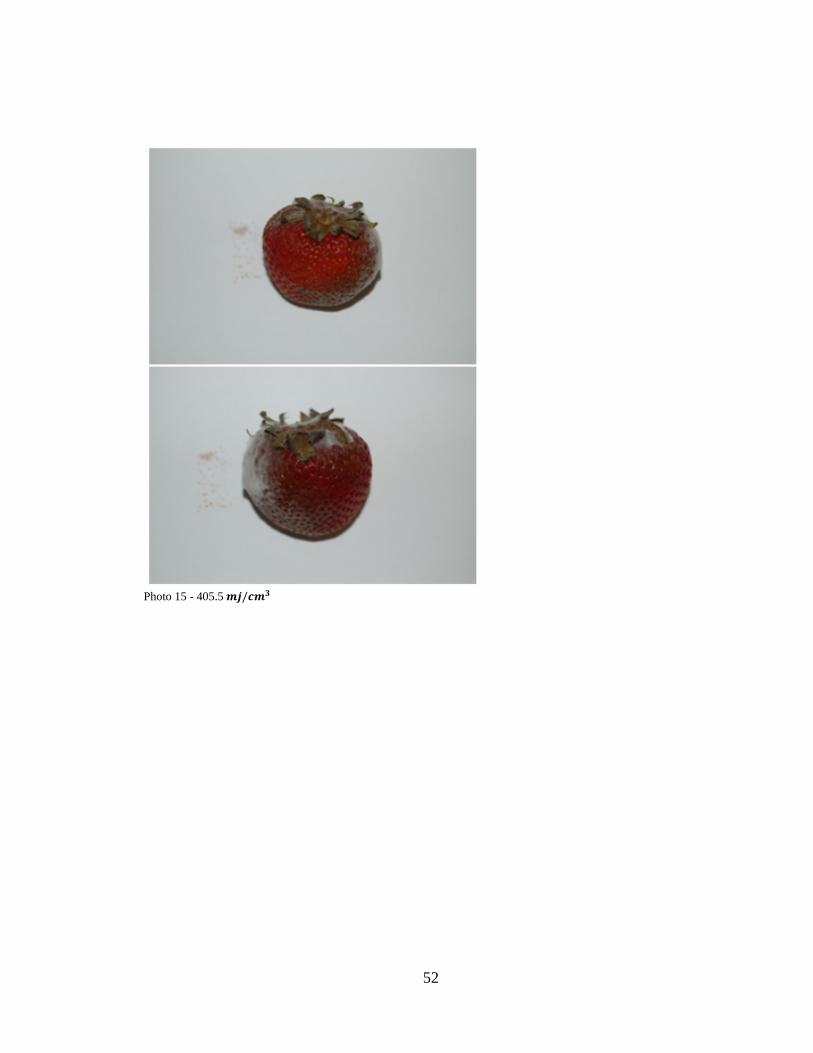
52
Photo 15 - 405.5 � /���
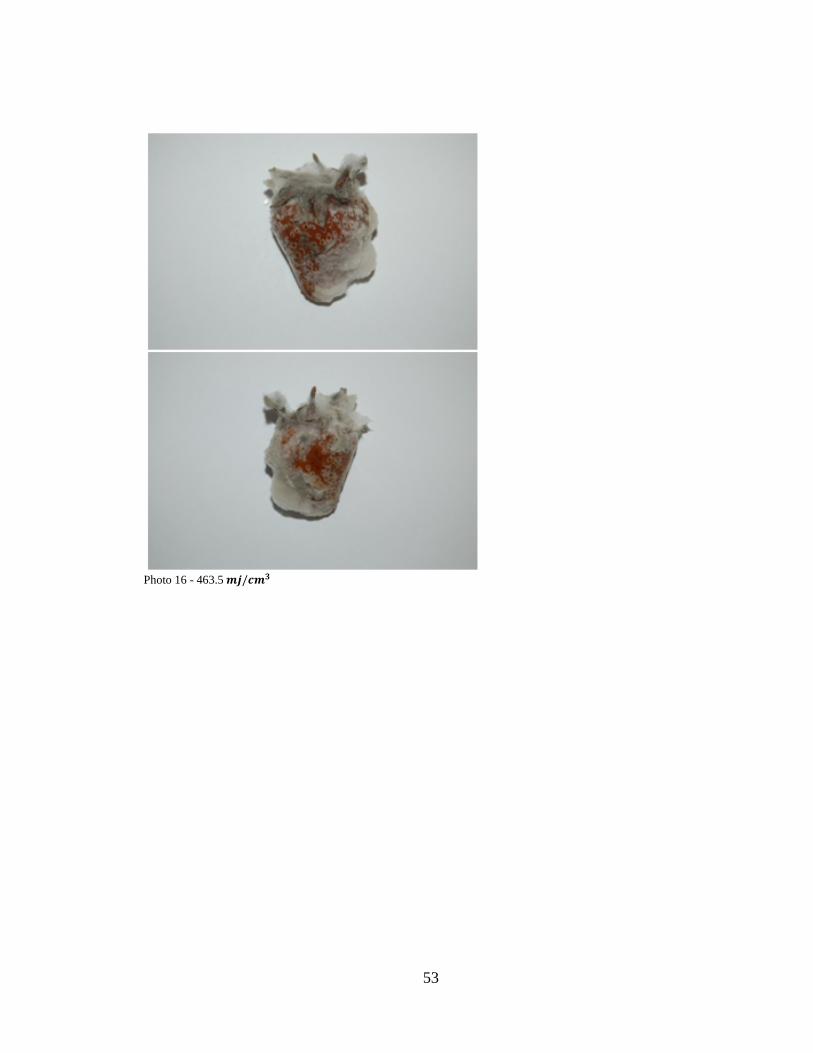
53
Photo 16 - 463.5 � /���
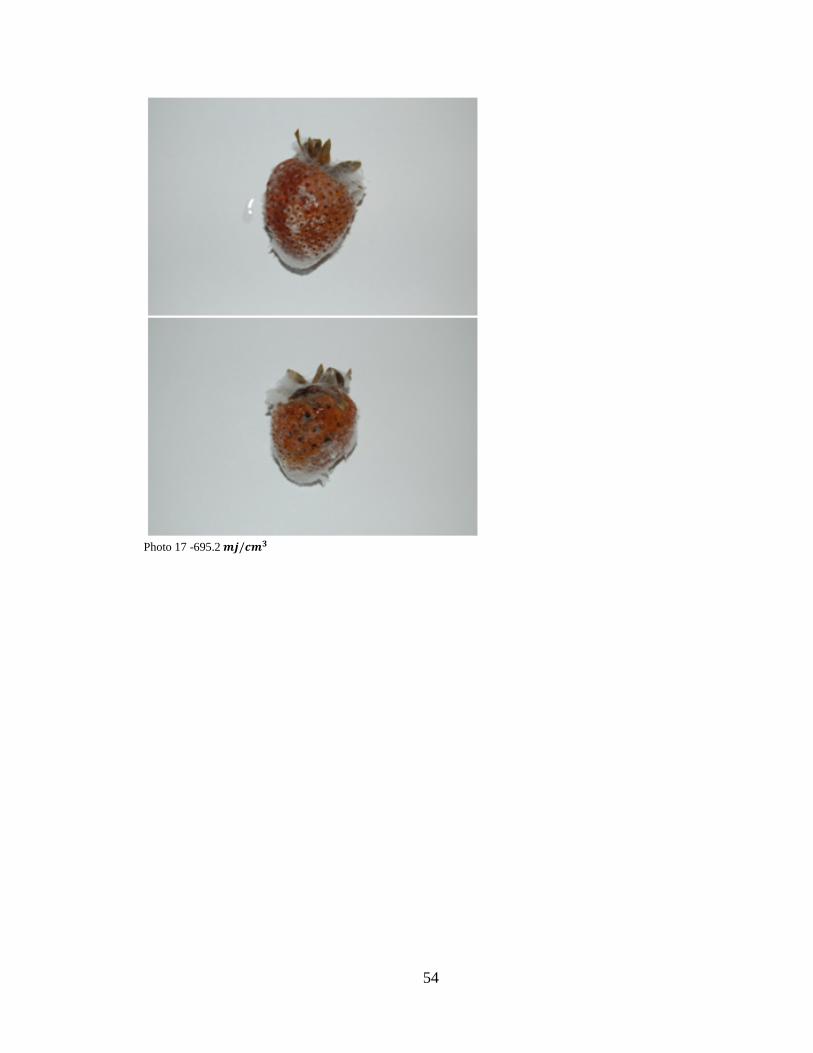
54
Photo 17 -695.2 � /���
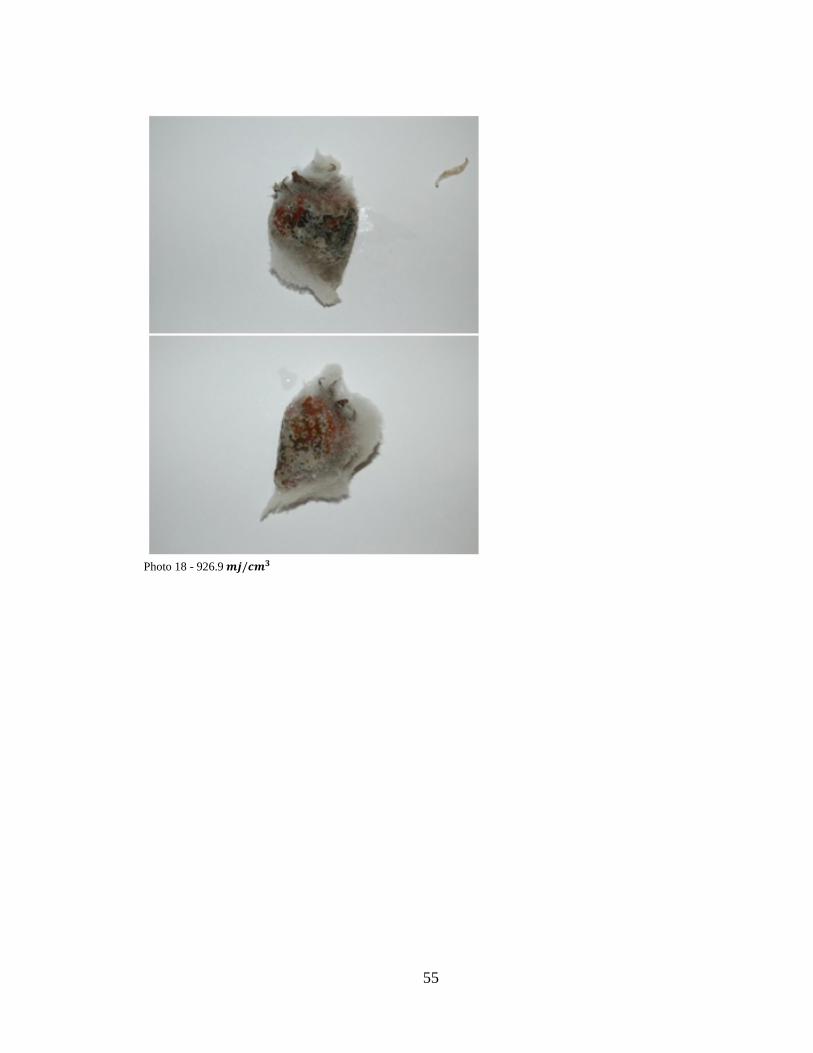
55
Photo 18 - 926.9 � /���
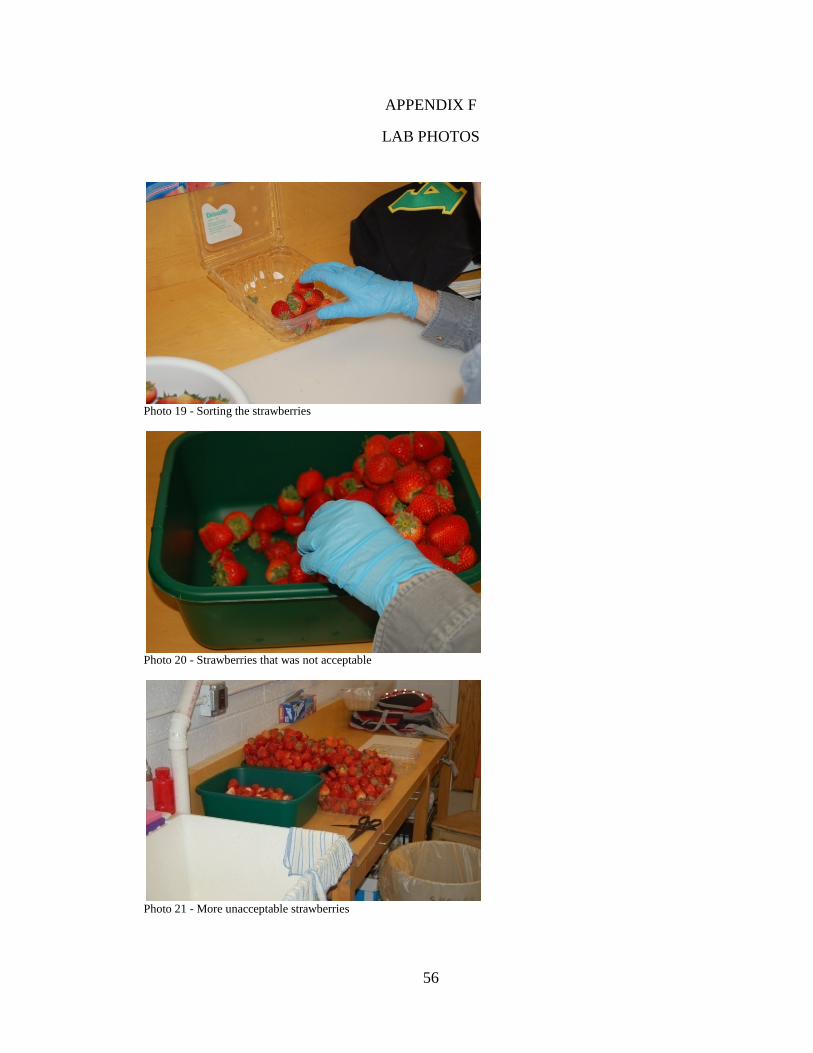
56
APPENDIX F
LAB PHOTOS
Photo 19 - Sorting the strawberries
Photo 20 - Strawberries that was not acceptable
Photo 21 - More unacceptable strawberries
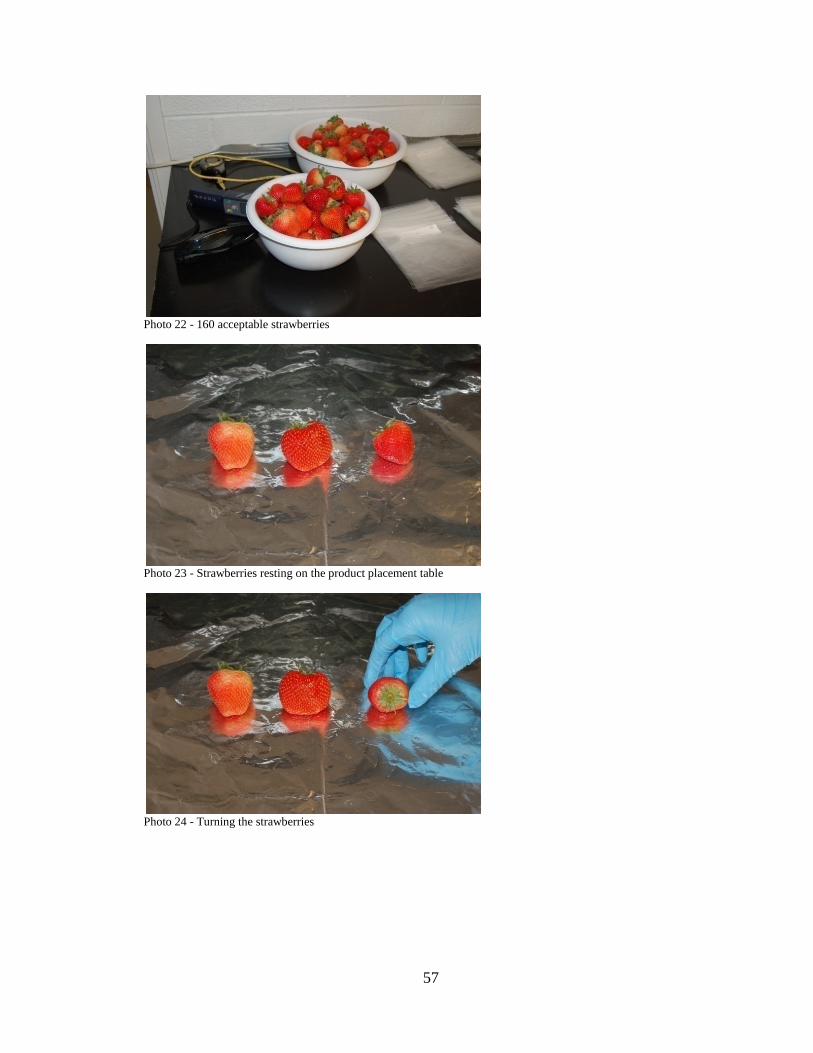
57
Photo 22 - 160 acceptable strawberries
Photo 23 - Strawberries resting on the product placement table
Photo 24 - Turning the strawberries
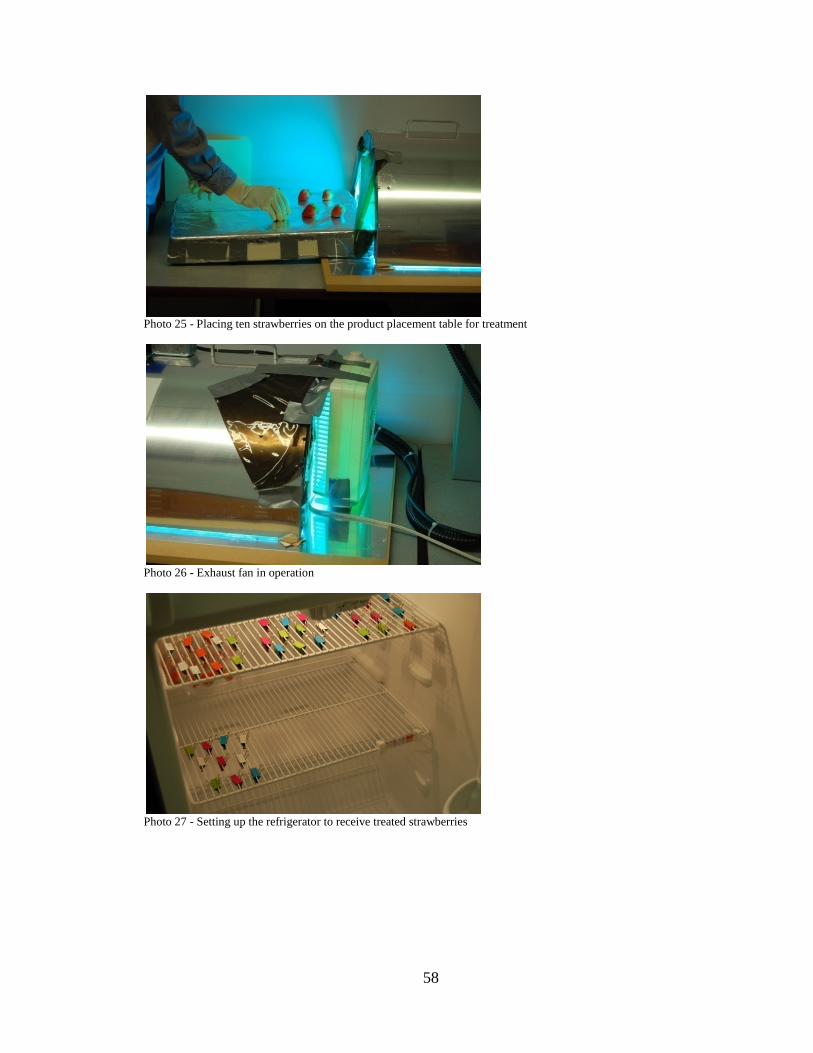
58
Photo 25 - Placing ten strawberries on the product placement table for treatment
Photo 26 - Exhaust fan in operation
Photo 27 - Setting up the refrigerator to receive treated strawberries
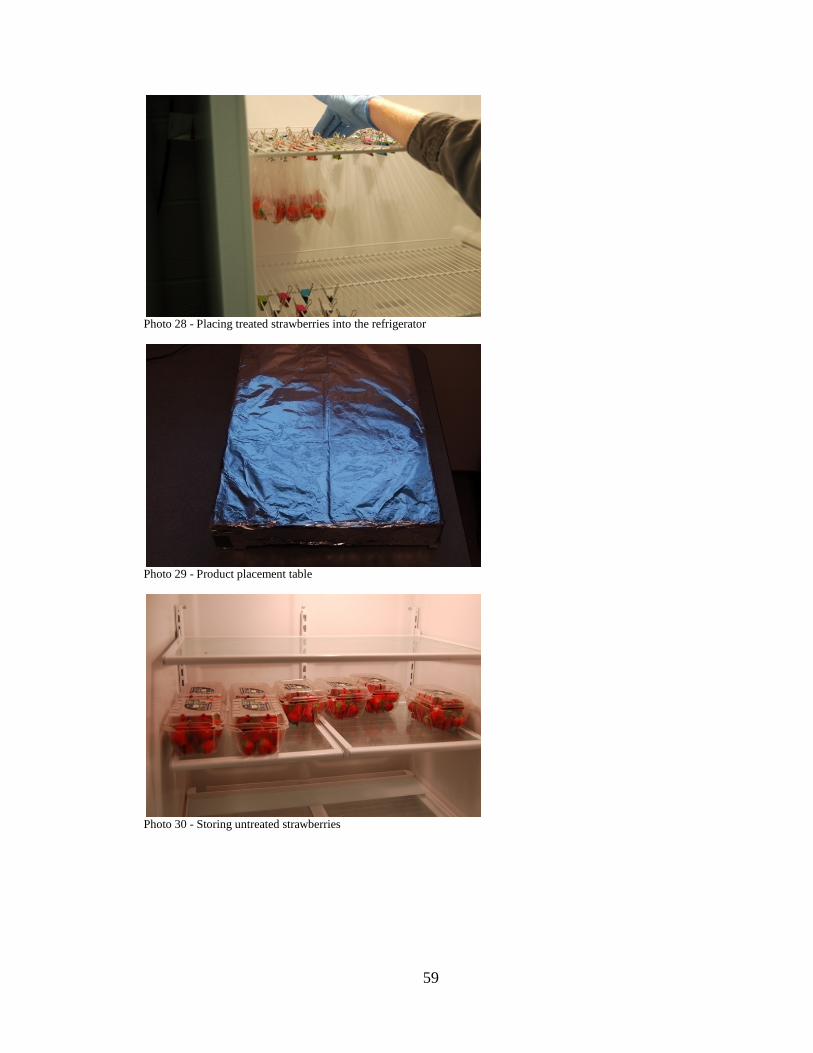
59
Photo 28 - Placing treated strawberries into the refrigerator
Photo 29 - Product placement table
Photo 30 - Storing untreated strawberries
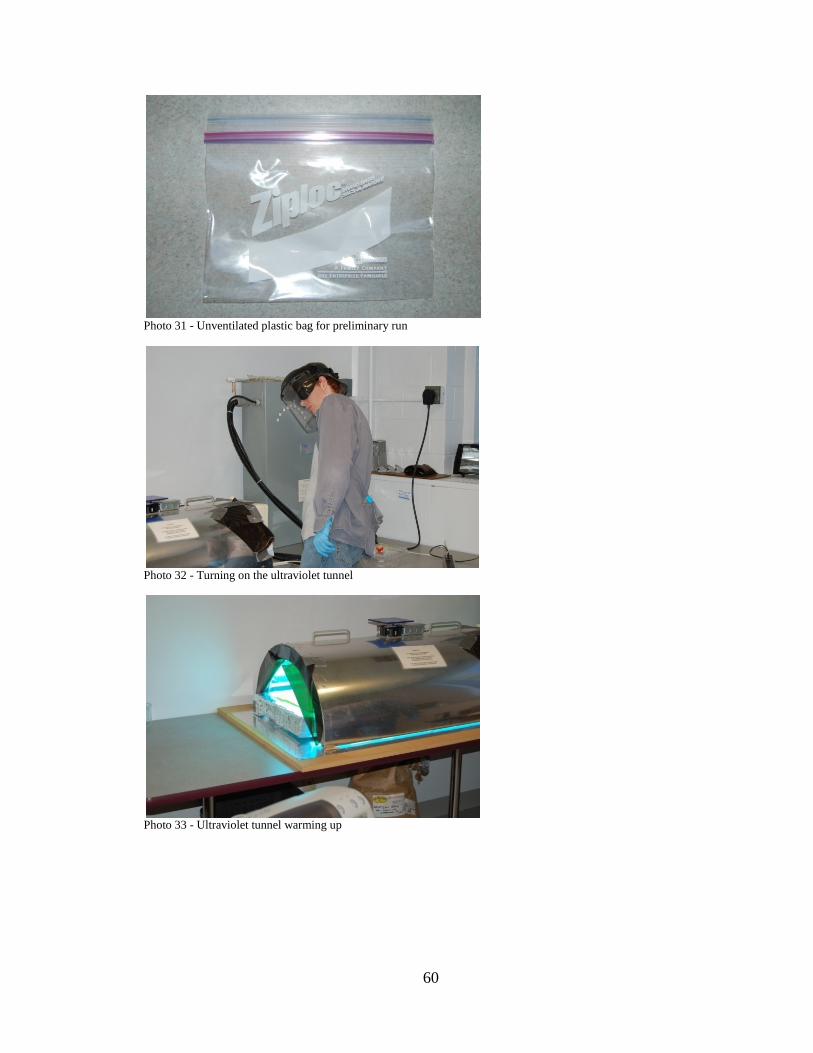
60
Photo 31 - Unventilated plastic bag for preliminary run
Photo 32 - Turning on the ultraviolet tunnel
Photo 33 - Ultraviolet tunnel warming up
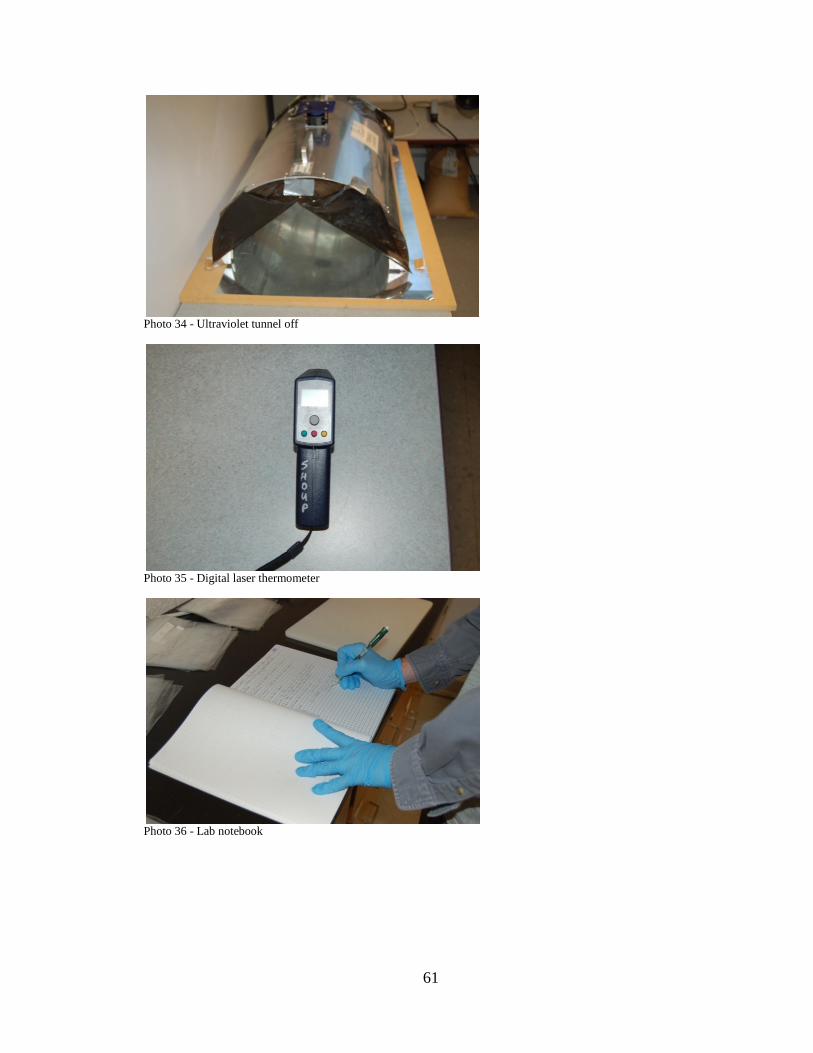
61
Photo 34 - Ultraviolet tunnel off
Photo 35 - Digital laser thermometer
Photo 36 - Lab notebook
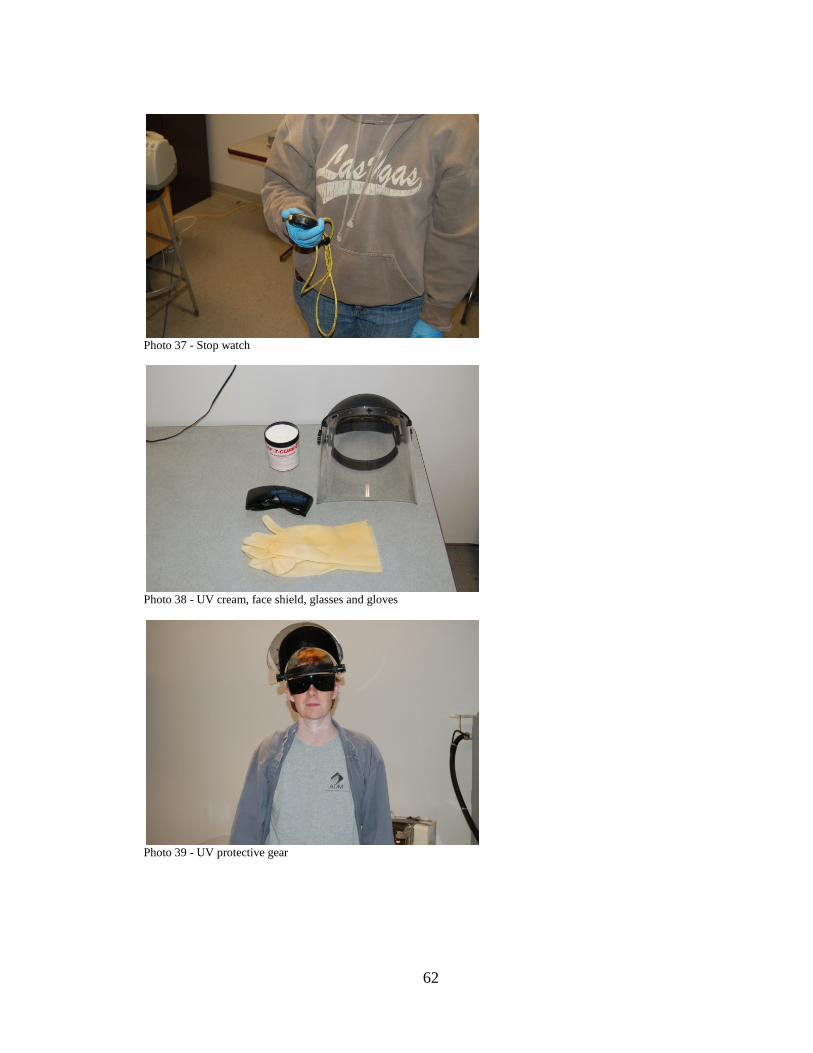
62
Photo 37 - Stop watch
Photo 38 - UV cream, face shield, glasses and gloves
Photo 39 - UV protective gear
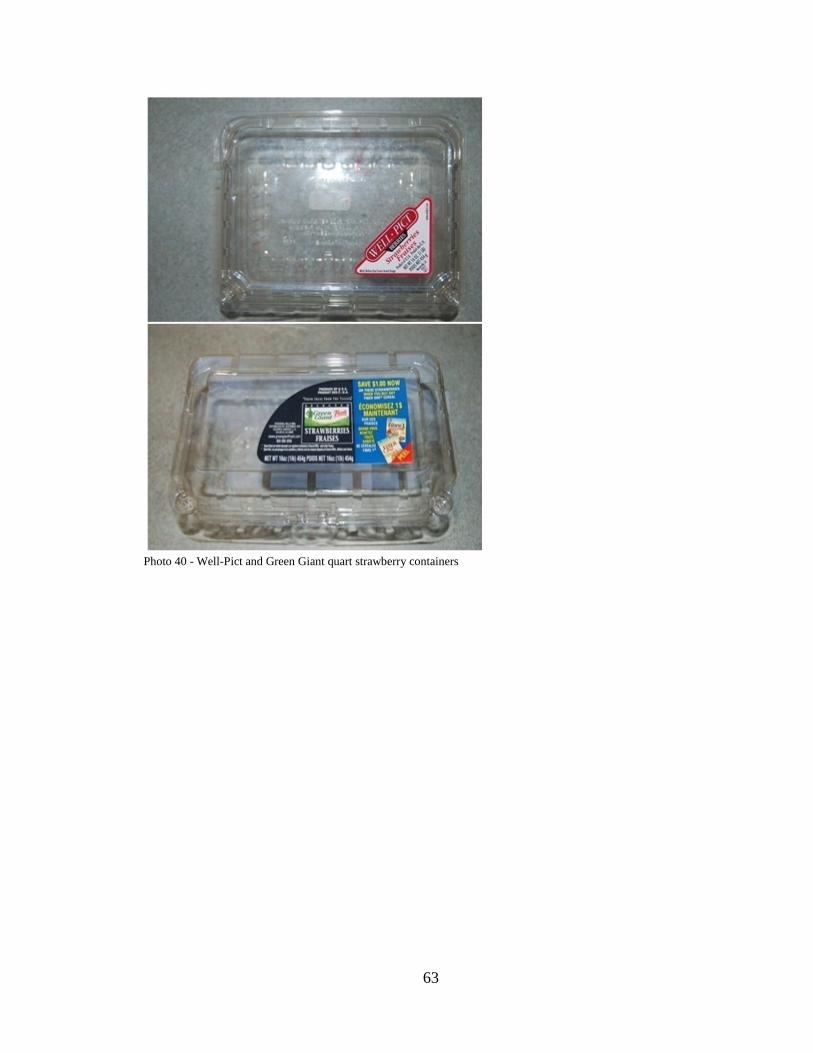
63
Photo 40 - Well-Pict and Green Giant quart strawberry containers
64
APPENDIX G
LAB NOTES 5-8-08
• Kill Bacteria with 254 nanometer wave length • Every light tube emits different amounts of energy • Keep heat to a minimum in tunnel • Step up intensity of UV range that is effective • Bounce waves of UV light • Use multiple replications to provide for statistics • UV cannot overcome chemical breakdown, can help keep surface bacteria low • Refrigerator temperature zones – coordinate temperatures to around 37 degrees F.
o Use two new refrigerators • Rinse with de-ionized water, may wash with tap water
End of Day
5-19-08
• Searching www.highbeam.com for articles • Typing out a list of related articles form Willie’s Thesis • See document titles “May” for an electronic version performed in the Ag
Building. End of Day 5-20-08
• Started cleaning out UV lab in Lindrgren today • Re-organized and restructured various parts of the lab • Started to sanitize some equipment as well as desk surfaces
End of Day 5-21-08
• Started printing out articles to review • Started reading “Food Irradiation – A sourcebook”
End of Day 5-28-08
• Have spent last few days working on Lit Review • Performed Equipment list check for Ag Dept
o Printer DeskJet 970CSE HP
65
o Monitor 18” Flat Panel o UV Tunnel
• All of these were accounted for End of Day 5-29-08
• Searched Morris Library and I-Share for Irradiation articles • Requested several books
End of Day 6-4-08
• Spent Monday 6-2-08 and Tuesday 6-3-08 thumbing through 2 lit review articles (books) from the library
o 2000 – Food Irradiation: Available Research Indicates that Benefits Outweigh Risks: Report to Congressional Requesters.
o 1967-1971 Food Irradiation • Also spent 5 hours on Wed Evening typing important details into an outline.
There will be a printed copy in the Carbon Copy File End of Day 6-21-08
• Spent a few hours cleaning and setting up the lab • Spent the last two weeks outlining books and articles • Also picked up mail and list of articles to research • Did not find any strawberries at Carbondale Farmer’s Market
List from Dr. Shoup
General Title • Ultraviolet Treatment of Fresh Strawberries
Areas of Lit Review
• Discuss Strawberries in Storage and transport • Senescence of Strawberries • Preservation techniques for fresh strawberries • UV principles • UV tunnels and application equipment • Alternative products for U.V. treated berries
Committee
• Shoup – Chair • Walters
66
• Albers • ??? Nutrition and Dietetics
Possible Objectives
• What produces spores and what does not produce spores among Yeasts, Molds and Bacteria
• Make lists of common yeasts, molds and bacteria on strawberries • What can be killed at:
o Easily o Moderately o hard to kill o Not at all
End of Day 6-23-08 Lab Training: Preliminary Data – Strawberries Occupants in Lab - Dr. Shoup, Chris Carpenter Lab Temp: 72 degrees F
• Turn on tunnel with apple or test fruit inside to gain a constant temperature • Turn fan onto desired setting (Low or High) • Make sure all lamps are on • Sort berries in approximate size, shape and damage • “It’s hard to find flawless berries.” – Shoup • Tomato in tunnel =
o 76 F measured on top or crown of tomato o 79 F measured on bottom of fruit
• 30 seconds to sterilize bags and cardboard • 3 or 4 berries in control • Times to test: 15, 30, 45, 60, 75, 90, 105, 120, 180, 240 • Use stopwatch
End of Day 6-24-08 Start at 10 AM Preliminary Lab Test
• 10 lab tests and one control, each tested for the time listed above. • These tests will be timed and carried out using Dr. Shoup’s U.V. tunnel. The
tested berries will then be placed in pre-marked, sterile, double seal Ziploc, pint bags and hung in a refrigerator.
• Strawberries were bough on 6-23-08 • Fan Speed set to high
67
• Used a class flask to hold down a corner of the plastic bags on each side to sterilize them.
• The run end time = 12 Noon • Bags are in the fridge
End of Day
6-25-08 • Checked strawberries, all seem OK. I will check later.
End of Day 6-27-08
• Checked on the strawberries today at 2:30 PM • No signs are visible yet of any mold, yeast or bacterial growth. • NOTE: I am not using a microscope yet. I will examine samples more closely
after the control berry starts to show symptoms. End of Day 6-30-08 9PM
• Checked berries. Still no sign of deterioration or spoilage. • Typed “Carbon Copy Prints” into the computer (Lindergren) to keep an electronic
copy of ‘legible’ notes in the lab. • Typed on the “Food Irradiation Outline” • Finished typing in the chronological list of important dates and events about food
irradiation. End of Day 1AM 7-2-08 10PM
• Day eight of strawberry experiment. • Still no signs of decay • In other news, I have left the ‘non-acceptable’ berries in the other refrigerator in a
plastic bag that is open and there is no sign of deterioration yet either. • Worked on the outline some more
End of day 7-4-08
• No change in test berries • Control berry is starting to darken in color
End of Day
68
7-6-08 • Berry coloring; Light = 1, Dark = 10 • Strawberry diagram: Crown = Green leafy stuff, Top = Top upper side of berry,
Middle = Middle of the berry, Bottom = Bottom of berry • Control berry is still dark • 15 sec berry is still dark on just the top portion • 60 second berry is darkening on the bottom • 90 second berry is darkening on top • 120 second berry is darkening on top and showing signs of tanish depression with
a diameter of ½ cm. • 240 has tanish depression on the middle of the berry • Continued to work on Lit Review
End of Day 7-8-08
• Came in today to work on the outline • Data for today’s strawberry observation are on the next page • Control – dark on middle and top • 15 – dark on top • 30 - dark on top • 45 – ok • 60 – Really dark on bottom with white mold on bottom tip • 75 - darker throughout • 90 - really dark throughout on one side • 105 – ok • 120 – Tan spot is about 1 cm in size • 180 – ok • 240 – tan on one side – 2 cm in size
End of Day 7-9-08
• Control – Dark, small tanish spot on middle on one side 1/3 cm • 15 – darker on top • 30 - slightly dark throughout • 45 – ok • 60 – mold is spreading from bottom to middle • 75 – darker throughout • 90 – tanish throughout top • 105 – ok • 120 – 2 tanish spots on top on one side • 180 – tanish on top, one side • 240 – tanish on one side, soft red tissue on other
69
End of Day 7-10-08
• Control – tanish spot 1/3 cm and on one side • 15 – dark on top • 30 – unchanged • 45 – unchanged • 60 – mold is spreading to top • 75 – darker • 90 – tanish all the way around top • 105 – unchanged • 120 – tanish on one side • 180 – tanish on one side • 240 – dark tanish on one side, white spot on middle of tanish region
End of Day 7-12-08
• Control – unchanged • 15 – unchanged • 30 – unchanged • 45 – unchanged • 60 – leakage is occurring • 75 – unchanged • 90 – leakage is occurring • 105 – small green spot has appeared the size of a seed on middle • 120 – mold has appeared at crown on top of the berry and is spreading, also some
leakage has appeared • 180 – leakage • 240 – leakage End of Day 7-14-08 10 PM • Control – tanish spot, darker • 15 – top dark • 30 – unchanged • 45 – unchanged • 60 – tan, darkened, soft • 75 – unchanged • 90 – dark tan middle through crown • 105 – unchanged • 120 – unchanged
70
• 180 – unchanged • 240 – mold starting on tanish dark side Continued to work on outline. End of Day 7-23-08 9 PM • Control – spoiled, tanish dark and moldy • 15 – spoiled, tanish, dark, moldy • 30 – ok • 45 – ok • 60 – spoiled • 75 – ok • 90 – spoiled • 105 – unchanged • 120 – spoiled • 180 –seeds are dark, green spots on red flesh, looks fairly ok • 240 – spoiled End of Day 7-30-08 • 30 – unchanged • 45 – unchanged • 75 – unchanged • 105 – unchanged End of Day 8-11-08 Day 49 Dr. Shoup decided today was the day to end the preliminary test group. 3 test groups were still in relatively good condition. These were the 30 sec, 45 sec, and 75 sec test groups. I took pictures of all of the berries as well as cut berries (cross sections) for the 3 test groups of 30, 45 and 75. I also performed a taste test of those 3 berry groups. Taste test results: 1=Bad, 10=Good
71
30 sec = slight off taste, 8 45 sec = slight off taste, 7 75 sec = slight off taste, 9 These 3 berries were still as firm as the day I tested them. Possible off taste causes other than spoilage could be due to a lack of a box of Baking Soda in the refrigerator. End of Day
8-25-08 Cleaned lab, bought 48 lbs of Strawberries from Aldies 2 Brands – Green Giant and Well Pict
Sorted the boxes for usable berries, about 7.5 pints of 48 pints were deemed usable. Typed up lab protocol for tests.
End of Day 8-27-08 Test day. All berries rotted in fridge. End of Day 9-17-08 Test Day. Persons in Lab: Dr. Shoup, Chris Carpenter, Kyndall Overton Bought 24 quarts of Driscoll’s Strawberries from Schnucks for $5.99 / Quart Placed Berries in Left new Refrigerator before testing and sorting. Lab has been cleaned.
Plastic Ziploc bags have had holes cut in them for ventilation purposes. Bags with berries will be placed in the refrigerator once tested. 1 Berry per bag. Bags are labeled with today’s date on it as well as the test duration.
Test Groups: 20 Berries per group Control Room Temp = 66 degrees F
72
15 30 Changes to Methods: Will not sterilize the bags for this 45 test run as Dr. Shoup suggested 60 75 U.V. Tunnel Temp: 76 degrees F. 90 Time 2:55 PM
Strawberries are tested and in the fridge by 5:30 PM End of Day
9-19-08 All berries are ok. Top Rack berries are 37 degrees F. Bottom Rack berries are 34 degrees F. End of Day
9-21-08 Day 4 Checked berries today, all seem ok. Top 35° F Bottom 33° F End of Day 9-22-08 Day 5 Checked berries, all seem ok. Top 34° F Bottom 32-33° F Room Temp 67° F Increased thermostat in Refrigerator so interior temp will raise slightly. End of Day 9-23-08 Day 6
73
Checked the berries, all seem ok. Some are starting to drop their seeds. Top 38° F Bottom 36° F End of Day 9-24-08 Day 7 Berries seem to be ok. Top 33° F Bottom 32° F End of Day 9-25-08 Day 8 Berries seem to be ok. Top 34° F Bottom 32° F End of Day 9-26-08 Day 9
Berries are ok. Caps are starting to wilt. Made moderate or slight change to thermostat to raise temp. Top 34° F Bottom 32° F End of Day 9-27-08 Day 10
74
Berries are darkening I hypothesize that I will start pulling berries tomorrow due to rot. Top 36° F Bottom 34° F End of Day 9-28-08 Day 11 Berries seem unchanged, some dark spots occurring Top 35° F Bottom 34° F End of Day 9-29-08 Day 12 Berries are darkening but still seem to be marketable. No temp reading today. End of Day 9-30-08 Day 13 Berries pulled: Group - Berry # 90-20 White/Gray mold under cap, tanish flesh under cap, darkening of flesh 30-19 White/Gray mold under cap, tanish flesh under cap, darkening of berry Berry temps ranged from 27-41 as soon as I opened the door. This is a big concern! End of Day 10-1-08

75
Day 14 Replaced the battery in the temperature gauge. Berry temp Top: 36° F, Bottom 34° F Results on Next page
Wed. 10-1-08 Day 14
Control 15 30 45 60 75 90
5 Good 19 Good Good 19 Good 10 Good 6 Good 10 Good 8 OK 1 OK 19 OK 1 OK 9 OK 9 OK 8 OK 7 Bad Bad 1 Bad Bad 1 Bad 5 Bad 2 Bad
Out Out Out Out Out Out Out
Placed Bad berries in a different refrigerator so not to contaminant good or marginal berries. End of Day 10-2-08 Day 15 Test Fridge: 33 / 31 Bad Fridge: 35 / 34 Re-adjusted the thermostat again in the good fridge.
Thurs 10-2-08 Day 15
Control 15 30 45 60 75 90 0 Good 12 Good 6 Good 10 Good 5 Good 6 Good 6 Good 9 OK 5 OK 10 OK 9 OK 14 OK 9 OK 11 OK 4 Bad 2 Bad 3 Bad 1 Bad 0 Bad 0 Bad 0 Bad 7 Out 1 Out 1 Out Out 1 Out 5 Out 2 Out
Overall: More berries seem to have skin lesion, this could be due to freezing. End of day 10-3-08 Day 16 Good Fridge: 36/34 Bad Fridge: 34

76
Friday 10-3-08 Day 16
Control 15 30 45 60 75 90 1 Good 8 Good 4 Good 4 Good 6 Good 4 Good 4 Good 6 OK 8 OK 11 OK 14 OK 13 OK 11 OK 13 OK 2 Bad 1 Bad 1 Bad 1 Bad 0 Bad 1 Bad 6 Bad
11 Out 3 Out 4 Out 1 Out 1 Out 5 Out 3 Out
Berries with skin lesions but without cell leakage automatically go into Marginal. Marginal contains berries that are still marketable and contain a low percentage of blemishes to the total surface area. End of Day 10-4-08 Day 17 Good fridge temp: 31 / 30 Bad fridge temp: 35 / 35 / 35
Sat 10-4-08 Day 17
Control 15 30 45 60 75 90 1 Good 8 Good 3 Good 3 Good 1 Good 2 Good 3 Good 3 OK 8 OK 8 OK 13 OK 16 OK 9 OK 11 OK 3 Bad 0 Bad 4 Bad 2 Bad 2 Bad 3 Bad 3 Bad
13 Out 4 Out 5 Out 2 Out 1 Out 6 Out 3 Out
Adjusted thermostat again to raise temp. All berries today were counted as ‘bad’ were due to skin lesions. End of Day 10-5-08 Day 18 Good Fridge: 33 / 32 Bad Fridge: 35 / 35 / 34
Sun 10-5-08 Day 18
Control 15 30 45 60 75 90
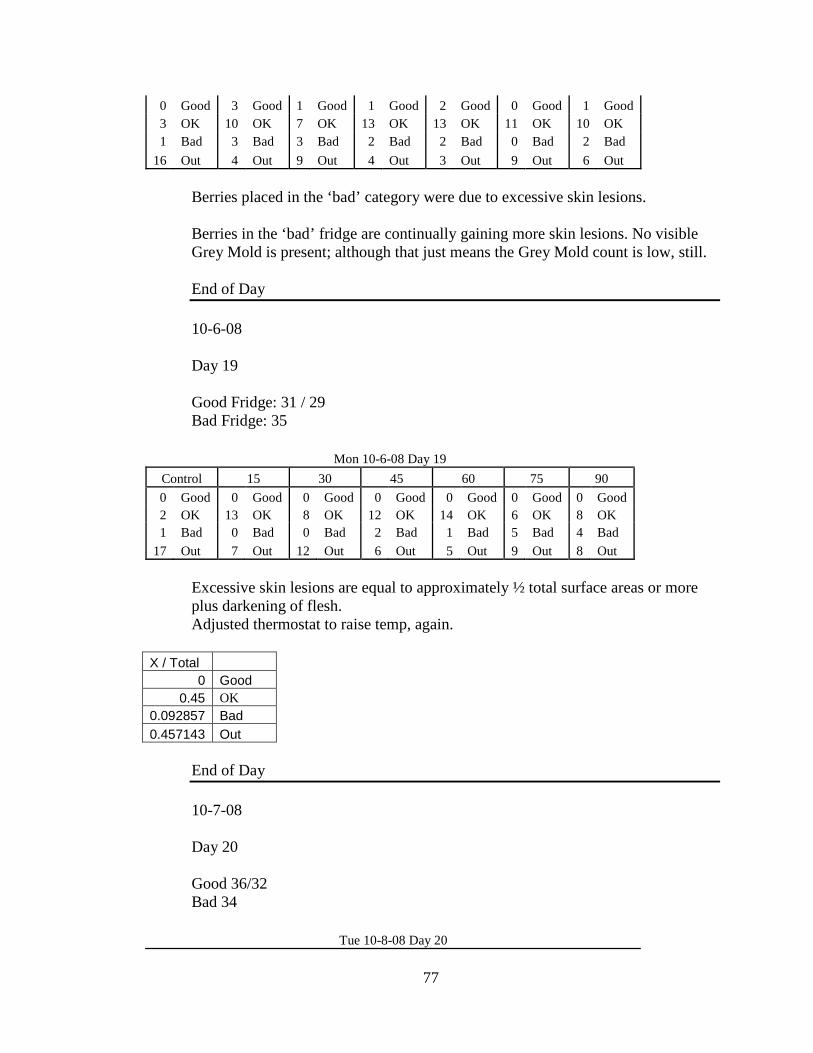
77
0 Good 3 Good 1 Good 1 Good 2 Good 0 Good 1 Good 3 OK 10 OK 7 OK 13 OK 13 OK 11 OK 10 OK 1 Bad 3 Bad 3 Bad 2 Bad 2 Bad 0 Bad 2 Bad
16 Out 4 Out 9 Out 4 Out 3 Out 9 Out 6 Out
Berries placed in the ‘bad’ category were due to excessive skin lesions. Berries in the ‘bad’ fridge are continually gaining more skin lesions. No visible Grey Mold is present; although that just means the Grey Mold count is low, still. End of Day 10-6-08 Day 19 Good Fridge: 31 / 29 Bad Fridge: 35
Mon 10-6-08 Day 19
Control 15 30 45 60 75 90
0 Good 0 Good 0 Good 0 Good 0 Good 0 Good 0 Good 2 OK 13 OK 8 OK 12 OK 14 OK 6 OK 8 OK 1 Bad 0 Bad 0 Bad 2 Bad 1 Bad 5 Bad 4 Bad
17 Out 7 Out 12 Out 6 Out 5 Out 9 Out 8 Out
Excessive skin lesions are equal to approximately ½ total surface areas or more plus darkening of flesh. Adjusted thermostat to raise temp, again.
X / Total 0 Good
0.45 OK 0.092857 Bad 0.457143 Out
End of Day 10-7-08 Day 20 Good 36/32 Bad 34
Tue 10-8-08 Day 20
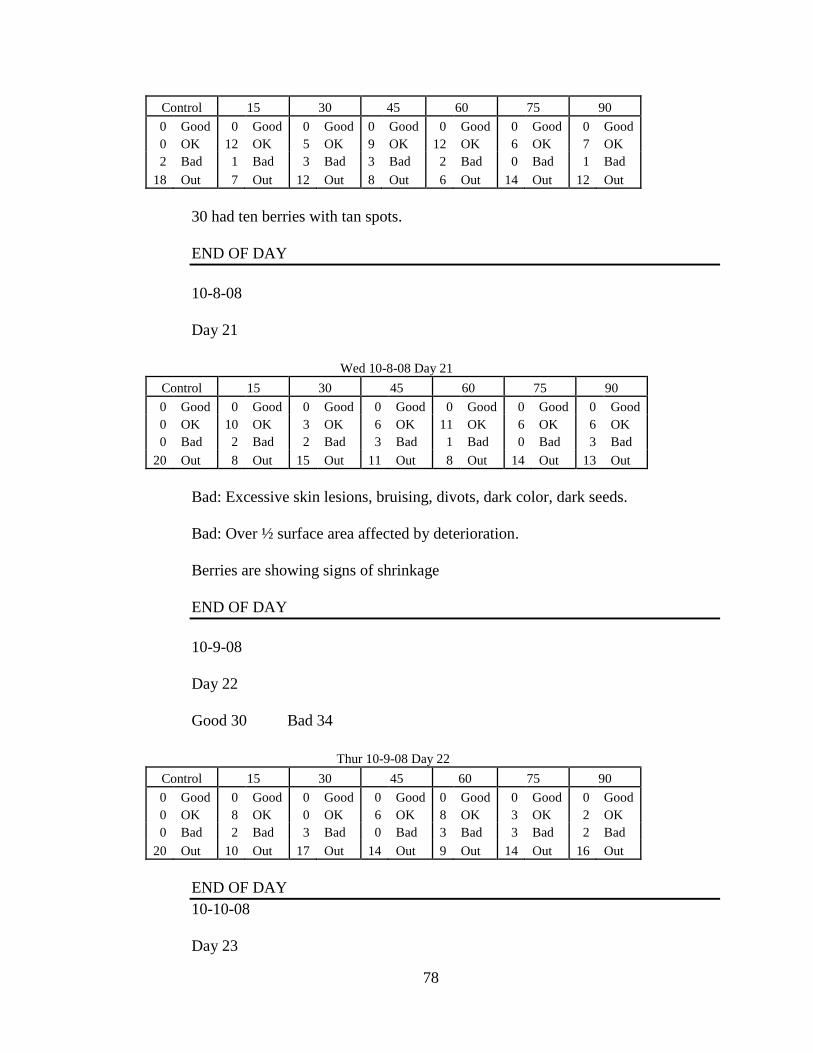
78
Control 15 30 45 60 75 90
0 Good 0 Good 0 Good 0 Good 0 Good 0 Good 0 Good 0 OK 12 OK 5 OK 9 OK 12 OK 6 OK 7 OK 2 Bad 1 Bad 3 Bad 3 Bad 2 Bad 0 Bad 1 Bad
18 Out 7 Out 12 Out 8 Out 6 Out 14 Out 12 Out
30 had ten berries with tan spots. END OF DAY 10-8-08 Day 21
Wed 10-8-08 Day 21
Control 15 30 45 60 75 90
0 Good 0 Good 0 Good 0 Good 0 Good 0 Good 0 Good 0 OK 10 OK 3 OK 6 OK 11 OK 6 OK 6 OK 0 Bad 2 Bad 2 Bad 3 Bad 1 Bad 0 Bad 3 Bad
20 Out 8 Out 15 Out 11 Out 8 Out 14 Out 13 Out
Bad: Excessive skin lesions, bruising, divots, dark color, dark seeds. Bad: Over ½ surface area affected by deterioration. Berries are showing signs of shrinkage END OF DAY 10-9-08 Day 22 Good 30 Bad 34
Thur 10-9-08 Day 22
Control 15 30 45 60 75 90
0 Good 0 Good 0 Good 0 Good 0 Good 0 Good 0 Good 0 OK 8 OK 0 OK 6 OK 8 OK 3 OK 2 OK 0 Bad 2 Bad 3 Bad 0 Bad 3 Bad 3 Bad 2 Bad
20 Out 10 Out 17 Out 14 Out 9 Out 14 Out 16 Out
END OF DAY 10-10-08 Day 23

79
Good 37
Fri 10-10-08 Day 23
Control 15 30 45 60 75 90
0 Good 0 Good 0 Good 0 Good 0 Good 0 Good 0 Good 0 OK 5 OK 0 OK 3 OK 3 OK 1 OK 2 OK 0 Bad 3 Bad 0 Bad 3 Bad 5 Bad 2 Bad 0 Bad
20 Out 12 Out 20 Out 14 Out 12 Out 17 Out 18 Out
Power was cut to the lab due to construction next door. The power was off for an undisclosed amount of time. Bad Fridge continues to not have power Computer does not have power. END OF DAY 10-11-08 Good 31 Bad 65
Sat 10-11-08 Day 24
Control 15 30 45 60 75 90
0 Good 0 Good 0 Good 0 Good 0 Good 0 Good 0 Good 0 OK 5 OK 0 OK 3 OK 2 OK 1 OK 2 OK 0 Bad 0 Bad 0 Bad 0 Bad 1 Bad 0 Bad 0 Bad
20 Out 15 Out 20 Out 17 Out 17 Out 19 Out 18 Out
END OF DAY 10-12-08
Sun 10-12-08 Day 25
Control 15 30 45 60 75 90
0 Good 0 Good 0 Good 0 Good 0 Good 0 Good 0 Good 0 OK 5 OK 0 OK 3 OK 2 OK 1 OK 1 OK 0 Bad 0 Bad 0 Bad 0 Bad 0 Bad 0 Bad 1 Bad
20 Out 15 Out 20 Out 17 Out 18 Out 19 Out 18 Out
Bad Fridge 76 – Mold is prevalent Good Fridge 34 END OF DAY 10-13-08 Good 32 Bad 74

80
Mon 10-13-08 Day 26
Control 15 30 45 60 75 90
0 Good 0 Good 0 Good 0 Good 0 Good 0 Good 0 Good 0 OK 5 OK 0 OK 3 OK 2 OK 1 OK 1 OK 0 Bad 0 Bad 0 Bad 0 Bad 0 Bad 0 Bad 0 Bad
20 Out 15 Out 20 Out 17 Out 18 Out 19 Out 19 Out
END OF DAY 10-14-08 Power is back on in the lab today.
Tues 10-14-08 Day 27
Control 15 30 45 60 75 90
0 Good 0 Good 0 Good 0 Good 0 Good 0 Good 0 Good 0 OK 4 OK 0 OK 2 OK 2 OK 1 OK 1 OK 0 Bad 1 Bad 0 Bad 1 Bad 0 Bad 0 Bad 0 Bad
20 Out 15 Out 20 Out 17 Out 18 Out 19 Out 19 Out
END OF DAY 10-15-08
Wed 10-15-08 Day 28
Control 15 30 45 60 75 90
0 Good 0 Good 0 Good 0 Good 0 Good 0 Good 0 Good 0 OK 3 OK 0 OK 2 OK 2 OK 1 OK 1 OK 0 Bad 1 Bad 0 Bad 0 Bad 0 Bad 0 Bad 0 Bad
20 Out 16 Out 20 Out 18 Out 18 Out 19 Out 19 Out
END OF DAY 10-16-08
Thurs 10-16-08 Day 29
Control 15 30 45 60 75 90
0 Good 0 Good 0 Good 0 Good 0 Good 0 Good 0 Good 0 OK 2 OK 0 OK 2 OK 2 OK 1 OK 1 OK 0 Bad 1 Bad 0 Bad 0 Bad 0 Bad 0 Bad 0 Bad
20 Out 17 Out 20 Out 18 Out 18 Out 19 Out 19 Out
END OF DAY

81
10-17-08
Fri 10-17-08 Day 30
Control 15 30 45 60 75 90
0 Good 0 Good 0 Good 0 Good 0 Good 0 Good 0 Good 0 OK 1 OK 0 OK 1 OK 2 OK 1 OK 1 OK 0 Bad 1 Bad 0 Bad 1 Bad 0 Bad 0 Bad 0 Bad
20 Out 18 Out 20 Out 18 Out 18 Out 19 Out 19 Out
END OF DAY 10-18-08
Sat 10-18-08 Day 31
Control 15 30 45 60 75 90
0 Good 0 Good 0 Good 0 Good 0 Good 0 Good 0 Good 0 OK 1 OK 0 OK 1 OK 2 OK 1 OK 1 OK 0 Bad 0 Bad 0 Bad 0 Bad 0 Bad 0 Bad 0 Bad
20 Out 19 Out 20 Out 19 Out 18 Out 19 Out 19 Out
END OF DAY 10-19-08
Sun 10-19-08 Day 32
Control 15 30 45 60 75 90
0 Good 0 Good 0 Good 0 Good 0 Good 0 Good 0 Good 0 OK 0 OK 0 OK 1 OK 2 OK 0 OK 0 OK 0 Bad 1 Bad 0 Bad 0 Bad 0 Bad 1 Bad 1 Bad
20 Out 19 Out 20 Out 19 Out 18 Out 19 Out 19 Out
END OF DAY 10-20-08
Mon 10-20-08 Day 33
Control 15 30 45 60 75 90
0 Good 0 Good 0 Good 0 Good 0 Good 0 Good 0 Good 0 OK 0 OK 0 OK 1 OK 1 OK 0 OK 0 OK 0 Bad 0 Bad 0 Bad 0 Bad 1 Bad 0 Bad 0 Bad
20 Out 20 Out 20 Out 19 Out 18 Out 20 Out 120 Out
END OF DAY 10-21-08
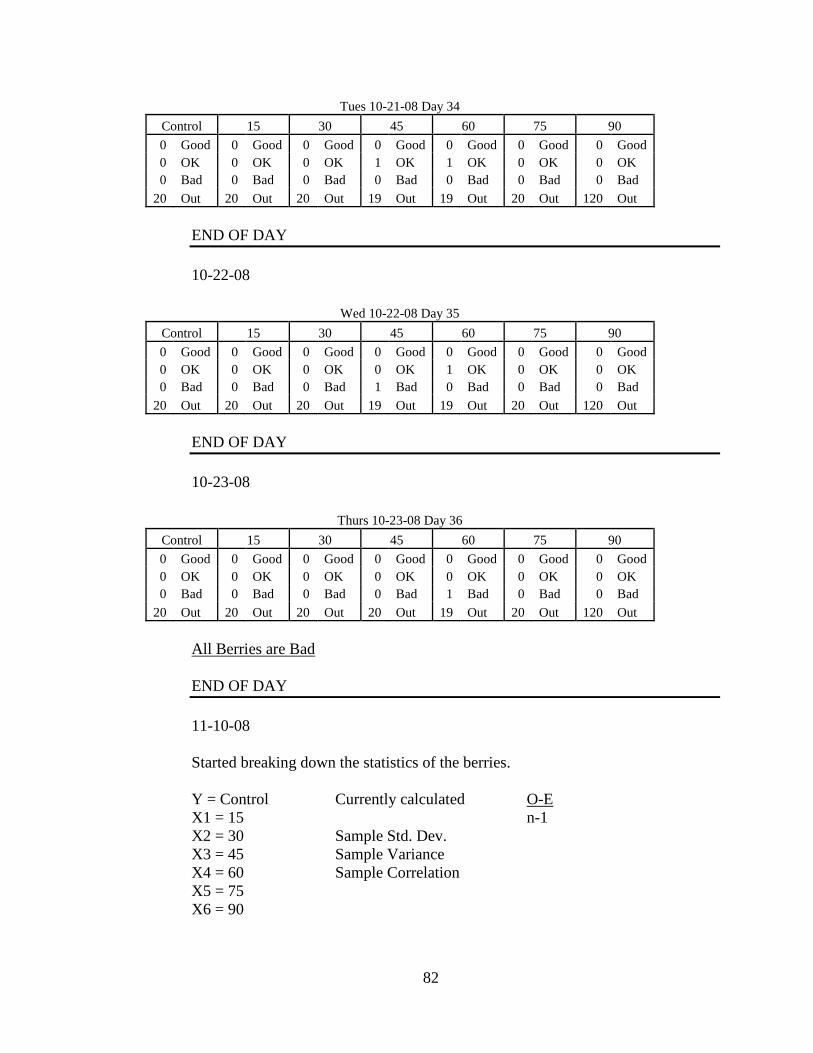
82
Tues 10-21-08 Day 34
Control 15 30 45 60 75 90
0 Good 0 Good 0 Good 0 Good 0 Good 0 Good 0 Good 0 OK 0 OK 0 OK 1 OK 1 OK 0 OK 0 OK 0 Bad 0 Bad 0 Bad 0 Bad 0 Bad 0 Bad 0 Bad
20 Out 20 Out 20 Out 19 Out 19 Out 20 Out 120 Out
END OF DAY 10-22-08
Wed 10-22-08 Day 35
Control 15 30 45 60 75 90
0 Good 0 Good 0 Good 0 Good 0 Good 0 Good 0 Good 0 OK 0 OK 0 OK 0 OK 1 OK 0 OK 0 OK 0 Bad 0 Bad 0 Bad 1 Bad 0 Bad 0 Bad 0 Bad
20 Out 20 Out 20 Out 19 Out 19 Out 20 Out 120 Out
END OF DAY 10-23-08
Thurs 10-23-08 Day 36
Control 15 30 45 60 75 90
0 Good 0 Good 0 Good 0 Good 0 Good 0 Good 0 Good 0 OK 0 OK 0 OK 0 OK 0 OK 0 OK 0 OK 0 Bad 0 Bad 0 Bad 0 Bad 1 Bad 0 Bad 0 Bad
20 Out 20 Out 20 Out 20 Out 19 Out 20 Out 120 Out
All Berries are Bad END OF DAY 11-10-08 Started breaking down the statistics of the berries. Y = Control Currently calculated O-E X1 = 15 n-1 X2 = 30 Sample Std. Dev. X3 = 45 Sample Variance X4 = 60 Sample Correlation X5 = 75 X6 = 90
83
END OF DAY 2-2-09 Introduction has been submitted to Dr. Shoup and corrected. Lit Review has been submitted to Dr. Shoup and I am currently waiting to hear back from him. Currently refining Methods and Procedures to submit next. END OF DAY
84
VITA
Graduate School Southern Illinois University
Christopher E. Carpenter Date of Birth: September 22, 1984 2006 West Woodriver Dr. Apt. 5, Carbondale, Illinois 62901 320 South Main Street, Ewing, Illinois 62836 [email protected] Southern Illinois University Carbondale Bachelor of Science, Agricultural Systems, May 2007 Thesis Title: IMPACT OF ULTRAVIOLET ENERGY ON STRAWBERRY SHELF LIFE Major Professor: Dr. W.D. Shoup