carnival corporation & plc -...
TRANSCRIPT
2004 Annual Report
C A R N I V A LCORPORATION & PLC
The Power of Our Global Brands
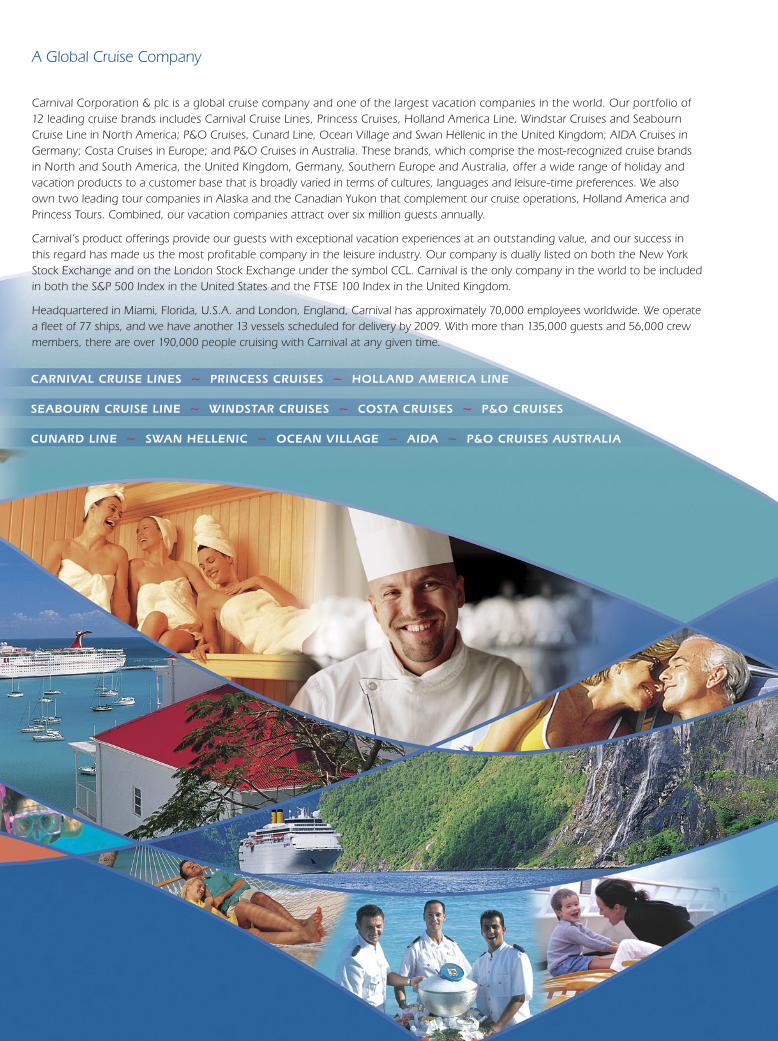
A Global Cruise Company
Carnival Corporation & plc is a global cruise company and one of the largest vacation companies in the world. Our portfolio of 12 leading cruise brands includes Carnival Cruise Lines, Princess Cruises, Holland America Line, Windstar Cruises and Seabourn Cruise Line in North America; P&O Cruises, Cunard Line, Ocean Village and Swan Hellenic in the United Kingdom; AIDA Cruises in Germany; Costa Cruises in Europe; and P&O Cruises in Australia. These brands, which comprise the most-recognized cruise brands in North and South America, the United Kingdom, Germany, Southern Europe and Australia, offer a wide range of holiday and vacation products to a customer base that is broadly varied in terms of cultures, languages and leisure-time preferences. We also own two leading tour companies in Alaska and the Canadian Yukon that complement our cruise operations, Holland America and Princess Tours. Combined, our vacation companies attract over six million guests annually.
Carnival’s product offerings provide our guests with exceptional vacation experiences at an outstanding value, and our success in this regard has made us the most profitable company in the leisure industry. Our company is dually listed on both the New York Stock Exchange and on the London Stock Exchange under the symbol CCL. Carnival is the only company in the world to be included in both the S&P 500 Index in the United States and the FTSE 100 Index in the United Kingdom.
Headquartered in Miami, Florida, U.S.A. and London, England, Carnival has approximately 70,000 employees worldwide. We operate a fleet of 77 ships, and we have another 13 vessels scheduled for delivery by 2009. With more than 135,000 guests and 56,000 crew members, there are over 190,000 people cruising with Carnival at any given time.
CARNIVAL CRUISE LINES ~ PRINCESS CRUISES ~ HOLLAND AMERICA LINE
SEABOURN CRUISE LINE ~ WINDSTAR CRUISES ~ COSTA CRUISES ~ P&O CRUISES
CUNARD LINE ~ SWAN HELLENIC ~ OCEAN VILLAGE ~ AIDA ~ P&O CRUISES AUSTRALIA
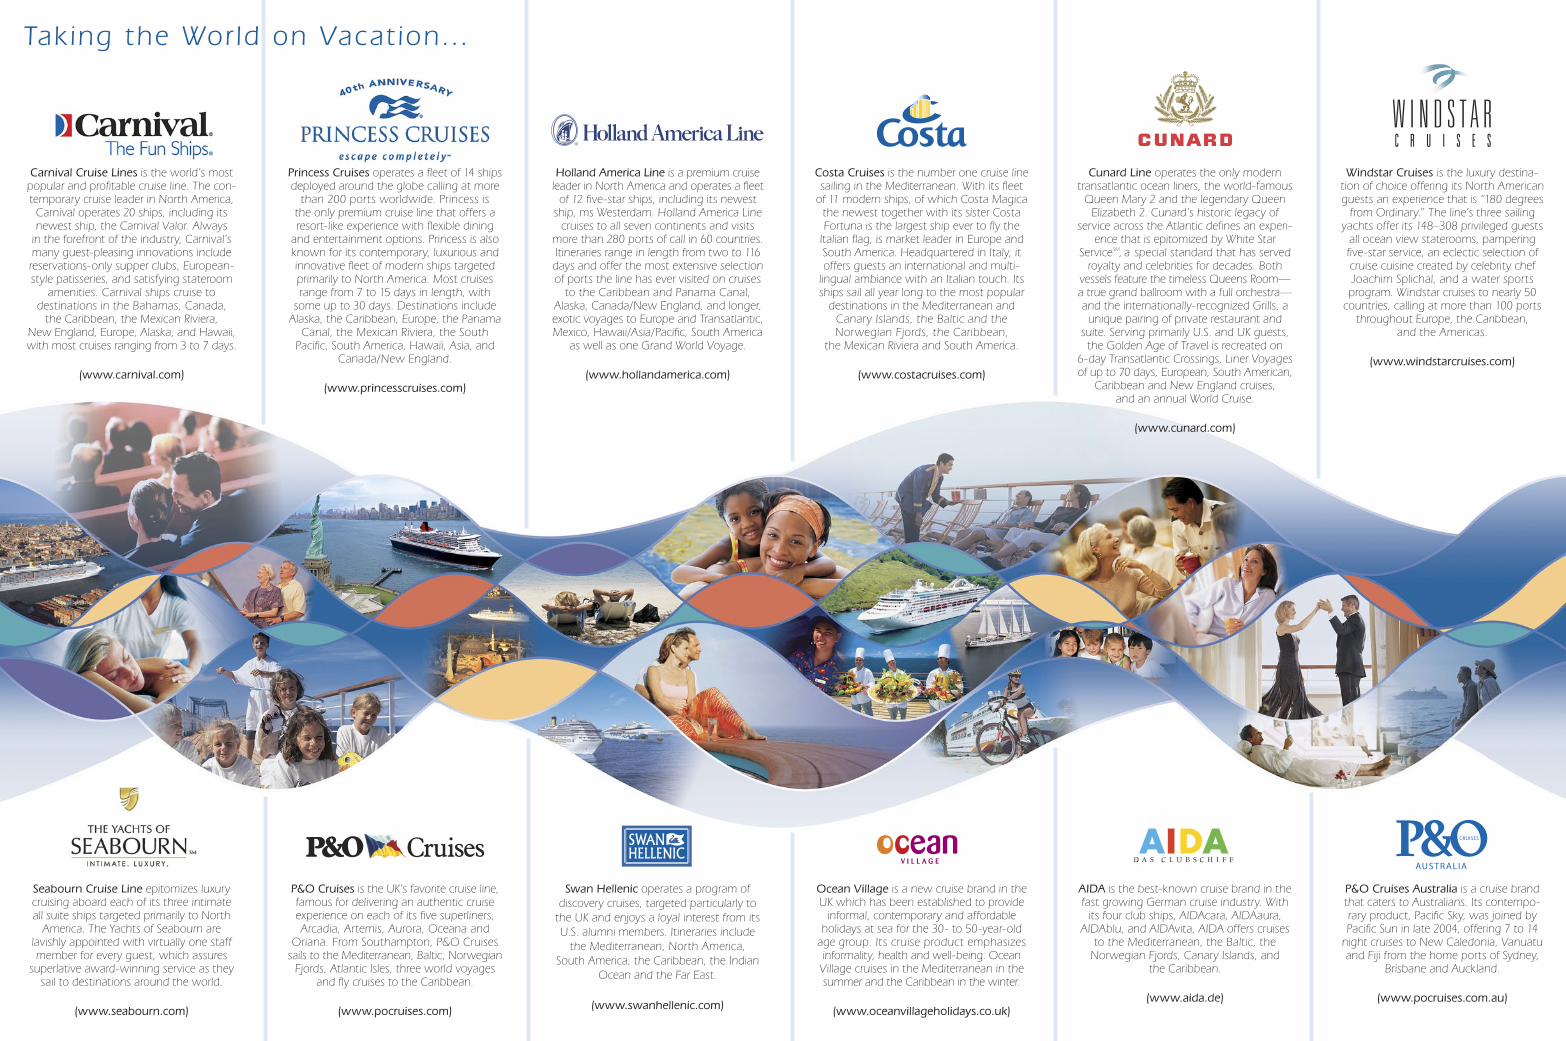
Tak ing the Wor ld on Vacat ion…
Carnival Cruise Lines is the world’s most popular and profitable cruise line. The con-temporary cruise leader in North America,
Carnival operates 20 ships, including its newest ship, the Carnival Valor. Always
in the forefront of the industry, Carnival’s many guest-pleasing innovations include reservations-only supper clubs, European-style patisseries, and satisfying stateroom
amenities. Carnival ships cruise to destinations in the Bahamas, Canada,
the Caribbean, the Mexican Riviera, New England, Europe, Alaska, and Hawaii, with most cruises ranging from 3 to 7 days.
(www.carnival.com)
Princess Cruises operates a fleet of 14 ships deployed around the globe calling at more
than 200 ports worldwide. Princess is the only premium cruise line that offers a resort-like experience with flexible dining
and entertainment options. Princess is also known for its contemporary, luxurious and innovative fleet of modern ships targeted primarily to North America. Most cruises range from 7 to 15 days in length, with
some up to 30 days. Destinations include Alaska, the Caribbean, Europe, the Panama
Canal, the Mexican Riviera, the South Pacific, South America, Hawaii, Asia, and
Canada/New England.
(www.princesscruises.com)
Holland America Line is a premium cruise leader in North America and operates a fleet
of 12 five-star ships, including its newest ship, ms Westerdam. Holland America Line
cruises to all seven continents and visits more than 280 ports of call in 60 countries. Itineraries range in length from two to 116 days and offer the most extensive selection of ports the line has ever visited on cruises
to the Caribbean and Panama Canal, Alaska, Canada/New England, and longer, exotic voyages to Europe and Transatlantic, Mexico, Hawaii/Asia/Pacific, South America
as well as one Grand World Voyage.
(www.hollandamerica.com)
Costa Cruises is the number one cruise line sailing in the Mediterranean. With its fleet
of 11 modern ships, of which Costa Magica the newest together with its sister Costa Fortuna is the largest ship ever to fly the
Italian flag, is market leader in Europe and South America. Headquartered in Italy, it offers guests an international and multi-
lingual ambiance with an Italian touch. Its ships sail all year long to the most popular
destinations in the Mediterranean and Canary Islands, the Baltic and the Norwegian Fjords, the Caribbean,
the Mexican Riviera and South America.
(www.costacruises.com)
Cunard Line operates the only modern transatlantic ocean liners, the world-famous
Queen Mary 2 and the legendary Queen Elizabeth 2. Cunard’s historic legacy of
service across the Atlantic defines an experi-ence that is epitomized by White Star
ServiceSM, a special standard that has served royalty and celebrities for decades. Both
vessels feature the timeless Queens Room— a true grand ballroom with a full orchestra— and the internationally-recognized Grills, a
unique pairing of private restaurant and suite. Serving primarily U.S. and UK guests,
the Golden Age of Travel is recreated on 6-day Transatlantic Crossings, Liner Voyages of up to 70 days, European, South American,
Caribbean and New England cruises, and an annual World Cruise.
(www.cunard.com)
Windstar Cruises is the luxury destina-tion of choice offering its North American guests an experience that is “180 degrees
from Ordinary.” The line’s three sailing yachts offer its 148–308 privileged guests
all ocean view staterooms, pampering five-star service, an eclectic selection of cruise cuisine created by celebrity chef Joachim Splichal, and a water sports program. Windstar cruises to nearly 50
countries, calling at more than 100 ports throughout Europe, the Caribbean,
and the Americas.
(www.windstarcruises.com)
Seabourn Cruise Line epitomizes luxury cruising aboard each of its three intimate all suite ships targeted primarily to North
America. The Yachts of Seabourn are lavishly appointed with virtually one staff member for every guest, which assures
superlative award-winning service as they sail to destinations around the world.
(www.seabourn.com)
P&O Cruises is the UK’s favorite cruise line, famous for delivering an authentic cruise experience on each of its five superliners, Arcadia, Artemis, Aurora, Oceana and
Oriana. From Southampton, P&O Cruises sails to the Mediterranean, Baltic, Norwegian
Fjords, Atlantic Isles, three world voyages and fly cruises to the Caribbean.
(www.pocruises.com)
Swan Hellenic operates a program of discovery cruises, targeted particularly to
the UK and enjoys a loyal interest from its U.S. alumni members. Itineraries include
the Mediterranean, North America, South America, the Caribbean, the Indian
Ocean and the Far East.
(www.swanhellenic.com)
Ocean Village is a new cruise brand in the UK which has been established to provide
informal, contemporary and affordable holidays at sea for the 30- to 50-year-old
age group. Its cruise product emphasizes informality, health and well-being. Ocean
Village cruises in the Mediterranean in the summer and the Caribbean in the winter.
(www.oceanvillageholidays.co.uk)
AIDA is the best-known cruise brand in the fast growing German cruise industry. With
its four club ships, AIDAcara, AIDAaura, AIDAblu, and AIDAvita, AIDA offers cruises
to the Mediterranean, the Baltic, the Norwegian Fjords, Canary Islands, and
the Caribbean.
(www.aida.de)
P&O Cruises Australia is a cruise brand that caters to Australians. Its contempo-rary product, Pacific Sky, was joined by Pacific Sun in late 2004, offering 7 to 14
night cruises to New Caledonia, Vanuatu and Fiji from the home ports of Sydney,
Brisbane and Auckland.
(www.pocruises.com.au)
1Carnival Corporation & plc
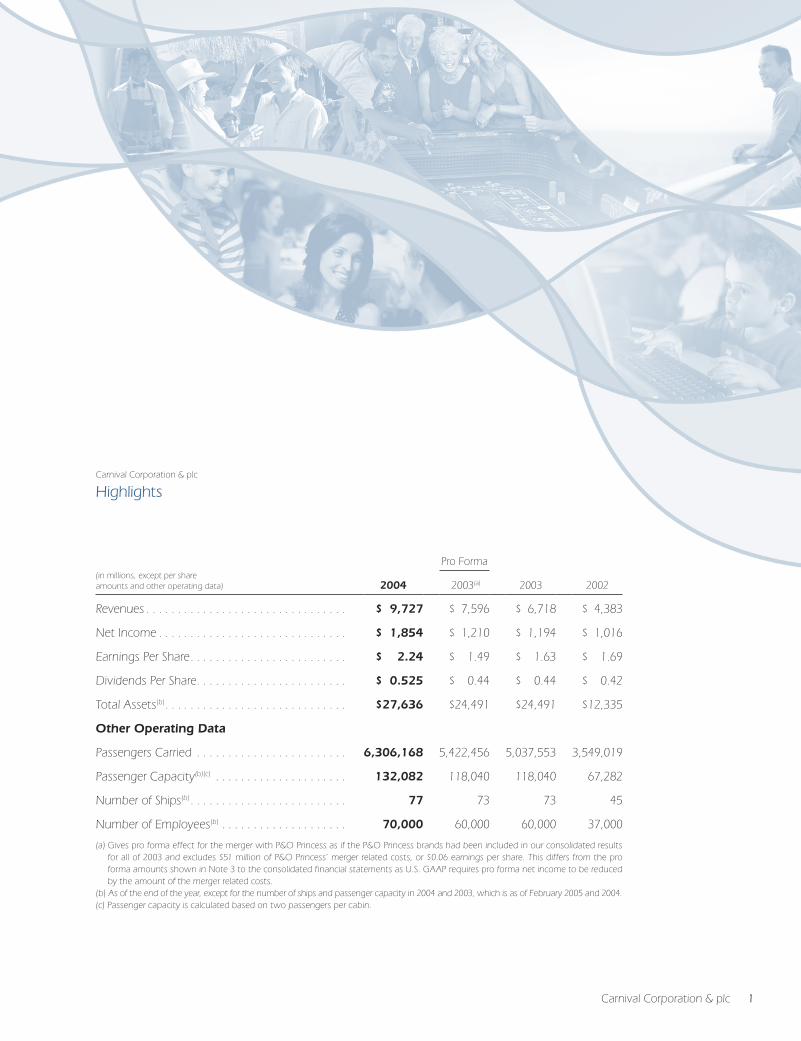
(in millions, except per share
Pro Forma
amounts and other operating data) 2004 2003(a) 2003 2002
Revenues . . . . . . . . . . . . . . . . . . . . . . . . . . . . . . . . $ 9,727 $ 7,596 $ 6,718 $ 4,383
Net Income . . . . . . . . . . . . . . . . . . . . . . . . . . . . . . $ 1,854 $ 1,210 $ 1,194 $ 1,016
Earnings Per Share . . . . . . . . . . . . . . . . . . . . . . . . . $ 2.24 $ 1.49 $ 1.63 $ 1.69
Dividends Per Share . . . . . . . . . . . . . . . . . . . . . . . . $ 0.525 $ 0.44 $ 0.44 $ 0.42
Total Assets(b) . . . . . . . . . . . . . . . . . . . . . . . . . . . . . $27,636 $24,491 $24,491 $12,335
Other Operating Data
Passengers Carried . . . . . . . . . . . . . . . . . . . . . . . . 6,306,168 5,422,456 5,037,553 3,549,019
Passenger Capacity(b)(c) . . . . . . . . . . . . . . . . . . . . . 132,082 118,040 118,040 67,282
Number of Ships(b) . . . . . . . . . . . . . . . . . . . . . . . . . 77 73 73 45
Number of Employees(b) . . . . . . . . . . . . . . . . . . . . 70,000 60,000 60,000 37,000
(a) Gives pro forma effect for the merger with P&O Princess as if the P&O Princess brands had been included in our consolidated results for all of 2003 and excludes $51 million of P&O Princess’ merger related costs, or $0.06 earnings per share. This differs from the pro forma amounts shown in Note 3 to the consolidated financial statements as U.S. GAAP requires pro forma net income to be reduced by the amount of the merger related costs.
(b) As of the end of the year, except for the number of ships and passenger capacity in 2004 and 2003, which is as of February 2005 and 2004.(c) Passenger capacity is calculated based on two passengers per cabin.
Carnival Corporation & plc
Highlights
2 Carnival Corporation & plc
To Our Shareholders
A Record Year In the first full year following the merger of Carnival Corporation
and P&O Princess Cruises, our company achieved record earnings,
launched an unprecedented eight new ships, placed orders for an
additional eight, and significantly enhanced shareholder value as
share prices in both the United States and United Kingdom climbed
to new highs.
The merger has forever changed the dynamics of our company. We
are now a stronger, more diversified organization and the world’s first
global cruise operator, offering more worldwide seagoing vacation
choices on more ships, to more destinations and from more departure
points than any other cruise company. In 2004, a record 6.3 million
vacationers chose to sail with our portfolio of cruise brands, represent-
ing about one of every two cruise passengers worldwide. We now
operate the leading cruise brands in every major cruise region, North
and South America, the United Kingdom, Germany, Italy, France, Spain
and Australia. Our 12 distinct cruise brands, with 77 ships operating
worldwide itineraries, cater to a diversity of national markets creating
the broadest platform for the growth of our business thus providing
us with the opportunity to further increase shareholder value.
In testament to the success of the merger and the synergies achieved,
our company also posted its best year ever. All of our major brands
in both North America and Europe performed extremely well. We
achieved record net revenue yield increases of 10 percent while
absorbing an extraordinarily high capacity increase of 17 percent.
We realized a significant improvement in profitability, increasing net
income by 53 percent to $1.85 billion on record revenues of $9.73
billion, by far the most profitable leisure travel company in the world.
Carnival Corporation & plc’s share price also reached an all-time high
in the U.S. and in the UK. Since the inception of our dual-listed com-
pany structure, both share prices have more than doubled, exceeding
the performance of both the S&P 500 and the FTSE 100 indices by
75 percent. In the U.S., we were named to The BusinessWeek 50,
the only leisure company to be included in this prestigious magazine’s
ranking of top performing companies in the S&P 500. And in the UK,
we ranked among the top 50 Most Admired Companies in Britain as
recognized by the respected publication Management Today.
Unprecedented New Ship IntroductionsNew ships were the primary driver of Carnival Corporation & plc’s profit
growth. In 2004, Carnival Corporation & plc introduced eight new
ships, including the 150,000-ton Queen Mary 2, the world’s largest
ocean liner, launched at a spectacular ceremony with Her Majesty,
Queen Elizabeth II serving as godmother. Even now, more than a
year after entering service, Queen Mary 2 continues to draw crowds
wherever she calls.
Also launched over the past year were Costa Cruises’ Costa Magica,
Carnival Cruise Lines’ Carnival Miracle and Carnival Valor, Princess
Cruises’ Diamond, Sapphire, and Caribbean Princesses, and Holland
America Line’s Westerdam. Collectively, these eight new vessels added
nearly 21,000 berths to our fleet.
An Eye Toward the Future Our strategy remains focused on providing superior returns for our
shareholders and begins with maintaining our leading brand positions
in all principal cruise regions. Powerful cash flows and a strong capital
base allow us to build innovative, cost-efficient ships and grow our
most profitable brands faster than capacity growth in the broader
vacation market. While the euro-dollar exchange rate made it extremely
expensive to order new ships for a North American cruise brand this
past year, our financial strength enabled us to structure an economical
five-ship order which included very attractively priced U.S. dollar ships
for our North American brands. This allowed us to continue our
strategy for growing both our North American and European cruise
business at ship prices that compare favorably with our historic costs.
These newbuilding projects, which bring our total order book to
We have a clear vision for our future: maintaining a constant focus on providing higher quality vacations at tremendous value to our customers, while keeping an eye on the bottom line and earning superior returns for our shareholders.
3Carnival Corporation & plc
13 vessels, will drive growth in all geographic regions and position our
continued expansion over the next several years.
North America today represents two-thirds of our business, and to
build on our leadership position we have five ships on order for our
well-recognized brands Carnival Cruise Lines, Princess Cruises and
Holland America Line. To further stimulate demand for these com-
panies, each of these brands embarked on new marketing campaigns
to reflect their distinct market positioning, including Carnival Cruise
Lines’ “A Million Ways to Have Fun,” Princess Cruises’ “Escape Completely”
and Holland America’s “Signature of Excellence.”
We have long believed that Europe offers tremendous growth poten-
tial for our company, and we are well positioned to capitalize on that
opportunity with eight of our new ship orders dedicated to our European
brands. Costa Cruises, our continental European brand with a strong
presence in Italy, France, Germany and Spain will introduce the newly
designed Costa Concordia class ships in 2006 and 2007, which will be
the largest ships based in the Mediterranean year-round.
The UK remains the most established cruise region in Europe, and
our presence will be expanded in 2005 with the delivery of the new
Arcadia for P&O Cruises. In 2008, the Queen Victoria, which will
incorporate many of the features of the grand ocean liner style of
Queen Mary 2, will be launched for Cunard Line.
Our European strategy is also focused on growing the German
market, which is increasingly discovering the value and convenience
of cruise holidays. During the year, we ordered two ships for our AIDA
brand’s club resort style cruise specifically designed for the younger,
more active vacationers in the German market.
We are also looking for opportunities to grow our presence inter-
nationally and current efforts include developing a strategy for the
Asian cruise market.
Our strong cash flow also provides us with the opportunity to return
additional value to shareholders. This includes the recently announced
20 percent increase in our quarterly dividend to $0.15 per share and
the board of directors’ authorization to repurchase up to $1 billion of
Carnival Corporation and Carnival plc shares.
We have a clear vision for our future: maintaining a constant focus
on providing higher quality vacations at tremendous value to our
customers, while keeping an eye on the bottom line and earning
superior returns for our shareholders.
At the same time, our corporate culture fosters a deep commitment
to preserving the marine environment and in particular the pristine
condition of the waters upon which our vessels sail. We are commit-
ted to pollution prevention and continuous improvement of our
environmental management. We recently announced our goal to
become certified in accordance with the internationally recognized
standard ISO 14001, which provides a framework for environmental
management and the measurement of environmental improvement.
The past year we saw the realization of many achievements and
accomplishments, but none of this success would have been possible
without the hard work and dedication of our 70,000 employees
worldwide whose collective efforts have led to this record year.
I also want to thank our board of directors and shareholders for
their continuing support of our efforts.
Sincerely,
Micky ArisonChairman and CEOFebruary 23, 2005
4 Carnival Corporation & plc4 Carnival Corporation & plc
Shareholder Benefit
NORTH A MERIC A N BR A NDS
C A R N I VA L C R U I S E L I N E S P R I N C E S S C R U I S E L I N E S H O L L A N D A M E R I C A L I N E / WI N D S TA R S E A B O U R N CU N A R D L I N E*
Research Supervisor Yield Management Reservation Administration Guest Services Yield ManagementReservation Administration 24305 Town Center Drive 300 Elliott Avenue West 6100 Blue Lagoon Drive 24303 Town Center Drive3655 N.W. 87th Avenue Santa Clarita, CA 91355 Seattle, WA 98119 Suite 400 Suite 200Miami, FL 33178 Tel 800-872-6779 ext. 30305 Tel 800-426-0327 ext. 4042 Miami, FL 33126 Valencia, CA 91355-0908Tel 800-438-6744 ext. 70041 Fax 661-753-0180 Fax 206-298-3059 Tel 800-929-9391 Tel 800-872-6779 ext. 30305Fax 305-406-5882 Fax 305-463-3055 Fax 661-753-0180
UNITED K INGDOM BR A NDS
P& O CR U I S E S / P R I N C E S S CR U I S E L I N E S* O C E A N VI L L A G E SWA N H E L L E N I C CU N A R D L I N E*
Reservations Manager Reservations Manager Reservations Manager Guest ServicesRichmond House Richmond House Richmond House Richmond HouseTerminus Terrace Terminus Terrace Terminus Terrace Terminus TerraceSouthampton Southampton Southampton SouthamptonHants SO14 3PN Hants SO14 3PN Hants SO14 3PN Hants SO14 3PNUnited Kingdom United Kingdom United Kingdom United KingdomTel 44 (0) 238 065 7681 Tel 44 (0) 238 065 7681 Tel 44 (0) 238 065 7681 Tel 44 (0) 845 071 0305Fax 44 (0) 238 065 7360 Fax 44 (0) 238 065 7360 Fax 44 (0) 238 065 7361 Fax 44 (0) 238 065 7356
CONTINENTA L EUROPE A N BR A NDS AUSTR A L IA N BR A ND
CO S TA C R U I S E S* A IDA C R U I S E S P& O C R U I S E S A U S T R A L I A
Staff Vice President Staff to the Senior Vice President Reservations ManagerPassenger Services Marketing & Sales Locked Bag 1014200 S. Park Road, Suite 200 Frankfurter Strasse 233 St. Leonards NSW 1590Hollywood, FL 33021 63263 Neu Isenburg, Germany Tel 61 2 8424 8800Tel 800-462-6782 Tel 49 (0) 6102 811-500 Fax 61 2 8424 9161Fax 954-266-2100 Fax 49 (0) 6102 811-950
*The onboard credit for Cunard Line, Princess Cruise Lines and Costa Cruises is determined based on the operational currency onboard the vessel.
Carnival Corporation & plc is pleased to extend the following benefit to our shareholders:
North United Continental American Kingdom European Australian Brands Brands Brands Brand
Onboard credit per stateroom on sailings of 14 days or longer . . . . . . . . . . . . . . . . . . . . . . . . . . US $250 £ 125 € 250 AUD 250
Onboard credit per stateroom on sailings of 7 to 13 days . . . . . . . . . . . . . . . . . . . . . . . . . . . . . . US $100 £ 50 € 100 AUD 100
Onboard credit per stateroom on sailings of 6 days or less . . . . . . . . . . . . . . . . . . . . . . . . . . . . . US $ 50 £ 25 € 50 AUD 50
This benefit is applicable on sailings through July 31, 2006 aboard the brands listed below. Certain restrictions apply.
This benefit is available to shareholders holding a minimum of 100 shares of Carnival Corporation or Carnival plc. Employees, travel agents cruising at
travel agent rates, tour conductors or anyone cruising on a reduced-rate or complimentary basis are excluded from this offer. This benefit is not transferable,
not combinable with any other shipboard offer and cannot be used for casino credits/charges and gratuities charged to your onboard account. Only one
onboard credit per shareholder-occupied stateroom. Reservations must be made by February 28, 2006.
Please provide your name, reservation number, ship and sailing date, along with proof of ownership of Carnival Corporation or Carnival plc shares
(i.e., photocopy of shareholder proxy card, shares certificate or a current brokerage or nominee statement) and the initial deposit to your travel agent or to
the cruise line you have selected.
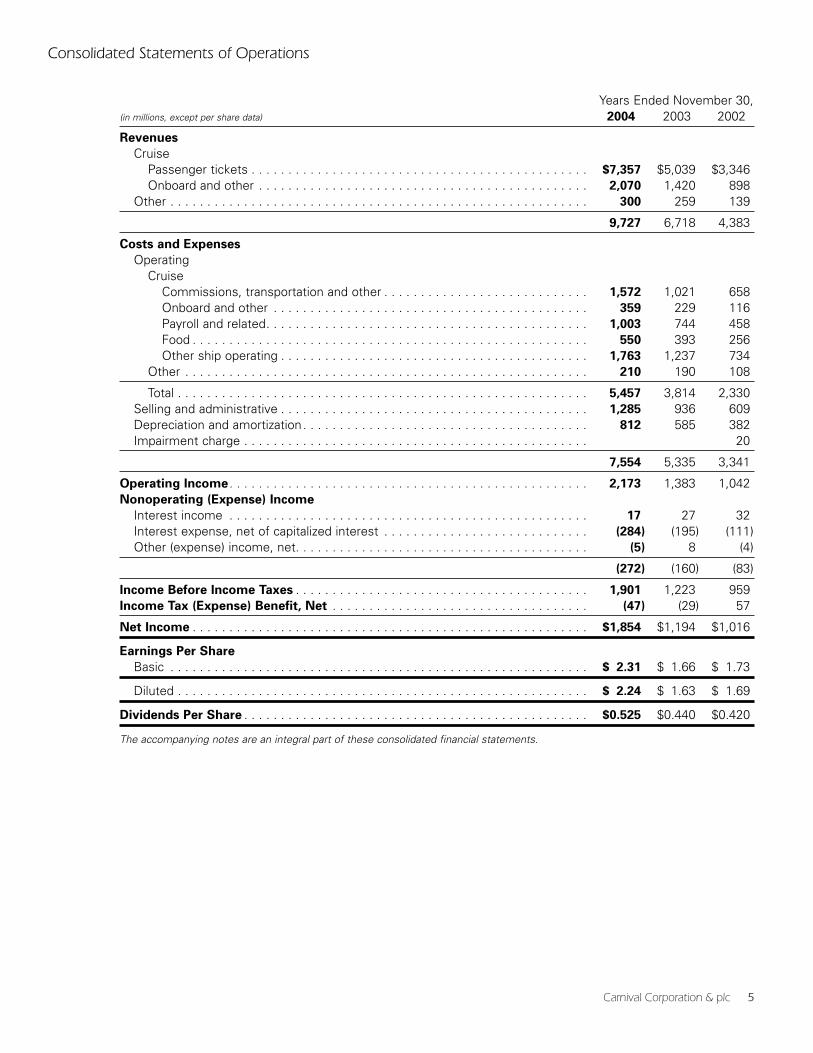
Consolidated Statements of Operations
Years Ended November 30,(in millions, except per share data) 2004 2003 2002
Revenues
CruisePassenger tickets . . . . . . . . . . . . . . . . . . . . . . . . . . . . . . . . . . . . . . . . . . . . . . $7,357 $5,039 $3,346Onboard and other . . . . . . . . . . . . . . . . . . . . . . . . . . . . . . . . . . . . . . . . . . . . . 2,070 1,420 898
Other . . . . . . . . . . . . . . . . . . . . . . . . . . . . . . . . . . . . . . . . . . . . . . . . . . . . . . . . . 300 259 139
9,727 6,718 4,383
Costs and Expenses
OperatingCruise
Commissions, transportation and other . . . . . . . . . . . . . . . . . . . . . . . . . . . . 1,572 1,021 658Onboard and other . . . . . . . . . . . . . . . . . . . . . . . . . . . . . . . . . . . . . . . . . . . 359 229 116Payroll and related. . . . . . . . . . . . . . . . . . . . . . . . . . . . . . . . . . . . . . . . . . . . 1,003 744 458Food . . . . . . . . . . . . . . . . . . . . . . . . . . . . . . . . . . . . . . . . . . . . . . . . . . . . . . 550 393 256Other ship operating . . . . . . . . . . . . . . . . . . . . . . . . . . . . . . . . . . . . . . . . . . 1,763 1,237 734
Other . . . . . . . . . . . . . . . . . . . . . . . . . . . . . . . . . . . . . . . . . . . . . . . . . . . . . . . 210 190 108
Total . . . . . . . . . . . . . . . . . . . . . . . . . . . . . . . . . . . . . . . . . . . . . . . . . . . . . . . . 5,457 3,814 2,330Selling and administrative . . . . . . . . . . . . . . . . . . . . . . . . . . . . . . . . . . . . . . . . . . 1,285 936 609Depreciation and amortization. . . . . . . . . . . . . . . . . . . . . . . . . . . . . . . . . . . . . . . 812 585 382Impairment charge . . . . . . . . . . . . . . . . . . . . . . . . . . . . . . . . . . . . . . . . . . . . . . . 20
7,554 5,335 3,341
Operating Income . . . . . . . . . . . . . . . . . . . . . . . . . . . . . . . . . . . . . . . . . . . . . . . . . 2,173 1,383 1,042Nonoperating (Expense) Income
Interest income . . . . . . . . . . . . . . . . . . . . . . . . . . . . . . . . . . . . . . . . . . . . . . . . . 17 27 32Interest expense, net of capitalized interest . . . . . . . . . . . . . . . . . . . . . . . . . . . . (284) (195) (111)Other (expense) income, net. . . . . . . . . . . . . . . . . . . . . . . . . . . . . . . . . . . . . . . . (5) 8 (4)
(272) (160) (83)
Income Before Income Taxes . . . . . . . . . . . . . . . . . . . . . . . . . . . . . . . . . . . . . . . . 1,901 1,223 959Income Tax (Expense) Benefit, Net . . . . . . . . . . . . . . . . . . . . . . . . . . . . . . . . . . . (47) (29) 57
Net Income . . . . . . . . . . . . . . . . . . . . . . . . . . . . . . . . . . . . . . . . . . . . . . . . . . . . . . $1,854 $1,194 $1,016
Earnings Per Share
Basic . . . . . . . . . . . . . . . . . . . . . . . . . . . . . . . . . . . . . . . . . . . . . . . . . . . . . . . . . $ 2.31 $ 1.66 $ 1.73
Diluted . . . . . . . . . . . . . . . . . . . . . . . . . . . . . . . . . . . . . . . . . . . . . . . . . . . . . . . . $ 2.24 $ 1.63 $ 1.69
Dividends Per Share . . . . . . . . . . . . . . . . . . . . . . . . . . . . . . . . . . . . . . . . . . . . . . . $0.525 $0.440 $0.420
The accompanying notes are an integral part of these consolidated financial statements.
Carnival Corporation & plc 5
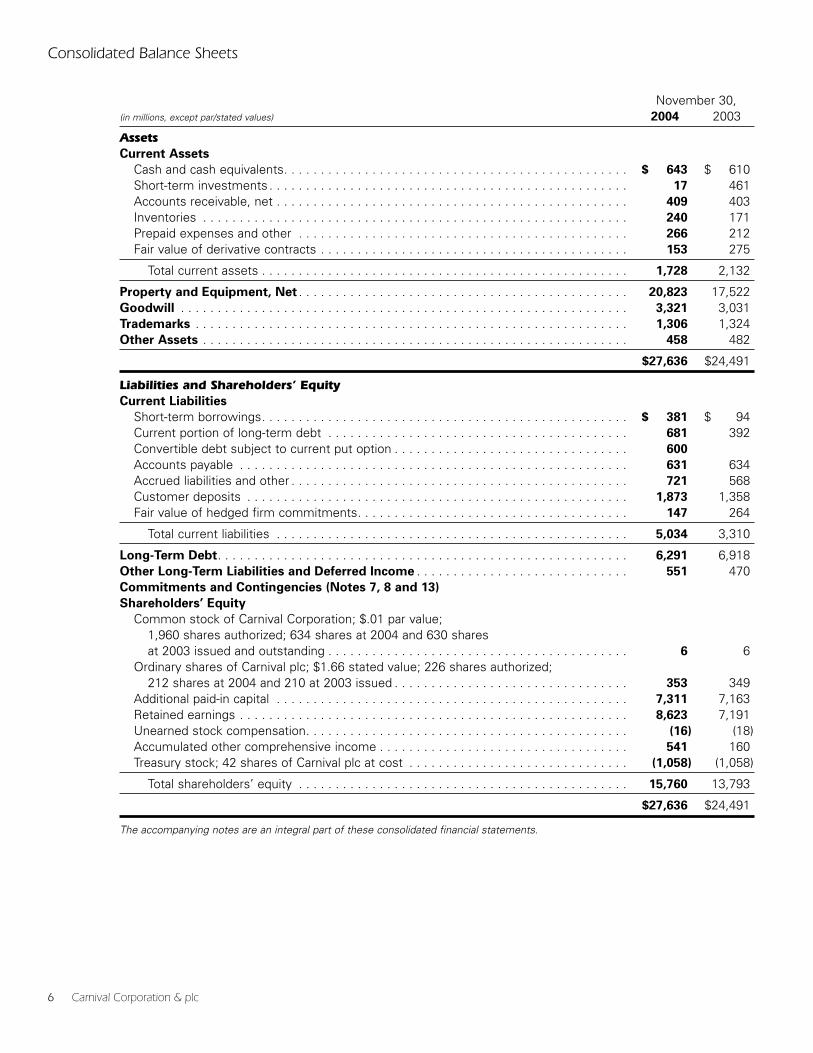
Consolidated Balance Sheets
November 30,(in millions, except par/stated values) 2004 2003
AssetsCurrent Assets
Cash and cash equivalents. . . . . . . . . . . . . . . . . . . . . . . . . . . . . . . . . . . . . . . . . . . . . . . $ 643 $ 610Short-term investments . . . . . . . . . . . . . . . . . . . . . . . . . . . . . . . . . . . . . . . . . . . . . . . . . 17 461Accounts receivable, net . . . . . . . . . . . . . . . . . . . . . . . . . . . . . . . . . . . . . . . . . . . . . . . . 409 403Inventories . . . . . . . . . . . . . . . . . . . . . . . . . . . . . . . . . . . . . . . . . . . . . . . . . . . . . . . . . . 240 171Prepaid expenses and other . . . . . . . . . . . . . . . . . . . . . . . . . . . . . . . . . . . . . . . . . . . . . 266 212Fair value of derivative contracts . . . . . . . . . . . . . . . . . . . . . . . . . . . . . . . . . . . . . . . . . . 153 275
Total current assets . . . . . . . . . . . . . . . . . . . . . . . . . . . . . . . . . . . . . . . . . . . . . . . . . . 1,728 2,132
Property and Equipment, Net . . . . . . . . . . . . . . . . . . . . . . . . . . . . . . . . . . . . . . . . . . . . . 20,823 17,522Goodwill . . . . . . . . . . . . . . . . . . . . . . . . . . . . . . . . . . . . . . . . . . . . . . . . . . . . . . . . . . . . . 3,321 3,031Trademarks . . . . . . . . . . . . . . . . . . . . . . . . . . . . . . . . . . . . . . . . . . . . . . . . . . . . . . . . . . . 1,306 1,324Other Assets . . . . . . . . . . . . . . . . . . . . . . . . . . . . . . . . . . . . . . . . . . . . . . . . . . . . . . . . . . 458 482
$27,636 $24,491
Liabilities and Shareholders’ EquityCurrent Liabilities
Short-term borrowings. . . . . . . . . . . . . . . . . . . . . . . . . . . . . . . . . . . . . . . . . . . . . . . . . . $ 381 $ 94Current portion of long-term debt . . . . . . . . . . . . . . . . . . . . . . . . . . . . . . . . . . . . . . . . . 681 392Convertible debt subject to current put option . . . . . . . . . . . . . . . . . . . . . . . . . . . . . . . . 600
Accounts payable . . . . . . . . . . . . . . . . . . . . . . . . . . . . . . . . . . . . . . . . . . . . . . . . . . . . . 631 634Accrued liabilities and other . . . . . . . . . . . . . . . . . . . . . . . . . . . . . . . . . . . . . . . . . . . . . . 721 568Customer deposits . . . . . . . . . . . . . . . . . . . . . . . . . . . . . . . . . . . . . . . . . . . . . . . . . . . . 1,873 1,358Fair value of hedged firm commitments. . . . . . . . . . . . . . . . . . . . . . . . . . . . . . . . . . . . . 147 264
Total current liabilities . . . . . . . . . . . . . . . . . . . . . . . . . . . . . . . . . . . . . . . . . . . . . . . . 5,034 3,310
Long-Term Debt. . . . . . . . . . . . . . . . . . . . . . . . . . . . . . . . . . . . . . . . . . . . . . . . . . . . . . . . 6,291 6,918Other Long-Term Liabilities and Deferred Income . . . . . . . . . . . . . . . . . . . . . . . . . . . . . 551 470Commitments and Contingencies (Notes 7, 8 and 13)
Shareholders’ Equity
Common stock of Carnival Corporation; $.01 par value; 1,960 shares authorized; 634 shares at 2004 and 630 shares at 2003 issued and outstanding . . . . . . . . . . . . . . . . . . . . . . . . . . . . . . . . . . . . . . . . . 6 6
Ordinary shares of Carnival plc; $1.66 stated value; 226 shares authorized; 212 shares at 2004 and 210 at 2003 issued . . . . . . . . . . . . . . . . . . . . . . . . . . . . . . . . 353 349
Additional paid-in capital . . . . . . . . . . . . . . . . . . . . . . . . . . . . . . . . . . . . . . . . . . . . . . . . 7,311 7,163Retained earnings . . . . . . . . . . . . . . . . . . . . . . . . . . . . . . . . . . . . . . . . . . . . . . . . . . . . . 8,623 7,191Unearned stock compensation. . . . . . . . . . . . . . . . . . . . . . . . . . . . . . . . . . . . . . . . . . . . (16) (18)Accumulated other comprehensive income . . . . . . . . . . . . . . . . . . . . . . . . . . . . . . . . . . 541 160Treasury stock; 42 shares of Carnival plc at cost . . . . . . . . . . . . . . . . . . . . . . . . . . . . . . (1,058) (1,058)
Total shareholders’ equity . . . . . . . . . . . . . . . . . . . . . . . . . . . . . . . . . . . . . . . . . . . . . 15,760 13,793
$27,636 $24,491
The accompanying notes are an integral part of these consolidated financial statements.
6 Carnival Corporation & plc
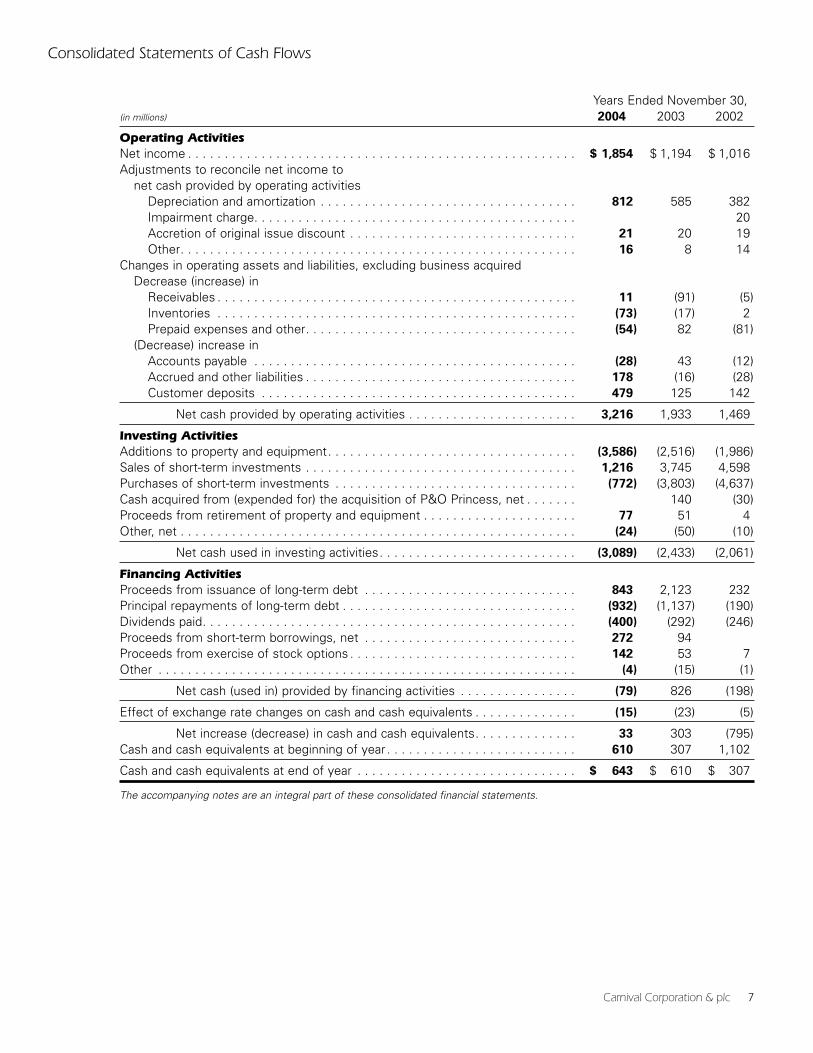
Consolidated Statements of Cash Flows
Years Ended November 30,(in millions) 2004 2003 2002
Operating ActivitiesNet income . . . . . . . . . . . . . . . . . . . . . . . . . . . . . . . . . . . . . . . . . . . . . . . . . . . . . $ 1,854 $ 1,194 $ 1,016Adjustments to reconcile net income to
net cash provided by operating activitiesDepreciation and amortization . . . . . . . . . . . . . . . . . . . . . . . . . . . . . . . . . . . 812 585 382Impairment charge. . . . . . . . . . . . . . . . . . . . . . . . . . . . . . . . . . . . . . . . . . . . 20Accretion of original issue discount . . . . . . . . . . . . . . . . . . . . . . . . . . . . . . . 21 20 19Other. . . . . . . . . . . . . . . . . . . . . . . . . . . . . . . . . . . . . . . . . . . . . . . . . . . . . . 16 8 14
Changes in operating assets and liabilities, excluding business acquiredDecrease (increase) in
Receivables . . . . . . . . . . . . . . . . . . . . . . . . . . . . . . . . . . . . . . . . . . . . . . . . . 11 (91) (5)Inventories . . . . . . . . . . . . . . . . . . . . . . . . . . . . . . . . . . . . . . . . . . . . . . . . . (73) (17) 2Prepaid expenses and other. . . . . . . . . . . . . . . . . . . . . . . . . . . . . . . . . . . . . (54) 82 (81)
(Decrease) increase inAccounts payable . . . . . . . . . . . . . . . . . . . . . . . . . . . . . . . . . . . . . . . . . . . . (28) 43 (12)Accrued and other liabilities . . . . . . . . . . . . . . . . . . . . . . . . . . . . . . . . . . . . . 178 (16) (28)Customer deposits . . . . . . . . . . . . . . . . . . . . . . . . . . . . . . . . . . . . . . . . . . . 479 125 142
Net cash provided by operating activities . . . . . . . . . . . . . . . . . . . . . . . 3,216 1,933 1,469
Investing ActivitiesAdditions to property and equipment. . . . . . . . . . . . . . . . . . . . . . . . . . . . . . . . . . (3,586) (2,516) (1,986)Sales of short-term investments . . . . . . . . . . . . . . . . . . . . . . . . . . . . . . . . . . . . . 1,216 3,745 4,598Purchases of short-term investments . . . . . . . . . . . . . . . . . . . . . . . . . . . . . . . . . (772) (3,803) (4,637)Cash acquired from (expended for) the acquisition of P&O Princess, net . . . . . . . 140 (30)Proceeds from retirement of property and equipment . . . . . . . . . . . . . . . . . . . . . 77 51 4Other, net . . . . . . . . . . . . . . . . . . . . . . . . . . . . . . . . . . . . . . . . . . . . . . . . . . . . . . (24) (50) (10)
Net cash used in investing activities. . . . . . . . . . . . . . . . . . . . . . . . . . . (3,089) (2,433) (2,061)
Financing ActivitiesProceeds from issuance of long-term debt . . . . . . . . . . . . . . . . . . . . . . . . . . . . . 843 2,123 232Principal repayments of long-term debt . . . . . . . . . . . . . . . . . . . . . . . . . . . . . . . . (932) (1,137) (190)Dividends paid. . . . . . . . . . . . . . . . . . . . . . . . . . . . . . . . . . . . . . . . . . . . . . . . . . . (400) (292) (246)Proceeds from short-term borrowings, net . . . . . . . . . . . . . . . . . . . . . . . . . . . . . 272 94Proceeds from exercise of stock options . . . . . . . . . . . . . . . . . . . . . . . . . . . . . . . 142 53 7Other . . . . . . . . . . . . . . . . . . . . . . . . . . . . . . . . . . . . . . . . . . . . . . . . . . . . . . . . . (4) (15) (1)
Net cash (used in) provided by financing activities . . . . . . . . . . . . . . . . (79) 826 (198)
Effect of exchange rate changes on cash and cash equivalents . . . . . . . . . . . . . . (15) (23) (5)
Net increase (decrease) in cash and cash equivalents. . . . . . . . . . . . . . 33 303 (795)Cash and cash equivalents at beginning of year . . . . . . . . . . . . . . . . . . . . . . . . . . 610 307 1,102
Cash and cash equivalents at end of year . . . . . . . . . . . . . . . . . . . . . . . . . . . . . . $ 643 $ 610 $ 307
The accompanying notes are an integral part of these consolidated financial statements.
Carnival Corporation & plc 7
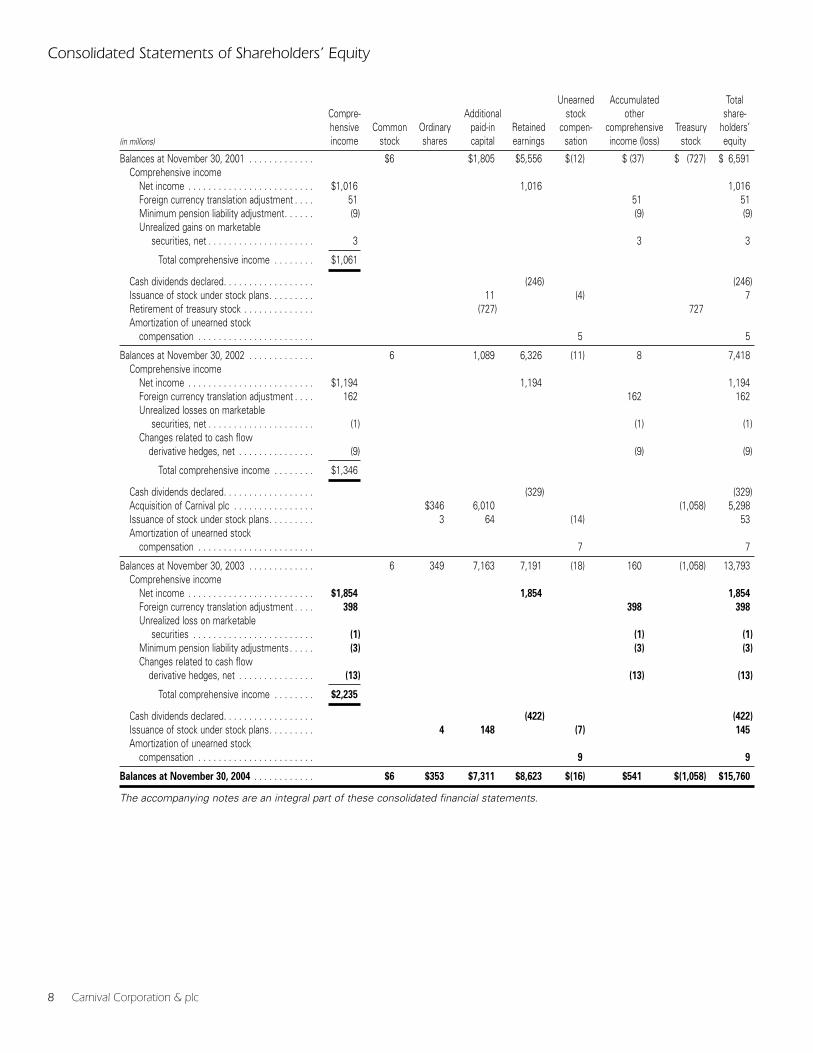
Consolidated Statements of Shareholders’ Equity
Unearned Accumulated TotalCompre- Additional stock other share-hensive Common Ordinary paid-in Retained compen- comprehensive Treasury holders’
(in millions) income stock shares capital earnings sation income (loss) stock equity
Balances at November 30, 2001 . . . . . . . . . . . . . $6 $1,805 $5,556 $(12) $ (37) $ (727) $ 6,591Comprehensive income
Net income . . . . . . . . . . . . . . . . . . . . . . . . . $1,016 1,016 1,016Foreign currency translation adjustment . . . . 51 51 51Minimum pension liability adjustment. . . . . . (9) (9) (9)Unrealized gains on marketable
securities, net . . . . . . . . . . . . . . . . . . . . . 3 3 3
Total comprehensive income . . . . . . . . $1,061
Cash dividends declared. . . . . . . . . . . . . . . . . . (246) (246)Issuance of stock under stock plans. . . . . . . . . 11 (4) 7Retirement of treasury stock . . . . . . . . . . . . . . (727) 727Amortization of unearned stock
compensation . . . . . . . . . . . . . . . . . . . . . . . 5 5
Balances at November 30, 2002 . . . . . . . . . . . . . 6 1,089 6,326 (11) 8 7,418Comprehensive income
Net income . . . . . . . . . . . . . . . . . . . . . . . . . $1,194 1,194 1,194Foreign currency translation adjustment . . . . 162 162 162Unrealized losses on marketable
securities, net . . . . . . . . . . . . . . . . . . . . . (1) (1) (1)Changes related to cash flow
derivative hedges, net . . . . . . . . . . . . . . . (9) (9) (9)
Total comprehensive income . . . . . . . . $1,346
Cash dividends declared. . . . . . . . . . . . . . . . . . (329) (329)Acquisition of Carnival plc . . . . . . . . . . . . . . . . $346 6,010 (1,058) 5,298Issuance of stock under stock plans. . . . . . . . . 3 64 (14) 53Amortization of unearned stock
compensation . . . . . . . . . . . . . . . . . . . . . . . 7 7
Balances at November 30, 2003 . . . . . . . . . . . . . 6 349 7,163 7,191 (18) 160 (1,058) 13,793Comprehensive income
Net income . . . . . . . . . . . . . . . . . . . . . . . . . $1,854 1,854 1,854
Foreign currency translation adjustment . . . . 398 398 398
Unrealized loss on marketablesecurities . . . . . . . . . . . . . . . . . . . . . . . . (1) (1) (1)
Minimum pension liability adjustments . . . . . (3) (3) (3)
Changes related to cash flowderivative hedges, net . . . . . . . . . . . . . . . (13) (13) (13)
Total comprehensive income . . . . . . . . $2,235
Cash dividends declared. . . . . . . . . . . . . . . . . . (422) (422)
Issuance of stock under stock plans. . . . . . . . . 4 148 (7) 145
Amortization of unearned stockcompensation . . . . . . . . . . . . . . . . . . . . . . . 9 9
Balances at November 30, 2004 . . . . . . . . . . . . $6 $353 $7,311 $8,623 $(16) $541 $(1,058) $15,760
The accompanying notes are an integral part of these consolidated financial statements.
8 Carnival Corporation & plc
Notes to Consolidated Financial Statements
Note 1—General
Description of Business
Carnival Corporation is incorporated in Panama, andCarnival plc is incorporated in England and Wales. Togetherwith their consolidated subsidiaries they are referred tocollectively in these consolidated financial statementsand elsewhere in this 2004 Annual Report as “CarnivalCorporation & plc,” “our,” “us,” and “we.” Our consoli-dated financial statements only include the results ofoperations of the former P&O Princess Cruises plc sinceApril 17, 2003.
On April 17, 2003, Carnival Corporation and Carnivalplc (formerly known as P&O Princess Cruises plc or“P&O Princess”) completed a dual listed company(“DLC”) transaction (the “DLC transaction”), whichimplemented Carnival Corporation & plc’s DLC struc-ture. The DLC transaction combined the businesses of
Carnival Corporation and Carnival plc through a numberof contracts and through amendments to CarnivalCorporation’s articles of incorporation and by-laws andto Carnival plc’s memorandum of association and articlesof association. The two companies have retained theirseparate legal identities, however, they operate as if theywere a single economic enterprise. Each company’sshares continue to be publicly traded on the New YorkStock Exchange (“NYSE”) for Carnival Corporation andthe London Stock Exchange for Carnival plc. In addition,Carnival plc American Depository Shares (“ADSs”) aretraded on the NYSE. See Note 3.
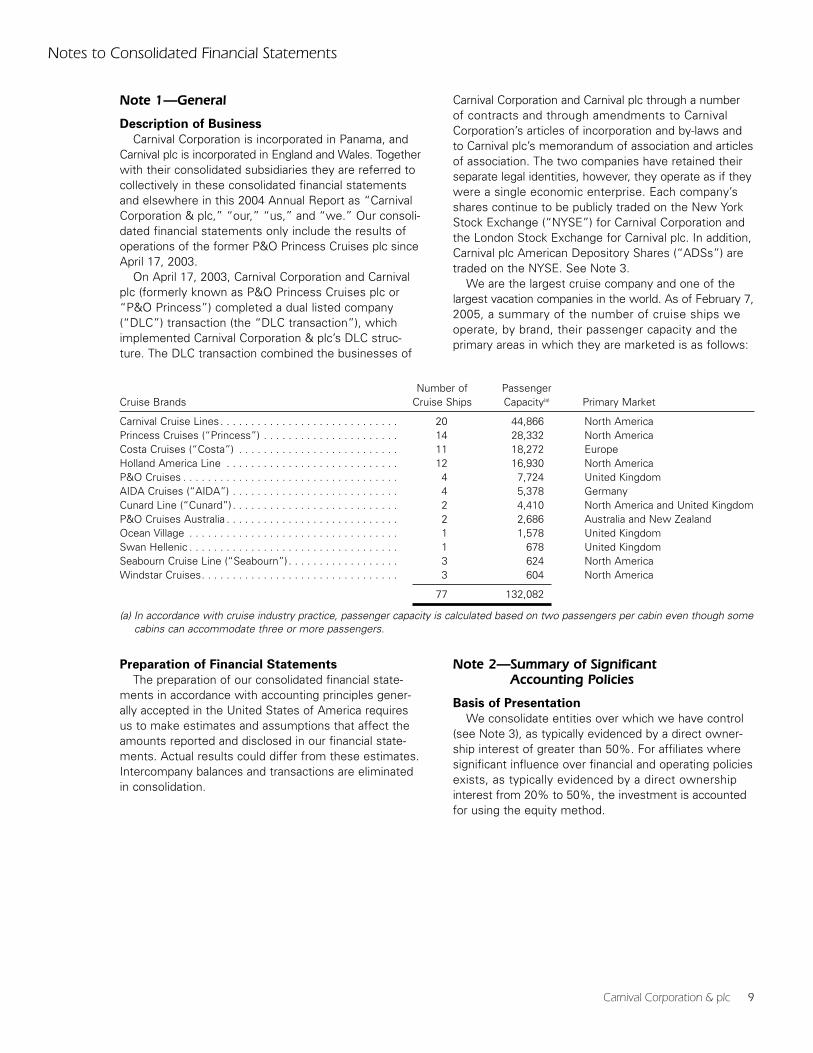
We are the largest cruise company and one of thelargest vacation companies in the world. As of February 7,2005, a summary of the number of cruise ships weoperate, by brand, their passenger capacity and theprimary areas in which they are marketed is as follows:
Carnival Corporation & plc 9
Number of PassengerCruise Brands Cruise Ships Capacity(a) Primary Market
Carnival Cruise Lines . . . . . . . . . . . . . . . . . . . . . . . . . . . . . 20 44,866 North AmericaPrincess Cruises (“Princess”) . . . . . . . . . . . . . . . . . . . . . . 14 28,332 North AmericaCosta Cruises (“Costa”) . . . . . . . . . . . . . . . . . . . . . . . . . . 11 18,272 EuropeHolland America Line . . . . . . . . . . . . . . . . . . . . . . . . . . . . 12 16,930 North AmericaP&O Cruises . . . . . . . . . . . . . . . . . . . . . . . . . . . . . . . . . . . 4 7,724 United KingdomAIDA Cruises (“AIDA”) . . . . . . . . . . . . . . . . . . . . . . . . . . . 4 5,378 GermanyCunard Line (“Cunard”) . . . . . . . . . . . . . . . . . . . . . . . . . . . 2 4,410 North America and United KingdomP&O Cruises Australia . . . . . . . . . . . . . . . . . . . . . . . . . . . . 2 2,686 Australia and New ZealandOcean Village . . . . . . . . . . . . . . . . . . . . . . . . . . . . . . . . . . 1 1,578 United KingdomSwan Hellenic . . . . . . . . . . . . . . . . . . . . . . . . . . . . . . . . . . 1 678 United KingdomSeabourn Cruise Line (“Seabourn”) . . . . . . . . . . . . . . . . . . 3 624 North AmericaWindstar Cruises. . . . . . . . . . . . . . . . . . . . . . . . . . . . . . . . 3 604 North America
77 132,082
(a) In accordance with cruise industry practice, passenger capacity is calculated based on two passengers per cabin even though somecabins can accommodate three or more passengers.
Preparation of Financial Statements
The preparation of our consolidated financial state-ments in accordance with accounting principles gener-ally accepted in the United States of America requiresus to make estimates and assumptions that affect theamounts reported and disclosed in our financial state-ments. Actual results could differ from these estimates.Intercompany balances and transactions are eliminatedin consolidation.
Note 2—Summary of Significant Accounting Policies
Basis of Presentation
We consolidate entities over which we have control(see Note 3), as typically evidenced by a direct owner-ship interest of greater than 50%. For affiliates wheresignificant influence over financial and operating policiesexists, as typically evidenced by a direct ownershipinterest from 20% to 50%, the investment is accountedfor using the equity method.
Notes to Consolidated Financial Statements (continued)
Cash and Cash Equivalents and Short-Term
Investments
Cash and cash equivalents include investments withoriginal maturities of three months or less, which arestated at cost. At November 30, 2004 and 2003, cashand cash equivalents included $495 million and $477million of investments, respectively, primarily comprisedof investment grade asset-backed debt obligations,commercial paper and money market funds.
Substantially all our short-term investments are com-prised of investment grade variable rate debt obligations,which are asset-backed and categorized as available-for-sale. Accordingly, our investments in these securitiesare recorded at cost, which approximates fair value dueto their variable interest rates, which typically resetevery 28 days. Despite the long-term nature of theirstated contractual maturities, we have the ability toquickly liquidate these securities. As a result of theresetting variable rates, we had no cumulative grossunrealized or realized holding gains or losses from theseinvestments. All income generated from these invest-ments was recorded as interest income.
Inventories
Inventories consist primarily of provisions, gift shopand art merchandise held for resale, fuel and suppliescarried at the lower of cost or market. Cost is deter-mined using the weighted-average or first-in, first-outmethods.
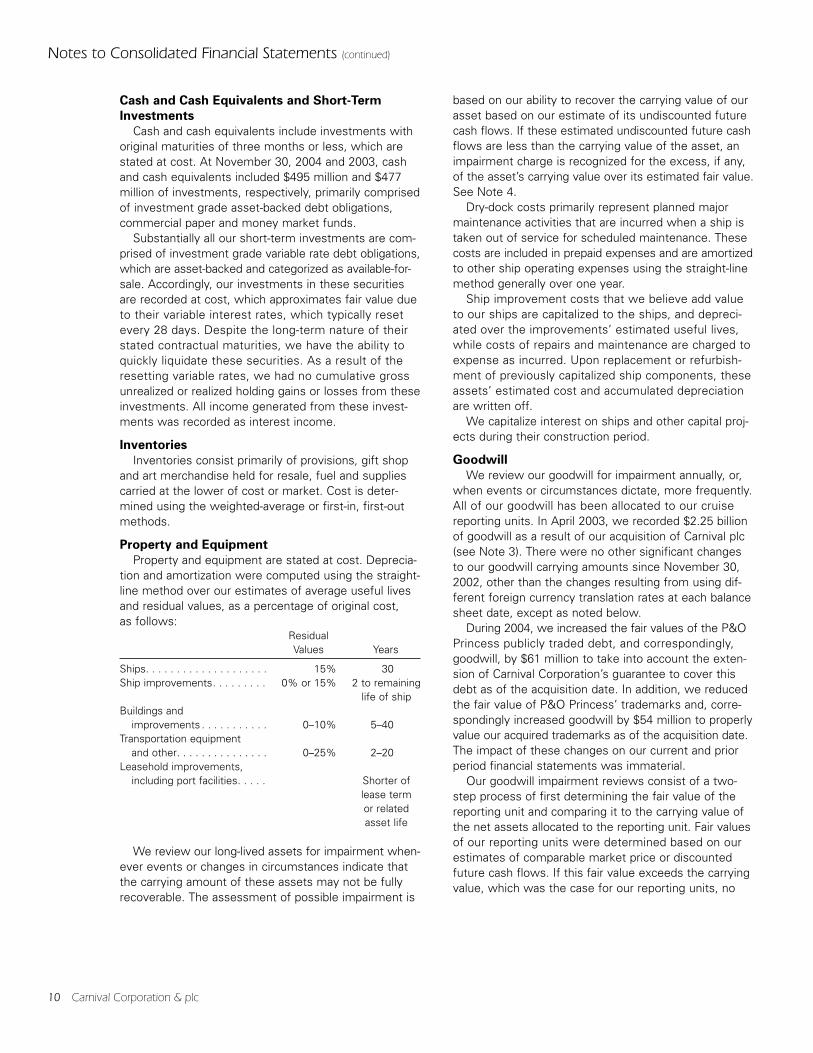
Property and Equipment
Property and equipment are stated at cost. Deprecia-tion and amortization were computed using the straight-line method over our estimates of average useful livesand residual values, as a percentage of original cost, as follows:
ResidualValues Years
Ships. . . . . . . . . . . . . . . . . . . . 15% 30Ship improvements. . . . . . . . . 0% or 15% 2 to remaining
life of shipBuildings and
improvements . . . . . . . . . . . 0–10% 5–40Transportation equipment
and other. . . . . . . . . . . . . . . 0–25% 2–20Leasehold improvements,
including port facilities. . . . . Shorter of lease termor related asset life
We review our long-lived assets for impairment when-ever events or changes in circumstances indicate thatthe carrying amount of these assets may not be fullyrecoverable. The assessment of possible impairment is
based on our ability to recover the carrying value of ourasset based on our estimate of its undiscounted futurecash flows. If these estimated undiscounted future cashflows are less than the carrying value of the asset, animpairment charge is recognized for the excess, if any,of the asset’s carrying value over its estimated fair value.See Note 4.
Dry-dock costs primarily represent planned majormaintenance activities that are incurred when a ship istaken out of service for scheduled maintenance. Thesecosts are included in prepaid expenses and are amortizedto other ship operating expenses using the straight-linemethod generally over one year.
Ship improvement costs that we believe add value to our ships are capitalized to the ships, and depreci-ated over the improvements’ estimated useful lives,while costs of repairs and maintenance are charged toexpense as incurred. Upon replacement or refurbish-ment of previously capitalized ship components, theseassets’ estimated cost and accumulated depreciationare written off.
We capitalize interest on ships and other capital proj-ects during their construction period.
Goodwill
We review our goodwill for impairment annually, or,when events or circumstances dictate, more frequently.All of our goodwill has been allocated to our cruisereporting units. In April 2003, we recorded $2.25 billionof goodwill as a result of our acquisition of Carnival plc(see Note 3). There were no other significant changesto our goodwill carrying amounts since November 30,2002, other than the changes resulting from using dif-ferent foreign currency translation rates at each balancesheet date, except as noted below.
During 2004, we increased the fair values of the P&OPrincess publicly traded debt, and correspondingly,goodwill, by $61 million to take into account the exten-sion of Carnival Corporation’s guarantee to cover thisdebt as of the acquisition date. In addition, we reducedthe fair value of P&O Princess’ trademarks and, corre-spondingly increased goodwill by $54 million to properlyvalue our acquired trademarks as of the acquisition date.The impact of these changes on our current and priorperiod financial statements was immaterial.
Our goodwill impairment reviews consist of a two-step process of first determining the fair value of thereporting unit and comparing it to the carrying value ofthe net assets allocated to the reporting unit. Fair valuesof our reporting units were determined based on ourestimates of comparable market price or discountedfuture cash flows. If this fair value exceeds the carryingvalue, which was the case for our reporting units, no
10 Carnival Corporation & plc
further analysis or goodwill write-down is required. Ifthe fair value of the reporting unit is less than the carry-ing value of the net assets, the implied fair value of thereporting unit is allocated to all the underlying assetsand liabilities, including both recognized and unrecog-nized tangible and intangible assets, based on their fairvalue. If necessary, goodwill is then written-down to itsimplied fair value.
Trademarks
The cost of developing and maintaining our trademarkshave been expensed as incurred. However, pursuant toStatement of Financial Accounting Standards (“SFAS”)No. 141, “Business Combinations,” commencing foracquisitions made after June 2001, we have allocated aportion of the purchase price to the acquiree’s identifiedtrademarks. The trademarks that Carnival Corporationrecorded as part of the DLC transaction, which are estimated to have an indefinite useful life and, there-fore, are not amortizable, are reviewed for impairmentannually, or more frequently when events or circum-stances indicate that the trademark may be impaired.Our trademarks would be considered impaired if theircarrying value exceeds their fair value. See Note 3.
Derivative Instruments and Hedging Activities
We utilize derivative and nonderivative financial instru-ments, such as foreign currency swaps and foreigncurrency obligations to limit our exposure to fluctuationsin foreign currency exchange rates and interest rateswaps to manage our interest rate exposure and toachieve a desired proportion of variable and fixed ratedebt (see Notes 6 and 11).
All derivatives are recorded at fair value, and thechanges in fair value must be immediately included inearnings if the derivatives do not qualify as effectivehedges. If a derivative is a fair value hedge, then changesin the fair value of the derivative are offset against thechanges in the fair value of the underlying hedged firmcommitment. If a derivative is a cash flow hedge, thenchanges in the fair value of the derivative are recognizedas a component of accumulated other comprehensiveincome (“AOCI”) until the underlying hedged item isrecognized in earnings. If a derivative or a nonderivativefinancial instrument is designated as a hedge of a netinvestment in a foreign operation, then changes in thefair value of the financial instrument are recognized as a component of AOCI to offset the change in the trans-lated value of the net investment being hedged, untilthe investment is liquidated. We formally document allrelationships between hedging instruments and hedgeditems, as well as our risk management objectives andstrategies for undertaking our hedge transactions.
We classify the fair value of our derivative contractsand the fair value of our offsetting hedged firm commit-ments as either current or long-term assets and liabilitiesdepending on whether the maturity date of the deriva-tive contract is within or beyond one year from ourbalance sheet dates. The cash flows from derivativestreated as hedges are classified in our statements of cashflows in the same category as the item being hedged.
During fiscal 2004, 2003 and 2002, all net changes inthe fair value of both our fair value hedges and the off-setting hedged firm commitments and our cash flowhedges were immaterial, as were any ineffective portionsof these hedges. No fair value hedges or cash flowhedges were derecognized or discontinued in fiscal2004, 2003 or 2002, and the amount of estimated cashflow hedges unrealized net losses which are expectedto be reclassified to earnings in the next twelve monthsis approximately $24 million.
Finally, if any shipyard with which we have contractsto build our ships is unable to perform, we would berequired to perform under our foreign currency swapsrelated to these shipbuilding contracts. Accordingly, basedupon the circumstances, we may have to discontinuethe accounting for those currency swaps as hedges, ifthe shipyard cannot perform. However, we believe thatthe risk of shipyard nonperformance is remote.
Revenue and Expense Recognition
Guest cruise deposits represent unearned revenuesand are initially recorded as customer deposit liabilitieswhen received. Customer deposits are subsequentlyrecognized as cruise revenues, together with revenuesfrom onboard and other activities and all associateddirect costs of a voyage, generally upon completion ofvoyages with durations of ten nights or less and on apro rata basis for voyages in excess of ten nights. Futuretravel discount vouchers issued to guests are typicallyrecorded as a reduction of revenues when such vouchersare utilized. Revenues and expenses from our tour andtravel services are recognized at the time the servicesare performed or expenses are incurred.
Insurance/Self-Insurance
We use a combination of insurance and self-insurancefor a number of risks including claims related to crewand passengers, hull and machinery, workers’ compen-sation and general liability. Liabilities associated withthese risks, including estimates for crew and passengerclaims, are estimated based on, among other things,historical claims experience, severity factors and otheractuarial assumptions. Our expected loss accruals arebased on estimates, and while we believe the amountsaccrued are adequate, the ultimate loss may differ fromthe amounts provided.
Carnival Corporation & plc 11
Notes to Consolidated Financial Statements (continued)
Advertising Costs
Substantially all our advertising costs are charged toexpense as incurred except costs which result in tangi-ble assets, such as brochures, which are recorded asprepaid expenses and charged to expense as consumed.Media production costs are also recorded as prepaidexpenses and charged to expense upon the first airingof the advertisement. Advertising expenses totaled$425 million, $334 million and $208 million in fiscal 2004,2003 and 2002, respectively. At November 30, 2004and 2003, the amount of advertising costs included inprepaid expenses was not material.
Foreign Currency Translations and Transactions
For our foreign subsidiaries and affiliates using thelocal currency as their functional currency, assets andliabilities are translated at exchange rates in effect atthe balance sheet dates. Revenues and expenses ofthese foreign subsidiaries and affiliates are translated atweighted-average exchange rates for the period. Equityis translated at historical rates and the resulting cumula-tive foreign currency translation adjustments resultingfrom this process are included as a component of AOCI.Therefore, the U.S. dollar value of these items in ourfinancial statements fluctuates from period to period,depending on the value of the dollar against these func-tional currencies.
Exchange gains and losses arising from the remea-surement of transactions and monetary assets andliabilities denominated in a currency other than the func-tional currency of the entity involved are immediatelyincluded in our earnings, unless such liabilities havebeen designated to act as a hedge of a net investmentin a foreign operation.
Earnings Per Share
Basic earnings per share is computed by dividing netincome by the weighted-average number of shares ofcommon stock and ordinary shares outstanding duringeach period. Diluted earnings per share is computed bydividing adjusted net income by the weighted-averagenumber of shares of common stock and ordinary shares,common stock equivalents and other potentially dilutivesecurities outstanding during each period.
During the fourth quarter of 2004, we elected to earlyadopt Emerging Issues Task Force (“EITF”) No. 04-08,“Accounting Issues Related to Certain Features ofContingently Convertible Debt and the Effect on DilutedEarnings Per Share.” This statement requires all sharesthat are issuable under our outstanding convertible notesthat have contingent share conversion features to beconsidered outstanding for our diluted earnings per sharecomputations, if dilutive, using the “if converted” methodof accounting from the date of issuance. In prior periods,these shares were only included in our diluted earnings
per share computations if Carnival Corporation’s com-mon stock price had reached certain conversion triggerprices. As required by EITF No. 04-08, we have retro-actively restated our 2003 and 2002 diluted earningsper share amounts. Our previously reported dilutedearnings per share for 2003 and 2002 were $1.66 and$1.73, respectively.
Stock-Based Compensation
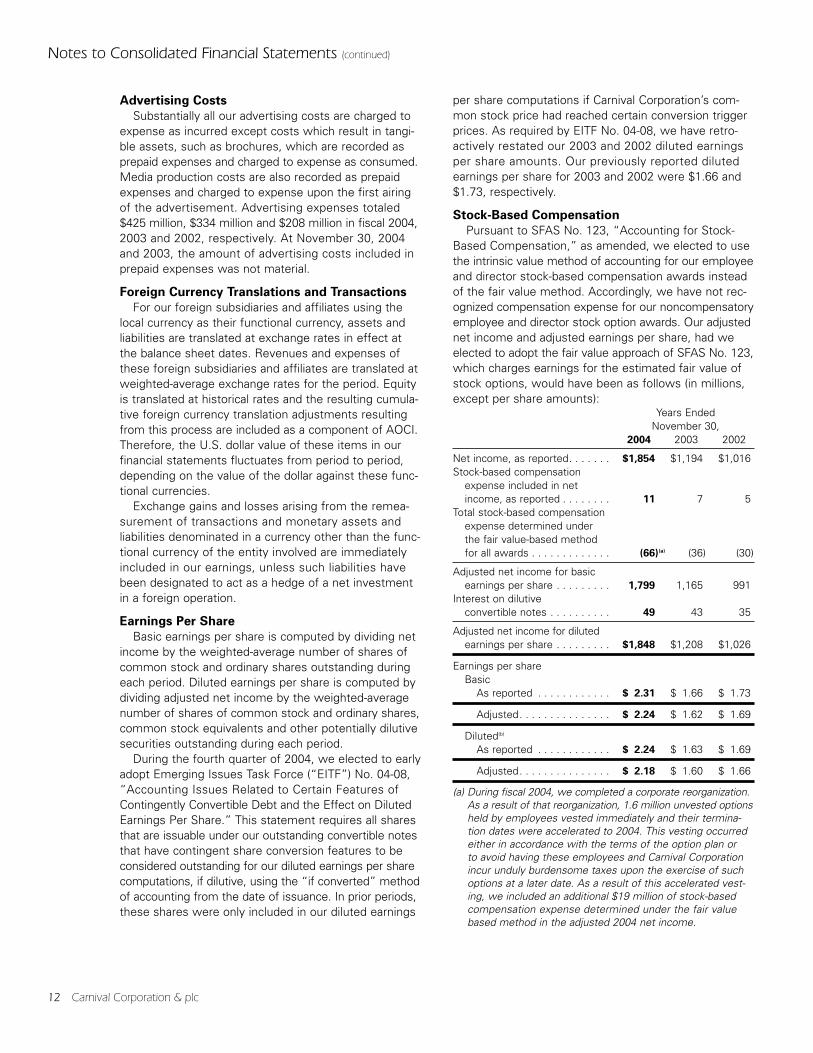
Pursuant to SFAS No. 123, “Accounting for Stock-Based Compensation,” as amended, we elected to usethe intrinsic value method of accounting for our employeeand director stock-based compensation awards insteadof the fair value method. Accordingly, we have not rec-ognized compensation expense for our noncompensatoryemployee and director stock option awards. Our adjustednet income and adjusted earnings per share, had weelected to adopt the fair value approach of SFAS No. 123,which charges earnings for the estimated fair value ofstock options, would have been as follows (in millions,except per share amounts):
Years Ended November 30,
2004 2003 2002
Net income, as reported. . . . . . . $1,854 $1,194 $1,016Stock-based compensation
expense included in netincome, as reported . . . . . . . . 11 7 5
Total stock-based compensationexpense determined underthe fair value-based methodfor all awards . . . . . . . . . . . . . (66)(a) (36) (30)
Adjusted net income for basicearnings per share . . . . . . . . . 1,799 1,165 991
Interest on dilutive convertible notes . . . . . . . . . . 49 43 35
Adjusted net income for dilutedearnings per share . . . . . . . . . $1,848 $1,208 $1,026
Earnings per shareBasic
As reported . . . . . . . . . . . . $ 2.31 $ 1.66 $ 1.73
Adjusted. . . . . . . . . . . . . . . $ 2.24 $ 1.62 $ 1.69
Diluted(b)
As reported . . . . . . . . . . . . $ 2.24 $ 1.63 $ 1.69
Adjusted. . . . . . . . . . . . . . . $ 2.18 $ 1.60 $ 1.66
(a) During fiscal 2004, we completed a corporate reorganization.As a result of that reorganization, 1.6 million unvested optionsheld by employees vested immediately and their termina-tion dates were accelerated to 2004. This vesting occurredeither in accordance with the terms of the option plan or to avoid having these employees and Carnival Corporationincur unduly burdensome taxes upon the exercise of suchoptions at a later date. As a result of this accelerated vest-ing, we included an additional $19 million of stock-basedcompensation expense determined under the fair valuebased method in the adjusted 2004 net income.
12 Carnival Corporation & plc
(b) The 2003 and 2002 diluted earnings per share amounts havebeen restated as a result of early adoption of EITF No. 04-08and we have reduced previously reported diluted earningsper share amounts by $0.03 and $0.04, respectively.
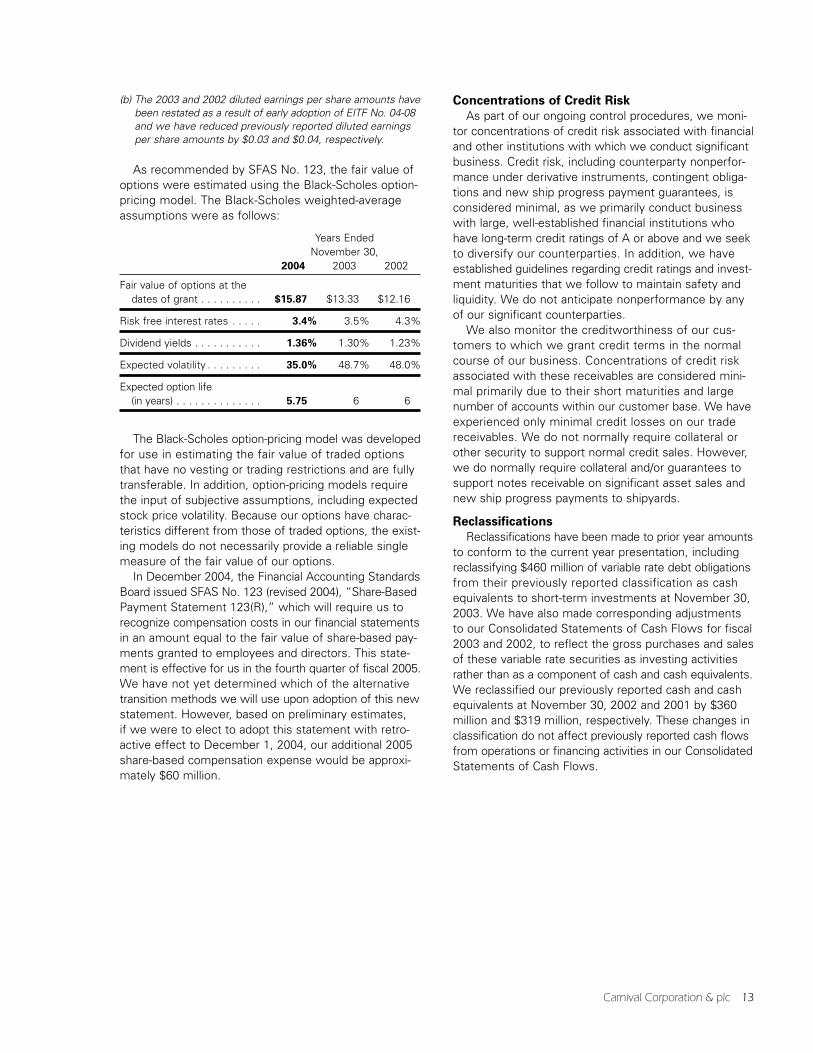
As recommended by SFAS No. 123, the fair value ofoptions were estimated using the Black-Scholes option-pricing model. The Black-Scholes weighted-averageassumptions were as follows:
Years Ended November 30,
2004 2003 2002
Fair value of options at thedates of grant . . . . . . . . . . $15.87 $13.33 $12.16
Risk free interest rates . . . . . 3.4% 3.5% 4.3%
Dividend yields . . . . . . . . . . . 1.36% 1.30% 1.23%
Expected volatility . . . . . . . . . 35.0% 48.7% 48.0%
Expected option life (in years) . . . . . . . . . . . . . . 5.75 6 6
The Black-Scholes option-pricing model was developedfor use in estimating the fair value of traded optionsthat have no vesting or trading restrictions and are fullytransferable. In addition, option-pricing models requirethe input of subjective assumptions, including expectedstock price volatility. Because our options have charac-teristics different from those of traded options, the exist-ing models do not necessarily provide a reliable singlemeasure of the fair value of our options.
In December 2004, the Financial Accounting StandardsBoard issued SFAS No. 123 (revised 2004), “Share-BasedPayment Statement 123(R),” which will require us torecognize compensation costs in our financial statementsin an amount equal to the fair value of share-based pay-ments granted to employees and directors. This state-ment is effective for us in the fourth quarter of fiscal 2005.We have not yet determined which of the alternativetransition methods we will use upon adoption of this newstatement. However, based on preliminary estimates, if we were to elect to adopt this statement with retro-active effect to December 1, 2004, our additional 2005share-based compensation expense would be approxi-mately $60 million.
Concentrations of Credit Risk
As part of our ongoing control procedures, we moni-tor concentrations of credit risk associated with financialand other institutions with which we conduct significantbusiness. Credit risk, including counterparty nonperfor-mance under derivative instruments, contingent obliga-tions and new ship progress payment guarantees, isconsidered minimal, as we primarily conduct businesswith large, well-established financial institutions whohave long-term credit ratings of A or above and we seekto diversify our counterparties. In addition, we haveestablished guidelines regarding credit ratings and invest-ment maturities that we follow to maintain safety andliquidity. We do not anticipate nonperformance by anyof our significant counterparties.
We also monitor the creditworthiness of our cus-tomers to which we grant credit terms in the normalcourse of our business. Concentrations of credit riskassociated with these receivables are considered mini-mal primarily due to their short maturities and largenumber of accounts within our customer base. We haveexperienced only minimal credit losses on our tradereceivables. We do not normally require collateral orother security to support normal credit sales. However,we do normally require collateral and/or guarantees tosupport notes receivable on significant asset sales andnew ship progress payments to shipyards.
Reclassifications
Reclassifications have been made to prior year amountsto conform to the current year presentation, includingreclassifying $460 million of variable rate debt obligationsfrom their previously reported classification as cashequivalents to short-term investments at November 30,2003. We have also made corresponding adjustmentsto our Consolidated Statements of Cash Flows for fiscal2003 and 2002, to reflect the gross purchases and salesof these variable rate securities as investing activitiesrather than as a component of cash and cash equivalents.We reclassified our previously reported cash and cashequivalents at November 30, 2002 and 2001 by $360million and $319 million, respectively. These changes inclassification do not affect previously reported cash flowsfrom operations or financing activities in our ConsolidatedStatements of Cash Flows.
Carnival Corporation & plc 13
Notes to Consolidated Financial Statements (continued)
Note 3—DLC Transaction
The contracts governing the DLC structure providethat Carnival Corporation and Carnival plc each continueto have separate boards of directors, but the boards andsenior executive management of both companies areidentical. The amendments to the constituent documentsof each of the companies also provide that, on mostmatters, the holders of the common equity of bothcompanies effectively vote as a single body. On speci-fied matters where the interests of Carnival Corporation’sshareholders may differ from the interests of Carnivalplc’s shareholders (a “class rights action”), each share-holder body will vote separately as a class, such as trans-actions primarily designed to amend or unwind the DLCstructure. Generally, no class rights action will be imple-mented unless approved by both shareholder bodies.
Upon the closing of the DLC transaction, CarnivalCorporation and Carnival plc also executed the Equaliza-tion and Governance Agreement, which provides for theequalization of dividends and liquidation distributionsbased on an equalization ratio and contains provisionsrelating to the governance of the DLC structure. Becausethe current equalization ratio is 1 to 1, one Carnival plcordinary share is entitled to the same distributions,subject to the terms of the Equalization and GovernanceAgreement, as one share of Carnival Corporation com-mon stock. In a liquidation of either company or bothcompanies, if the hypothetical potential per share liqui-dation distributions to each company’s shareholders arenot equivalent, taking into account the relative value ofthe two companies’ assets and the indebtedness ofeach company, to the extent that one company hasgreater net assets so that any liquidation distribution toits shareholders would not be equivalent on a per sharebasis, the company with the ability to make a higher netdistribution is required to make a payment to the othercompany to equalize the possible net distribution toshareholders, subject to certain exceptions.
At the closing of the DLC transaction, CarnivalCorporation and Carnival plc also executed deeds ofguarantee. Under the terms of Carnival Corporation’sdeed of guarantee, Carnival Corporation has agreed toguarantee all indebtedness and certain other monetary
obligations of Carnival plc that are incurred under agree-ments entered into on or after the closing date of theDLC transaction. The terms of Carnival plc’s deed ofguarantee are identical to those of Carnival Corporation’s.In addition, Carnival Corporation and Carnival plc haveeach extended their respective deeds of guarantee tothe other’s pre-DLC indebtedness and other monetaryobligations, thus effectively cross guaranteeing allCarnival Corporation and Carnival plc indebtedness andother monetary obligations. Each deed of guaranteeprovides that the creditors to whom the obligations areowed are intended third party beneficiaries of such deedof guarantee.
The deeds of guarantee are governed and construedin accordance with the laws of the Isle of Man. Subjectto the terms of the guarantees, the holders of indebted-ness and other obligations that are subject to the guar-antees will have recourse to both Carnival plc andCarnival Corporation though a Carnival plc creditor mustfirst make written demand on Carnival plc and a CarnivalCorporation creditor on Carnival Corporation. Once thewritten demand is made by letter or other form ofnotice, the holders of indebtedness or other obligationsmay immediately commence an action against therelevant guarantor. There is no requirement under thedeeds of guarantee to obtain a judgment, take otherenforcement actions or wait any period of time prior totaking steps against the relevant guarantor. All actionsor proceedings arising out of or in connection with thedeeds of guarantee must be exclusively brought incourts in England.
Under the terms of the DLC transaction documents,Carnival Corporation and Carnival plc are permitted totransfer assets between the companies, make loans orinvestments in each other and otherwise enter intointercompany transactions. The companies have enteredinto some of these types of transactions and expect toenter into additional transactions in the future to takeadvantage of the flexibility provided by the DLC structureand to operate both companies as a single unified eco-nomic enterprise in the most effective manner. In addi-tion, under the terms of the Equalization and GovernanceAgreement and the deeds of guarantee, the cash flow
14 Carnival Corporation & plc
and assets of one company are required to be used topay the obligations of the other company, if necessary.
Given the DLC structure as described above, webelieve that providing separate financial statements foreach of Carnival Corporation and Carnival plc would notpresent a true and fair view of the economic realities of their operations. Accordingly, separate financial state-ments for both Carnival Corporation and Carnival plchave not been presented.
Simultaneously with the completion of the DLC trans-action, a partial share offer (“PSO”) for 20% of Carnivalplc’s shares was made and accepted, which enabled20% of Carnival plc shares to be exchanged for 41.7million Carnival Corporation shares. The 41.7 millionshares of Carnival plc held by Carnival Corporation as a result of the PSO, which cost $1.05 billion, are beingaccounted for as treasury stock in the accompanyingbalance sheets. The holders of Carnival Corporationshares, including the new shareholders who exchangedtheir Carnival plc shares for Carnival Corporation sharesunder the PSO, now own an economic interest equal toapproximately 79%, and holders of Carnival plc sharesnow own an economic interest equal to approximately21%, of Carnival Corporation & plc.
The management of Carnival Corporation andCarnival plc ultimately agreed to enter into the DLCtransaction because, among other things, the creationof Carnival Corporation & plc would result in a companywith complementary well-known brands operating glob-ally with enhanced growth opportunities, benefits ofsharing best practices and generating cost savings,increased financial flexibility and access to capital marketsand a DLC structure, which allows for continued partici-pation in an investment in the global cruise industry by Carnival plc’s shareholders who wish to continue tohold shares in a UK-listed company.
Carnival plc was the third largest cruise company inthe world and operated many well-known global brandswith leading positions in the U.S., UK, Germany andAustralia. The combination of Carnival Corporation withCarnival plc under the DLC structure has been accountedfor under U.S. generally accepted accounting principles(“GAAP”) as an acquisition of Carnival plc by Carnival
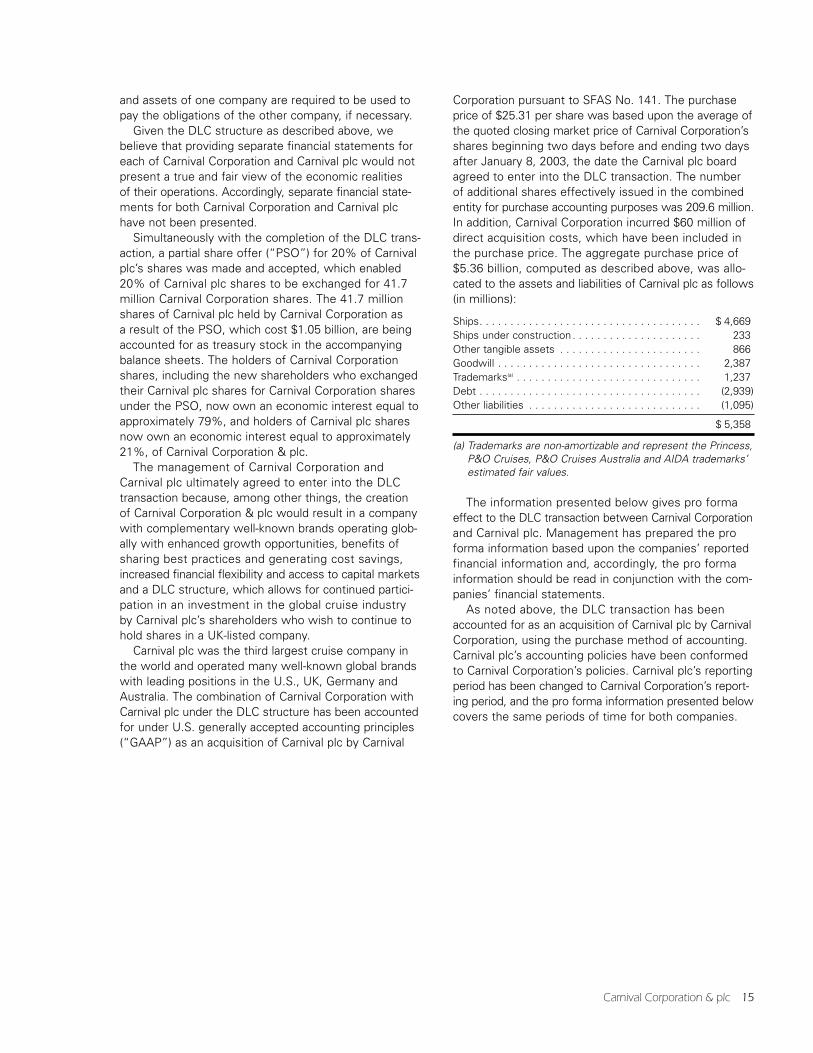
Corporation pursuant to SFAS No. 141. The purchaseprice of $25.31 per share was based upon the average ofthe quoted closing market price of Carnival Corporation’sshares beginning two days before and ending two daysafter January 8, 2003, the date the Carnival plc boardagreed to enter into the DLC transaction. The numberof additional shares effectively issued in the combinedentity for purchase accounting purposes was 209.6 million.In addition, Carnival Corporation incurred $60 million ofdirect acquisition costs, which have been included inthe purchase price. The aggregate purchase price of$5.36 billion, computed as described above, was allo-cated to the assets and liabilities of Carnival plc as follows(in millions):
Ships. . . . . . . . . . . . . . . . . . . . . . . . . . . . . . . . . . . . $ 4,669Ships under construction . . . . . . . . . . . . . . . . . . . . . 233Other tangible assets . . . . . . . . . . . . . . . . . . . . . . . 866Goodwill . . . . . . . . . . . . . . . . . . . . . . . . . . . . . . . . . 2,387Trademarks(a) . . . . . . . . . . . . . . . . . . . . . . . . . . . . . . 1,237Debt . . . . . . . . . . . . . . . . . . . . . . . . . . . . . . . . . . . . (2,939)Other liabilities . . . . . . . . . . . . . . . . . . . . . . . . . . . . (1,095)
$ 5,358
(a) Trademarks are non-amortizable and represent the Princess,P&O Cruises, P&O Cruises Australia and AIDA trademarks’estimated fair values.
The information presented below gives pro formaeffect to the DLC transaction between Carnival Corporationand Carnival plc. Management has prepared the proforma information based upon the companies’ reportedfinancial information and, accordingly, the pro formainformation should be read in conjunction with the com-panies’ financial statements.
As noted above, the DLC transaction has beenaccounted for as an acquisition of Carnival plc by CarnivalCorporation, using the purchase method of accounting.Carnival plc’s accounting policies have been conformedto Carnival Corporation’s policies. Carnival plc’s reportingperiod has been changed to Carnival Corporation’s report-ing period, and the pro forma information presented belowcovers the same periods of time for both companies.
Carnival Corporation & plc 15
Notes to Consolidated Financial Statements (continued)
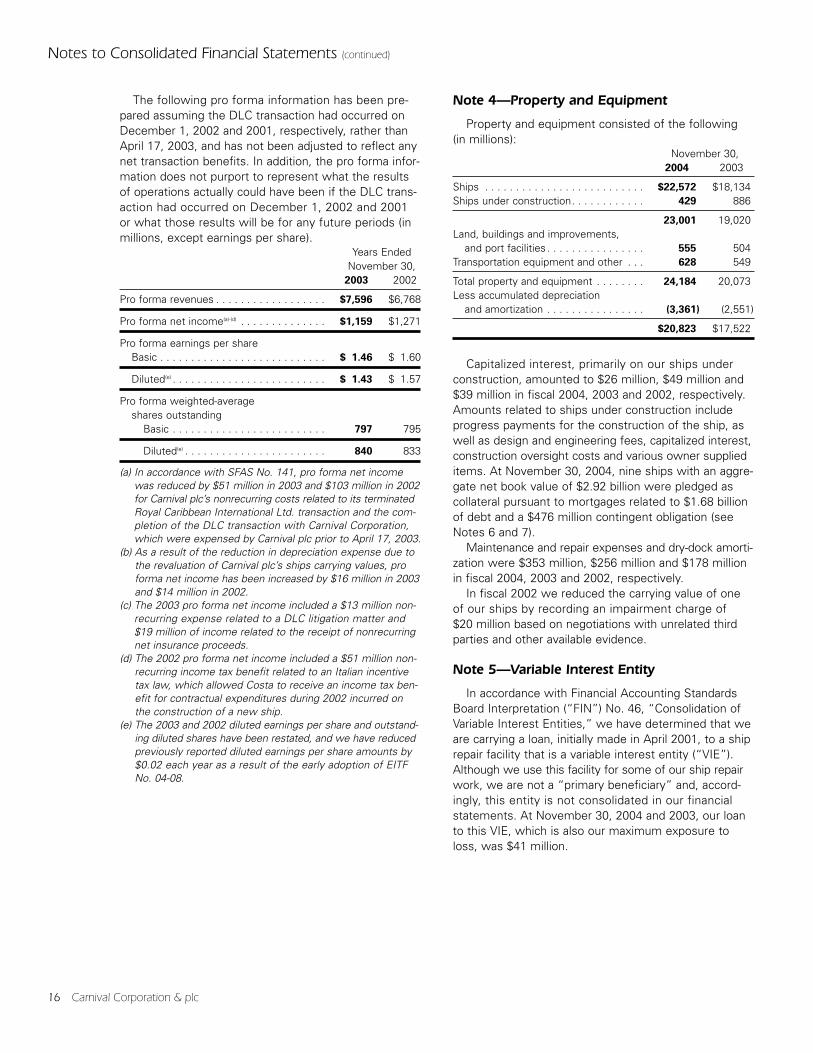
The following pro forma information has been pre-pared assuming the DLC transaction had occurred onDecember 1, 2002 and 2001, respectively, rather thanApril 17, 2003, and has not been adjusted to reflect anynet transaction benefits. In addition, the pro forma infor-mation does not purport to represent what the resultsof operations actually could have been if the DLC trans-action had occurred on December 1, 2002 and 2001 or what those results will be for any future periods (inmillions, except earnings per share).
Years Ended November 30,
2003 2002
Pro forma revenues . . . . . . . . . . . . . . . . . . $7,596 $6,768
Pro forma net income(a)-(d) . . . . . . . . . . . . . . $1,159 $1,271
Pro forma earnings per shareBasic . . . . . . . . . . . . . . . . . . . . . . . . . . . $ 1.46 $ 1.60
Diluted(e) . . . . . . . . . . . . . . . . . . . . . . . . . $ 1.43 $ 1.57
Pro forma weighted-averageshares outstanding
Basic . . . . . . . . . . . . . . . . . . . . . . . . . 797 795
Diluted(e) . . . . . . . . . . . . . . . . . . . . . . . 840 833
(a) In accordance with SFAS No. 141, pro forma net incomewas reduced by $51 million in 2003 and $103 million in 2002for Carnival plc’s nonrecurring costs related to its terminatedRoyal Caribbean International Ltd. transaction and the com-pletion of the DLC transaction with Carnival Corporation,which were expensed by Carnival plc prior to April 17, 2003.
(b) As a result of the reduction in depreciation expense due tothe revaluation of Carnival plc’s ships carrying values, proforma net income has been increased by $16 million in 2003and $14 million in 2002.
(c) The 2003 pro forma net income included a $13 million non-recurring expense related to a DLC litigation matter and $19 million of income related to the receipt of nonrecurringnet insurance proceeds.
(d) The 2002 pro forma net income included a $51 million non-recurring income tax benefit related to an Italian incentivetax law, which allowed Costa to receive an income tax ben-efit for contractual expenditures during 2002 incurred onthe construction of a new ship.
(e) The 2003 and 2002 diluted earnings per share and outstand-ing diluted shares have been restated, and we have reducedpreviously reported diluted earnings per share amounts by$0.02 each year as a result of the early adoption of EITF No. 04-08.
Note 4—Property and Equipment
Property and equipment consisted of the following (in millions):
November 30,2004 2003
Ships . . . . . . . . . . . . . . . . . . . . . . . . . . $22,572 $18,134Ships under construction. . . . . . . . . . . . 429 886
23,001 19,020Land, buildings and improvements,
and port facilities . . . . . . . . . . . . . . . . 555 504Transportation equipment and other . . . 628 549
Total property and equipment . . . . . . . . 24,184 20,073Less accumulated depreciation
and amortization . . . . . . . . . . . . . . . . (3,361) (2,551)
$20,823 $17,522
Capitalized interest, primarily on our ships underconstruction, amounted to $26 million, $49 million and$39 million in fiscal 2004, 2003 and 2002, respectively.Amounts related to ships under construction includeprogress payments for the construction of the ship, aswell as design and engineering fees, capitalized interest,construction oversight costs and various owner supplieditems. At November 30, 2004, nine ships with an aggre-gate net book value of $2.92 billion were pledged ascollateral pursuant to mortgages related to $1.68 billionof debt and a $476 million contingent obligation (seeNotes 6 and 7).
Maintenance and repair expenses and dry-dock amorti-zation were $353 million, $256 million and $178 millionin fiscal 2004, 2003 and 2002, respectively.
In fiscal 2002 we reduced the carrying value of oneof our ships by recording an impairment charge of $20 million based on negotiations with unrelated thirdparties and other available evidence.
Note 5—Variable Interest Entity
In accordance with Financial Accounting StandardsBoard Interpretation (“FIN”) No. 46, “Consolidation ofVariable Interest Entities,” we have determined that weare carrying a loan, initially made in April 2001, to a shiprepair facility that is a variable interest entity (“VIE”).Although we use this facility for some of our ship repairwork, we are not a “primary beneficiary” and, accord-ingly, this entity is not consolidated in our financialstatements. At November 30, 2004 and 2003, our loanto this VIE, which is also our maximum exposure toloss, was $41 million.
16 Carnival Corporation & plc
Carnival Corporation & plc 17
Note 6—Debt
Short-Term Borrowings
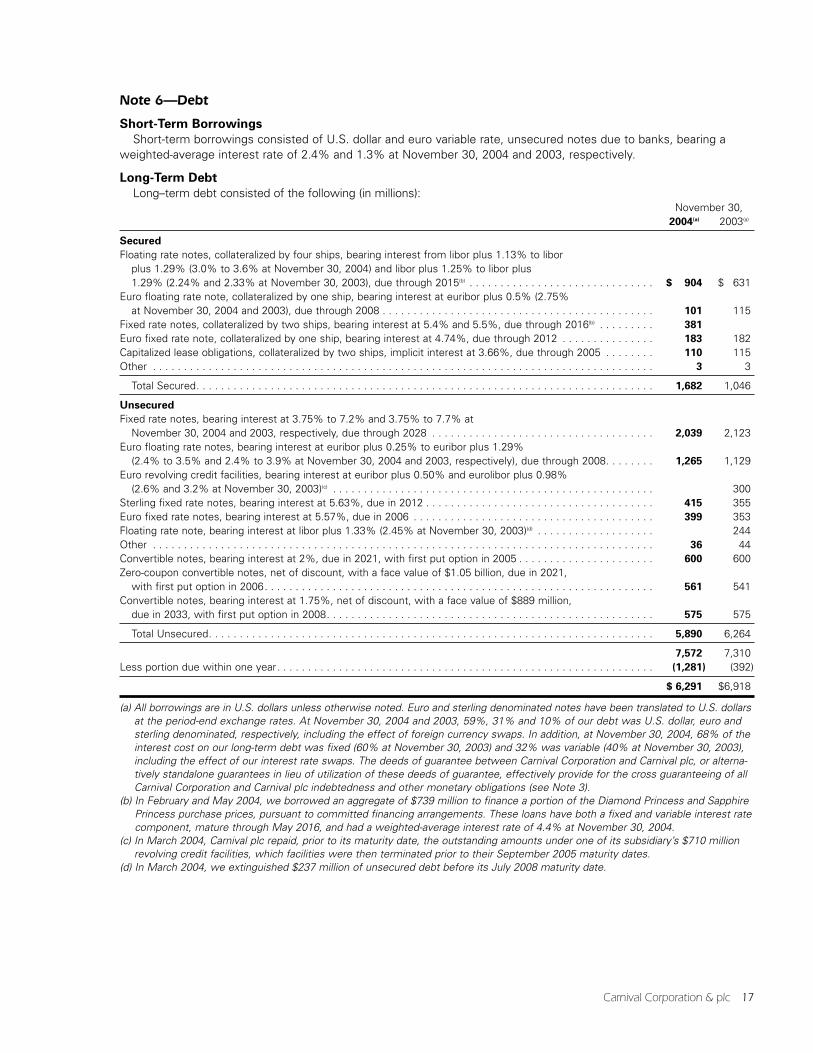
Short-term borrowings consisted of U.S. dollar and euro variable rate, unsecured notes due to banks, bearing aweighted-average interest rate of 2.4% and 1.3% at November 30, 2004 and 2003, respectively.
Long-Term Debt
Long–term debt consisted of the following (in millions):November 30,
2004(a) 2003(a)
Secured
Floating rate notes, collateralized by four ships, bearing interest from libor plus 1.13% to liborplus 1.29% (3.0% to 3.6% at November 30, 2004) and libor plus 1.25% to libor plus 1.29% (2.24% and 2.33% at November 30, 2003), due through 2015(b) . . . . . . . . . . . . . . . . . . . . . . . . . . . . . . $ 904 $ 631
Euro floating rate note, collateralized by one ship, bearing interest at euribor plus 0.5% (2.75%at November 30, 2004 and 2003), due through 2008 . . . . . . . . . . . . . . . . . . . . . . . . . . . . . . . . . . . . . . . . . . . . 101 115
Fixed rate notes, collateralized by two ships, bearing interest at 5.4% and 5.5%, due through 2016(b) . . . . . . . . . 381
Euro fixed rate note, collateralized by one ship, bearing interest at 4.74%, due through 2012 . . . . . . . . . . . . . . . 183 182Capitalized lease obligations, collateralized by two ships, implicit interest at 3.66%, due through 2005 . . . . . . . . 110 115Other . . . . . . . . . . . . . . . . . . . . . . . . . . . . . . . . . . . . . . . . . . . . . . . . . . . . . . . . . . . . . . . . . . . . . . . . . . . . . . . . . 3 3
Total Secured. . . . . . . . . . . . . . . . . . . . . . . . . . . . . . . . . . . . . . . . . . . . . . . . . . . . . . . . . . . . . . . . . . . . . . . . . . 1,682 1,046
Unsecured
Fixed rate notes, bearing interest at 3.75% to 7.2% and 3.75% to 7.7% at November 30, 2004 and 2003, respectively, due through 2028 . . . . . . . . . . . . . . . . . . . . . . . . . . . . . . . . . . . . 2,039 2,123
Euro floating rate notes, bearing interest at euribor plus 0.25% to euribor plus 1.29%(2.4% to 3.5% and 2.4% to 3.9% at November 30, 2004 and 2003, respectively), due through 2008. . . . . . . . 1,265 1,129
Euro revolving credit facilities, bearing interest at euribor plus 0.50% and eurolibor plus 0.98%(2.6% and 3.2% at November 30, 2003)(c) . . . . . . . . . . . . . . . . . . . . . . . . . . . . . . . . . . . . . . . . . . . . . . . . . . . . 300
Sterling fixed rate notes, bearing interest at 5.63%, due in 2012 . . . . . . . . . . . . . . . . . . . . . . . . . . . . . . . . . . . . . 415 355Euro fixed rate notes, bearing interest at 5.57%, due in 2006 . . . . . . . . . . . . . . . . . . . . . . . . . . . . . . . . . . . . . . . 399 353Floating rate note, bearing interest at libor plus 1.33% (2.45% at November 30, 2003)(d) . . . . . . . . . . . . . . . . . . . 244Other . . . . . . . . . . . . . . . . . . . . . . . . . . . . . . . . . . . . . . . . . . . . . . . . . . . . . . . . . . . . . . . . . . . . . . . . . . . . . . . . . 36 44Convertible notes, bearing interest at 2%, due in 2021, with first put option in 2005 . . . . . . . . . . . . . . . . . . . . . . 600 600Zero-coupon convertible notes, net of discount, with a face value of $1.05 billion, due in 2021,
with first put option in 2006. . . . . . . . . . . . . . . . . . . . . . . . . . . . . . . . . . . . . . . . . . . . . . . . . . . . . . . . . . . . . . . 561 541Convertible notes, bearing interest at 1.75%, net of discount, with a face value of $889 million,
due in 2033, with first put option in 2008. . . . . . . . . . . . . . . . . . . . . . . . . . . . . . . . . . . . . . . . . . . . . . . . . . . . . 575 575
Total Unsecured. . . . . . . . . . . . . . . . . . . . . . . . . . . . . . . . . . . . . . . . . . . . . . . . . . . . . . . . . . . . . . . . . . . . . . . . 5,890 6,264
7,572 7,310Less portion due within one year. . . . . . . . . . . . . . . . . . . . . . . . . . . . . . . . . . . . . . . . . . . . . . . . . . . . . . . . . . . . . (1,281) (392)
$ 6,291 $6,918
(a) All borrowings are in U.S. dollars unless otherwise noted. Euro and sterling denominated notes have been translated to U.S. dollarsat the period-end exchange rates. At November 30, 2004 and 2003, 59%, 31% and 10% of our debt was U.S. dollar, euro andsterling denominated, respectively, including the effect of foreign currency swaps. In addition, at November 30, 2004, 68% of theinterest cost on our long-term debt was fixed (60% at November 30, 2003) and 32% was variable (40% at November 30, 2003),including the effect of our interest rate swaps. The deeds of guarantee between Carnival Corporation and Carnival plc, or alterna-tively standalone guarantees in lieu of utilization of these deeds of guarantee, effectively provide for the cross guaranteeing of allCarnival Corporation and Carnival plc indebtedness and other monetary obligations (see Note 3).
(b) In February and May 2004, we borrowed an aggregate of $739 million to finance a portion of the Diamond Princess and SapphirePrincess purchase prices, pursuant to committed financing arrangements. These loans have both a fixed and variable interest ratecomponent, mature through May 2016, and had a weighted-average interest rate of 4.4% at November 30, 2004.
(c) In March 2004, Carnival plc repaid, prior to its maturity date, the outstanding amounts under one of its subsidiary’s $710 millionrevolving credit facilities, which facilities were then terminated prior to their September 2005 maturity dates.
(d) In March 2004, we extinguished $237 million of unsecured debt before its July 2008 maturity date.
Notes to Consolidated Financial Statements (continued)
18 Carnival Corporation & plc
Convertible Notes
Carnival Corporation’s 2% convertible notes (“2%Notes”), its zero-coupon convertible notes (“Zero-CouponNotes”) and its 1.75% convertible notes (“1.75% Notes”)are convertible into 15.3 million shares, 17.4 millionshares and a maximum of 20.9 million shares (10.8 mil-lion shares during fiscal 2004), respectively, of CarnivalCorporation common stock.
The 2% Notes are convertible at a conversion priceof $39.14 per share, subject to adjustment, during anyfiscal quarter for which the closing price of the CarnivalCorporation common stock is greater than $43.05 pershare for a defined duration of time in the precedingfiscal quarter. The conditions for conversion of the 2%Notes were satisfied throughout fiscal 2004 and, accord-ingly, the 2% Notes were convertible into CarnivalCorporation common stock commencing with the secondquarter of fiscal 2004. A nominal amount of 2% Noteswere converted in fiscal 2004.
At November 30, 2004, the 2% Notes were classifiedas a current liability, since we may be required to redeemthe notes at the option of the holders on April 15, 2005at their face value plus any unpaid accrued interest. Ifthe noteholders do not exercise this option, then wewill change the classification of the 2% Notes to long-term debt, as the next optional redemption date doesnot occur until April 15, 2008. We do not currently expectthese noteholders to exercise their put options, as thecurrent market value of the 2% Notes is greater thanthe redemption price.
The Zero-Coupon Notes have a 3.75% yield to matu-rity and are convertible during any fiscal quarter for whichthe closing price of the Carnival Corporation commonstock is greater than a specified trigger price for a definedduration of time in the preceding fiscal quarter. The trig-ger price commenced at a low of $31.94 per share forthe first quarter of fiscal 2002 and increases at an annualrate of 3.75% thereafter, until maturity. Since the thirdquarter of 2003, the Zero-Coupon Notes have beenconvertible into Carnival Corporation common stock forthe quarter following that quarter in which it was con-vertible as a result of Carnival Corporation’s commonstock achieving its target conversion trigger price per
share, which ranged from $33.77 for the 2003 thirdquarter to $35.38 for the 2004 fourth quarter, for therequisite periods of time. No Zero-Coupon Notes wereconverted in fiscal 2003 or 2004.
The 1.75% Notes, which were issued in April 2003,are convertible at a conversion price of $53.11 pershare, subject to adjustment, during any fiscal quarterfor which the closing price of the Carnival Corporationcommon stock is greater than a specified trigger pricefor a defined duration of time in the preceding fiscalquarter. During the fiscal quarters ending from August 31,2003 through April 29, 2008, the trigger price will be$63.73 per share. Thereafter, this conversion triggerprice increases each quarter based on an annual rate of 1.75%, until maturity. In addition, holders may alsosurrender the 1.75% Notes for conversion if they havebeen called for redemption or for other specified occur-rences, including the credit rating assigned to the 1.75%Notes being Baa3 or lower by Moody’s Investors Serv-ice and BBB- or lower by Standard & Poor’s RatingServices, as well as certain corporate transactions. Theconditions for conversion of the 1.75% Notes have notbeen met since their issuance. The 1.75% Notes inter-est is payable in cash semi-annually in arrears, commen-cing October 29, 2003 through April 29, 2008. EffectiveApril 30, 2008, the 1.75% Notes no longer require acash interest payment, but interest will accrete at a 1.75%yield to maturity.
Subsequent to April 29, 2008 and October 23, 2008,we may redeem all or a portion of the 1.75% Notes andZero-Coupon Notes, respectively, at their accreted valuesand subsequent to April 14, 2008, we may redeem allor a portion of our 2% Notes at their face value plusany unpaid accrued interest, subject to the noteholders’right to convert.
In addition, on April 29 of 2008, 2013, 2018, 2023and 2028 the 1.75% noteholders, on April 15 of 2005,2008 and 2011 the 2% noteholders and on October 24of 2006, 2008, 2011 and 2016 the Zero-Coupon note-holders may require us to repurchase all or a portion ofthe outstanding 1.75% Notes and Zero-Coupon Notesat their accreted values and the 2% Notes at their facevalue plus any unpaid accrued interest.
Carnival Corporation & plc 19
Upon conversion, redemption or repurchase of the1.75% Notes, the 2% Notes and the Zero-Coupon Notes,we may choose to deliver Carnival Corporation commonstock, cash or a combination of cash and common stockwith a total value equal to the value of the considerationotherwise deliverable.
Revolving Credit Facilities
Costa has a 257.5 million euro ($342 million U.S. dol-lars at the November 30, 2004 exchange rate) unsecuredeuro revolving credit facility, which expires in May 2006.At November 30, 2004, this entire facility was available.
In March 2004, Carnival plc entered into a 600 millioneuro ($798 million U.S. dollar at the November 30, 2004exchange rate) unsecured 364-day multi-currency revolv-ing credit facility, which currently bears interest ateurolibor plus 30 basis points (“BPS”). This interest ratespread over the base rate will vary based on changes toCarnival plc’s senior unsecured credit rating. This facilityalso has a nine BPS commitment fee on the undrawnportion and expires in March 2005, but provides Carnivalplc with the option to extend the repayment date of thethen existing outstanding borrowings to June 2006. AtNovember 30, 2004, this entire facility was available. In 2004, Carnival plc established U.S. dollar and multi-currency commercial paper programs, which are sup-ported by this 600 million euro revolving credit facilityand, accordingly, any amounts outstanding under thesecommercial paper programs, none at November 30,2004, will reduce the aggregate amount available underthe facility.
Carnival Corporation’s $1.4 billion unsecured multi-currency revolving credit facility matures in June 2006.This facility currently bears interest at USD Libor plus20 BPS, which interest rate spread over the base ratewill vary based on changes to Carnival Corporation’ssenior unsecured debt ratings, and provides for anundrawn facility fee of ten BPS. Carnival Corporation’sU.S. dollar commercial paper program is supported bythis revolving credit facility and, accordingly, any amountsoutstanding under its commercial paper program, noneat November 30, 2004 and 2003, effectively reduce the aggregate amount available under this facility. AtNovember 30, 2004, the entire facility was available.
These $1.4 billion and 600 million euro facilities andother of our loan and derivative agreements, containcovenants that require us, among other things, to main-tain a minimum debt service coverage, minimum share-holders’ equity and limits our debt to capital and debt to equity ratios, and the amounts of our secured assetsand secured indebtedness. In addition, if our businesssuffers a material adverse change or if other events ofdefault under our loan agreements are triggered, thenpursuant to cross default acceleration clauses, substan-tially all of our outstanding debt and derivative contractpayables could become due and the underlying facilitiescould be terminated. At November 30, 2004, we werein compliance with all of our debt covenants.
At November 30, 2004, the scheduled annual maturi-ties of our long-term debt was as follows (in millions):
Fiscal
2005 . . . . . . . . . . . . . . . . . . . . . . . . . . . . . . . . . . . . $1,281(a)
2006 . . . . . . . . . . . . . . . . . . . . . . . . . . . . . . . . . . . . 1,686(a)
2007 . . . . . . . . . . . . . . . . . . . . . . . . . . . . . . . . . . . . 1,0582008 . . . . . . . . . . . . . . . . . . . . . . . . . . . . . . . . . . . . 1,435(a)
2009 . . . . . . . . . . . . . . . . . . . . . . . . . . . . . . . . . . . . 141Thereafter . . . . . . . . . . . . . . . . . . . . . . . . . . . . . . . . 1,971
$7,572
(a) Includes $600 million of Carnival Corporation’s 2% Notes in2005, $561 million of its Zero-Coupon Notes in 2006, and$575 million of its 1.75% Notes in 2008, based in each caseon the date of the noteholders’ first put option.
Debt issuance costs are generally amortized to interestexpense using the straight-line method, which approxi-mates the effective interest method, over the term ofthe notes or the noteholders first put option date, which-ever is earlier. In addition, all loan issue discounts areamortized to interest expense using the effective interestrate method over the term of the notes.
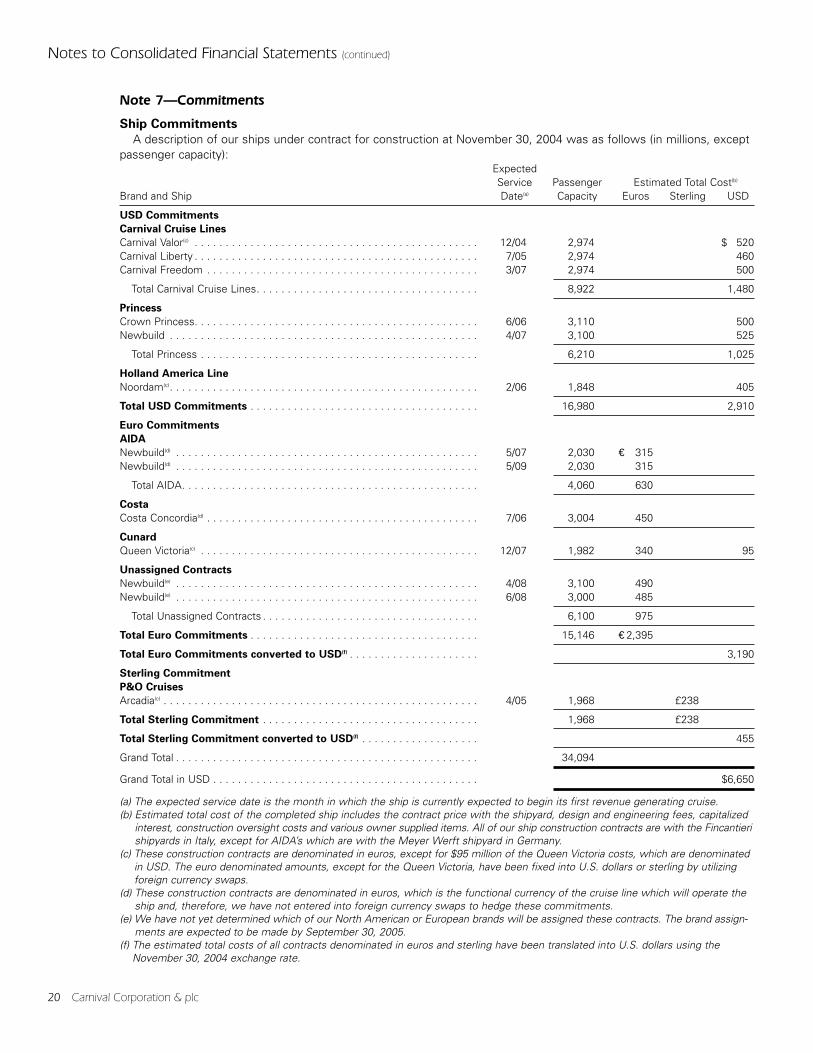
20 Carnival Corporation & plc
Note 7—Commitments
Ship Commitments
A description of our ships under contract for construction at November 30, 2004 was as follows (in millions, exceptpassenger capacity):
ExpectedService Passenger Estimated Total Cost(b)
Brand and Ship Date(a) Capacity Euros Sterling USD
USD Commitments
Carnival Cruise Lines
Carnival Valor(c) . . . . . . . . . . . . . . . . . . . . . . . . . . . . . . . . . . . . . . . . . . . . . . 12/04 2,974 $ 520Carnival Liberty . . . . . . . . . . . . . . . . . . . . . . . . . . . . . . . . . . . . . . . . . . . . . . 7/05 2,974 460Carnival Freedom . . . . . . . . . . . . . . . . . . . . . . . . . . . . . . . . . . . . . . . . . . . . 3/07 2,974 500
Total Carnival Cruise Lines. . . . . . . . . . . . . . . . . . . . . . . . . . . . . . . . . . . . 8,922 1,480
Princess
Crown Princess. . . . . . . . . . . . . . . . . . . . . . . . . . . . . . . . . . . . . . . . . . . . . . 6/06 3,110 500Newbuild . . . . . . . . . . . . . . . . . . . . . . . . . . . . . . . . . . . . . . . . . . . . . . . . . . 4/07 3,100 525
Total Princess . . . . . . . . . . . . . . . . . . . . . . . . . . . . . . . . . . . . . . . . . . . . . 6,210 1,025
Holland America Line
Noordam(c). . . . . . . . . . . . . . . . . . . . . . . . . . . . . . . . . . . . . . . . . . . . . . . . . . 2/06 1,848 405
Total USD Commitments . . . . . . . . . . . . . . . . . . . . . . . . . . . . . . . . . . . . . 16,980 2,910
Euro Commitments
AIDA
Newbuild(d) . . . . . . . . . . . . . . . . . . . . . . . . . . . . . . . . . . . . . . . . . . . . . . . . . 5/07 2,030 € 315Newbuild(d) . . . . . . . . . . . . . . . . . . . . . . . . . . . . . . . . . . . . . . . . . . . . . . . . . 5/09 2,030 315
Total AIDA. . . . . . . . . . . . . . . . . . . . . . . . . . . . . . . . . . . . . . . . . . . . . . . . 4,060 630
Costa
Costa Concordia(d) . . . . . . . . . . . . . . . . . . . . . . . . . . . . . . . . . . . . . . . . . . . . 7/06 3,004 450
Cunard
Queen Victoria(c) . . . . . . . . . . . . . . . . . . . . . . . . . . . . . . . . . . . . . . . . . . . . . 12/07 1,982 340 95
Unassigned Contracts
Newbuild(e) . . . . . . . . . . . . . . . . . . . . . . . . . . . . . . . . . . . . . . . . . . . . . . . . . 4/08 3,100 490Newbuild(e) . . . . . . . . . . . . . . . . . . . . . . . . . . . . . . . . . . . . . . . . . . . . . . . . . 6/08 3,000 485
Total Unassigned Contracts . . . . . . . . . . . . . . . . . . . . . . . . . . . . . . . . . . . 6,100 975
Total Euro Commitments . . . . . . . . . . . . . . . . . . . . . . . . . . . . . . . . . . . . . 15,146 € 2,395
Total Euro Commitments converted to USD(f) . . . . . . . . . . . . . . . . . . . . . 3,190
Sterling Commitment
P&O Cruises
Arcadia(c) . . . . . . . . . . . . . . . . . . . . . . . . . . . . . . . . . . . . . . . . . . . . . . . . . . . 4/05 1,968 £238
Total Sterling Commitment . . . . . . . . . . . . . . . . . . . . . . . . . . . . . . . . . . . 1,968 £238
Total Sterling Commitment converted to USD(f) . . . . . . . . . . . . . . . . . . . 455
Grand Total . . . . . . . . . . . . . . . . . . . . . . . . . . . . . . . . . . . . . . . . . . . . . . . . . 34,094
Grand Total in USD . . . . . . . . . . . . . . . . . . . . . . . . . . . . . . . . . . . . . . . . . . . $6,650
(a) The expected service date is the month in which the ship is currently expected to begin its first revenue generating cruise.(b) Estimated total cost of the completed ship includes the contract price with the shipyard, design and engineering fees, capitalized
interest, construction oversight costs and various owner supplied items. All of our ship construction contracts are with the Fincantierishipyards in Italy, except for AIDA’s which are with the Meyer Werft shipyard in Germany.
(c) These construction contracts are denominated in euros, except for $95 million of the Queen Victoria costs, which are denominatedin USD. The euro denominated amounts, except for the Queen Victoria, have been fixed into U.S. dollars or sterling by utilizingforeign currency swaps.
(d) These construction contracts are denominated in euros, which is the functional currency of the cruise line which will operate theship and, therefore, we have not entered into foreign currency swaps to hedge these commitments.
(e) We have not yet determined which of our North American or European brands will be assigned these contracts. The brand assign-ments are expected to be made by September 30, 2005.
(f) The estimated total costs of all contracts denominated in euros and sterling have been translated into U.S. dollars using theNovember 30, 2004 exchange rate.
Notes to Consolidated Financial Statements (continued)
Carnival Corporation & plc 21
In connection with our cruise ships under contract for construction, we have paid $429 million throughNovember 30, 2004 and anticipate paying the remainingestimated total costs as follows: $1.54 billion, $1.40 bil-lion, $1.33 billion, $1.60 billion and $357 million in fiscal2005 through 2009, respectively.
Subsequent to November 30, 2004, Costa enteredinto a ship construction contract with Fincantieri for a3,000 passenger ship, which has an estimated all-in costof 475 million euros, and is expected to enter service in June 2007.
Operating Leases
Rent expense under our operating leases, primarilyfor office and warehouse space, was $50 million, $48million and $15 million in fiscal 2004, 2003 and 2002,respectively. At November 30, 2004, minimum annualrentals for our operating leases, with initial or remainingterms in excess of one year, were as follows (in millions):$51, $37, $25, $21, $18 and $79 in fiscal 2005 through2009 and thereafter, respectively.
Port Facilities and Other
At November 30, 2004, we had commitments through2052, with initial or remaining terms in excess of oneyear, to pay minimum amounts for our annual usage ofport facilities and other contractual commitments as fol-lows (in millions): $135, $92, $73, $72, $66 and $368 infiscal 2005 through 2009 and thereafter, respectively.
Note 8—Contingencies
Litigation
In 2002, two actions (collectively, the “FacsimileComplaints”) were filed against Carnival Corporation onbehalf of purported classes of persons who receivedunsolicited advertisements via facsimile, alleging thatCarnival Corporation and other defendants distributedunsolicited advertisements via facsimile in contraven-tion of the U.S. Telephone Consumer Protection Act.The plaintiffs seek to enjoin the sending of unsolicitedfacsimile advertisements and statutory damages. Theadvertisements referred to in the Facsimile Complaintsthat reference a Carnival Cruise Line product were notsent by Carnival Corporation, but rather were distributedby a professional faxing company at the behest of travelagencies. We do not advertise directly to the travelingpublic through the use of facsimile transmission. Theultimate outcomes of the Facsimile Complaints cannotbe determined at this time. We believe that we havemeritorious defenses to these claims and, accordingly,we intend to vigorously defend against these actions.
In February 2001, Holland America Line-USA, Inc.(“HAL-USA”), our wholly-owned subsidiary, received agrand jury subpoena requesting that it produce docu-ments and records relating to the air emissions fromHolland America Line ships in Alaska. HAL-USA responded
to the subpoena. The ultimate outcome of this mattercannot be determined at this time.
In August 2002, Holland America Line’s Ryndam dis-charged wastewater from the ship while in Juneau,Alaska. In December 2004, a plea agreement betweenHAL Maritime Ltd. (“HAL Maritime”), a wholly-ownedsubsidiary, and the U.S. government was entered inwhich HAL Maritime pled guilty to a single misdemeanor.Pursuant to the plea agreement, HAL Maritime paid a $0.2 million criminal fine, a $0.5 million communityservice payment, and agreed to expend $1.3 milliontoward the implementation of a Focused EnvironmentalCompliance Plan. The agreement also provides for athree-year probationary term, with the ability to requestearly termination of probation after two years. HALMaritime also paid a civil fine of $65,000 to the State of Alaska as a result of the same event.
In March 2004, Holland America Line notified theUnited States and Netherlands governmental authoritiesthat one of its chief engineers had admitted to improp-erly processing bilge water on the Noordam. A subse-quent internal investigation has determined that theimproper operation may have begun in January 2004and may have continued sporadically through March 4,2004. Holland America Line and three shipboard engi-neers have received grand jury subpoenas from theOffice of the U.S. Attorney in Tampa, Florida. If thegovernment investigations result in charges being filed,a judgment could include, among other forms of relief,fines and debarment from federal contracting, whichwould prohibit operations in Glacier Bay National Parkand Preserve (“Glacier Bay”) during the period of debar-ment. The ultimate outcome of this matter cannot bedetermined at this time.
In August 2004, Holland America Line was notifiedby the National Park Service (“NPS”) that the Volendamand Statendam may have violated opacity standardswhile operating in Glacier Bay. In November 2004, NPSnotified Holland America Line in separate letters that aViolation of Record would be entered in the permanentpark files for each ship. Holland America Line intends tovigorously oppose the decision in each case. The ulti-mate outcome of these matters cannot be determinedat this time. However, if the Violations of Record arenot reversed and either ship receives a second suchviolation within three years, that ship may be barredfrom entry into Glacier Bay.
If Holland America Line were to lose its Glacier Baypermits as a result of the Ryndam plea or the Noordaminvestigations, or if the Statendam or Volendam wereprohibited from entering Glacier Bay, we would notexpect the impact on our financial statements to bematerial to us since we believe there are additionalattractive alternative destinations in Alaska and else-where that can be substituted for Glacier Bay.
22 Carnival Corporation & plc
Notes to Consolidated Financial Statements (continued)
Costa has instituted arbitration proceedings in Italy toconfirm the validity of its decision not to deliver its ship,the Costa Classica, to the shipyard of Cammell LairdHoldings PLC (“Cammell Laird”) under a 79 million eurodenominated contract for the conversion and lengthen-ing of the ship in November 2000. Costa has also givennotice of termination of the contract. In October 2004the arbitration tribunal decided to increase the scope of work of the technical experts by introducing newdemands for reply in the experts’ report. It is expectedthat the arbitration tribunal’s decision will be made inthe second half of 2005 at the earliest. In the event thatan award is given in favor of Cammell Laird, the amountof damages, which Costa would have to pay, if any, isnot currently determinable. The ultimate outcome ofthis matter cannot be determined at this time.
In April 2003, Festival Crociere S.p.A. (“Festival”)commenced an action against the European Commission(the “Commission”) in the Court of First Instance of theEuropean Communities in Luxembourg seeking to annulthe Commission’s antitrust approval of the DLC trans-action (the “Festival Action”). We have been grantedleave to intervene in the Festival Action and filed aStatement in Intervention with the court. Festival wasdeclared bankrupt in May 2004 and Festival did notsubmit observations on our Statement in Intervention. A date for an oral hearing will be set in due course,unless Festival withdraws its action. A successful thirdparty challenge of an unconditional Commission clear-ance decision would be unprecedented, and based on areview of the law and the factual circumstances of theDLC transaction, as well as the Commission’s approvaldecision in relation to the DLC transaction, we believethat the Festival Action will not have a material adverseeffect on the companies or the DLC transaction. How-ever, the ultimate outcome of this matter cannot bedetermined at this time.
In the normal course of our business, various otherclaims and lawsuits have been filed or are pending againstus. Most of these claims and lawsuits are covered byinsurance and, accordingly, the maximum amount of ourliability is typically limited to our self-insurance retentionlevels. However, the ultimate outcome of these claimsand lawsuits which are not covered by insurance cannotbe determined at this time.
Contingent Obligations
At November 30, 2004, Carnival Corporation had con-tingent obligations totaling $1.08 billion to participants in lease out and lease back type transactions for threeof its ships. At the inception of the leases, the entireamount of the contingent obligations was paid by CarnivalCorporation to major financial institutions to enablethem to directly pay these obligations. Accordingly,these obligations were considered extinguished, and
neither the funds paid to the financial institutions northe contingent obligations have been included on ourbalance sheets. Carnival Corporation would only berequired to make any payments under these contingentobligations in the remote event of nonperformance by these financial institutions, all of which have long-term credit ratings of AAA or AA. In addition, CarnivalCorporation obtained a direct guarantee from anotherAAA rated financial institution for $294 million of theabove noted contingent obligations, thereby furtherreducing the already remote exposure to this portion ofthe contingent obligations. If the major financial institu-tions’ credit ratings fall below AA-, Carnival Corporationwould be required to move a majority of the funds fromthese financial institutions to other highly-rated financialinstitutions. If Carnival Corporation’s credit rating fallsbelow BBB, it would be required to provide a standbyletter of credit for $88 million, or alternatively providemortgages in the aggregate amount of $88 million ontwo of its ships.
In the unlikely event that Carnival Corporation wereto terminate the three lease agreements early or defaulton our obligations, it would, as of November 30, 2004,have to pay a total of $177 million in stipulated damages.As of November 30, 2004, $186 million of standby lettersof credit have been issued by a major financial institu-tion in order to provide further security for the paymentof these contingent stipulated damages. In addition, in2004 Carnival Corporation entered into a five year $170million unsecured revolving credit facility, guaranteed by Carnival plc, which is being used to support thesestandby letters of credit through the issuance of a back-up letter of credit. In the event we were to default undercovenants in our loan agreements, any amounts out-standing under the $170 million unsecured revolvingcredit facility would be due and payable, and we wouldbe required to post cash collateral to support the stipu-lated damages standby letters of credit in excess of$170 million. Between 2017 and 2022, we have theright to exercise options that would terminate thesetransactions at no cost to us. As a result of these threetransactions, we have $39 million and $42 million ofdeferred income recorded on our balance sheets as ofNovember 30, 2004 and 2003, respectively, which isbeing amortized to nonoperating income through 2022.
Some of the debt agreements that we enter intoinclude indemnification provisions that obligate us tomake payments to the counterparty if certain eventsoccur. These contingencies generally relate to changesin taxes, changes in laws that increase lender capitalcosts and other similar costs. The indemnification clausesare often standard contractual terms and were enteredinto in the normal course of business. There are nostated or notional amounts included in the indemnifi-
Carnival Corporation & plc 23
cation clauses and we are not able to estimate themaximum potential amount of future payments, if any,under these indemnification clauses. We have not beenrequired to make any material payments under suchindemnification clauses in the past and, under currentcircumstances, we do not believe a request for materialfuture indemnification is probable.
Note 9—Income and Other Taxes
We believe that substantially all of our income in fis-cal 2004, 2003 and 2002, with the exception of our U.S.source income principally from the transportation, hoteland tour businesses of Holland America Tours andPrincess Tours, is exempt from U.S. federal incometaxes. If we were found not to qualify for exemptionpursuant to applicable income tax treaties or under theInternal Revenue Code or if the income tax treaties orInternal Revenue Code were to be changed in a manneradverse to us, a portion of our income would becomesubject to taxation by the U.S. at higher than normalcorporate tax rates.
In August 2003, final regulations under Section 883of the Internal Revenue Code were published in theFederal Register. Section 883 is the primary provisionupon which we rely to exempt certain of our interna-tional ship operation earnings from U.S. income taxes.The final regulations list elements of income that arenot considered to be incidental to ship operations and,to the extent earned within the U.S., are subject to U.S.income tax. Among the items identified in the final reg-ulations are income from the sale of air transportation,shore excursions and pre-and post cruise land packages.These rules will first be effective for us in fiscal 2005.
AIDA, through October 2004, Cunard, Ocean Village,P&O Cruises, P&O Cruises Australia and Swan Hellenicare all strategically and commercially managed in theUK and have elected to enter the UK tonnage tax regime.Accordingly, these operations pay UK corporation tax onshipping profits calculated by reference to the net ton-nage of qualifying vessels. Income not considered to beshipping profits is taxable under the normal UK incometax rules. We believe that substantially all of the incomeattributable to these brands constitutes shipping profitsand, accordingly, UK income tax expense from theseoperations has been and is expected to be minimal.
Some of our subsidiaries, including AIDA, a subsidiaryof Costa commencing in November 2004, Costa, HollandAmerica Tours, Princess Tours and other of our non-shipping activities, are subject to foreign and/or U.S.federal and state income taxes. In fiscal 2004 and 2003,we recognized a net $47 million and $29 million incometax expense, primarily related to these operations. In
2002, we recognized a net $57 million income tax bene-fit primarily due to an Italian investment incentive law,which allowed Costa to receive a $51 million incometax benefit based on contractual expenditures during2002 on the construction of a new ship. At November30, 2004, Costa had a remaining net deferred tax assetof approximately $13 million relating primarily to the tax benefit of the net operating loss carryforwards arisingfrom this incentive law, which expire in 2007.
We do not expect to incur income taxes on futuredistributions of undistributed earnings of foreign sub-sidiaries and, accordingly, no deferred income taxes havebeen provided for the distribution of these earnings.
In addition to or in place of income taxes, virtually alljurisdictions where our ships call, impose taxes basedon passenger counts, ship tonnage or some othermeasure. These taxes, other than those directly chargedto and/or collected from passengers by us, are recordedas operating expenses in the accompanying statementsof operations.
Note 10—Shareholders’ Equity
Carnival Corporation’s articles of incorporation author-ize its Board of Directors, at its discretion, to issue upto 40 million shares of its preferred stock and Carnivalplc has 100,000 authorized preference shares. AtNovember 30, 2004 and 2003, no Carnival Corporationpreferred stock had been issued and only a nominalamount of Carnival plc preferred shares had been issued.
In October 2004, the Board of Directors authorizedthe repurchase of either Carnival Corporation commonstock and/or Carnival plc ordinary shares up to an aggre-gate of $1 billion commencing in 2005, subject to certainrepurchase restrictions on Carnival plc shares.
At November 30, 2004, there were 88.4 millionshares of Carnival Corporation common stock reservedfor issuance pursuant to its convertible notes and itsemployee benefit and dividend reinvestment plans. Inaddition, Carnival plc shareholders have authorized 3.2million ordinary shares for future issuance under itsemployee benefit plans.
At November 30, 2004 and 2003 accumulated othercomprehensive income was as follows (in millions):
2004 2003
Cumulative foreign currency translation adjustments, net . . . . . . . . . . . $588 $190
Unrealized gain on marketable securities . . . 1Minimum pension liability adjustments. . . . . (17) (14)Unrealized losses on cash flow
derivative hedges, net . . . . . . . . . . . . . . . (30) (17)
$541 $160
24 Carnival Corporation & plc
Notes to Consolidated Financial Statements (continued)
Note 11—Financial Instruments
We estimated the fair value of our financial instru-ments through the use of public market prices, quotesfrom financial institutions and other available informa-tion. Considerable judgment is required in interpretingdata to develop estimates of fair value and, accordingly,amounts are not necessarily indicative of the amountsthat we could realize in a current market exchange. Our financial instruments are not held for trading or otherspeculative purposes.
Cash and Cash Equivalents and Short-Term
Investments
The carrying amounts of our cash and cash equivalentsand short-term investments approximate their fair valuesdue to their short maturities or variable interest rates.
Other Assets
At November 30, 2004 and 2003, long-term otherassets included marketable securities held in rabbitrusts for certain of our nonqualified benefit plans andnotes and other receivables. These assets had carryingand fair values of $240 million and $227 million atNovember 30, 2004, respectively, and carrying and fairvalues of $200 million at November 30, 2003. Fair valueswere based on public market prices, estimated discountedfuture cash flows or estimated fair value of collateral.
Debt
The fair values of our non-convertible debt and con-vertible notes were $6.32 billion and $2.53 billion,respectively, at November 30, 2004 and $5.83 billionand $1.92 billion at November 30, 2003. These fairvalues were greater than the related carrying values by $100 million and $790 million, respectively, atNovember 30, 2004 and by $140 million and $205 mil-lion at November 30, 2003. The net difference betweenthe fair value of our debt and its carrying value was dueprimarily to our issuance of debt obligations at fixedinterest rates that are above market interest rates inexistence at the measurement dates. The net differencebetween the fair value of our convertible notes is largelydue to the impact of changes in the Carnival Corporationcommon stock value on the value of our convertiblenotes on those dates. The fair values of our unsecuredfixed rate public notes, convertible notes, sterling bondsand unsecured 5.57% euro notes were based on theirpublic market prices. The fair values of our other debtwere estimated based on appropriate market interestrates being applied to this debt.
Foreign Currency Swaps and
Other Hedging Instruments
We have foreign currency swaps that are designatedas foreign currency fair value hedges for three of our
euro denominated shipbuilding contracts (see Note 7).At November 30, 2004 and 2003, the fair value of theforeign currency swaps related to our shipbuilding com-mitments was an unrealized gain of $219 million and$363 million, respectively. These foreign currencyswaps mature through 2006.
We have foreign currency swaps totaling $887 millionthat are effectively designated as hedges of our netinvestments in foreign subsidiaries, which have euroand sterling denominated functional currencies. Theseforeign currency swaps were entered into to effectivelyconvert $251 million and $466 million of U.S. dollardenominated debt into sterling debt and euro debt,respectively, and $170 million of euro denominated debtinto sterling debt. At November 30, 2004, the fair valueof these foreign currency swaps was an unrealized lossof $137 million, which is included in the cumulativetranslation adjustment component of AOCI. These cur-rency swaps mature through 2012.
The fair values of these foreign currency swaps wereestimated based on prices quoted by financial institutionsfor these instruments.
Finally, we have designated $1.1 billion of our out-standing euro and sterling debt and other obligations,which are nonderivatives and mature through 2012, ashedges of our net investments in foreign operationsand, accordingly, have included $194 million of foreigncurrency transaction losses in the cumulative translationadjustment component of AOCI at November 30, 2004.
Interest Rate Swaps
We have interest rate swap agreements designatedas fair value hedges whereby we receive fixed interestrate payments in exchange for making variable interestrate payments. At November 30, 2004 and 2003, theseinterest rate swap agreements effectively changed$929 million and $1.19 billion of fixed rate debt to Libor-based floating rate debt.
In addition, we also have interest rate swap agree-ments designated as cash flow hedges whereby wereceive variable interest rate payments in exchange formaking fixed interest rate payments. At November 30,2004 and 2003, these interest rate swap agreementseffectively changed $828 million and $760 million, respec-tively, of euribor floating rate debt to fixed rate debt.
These interest rate swap agreements mature through2008. At November 30, 2004 and 2003, the fair value ofour interest rate swaps designated as cash flow hedgeswas an unrealized loss of $22 million and $6 million,respectively. The fair values of our interest rate swapagreements were estimated based on prices quoted byfinancial institutions for these instruments.
Carnival Corporation & plc 25
Note 12—Segment Information
Our cruise segment included all of our cruise brands, which have been aggregated as a single reportable segmentbased on the similarity of their economic and other characteristics, including the products and services they provide.Our other segment primarily represents the transportation, hotel and tour operations of Holland America Tours andPrincess Tours, and the business to business travel agency operations of P&O Travel Ltd., the latter two since comple-tion of the DLC transaction on April 17, 2003. The significant accounting policies of our segments are the same as thosedescribed in Note 2—“Summary of Significant Accounting Policies.” Information for our cruise and other segments asof and for the years ended November 30, was as follows (in millions):
Sellingand Depreciation Operating Capital
Operating adminis- and income expend- TotalRevenues(a) expenses trative amortization (loss) itures assets
2004
Cruise . . . . . . . . . . . . . . . . . . . . . . . . $9,427 $5,247 $1,231 $791 $ 2,158 $3,512 $27,136
Other . . . . . . . . . . . . . . . . . . . . . . . . 398 308 54 21 15 74 500(b)
Intersegment elimination . . . . . . . . . . (98) (98)
$9,727 $5,457 $1,285 $812 $ 2,173 $3,586 $27,636
2003Cruise . . . . . . . . . . . . . . . . . . . . . . . . $6,459 $3,624 $ 896 $568 $ 1,371 $2,454 $24,090Other . . . . . . . . . . . . . . . . . . . . . . . . 345 276(c) 40(c) 17 12 62 401(b)
Intersegment elimination . . . . . . . . . . (86) (86)
$6,718 $3,814 $ 936 $585 $ 1,383 $2,516 $24,491
2002Cruise . . . . . . . . . . . . . . . . . . . . . . . . $4,244 $2,222 $ 577 $371 $1,055(d) $1,949 $12,120Other . . . . . . . . . . . . . . . . . . . . . . . . 176 145 32 11 (13) 37 215(b)
Intersegment elimination . . . . . . . . . . (37) (37)
$4,383 $2,330 $ 609 $382 $ 1,042 $1,986 $12,335
(a) Other segment revenues primarily included revenues for the cruise portion of a tour, when a cruise is sold along with a land tourpackage by Holland America Tours or Princess Tours, and shore excursion and port hospitality services provided to cruise passen-gers by these tour companies. These intersegment revenues, which are included in full in the cruise segment, are eliminatedfrom the other segment revenues in the line “Intersegment elimination.”
(b) Other segment assets primarily included hotels and lodges in Alaska and the Canadian Yukon, luxury dayboats offering tours to aglacier in Alaska and on the Yukon River, motorcoaches used for sightseeing and charters in the States of Washington and Alaska,British Columbia, Canada and the Canadian Yukon and private, domed rail cars, which run on the Alaska Railroad between Anchorageand Fairbanks.
(c) Operating and selling expenses in 2003 have been reclassified to conform to the 2004 presentation.(d) Cruise operating income included an impairment charge of $20 million in 2002.
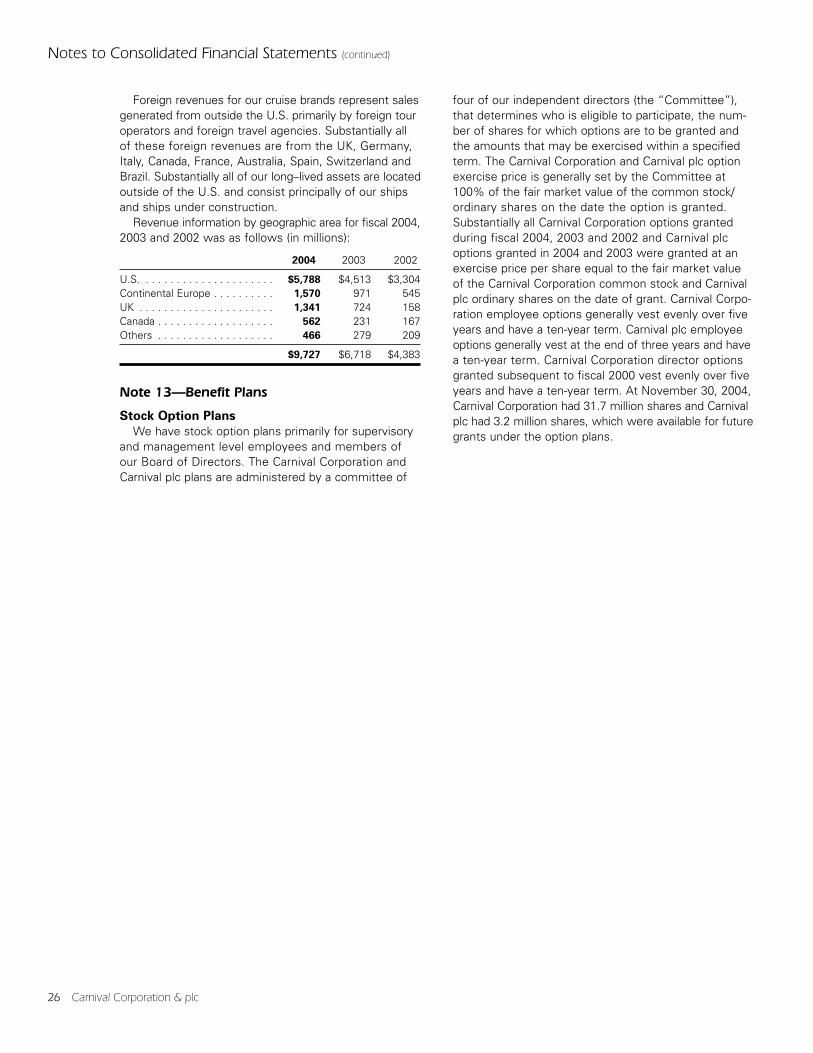
26 Carnival Corporation & plc
Notes to Consolidated Financial Statements (continued)
Foreign revenues for our cruise brands represent salesgenerated from outside the U.S. primarily by foreign touroperators and foreign travel agencies. Substantially allof these foreign revenues are from the UK, Germany,Italy, Canada, France, Australia, Spain, Switzerland andBrazil. Substantially all of our long–lived assets are locatedoutside of the U.S. and consist principally of our shipsand ships under construction.
Revenue information by geographic area for fiscal 2004,2003 and 2002 was as follows (in millions):
2004 2003 2002
U.S. . . . . . . . . . . . . . . . . . . . . . $5,788 $4,513 $3,304Continental Europe . . . . . . . . . . 1,570 971 545UK . . . . . . . . . . . . . . . . . . . . . . 1,341 724 158Canada . . . . . . . . . . . . . . . . . . . 562 231 167Others . . . . . . . . . . . . . . . . . . . 466 279 209
$9,727 $6,718 $4,383
Note 13—Benefit Plans
Stock Option Plans
We have stock option plans primarily for supervisoryand management level employees and members of our Board of Directors. The Carnival Corporation andCarnival plc plans are administered by a committee of
four of our independent directors (the “Committee”),that determines who is eligible to participate, the num-ber of shares for which options are to be granted andthe amounts that may be exercised within a specifiedterm. The Carnival Corporation and Carnival plc optionexercise price is generally set by the Committee at100% of the fair market value of the common stock/ordinary shares on the date the option is granted.Substantially all Carnival Corporation options grantedduring fiscal 2004, 2003 and 2002 and Carnival plcoptions granted in 2004 and 2003 were granted at anexercise price per share equal to the fair market valueof the Carnival Corporation common stock and Carnivalplc ordinary shares on the date of grant. Carnival Corpo-ration employee options generally vest evenly over fiveyears and have a ten-year term. Carnival plc employeeoptions generally vest at the end of three years and havea ten-year term. Carnival Corporation director optionsgranted subsequent to fiscal 2000 vest evenly over fiveyears and have a ten-year term. At November 30, 2004,Carnival Corporation had 31.7 million shares and Carnivalplc had 3.2 million shares, which were available for futuregrants under the option plans.
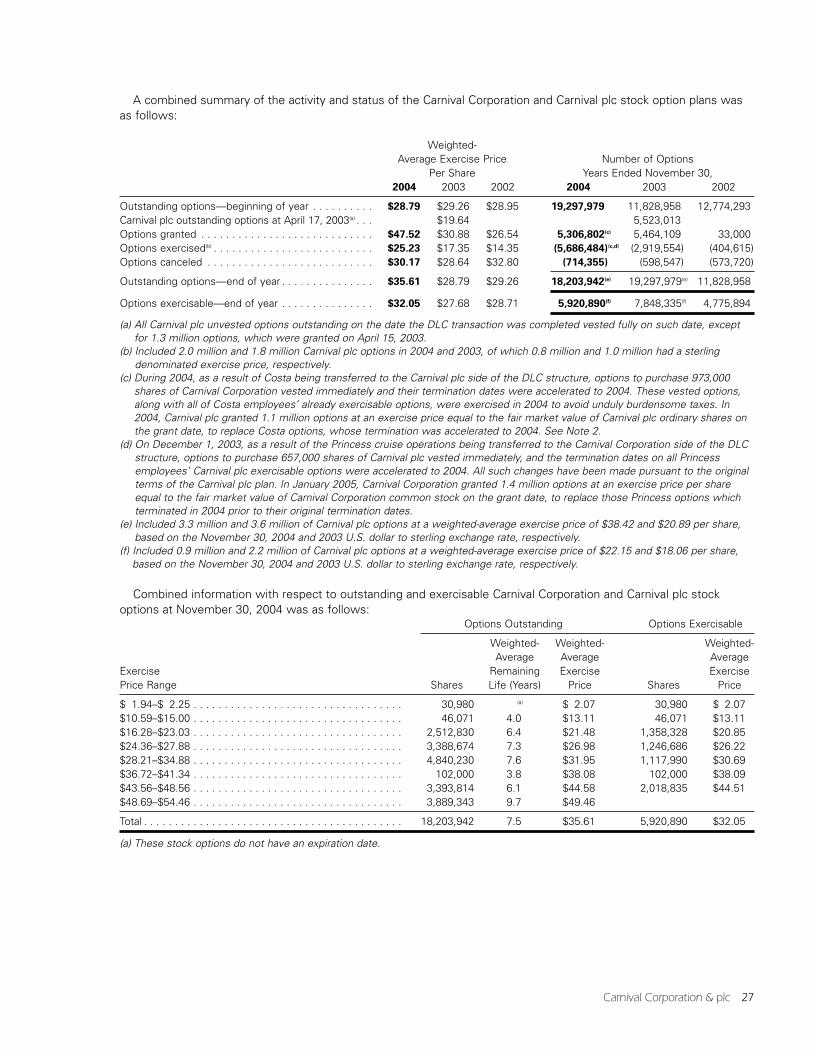
Carnival Corporation & plc 27
A combined summary of the activity and status of the Carnival Corporation and Carnival plc stock option plans wasas follows:
Weighted-Average Exercise Price Number of Options
Per Share Years Ended November 30,2004 2003 2002 2004 2003 2002
Outstanding options—beginning of year . . . . . . . . . . $28.79 $29.26 $28.95 19,297,979 11,828,958 12,774,293Carnival plc outstanding options at April 17, 2003(a) . . . $19.64 5,523,013Options granted . . . . . . . . . . . . . . . . . . . . . . . . . . . . $47.52 $30.88 $26.54 5,306,802(c) 5,464,109 33,000Options exercised(b) . . . . . . . . . . . . . . . . . . . . . . . . . . $25.23 $17.35 $14.35 (5,686,484)(c,d) (2,919,554) (404,615)Options canceled . . . . . . . . . . . . . . . . . . . . . . . . . . . $30.17 $28.64 $32.80 (714,355) (598,547) (573,720)
Outstanding options—end of year . . . . . . . . . . . . . . . $35.61 $28.79 $29.26 18,203,942(e) 19,297,979(e) 11,828,958
Options exercisable—end of year . . . . . . . . . . . . . . . $32.05 $27.68 $28.71 5,920,890(f) 7,848,335(f) 4,775,894
(a) All Carnival plc unvested options outstanding on the date the DLC transaction was completed vested fully on such date, exceptfor 1.3 million options, which were granted on April 15, 2003.
(b) Included 2.0 million and 1.8 million Carnival plc options in 2004 and 2003, of which 0.8 million and 1.0 million had a sterlingdenominated exercise price, respectively.
(c) During 2004, as a result of Costa being transferred to the Carnival plc side of the DLC structure, options to purchase 973,000shares of Carnival Corporation vested immediately and their termination dates were accelerated to 2004. These vested options,along with all of Costa employees’ already exercisable options, were exercised in 2004 to avoid unduly burdensome taxes. In2004, Carnival plc granted 1.1 million options at an exercise price equal to the fair market value of Carnival plc ordinary shares onthe grant date, to replace Costa options, whose termination was accelerated to 2004. See Note 2.
(d) On December 1, 2003, as a result of the Princess cruise operations being transferred to the Carnival Corporation side of the DLCstructure, options to purchase 657,000 shares of Carnival plc vested immediately, and the termination dates on all Princessemployees’ Carnival plc exercisable options were accelerated to 2004. All such changes have been made pursuant to the originalterms of the Carnival plc plan. In January 2005, Carnival Corporation granted 1.4 million options at an exercise price per shareequal to the fair market value of Carnival Corporation common stock on the grant date, to replace those Princess options whichterminated in 2004 prior to their original termination dates.
(e) Included 3.3 million and 3.6 million of Carnival plc options at a weighted-average exercise price of $38.42 and $20.89 per share,based on the November 30, 2004 and 2003 U.S. dollar to sterling exchange rate, respectively.
(f) Included 0.9 million and 2.2 million of Carnival plc options at a weighted-average exercise price of $22.15 and $18.06 per share,based on the November 30, 2004 and 2003 U.S. dollar to sterling exchange rate, respectively.
Combined information with respect to outstanding and exercisable Carnival Corporation and Carnival plc stockoptions at November 30, 2004 was as follows:
Options Outstanding Options Exercisable
Weighted- Weighted- Weighted-Average Average Average
Exercise Remaining Exercise ExercisePrice Range Shares Life (Years) Price Shares Price
$ 1.94–$ 2.25 . . . . . . . . . . . . . . . . . . . . . . . . . . . . . . . . . . 30,980 (a) $ 2.07 30,980 $ 2.07$10.59–$15.00 . . . . . . . . . . . . . . . . . . . . . . . . . . . . . . . . . . 46,071 4.0 $13.11 46,071 $13.11$16.28–$23.03 . . . . . . . . . . . . . . . . . . . . . . . . . . . . . . . . . . 2,512,830 6.4 $21.48 1,358,328 $20.85$24.36–$27.88 . . . . . . . . . . . . . . . . . . . . . . . . . . . . . . . . . . 3,388,674 7.3 $26.98 1,246,686 $26.22$28.21–$34.88 . . . . . . . . . . . . . . . . . . . . . . . . . . . . . . . . . . 4,840,230 7.6 $31.95 1,117,990 $30.69$36.72–$41.34 . . . . . . . . . . . . . . . . . . . . . . . . . . . . . . . . . . 102,000 3.8 $38.08 102,000 $38.09$43.56–$48.56 . . . . . . . . . . . . . . . . . . . . . . . . . . . . . . . . . . 3,393,814 6.1 $44.58 2,018,835 $44.51$48.69–$54.46 . . . . . . . . . . . . . . . . . . . . . . . . . . . . . . . . . . 3,889,343 9.7 $49.46
Total . . . . . . . . . . . . . . . . . . . . . . . . . . . . . . . . . . . . . . . . . . 18,203,942 7.5 $35.61 5,920,890 $32.05
(a) These stock options do not have an expiration date.
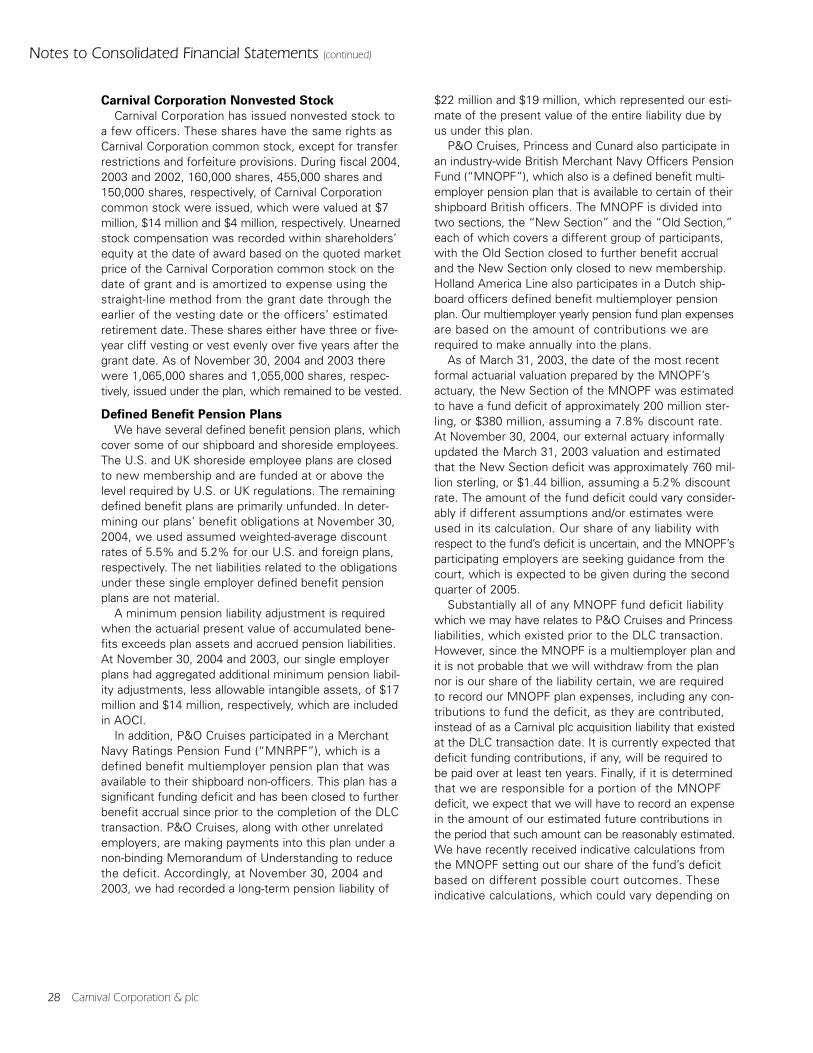
28 Carnival Corporation & plc
Notes to Consolidated Financial Statements (continued)
Carnival Corporation Nonvested Stock
Carnival Corporation has issued nonvested stock to a few officers. These shares have the same rights asCarnival Corporation common stock, except for transferrestrictions and forfeiture provisions. During fiscal 2004,2003 and 2002, 160,000 shares, 455,000 shares and150,000 shares, respectively, of Carnival Corporationcommon stock were issued, which were valued at $7million, $14 million and $4 million, respectively. Unearnedstock compensation was recorded within shareholders’equity at the date of award based on the quoted marketprice of the Carnival Corporation common stock on thedate of grant and is amortized to expense using thestraight-line method from the grant date through theearlier of the vesting date or the officers’ estimatedretirement date. These shares either have three or five-year cliff vesting or vest evenly over five years after thegrant date. As of November 30, 2004 and 2003 therewere 1,065,000 shares and 1,055,000 shares, respec-tively, issued under the plan, which remained to be vested.
Defined Benefit Pension Plans
We have several defined benefit pension plans, whichcover some of our shipboard and shoreside employees.The U.S. and UK shoreside employee plans are closedto new membership and are funded at or above thelevel required by U.S. or UK regulations. The remainingdefined benefit plans are primarily unfunded. In deter-mining our plans’ benefit obligations at November 30,2004, we used assumed weighted-average discountrates of 5.5% and 5.2% for our U.S. and foreign plans,respectively. The net liabilities related to the obligationsunder these single employer defined benefit pensionplans are not material.
A minimum pension liability adjustment is requiredwhen the actuarial present value of accumulated bene-fits exceeds plan assets and accrued pension liabilities.At November 30, 2004 and 2003, our single employerplans had aggregated additional minimum pension liabil-ity adjustments, less allowable intangible assets, of $17million and $14 million, respectively, which are includedin AOCI.
In addition, P&O Cruises participated in a MerchantNavy Ratings Pension Fund (“MNRPF”), which is adefined benefit multiemployer pension plan that wasavailable to their shipboard non-officers. This plan has asignificant funding deficit and has been closed to furtherbenefit accrual since prior to the completion of the DLCtransaction. P&O Cruises, along with other unrelatedemployers, are making payments into this plan under anon-binding Memorandum of Understanding to reducethe deficit. Accordingly, at November 30, 2004 and2003, we had recorded a long-term pension liability of
$22 million and $19 million, which represented our esti-mate of the present value of the entire liability due byus under this plan.
P&O Cruises, Princess and Cunard also participate inan industry-wide British Merchant Navy Officers PensionFund (“MNOPF”), which also is a defined benefit multi-employer pension plan that is available to certain of theirshipboard British officers. The MNOPF is divided intotwo sections, the “New Section” and the “Old Section,”each of which covers a different group of participants,with the Old Section closed to further benefit accrualand the New Section only closed to new membership.Holland America Line also participates in a Dutch ship-board officers defined benefit multiemployer pensionplan. Our multiemployer yearly pension fund plan expensesare based on the amount of contributions we arerequired to make annually into the plans.
As of March 31, 2003, the date of the most recentformal actuarial valuation prepared by the MNOPF’sactuary, the New Section of the MNOPF was estimatedto have a fund deficit of approximately 200 million ster-ling, or $380 million, assuming a 7.8% discount rate. At November 30, 2004, our external actuary informallyupdated the March 31, 2003 valuation and estimatedthat the New Section deficit was approximately 760 mil-lion sterling, or $1.44 billion, assuming a 5.2% discountrate. The amount of the fund deficit could vary consider-ably if different assumptions and/or estimates wereused in its calculation. Our share of any liability withrespect to the fund’s deficit is uncertain, and the MNOPF’sparticipating employers are seeking guidance from thecourt, which is expected to be given during the secondquarter of 2005.
Substantially all of any MNOPF fund deficit liabilitywhich we may have relates to P&O Cruises and Princessliabilities, which existed prior to the DLC transaction.However, since the MNOPF is a multiemployer plan andit is not probable that we will withdraw from the plannor is our share of the liability certain, we are requiredto record our MNOPF plan expenses, including any con-tributions to fund the deficit, as they are contributed,instead of as a Carnival plc acquisition liability that existedat the DLC transaction date. It is currently expected thatdeficit funding contributions, if any, will be required tobe paid over at least ten years. Finally, if it is determinedthat we are responsible for a portion of the MNOPFdeficit, we expect that we will have to record an expensein the amount of our estimated future contributions inthe period that such amount can be reasonably estimated.We have recently received indicative calculations fromthe MNOPF setting out our share of the fund’s deficitbased on different possible court outcomes. Theseindicative calculations, which could vary depending on
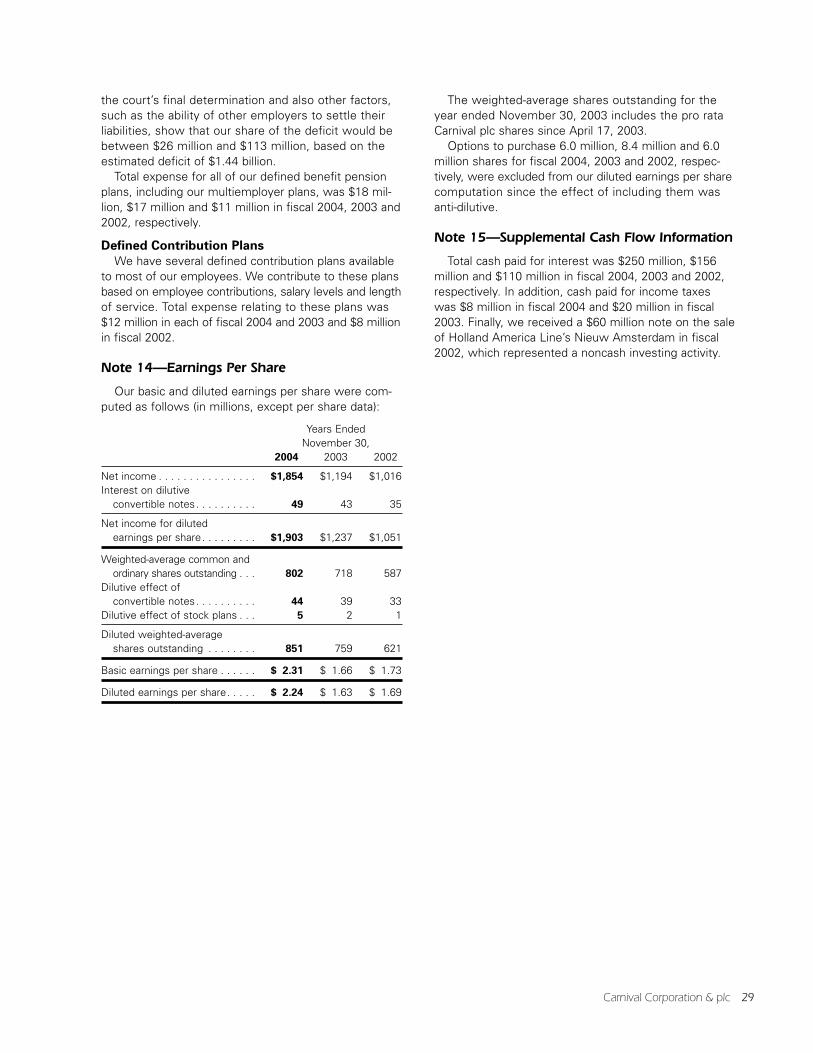
Carnival Corporation & plc 29
the court’s final determination and also other factors,such as the ability of other employers to settle theirliabilities, show that our share of the deficit would bebetween $26 million and $113 million, based on theestimated deficit of $1.44 billion.
Total expense for all of our defined benefit pensionplans, including our multiemployer plans, was $18 mil-lion, $17 million and $11 million in fiscal 2004, 2003 and2002, respectively.
Defined Contribution Plans
We have several defined contribution plans availableto most of our employees. We contribute to these plansbased on employee contributions, salary levels and lengthof service. Total expense relating to these plans was$12 million in each of fiscal 2004 and 2003 and $8 millionin fiscal 2002.
Note 14—Earnings Per Share
Our basic and diluted earnings per share were com-puted as follows (in millions, except per share data):
Years Ended November 30,
2004 2003 2002
Net income . . . . . . . . . . . . . . . . $1,854 $1,194 $1,016Interest on dilutive
convertible notes. . . . . . . . . . 49 43 35
Net income for diluted earnings per share. . . . . . . . . $1,903 $1,237 $1,051
Weighted-average common andordinary shares outstanding . . . 802 718 587
Dilutive effect of convertible notes. . . . . . . . . . 44 39 33
Dilutive effect of stock plans . . . 5 2 1
Diluted weighted-average shares outstanding . . . . . . . . 851 759 621
Basic earnings per share . . . . . . $ 2.31 $ 1.66 $ 1.73
Diluted earnings per share. . . . . $ 2.24 $ 1.63 $ 1.69
The weighted-average shares outstanding for theyear ended November 30, 2003 includes the pro rataCarnival plc shares since April 17, 2003.
Options to purchase 6.0 million, 8.4 million and 6.0million shares for fiscal 2004, 2003 and 2002, respec-tively, were excluded from our diluted earnings per sharecomputation since the effect of including them wasanti-dilutive.
Note 15—Supplemental Cash Flow Information
Total cash paid for interest was $250 million, $156million and $110 million in fiscal 2004, 2003 and 2002,respectively. In addition, cash paid for income taxeswas $8 million in fiscal 2004 and $20 million in fiscal2003. Finally, we received a $60 million note on the saleof Holland America Line’s Nieuw Amsterdam in fiscal2002, which represented a noncash investing activity.
30 Carnival Corporation & plc
Management’s Report on Internal Control over Financial Reporting
Our management is responsible for establishing and maintaining adequate internal control over financial reporting,as such term is defined in Exchange Act Rule 13a-15(f). Under the supervision and with the participation of our man-agement, including our Chief Executive Officer, Chief Operating Officer and Chief Financial and Accounting Officer, weconducted an evaluation of the effectiveness of our internal control over financial reporting based on the framework in Internal Control—Integrated Framework, issued by the Committee of Sponsoring Organizations of the TreadwayCommission (“COSO Framework”). Based on our evaluation under the COSO Framework, our management concludedthat our internal control over financial reporting was effective as of November 30, 2004.
Our management’s assessment of the effectiveness of our internal control over financial reporting as of November 30,2004 has been audited by PricewaterhouseCoopers LLP, an independent registered certified public accounting firm asstated in their report, which is included in this 2004 Annual Report.
Carnival Corporation & plc 31
Report of Independent Registered Certified Public Accounting Firm
To the Boards of Directors and Shareholders of Carnival Corporation and Carnival plc:
We have completed an integrated audit of Carnival Corporation & plc’s November 30, 2004 consolidated financialstatements and of its internal control over financial reporting as of November 30, 2004 and audits of its 2003 and 2002consolidated financial statements in accordance with the standards of the Public Company Accounting Oversight Board(United States). Our opinions, based on our audits, are presented below.
Consolidated financial statements
In our opinion, the accompanying consolidated balance sheets and the related consolidated statements of operations,cash flows and shareholders’ equity present fairly, in all material respects, the financial position of Carnival Corporation& plc (comprising Carnival Corporation and Carnival plc and their respective subsidiaries, the “Company”) at November 30,2004 and November 30, 2003, and the results of their operations and their cash flows for each of the three years inthe period ended November 30, 2004 in conformity with accounting principles generally accepted in the United Statesof America. These financial statements are the responsibility of the Company’s management. Our responsibility is toexpress an opinion on these financial statements based on our audits. We conducted our audits of these statementsin accordance with the standards of the Public Company Accounting Oversight Board (United States). Those standardsrequire that we plan and perform the audit to obtain reasonable assurance about whether the financial statements arefree of material misstatement. An audit of financial statements includes examining, on a test basis, evidence support-ing the amounts and disclosures in the financial statements, assessing the accounting principles used and significantestimates made by management, and evaluating the overall financial statement presentation. We believe that ouraudits provide a reasonable basis for our opinion.
Internal control over financial reporting
Also, in our opinion, management’s assessment, included in the accompanying Management’s Report on InternalControl Over Financial Reporting appearing in this 2004 Annual Report, that the Company maintained effective internalcontrol over financial reporting as of November 30, 2004 based on criteria established in Internal Control—IntegratedFramework issued by the Committee of Sponsoring Organizations of the Treadway Commission (“COSO”), is fairlystated, in all material respects, based on those criteria. Furthermore, in our opinion, the Company maintained, in allmaterial respects, effective internal control over financial reporting as of November 30, 2004, based on criteria estab-lished in Internal Control—Integrated Framework issued by the COSO. The Company’s management is responsible formaintaining effective internal control over financial reporting and for its assessment of the effectiveness of internalcontrol over financial reporting. Our responsibility is to express opinions on management’s assessment and on theeffectiveness of the Company’s internal control over financial reporting based on our audit. We conducted our audit ofinternal control over financial reporting in accordance with the standards of the Public Company Accounting OversightBoard (United States). Those standards require that we plan and perform the audit to obtain reasonable assuranceabout whether effective internal control over financial reporting was maintained in all material respects. An audit ofinternal control over financial reporting includes obtaining an understanding of internal control over financial reporting,evaluating management’s assessment, testing and evaluating the design and operating effectiveness of internal con-trol, and performing such other procedures as we consider necessary in the circumstances. We believe that our auditprovides a reasonable basis for our opinions.
A company’s internal control over financial reporting is a process designed to provide reasonable assurance regard-ing the reliability of financial reporting and the preparation of financial statements for external purposes in accordancewith generally accepted accounting principles. A company’s internal control over financial reporting includes those poli-cies and procedures that (i) pertain to the maintenance of records that, in reasonable detail, accurately and fairly reflectthe transactions and dispositions of the assets of the company; (ii) provide reasonable assurance that transactions arerecorded as necessary to permit preparation of financial statements in accordance with generally accepted accountingprinciples, and that receipts and expenditures of the company are being made only in accordance with authorizationsof management and directors of the company; and (iii) provide reasonable assurance regarding prevention or timelydetection of unauthorized acquisition, use, or disposition of the company’s assets that could have a material effect onthe financial statements.
Because of its inherent limitations, internal control over financial reporting may not prevent or detect misstate-ments. Also, projections of any evaluation of effectiveness to future periods are subject to the risk that controls maybecome inadequate because of changes in conditions, or that the degree of compliance with the policies or proceduresmay deteriorate.
Miami, Florida February 11, 2005
Management’s Discussion and Analysis of Financial Condition and Results of Operations
32 Carnival Corporation & plc
Cautionary Note Concerning Factors That MayAffect Future Results
Some of the statements contained in this 2004 AnnualReport are “forward-looking statements” that involverisks, uncertainties and assumptions with respect to us,including some statements concerning future results,outlook, plans, goals and other events which have notyet occurred. These statements are intended to qualifyfor the safe harbors from liability provided by Section27A of the Securities Act of 1933 and Section 21E ofthe Securities Exchange Act of 1934. You can find many,but not all, of these statements by looking for wordslike “will,” “may,” “believes,” “expects,” “anticipates,”“forecast,” “future,” “intends,” “plans,” and “estimates”and for similar expressions.
Because forward-looking statements involve risks anduncertainties, there are many factors that could causeour actual results, performance or achievements to dif-fer materially from those expressed or implied in this2004 Annual Report. Forward-looking statements includethose statements which may impact the forecasting ofour earnings per share, net revenue yields, booking lev-els, pricing, occupancy, operating, financing and/or taxcosts, costs per available lower berth day (“ALBD”),estimates of ship depreciable lives and residual values,outlook or business prospects. These factors include,but are not limited to, the following:
• risks associated with the DLC structure, includingthe uncertainty of its tax status;
• general economic and business conditions, whichmay impact levels of disposable income of con-sumers and net revenue yields for our cruise brands;
• conditions in the cruise and land-based vacationindustries, including competition from other cruiseship operators and providers of other vacationalternatives and increases in capacity offered bycruise ship and land-based vacation alternatives;
• risks associated with operating internationally;
• the international political and economic climate,armed conflicts, terrorist attacks and threats thereof,availability of air service, other world events andadverse publicity, and their impact on the demandfor cruises;
• accidents and other incidents affecting the health,safety, security and vacation satisfaction of passen-gers, including machinery and equipment failures,which could cause the cancellation of a cruise or aseries of cruises;
• our ability to implement our shipbuilding programsand brand strategies and to continue to expand ourbusiness worldwide;
• our ability to attract and retain qualified shipboardcrew and maintain good relations with employeeunions;
• our ability to obtain financing on terms that arefavorable or consistent with our expectations;
• the impact of changes in operating and financingcosts, including changes in foreign currency andinterest rates and fuel, food, payroll, insurance andsecurity costs;
• changes in the tax, environmental, health, safety,security and other regulatory regimes under whichwe operate;
• continued availability of attractive port destinations;
• our ability to successfully implement cost improve-ment plans and to integrate business acquisitions;
• continuing financial viability of our travel agent dis-tribution system and air service providers; and
• unusual weather patterns or natural disasters.
Forward-looking statements should not be relied uponas a prediction of actual results. Subject to any continu-ing obligations under applicable law or any relevant listingrules, we expressly disclaim any obligation to dissemi-nate, after the date of this 2004 Annual Report, anyupdates or revisions to any such forward-looking state-ments to reflect any change in expectations or events,conditions or circumstances on which any such state-ments are based.
Executive Overview
The post-September 11, 2001 travel environmentwas a challenging period for the travel and leisureindustry. In 2002, demand for travel was weakened dueto the September 11th attacks followed by the conflictin Afghanistan. In 2003, the cruise industry was chal-lenged by, among other things, a weaker economy andunstable geopolitical environment, the emergence ofSevere Acute Respiratory Syndrome (“SARS”) in Asiaand the threat and eventual outbreak of war in Iraq. Theseevents had a negative effect on the public’s willingnessto travel, and consequently, negatively impacted our netrevenue yields (see “Key Performance Indicators” below).
In 2004, the effects of those factors on the cruiseindustry were reduced, and we experienced a substan-tial improvement in our net revenue yields. We believethis improvement was primarily the result of strongerconsumer demand for travel, which resulted in higherpassenger ticket prices and onboard revenues and, to a lesser extent, a weaker U.S. dollar relative to the euroand sterling. The increase in pricing was achieved despitea 17.2% increase in pro forma passenger capacity relating
Carnival Corporation & plc 33
to the introduction of seven new ships in fiscal 2004. In addition, from 2002 through 2004, the cruise industrywas impacted by substantial increases in fuel prices. Itis possible that fuel prices may continue to increase in2005 and future years.
Throughout this period we generated significant cashflows and remained in a strong financial position, whichis a high priority and we believe provides us with acompetitive advantage in the capital intensive cruiseindustry. However, our operations are subject to manyrisks, as briefly noted above and under the caption“Cautionary Note Concerning Factors That May AffectFuture Results,” which could adversely impact ourfuture results.
During 2004, we ordered eight new ships for our NorthAmerican and European brands, which are expected tobe delivered between 2007 and 2009. These new shipsare expected to continue to help us maintain our leader-ship position within the cruise industry. The year-over-year percentage increases in Carnival Corporation &plc’s ALBD capacity, resulting from new ships enteringservice, is 8.7%, 6.1%, 7.5%, 6.6% and 2.4% for fiscal2005, 2006, 2007, 2008 and 2009, respectively, basedon ships currently on order.
We believe that given a stable geopolitical environ-ment and the continuing strong demand for travel, ournet revenue yields will increase in 2005.
Outlook for Fiscal 2005 (“2005”)
As of December 16, 2004 we said that we werecomfortable with earnings per share estimates of $2.70for 2005. We also said that we expected our first quar-ter 2005 earnings per share to be in the range of $0.38to $0.40. Our guidance was based on flat fuel pricingcompared to 2004, which was in line with the forwardcurve for bunker fuel at that time, and an exchange rateof $1.30 to the euro and $1.86 to the sterling.
On January 20, 2005, we announced that the 1,870-passenger ship Aurora, operated by P&O Cruises, expe-rienced a technical problem with its propulsion systemthat forced the cancellation of its 103-day, 2005 worldcruise. We expected that the vessel would be repairedand would return to service prior to the date it was toend its world cruise and anticipated scheduling revisedshort replacement cruises. The cancellation of the worldcruise, net of estimated earnings from anticipated replace-ment cruises, was expected to reduce 2005 full yearearnings per share by approximately $0.05, of whichapproximately $0.03 per share was expected to impactthe first quarter and the remainder in the second quarter.We now expect the Aurora to be out of service for alonger duration and anticipate scheduling fewer replace-ment cruises. Consequently, we expect the full year
2005 impact to be approximately $0.06 per share, ofwhich approximately $0.04 per share will effect the firstquarter of 2005.
We also expect that there will be $0.01 per share gainfrom the settlement of litigation recorded in the firstquarter of 2005.
Since our December guidance, fuel prices have risen.Our current forecast uses fuel prices that are 10% higherthan the prior year, which was determined based uponthe current forward curve for bunker fuel, which equatesto approximately $0.06 per share on an annual basis.
Since early January 2005, the cruise industry hasentered the “wave season,” a period of higher bookinglevels than during the rest of the year. During the 2005wave season, company wide booking levels, on anabsolute basis, have been running slightly higher thanduring the same period last year. However, pricing duringwave season has been significantly higher than duringthe same period last year. As of the end of January 2005,we have 10% less inventory remaining to sell for 2005than at the same time last year, even with a 9% capac-ity increase in 2005. We believe our lower inventoryavailability provides us with the opportunity to executeour pricing strategies to maximize revenue yields in 2005.
Based upon the stronger booking trends experiencedduring the month of January, we remain comfortablewith our previous guidance of $2.70 per share for thefull year 2005 and a range of $0.38 to $0.40 per sharefor the first quarter of 2005, including the aforemen-tioned impact of the Aurora, the litigation settlementand higher fuel prices. Our current guidance is basedupon an exchange rate of $1.31 to the euro and $1.87to the sterling.
Net revenue yields for 2005 are now forecasted toincrease 4 to 6 percent (3 to 5 percent on a constantdollar basis), compared to last year. The increase inexpected net revenue yields compared with our previousguidance is largely due to higher prices achieved duringthe initial month of wave season partially offset by theimpact of the cancellation of the Aurora world cruise.Net cruise costs per ALBD are now forecast to be up 1 to 3 percent (flat to up 2 percent on a constant dollarbasis) compared to last year. This increase from ourprior guidance is primarily because of assumed higherfuel prices and costs associated with the cancellation of Aurora’s world cruise.
We continue to expect that first quarter 2005 net rev-enue yields will increase approximately 5 to 7 percent(4 to 6 percent on a constant dollar basis), compared to last year. Our first quarter guidance for net revenueyields remains the same as our previous guidance givenin December because the approximate 1 percent reduc-tion in net revenue yields due to the cancellation ofAurora’s world cruise offset the stronger pricing achieved
Management’s Discussion and Analysis of Financial Condition and Results of Operations (continued)
34 Carnival Corporation & plc
during the initial month of wave season. We continue toexpect net cruise costs per ALBD to be flat to up 2 per-cent (down 1 to up 1 percent on a constant dollar basis),compared to last year. First quarter net cruise costs perALBD remained the same as our prior guidance becausethe impact of the cancellation of the world cruise wasoffset by the delay in timing of advertising costs.
Share-Based Compensation
In December 2004, the Financial Accounting StandardsBoard issued Share-Based Payment Statement 123(R),which will require us to recognize compensation costsin our financial statements in an amount equal to the fairvalue of share-based payments granted to employeesand directors. This statement is effective for us in thefourth quarter of fiscal 2005. We have not yet deter-mined which of the alternative transition methods wewill use upon adoption of this statement. However, basedon preliminary estimates, if we were to elect to adoptthis statement with retroactive effect to December 1,2004, our additional 2005 share-based compensationexpense would be approximately $60 million, which hasnot been included in the Outlook for 2005.
Key Performance Indicators and Pro Forma Information
We use net cruise revenues per ALBD (“net revenueyields”) and net cruise costs per ALBD as significantnon-GAAP financial measures of our cruise segmentfinancial performance. We believe that net revenue yieldsare commonly used in the cruise industry to measure acompany’s cruise segment revenue performance. Thismeasure is also used for revenue management purposes.In calculating net revenue yields, we use “net cruiserevenues” rather than “gross cruise revenues.” Webelieve that net cruise revenues is a more meaningfulmeasure in determining revenue yield than gross cruiserevenues because it reflects the cruise revenues earnedby us net of our most significant variable costs, whichare travel agent commissions, cost of air transportationand certain other variable direct costs associated withonboard revenues. Substantially all of our remainingcruise costs are largely fixed once our ship capacitylevels have been determined.
Net cruise costs per ALBD is the most significantmeasure we use to monitor our ability to control ourcruise segment costs rather than gross cruise costs perALBD. In calculating net cruise costs, we exclude thesame variable costs as described above, which areincluded in the calculation of net cruise revenues. Thisis done to avoid duplicating these variable costs in thesetwo non-GAAP financial measures.
We have not provided estimates of future grossrevenue yields or future gross cruise costs per ALBDbecause the reconciliations of forecasted net cruiserevenues to forecasted gross cruise revenues or fore-casted net cruise costs to forecasted cruise operatingexpenses would require us to forecast, with reasonableaccuracy, the amount of air and other transportationcosts that our forecasted cruise passengers would electto purchase from us (the “air/sea mix”). Since the fore-casting of future air/sea mix involves several significantvariables that are relatively difficult to forecast and therevenues from the sale of air and other transportationapproximate the costs of providing that transportation,management focuses primarily on forecasts of net cruiserevenues and costs rather than gross cruise revenuesand costs. This does not impact, in any material respect,our ability to forecast our future results, as any variationin the air/sea mix has no material impact on our forecastednet cruise revenues or forecasted net cruise costs. Assuch, management does not believe that this reconcilinginformation would be meaningful.
In addition, because a significant portion of our opera-tions utilize the euro or sterling to measure their resultsand financial condition, the translation of those opera-tions to our U.S. dollar reporting currency results inincreases in reported U.S. dollar revenues and expensesif the U.S. dollar weakens against these foreign curren-cies, and decreases in reported U.S. dollar revenuesand expenses if the U.S. dollar strengthens againstthese foreign currencies. Accordingly, we also monitorour key indicators assuming the 2004 exchange rateshave remained constant with the prior year’s comparablerates, or on a “constant dollar basis,” in order to removethe impact of changes in exchange rates on our non-U.S. cruise operations. We believe that this is a usefulmeasure indicating the actual growth of our operationsin a fluctuating exchange rate environment.
Our 2003 reported results only included the results of P&O Princess since April 17, 2003. Consequently, for the years ended November 30, 2004 and 2003, webelieve that the most meaningful comparison of ourannual operating income and revenue and cost metricsis to the comparable pro forma results and metrics in2003 and 2002, which reflect the operations of bothCarnival Corporation and P&O Princess as if the compa-nies had been consolidated throughout 2003 and 2002.Accordingly, we have disclosed pro forma informationfor the year ended November 30, 2003 and 2002, aswell as the required reported information, in the discus-sion of our results of operations.
The 2003 and 2002 pro forma information was com-puted by adding the results of P&O Princess’ annualoperations, and acquisition adjustments of $16 millionand $14 million of depreciation expense and $3 million
Carnival Corporation & plc 35
and $7 million of interest expense, and excluding $51million and $103 million of nonrecurring DLC transac-tion costs, respectively, to the 2003 and 2002 CarnivalCorporation reported results for the year endedNovember 30, 2003 and 2002, respectively.
Critical Accounting Estimates
Our critical accounting estimates are those which we believe require our most significant judgmentsabout the effect of matters that are inherently uncer-tain. A discussion of our critical accounting estimates,the underlying judgments and uncertainties used tomake them and the likelihood that materially differentestimates would be reported under different conditionsor using different assumptions, is set forth below.
Ship Accounting
Our most significant assets are our ships and shipsunder construction, which represent 83% of our totalassets. We make several critical accounting estimatesdealing with our ship accounting. First, we compute ourships’ depreciation expense, which represents 11.6%of our cruise operating expenses in fiscal 2004, whichrequires us to estimate the average useful life of eachof our ships, as well as their residual values. Secondly,we account for ship improvement costs by capitalizingthose costs, which we believe will add value to ourships and depreciate those improvements over theirestimated useful lives. Finally, we account for the replace-ment or refurbishment of our ship components basedupon their estimated net book value.
We determine the average useful life of our shipsbased primarily on our estimates of the weighted-averageuseful lives and residual values of the ships’ major com-ponent systems, such as cabins, main diesels, mainelectric, superstructure and hull. In addition, we consider,among other things, the impact of anticipated techno-logical changes, long-term vacation market conditionsand competition and historical useful lives of similarly-built ships. We have estimated our new ships’ averageuseful lives at 30 years and their average residual valuesat 15% of our original ship cost.
Given the very large and complex nature of our ships,ship accounting estimates require considerable judg-ment and are inherently uncertain. We do not have costsegregation studies performed to specifically compone-tize our ship systems. However, we have estimated theuseful lives of our ships to be 30 years based upon ourestimates of the relative costs of the major componentsof a cruise ship. In addition, since we do not separatelycomponetize our ships, we do not identify and trackdepreciation of specific component systems. Therefore,we have to estimate the net book value of componentsthat are replaced or refurbished, based primarily upon
their replacement or refurbishment cost and the age of the ship.
If materially different conditions existed, or if wematerially changed our assumptions of ship lives andresidual values, our depreciation expense or loss onreplacement or refurbishment of ship assets and netbook value of our ships would be materially different. Inaddition, if we change our assumptions in making ourdeterminations as to whether improvements to a shipadd value, the amounts we expense each year as repairand maintenance costs could increase, partially offsetby a decrease in depreciation expense, as less costswould have been initially capitalized to our ships. Ourfiscal 2004 ship depreciation expense would haveincreased by approximately $21 million for every yearwe reduced our estimated average 30 year ship usefullife. In addition, if our ships were estimated to have noresidual value, our fiscal 2004 depreciation expensewould have increased by approximately $100 million.
We believe that the estimates we made for shipaccounting purposes are reasonable and our methodsare consistently applied and, accordingly, result indepreciation expense that is based on a rational andsystematic method to equitably allocate the costs of ourships to the periods during which services are obtainedfrom their use. In addition, we believe that the estimateswe made are reasonable and our methods consistentlyapplied (1) in determining the average useful life andaverage residual values of our ships; (2) in determiningwhich ship improvement costs add value to our ships;and (3) in determining the net book value of ship com-ponent assets being replaced or refurbished. Finally, we believe our critical ship accounting estimates aregenerally comparable with those of other major cruisecompanies.
Asset Impairment
The impairment reviews of our ship and trademarkassets and of our goodwill, which has been allocated toour cruise line reporting units, require us to make signif-icant estimates to determine the fair values of theseassets or reporting units.
The determination of fair value includes numerousuncertainties, unless a viable actively traded marketexists for the asset or for a comparable reporting unit,which is usually not the case for cruise ships, cruiselines and trademarks. For example, in determining fairvalues of ships and cruise lines utilizing discounted fore-casted cash flows, significant judgments are made con-cerning, among other things, future net revenue yields,net cruise costs per ALBD, interest and discount rates,cruise itineraries, ship additions and retirements, tech-nological changes, consumer demand, governmentalregulations and the effects of competition. In addition,
Management’s Discussion and Analysis of Financial Condition and Results of Operations (continued)
36 Carnival Corporation & plc
third party appraisers are sometimes used to determinefair values and some of their valuation methodologiesare also subject to similar types of uncertainties. Also,the determination of fair values of reporting units usinga price earnings multiple approach also requires signifi-cant judgments, such as determining reasonably com-parable multiples. Finally, determining trademark fairvalues also requires significant judgments in determin-ing both the estimated trademark cash flows, and theappropriate royalty rates to be applied to those cashflows to determine their fair value. We believe that wehave made reasonable estimates and judgments indetermining whether our ships, goodwill and trademarkshave been impaired. However, if there is a materialchange in the assumptions used in our determination of fair value or if there is a material change in the condi-tions or circumstances influencing fair value, we couldbe required to recognize a material impairment charge.
Contingencies
We periodically assess the potential liabilities relatedto any lawsuits or claims brought against us, as well asfor other known unasserted claims, including environ-mental, legal, passenger and crew, and tax matters.While it is typically very difficult to determine the timingand ultimate outcome of these matters, we use ourbest judgment to determine if it is probable that we will incur an expense related to the settlement or finaladjudication of such matters and whether a reasonableestimation of such probable loss, if any, can be made.In assessing probable losses, we make estimates ofthe amount of insurance recoveries, if any. We accrue a liability when we believe a loss is probable and theamount of the loss can be reasonably estimated, inaccordance with the provisions of SFAS No. 5, “Account-ing for Contingencies,” as amended. Such accruals aretypically based on developments to date, management’sestimates of the outcomes of these matters, our expe-rience in contesting, litigating and settling other similarmatters, historical claims experience and actuariallydetermined assumptions of liabilities, and any relatedinsurance coverage. See Notes 8 and 13 in the accom-panying financial statements for additional informationconcerning our contingencies.
Given the inherent uncertainty related to the even-tual outcome of these matters and potential insurancerecoveries, it is possible that all or some of these mat-ters may be resolved for amounts materially differentfrom any provisions or disclosures that we may havemade with respect to their resolution. In addition, asnew information becomes available, we may need toreassess the amount of probable liability that needs tobe accrued related to our contingencies. All such revisions
in our estimates could materially impact our results ofoperations and financial position.
Results of Operations
We earn our cruise revenues primarily from the following:
• sales of passenger cruise tickets and, in some cases,the sale of air and other transportation to and fromour ships. The cruise ticket price includes accom-modations, meals, some non-alcoholic beverages,entertainment and many onboard activities, and
• the sale of goods and/or services primarily on boardour ships, which include bar and some beveragesales, casino gaming, shore excursions, gift shopand spa sales, photo and art sales and pre- andpost cruise land packages. These activities areeither performed directly by us or by independentconcessionaires, from which we receive a percent-age of their revenues.
We incur cruise operating costs and expenses for the following:
• the costs of passenger cruise tickets which repre-sent costs that vary directly with passenger cruiseticket revenues, and include travel agent commis-sions, air and other travel related costs and creditcard fees,
• onboard and other cruise costs which representcosts that vary directly with onboard and other rev-enues, and include the costs of liquor and somebeverages, costs of tangible goods sold by us fromour gift, photo and art auction activities, pre- andpost cruise land packages and credit card fees.Concession revenues do not have any significantamount of costs associated with them, as thecosts and services incurred for these activities areprovided by our concessionaires,
• payroll and related costs which represent costs forall our shipboard personnel, including deck andengine officers and crew and hotel and administra-tive employees,
• food costs, which include both our passenger andcrew food costs, and
• other ship operating costs which include fuel,repairs and maintenance, port charges, insurance,entertainment and all other shipboard operatingcosts and expenses.
For segment information related to our revenues,expenses, operating income and other financial informa-tion see Note 12 in the accompanying financial statements.
Carnival Corporation & plc 37
Summary
Our reported and pro forma results of operations and selected statistical information were as follows:
Years Ended November 30,Pro Forma Reported Pro Forma Reported
2004 2003 2003 2002 2002
(dollars in millions, except statistical information)Revenues
CruisePassenger tickets. . . . . . . . . . . . . . . . . . . . . . . . . . . . $ 7,357 $ 5,732 $ 5,039 $ 5,128 $ 3,346Onboard and other . . . . . . . . . . . . . . . . . . . . . . . . . . . 2,070 1,600 1,420 1,356 898Other . . . . . . . . . . . . . . . . . . . . . . . . . . . . . . . . . . . . . 300 264 259 284 139
9,727 7,596 6,718 6,768 4,383
Costs and Expenses
OperatingCruise
Commissions, transportation and other . . . . . . . . . 1,572 1,227 1,021 1,121 658Onboard and other . . . . . . . . . . . . . . . . . . . . . . . . . 359 279 229 240 116Payroll and related . . . . . . . . . . . . . . . . . . . . . . . . . 1,003 841 744 676 458Food . . . . . . . . . . . . . . . . . . . . . . . . . . . . . . . . . . . 550 447 393 381 256Other ship operating . . . . . . . . . . . . . . . . . . . . . . . 1,763 1,428 1,237 1,149 734
Other . . . . . . . . . . . . . . . . . . . . . . . . . . . . . . . . . . . . . 210 198 190 211 108
Total. . . . . . . . . . . . . . . . . . . . . . . . . . . . . . . . . . . . . . 5,457 4,420 3,814 3,778 2,330Selling and administrative . . . . . . . . . . . . . . . . . . . . . . . 1,285 1,103 936 960 609Depreciation and amortization . . . . . . . . . . . . . . . . . . . . 812 653 585 534 382Impairment charge. . . . . . . . . . . . . . . . . . . . . . . . . . . . . 20 20
Operating Income . . . . . . . . . . . . . . . . . . . . . . . . . . . . . . 2,173 1,420 1,383 1,476 1,042Nonoperating Expense, Net . . . . . . . . . . . . . . . . . . . . . . (272) (185) (160) (148) (83)
Income Before Income Taxes . . . . . . . . . . . . . . . . . . . . . 1,901 1,235 1,223 1,328 959Income Tax (Expense) Benefit, Net . . . . . . . . . . . . . . . . . (47) (25) (29) 46 57
Net Income . . . . . . . . . . . . . . . . . . . . . . . . . . . . . . . . . . . $ 1,854 $ 1,210 $ 1,194 $ 1,374 $ 1,016
Selected Statistical Information
Passengers carried (in thousands) . . . . . . . . . . . . . . . . . 6,306 5,422 5,038 4,725 3,549
Occupancy percentage . . . . . . . . . . . . . . . . . . . . . . . . . 104.5% 102.6% 103.4% 103.5% 105.2%
Gross and net revenue yields were computed by dividing the gross or net revenues, without rounding, by ALBDsas follows:
Years Ended November 30,Pro Forma Reported Pro Forma Reported
2004 2003 2003 2002 2002
(in millions, except ALBDs and yields)Cruise revenues
Passenger tickets . . . . . . . . . . . . . . . . . . . . . . . . . . . . . $ 7,357 $ 5,732 $ 5,039 $ 5,128 $ 3,346Onboard and other. . . . . . . . . . . . . . . . . . . . . . . . . . . . . 2,070 1,600 1,420 1,356 898
Gross cruise revenues . . . . . . . . . . . . . . . . . . . . . . . . . . . . 9,427 7,332 6,459 6,484 4,244Less cruise costs
Commissions, transportation and other . . . . . . . . . . . . . (1,572) (1,227) (1,021) (1,121) (658)Onboard and other. . . . . . . . . . . . . . . . . . . . . . . . . . . . . (359) (279) (229) (240) (116)
Net cruise revenues . . . . . . . . . . . . . . . . . . . . . . . . . . . . . $ 7,496 $ 5,826 $ 5,209 $ 5,123 $ 3,470
ALBDs. . . . . . . . . . . . . . . . . . . . . . . . . . . . . . . . . . . . . . . . 44,009,061 37,554,709 33,309,785 31,962,000 21,435,828
Gross revenue yields . . . . . . . . . . . . . . . . . . . . . . . . . . . . . $214.21 $195.23 $193.91 $202.85 $198.01
Net revenue yields. . . . . . . . . . . . . . . . . . . . . . . . . . . . . . . $170.32 $155.11 $156.38 $160.25 $161.91
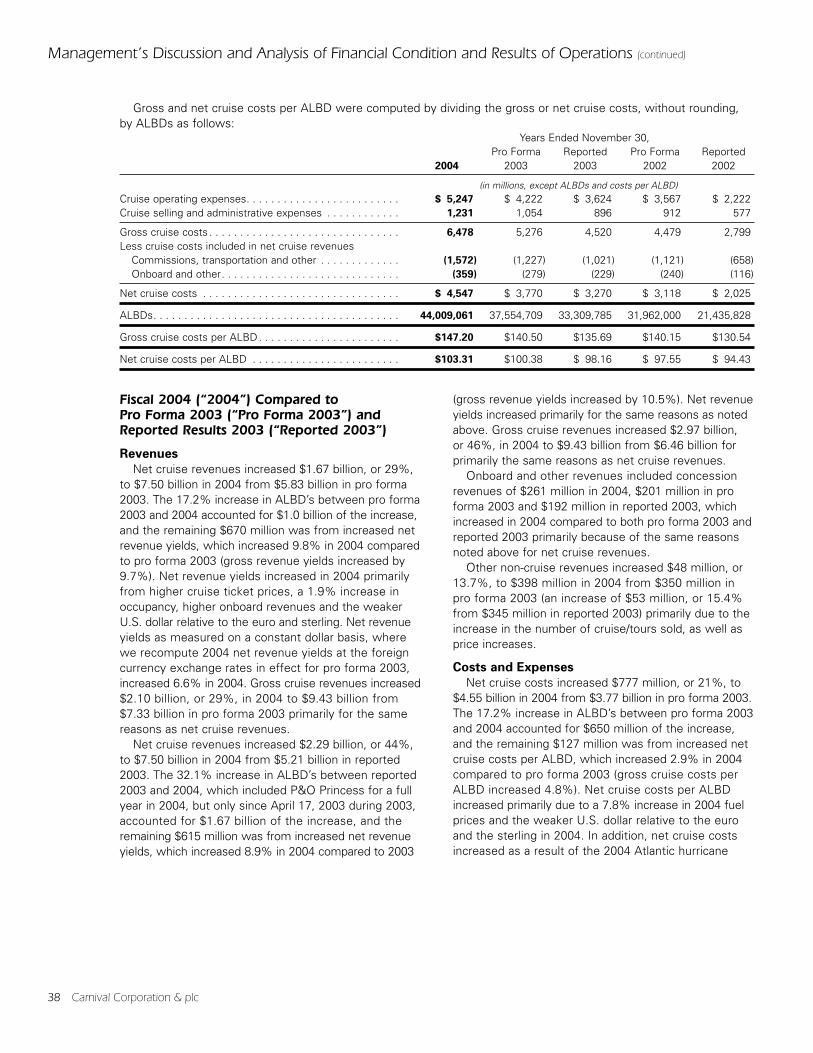
Management’s Discussion and Analysis of Financial Condition and Results of Operations (continued)
38 Carnival Corporation & plc
Gross and net cruise costs per ALBD were computed by dividing the gross or net cruise costs, without rounding,by ALBDs as follows:
Years Ended November 30,Pro Forma Reported Pro Forma Reported
2004 2003 2003 2002 2002
(in millions, except ALBDs and costs per ALBD)Cruise operating expenses. . . . . . . . . . . . . . . . . . . . . . . . . $ 5,247 $ 4,222 $ 3,624 $ 3,567 $ 2,222Cruise selling and administrative expenses . . . . . . . . . . . . 1,231 1,054 896 912 577
Gross cruise costs . . . . . . . . . . . . . . . . . . . . . . . . . . . . . . . 6,478 5,276 4,520 4,479 2,799Less cruise costs included in net cruise revenues
Commissions, transportation and other . . . . . . . . . . . . . (1,572) (1,227) (1,021) (1,121) (658)Onboard and other. . . . . . . . . . . . . . . . . . . . . . . . . . . . . (359) (279) (229) (240) (116)
Net cruise costs . . . . . . . . . . . . . . . . . . . . . . . . . . . . . . . . $ 4,547 $ 3,770 $ 3,270 $ 3,118 $ 2,025
ALBDs. . . . . . . . . . . . . . . . . . . . . . . . . . . . . . . . . . . . . . . . 44,009,061 37,554,709 33,309,785 31,962,000 21,435,828
Gross cruise costs per ALBD. . . . . . . . . . . . . . . . . . . . . . . $147.20 $140.50 $135.69 $140.15 $130.54
Net cruise costs per ALBD . . . . . . . . . . . . . . . . . . . . . . . . $103.31 $100.38 $ 98.16 $ 97.55 $ 94.43
Fiscal 2004 (“2004”) Compared to Pro Forma 2003 (“Pro Forma 2003”) andReported Results 2003 (“Reported 2003”)
Revenues
Net cruise revenues increased $1.67 billion, or 29%,to $7.50 billion in 2004 from $5.83 billion in pro forma2003. The 17.2% increase in ALBD’s between pro forma2003 and 2004 accounted for $1.0 billion of the increase,and the remaining $670 million was from increased netrevenue yields, which increased 9.8% in 2004 comparedto pro forma 2003 (gross revenue yields increased by9.7%). Net revenue yields increased in 2004 primarilyfrom higher cruise ticket prices, a 1.9% increase inoccupancy, higher onboard revenues and the weakerU.S. dollar relative to the euro and sterling. Net revenueyields as measured on a constant dollar basis, wherewe recompute 2004 net revenue yields at the foreigncurrency exchange rates in effect for pro forma 2003,increased 6.6% in 2004. Gross cruise revenues increased$2.10 billion, or 29%, in 2004 to $9.43 billion from$7.33 billion in pro forma 2003 primarily for the samereasons as net cruise revenues.
Net cruise revenues increased $2.29 billion, or 44%,to $7.50 billion in 2004 from $5.21 billion in reported2003. The 32.1% increase in ALBD’s between reported2003 and 2004, which included P&O Princess for a fullyear in 2004, but only since April 17, 2003 during 2003,accounted for $1.67 billion of the increase, and theremaining $615 million was from increased net revenueyields, which increased 8.9% in 2004 compared to 2003
(gross revenue yields increased by 10.5%). Net revenueyields increased primarily for the same reasons as notedabove. Gross cruise revenues increased $2.97 billion, or 46%, in 2004 to $9.43 billion from $6.46 billion forprimarily the same reasons as net cruise revenues.
Onboard and other revenues included concessionrevenues of $261 million in 2004, $201 million in proforma 2003 and $192 million in reported 2003, whichincreased in 2004 compared to both pro forma 2003 andreported 2003 primarily because of the same reasonsnoted above for net cruise revenues.
Other non-cruise revenues increased $48 million, or13.7%, to $398 million in 2004 from $350 million inpro forma 2003 (an increase of $53 million, or 15.4%from $345 million in reported 2003) primarily due to theincrease in the number of cruise/tours sold, as well asprice increases.
Costs and Expenses
Net cruise costs increased $777 million, or 21%, to$4.55 billion in 2004 from $3.77 billion in pro forma 2003.The 17.2% increase in ALBD’s between pro forma 2003and 2004 accounted for $650 million of the increase,and the remaining $127 million was from increased netcruise costs per ALBD, which increased 2.9% in 2004compared to pro forma 2003 (gross cruise costs perALBD increased 4.8%). Net cruise costs per ALBDincreased primarily due to a 7.8% increase in 2004 fuelprices and the weaker U.S. dollar relative to the euroand the sterling in 2004. In addition, net cruise costsincreased as a result of the 2004 Atlantic hurricane
Carnival Corporation & plc 39
season and Cunard’s $10 million of relocation costs,resulting from combining the Cunard back-office opera-tions into Princess’ operations. Net cruise costs perALBD as measured on a constant dollar basis comparedto pro forma 2003 declined 0.5% in 2004. The decreasein constant dollar net cruise costs was primarily theresult of the economies of scale associated with thepro forma 17.2% ALBD increase and synergy savingsfrom the integration efforts following the DLC transac-tion. Gross cruise costs increased $1.20 billion, or 23%,in 2004 to $6.48 billion from $5.23 billion in pro forma2003 primarily for the same reasons as net cruise costs.
Net cruise costs increased $1.28 billion, or 39%, to$4.55 billion in 2004 from $3.27 billion in reported 2003.The increase in ALBD’s between reported 2003 and2004 accounted for $1.05 billion of the increase, andthe remaining $230 million was from increased netcruise costs per ALBD, which increased 5.2% in 2004compared to reported 2003 (gross cruise costs perALBD increased 8.5%). Net cruise costs per ALBDincreased primarily for the same reasons as notedabove. Gross cruise costs increased $1.96 billion, or43%, in 2004 to $6.48 billion from $4.52 billion inreported 2003 primarily for the same reasons as netcruise costs and a higher proportion of P&O Princessbrands’ customers who purchased air from us.
Other non-cruise operating expense increased $24million, or 8.5%, to $308 million in 2004 from $284 mil-lion in pro forma 2003 (an increase of $32 million, or11.6%, from $276 million in reported 2003) primarilydue to the increased volume of cruise/tours sold in 2004.
Depreciation and amortization expense increased by$159 million, or 24.3%, to $812 million in 2004 from$653 million in pro forma 2003 largely due to the proforma 17.2% expansion of the combined fleet and shipimprovement expenditures, as well as the impact of a weaker U.S. dollar. Depreciation and amortizationincreased by $227 million, or 38.8%, to $812 million in2004 from $585 million in reported 2003. This increasewas primarily due to the same factors as noted aboveand the result of the consolidation of P&O Princess.
Nonoperating (Expense) Income
Net interest expense, excluding capitalized interest,increased to $292 million in 2004 from $217 million inreported 2003, or $75 million, which increase consistedprimarily of a $102 million increase in interest expensefrom our increased level of average borrowings and a weaker U.S. dollar, partially offset by a $27 milliondecrease in interest expense due to lower average bor-rowing rates. The higher average debt balances were
primarily a result of our consolidation of the former P&OPrincess debt and new ship deliveries.
Income Taxes
Income tax expense increased $18 million fromreported 2003 to $47 million in 2004 primarily becauseof the increase in Costa’s Italian taxable income andother taxes relating to our operations.
Pro Forma 2003 (“Pro Forma 2003”)Compared to Pro Forma 2002 (“Pro Forma2002”) and Reported Results 2003 (“Reported2003”) Compared to Reported Results 2002(“Reported 2002”)
Revenues
Net cruise revenues increased $703 million, or 14%,to $5.83 billion in pro forma 2003 from $5.12 billion inpro forma 2002. The 17.5% increase in pro forma ALBD’saccounted for $895 million of the increase, which waspartially offset by a $192 million reduction from lowernet revenue yields, which declined 3.2% in pro forma2003 compared to pro forma 2002 (gross revenue yieldsdecreased 3.8%). Net revenue yields decreased largelybecause of lower cruise ticket prices, and to a lesserextent, lower occupancy levels. Our revenue yields in2003 were adversely affected by consumer concernsabout travel during the period leading up to the war withIraq and its eventual outbreak, the uncertain world econ-omy and the increase in cruise industry capacity. Thiswas partially offset by the weaker U.S. dollar. Gross cruiserevenues increased $848 million, or 13%, in pro forma2003 to $7.33 billion from $6.48 billion in pro forma 2002primarily for the same reasons as net cruise revenues.
Net cruise revenues increased $1.74 billion, or 50%,to $5.21 billion in reported 2003 from $3.47 billion inreported 2002. The 55.4% increase in reported ALBD’s,which only included P&O Princess since April 17, 2003,accounted for $1.92 billion of the increase, which waspartially offset by $185 million from lower net revenueyields, which declined 3.4% in reported 2003 comparedto reported 2002 (gross revenue yields decreased 2.1%).Net revenue yields decreased primarily for the samereasons as noted above. Gross cruise revenues increased$2.22 billion, or 52%, in reported 2003 to $6.46 billionfrom $4.24 billion in reported 2002 primarily for the samereasons as net cruise revenues.
Onboard and other revenues included concessionrevenues of $201 million in pro forma 2003, $156 millionin pro forma 2002, $192 million in reported 2003 and$147 million in reported 2002.
Management’s Discussion and Analysis of Financial Condition and Results of Operations (continued)
40 Carnival Corporation & plc
Other non-cruise revenues increased $169 million, or96%, to $345 million in reported 2003 from $176 millionin reported 2002 due to the consolidation of PrincessTours and P&O Travel Ltd.
Costs and Expenses
Net cruise costs increased $652 million, or 21%, to$3.77 billion in pro forma 2003 from $3.12 billion in proforma 2002. The 17.5% increase in pro forma ALBD’saccounted for $546 million of the increase, and theremaining $106 million was from increased net cruisecosts per ALBD, which increased 2.9% in pro forma2003 compared to pro forma 2002 (gross cruise costper ALBD increased 0.2%). Net cruise costs per ALBDincreased primarily due to a 20% increase in fuel pricesand the weak U.S. dollar relative to the euro and thesterling, partially offset by the economies of scale asso-ciated with the 17.5% pro forma ALBD increase. Grosscruise costs increased $797 million, or 18%, in pro forma2003 to $5.28 billion from $4.45 billion in pro forma2002 primarily for the same reasons as net cruise costs.
Net cruise costs increased $1.25 billion, or 61%, to$3.27 billion in reported 2003 from $2.03 billion in reported2002. The increase in reported ALBD’s accounted for$1.12 billion of the increase and the remaining $130 mil-lion was from increased net cruise costs per ALBD,which increased 3.9% in reported 2003 compared toreported 2002 (gross cruise cost per ALBD increased3.9%). Gross cruise costs increased $1.72 billion, or61%, in reported 2003 to $4.52 billion from $2.80 billionin reported 2002 primarily for the same reasons as netcruise costs and a higher proportion of P&O Princessbrands’ customers who purchased air from us.
Other non-cruise operating expense increased $131million, or 90.3%, to $276 million in reported 2003 from$145 million in reported 2002 due to the consolidationof Princess Tours and P&O Travel.
Depreciation and amortization expense increased by$119 million, or 22.3%, to $653 million in pro forma 2003from $534 million in pro forma 2002 largely due to theexpansion of the combined fleet and ship improvementexpenditures, as well as the impact of a weaker U.S.dollar. Depreciation and amortization increased by $203million, or 53.1%, to $585 million in reported 2003 from$382 million in reported 2002. Approximately $126 mil-lion of this increase was from the consolidation of theformer P&O Princess acquired operations. The majorityof the remaining increase was a result of the expansionof the Carnival Corporation fleet and ship improvementexpenditures.
Nonoperating (Expense) Income
Net interest expense, excluding capitalized interest,increased to $217 million in reported 2003 from $118million in reported 2002, or $99 million, which increaseconsisted primarily of a $125 million increase in interestexpense from our increased level of average borrowingsand a weaker U.S. dollar, partially offset by a $31 milliondecrease in interest expense due to lower average bor-rowing rates. The higher average debt balances wereprimarily a result of our consolidation of the former P&OPrincess debt and new ship deliveries.
Income Taxes
The income tax expense of $29 million in reported2003 was primarily due to the consolidation of Carnivalplc’s U.S. based Princess Tours and Costa’s Italian tax-able income.
Liquidity and Capital Resources
Sources and Uses of Cash
Our business provided $3.22 billion of net cash fromoperations during fiscal 2004, an increase of $1.28 billion,or 66.4%, compared to fiscal 2003, due primarily to afull year in 2004 of the P&O Princess operations andsignificantly higher cash flows from operations. We con-tinue to generate substantial cash from operations andremain in a strong financial position.
During fiscal 2004, our net expenditures for capitalprojects were $3.59 billion, of which $3.22 billion wasspent for our ongoing new shipbuilding program, includ-ing the final delivery payments for seven new ships. Theremaining capital expenditures consisted primarily of$219 million for ship improvements and refurbishments,and $151 million for Alaska tour assets, cruise port facil-ity developments and information technology assets.
During fiscal 2004, we borrowed $843 million, whichwere used primarily to finance a portion of the DiamondPrincess and Sapphire Princess purchase prices. Duringfiscal 2004, we made $932 million of debt repayments,which included $330 million of debt repaid prior to itsmaturity date in order to reduce our borrowing rates.Finally, we borrowed $272 million of net short-termbank borrowings primarily to make a portion of the finalship delivery payment for the Costa Magica. We alsopaid cash dividends of $400 million in fiscal 2004.
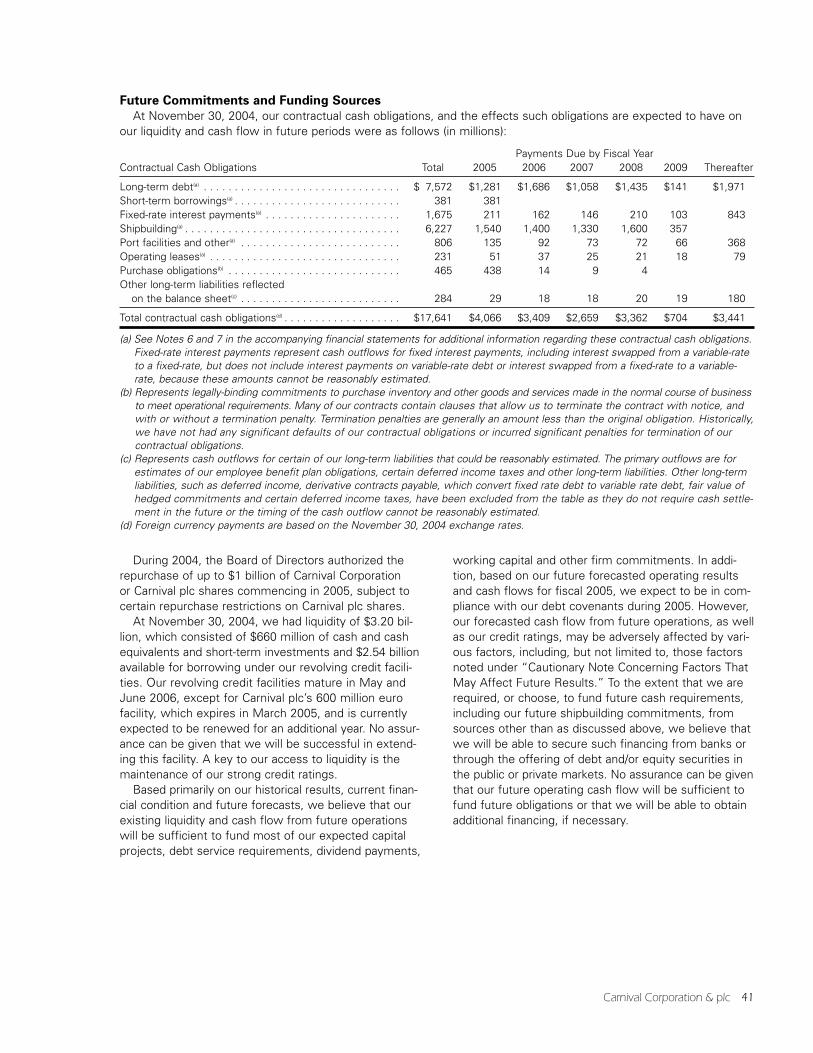
Carnival Corporation & plc 41
During 2004, the Board of Directors authorized therepurchase of up to $1 billion of Carnival Corporation or Carnival plc shares commencing in 2005, subject tocertain repurchase restrictions on Carnival plc shares.
At November 30, 2004, we had liquidity of $3.20 bil-lion, which consisted of $660 million of cash and cashequivalents and short-term investments and $2.54 billionavailable for borrowing under our revolving credit facili-ties. Our revolving credit facilities mature in May andJune 2006, except for Carnival plc’s 600 million eurofacility, which expires in March 2005, and is currentlyexpected to be renewed for an additional year. No assur-ance can be given that we will be successful in extend-ing this facility. A key to our access to liquidity is themaintenance of our strong credit ratings.
Based primarily on our historical results, current finan-cial condition and future forecasts, we believe that ourexisting liquidity and cash flow from future operationswill be sufficient to fund most of our expected capitalprojects, debt service requirements, dividend payments,
working capital and other firm commitments. In addi-tion, based on our future forecasted operating resultsand cash flows for fiscal 2005, we expect to be in com-pliance with our debt covenants during 2005. However,our forecasted cash flow from future operations, as wellas our credit ratings, may be adversely affected by vari-ous factors, including, but not limited to, those factorsnoted under “Cautionary Note Concerning Factors ThatMay Affect Future Results.” To the extent that we arerequired, or choose, to fund future cash requirements,including our future shipbuilding commitments, fromsources other than as discussed above, we believe thatwe will be able to secure such financing from banks orthrough the offering of debt and/or equity securities inthe public or private markets. No assurance can be giventhat our future operating cash flow will be sufficient tofund future obligations or that we will be able to obtainadditional financing, if necessary.
Future Commitments and Funding Sources
At November 30, 2004, our contractual cash obligations, and the effects such obligations are expected to have onour liquidity and cash flow in future periods were as follows (in millions):
Payments Due by Fiscal YearContractual Cash Obligations Total 2005 2006 2007 2008 2009 Thereafter
Long-term debt(a) . . . . . . . . . . . . . . . . . . . . . . . . . . . . . . . . $ 7,572 $1,281 $1,686 $1,058 $1,435 $141 $1,971Short-term borrowings(a) . . . . . . . . . . . . . . . . . . . . . . . . . . . 381 381Fixed-rate interest payments(a) . . . . . . . . . . . . . . . . . . . . . . 1,675 211 162 146 210 103 843Shipbuilding(a) . . . . . . . . . . . . . . . . . . . . . . . . . . . . . . . . . . . 6,227 1,540 1,400 1,330 1,600 357Port facilities and other(a) . . . . . . . . . . . . . . . . . . . . . . . . . . 806 135 92 73 72 66 368Operating leases(a) . . . . . . . . . . . . . . . . . . . . . . . . . . . . . . . 231 51 37 25 21 18 79Purchase obligations(b) . . . . . . . . . . . . . . . . . . . . . . . . . . . . 465 438 14 9 4Other long-term liabilities reflected
on the balance sheet(c) . . . . . . . . . . . . . . . . . . . . . . . . . . 284 29 18 18 20 19 180
Total contractual cash obligations(d) . . . . . . . . . . . . . . . . . . . $17,641 $4,066 $3,409 $2,659 $3,362 $704 $3,441
(a) See Notes 6 and 7 in the accompanying financial statements for additional information regarding these contractual cash obligations.Fixed-rate interest payments represent cash outflows for fixed interest payments, including interest swapped from a variable-rateto a fixed-rate, but does not include interest payments on variable-rate debt or interest swapped from a fixed-rate to a variable-rate, because these amounts cannot be reasonably estimated.
(b) Represents legally-binding commitments to purchase inventory and other goods and services made in the normal course of businessto meet operational requirements. Many of our contracts contain clauses that allow us to terminate the contract with notice, andwith or without a termination penalty. Termination penalties are generally an amount less than the original obligation. Historically,we have not had any significant defaults of our contractual obligations or incurred significant penalties for termination of ourcontractual obligations.
(c) Represents cash outflows for certain of our long-term liabilities that could be reasonably estimated. The primary outflows are forestimates of our employee benefit plan obligations, certain deferred income taxes and other long-term liabilities. Other long-termliabilities, such as deferred income, derivative contracts payable, which convert fixed rate debt to variable rate debt, fair value ofhedged commitments and certain deferred income taxes, have been excluded from the table as they do not require cash settle-ment in the future or the timing of the cash outflow cannot be reasonably estimated.
(d) Foreign currency payments are based on the November 30, 2004 exchange rates.
Management’s Discussion and Analysis of Financial Condition and Results of Operations (continued)
42 Carnival Corporation & plc
Off-Balance Sheet Arrangements
We are not a party to any off-balance sheet arrange-ments, including guarantee contracts, retained or con-tingent interests, certain derivative instruments andvariable interest entities, that either have, or are rea-sonably likely to have, a current or future material effecton our financial statements.
Foreign Currency Exchange Rate Risks
In 2003, we broadened our global presence throughCarnival plc’s foreign operations, in addition to the for-eign currency denominated operations of our Costa sub-sidiary. Specifically, our expanded international businessoperations through P&O Cruises, Ocean Village andSwan Hellenic in the UK and AIDA in Germany subjectus to an increasing level of foreign currency exchangerisk related to the sterling and euro because these oper-ations have either the sterling or the euro as their func-tional currency. Accordingly, exchange rate fluctuationsof the sterling and the euro against the dollar will affectour reported financial results since the reporting cur-rency for our consolidated financial statements is theU.S. dollar and the functional currency for our interna-tional operations is generally the local currency. Anyweakening of the U.S. dollar against these local func-tional currencies has the financial statement effect ofincreasing the U.S. dollar values reported for cruise rev-enues and cruise expenses in our consolidated financialstatements. Strengthening of the U.S. dollar has theopposite effect.
We seek to minimize the impact of fluctuations inforeign currency exchange rates through our normaloperating and financing activities, including netting cer-tain exposures to take advantage of any natural offsetsand, when considered appropriate, through the use ofderivative financial instruments. The financial impacts of these hedging instruments are generally offset bycorresponding changes in the underlying exposuresbeing hedged. Our policy is to not use any financialinstruments for trading or other speculative purposes.
One of our primary foreign currency exchange raterisks is related to our outstanding commitments undership construction contracts denominated in a currencyother than the functional currency of the cruise brandthat is expected to be operating the ship. These currencycommitments are affected by fluctuations in the valueof the functional currency as compared to the currencyin which the shipbuilding contract is denominated. Wegenerally use foreign currency swaps to manage foreigncurrency exchange rate risk from ship construction
contracts (see Notes 2, 7 and 11 in the accompanyingfinancial statements). Accordingly, increases anddecreases in the fair value of these foreign currencyswaps offset changes in the fair value of the foreigncurrency denominated ship construction commitments,thus resulting in the elimination of such risk.
Specifically, we have foreign currency swaps forthree of our euro denominated shipbuilding contracts.At November 30, 2004, the fair value of these foreigncurrency swaps was an unrealized gain of $219 millionwhich is recorded, along with an offsetting $219 millionfair value liability related to our shipbuilding firm com-mitments, on our accompanying 2004 balance sheet.Based upon a 10% strengthening or weakening of theU.S. dollar compared to the euro as of November 30,2004, assuming no changes in comparative interest rates,the estimated fair value of these foreign currency swapswould decrease or increase by $105 million, whichwould be offset by a decrease or increase of $105 millionin the U.S. dollar value of the related foreign currencyship construction commitments resulting in no net dollarimpact to us.
However, at November 30, 2004, we also have threeshipbuilding contracts denominated in euros, one ofwhich has been assigned to a sterling functional currencycompany and two, which are still unassigned, for whichwe have not entered into any foreign currency swaps.At current exchange rates, it is most likely that thesetwo contracts will be assigned to one of our cruisebrands whose functional currency is the euro or sterling.
The cost of shipbuilding orders that we may place inthe future for our cruise lines who generate their cashflows in a currency that is different than the shipyard’soperating currency, generally the euro, is expected tobe affected by foreign currency exchange rate fluctua-tions. Given the decline in the U.S. dollar relative to theeuro, the U.S. dollar cost to order new cruise ships atcurrent exchange rates has increased significantly. If theU.S. dollar remains at current levels or declines further,this may affect our ability to order future new cruiseships for U.S. dollar functional currency brands.
Finally, we consider our investments in foreign sub-sidiaries to be denominated in relatively stable currenciesand of a long-term nature. We partially address theseexposures by denominating a portion of our debt orentering into foreign currency swaps in our subsidiaries’functional currencies (generally euros or sterling). Speci-fically, we have debt of $2.2 billion in euros and $415million in sterling and have $887 million of foreign cur-rency swaps, whereby we have converted $251 million
Carnival Corporation & plc 43
of U.S. dollar debt into sterling debt, $466 million ofU.S. dollar debt into euro debt and $170 million of eurodebt into sterling debt, thus partially offsetting this for-eign currency exchange rate risk. At November 30, 2004,the fair value of these foreign currency swaps was anunrealized loss of $137 million, which is recorded inAOCI and offsets a portion of the gains recorded in AOCIupon translating these foreign subsidiaries’ net assetsinto U.S. dollars. Based upon a 10% hypothetical increaseor decrease in the November 30, 2004 foreign currencyexchange rate, we estimate that these contracts’ fairvalues would increase or decrease by $89 million, whichwould be offset by a decrease or increase of $89 millionin the U.S. dollar value of our net investments.
Interest Rate RisksWe seek to minimize the impact of fluctuations in
interest rates through our long-term investment anddebt portfolio strategies, which include entering into asubstantial amount of fixed rate debt instruments. Wecontinuously evaluate our debt portfolio, and make peri-odic adjustments to the mix of floating rate and fixedrate debt based on our view of interest rate movementsthrough the use of interest rate swaps. Accordingly in2003 and 2001, we entered into fixed to variable inter-est rate swaps, which lowered our fiscal 2004, 2003and 2002 interest costs, and are also expected to lowerour fiscal 2005 interest costs. At November 30, 2004,68% of the interest cost on our long-term debt waseffectively fixed and 32% was variable, including theeffect of our interest rate swaps.
Specifically, we have interest rate swaps at November30, 2004, which effectively changed $929 million offixed rate debt to Libor-based floating rate debt. In addi-tion, we have interest rate swaps at November 30, 2004,which effectively changed $828 million of euribor float-ing rate debt to fixed rate debt. The fair value of ourlong-term debt and interest rate swaps at November30, 2004 was $8.46 billion. Based upon a hypothetical10% decrease or increase in the November 30, 2004market interest rates, the fair value of our long-termdebt and interest rate swaps would increase or decreaseby approximately $100 million and interest expense onour variable rate debt, including the effect of our inter-est rate swaps, would increase or decrease by approxi-mately $8 million.
In addition, based upon a hypothetical 10% decreaseor increase in Carnival Corporation’s November 30,2004 common stock price, the fair value of our convert-ible notes would increase or decrease by approximately$230 million.
These hypothetical amounts are determined by con-sidering the impact of the hypothetical interest ratesand common stock price on our existing long-term debtand interest rate swaps. This analysis does not considerthe effects of the changes in the level of overall eco-nomic activity that could exist in such environments orany relationships which may exist between interest rateand stock price movements. Furthermore, since sub-stantially all of our fixed rate long-term debt cannotcurrently be called or prepaid and $828 million of ourvariable rate long-term debt is subject to interest rateswaps which effectively fix the interest rate, it is unlikelywe would be able to take any significant steps in theshort term to mitigate our exposure in the unlikely eventof a significant decrease in market interest rates.
Bunker Fuel Price RisksWe have typically not used financial instruments to
hedge our exposure to the bunker fuel price market risk.Based upon a 10% hypothetical increase or decrease inour fiscal 2004 average bunker fuel price of $194 perton, we estimate that our fiscal 2005 bunker fuel costwould increase or decrease by approximately $55 million.
Selected Financial Data
The selected consolidated financial data presented below for fiscal 2000 through 2004 and as of the end of eachsuch year, are derived from our audited financial statements and should be read in conjunction with those financialstatements and the related notes.
Years Ended November 30,2004 2003 2002 2001 2000
(in millions, except per share and other operating data)Statement of Operations and Cash Flow Data(a)(b)
Revenues . . . . . . . . . . . . . . . . . . . . . . . . . . . . . . . $ 9,727 $ 6,718 $ 4,383 $ 4,549 $3,791Operating income . . . . . . . . . . . . . . . . . . . . . . . . . $ 2,173 $ 1,383 $ 1,042 $ 892 $ 983Net income(c) . . . . . . . . . . . . . . . . . . . . . . . . . . . . . $ 1,854 $ 1,194 $ 1,016(d) $ 926(d) $ 965Earnings per share(c)
Basic . . . . . . . . . . . . . . . . . . . . . . . . . . . . . . . . . $ 2.31 $ 1.66 $ 1.73 $ 1.58 $ 1.61Diluted(e) . . . . . . . . . . . . . . . . . . . . . . . . . . . . . . $ 2.24 $ 1.63 $ 1.69 $ 1.57 $ 1.60
Dividends declared per share . . . . . . . . . . . . . . . . $ 0.525 $ 0.440 $ 0.420 $ 0.420 $0.420Cash from operations . . . . . . . . . . . . . . . . . . . . . . $ 3,216 $ 1,933 $ 1,469 $ 1,239 $1,280Capital expenditures . . . . . . . . . . . . . . . . . . . . . . . $ 3,586 $ 2,516 $ 1,986 $ 827 $1,003Other Operating Data(a)(b)
Available lower berth days(f) . . . . . . . . . . . . . . . . . . 44,009,061 33,309,785 21,435,828 20,685,123 15,888,404Passengers carried . . . . . . . . . . . . . . . . . . . . . . . . 6,306,168 5,037,553 3,549,019 3,385,280 2,669,153Occupancy percentages(g) . . . . . . . . . . . . . . . . . . . 104.5% 103.4% 105.2% 104.7% 105.4%
As of November 30,2004 2003 2002 2001 2000
(in millions, except percentages)Balance Sheet and Other Data(a)(b)
Total assets. . . . . . . . . . . . . . . . . . . . . . . . . . . . . . $27,636 $24,491 $12,335 $11,564 $9,831Long-term debt, excluding current portion . . . . . . . $ 6,291 $ 6,918 $ 3,014 $ 2,955 $2,099Total shareholders’ equity . . . . . . . . . . . . . . . . . . . $15,760 $13,793 $ 7,418 $ 6,591 $5,871Debt to capital(h). . . . . . . . . . . . . . . . . . . . . . . . . . . 33.5% 34.9% 29.9% 31.1% 28.6%
(a) Includes the results of Carnival plc since April 17, 2003. Accordingly, the information for 2004 and 2003 is not comparable to theprior periods. Our results for the three years prior to fiscal 2004, were negatively affected by a number of factors affecting con-sumers’ vacation demands including, among other things, armed conflicts in the Middle East and elsewhere, terrorist attacks inthe U.S. and elsewhere, the uncertain worldwide economy and adverse publicity surrounding these and other events.
(b) From June 1997 through September 28, 2000, we owned 50% of Costa. On September 29, 2000, we completed the acquisitionof the remaining 50% interest in Costa. We accounted for this transaction using the purchase accounting method. In fiscal 2000,we accounted for our 50% interest in Costa using the equity method. Commencing in fiscal 2001, Costa’s results of operationshave been consolidated. Our November 30, 2000 and subsequent consolidated balance sheets include Costa’s balance sheet. The statistical information for 2000 does not include Costa.
44 Carnival Corporation & plc
(c) Effective December 1, 2001, we adopted SFAS No. 142, which required us to stop amortizing goodwill as of December 1, 2001.If amortization of goodwill had not been recorded for fiscal 2001 and 2000, our adjusted net income and adjusted basic anddiluted earnings per share would have been as follows (in millions, except per share data):
Years Ended November 30,2001 2000
Net income . . . . . . . . . . . . . . . . . . . . . . . . . . . . . . . . . . . . . . . . . . . . . . . . $ 926 $ 965Goodwill amortization . . . . . . . . . . . . . . . . . . . . . . . . . . . . . . . . . . . . . . . . . 26 23
Adjusted net income . . . . . . . . . . . . . . . . . . . . . . . . . . . . . . . . . . . . . . . . . $ 952 $ 988
Adjusted earnings per shareBasic . . . . . . . . . . . . . . . . . . . . . . . . . . . . . . . . . . . . . . . . . . . . . . . . . . . $1.63 $1.65
Diluted . . . . . . . . . . . . . . . . . . . . . . . . . . . . . . . . . . . . . . . . . . . . . . . . . . $1.61 $1.64
As required by EITF No. 04-08, we have retroactively restated our 2001 diluted earnings per share amount and reduced it fromthe previously reported amount by $0.01.
(d) Our net income for fiscal 2002 and 2001 includes an impairment charge of $20 million and $140 million, respectively, and fiscal2001 includes a nonoperating net gain of $101 million from the sale of our investment in Airtours plc. In addition, fiscal 2002includes a $51 million income tax benefit as a result of an Italian investment incentive.
(e) During the fourth quarter of 2004, we elected to early adopt EITF No. 04-08. As required by EITF No. 04-08, we have retroactivelyrestated our 2003, 2002 and 2001 diluted earnings per share amounts and reduced them from the previously reported amountsby $0.03, $0.04, and $0.01, respectively.
(f) Total annual passenger capacity for the period, assuming two passengers per cabin, that we offered for sale, which is computedby multiplying passenger capacity by revenue-producing ship operating days in the period.
(g) In accordance with cruise industry practice, occupancy percentage is calculated using a denominator of two passengers per cabineven though some cabins can accommodate three or more passengers. The percentages in excess of 100% indicate that morethan two passengers occupied some cabins.
(h) Percentage of total debt to the sum of total debt and shareholders’ equity.
Carnival Corporation & plc 45
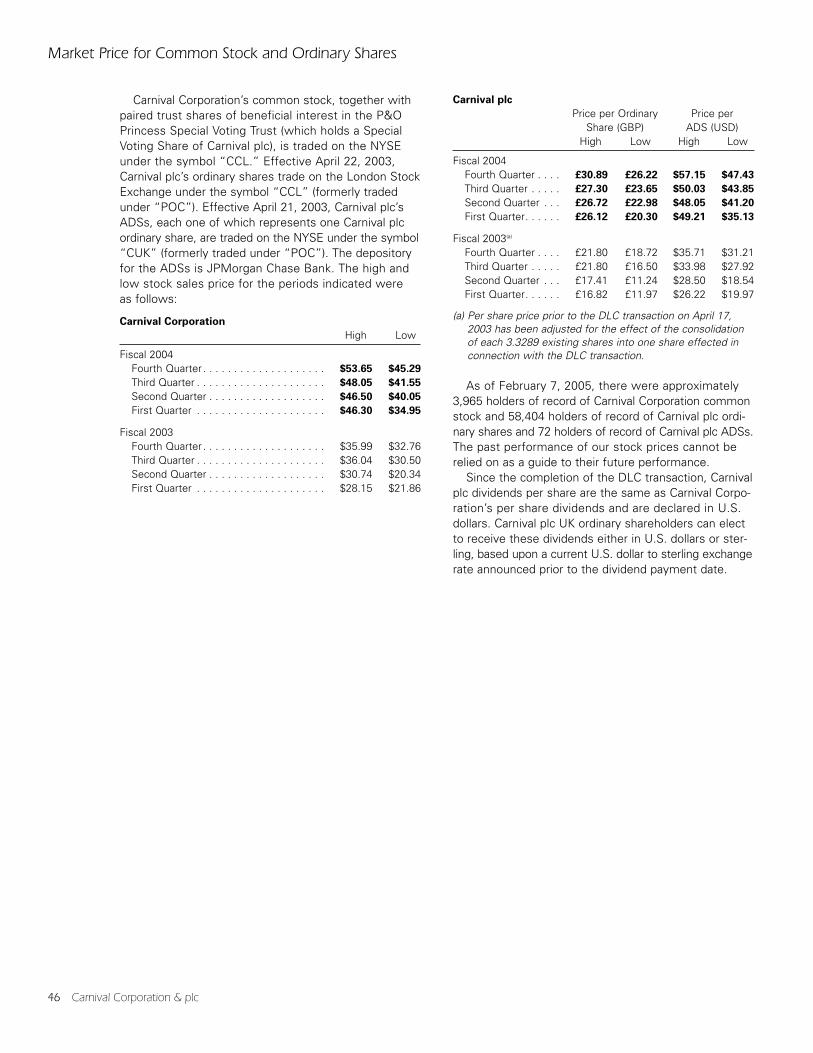
Market Price for Common Stock and Ordinary Shares
Carnival Corporation’s common stock, together withpaired trust shares of beneficial interest in the P&OPrincess Special Voting Trust (which holds a SpecialVoting Share of Carnival plc), is traded on the NYSEunder the symbol “CCL.” Effective April 22, 2003,Carnival plc’s ordinary shares trade on the London StockExchange under the symbol “CCL” (formerly tradedunder “POC”). Effective April 21, 2003, Carnival plc’sADSs, each one of which represents one Carnival plcordinary share, are traded on the NYSE under the symbol“CUK” (formerly traded under “POC”). The depositoryfor the ADSs is JPMorgan Chase Bank. The high andlow stock sales price for the periods indicated wereas follows:
Carnival Corporation
High Low
Fiscal 2004Fourth Quarter . . . . . . . . . . . . . . . . . . . . $53.65 $45.29
Third Quarter . . . . . . . . . . . . . . . . . . . . . $48.05 $41.55
Second Quarter . . . . . . . . . . . . . . . . . . . $46.50 $40.05
First Quarter . . . . . . . . . . . . . . . . . . . . . $46.30 $34.95
Fiscal 2003Fourth Quarter . . . . . . . . . . . . . . . . . . . . $35.99 $32.76Third Quarter . . . . . . . . . . . . . . . . . . . . . $36.04 $30.50Second Quarter . . . . . . . . . . . . . . . . . . . $30.74 $20.34First Quarter . . . . . . . . . . . . . . . . . . . . . $28.15 $21.86
Carnival plc
Price per Ordinary Price perShare (GBP) ADS (USD)
High Low High Low
Fiscal 2004Fourth Quarter . . . . £30.89 £26.22 $57.15 $47.43
Third Quarter . . . . . £27.30 £23.65 $50.03 $43.85
Second Quarter . . . £26.72 £22.98 $48.05 $41.20
First Quarter. . . . . . £26.12 £20.30 $49.21 $35.13
Fiscal 2003(a)
Fourth Quarter . . . . £21.80 £18.72 $35.71 $31.21Third Quarter . . . . . £21.80 £16.50 $33.98 $27.92Second Quarter . . . £17.41 £11.24 $28.50 $18.54First Quarter. . . . . . £16.82 £11.97 $26.22 $19.97
(a) Per share price prior to the DLC transaction on April 17,2003 has been adjusted for the effect of the consolidationof each 3.3289 existing shares into one share effected inconnection with the DLC transaction.
As of February 7, 2005, there were approximately3,965 holders of record of Carnival Corporation commonstock and 58,404 holders of record of Carnival plc ordi-nary shares and 72 holders of record of Carnival plc ADSs.The past performance of our stock prices cannot berelied on as a guide to their future performance.
Since the completion of the DLC transaction, Carnivalplc dividends per share are the same as Carnival Corpo-ration’s per share dividends and are declared in U.S.dollars. Carnival plc UK ordinary shareholders can electto receive these dividends either in U.S. dollars or ster-ling, based upon a current U.S. dollar to sterling exchangerate announced prior to the dividend payment date.
46 Carnival Corporation & plc
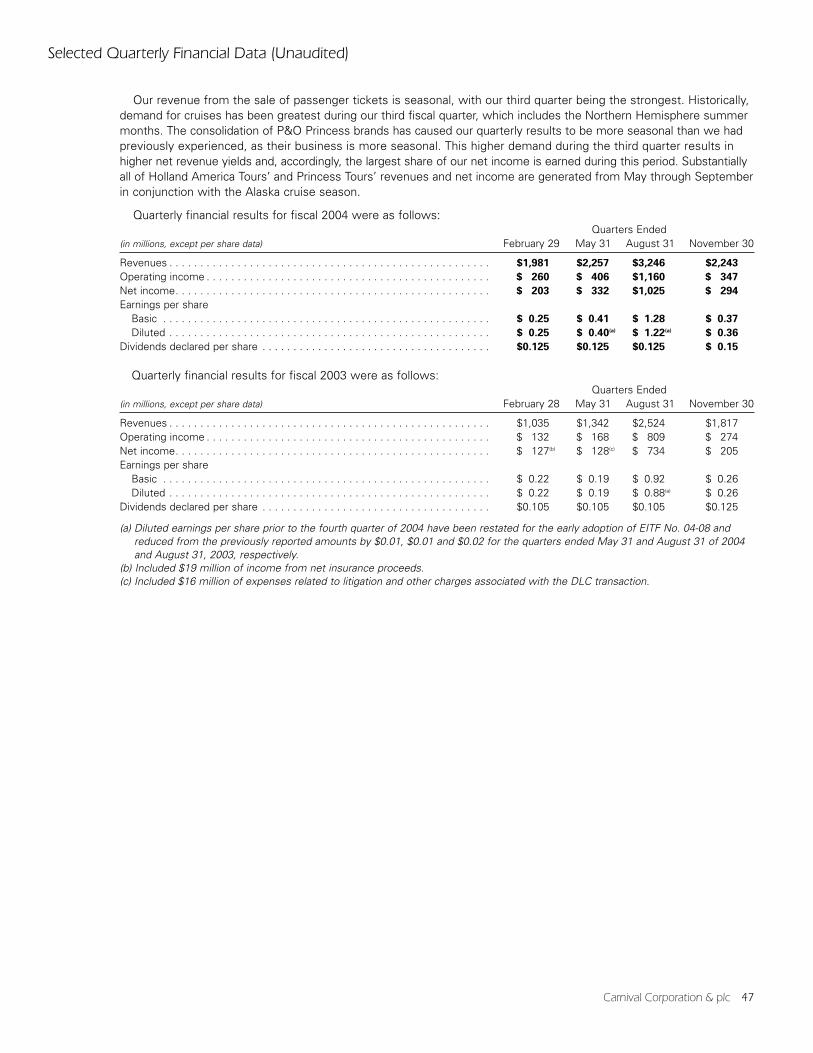
Selected Quarterly Financial Data (Unaudited)
Our revenue from the sale of passenger tickets is seasonal, with our third quarter being the strongest. Historically,demand for cruises has been greatest during our third fiscal quarter, which includes the Northern Hemisphere summermonths. The consolidation of P&O Princess brands has caused our quarterly results to be more seasonal than we hadpreviously experienced, as their business is more seasonal. This higher demand during the third quarter results inhigher net revenue yields and, accordingly, the largest share of our net income is earned during this period. Substantiallyall of Holland America Tours’ and Princess Tours’ revenues and net income are generated from May through Septemberin conjunction with the Alaska cruise season.
Quarterly financial results for fiscal 2004 were as follows:Quarters Ended
(in millions, except per share data) February 29 May 31 August 31 November 30
Revenues . . . . . . . . . . . . . . . . . . . . . . . . . . . . . . . . . . . . . . . . . . . . . . . . . . . . $1,981 $2,257 $3,246 $2,243
Operating income . . . . . . . . . . . . . . . . . . . . . . . . . . . . . . . . . . . . . . . . . . . . . . $ 260 $ 406 $1,160 $ 347
Net income. . . . . . . . . . . . . . . . . . . . . . . . . . . . . . . . . . . . . . . . . . . . . . . . . . . $ 203 $ 332 $1,025 $ 294
Earnings per shareBasic . . . . . . . . . . . . . . . . . . . . . . . . . . . . . . . . . . . . . . . . . . . . . . . . . . . . . $ 0.25 $ 0.41 $ 1.28 $ 0.37
Diluted . . . . . . . . . . . . . . . . . . . . . . . . . . . . . . . . . . . . . . . . . . . . . . . . . . . . $ 0.25 $ 0.40(a) $ 1.22(a) $ 0.36
Dividends declared per share . . . . . . . . . . . . . . . . . . . . . . . . . . . . . . . . . . . . . $0.125 $0.125 $0.125 $ 0.15
Quarterly financial results for fiscal 2003 were as follows:Quarters Ended
(in millions, except per share data) February 28 May 31 August 31 November 30
Revenues . . . . . . . . . . . . . . . . . . . . . . . . . . . . . . . . . . . . . . . . . . . . . . . . . . . . $1,035 $1,342 $2,524 $1,817Operating income . . . . . . . . . . . . . . . . . . . . . . . . . . . . . . . . . . . . . . . . . . . . . . $ 132 $ 168 $ 809 $ 274Net income. . . . . . . . . . . . . . . . . . . . . . . . . . . . . . . . . . . . . . . . . . . . . . . . . . . $ 127(b) $ 128(c) $ 734 $ 205Earnings per share
Basic . . . . . . . . . . . . . . . . . . . . . . . . . . . . . . . . . . . . . . . . . . . . . . . . . . . . . $ 0.22 $ 0.19 $ 0.92 $ 0.26Diluted . . . . . . . . . . . . . . . . . . . . . . . . . . . . . . . . . . . . . . . . . . . . . . . . . . . . $ 0.22 $ 0.19 $ 0.88(a) $ 0.26
Dividends declared per share . . . . . . . . . . . . . . . . . . . . . . . . . . . . . . . . . . . . . $0.105 $0.105 $0.105 $0.125
(a) Diluted earnings per share prior to the fourth quarter of 2004 have been restated for the early adoption of EITF No. 04-08 andreduced from the previously reported amounts by $0.01, $0.01 and $0.02 for the quarters ended May 31 and August 31 of 2004and August 31, 2003, respectively.
(b) Included $19 million of income from net insurance proceeds.(c) Included $16 million of expenses related to litigation and other charges associated with the DLC transaction.
Carnival Corporation & plc 47
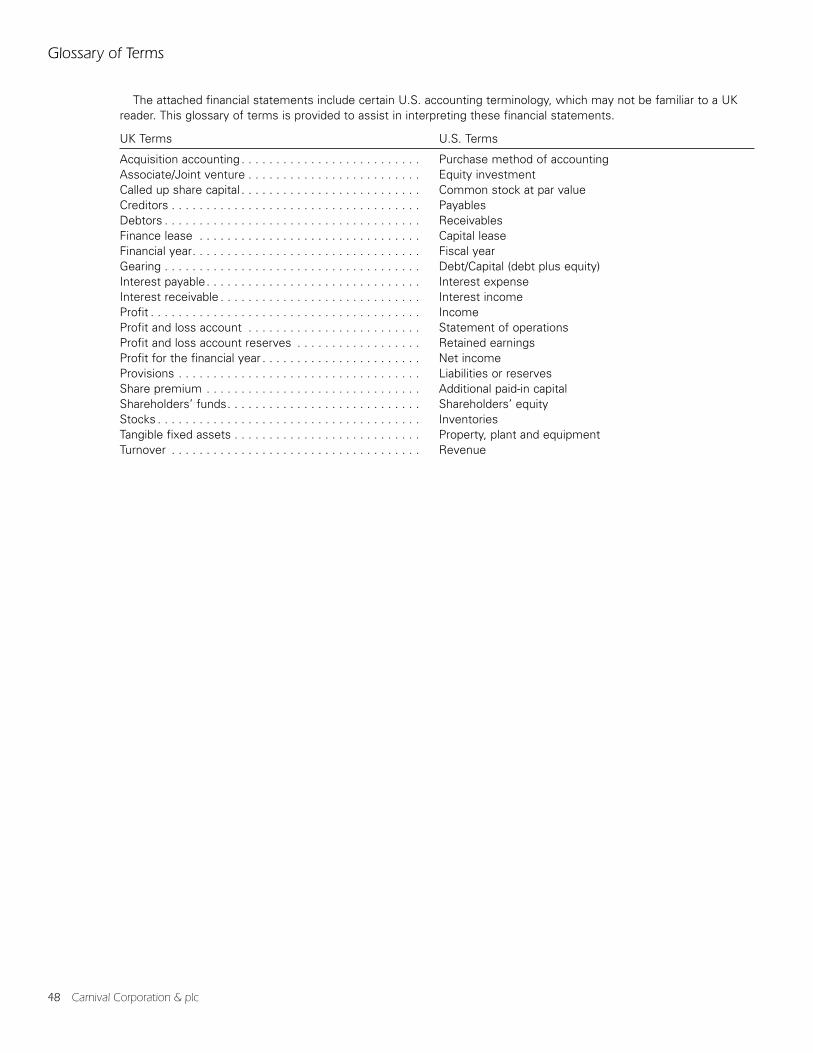
Glossary of Terms
The attached financial statements include certain U.S. accounting terminology, which may not be familiar to a UKreader. This glossary of terms is provided to assist in interpreting these financial statements.
UK Terms U.S. Terms
Acquisition accounting . . . . . . . . . . . . . . . . . . . . . . . . . . Purchase method of accountingAssociate/Joint venture . . . . . . . . . . . . . . . . . . . . . . . . . Equity investmentCalled up share capital . . . . . . . . . . . . . . . . . . . . . . . . . . Common stock at par valueCreditors . . . . . . . . . . . . . . . . . . . . . . . . . . . . . . . . . . . . PayablesDebtors . . . . . . . . . . . . . . . . . . . . . . . . . . . . . . . . . . . . . ReceivablesFinance lease . . . . . . . . . . . . . . . . . . . . . . . . . . . . . . . . Capital leaseFinancial year. . . . . . . . . . . . . . . . . . . . . . . . . . . . . . . . . Fiscal yearGearing . . . . . . . . . . . . . . . . . . . . . . . . . . . . . . . . . . . . . Debt/Capital (debt plus equity)Interest payable. . . . . . . . . . . . . . . . . . . . . . . . . . . . . . . Interest expenseInterest receivable . . . . . . . . . . . . . . . . . . . . . . . . . . . . . Interest incomeProfit . . . . . . . . . . . . . . . . . . . . . . . . . . . . . . . . . . . . . . . IncomeProfit and loss account . . . . . . . . . . . . . . . . . . . . . . . . . Statement of operationsProfit and loss account reserves . . . . . . . . . . . . . . . . . . Retained earningsProfit for the financial year . . . . . . . . . . . . . . . . . . . . . . . Net incomeProvisions . . . . . . . . . . . . . . . . . . . . . . . . . . . . . . . . . . . Liabilities or reservesShare premium . . . . . . . . . . . . . . . . . . . . . . . . . . . . . . . Additional paid-in capitalShareholders’ funds. . . . . . . . . . . . . . . . . . . . . . . . . . . . Shareholders’ equityStocks . . . . . . . . . . . . . . . . . . . . . . . . . . . . . . . . . . . . . . InventoriesTangible fixed assets . . . . . . . . . . . . . . . . . . . . . . . . . . . Property, plant and equipmentTurnover . . . . . . . . . . . . . . . . . . . . . . . . . . . . . . . . . . . . Revenue
48 Carnival Corporation & plc
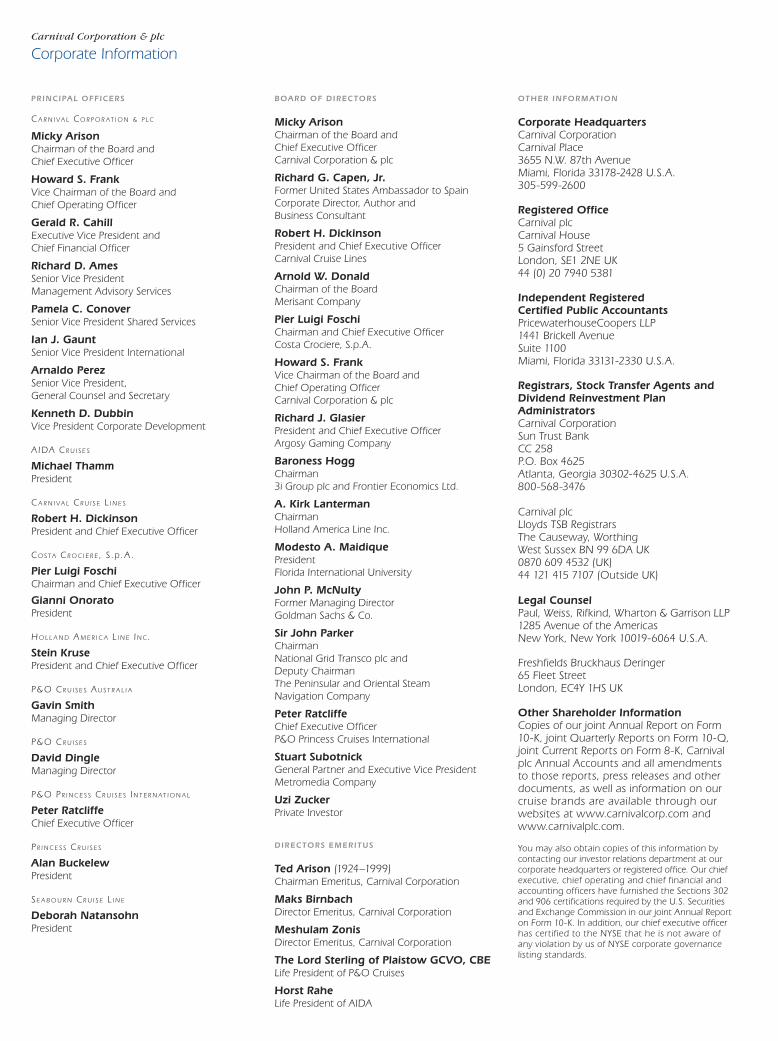
Carnival Corporation & plc
Corporate Information
PR INCIPA L OFFICERS
C A R N I VA L CO R P O R AT I O N & P L C
Micky ArisonChairman of the Board and Chief Executive Officer
Howard S. FrankVice Chairman of the Board and Chief Operating Officer
Gerald R. CahillExecutive Vice President and Chief Financial Officer
Richard D. AmesSenior Vice President Management Advisory Services
Pamela C. ConoverSenior Vice President Shared Services
Ian J. GauntSenior Vice President International
Arnaldo PerezSenior Vice President, General Counsel and Secretary
Kenneth D. DubbinVice President Corporate Development
A IDA C R U I S E S
Michael ThammPresident
C A R N I VA L C R U I S E L I N E S
Robert H. DickinsonPresident and Chief Executive Officer
CO S TA C R O C I E R E , S .p . A .
Pier Luigi FoschiChairman and Chief Executive Officer
Gianni OnoratoPresident
H O L L A N D A M E R I C A L I N E I N C .
Stein KrusePresident and Chief Executive Officer
P& O C R U I S E S A U S T R A L I A
Gavin SmithManaging Director
P& O C R U I S E S
David DingleManaging Director
P& O P R I N C E S S C R U I S E S I N T E R N AT I O N A L
Peter RatcliffeChief Executive Officer
P R I N C E S S C R U I S E S
Alan BuckelewPresident
S E A B O U R N C R U I S E L I N E
Deborah NatansohnPresident
BOA RD OF DIRECTORS
Micky ArisonChairman of the Board and Chief Executive Officer Carnival Corporation & plc
Richard G. Capen, Jr.Former United States Ambassador to SpainCorporate Director, Author and Business Consultant
Robert H. DickinsonPresident and Chief Executive Officer Carnival Cruise Lines
Arnold W. DonaldChairman of the Board Merisant Company
Pier Luigi FoschiChairman and Chief Executive Officer Costa Crociere, S.p.A.
Howard S. FrankVice Chairman of the Board and Chief Operating Officer Carnival Corporation & plc
Richard J. GlasierPresident and Chief Executive Officer Argosy Gaming Company
Baroness HoggChairman 3i Group plc and Frontier Economics Ltd.
A. Kirk LantermanChairman Holland America Line Inc.
Modesto A. MaidiquePresident Florida International University
John P. McNultyFormer Managing Director Goldman Sachs & Co.
Sir John ParkerChairman National Grid Transco plc and Deputy Chairman The Peninsular and Oriental Steam Navigation Company
Peter RatcliffeChief Executive Officer P&O Princess Cruises International
Stuart SubotnickGeneral Partner and Executive Vice President Metromedia Company
Uzi ZuckerPrivate Investor
DIRECTORS EMERITUS
Ted Arison (1924–1999)Chairman Emeritus, Carnival Corporation
Maks BirnbachDirector Emeritus, Carnival Corporation
Meshulam ZonisDirector Emeritus, Carnival Corporation
The Lord Sterling of Plaistow GCVO, CBELife President of P&O Cruises
Horst RaheLife President of AIDA
OTHER INFORMATION
Corporate HeadquartersCarnival Corporation Carnival Place 3655 N.W. 87th Avenue Miami, Florida 33178-2428 U.S.A. 305-599-2600
Registered OfficeCarnival plcCarnival House 5 Gainsford Street London, SE1 2NE UK 44 (0) 20 7940 5381
Independent Registered Certified Public Accountants PricewaterhouseCoopers LLP 1441 Brickell Avenue Suite 1100 Miami, Florida 33131-2330 U.S.A.
Registrars, Stock Transfer Agents andDividend Reinvestment Plan AdministratorsCarnival Corporation Sun Trust BankCC 258 P.O. Box 4625 Atlanta, Georgia 30302-4625 U.S.A.800-568-3476
Carnival plcLloyds TSB RegistrarsThe Causeway, WorthingWest Sussex BN 99 6DA UK0870 609 4532 (UK) 44 121 415 7107 (Outside UK)
Legal CounselPaul, Weiss, Rifkind, Wharton & Garrison LLP 1285 Avenue of the Americas New York, New York 10019-6064 U.S.A.
Freshfields Bruckhaus Deringer 65 Fleet Street London, EC4Y 1HS UK
Other Shareholder InformationCopies of our joint Annual Report on Form 10-K, joint Quarterly Reports on Form 10-Q, joint Current Reports on Form 8-K, Carnival plc Annual Accounts and all amendments to those reports, press releases and other documents, as well as information on our cruise brands are available through our websites at www.carnivalcorp.com and www.carnivalplc.com.
You may also obtain copies of this information by contacting our investor relations department at our corporate headquarters or registered office. Our chief executive, chief operating and chief financial and accounting officers have furnished the Sections 302 and 906 certifications required by the U.S. Securities and Exchange Commission in our joint Annual Report on Form 10-K. In addition, our chief executive officer has certified to the NYSE that he is not aware of any violation by us of NYSE corporate governance listing standards.
C A R N I V A LCORPORATION & PLC
Carnival Place 3655 N.W. 87th Avenue
Miami, Florida 33178-2428 U.S.A.
www.carnivalcorp.com
Carnival House 5 Gainsford Street London SE1 2NE
UKwww.carnivalplc.com