caribou management report -alaska dept fish and game...suspected the 2-cannister st-14 satellite...
TRANSCRIPT

Caribou Management Report
of survey-inventory activities 1 July 1998–30 June 2000
Carole Healy, Editor
Alaska Department of Fish and Game Division of Wildlife Conservation
December 2001
Please note that population and harvest data in this report are estimates and may be refined at a later date.
If this report is used in its entirety, please reference as: Alaska Department of Fish and Game. 2001. Caribou management report of survey-inventory activities 1 July 1998–30 June 2000. C. Healy, editor. Project 3.0. Juneau, Alaska.
If used in part, the reference would include the author’s name, unit number, and page numbers. Authors’ names can be found at the end of each unit section.
Funded in part through Federal Aid in Wildlife Restoration, Proj. 3, Grants W-27-2 and W-27-3.
ADF&G

Alaska’s Game Management Units Caribou Herds in Alaska
SPECIES Alaska Department of Fish and GameDivision of Wildlife Conservation
MANAGEMENT REPORT (907) 465-4190 PO BOX 25526 JUNEAU, AK 99802-5526
181
CARIBOU MANAGEMENT REPORT
From: 1 July 1998 To: 30 June 2000
LOCATION GAME MANAGEMENT UNIT: 21D, 22A, 22B, 23, 24 and 26A
HERD: Western Arctic
GEOGRAPHIC DESCRIPTION: Northwest Alaska
BACKGROUND The Western Arctic Caribou Herd (WACH) ranges over approximately 140,000 mi2 (363,000 km2) of northwestern Alaska (Fig 1). Summer range encompasses the calving grounds and consists of the northern foothills and mountains of the Brooks Range west of the Trans-Alaska Pipeline. In most years since the mid 1980s, at least half of the WACH has wintered in the eastern third of the Seward Peninsula and in the Nulato Hills as far south as the Unalakleet River drainage. Since 1996, caribou expanded this winter range to include the eastern half of the Seward Peninsula. Additionally, in several years during the late 1990s many caribou wintered in upper Koyukuk River drainages and on the North Slope between Atqasuk, Wainwright and Umiat.
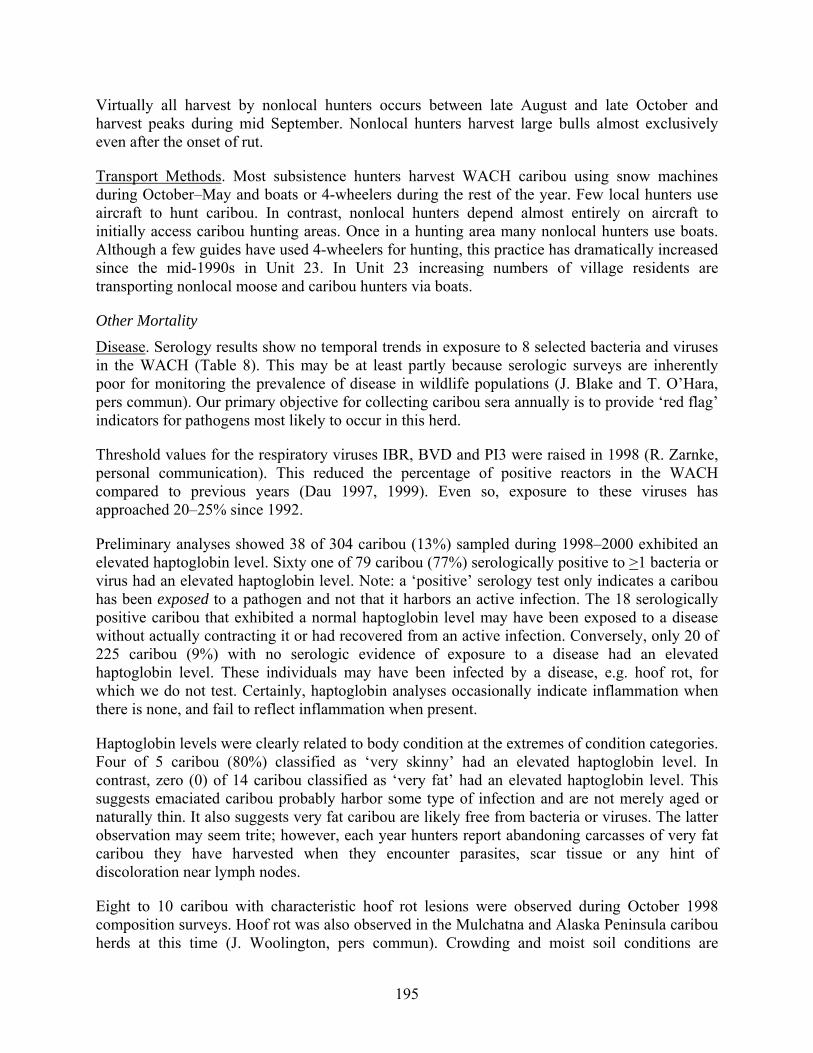
In 1970, the WACH population numbered approximately 243,000 caribou. By 1976 it had declined to an estimated 75,000 animals. From 1976 to 1990, the WACH grew about 13% annually, and from 1990–1996 it grew 1–3% annually. The herd may have peaked in 1996 at 463,00 caribou. Census results suggest the WACH declined about 2% annually between 1996 and 1999 to 430,000 caribou; however, the 1999 estimate may be conservative and the population may have remained stable during this time.
MANAGEMENT DIRECTION
MANAGEMENT GOALS • To protect and maintain the WACH and its habitat.
• To provide for subsistence and recreational hunting on a sustained yield basis.
• To provide for viewing and other uses of caribou.
• To perpetuate associated wildlife populations, including carnivores.

182
MANAGEMENT OBJECTIVES • To maintain a postcalving population of ≥200,000 caribou.
• To minimize conflicts with the reindeer industry.
• To monitor the size, sex and age composition, productivity and recruitment, mortality and distribution of this population.
• To improve public understanding of WACH management, improve harvest reporting and encourage public involvement in the regulatory process.
• To minimize human impacts, e.g. resource development, tourism, commercial activities (guiding and transporting hunters and nonconsumptive users) and transportation corridors, on caribou and their habitat.
• To cooperatively manage this herd through a Working Group comprising major stakeholders (e.g. village representatives, guides, transporters, nonconsumptive users, nonlocal hunters, and state and federal resource managers).
• To re-write the WACH Management Plan by December 2002.
METHODS In this report ‘caribou’ in the generic sense refers to the WACH. Reference to caribou from other herds will be identified in text.
Population Status and Trend. Conventional VHF and satellite radiotelemetry techniques were used to estimate population size, adult mortality, calf production and recruitment, sex and age composition, movement patterns and distribution. Telonics, Inc. (Mesa, AZ) manufactured all radio collars deployed in the WACH. Configuration of conventional collars, relocation techniques, types of data collected, allocation of collars between bulls and cows, and sources of error in telemetry data have been previously described in Dau (1997, 1999).
As in the past, we attempted to complete each “collar year” (1 Oct–30 Sep) with ≥100 functional transmitters on living caribou during this reporting period. To meet this goal, in recent years we began each collar year with 115–130 potentially active collars in the herd. We have not attempted to radiocollar a cross-section of ages and sexes in the population. For example, we do not have an accurate cross-section of bull cohorts collared because only large adults are collared and we attempt to maintain only 15 collared bulls in the total marked sample annually. The radiocollared sample of cows, however, is probably representative of adult female cohorts because collars are randomly deployed annually among females >2 years old irrespective of maternal status. Only those individuals in very poor physical condition are not collared.
We began the 1998–1999 collar year with 118 potentially active conventional collars on living caribou (105 cows and 13 bulls). Of these, 15 collars on cows were also equipped with a functional platform terminal transmitter (PTT or satellite collar). We began the 1999–2000 collar year with 127 potentially active conventional collars on living caribou (110 cows and 17 bulls).
183
Of these, 22 collars on cows were also equipped with a functional PTT. We began the 2000–2001 collar year with 127 potentially active conventional collars on living caribou (114 cows and 13 bulls). Of these, 20 collars on cows were also equipped with a functional PTT.
During the reporting period all radio collars were deployed during September in Unit 23 at Onion Portage on the Kobuk River. The rationale and methods for this technique have been previously described (Dau 1997). As in the past, we did not remove radio collars or recollar caribou during the reporting period.
Twenty eight radio collars were deployed on 8 bulls and 20 cows at Onion Portage during 1998; 10 of these collars deployed on cows were also equipped with a PTT. Of the 10 PTTs deployed in 1998, 8 were model ST-14s and 2 were a prototype of what later became ST-18s. We suspected the 2-cannister ST-14 satellite collar configuration predisposed some cows to early mortality so worked with Telonics, Inc., to develop the ST-18 collar. Advantages of the ST-18 compared to the ST-14 were reduced weight (1388g vs. 1789g) and a more streamlined configuration with both the PTT and conventional beacons within 1 cannister. In 1999, 30 caribou (5 bulls and 25 cows) were radiocollared; 10 collars on cows were also equipped with an ST-18 PTT. In 2000 (after this reporting period), 20 caribou (3 bulls and 17 cows) were radiocollared, and 4 collars on cows were equipped with an ST-18 PTT. In fall 2000 we programmed a duty cycle (18 hours on and 6 hours off, 7:00 a.m. to 1:00 a.m. daily) into all conventional transmitters to extend their functional life. This was the first time duty cycles were used in conventional transmitters in the WACH. The history and objectives of the WACH PTT program, configuration of satellite collars, PTT duty cycles, and use of data was summarized by Dau (1997).
Population Size and Composition. We determined population size using the aerial direct count photo extrapolation technique (Davis et al. 1979). The herd was photographed in July 1999 and the estimate was finalized in June 2000. Department staff put overlap lines on the photographs and private individuals were contracted to count most photographs. Our policy is to census the WACH every 3 years until evidence of a rapid population decline warrants more frequent estimates of population size. The next census will be attempted July 2002.
Population composition for the WACH was estimated from calving surveys during June, composition counts during October, and short yearling surveys during April–May. For each of these surveys and throughout this report ‘maternal cow’ refers to a female with a calf at heel or >1 hard antler during June. ‘Calf’ refers to any caribou <12 mos old and ‘adult’ to any caribou >12 mos old.
In 1999 calving surveys were conducted 11–13 June using a C-185 and C-206, each with 1 observer. In 2000 calving surveys were conducted 7 and 12–14 June in a C-185 with 3 observers. Calving survey techniques, criteria to determine maternal status and geographic coverage were the same as previously described (Dau 1997). In both years, areas outside core calving areas were searched at low intensity for radiocollared cows.
Fall composition surveys were conducted 5–7 October 1999 using techniques previously described by Dau (1997). As in previous years we retrieved moose and caribou radio collars on

184
mortality mode in conjunction with fall composition surveys. Weather precluded composition surveys in October 2000.
Spring composition (short yearling) surveys were conducted on 9 and 27 April and 13, 17 and 19 May 1999. In 2000, short yearling surveys were conducted on 7, 9, 10, 13, and 27–29 April. In both years we used survey techniques previously reported by Dau (1997).
Distribution and Movements. Distribution and movements of the herd were assessed using spring (Jan–May), summer (June) and fall (Aug–Dec) range-wide conventional telemetry surveys often in conjunction with composition surveys. Flights were based out of Barrow, Kotzebue, Nome and Fairbanks using survey techniques previously described by Dau (1997). Additionally, PTT data supplemented conventional telemetry locations.
During range-wide telemetry surveys we located: 93 of 150 potentially active collars during fall 1998 (62%); 91 of 137 (66%) during spring 1999; 91 of 142 (64%) during fall 1999; 107 of 140 (76%) during spring 2000; and 86 of 134 (64%) during fall 2000. Since fall 1998 we’ve located an average 66% (SD = 5.5) of all potentially active conventional collars during range-wide surveys. Often, collars missed during a range-wide survey are located during the subsequent survey mixed with caribou that had been found. This suggests long frequency scan times, topography, movements of caribou and infrequent relocation flights are responsible for ‘missed’ collars rather than incomplete coverage of range.
Mortality. Annual mortality rates for adult WACH caribou were estimated from cows with conventional radio collars or ST-18 PTTs during the 12-month period 1 Oct–30 Sep (‘collar-year’). The October 1998–September 1999 mortality estimate corresponds with the 1999 recruitment (i.e., short yearling) estimate. Radiocollared bulls and cows collared with ST-3 or ST-14 PTTs were not used to estimate mortality (Dau 1997). Three “collar years” (1997–1998, 1998–1999, and 1999–2000) span portions of this reporting period. Radiocollared cows not located for 2 years were retroactively dropped from the sample of potentially active collars. Therefore, annual mortality estimates often increased 1–3% for up to 2 years after each collar year. Estimated mortality rate includes all sources of mortality.
Harvest. In this report ‘local’ hunter refers to a resident of Alaska who lives north of the Yukon River and west of the Dalton Highway (i.e., within the range of the WACH). ‘Nonlocal’ refers to residents of Alaskan who live outside this area as well as nonresident and alien hunters.
We monitored harvest using 3 systems: 1) registration permits for hunters residing within the range of the WACH; 2) statewide harvest tickets for all other hunters; and 3) community-based assessments for selected communities within the range of the WACH. Seventeen communities within the range of the WACH were surveyed during this reporting period (Table 1). Beginning in the 1998–1999 regulatory year the Information Management section of the Division of Wildlife Conservation (DWC) reestablished the practice of sending up to 2 reminder letters to hunters who failed to submit their statewide caribou harvest report, and all data was entered into the statewide harvest database.
For the 1999-2000 regulatory year we estimated total harvest by local hunters using community harvest data. We used unadjusted counts of harvested caribou for communities surveyed during
185
1999-2000. For communities that were not surveyed during this period but which have been surveyed in the past we calculated a mean per capita harvest rate from historical data and multiplied it by the current (1999 or 2000) community population size. When using historical data to calculate 1999-2000 per capita harvest we excluded years we knew were incomparable because of herd growth, geographic distribution of caribou, etc. For communities never surveyed we used per capita harvest for nearby communities surveyed in 1999 or communities surveyed during previous years with similar access to caribou. When combining several communities to calculate per capita harvest for an unsurveyed community we summed human population sizes and caribou harvests over all communities (i.e., ‘people’ and ‘caribou’ were the sample units, not ‘community’) to avoid disproportionately weighting samples from small communities. For communities near areas where the Central Arctic Caribou Herd (CACH), Teshekpuk Lake Caribou Herd (TLCH) and WACH mingled, we initially estimated total community harvest as described above. We then estimated the percentage of total harvest comprised of WACH caribou based on the distribution of conventional- and satellite-collared caribou from each herd as well as direct observations by staff and hunters. This attempt to differentiate harvests among herds was more qualitative than quantitative. Although there is some uncertainty associated with assigning harvest levels to individual caribou herds where they mixed (which is not incorporated into our estimated confidence intervals) we felt this approach was better than ignoring mixing of herds altogether. Confidence intervals were calculated for each community using a parametric bootstrap technique. This technique employed a Poisson distribution with ‘WACH total harvest’ as the distribution parameter. Each 95% interval was calculated by randomly selecting 1000 samples from the Poisson distribution, sorting them and dropping the lowest 2.5% (25) and the highest 2.5% (25) of the values. The smallest remaining value was the lower limit and the largest was the upper limit. Lower and upper confidence limits of individual communities were respectively summed to produce an interval around total harvest.
Other Mortality We collected blood samples from living caribou while deploying radiocollars at Onion Portage. Caribou were captured and restrained as previously reported (Dau 1997), and then released. We conducted serological tests to monitor prevalence of 8 selected bacteria and viruses in the herd (Dau 1997). In September 1998 we sampled 51 bulls and 62 cows; in 1999, 40 bulls and 42 cows; and in 2000 (after this reporting period), 57 bulls and 59 cows. Body condition (very skinny, skinny, average, fat, very fat) and maternal status (with calf/no calf) were recorded for caribou from which a blood sample was collected.
In 1999 we began analyzing sera for haptoglobin levels. Haptoglobins are proteins that indicate inflammation regardless of cause (Oderkirk 1998). The benefit of measuring haptoglobins is that they may reveal conditions for which there is no serologic test (e.g. Fusibacterium necrophorum, the causative agent of hoof rot). Sera from 1998–2000 have been analyzed for haptoglobin levels. We are currently analyzing haptoglobin levels in sera from 1992–1997.
During 7–11 June 2000 we investigated the causes of a mortality event that occurred in the northwest portion of Unit 23 during the winter of 1999–2000. Two veterinarians, Dr. Victoria Woshner (North Slope Borough Department of Wildlife Management) and Dr. Cheryl Rosa (University of Alaska Institute of Arctic Biology – Fairbanks) necropsied 34 carcasses. They recorded gross characteristics and collected tissue samples to analyze for metals and

186
radionuclides. NANA/Cominco provided helicopter support, food, lodging and transportation between Red Dog and Kotzebue. The department paid each veterinarian and provided all other transportation. The department and North Slope Borough Department of Wildlife Management shared laboratory costs.
RESULTS AND DISCUSSION
POPULATION STATUS AND TREND Population Size The July 1999 photocensus produced a minimum estimate of 430,000 caribou (Table 2, Fig 2). There were 4 components to this estimate:
1) 9 X 9 photo counts 416,379 caribou
2) direct counts from Beaver 4012 caribou
3) direct counts from Cubs/C-185 2147 caribou
4) correction for ‘missed’ caribou 7515 caribou
As in the past, we relied heavily on radiocollared caribou to conduct the census. The correction for missed caribou was based on 2 collared caribou located in peripheral groups that totaled 2147 caribou (1073.5 caribou/collar). Seven collared caribou not located anytime during the census were subsequently found alive. Assuming these 7 missed collared caribou were distributed in small groups similar to the 2 peripheral groups found during the photography, 7 X 1073.5=7515 caribou. This is the same approach used for the 1990 and 1993 WACH censuses.
We found 89 collared caribou during the actual photography. Five additional collared caribou located during the census week in large aggregations that were eventually photographed were not heard during the actual photography. We assumed these 5 caribou were photographed which brings the total number of ‘found’ collars to 94. Radiocollars indicate 93% of the WACH was present during the census photography.
There were 14 collared caribou with potentially active transmitters that we did not find during the census or anytime thereafter. We assumed all of these transmitters had exhausted their batteries and did not use them for any aspect of the census.
Most factors that affect the accuracy of photocensuses were favorable during 1999. This was the first time the software program ‘Photoman’ (developed by R De Long and J VerHoef, ADF&G, Fairbanks, AK) was used on a WACH census. This program links an on-board GPS receiver and radar altimeter to a PC computer to show the area of 9 X 9 coverage during the photography. As a result fewer 9 X 9 photographs lacked overlap compared to previous WACH censuses. Aggregations of caribou were not too dense to count or diffuse to photograph, caribou were not rapidly moving, and lighting was excellent. We completed the photography in 2 consecutive days, confirmed there was no mixing of photographed and unphotographed caribou between the 2 days. We did not have to take any 35 mm photos, and the large format camera provided high quality photographs.

187
The only factor that may have reduced the accuracy of the 1999 census was the small size of caribou images on the 9 X 9 photographs. Coastal fog threatened to obscure portions of the largest aggregations. As a result the Beaver exposed photographs at the highest possible altitude to expedite photography. The small images of caribou may have caused counters to miss many calves that were in close proximity to their mother or in densely packed groups. This may have caused us to undercount the herd.
The 1999 estimate suggests the WACH declined about 2% annually since 1996. Conversely, annual estimates of adult mortality and recruitment suggest the herd should have grown substantially during 1997 and 1998, and remained stable during 1999. This apparent inconsistency may indicate we have been working within the range of accuracy and precision for all 3 parameters (recruitment, adult mortality and herd size) since 1990 and that the herd has essentially been stable for the last 10 years. Alternatively, we may have underestimated herd size in 1999. Even if we did undercount the herd in 1999, these results unequivocally indicate the WACH is still very large. If it has declined since 1996, it has done so only slowly.
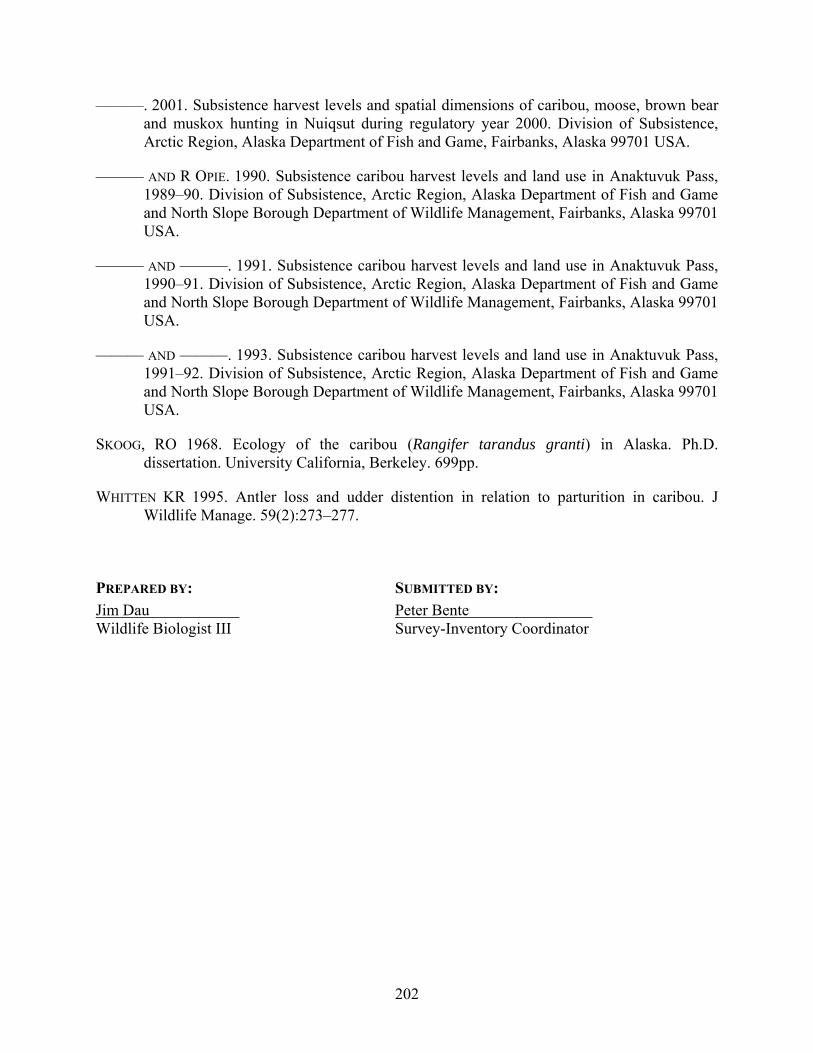
Population Composition Calving. We observed 58 calves:100 radiocollared cows during June 1999 and 69 calves:100 cows in 2000 (Table 3). The 2000 ratio is the highest observed since 1994. Estimates of calf production are probably conservative because we do not record udder status for collared cows (Whitten 1995) and do not consistently conduct calving surveys just prior to or during peak calving.
The strong negative correlation between the calf:cow ratio and the proportion of cows with velvet antlers during calving previously reported (Dau 1997) continued through this reporting period (r = -0.95, n = 13 years). The mean proportion of cows with velvet antlers during years when the calf:cow ratio was >70:100 (n=6, SD = 3.3) was 2.8% and during years when this ratio was <70:100 the mean proportion was 16% (n=7, SD = 5.1). Cows with substantial growth of velvet antlers during calving either failed to conceive the previous fall or lost their fetus during early pregnancy. This suggests the low calf:cow estimates are real and not artifacts of sampling error.
Calf production generally declined from 1987 to 2000 (Fig 3). The coefficient of determination indicates a gradual linear decline in calf production during this period (R2 = 0.43, n = 13). However, a scatter plot of this data suggests a step function decline in calf production may have occurred after 1992. The mean calf:cow ratio for 1987–1992 was 78:100 (SD = 4.3) and 61:100 (SD = 4.9) during 1993–2000 (1-tailed t-test P<0.001, equal variances).
The distribution of cows was unusually far south during the 2000 calving season: 11 of 50 (22%) maternal radiocollared cows and 8 of 22 nonmaternal cows (36%) were south of the Brooks Range crest. Between 1987 and 1999 only 6 of 511 maternal cow observations (1%) and 19 of 301 nonmaternal cow observations (6%) were observed south of the Brooks Range crest. Breakup was exceptionally late during spring 2000. This probably slowed the northward migration and caused many cows to calve en route to the calving grounds.

188
Between 1992 and 1999 there was no correlation between the June and subsequent fall calf:cow ratios (r = 0.19, n = 8). This suggests calf survival through summer has a greater effect on the fall calf:cow ratio than initial productivity.
Fall Composition. The fall calf:cow ratio was 45:100 in 1998, and 47:100 in 1999. This ratio has ranged from 34:100 to 52:100 since 1992 when we initiated fall composition surveys from an R-22 helicopter (Table 4). Part of the variability in fall calf:cow ratios may be attributable to misclassification of small bulls as cows during 1992–1994 (P Valkenburg, pers commun). Young bulls are easily confused with cows if an observer uses any criteria other than presence of a vulva patch for classification.
Since 1992 the fall calf:adult ratio has ranged from 24–33:100. This ratio is less vulnerable to misclassification than the calf:cow ratio because calves are easy to distinguish from adults. However, spatial or temporal segregation of bulls and cows likely confounds calf:adult estimates because we do not sample the entire WACH, and because segregation of bulls and cows occurs but varies among years in degree as well as in spatial and temporal pattern. Between 1992 and 1999 there has been a weak correlation (r = 0.59, n = 8) between the October calf:adult ratio and subsequent April/May calf:adult ratio. This may indicate calf survival through summer has a greater effect on recruitment than survival through winter.
The fall bull:cow ratio was 54:100 in 1998 and 49:100 in 1999 (Table 4). Sampling errors probably account for more variability in this parameter than actual changes in population composition.
Spring Composition. We observed 15 short yearlings:100 adults in spring 1999 and 18:100 in spring 2000 (Table 5). This continued the general decline in recruitment since 1979 (Figs. 4 and 5).
Distribution and Movements Historical Summary. Our understanding of the distribution of the WACH has evolved during the last 25–30 years with the application of telemetry techniques in northern Alaska. Caribou have inhabited northwestern Alaska since the Pleistocene period (Guthrie 1968 as reported by Skoog 1968). During the latter half of the 1800s, caribou in northwest Alaska disappeared from the Seward Peninsula and began to decline in coastal portions of Kotzebue Sound. By the 1890s, caribou had completely disappeared from Norton and Kotzebue Sounds. The reasons for this decline are unknown but may involve long-term, periodic, natural variations in caribou abundance (Skoog 1968). During this time, caribou remained abundant across the western North Slope (Skoog 1968; Brower, unpubl. ms.).
By the late 1930s caribou in northwest Alaska began to increase and reoccupy Kotzebue Sound. Aggregations estimated >250,000 caribou were observed in the Baird and De Long Mountains during the mid to late 1940s (Skoog 1968). Although such estimates were little more than qualified guesses, they indicate caribou were abundant within the current range of the WACH during this time.
During the 1950s and 1960s biologists considered all caribou north of the Brooks Range as a single “Arctic Herd” (Skoog 1968). Two developments in caribou research allowed biologists to

189
refine this. In1968 Skoog identified the single criteria still used today to define caribou herds: repeated use of a discrete calving area. Soon thereafter funding for caribou research became available as oil development was contemplated on the North Slope and conventional radio telemetry techniques were applied to caribou in northern Alaska. By the mid 1970s the “Arctic Herd” was determined to consist of the WACH, Porcupine Caribou Herd (PCH), CACH and TLCH. Since the mid 1970s, when the WACH began to rapidly increase, it has reoccupied habitat caribou have not used for >100 yrs; however, range expansion has occurred more slowly than population growth.
Winter Range. Since the mid-1970s most of the WACH wintered in the Kobuk, Selawik and Buckland River drainages. Prior to this time a substantial portion of the WACH wintered north of the Brooks Range or near Wiseman and Anaktuvuk Pass (J. Davis, J. Hemming and J. Reakhoff, pers commun). Approximately 50,000–60,000 caribou wintered between the Alatna Hills, Iniakuk Lake and North Fork of the Koyukuk River during the winter of 1997–1998. This was the first time a substantial portion of the WACH wintered in this portion of the Koyukuk River drainage since the early 1970s (J. Reakhoff, pers commun). Roughly 10,000–20,000 caribou wintered between Wainwright, Atqasuk and Umiat during the winters of 1998–1999 through 2000–2001. For the first time in >15 years almost no caribou wintered in the Nulato Hills south of Koyuk during the winter of 1999–2000; instead, the majority of the WACH caribou wintered in the Purcell Mountains, Zane Hills and Kobuk River drainage between Selby Lake and the Ambler River.
Movement of caribou onto the Seward Peninsula continued to provide hunters from Nome and surrounding communities opportunities to harvest caribou for sport and subsistence. Caribou hunting has been intense along the Kougarok Road and near Council. Village hunters and reindeer herders report wolf numbers have increased on the Seward Peninsula as a result of caribou reoccupying this area.
Several unusual caribou movements were observed by staff or reported by the public during this reporting period. During the winter of 1998–1999, residents of Point Hope and several local pilots reported 3–6 groups of 200–600 caribou up to roughly 10 miles offshore between Cape Thompson and Cape Lisburne (E. Kingik, pers commun). A lead reportedly formed between one group of caribou and shore, and residents of Point Hope watched a group of about 600 caribou drift to sea. In February 2000, an employee of the Cape Lisburne Air Force station reported that over several days up to 3000 caribou marched north (i.e., out to sea) along a pressure ridge that extended from Cape Lisburne (D. Lamont, pers commun). It is unknown whether they returned to land. In April 2000, I observed roughly 4000 caribou travel almost 50 statute miles over sea ice on Kotzebue Sound as they moved from the Sullivan Bluffs area (southwest of Deering) to Cape Blossom on the Baldwin Peninsula. This movement required about 24 hrs to complete. Amazingly, these caribou traveled almost linearly without landmarks for most of this movement.
Calving Grounds. The WACH continued to calve in the Utukok Hills during this reporting period as they generally have since the mid 1970s (J. Coady, pers commun). Since 1987, 890 of 931 observations (96%) of maternal and nonmaternal collared cows have been observed north of the Brooks Range crest during calving surveys. Even so, in some years many caribou calved in areas far from the Utukok Hills. In 2000, breakup was very late which probably delayed the
190
northward movement of caribou: 11 of 50 maternal cows (22%) and 8 of 21 nonmaternal cows (38%) were observed south of the Brooks Range crest..
Some of the variability in distribution of collared cows during calving may be attributable to the timing of surveys in relation to date of peak calving. For example, in 1990 most collared cows were located west of the Utukok Hills. Even though the timing of calving surveys in 1990 was no later than in most other years, if calving peaked early in 1990 we may have located them during the westward post-calving movement rather than near their parturition site. Daily rates of travel for satellite-collared cows may reveal periods of peak calving; however, we have not examined this.
During this reporting period a University of Alaska graduate student (R. Kelleyhouse) initiated a project investigating WACH and TLCH calving data in relation to climatic variables. The principal investigator is Dr. B. Griffith. The objectives of this study are: 1) quantitatively estimate the annual calving distributions of the TLCH and WACH; 2) determine if there is a global warming signature in the relative amount of green plant biomass on these calving grounds; 3) estimate habitat selection by calving caribou of these herds in relation to amount of green plant biomass, rate of increase in green plant biomass during lactation, and extent of snow cover during calving; 4) compare and contrast habitat selection during the calving season between these herds; and 5) compare temporal trends in amounts of green plant biomass between the calving grounds of these herds. The department has provided all conventional and satellite collar data from May and June 1987–2000 for the TLCH and WACH to Ms. Kelleyhouse.
Satellite Collars. Satellite collars enabled us to effectively search for conventional radiocollared caribou. They also allowed us to monitor the distribution and movements of the WACH on a very coarse scale during periods of inclement weather and short day length. The PTTs were especially useful for notifying reindeer herders of potential conflicts with caribou. Viewed collectively, satellite collars reflected the onset of spring and fall migrations.
Despite never having >10 functional PTTs on living WACH caribou at any time before 1998, satellite collars indicated the overall distribution of the WACH within and among years amazingly well. A scatter plot of all WACH PTT locations collected since 1987 closely agrees with our representation of overall range (Fig 1) determined from thousands of conventional collar locations as well as countless opportunistic observations and public reports. The winters of 1999–2000 and 2000–20001 were somewhat atypical in that disproportionate numbers of satellite-collared caribou wintered in a small portion of the Seward Peninsula while other areas known to harbor substantial numbers of caribou lacked PTT-collared caribou.
Scatter plots for WACH and TLCH satellite collars show caribou from these herds are relatively discreet on the North Slope during summer, and that most caribou near Wainwright and Barrow are from the latter herd. Conventional and satellite collars have shown these herds frequently mix on winter range in the central Brooks Range. Also, the TLCH infrequently (e.g. during 1996–1997) winters along the coast between Capes Lisburne and Krusenstern, and as far south as the Seward Peninsula Lava Beds and Purcell Mountains.
Limitations of WACH satellite collar data have been previously discussed (Dau 1999). Although we have increased the number of PTTs deployed in the WACH through time and programmed-

191
duty cycles to provide more frequent locations during some times of the year (Fig 4), a primary limitation of this data is the small number of collared caribou in relation to herd size. Additionally, we have not deployed PTTs on bull caribou.
No method typically used to analyze telemetry data is entirely satisfactory (J. Ver Hoef, pers commun). In this reporting period the department agreed to provide all WACH satellite telemetry data and $4,000 funding to a University of Iowa Ph. D. student (Aaron Christ) to develop a spatial model for analyzing telemetry data. Dr. J. Ver Hoef will be the principal investigator.
At their request, a satellite collar is being provided to the Reindeer Herders Association to deploy on a female caribou incidentally corralled with reindeer on or near the Seward Peninsula during 2001-2002. Staff from the University of Alaska Reindeer Research Project will fit the collar on the caribou.
MORTALITY Since 1985 annual mortality has ranged from 7 (1997–1998) to 20 (1992–1993) deaths:100 collared adult cows (Table 6, Fig 5). The winters of 1997–1998 through 2000–2001 were unusually mild. Although the 1997–1998 mortality rate was the lowest ever observed, mortality during 1999–2000 and 2000–2001 was comparable to previous years of more typical weather.
Our estimates of adult cow mortality are a conservative index of overall WACH mortality because they exclude bulls, which tend to experience higher mortality rates than cows. Also, our sample of collared cows excludes emaciated, injured, or clinically diseased individuals even though they comprise part of the population. Although these factors would shift the WACH mortality curve up, they should not affect temporal trend (Dau 1997).
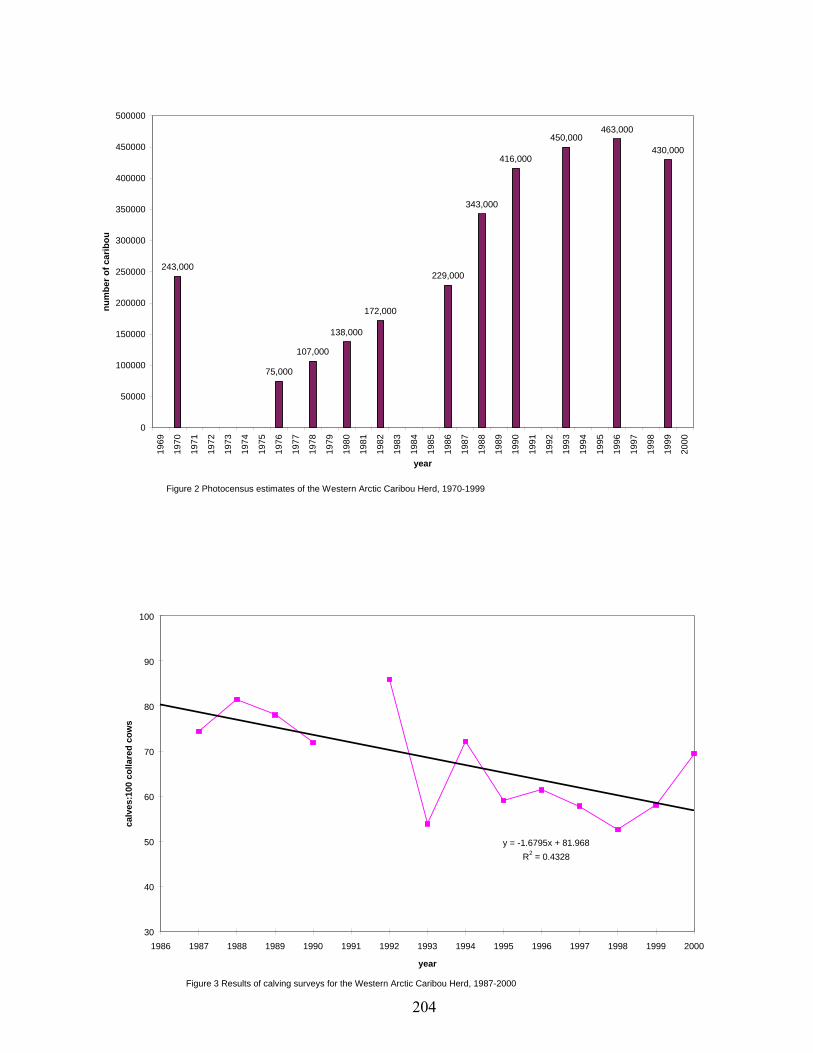
Annual estimates of adult mortality showed no trend through time (R2 = 0.15, Fig 5). Three-year moving averages reduce the effects of annual variability and suggest mortality slowly increased from roughly 1985 through 1993 and gradually declined from 1993 through 2000 (Fig 6).
Adult caribou mortality is most meaningful in relation to recruitment. The significance of Figs. 5 and 6 is that from the early 1980s to mid 1990s recruitment and adult cow mortality slowly converged. Since the mid 1990s both parameters have exhibited substantial annual variability; however, 3-year moving averages suggest recruitment generally exceeded adult mortality and the herd should have increased. This is inconsistent with the 1996 and 1999 photocensus results. If successful, the census that will be attempted in July 2002 should allow us to evaluate the accuracy of the 1999 census as well as recent annual estimates of recruitment and adult mortality.
Harvest Season and Bag Limit. On state-managed lands the following seasons and bag limits were in effect throughout the reporting period: Unit and Bag Limits
Resident Open Season
(Subsistence and General Hunts)
Nonresident Open Season

192
Units 21D, 22A, 22B, 23, 24, and 26A
Resident Hunters: 5 caribou per day. Nonresident Hunters: 5 caribou total per year.
Bulls
Cows
No closed season
1 July–15 May
No closed season
1 July–15 May Federal hunting seasons during this reporting period were identical to state regulations during this reporting period. However, the bag limit was 15 caribou per day for federally qualified subsistence users in Unit 23. The federal bag limit in other units used by the WACH was 5 caribou per day.
Board of Game Actions and Emergency Orders. Many emergency orders (EOs) were issued for caribou hunting in portions of Game Management Unit 22. These were in response to recent influxes of caribou into areas where 1) they had not appeared for many years, 2) where reindeer husbandry occurred and 3) there were no permanent caribou hunting regulations. When EOs opened hunting, bag limits were 5 caribou per day for resident and 5 caribou per year for nonresident hunters. The following regulatory actions, in chronological order, were taken that affected the WACH:
1. In response to caribou moving into the eastern portion of Unit 22D each fall since 1996, in late October 1999 the Board of Game established permanent caribou hunting regulations in a portion of Unit 22D. This area includes the Kuzitrin drainage upstream of the Kuzitrin River Bridge and east of the Taylor Highway. Seasons and bag limits are identical to other Units (e.g. Unit 23) within the range of the WACH. This regulation became effective July 1, 2000.
2. EO 05–08–98 opened caribou hunting 19 December 1998–June 30, 1999 in that portion of Unit 22D including the Kuzitrin drainage upstream of the Kuzitrin River bridge and east of the Taylor Highway.
3. EO 05–03–99 opened caribou hunting 24 October 1999–June 30 2000 in that portion of Unit 22D including the Kuzitrin drainage upstream of the Kuzitrin River bridge and east of the Nome-Taylor Highway.
4. EO 05–04–99 opened caribou hunting 6 November 1999–30 June 2000 in that portion of Unit 22D east of the Nome-Taylor Highway.
5. EO 05–05–99 opened caribou hunting 20 December 1999–30 June 2000 in the northeastern portion of Unit 22E.
6. EO 05–01–00 opened caribou hunting 22 July 2000–31 August 2000 in the eastern portion of Unit 22E.

193
7. EO 05–04–00 opened caribou hunting 1 September 2000–30 June 2001 in the northeastern portion of Unit 22E.
8. EO 05–06–00 opened caribou hunting 12 October 2000–30 June 2001 in that portion of Unit 22D east of the Taylor Highway (Nome-Kougarok Road) and south of the Kuzitrin Bridge.
Human-Induced Harvest. During the 1999-2000 regulatory year hunters harvested roughly 15,500 western Arctic caribou. This constituted about 3.6% of the entire herd (based on the 1999 WACH population estimate).
Permit Hunts. All hunting by residents residing north of the Yukon River within the range of the WACH is by registration permit. Registration permits are available at license vendors and department offices in northwestern, western, and interior Alaska. All hunting by nonresidents and residents residing south of the Yukon River is by statewide harvest ticket.
Hunter Residency and Success. Beginning in the 1998-1999 regulatory year, the statewide caribou harvest report system resumed being administered as for other big game, e.g. moose. Up to 2 reminder letters were sent to hunters who acquired a statewide caribou harvest ticket and failed to report their harvest or effort. Statewide caribou harvest data were entered into department computer harvest files. In the 1998-1999 regulatory year, nonlocal hunters reported harvesting 678 caribou: 28 in Unit 22 (4%), 571 in Unit 23 (84%), 32 in Unit 24 (5%) and 47 in Unit 26A (7%). Nonlocal hunters have probably harvested <1000 caribou annually in recent years which is somewhat lower than previously reported (Dau 1997, 1999). Harvest by nonlocal hunters appears to be increasing in Unit 23. Fish and Wildlife Protection officers indicate most nonlocal hunters possess a statewide caribou harvest ticket when hunting caribou (C. Bedingfield and J. Rodgers, pers. commun.). We think this system is reasonably accurate for monitoring caribou harvested by nonlocal hunters especially since we began sending reminder letters to individuals who failed to voluntarily return their harvest report.
Community-based harvest assessments have been conducted in selected villages within the range of the WACH since 1985 (Table 1). Most of these assessments have been conducted by Subsistence Division staff often working with local government or nonprofit Native corporation employees (Alaska Department of Fish and Game 2000; Pedersen and Opie 1990, 1991, 1993; S. Georgette, personal communication). Additionally, some assessments have been conducted by private organizations (Brower and Opie 1996, 1997; Fuller and George 1997; Hepa et al. 1997) or by private consultants contracted by the Department of the Interior Minerals Management Service (Braund 1991, 1993). Community based harvest estimates indicate only about 10% of caribou taken by local residents are reported under the registration permit system (Georgette 1994).
Without considering many factors that affect caribou harvest levels, e.g. hunting regulations or traveling conditions, community-based assessments suggest all communities within the range of the WACH harvested about 14,544 caribou (13,388–15,696 caribou 95% bootstrap confidence interval) during the 1999-2000 regulatory year (Table 7). This was about 3.4% of the WACH using the 1999 caribou population estimate. Assuming nonlocal hunters harvested about 1000 caribou during this period, total harvest was roughly 3.6% of the population.

194
Several factors may have caused this estimate of local harvest to be somewhat lower than the 20,000 caribou previously reported (Dau 1997, 1999). Perhaps the biggest factor is that the estimate reported here includes only caribou from the WACH for communities with access to >1 herd (i.e., it excludes caribou harvested from the TLCH and CACH). The previously reported WACH estimate did not make this distinction. For 1999-2000 roughly 2668 TLH and 256 CAH caribou were harvested by residents of communities in Unit 26A and Anaktuvuk Pass (i.e., within the range of the WACH; G. Carroll, pers commun.). Another factor that reduced the 1999-2000 estimate in relation to the 20,000 caribou previously reported relates to the respective periods of time these estimates cover. The previously reported figure was little more than an educated guess of annual local harvest, based on typical harvests over a span of 10+ years. It did not consider variation in local harvests through time and space. Conversely, the estimate of 14,544 caribou reported here applies only to the 1999-2000 regulatory year and does consider availability of caribou to individual communities. The distribution of caribou during winter 1999-2000 caused some communities, which typically have relatively high WACH harvest rates such as Unalakleet and Shaktoolik, to take fewer caribou than normal. No additional communities harvested western Arctic caribou as a result of this unusual distribution. Finally, although the harvest estimate reported here does not include all caribou taken by individuals living outside community boundaries (i.e., ‘camp’ residents), we think this effect was small because 1) few people live in remote camps year round and 2) some of them were surveyed during community assessments. We are developing a model to refine our estimate of ‘local’ harvests that will consider an array of independent variables that affect caribou harvests (R. Sutherland, pers commun.).
Community harvest assessments will continue to be conducted in selected communities within the range of the WACH each year. We hope to survey communities that lack harvest data to avoid applying mean per capita harvest rates from other communities. Additional range-wide estimates of annual harvests will provide opportunities to evaluate spatial and temporal variability in this parameter within and among years. They will also improve our ability to evaluate the strengths and weaknesses of this approach. Hopefully, this approach will eventually allow us to better understand the dynamic relationship between human harvests and WACH population dynamics.
Harvest Chronology. Subsistence harvest patterns are tied to seasonal movements of caribou. For example, Point Hope and North Slope villages harvest western Arctic caribou mainly during July and August while Shaktoolik and Unalakleet hunters primarily take them during September through March. In Unit 23, harvests are typically high during fall and spring migration periods, and also when caribou winter near communities. Unlike many subsistence activities that are seasonally specific, subsistence hunting of caribou occurs whenever they are available.
During early fall, subsistence hunters primarily harvest large bulls because they provide the best meat. Once bulls enter rut and become unpalatable, typically after 7–10 October, most subsistence hunters take cows until approximately March or April. In decades past, subsistence hunters resumed harvesting bulls in roughly mid to late December (W. Uhl, personal communication). During the rest of the year subsistence hunters take caribou of both sexes based on availability and the body condition of individual animals.
195
Virtually all harvest by nonlocal hunters occurs between late August and late October and harvest peaks during mid September. Nonlocal hunters harvest large bulls almost exclusively even after the onset of rut.
Transport Methods. Most subsistence hunters harvest WACH caribou using snow machines during October–May and boats or 4-wheelers during the rest of the year. Few local hunters use aircraft to hunt caribou. In contrast, nonlocal hunters depend almost entirely on aircraft to initially access caribou hunting areas. Once in a hunting area many nonlocal hunters use boats. Although a few guides have used 4-wheelers for hunting, this practice has dramatically increased since the mid-1990s in Unit 23. In Unit 23 increasing numbers of village residents are transporting nonlocal moose and caribou hunters via boats.
Other Mortality Disease. Serology results show no temporal trends in exposure to 8 selected bacteria and viruses in the WACH (Table 8). This may be at least partly because serologic surveys are inherently poor for monitoring the prevalence of disease in wildlife populations (J. Blake and T. O’Hara, pers commun). Our primary objective for collecting caribou sera annually is to provide ‘red flag’ indicators for pathogens most likely to occur in this herd.
Threshold values for the respiratory viruses IBR, BVD and PI3 were raised in 1998 (R. Zarnke, personal communication). This reduced the percentage of positive reactors in the WACH compared to previous years (Dau 1997, 1999). Even so, exposure to these viruses has approached 20–25% since 1992.
Preliminary analyses showed 38 of 304 caribou (13%) sampled during 1998–2000 exhibited an elevated haptoglobin level. Sixty one of 79 caribou (77%) serologically positive to >1 bacteria or virus had an elevated haptoglobin level. Note: a ‘positive’ serology test only indicates a caribou has been exposed to a pathogen and not that it harbors an active infection. The 18 serologically positive caribou that exhibited a normal haptoglobin level may have been exposed to a disease without actually contracting it or had recovered from an active infection. Conversely, only 20 of 225 caribou (9%) with no serologic evidence of exposure to a disease had an elevated haptoglobin level. These individuals may have been infected by a disease, e.g. hoof rot, for which we do not test. Certainly, haptoglobin analyses occasionally indicate inflammation when there is none, and fail to reflect inflammation when present.
Haptoglobin levels were clearly related to body condition at the extremes of condition categories. Four of 5 caribou (80%) classified as ‘very skinny’ had an elevated haptoglobin level. In contrast, zero (0) of 14 caribou classified as ‘very fat’ had an elevated haptoglobin level. This suggests emaciated caribou probably harbor some type of infection and are not merely aged or naturally thin. It also suggests very fat caribou are likely free from bacteria or viruses. The latter observation may seem trite; however, each year hunters report abandoning carcasses of very fat caribou they have harvested when they encounter parasites, scar tissue or any hint of discoloration near lymph nodes.
Eight to 10 caribou with characteristic hoof rot lesions were observed during October 1998 composition surveys. Hoof rot was also observed in the Mulchatna and Alaska Peninsula caribou herds at this time (J. Woolington, pers commun). Crowding and moist soil conditions are

196
sometimes reported to cause outbreaks of hoof rot in wildlife populations. These explanations are difficult to apply to the WACH, given that huge, insect-induced aggregations form multiple times each summer, and that caribou are almost constantly in wet tundra.
Exposure to brucellosis has shown no trend through time. Since 1992, exposure to Brucella suis has ranged from 0 (1997) to 11 or 12% (1993–1995). Of 526 caribou tested for exposure to brucellosis, only 6% have been sero-positive. We occasionally observe individuals with lesions characteristic of this disease.
Local subsistence hunters continued to be concerned about “sick” caribou during this reporting period. In January 2001 the department published ‘A Field Guide To Common Wildlife Diseases and Parasites in Alaska’ (Elkin and Zarnke 2001). This booklet has been distributed among all villages within the range of the WACH. It was modified from a booklet developed by the governments of the Northwest Territories and Nunavut.
Starvation. Between late October and late November 1999, telemetry data indicated about 20,000 caribou rapidly moved from Wainwright-Atqasuk, down the Chukchi Sea coast and into the Wulik-Kivalina River area. During January, 2000, I began to receive calls from residents of Point Hope and Kotzebue of dead and moribund caribou on the Tigara Peninsula and near Cape Thompson. Many of these caribou were reportedly calves or yearlings. I received the lower legs of 2 calves and 1 yearling from E. Kingik. These caribou had died from natural causes. They had red but waxy marrow so it didn’t appear they had died of chronic starvation.
During short yearling surveys in early April between Cape Krusenstern and the lower Kukpuk River we counted only 6 short yearlings:100 adults, one of the lowest ratios ever counted in a specific area. Even from the plane it was obvious these caribou were in poor condition, and some individuals even staggered when attempting to flee. Although the area was wind scoured with about 50% bare ground, we saw no carcasses. One of 7 collared caribou in the area had died (it was collared with an ST-14 PTT). The next day I retrieved the PTT from the carcass. The cow had been dead <1 month and had not been scavenged. She was frozen so I could not do a necropsy. Like the legs Earl had sent me, her bone marrow was red but waxy. She was emaciated to the point that a storm may have killed her. I walked about 1.5 miles to and from the carcass and observed almost no fruticose lichens, e.g., Cladina and Cladonia spp., although crustose lichens and Stereocaulon spp. were abundant. Surprisingly, there were few fecal pellets in the area even though there were thousands of caribou in the area. Numerous icicles of urine were tan to dark brown.
On 3–5 June 2000 I employed local observers to help me search by PA-18 airplane the area roughly within 10 miles of the coast between Kivalina village and Cape Dyer. We counted 1878 carcasses. The highest density of carcasses occurred within ½ mile of the coast in the hills just south of Ogotoruk Creek. Another high density carcass area was along the Kukpuk River near the mouth of the Ipewik River. A surprising number of carcasses were on lagoon ice between Cape Thompson and Point Hope. We found few carcasses >5 miles inland. However, near Angmakrok Mountain and the lower Ipewik River we found carcasses about 20 miles inland and I suspect additional carcasses occurred farther east at low densities. Unlike in 1995 when a few carcasses were distributed as far south as Mount Noak, we found no carcasses south of the Asikpak River.

197
Consistent with hunters’ reports, many carcasses appeared to be calves or yearlings. The antler status of bulls suggests they did not begin dying until after antler casting was over in late November. Many carcasses had cow-like antlers so were either pregnant females or young bulls. Even from the air caribou carcasses appeared emaciated at the time of death. Many carcasses had not been scavenged and were curled up as if asleep. We landed and walked to the carcasses of a calf, a young bull and an adult cow. All were emaciated with classic chronic starvation bone marrow.
Gross examinations of 34 carcasses necropsied during June 2000 suggest the animals starved without complications from poisoning or disease (V Woshner and C Rosa, pers commum). Results of tissue analyses are currently not available.
This event caused greater mortality compared to 1994–1995, when 2000–3000 caribou were estimated dead out of roughly 10,000 wintering in the area. However, the 1999-2000 mortalities probably constituted a smaller proportion of caribou in the area.
HABITAT Assessment The department did not monitor range condition for the WACH during the reporting period. During July and August 1997, BLM and the Natural Resources Conservation Service evaluated reindeer ranges near Koyuk and Shaktoolik (Henry and Sagoonik herds). They also assessed range condition in McCarthy’s Marsh and Death Valley on the Seward Peninsula. In July 1998 BLM evaluated range condition for 3 reindeer herds (Gray, Menadelook and Noyakuk) now used by the WACH as winter range. During July 1999, Ducks Unlimited, BLM and USF&WS ground truthed a satellite-based land cover classification in the eastern Buckland drainage, northern Nulato Hills, and a portion of the Selawik and Koyukuk National Wildlife Refuges. In July 2000 BLM evaluated range condition in McCarthy’s Marsh (R. Meyers, pers commun).
Enhancement There were no WACH habitat enhancement activities during the reporting period.
NONREGULATORY MANAGEMENT PROBLEMS/NEEDS WACH Cooperative Management Since 1995 we have actively explored the potential for cooperative management of the WACH. We view cooperative management as a resource stewardship process, emphasizing shared decision-making across cultural or institutional boundaries.
For department biologists, co-management offers the advantage of greater participation in day-to-day management by stakeholders, more effective integration of western and indigenous knowledge about caribou and their habitat, and greater coordination in administering a caribou herd across many jurisdictions and cultural boundaries. Many Alaska Natives see co-management as an opportunity to assume a more meaningful role in protecting their subsistence-based cultures and in managing the caribou resource.

198
For the last two years, we have applied these concepts by actively supporting the WACH Working Group (Working Group). In January, 2000 the Working Group reorganized and now consists of 19 voting chairs representing geographic clusters of subsistence-hunting communities, as well as guides, transporters, non-consumptive users, reindeer herders and recreational hunters. Most of these chairs are now filled. Ten of the 19 voting chairs on the Working Group were nominated by State of Alaska Advisory Committees. Resource agency representatives from ADF&G, BLM, FWS and NPS provide technical and fiscal support to the Working Group, but are not voting members.
The Working Group now has a charter and by-laws. Its mission is to: “Develop a grassroots process for sharing representation, responsibility and decision-making among stakeholders in management of the Western Arctic Caribou Herd.” Meetings are held twice a year. Most recently the Working Group met in Nome (January, 2000), Anaktuvuk Pass (August, 2000) and Kotzebue (January, 2001).
Members of the Working Group produce a newsletter, Western Arctic Caribou Trails, which is mailed to 9,000 post office box holders within the range of this herd twice a year. The Working Group has engaged a planner and begun to rewrite the WACH strategic management plan.
School programs As in the past, department staff made presentations on WACH caribou in schools throughout the range of this herd. Ambler high school students participated in the Onion Portage (Kobuk River) collaring project during September 1998, 1999 and 2000. In 1998, DWC public communication staff filmed high school students from Ambler and Kotzebue participating in this project. This video, Connecting with Caribou, was completed in 1999 and is available to the public. In 2000, 7th and 8th grade students from Anaktuvuk Pass participated in the collaring project.
Conflicts between the WACH and reindeer industry In most years since at least the mid 1970s the majority of the WACH wintered in the Nulato Hills between the Buckland drainage and Unalakleet River. Reindeer herds, even those situated along the base of the Seward Peninsula, remained largely unaffected by caribou until about 1990 (Dau 2000), although caribou were using the Kiwalik drainage and Monument Mountain area as early as 1983 (J. Coady, pers commun).
Between 1990 and 1995, 3 of 4 of the easternmost reindeer herds (Hadley, Buckland; Sheldon, Candle; and Henry, Koyuk) completely joined the WACH and were lost to the reindeer industry. These losses appeared to be more the result of increased WACH population size than a change in caribou movements or distribution.
During September and October 1996 roughly 80,000–90,000 WACH caribou moved onto the Seward Peninsula as far west as the Kougarok Road. This was not the first time caribou used this area in recent years. In several years during the early 1980s thousands of caribou were observed near the Lava Beds (J. Coady, pers commun). The 1996 incursion of caribou into this area was significant because of the number of caribou involved, and because caribou have repeated this movement annually since that time. Although this is a modest geographic expansion of winter range, initially only 50–60 miles west of areas where tens of thousands of caribou had regularly

199
wintered for the previous 10–15 years, it posed a tremendous threat to additional Seward Peninsula reindeer herds. Between the winters of 1996–1997 and 2000–2001, 5 reindeer herds (Karmun, Deering; Gray, White Mountain; Menadelook, Coffee Dome; Noyakuk, Teller; and Sagoonick, Shaktoolik) lost >50% of their deer when they joined the WACH. In the winter of 2000–2001 an unknown number of reindeer from the Davis (Nome) and Kakarak (Teller) herds joined the WACH and were lost. Since 1990, at least half of the reindeer on the Seward Peninsula have been lost to the WACH. At this time, only the Olanna (Brevig Mission), Weyiouanna (Shishmaref) and Ongtowasruk (Wales) reindeer herds have not been substantially impacted by the WACH. Since 1996, caribou have gradually expanded their use of the Seward Peninsula to now include its entire eastern half.
Approximately 90,000 caribou wintered on the Seward Peninsula during the winter of 1997–1998. Initially, these caribou moved as far west as the Niukluk River and then settled in the Fish River Flats, Bendeleben Mountains and Lava Beds. During the winter of 1998-1999 roughly 80,000 caribou moved into the Lava Beds, Death Valley and Fish River Flats during September and October. By November 1998 many of these animals moved southeast into the Nulato Hills which reduced their impact on reindeer herds. About 40,000–50,000 caribou wintered on the Seward Peninsula during the winter of 1999–2000. Most of these caribou were in the Bendeleben Mountains, Fish River Flats and Sullivan Bluffs area. During the winter of 2000–2001 at least 200,000 caribou were distributed from the western end of the Lava Beds, through the Fish River Flats and Nulato Hills to the Unalakleet River.
User issues Conflicts between nonlocal hunters, commercial operators (guides and transporters) and local hunters continued in portions of WACH range during this reporting period. These conflicts are most pronounced in Unit 23, but have also occurred in Units 26A and 24 near Anaktuvuk Pass. This complex issue involves all hunters, not just caribou hunters, and is affected by: 1) reliance on aircraft by nonlocal hunters and commercial operators in contrast to local hunters’ use of boats and snow machines; 2) other portions of Alaska experiencing shortened seasons, reduced bag limits, crowding, and few trophy animals; and 3) fewer places to hunt multiple big game species, especially for nonresidents. The limiting factor driving this conflict in Unit 23 is not inadequate numbers of wildlife, certainly not with regard to WACH caribou. Rather, the limiting factor is inadequate space to accommodate all users. An ad hoc group comprised of a broad spectrum of users (residents throughout Unit 23, guides, transporters and nonlocal hunters) met several times during the reporting period to discuss user issues throughout Unit 23. Additionally, 2 subgroups of local and nonlocal users each met once during the reporting period to address issues in the Squirrel and upper Kobuk River drainages. The user issues process was discontinued at least temporarily in 2001 largely because of inadequate staffing.
CONCLUSIONS AND RECOMMENDATIONS Census results indicate the WACH grew rapidly from 1975 through 1990, grew slowly from 1990 to 1996, and may have declined from 1996 to 1999. The slower population growth rate and possible decline appear to be attributable to declining recruitment rather than increasing adult mortality. Calf production doesn’t appear to currently limit recruitment.

200
Body condition of WACH caribou has shown no clear temporal trend. In 1993 and 1995 when fall caribou body condition was poor, the “bottleneck” appeared to occur during summer. The reasons for this are unknown but may be related to the amount of time individual caribou spend in huge, insect-induced aggregations during summer. Several localized mortality events each involving 2000–4000 western Arctic caribou have occurred since 1990. Starvation appeared to be the cause of death each time. There is no evidence that environmental contaminants or disease are affecting the population dynamics of this herd.
A substantial (but unknown) number of reindeer on the Seward Peninsula were lost to the WACH during the reporting period. The department should continue to provide as much information regarding movements and distribution of caribou to herders as possible within the constraints of staff, weather, aircraft and budgets.
Conflicts between local subsistence hunters, nonlocal sport hunters, and commercial operators have intensified in portions of WACH range since 1992. The primary limiting factor driving these conflicts is inadequate space to accommodate all users.
The department should continue to support the WACH Working Group and work with the planning subgroup to revise the management plan for this herd.
LITERATURE CITED ALASKA DEPARTMENT OF FISH AND GAME. 2000. Community Profile Database. Division of
Subsistence, Anchorage, Alaska 99518 USA.
BRAUND, SR & ASSOCIATES, AND INSTITUTE OF SOCIAL AND ECONOMIC RESEARCH. 1991. North Slope Subsistence Study - Barrow, 1987, 1988, and 1989. Technical Report No. 149. Prepared for the U.S. Department of Interior, Minerals Management Service.
———. 1993. North Slope Subsistence Study - Wainwright, 1988 and 1989. Technical Report No. 147. Prepared for the U.S. Department of Interior, Minerals Management Service.
BROWER, CD The northernmost American: An Autobiography by Charles David Brower. Vols. I–III. University of Alaska, Fairbanks, Alaska. Unpublished Ms.
BROWER, HK AND RT OPIE. 1996. North Slope Borough Subsistence Documentation Project: Data for Anaktuvuk Pass, Alaska for the Period July 1, 1994 to June 30, 1995. North Slope Borough Department of Wildlife Management Report. 36 pp. Available from North Slope Borough Department of Wildlife Management, Box 69, Barrow, Alaska 99723 USA.
———, AND ———. 1997. North Slope Borough Subsistence Documentation Project: Data for Nuiqsut, Alaska for the Period July 1, 1994–June 30, 1995. North Slope Borough Department of Wildlife Management Report. 44 pp. Available from North Slope Borough Department of Wildlife Management, Box 69, Barrow, Alaska 99723 USA.
DAU, J 1997. Caribou survey-inventory management report. Units 21D, 22A, 22B, 23, 24, 26A. Pages 158–185 in MV Hicks, ed. Caribou. Alaska Department Fish and Game. Federal

201
Aid Wildlife Restoration Survey-Inventory Activities 1 July 1994–30 June 1996. Grant W–24–3 and W–24–4. Study 3.0. Juneau. AK
———. 1999. Caribou survey-inventory management report. Units 21D, 22A, 22B, 23, 24, 26A. Pages 160–185 in MV Hicks, ed. Caribou. Alaska Department Fish and Game. Federal Aid Wildlife Restoration Survey-Inventory Activities 1 July 1994–30 June 1996. Grant W–24–5 and W–27–1. Juneau. AK.
———. 2000. Managing reindeer and wildlife on Alaska’s Seward Peninsula. Polar Research
19(1):57–62.
DAVIS, JL, P VALKENBERG AND SJ HARBO. 1979. Refinement of the aerial photo-direct count-extrapolation caribou census technique. Federal Aid Wildlife Restoration Grant W– 17–11, Job 3.25R, Juneau, AK. 23pp.
ELKIN, B AND RL ZARNKE. 2001. Common wildlife diseases and parasites in Alaska. Alaska Department of Fish and Game. Anchorage, Alaska USA. 58pp.
FULLER, AS AND JC GEORGE. 1997. Evaluation of Subsistence Harvest Data from the North Slope Borough 1993 Census for Eight North Slope Villages: for the Calendar Year 1992. Report by Department of Wildlife Management, North Slope Borough, Barrow, Alaska.
GEORGETTE, S 1994. Summary of Western Arctic Caribou Herd overlays (1984–92) and comparison with harvest data from other sources. Unpub. ms. Alaska Department of Fish and Game, Division of Subsistence, Fairbanks, AK 99701 USA.
GUTHRIE, RD 1968. Paleoecology of the large-mammal community in interior Alaska during the late Pleistocene. Am. Midland Naturalist 79(2):346–363.
HEPA, RT, HK BROWER AND D BATES. 1997. North Slope Borough Subsistence Harvest Documentation Project: Data for Atqasuk, Alaska for the Period July 1, 1994 to June 30, 1995. Department of Wildlife Management, North Slope Borough, Barrow, Alaska 99723 USA.
ODERKIRK, SE 1998. Serum haptoglobin levels as a prognostic tool for captive reindeer. Pages 29–43 in Clinical Pathology of Intensively Managed Reindeer. MS Thesis, University of Alaska-Fairbanks, Fairbanks, Alaska 99775 USA.
PEDERSEN, S. 1989. Point Lay subsistence land and resource use. In Impact Assessment, Inc.: Point Lay Case Study. Technical Report No. 139. U.S. Department of the Interior, Minerals Management Service, Alaska OCS Region, Anchorage, Alaska 99518 USA.
———. 1995. Nuiqsut. In J Fall and C Utermohle, eds. An Investigation of the Sociocultural consequences of Outer Continental Shelf Development in Alaska. Technical Report No. 160. U.S. Department of the Interior, Minerals Management Service, Alaska OCS Region, Anchorage, Alaska USA.
202
———. 2001. Subsistence harvest levels and spatial dimensions of caribou, moose, brown bear and muskox hunting in Nuiqsut during regulatory year 2000. Division of Subsistence, Arctic Region, Alaska Department of Fish and Game, Fairbanks, Alaska 99701 USA.
——— AND R OPIE. 1990. Subsistence caribou harvest levels and land use in Anaktuvuk Pass, 1989–90. Division of Subsistence, Arctic Region, Alaska Department of Fish and Game and North Slope Borough Department of Wildlife Management, Fairbanks, Alaska 99701 USA.
——— AND ———. 1991. Subsistence caribou harvest levels and land use in Anaktuvuk Pass, 1990–91. Division of Subsistence, Arctic Region, Alaska Department of Fish and Game and North Slope Borough Department of Wildlife Management, Fairbanks, Alaska 99701 USA.
——— AND ———. 1993. Subsistence caribou harvest levels and land use in Anaktuvuk Pass, 1991–92. Division of Subsistence, Arctic Region, Alaska Department of Fish and Game and North Slope Borough Department of Wildlife Management, Fairbanks, Alaska 99701 USA.
SKOOG, RO 1968. Ecology of the caribou (Rangifer tarandus granti) in Alaska. Ph.D. dissertation. University California, Berkeley. 699pp.
WHITTEN KR 1995. Antler loss and udder distention in relation to parturition in caribou. J Wildlife Manage. 59(2):273–277.
PREPARED BY: SUBMITTED BY: Jim Dau Peter Bente Wildlife Biologist III Survey-Inventory Coordinator

203
Figure 1 Seasonal ranges of the Western Arctic Caribou Herd
204
y = -1.6795x + 81.968R2 = 0.4328
30
40
50
60
70
80
90
100
1986 1987 1988 1989 1990 1991 1992 1993 1994 1995 1996 1997 1998 1999 2000
year
calv
es:1
00 c
olla
red
cow
s
Figure 3 Results of calving surveys for the Western Arctic Caribou Herd, 1987-2000
243,000
75,000
107,000
138,000
172,000
229,000
343,000
416,000
450,000463,000
430,000
0
50000
100000
150000
200000
250000
300000
350000
400000
450000
500000
1969
1970
1971
1972
1973
1974
1975
1976
1977
1978
1979
1980
1981
1982
1983
1984
1985
1986
1987
1988
1989
1990
1991
1992
1993
1994
1995
1996
1997
1998
1999
2000
year
num
ber o
f car
ibou
Figure 2 Photocensus estimates of the Western Arctic Caribou Herd, 1970-1999

205
0
10
20
30
40
50
60
70
80
90
100
110
120
130
140
150
160
170
180
190
200
210
1987 1988 1989 1990 1991 1992 1993 1994 1995 1996 1997 1998 1999 2000
# collarsthinned hits (X 10)total hits (X 10)
year
num
ber
Figure 4 Numbers of functional platform terminal (satellite) transmitters and locations for the Western Arctic Caribou Herd by year, 1987- 2000 ('thinned hits' are a subset of data that provide a standard frequency of locations among collars and seasons)
0
5
10
15
20
25
30
35
1979 1980 1981 1982 1983 1984 1985 1986 1987 1988 1989 1990 1991 1992 1993 1994 1995 1996 1997 1998 1999 2000
year
num
ber:
100
adul
ts
10-month-old calves:100 adults
proportion of adult females that died
Figure 5 Annual estimates of adult mortality and calf recruitment for the Western Arctic Caribou Herd, 1980-2000
206
0
5
10
15
20
25
30
35
1981
1982
1983
1984
1985
1986
1987
1988
1989
1990
1991
1992
1993
1994
1995
1996
1997
1998
1999
2000
midpoint year
num
ber:
100
adul
ts
calf recruitment
adult cow mortality
Figure 6 Three-year moving averages of adult cow mortality and calf recruitment for the Western Arctic Caribou Herd, 1979-2000

207
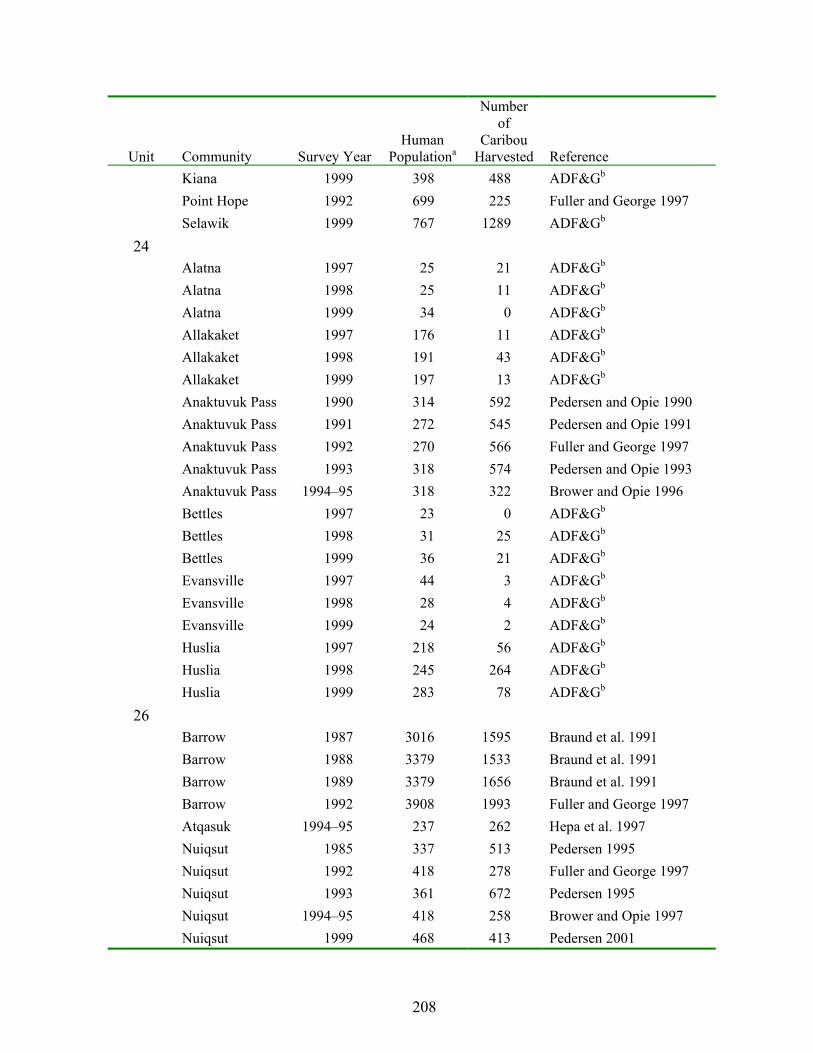
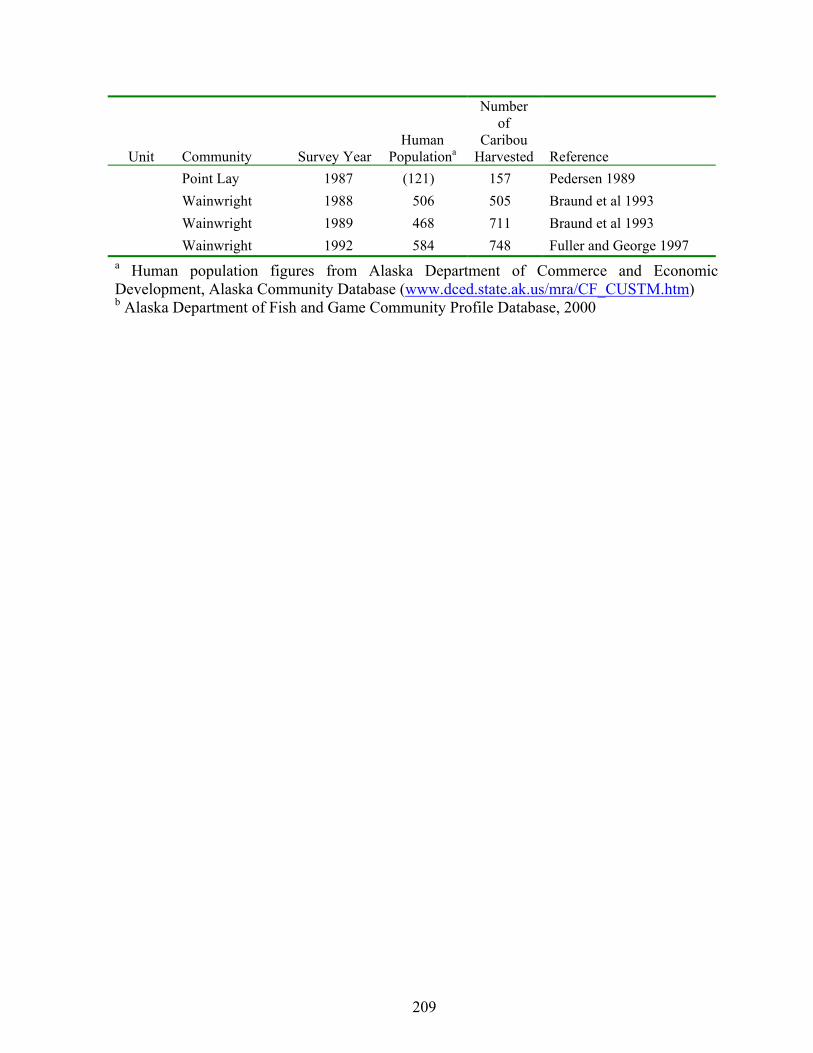
Table 1 Summary of community-based harvest assessments (ADF&G unless otherwise noted) for communities within the range of the Western Arctic Caribou Herd, 1985–1999 (population numbers in parentheses estimated during household interviews rather than by Department of Commerce and Economic Development)
Unit
Community
Survey Year
Human Populationa
Number of
Caribou Harvested
Reference
21 Galena 1996 548 40 ADF&Gb Galena 1997 536 39 ADF&Gb Galena 1998 481 7 ADF&Gb Galena 1999 592 8 ADF&Gb Kaltag 1996 227 16 ADF&Gb Kaltag 1997 247 8 ADF&Gb Kaltag 1998 227 6 ADF&Gb Kaltag 1999 251 0 ADF&Gb Nulato 1996 328 13 ADF&Gb Nulato 1997 311 3 ADF&Gb Nulato 1998 282 5 ADF&Gb Nulato 1999 347 0 ADF&Gb
22 Golovin 1989 169 40 ADF&Gb Koyuk 1998 277 263 ADF&Gb Shaktoolik 1998 235 167 ADF&Gb Shaktoolik 1999 216 125 ADF&Gb Shismaref 1989 472 197 ADF&Gb Shishmaref 1995 560 342 ADF&Gb Wales 1993 152 4 ADF&Gb Elim 1999 306 227 ADF&Gb White Mountain 1999 197 93 ADF&Gb
23 Deering 1994 147 142 ADF&Gb Kivalina 1992 344 351 ADF&Gb Kotzebue 1986 (2681) 1917 ADF&Gb Kotzebue 1991 2751 3782 ADF&Gb Noatak 1994 379 615 ADF&Gb Noatak 1999 423 683 ADF&Gb Shungnak 1998 245 561 ADF&Gb
208
Unit
Community
Survey Year
Human Populationa
Number of
Caribou Harvested
Reference
Kiana 1999 398 488 ADF&Gb Point Hope 1992 699 225 Fuller and George 1997 Selawik 1999 767 1289 ADF&Gb
24 Alatna 1997 25 21 ADF&Gb Alatna 1998 25 11 ADF&Gb Alatna 1999 34 0 ADF&Gb Allakaket 1997 176 11 ADF&Gb Allakaket 1998 191 43 ADF&Gb Allakaket 1999 197 13 ADF&Gb Anaktuvuk Pass 1990 314 592 Pedersen and Opie 1990 Anaktuvuk Pass 1991 272 545 Pedersen and Opie 1991 Anaktuvuk Pass 1992 270 566 Fuller and George 1997 Anaktuvuk Pass 1993 318 574 Pedersen and Opie 1993 Anaktuvuk Pass 1994–95 318 322 Brower and Opie 1996 Bettles 1997 23 0 ADF&Gb Bettles 1998 31 25 ADF&Gb Bettles 1999 36 21 ADF&Gb Evansville 1997 44 3 ADF&Gb Evansville 1998 28 4 ADF&Gb Evansville 1999 24 2 ADF&Gb Huslia 1997 218 56 ADF&Gb Huslia 1998 245 264 ADF&Gb Huslia 1999 283 78 ADF&Gb
26 Barrow 1987 3016 1595 Braund et al. 1991 Barrow 1988 3379 1533 Braund et al. 1991 Barrow 1989 3379 1656 Braund et al. 1991 Barrow 1992 3908 1993 Fuller and George 1997 Atqasuk 1994–95 237 262 Hepa et al. 1997 Nuiqsut 1985 337 513 Pedersen 1995 Nuiqsut 1992 418 278 Fuller and George 1997 Nuiqsut 1993 361 672 Pedersen 1995 Nuiqsut 1994–95 418 258 Brower and Opie 1997 Nuiqsut 1999 468 413 Pedersen 2001
209
Unit
Community
Survey Year
Human Populationa
Number of
Caribou Harvested
Reference
Point Lay 1987 (121) 157 Pedersen 1989 Wainwright 1988 506 505 Braund et al 1993 Wainwright 1989 468 711 Braund et al 1993 Wainwright 1992 584 748 Fuller and George 1997
a Human population figures from Alaska Department of Commerce and Economic Development, Alaska Community Database (www.dced.state.ak.us/mra/CF_CUSTM.htm) b Alaska Department of Fish and Game Community Profile Database, 2000

210
Table 2 Photocensus population estimates of the Western Arctic Caribou Herd, 1970–1999
Census year
Minimum population size
Mean annual rate of changea
Estimated population size
1970 243,000 1971 -18 200,000 1972 -18 164,000 1973 -18 135,000 1974 -18 111,000 1975 -18 91,000 1976 75,000 1977 19 89,000 1978 107,000 1979 14 121,000 1980 138,000 1981 12 154,000 1982 172,000 1983 7 185,000 1984 7 198,000 1985 7 213,000 1986 229,000 1987 22 280,000 1988 343,000 1989 10 378,000 1990 416,000 1991 3 427,000 1992 3 438,000 1993 450,000 1994 1 454,000 1995 1 459,000 1996 463,000 1997 -2 452,000 1998 -2 441,000 1999 430,000
a Mean annual rate of change = er e = 2.7183; r = [ln(Nt2) - ln(Nt1)]/t where: t = number of years between censuses; Nt1 = pop. estimate at time1; and Nt2 = pop. estimate at time2

211
Table 3 Aerial calving surveys from observations of radiocollared cows in the Western Arctic Caribou Herd, 1987–2000
Year
June dates
With Calf
No Calf >1 hard
antler
No Calf soft
antler
No Calf no
antler
Total
Maternal
Non-
Maternal
Calves: 100
Cows 1987 17–19 29 0 1 9 39 29 10 74 1988 3–5 27 17 1 9 54 44 10 81 1989 10–12 34 5 2 9 50 39 11 78 1990 11–13 51 0 5 15 71 51 20 72 1991 1992 12–14 55 6 0 10 71 61 10 86 1993 11–17 39 3 17 21 80 42 39 52 1994 10–13 42 15 2 21 80 57 23 71 1995 9–13,
19–20 47 2 13 21 83 49 34 59
1996 5–6, 13–14
38 16 13 21 88 54 34 61
1997 4–7 39 13 16 22 90 52 38 58
1998 12–15 36 5 16 21 78 41 37 53
1999 11–13 47 0 11 23 81 47 34 58
2000 7, 12–14 39 11 5 17 72 50 22 69

212
Table 4 Fall population composition of the Western Arctic Caribou Herd, 1961–1999
Year
Bulls
Cows
Calves
Total
Calves: 100
Cows
Calves: 100
Adults
Bulls: 100
Cows 1961 276 501 187 964 37 24 551970 1748 2732 1198 5678 44 27 64 1975 720 2330 1116 4166 48 37 31 1976 273 431 222 926 52 32 63 1980 715 1354 711 2780 53 34 53 1982 1896 3285 1923 7104 59 37 58 1992 1600 2498 1299 5397 52 32 64 1993 859 2321 859 4039 37 25 37 1994 1354 3284 1118 5756 34 24 41 1995 1176 2029 1057 4262 52 33 58 1996 2621 5119 2525 10265 49 33 51 1997 2588 5229 2255 10072 43 29 49 1998 2298 4231 1909 8438 45 29 54 1999 2059 4191 1960 8210 47 31 49

213
Table 5 Short yearlinga survey results of the Western Arctic Caribou Herd, 1980–2000
Number
Number of caribou Radio-
collared
SYa:100 3-yr
runningYear Adults SYa Total Groups cows adults average
1980 7823 2559 10382 33 1981 31b 1982 3988 1164 5152 29 31 1983 5079 1648 6727 32 31 1984 1646 503 2149 31 28 1985 2776 600 3376 22 25 1986 5372 1227 6599 23 23 1987 4272 1003 5275 23 23 1988 6047 1312 7359 31 45 22 26 1989 5321 1718 7039 29 37 32 26 1990 5231 1278 6509 25 36 24 25 1991 7111 1371 8482 47 48 19 22 1992 7660 1678 9338 49 52 22 20 1993 4396 814 5210 19 33 19 20 1994 8369 1587 9956 44 53 19 18 1995 13283 2196 15479 53 86 17 19 1996 5044 1111 6155 32 36 22 22 1997 9298 2438 11736 40 56 26 23 1998 7409 1585 8994 34 46 21 21 1999 6354 975 7329 34 36 15 18 2000 8568 1559 10127 42 48 18 a Short yearlings are 10–11-month-old caribou. b Calculates average using values from 1980 and 1982.

214
Table 6 Annual mortality and binomial confidence intervals for Western Arctic Caribou Herd cows collared with conventional radiocollars, 1984–1985 through 1999–2000 “collar years” (1 Oct–30 Sep)
Binomial Confidence Level
Collar yeara Sample
sizeb
No. diedMortality ratec (%)
80%
90%
95%
1984–1985 28 4 14 6–27 5–30 4–33 1985–1986 48 5 10 5–18 4–21 3–23 1986–1987 66 8 12 7–19 6–21 5–22 1987–1988 88 8 9 5–14 5–16 4–17 1988–1989 87 13 15 10–21 9–23 8–24 1989–1990 102 15 15 10–20 9–22 8–23 1990–1991 100 15 15 10–21 9–22 9–24 1991–1992 103 16 16 11–21 10–23 9–24 1992–1993 106 21 20 15–26 14–27 13–29 1993–1994 101 16 16 11–22 10–23 9–24 1994–1995 107 14 13 9–18 8–20 7–21 1995–1996 108 20 19 14–24 13–26 12–27 1996–1997 106 16 15 11–21 10–22 9–23 1997–1998 100 7 7 4–11 3–13 3–14 1998–1999 93 16 17 12–23 11–25 10–26 1999–2000 99 11 11 7–16 6–18 6–19 a “Collar year” defined as 1 October–30 September b Sample size = total number of potentially active conventional radiocollars active on adult cows at the beginning of the collar year c Mortality rate = Number caribou died/Sample size

215
Table 7 Estimated harvest of Western Arctic Herd Caribou during the 1999–2000 regulatory year by residents living within the range of this herd
Unit
Community
Human Population
Per
Capita CaribouHarvest
Total Community
Harvest
%
WACH in
Harvest
Estimated No. of WACH caribou
harvested
Assessments used to estimate per capita
harvesta
21 Galena 592 0.01 8 100 8 Galena 99 Kaltag 251 0.00 0 0 Kaltag 99 Koyukuk 100 0.04 8 100 8 Gal. 96–98, Kal. 96–98 Nulato 347 0.00 0 0 Nulato 99 Total Unit 21 16
22 Brevig Mission 291 0.24 69 100 69 Golovin 89 Elim 316 0.74 234 100 234 Elim 99 Golovin 142 0.74 105 100 105 Koyuk 98; Elim 99;
Wh. Mt.-99; Shkt. 98 Koyuk 289 0.95 274 100 274 Koyuk 98 Nome 3620 0.10 350 100 350 Reg. Permit Sys. Saint Michael 368 0.03 10 100 10 Wales 93 Shaktoolik 227 0.58 131 100 131 Shaktoolik. 99 Shishmaref 547 0.61 334 100 334 Shishmaref 95 Stebbins 543 0.03 14 100 14 Wales 93 Teller 281 0.24 67 100 67 Golovin 89 Unalakleet 757 0.58 438 100 438 Shkt. 99 Wales 154 0.03 4 100 4 Wales 93 White Mountain 207 0.47 98 100 98 White Mt. 99

216
Unit
Community
Human Population
Per
Capita CaribouHarvest
Total Community
Harvest
%
WACH in
Harvest
Estimated No. of WACH caribou
harvested
Assessments used to estimate per capita
harvesta
Total Unit 22 2128
23 Ambler 298 2.29 682 100 682 Shungnak 98 Buckland 442 1.64 727 100 727 Noa. 94, 99; Shg. 98;
Kia. 99; Sel. 99
Deering 155 1.64 255 100 255 Noa. 94, 99; Shg. 98; Kia. 99; Sel. 99
Kiana 366 1.23 488 100 488 Kiana 99 Kivalina 382 1.02 390 100 390 Kivalina 92 Kobuk 96 2.29 220 100 220 Shungnak 98 Kotzebue 3000 1.37 4124 100 4124 Kotzebue 91 Noatak 423 1.61 683 100 683 Noatak 99 Noorvik 634 1.23 777 100 777 Kiana 99 Point Hope 792 0.32 255 100 255 Pt. Hope 92 Selawik 792 1.68 1289 100 1289 Selawik 99 Shungnak 257 2.29 588 100 588 Shungnak 98 Total Unit 23 10478
24 Alatna 34 0.00 0 0 Alatna 99 Allakaket 197 0.07 13 100 13 Allakaket. 99 Anaktuvuk Pass 312 1.76 549 80 439 Anak. Pass 90–95 Bettles 36 0.58 21 100 21 Bettles 99 Evansville 24 0.08 2 100 2 Evansville 99
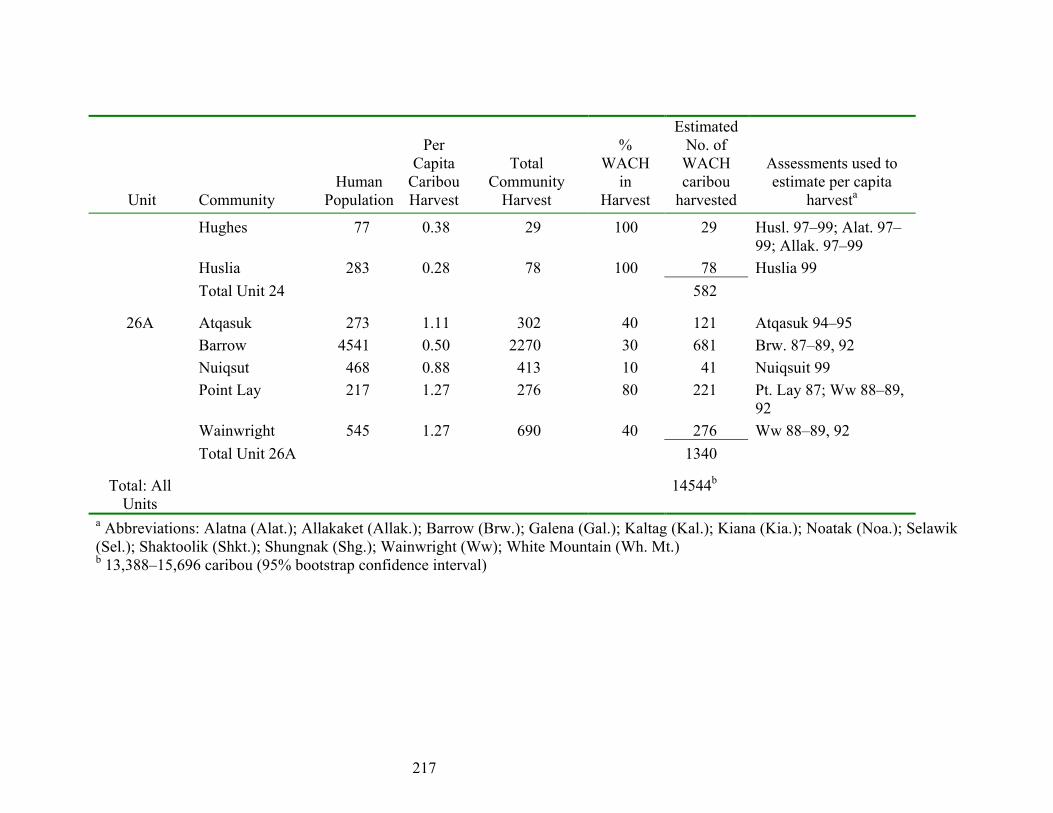
217
Unit
Community
Human Population
Per
Capita CaribouHarvest
Total Community
Harvest
%
WACH in
Harvest
Estimated No. of WACH caribou
harvested
Assessments used to estimate per capita
harvesta
Hughes 77 0.38 29 100 29 Husl. 97–99; Alat. 97–99; Allak. 97–99
Huslia 283 0.28 78 100 78 Huslia 99 Total Unit 24 582
26A Atqasuk 273 1.11 302 40 121 Atqasuk 94–95 Barrow 4541 0.50 2270 30 681 Brw. 87–89, 92 Nuiqsut 468 0.88 413 10 41 Nuiqsuit 99 Point Lay 217 1.27 276 80 221 Pt. Lay 87; Ww 88–89,
92 Wainwright 545 1.27 690 40 276 Ww 88–89, 92 Total Unit 26A 1340
Total: All Units
14544b
a Abbreviations: Alatna (Alat.); Allakaket (Allak.); Barrow (Brw.); Galena (Gal.); Kaltag (Kal.); Kiana (Kia.); Noatak (Noa.); Selawik (Sel.); Shaktoolik (Shkt.); Shungnak (Shg.); Wainwright (Ww); White Mountain (Wh. Mt.) b 13,388–15,696 caribou (95% bootstrap confidence interval)
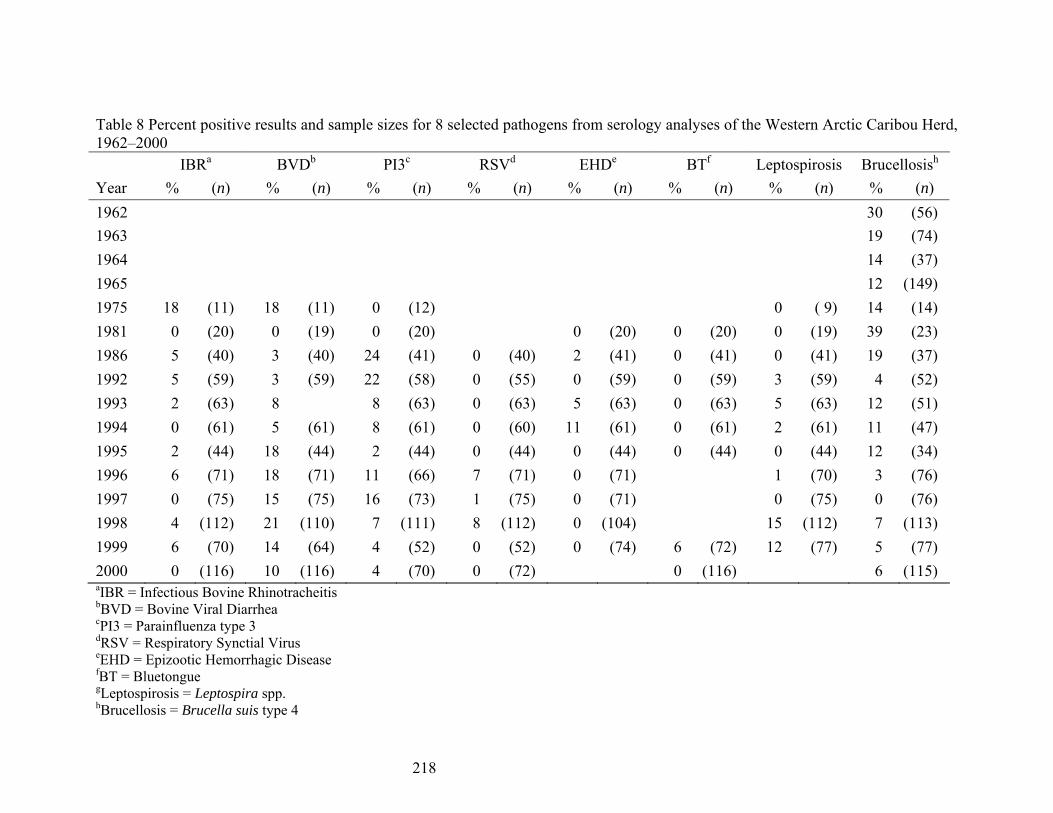
218
Table 8 Percent positive results and sample sizes for 8 selected pathogens from serology analyses of the Western Arctic Caribou Herd, 1962–2000 IBRa BVDb PI3c RSVd EHDe BTf Leptospirosis Brucellosish
Year % (n) % (n) % (n) % (n) % (n) % (n) % (n) % (n) 1962 30 (56) 1963 19 (74) 1964 14 (37) 1965 12 (149) 1975 18 (11) 18 (11) 0 (12) 0 ( 9) 14 (14) 1981 0 (20) 0 (19) 0 (20) 0 (20) 0 (20) 0 (19) 39 (23) 1986 5 (40) 3 (40) 24 (41) 0 (40) 2 (41) 0 (41) 0 (41) 19 (37) 1992 5 (59) 3 (59) 22 (58) 0 (55) 0 (59) 0 (59) 3 (59) 4 (52) 1993 2 (63) 8 8 (63) 0 (63) 5 (63) 0 (63) 5 (63) 12 (51) 1994 0 (61) 5 (61) 8 (61) 0 (60) 11 (61) 0 (61) 2 (61) 11 (47) 1995 2 (44) 18 (44) 2 (44) 0 (44) 0 (44) 0 (44) 0 (44) 12 (34) 1996 6 (71) 18 (71) 11 (66) 7 (71) 0 (71) 1 (70) 3 (76) 1997 0 (75) 15 (75) 16 (73) 1 (75) 0 (71) 0 (75) 0 (76) 1998 4 (112) 21 (110) 7 (111) 8 (112) 0 (104) 15 (112) 7 (113) 1999 6 (70) 14 (64) 4 (52) 0 (52) 0 (74) 6 (72) 12 (77) 5 (77) 2000 0 (116) 10 (116) 4 (70) 0 (72) 0 (116) 6 (115) aIBR = Infectious Bovine Rhinotracheitis bBVD = Bovine Viral Diarrhea cPI3 = Parainfluenza type 3 dRSV = Respiratory Synctial Virus eEHD = Epizootic Hemorrhagic Disease fBT = Bluetongue gLeptospirosis = Leptospira spp. hBrucellosis = Brucella suis type 4