caribbean region quarterly bulletin march 2019 · welcome to the march 2019 caribbean region...
TRANSCRIPT
Caribbean Region Quarterly Bulletin
For questions or comments please contact email [email protected]
Copyright © 2016 Inter-American Development Bank.This work is licensed under a Creative Commons IGO 3.0 Attribution-NonCommercial-NoDerivatives (CC-IGO BY-NC-ND 3.0 IGO) license (http://creativecommons.org/licenses/by-nc-nd/3.0/igo/legalcode) and may be reproduced with attribution to the IDB and for any non-commercial purpose. No derivative work is allowed. Any dispute related to the use of the works of the IDB that cannot be settled amicably shall be submitted to arbitration pursuant to the UNCITRAL rules. The use of the IDB’s name for any purpose other than for attribution, and the use of IDB’s logo shall be subject to a separate written license agreement between the IDB and the user and is not authorized as part of this CC-IGO license. Note that link provided above includes additional terms and conditions of the license. The opinions expressed in this publication are those of the authors and do not necessarily reflect the views of the Inter-American Development Bank, its Board of Directors, or the countries they represent.
blogs.iadb.org/caribbean-dev-trends
2019:I
Financial Depth, Access and Inclusion in the Caribbean
Volume 8, Issue 1 | March 2019
Special Regional Report: Financial Development, Access, and Inclusion in the Caribbean Why is financial access and inclusion so important? Emerging research suggests positive linkages between financial depth, access to finance, and development outcomes, including economic growth and poverty reduction. For firms – particularly small and newly-established enterprises – access to financial services is associated with stronger innovation, job creation, and growth performance. Other research also finds a strong positive relationship between financial inclusion and income equality. In this context, many countries around the world have begun to design financial development and inclusion strategies and polices with the aim of supporting faster and more inclusive economic growth. The regional and country-specific briefs featured in this Quarterly Bulletin consider related metrics, and examine several factors that may hold back financial development , access, and inclusion for countries across the Caribbean. The analysis considers a number of related indicators linked to common challenges facing small and medium-sized enterprises and individuals in accessing credit and financ ial services. Related policy initiatives and options are also explored, with a view to highlighting country-specific recommendations with the potential to support broader financial access and inclusion.
Dear Reader, Welcome to the March 2019 Caribbean Region Quarterly Bulletin. This edition focuses on important challenges fac ing Caribbean economies related to financial development, access, and inclusion, which have been identified as key building blocks for achieving the UN Sustainable Development Goals, as well as faster economic and social development, poverty reduction, and inclusive growth.
Table of ContentsIntroduction Economic Updates by Country 1
Regional Financial Inclusion: An Overview 5
Country Chapters The Bahamas 9
Barbados 13 Guyana 17 Jamaica 23 Suriname 28 Trinidad and Tobago 33 Organisation of Eastern Caribbean States 38
Financial Depth, Access, and Inclusion in the Caribbean
1
ECONOMIC UPDATES BY COUNTRY
Regional Overview Forecasts for the global economy remain positive, although optimism is receding. In its January 2019 World Economic Outlook Update, the International Monetary Fund suggested that the global expansion is weakening, with global growth projected at 3.5 percent for 2019 and 3.6 percent for 2020. This is slightly below the 3.7 percent estimate for 2018. Downside risks have increased, with the potential for further escalation of trade tensions. In addition, the IMF highlights issues such as a “no-deal” Brexit and a faster-than-envisaged slowdown in China as potential triggers for a deterioration in risk sentiment and growth. The economic outlook for the Caribbean in 2019 remains positive, with growth expected to be higher in 2019 than in 2018. The positive growth outlook comes on the back of a continued strong global economy, notwithstanding some projected weakening of global expansion. In addition, some Caribbean countries have implemented reforms to remove domestic bottlenecks that had been affecting stability and growth. Tourism demand remains elevated on the back of the strong global economy. Caribbean tourism is highly dependent on the United States, Canada, and, to a lesser extent, Europe. Strong economic and labour market performance in these countries has resulted in robust tourism demand. Commodity producers have benefited from the stabilization of commodity prices. Suriname and Trinidad and Tobago both fell into deep recessions after the fall in commodity prices in 2014/2015. However, both countries are recoving as a result of improved commodity prices, as well as the introduction of fiscal adjustment measures that support stablization, and that will support sustainability going forward. Guyana will also benefit from commodities owing to recent discoveries of new hydrocarbon resources. Debt-to-GDP levels in the Caribbean continue to be elevated, and considerable fiscal efforts are underway to reduce them. All countries but Guyana are pursuing fiscal consolidation, albeit with varying intensity. Efforts are especially strong in Jamaica and Barbados, which have primary budget balances higher than 6 percent of GDP. As a result, projections indicate that debt-to-GDP levels will continue a downward trend in 2019 and beyond for most Caribbean countries. Risks remain elevated but are balanced. Small countries in the Caribbean are highly susceptible to external economic conditions and shocks. Climate change and natural disasters exacerbate the region’s macroeconomic challenges. At the same time, upside risks could materialize if policy reforms continue to gain traction, and if global demand remains strong. Strong policy implementation in several countries, especially related to fiscal and debt sustainablity, have become an important buffer against future shocks.
The Bahamas Growth in The Bahamas in 2018 was 2.3 percent, above the moderate gain in the rate of growth in 2017. Medium-term growth levels are forecast at roughly 1.6 percent, as stable growth in the U.S. economy, and several private large-scale tourism investment projects are aiding the recovery. Gains in tourism sector output and investment projects continue to drive growth in the construction sector. In the monetary sector, liquidity levels narrowed, as domestic credit increased against deposit levels. External reserves contracted as traditional demand for foreign currency increased during the final few months of the year. The national unemployment rate rose to 10.7 percent, up from 10 percent in May, as the number of people looking for work increased. The unemployment rate for young adults (15 to 24 years old) remains high at approximately 23.1 percent. The government’s budgetary performance included revenue levels of just over US$1 billion for July-December 2018. Collections are estimated at 14 percent above the same period last year. Improvements in value-added tax and stamp tax collections accounted for the stronger performance. Fiscal deficit levels declined by roughly 31 percent when compared to the same period last year. The government met its deadline to begin the automatic exchange of tax information (AEOI) with 35 partner jurisdictions. An integrated system has been developed to submit and process tax compliance data, supporting all of The Bahamas’ AEOI needs. A new financial services framework is in place. Effective January 1, 2019, all financial institutions can offer services to both domestic and international clients once they meet the prescribed regulatory requirements with respect to the services provided. The European Union added The Bahamas to i ts non-cooperative jurisdictions list. The Bahamian government had hoped to avoid such an outcome, given the recent passage of tax compliance laws in Parliament , and its continued engagement with the EU’s tax watchdog.
2
ECONOMIC UPDATES BY COUNTRY
Barbados The government of Barbados is intensifying the fiscal adjustment to tackle unsustainable debt levels. The Barbados Economic Recovery and Transformation Plan (BERT) launched in August 2018 outlines reforms aimed at achieving a debt target of 60 percent of GDP by 2033. The domestic debt exchange was finalized in October 2018, and the government successfully secured support from multilateral institutions. It signed a four-year Extended Fund Facility program with the International Monetary Fund (IMF) for US$290 million and received a combined US$175 million in budget support from the Inter-American Development Bank and the Caribbean Development Bank. The economy contracted by 0.6 percent in 2018, compared to 0.1 percent growth in 2017. Lower tourism output growth and a fall of 7 percent in construction output fuelled the overall contraction of the economy during the year. The inflation rate decreased to 3.7 percent at the end of 2018, compared to 4.5 percent in 2017, as a result of the elimination of the National Social Responsibility Levy (NSRL) and a slight reduction in international fuel prices at the end of 2018. The government’s fiscal position is improving as a result of fiscal consolidation measures. The overall and primary fiscal balances reached 0.3 percent and 3.4 percent of GDP, respectively, between April and December 2018 compared to -4.5 percent and 3.1 percent in FY2017/2018. Higher corporate and property taxes between April and December 2018 (compared to the same period in 2017) overcame the fall in revenues stemming from the repeal of the NSRL. Tax refunds, lower imports, and lags in the collection of some of the recently implemented budgetary measures also impacted revenue collection. On the expenditure side, current expenditures fell, mostly due to a reduction in interest payments and a slight reduction in transfers. This was offset by an increase in spending on salaries and wages. Gross central government debt fell to an estimated 126.9 percent of GDP at the end of 2018, compared to 148.4 percent a year earlier, while international reserves increased to US$524.9 million. Reserves grew to reach 13.5 weeks of imports at the end of 2018 compared to 6.1 weeks a year earlier. The economic outlook will depend on the continued success of the reforms. The IMF expects the economy to contract by 0.1 percent in 2019. Special events like the English cricket tour or a potential expansion of the airl i ft could have positive effects on this outlook. However, downside risks remain given low forecast growth for major source markets, the potential impact of Brexit , and geopolitical uncertainties relating to international oil markets.
Guyana The gross recoverable petroleum resources off the coast of Guyana are now estimated at more than 5 billion oil-equivalent barrels, as announced by ExxonMobil in December 2018. In 2019, two new oil discoveries were made in addition to the five discoveries in 2018, increasing the total number of oil discoveries to 12. Oil production is expected to begin in 2020 (Liza-1), with two more wells coming onstream in the short term (Liza-2 in 2022 and Payara in 2023). Based on the most recent discoveries, ExxonMobil claims to have the potential to produce more than 750,000 barrels per day by 2025 with at least five floating production storage and offloading vessels. Growth has become more broad-based. In 2018, the Guyanese economy is estimated to have grown 3.4 percent, higher than the 2.1 percent in 2017, on account of growth in the construction (12 percent) and wholesale and retail trade (6.2 percent) sectors. The mining sector continued the contraction it had started in 2017 (-8.8 percent). Nontraditional sectors, which exclude mining and agriculture, grew at a faster rate than the res t of the economy, reaching 5 percent in 2017 and 5.1 percent in 2018. The Ministry of Finance projects that the mining sector will expand in 2019 and the economy will grow by 4.5 percent. The central government estimates a lower-than-expected fiscal deficit in 2018. The revised estimate of the fiscal deficit for 2018 is 3.9 percent of GDP, lower than the 5.4 percent estimated at the beginning of the year. Higher-than-expected tax collections contributed significantly to the lower fiscal deficit. The government has maintained a relatively stable fiscal deficit averaging 3.8 percent of GDP over the last five years. The deficit is projected to grow to 5 percent in 2019 mainly due to the government’s continued efforts to restructure the sugar public enterprises as well as increased infrastructure spending leading up to oil production in 2020. International reserves remain at prudent levels. At the end of December 2018, net international reserves were estimated to stand at US$477 million, below the US$581 million a year earlier. This level of international reserves represents approximately 2.5 months of imports and 16 percent of GDP. Reserve levels are expected to increase substantially after the start of oil production. The banking sector remains well capitalized, with a capital adequacy ratio of 30 percent, exceeding the regulatory benchmark of 8 percent. The ratio of nonperforming loans to gross loans remained stable at 12.58 percent in September 2018, lower than the 13.76 percent at the same time in 2017. Private sector credit has grown modestly, reaching 1.3 percent in September 2018.

3
ECONOMIC UPDATES BY COUNTRY
Jamaica Policies and reforms have stabilized the Jamaican economy and restored sustainability. Progress with debt reduction, fiscal consolidation, and the accumulation of external buffers has met or exceeded commitments under the current IMF arrangement, despite slower progress on wage compression and public sector transformation. Looking forward, efforts to reinforce financial and economic management institutions – for example, the shift to inflation-targeting and the recent ly -announced fiscal council – should help to ensure that hard-won gains are sustained. Growth is accelerating, but from a low base, and inflation is undershooting the target. Favourable weather conditions have driven a rebound in agricultural output. External demand remains strong, supporting tourism and trade, and improving credit conditions have begun to spur domestic investment. Consequently, real GDP is projected to grow by 1.8 percent during the year ending in March 2019 – up from 0.9 percent for FY2017/18. Yearly inflation was below the central bank’s target range of 4 to 6 percent through January 2019, coming in at 2.3 percent. In this context, the central bank reduced its policy interest rate from 1.75 to 1.50 percent (on February 20, 2019), and took the additional step of reducing reserve requirements for deposit-taking institutions from 12 to 9 percent (effective March 1, 2019) to further stimulate domestic demand. Jamaica experienced exchange rate volatility and modest depreciation driven largely by lower interest rates and redemptions. Exchange rate volatility has persisted over the past several months, in line with lower interest rates and expectations that accommodative monetary policies will remain in place for some time. Redemptions of U.S. dollar-denominated bonds have also driven market movements. Despite some volatility, the U.S. dollar/Jamaican dollar exchange rate changed only modestly in the year up to the end of February 2019 (from about 126 to 130 JM$/US$). Net international reserves have also remained stable over this period, at around US$3 billion, pointing to only limited intervention by the Bank of Jamaica. Reserves are now considered fully sufficient by the IMF’s adequacy assessment. Jamaica’s public debt levels fell at a faster-than-expected pace over the past year. The public -debt-to-GDP ratio is expected to fall to about 96 percent at the end of March 2019, from over 140 percent in 2013. In line with these developments, Fitch upgraded Jamaica’s long-term issuer rating from B (as of January 2018) to B+ at end-January 2019. The last time any rating agency rated Jamaica at B+ was in August 2006 (Fitch). S&P currently assigns a B rating to Jamaica, while Moody ’s ass igns a B3.
Suriname Economic growth has returned to positive territory in Suriname. The improvement in commodity prices and gold output helped return growth to 1.7 percent in 2017 and 2.7 percent in 2018. The IMF projected that real GDP growth would average 2.5 percent over the medium term, buttressed by improvements in both the mining and non-mining sectors. Inflation continues to decline in the face of a more stable exchange rate. The inflation rate fell to 5.4 percent in January 2019 from 9.1 percent in January 2018. This represents a significant decline from the inflation rate in October 2016 of 79.2 percent, which was caused by higher costs of utilities and a depreciation of the exchange rate. The exchange rate has been relatively stable since December 2016, averaging US$1/SRD7.5. Fiscal deficits are expected to decline over the medium term. According to data from the IMF, the primary fiscal deficit for 2017 was estimated at 5 percent of GDP, lower than the 6.2 percent of GDP reported in 2016. The overall fiscal deficit was estimated at 8 percent of GDP in 2017, falling from 8.1 percent of GDP in 2016. The primary fiscal deficit for 2018 is projected to dec line to 4.1 percent of GDP and average 3.1 percent of GDP over 2019–2023. External debt at the end of 2018 increased to US$1.716 billion from US$1.683 billion the previous year. Data from Suriname’s Debt Management Office shows that in 2018, the country’s total public debt was estimated at 62.5 percent of GDP. External debt as a percentage of GDP was estimated at 43.2 percent of GDP and domestic debt at 19.3 percent of GDP. The estimate of the external current account deficit for 2018 was 4.5 percent of GDP. Preliminary estimates from the Central Bank of Suriname show a current account deficit of US$188.8 million (equivalent to 4.5 percent of GDP) at the end of 2018, relatively higher than the deficit of 0.1 percent in 2017. International reserves continue to improve. International reserves increased to US$589 million in January 2019 (equivalent to roughly 3.5 months of import cover) from US$444.6 million in January 2018. A new governor of the Central Bank of Suriname was appointed during the year. The previous governor resigned on February 12 and a new governor was appointed on March 1 along with new directors for Monetary and Economic Affairs and for Bank Business and Banking.
4
ECONOMIC UPDATES BY COUNTRY
Trinidad and Tobago Trinidad and Tobago’s economy is expected to grow in the medium term. The economy contracted by 6 percent in 2016 and by another 2.6 percent in 2017. Recently, however, there has been a turnaround in the energy sector due to new gas fields coming on stream, increased investment by large oil and gas companies, and sustained higher energy prices. The recovery in the energy sector is expected to put Trinidad and Tobago on a positive growth path. The IMF projects the economy to grow by 1.5 percent in the medium term. The government is continuing its program of fiscal consolidation. The budgeted deficit for FY2018/19 is 2.5 percent of GDP, largely financed by domestic sources. Policy measures include strengthening social safety nets, further reducing fuel subsidies, and implementing a property tax. With interest payments expected to reach 2.3 percent of GDP, the FY2018/19 budget is projected to come close to a primary balance. Fiscal revenues for the first quarter of FY2018/19 turned out better than expected, in large part due to high natural gas prices. Public sector debt is stabilizing and has a favourable risk profile. At the end of December 2018, public debt stood at 62.2 percent of GDP, 1 percentage point up from 61.2 percent in December 2017. Central government debt reached 43.5 percent of GDP at the end of 2018 and mostly includes domestic securities denominated in local currency. In view of sizable assets in the Heritage and Stabilization Fund (25.7 percent of GDP) and liquid holdings in sinking funds (of about 5 percent of GDP) to cover principal payments, risk of debt distress in the short term is negligible. The tightness in the foreign exchange market may be easing, but excess demand persists. Recently the supply of foreign exchange has increased due to s izable investments by energy companies, tax reforms, and favourable production and price conditions in the gas sector. As a result, international reserves stood at US$7.6 billion – equivalent to eight months of imports – at the end of December 2018, up from US$7.4 billion in October 2018. Nevertheless, given reports that some companies with large import needs have left the market, while other companies have switched to import substitution, indications are that the foreign exchange market is still in a state of disequilibrium.
Organisation of Eastern Caribbean States The Organisation of Eastern Caribbean States (OECS) region recorded moderate economic growth at the end of 2018. Following economic growth averaging 0.7 percent in 2017, the OECS region saw an improvement estimated at 2.8 percent in 2018. Economic growth in the region ranged from 0.5 percent in Dominica to 4.8 percent in Grenada and 4.9 percent in Antigua and Barbuda. Economic activity during the year was boosted by tourism developments, business services, agriculture, and construction activity, as well as by recovery in some cases from extreme weather events in 2017. The growth outlook, projected at 2.9 percent in 2019, will depend on developments in the global economy. At the same time, growth is expected to continue in Dominica, as recovery from the 2017 hurricane season continues. The region witnessed an improved tourism performance during the first nine months of 2018. Total visitor expenditure grew by 1.5 percent to reach US$1.369 billion at the end of September 2018. Total visitor arrivals increased by 6.4 percent, with the cruise passenger segment driving this increase with growth of 7.5 percent. In particular, total visitor arrivals grew by around 44 percent in St. Vincent and the Grenadines, boosted by higher cruise ship calls. The number of cruise passenger arrivals almost doubled in St. Vincent and the Grenadines. At the same time, Grenada and Antigua and Barbuda witnessed an increase in total visitors of 20 percent and 14.6 percent, respectively. On the other hand, tourism performance continues to be weak in Dominica following the adverse impact of the 2017 hurricane season, as the number of stay-over visitors by air fell by 36.2 percent at the end of the first nine months of 2018. Access to credit remains a challenge in the OECS. Throughout the region, credit to the private sector grew marginally by 0.5 percent as of the end of November 2018. However, there was some heterogeneity across the region, with an expansion of credit in Grenada (3 percent) and Antigua and Barbuda (2.2 percent) but more modest growth in St. Kitts and Nevis (1.3 percent) and St. Vincent and the Grenadines (0.8 percent). Dominica and St. Lucia experienced a contraction in private sector credit of -1.4 percent and -1.8 percent, respectively. Consumer prices increased for most of the OECS countries as of the end of September 2018. There were increases in the inflation rate ranging from 0.2 percent in Antigua and Barbuda to 0.7 percent in Dominica. Most of the rise in inflation was a consequence of higher prices for a number of food items and for gas and fuels. On the other hand, the inflation rate declined by 0.4 percent in St. Kitts and Nevis and 0.1 percent in St. Lucia.

5
FINANCIAL INCLUSION: AN OVERVIEW
Contributors: Henry Mooney, Juan Pedro Schmid, and María Alejandra Zegarra
The Importance of Financial Access and Inclusion for Development Why is financial access and inclusion so important? Emerging research suggests positive linkages between financial depth, access to finance, and development outcomes. For example, recent evidence suggests that financ ial access and inclusion are crucial for development and poverty reduction, and that the poor stand to benefit considerably from the use of basic payments, savings, and insurance services.1 Similarly, for firms – part icularly small and newly established enterprises – access to financial services is associated with stronger innovation, job creat ion, and growth performance. Other research also finds a strong positive relationship between financial inclusion and income equality. In this context, many countries around the world have begun to design financial development and inclusion strategies and polices with the aim of supporting faster and more inclusive economic growth.
Definitions
Financial depth and development, access, and inclusion are distinct but related concepts, particularly for developing countries. • Financial depth generally refers to the degree to w hich f inancial markets – particularly credit markets – are suff icient to meet
the needs of domestic agents, including the public and private sectors. • The concept of financial development extends beyond the suff iciency of markets to include a broader set of f inancial
instruments and services, including securitized assets (e.g., debt and equity), synthetic instruments (e.g., futures, forw ards, options, etc.), and other f inancial services (e.g., pensions, insurance, etc.).
• Financial access focuses on the degree to w hich actors are able to make use of f inancial products and services, regardless of the degree to w hich the market is developed – for example, w here public entities have ready access to f inancial products and services, w hile private agents have diff iculty doing so.
• Financial inclusion focuses on the ability of vulnerable and marginalized groups w ithin a country (e.g., small and micro enterprises, those in the informal sector, poor and rural communities, minorities, etc.) to participate in the f inancial system or make use of related services such as deposit accounts, borrow ing, insurance, pensions, etc.
Link to the United Nations Sustainable Development Goals (SDGs). Financial access and inclusion are considered to be among the most important building blocks for achieving the 2030 SDGs, and related issues are featured as targets in eight of the 17 goals (highlighted in blue in Table 1). 2
Table 1. United Nations Sustainable Development Goals Goal 1. End poverty in all its forms everywhere. Goal 2. End hunger and achieve food security and improved nutrition and promote sustainable agriculture. Goal 3. Ensure healthy lives and promote well-being for all at all ages. Goal 4. Ensure inclusive and equitable quality education and promote lifelong learning opportunities for all. Goal 5. Achieve gender equality and empower all women and girls. Goal 6. Ensure availability and sustainable management of w ater and sanitation for all. Goal 7. Ensure access to affordable, reliable, sustainable, and modern energy for all. Goal 8. Promote sustained, inclusive, and sustainable economic growth, full and productive employment, and de ce nt work for all. Goal 9. Build resilient infrastructure, promote inclusive and sustainable industrialization, and foster innovation. Goal 10. Reduce inequality w ithin and among countries. Goal 11. Make cities and human settlements inclusive, safe, resilient, and sustainable. Goal 12. Ensure sustainable consumption and production patterns. Goal 13. Take urgent action to combat climate change and its impacts. Goal 14. Conserve and sustainably use the oceans, seas, and marine resources for sustainable development. Goal 15. Protect, restore, and promote sustainable use of terrestrial ecosystems, sustainably manage forests, combat desertif ication, and halt and reverse land degradation and halt biodiversity loss. Goal 16. Promote peaceful and inclusive societies for sustainable development, provide access to justice for all, and build effective, accountable, and inclusive institutions at all levels. Goal 17. Strengthen the means of implementation and revitalize the global partnership for sustainable development.
Source: United Nations Sustainable Development Knowledge Platform.
1 For a detailed discussion of related issues, see Henry Mooney, “Jamaica: Financial Development, Access and Inclusion: Constraints and Options,” IDB Policy Brief No. 301, Inter-American Development Bank, 2018. 2 Additional information available at http://www.uncdf.org/financial-inclusion-and-the-sdgs.

6
FINANCIAL INCLUSION: AN OVERVIEW
Costs and Access to Finance: A Crucial Challenge for Caribbean Countries The cost of finance and access to finance are key impediments to firm productivi ty and performance in the Caribbean. Caribbean firms responding to the 2014 PROTEqIN3 Caribbean Enterprise Survey ranked the costs of finance and access to finance as among the most significant constraints to improving firm-level productivity and performance (Figure 1). Other significant constraints commonly identified included tax rates and administration, competitor business practices, crime and disorder, electricity, and corruption. In this context, address ing obstacles to financial development, access, and inclusion in the region must be considered a key component of effec t ive country development strategies. The following country-specific briefs focus on related issues, with a particular focus on common challenges and areas where policy interventions and institutional reforms may help to promote progress.
Figure 1. Constraints to Firm Productivity and Performance: Responses to the 2014 PROTEqIN Caribbean Enterprise Survey (percent of firms for each country)
1. Access to Finance
2. Cost of Finance
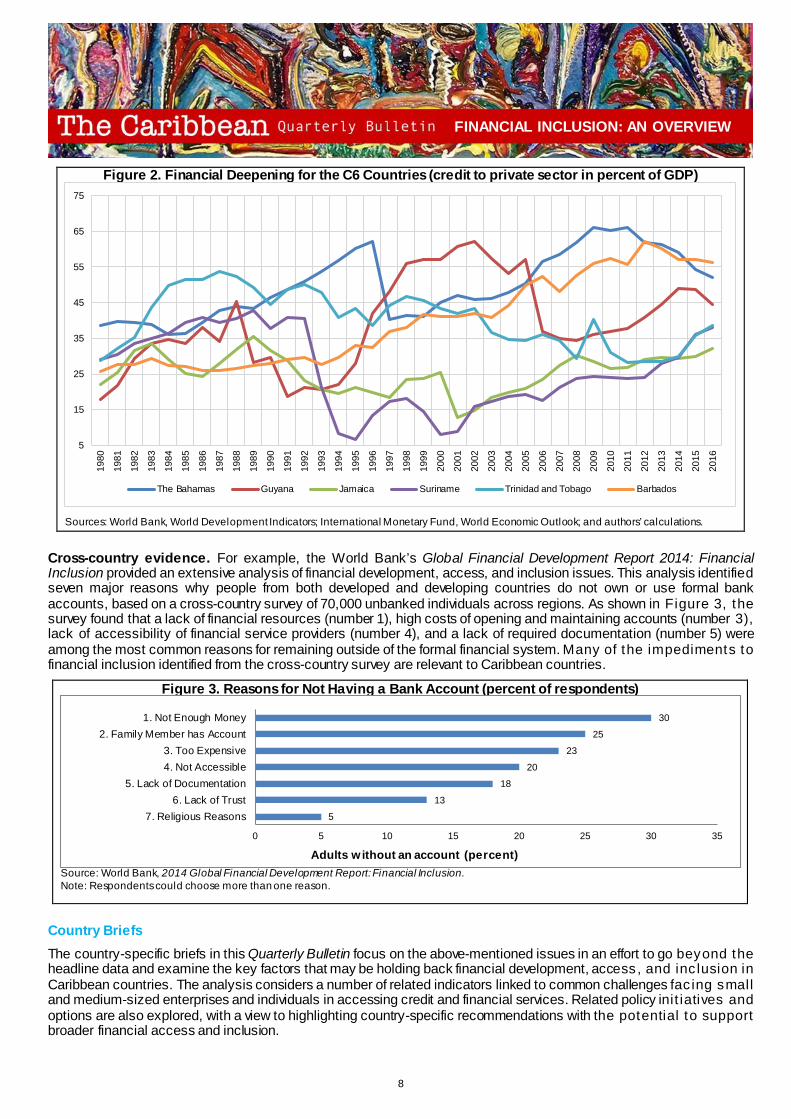
Source: 2014 PROTEqIN Caribbean Enterprise Survey. Note: Population results based on number of firms sampled in each country. *Organisation of Eastern Caribbean States (OECS) countries included in the composite index are Antigua and Barbuda, Dominica, Grenada, St. Ki tt s and Nevis, St. Lucia, and St. Vincent and the Grenadines. Financial Development across the Region: A Broad Range of Outcomes Caribbean countries are diverse in terms of their economic structure, geographic and demographic characteristics, income levels, and other socio-economic features. Not surprisingly, this is also true in terms of countries’ levels of financial depth and development. For example, the ratio of domestic private credit to GDP 4 in 20155 – a common indicator of financial sector depth – ranged from 62 percent for Barbados, to as low as 30 percent for Jamaica. In comparison, the average was 147 percent for all high-income countries, 94 percent for middle-income countries, 19 percent for low-income countries,6 189 percent for North American countries, 98 percent for European Union members, and 49 percent for Latin American and Caribbean countries as a whole (Table 2). For some countries, financial deepening has accelerated considerably since the 1990s, while other countries have remained stagnant. Countries such as Barbados and The Bahamas have seen their financ ial sectors deepen since the 1980s, in line with the implementation of policies aimed at expanding the sector, including for offshore clients . Other countries like Guyana, Trinidad and Tobago, and Suriname have seen market depth oscillate considerably. In this context, financial deepening has been largely stalled since 1970 for both Jamaica and Suriname, in part owing to policy inconsistency driving poor performance, external shocks, and financial crises (Figure 2).
3 Productivity, Technology, and Innovation in the Caribbean (PROTEqIN) is an enterprise and indicator survey first undertaken as part of the World Bank’s 2010 Latin American and Caribbean Enterprise Surveys (LACES). It was last updated in 2014. The project was sponsored by the Inter-American Development Bank (IDB), the UK’s Department for International Development (DFID), and the Government of Canada. 4 Includes funds provided to the private sector by financial corporations (e.g., loans, non-equity securities, trade credit, etc.) 5 At the time of this publication, 2015 was the latest data point available for a comparable cross-country dataset. The data are from the World Bank’s data portal, based on the IMF’s International Financial Statistics and data fi les and on GDP estimates by the World Bank. 6 Income groups are defined per the World Bank’s definition, with middle-income countries defined as those with a 2015 GNI per capita between US$1,026 and US$12,475, and low-income countries as those with a GNI per capita below US$1,026 in the same year.
0%
5%
10%
15%
20%
25%
30%
35%
40%
Jamaica Barbados TheBahamas
OECS* Guyana Suriname Trinidad &Tobago
Major obstacle Very severe obstacle
0%5%
10%15%20%25%30%35%40%45%50%
Trinidad &Tobago
Guyana Jamaica Suriname Barbados OECS* TheBahamas
Major obstacle Very severe obstacle
7
FINANCIAL INCLUSION: AN OVERVIEW
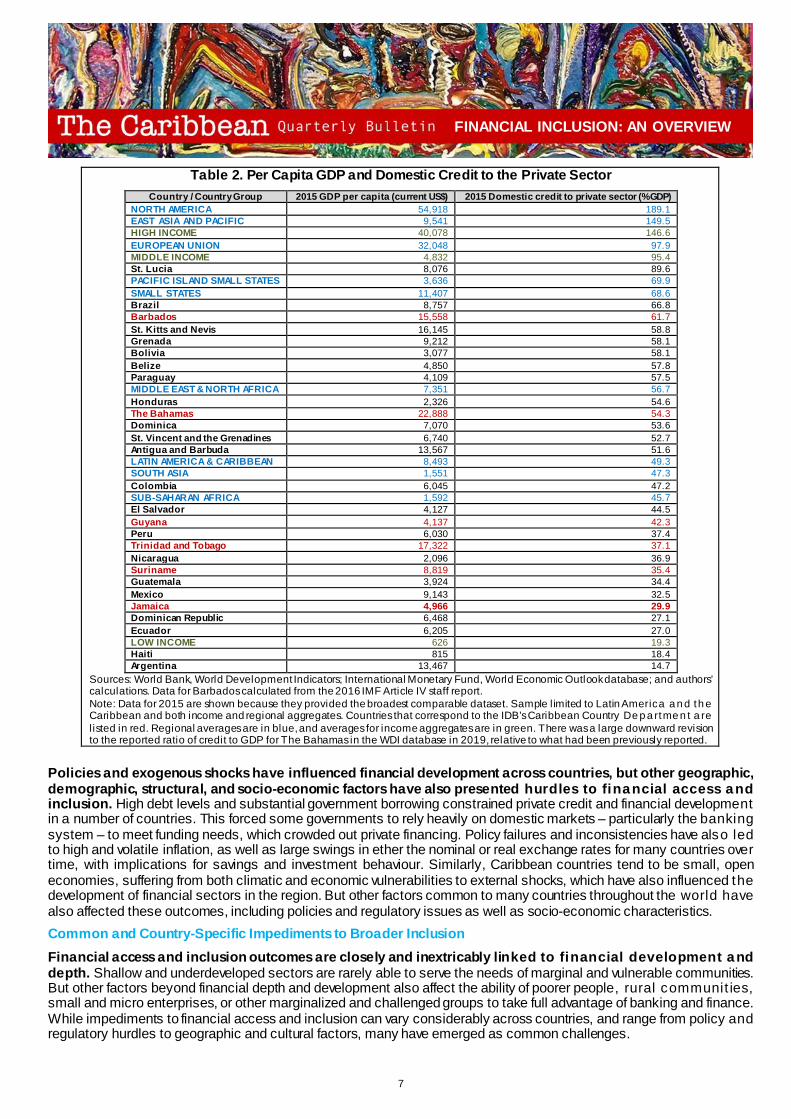
Table 2. Per Capita GDP and Domestic Credit to the Private Sector Country / Country Group 2015 GDP per capita (current US$) 2015 Domestic credit to private sector (%GDP)
NORTH AMERICA 54,918 189.1 EAST ASIA AND PACIFIC 9,541 149.5 HIGH INCOME 40,078 146.6 EUROPEAN UNION 32,048 97.9 MIDDLE INCOME 4,832 95.4 St. Lucia 8,076 89.6 PACIFIC ISLAND SMALL STATES 3,636 69.9 SMALL STATES 11,407 68.6 Brazil 8,757 66.8 Barbados 15,558 61.7 St. Kitts and Nevis 16,145 58.8 Grenada 9,212 58.1 Bolivia 3,077 58.1 Belize 4,850 57.8 Paraguay 4,109 57.5 MIDDLE EAST & NORTH AFRICA 7,351 56.7 Honduras 2,326 54.6 The Bahamas 22,888 54.3 Dominica 7,070 53.6 St. Vincent and the Grenadines 6,740 52.7 Antigua and Barbuda 13,567 51.6 LATIN AMERICA & CARIBBEAN 8,493 49.3 SOUTH ASIA 1,551 47.3 Colombia 6,045 47.2 SUB-SAHARAN AFRICA 1,592 45.7 El Salvador 4,127 44.5 Guyana 4,137 42.3 Peru 6,030 37.4 Trinidad and Tobago 17,322 37.1 Nicaragua 2,096 36.9 Suriname 8,819 35.4 Guatemala 3,924 34.4 Mexico 9,143 32.5 Jamaica 4,966 29.9 Dominican Republic 6,468 27.1 Ecuador 6,205 27.0 LOW INCOME 626 19.3 Haiti 815 18.4 Argentina 13,467 14.7
Sources: World Bank, World Development Indicators; International Monetary Fund, World Economic Outlook database; and authors’ calculations. Data for Barbados calculated from the 2016 IMF Article IV staff report. Note: Data for 2015 are shown because they provided the broadest comparable dataset. Sample limited to Latin America a n d th e Caribbean and both income and regional aggregates. Countries that correspond to the IDB’s Caribbean Country De p a rtme n t a re listed in red. Regional averages are in blue, and averages for income aggregates are in green. There was a large downward revision to the reported ratio of credit to GDP for The Bahamas in the WDI database in 2019, relative to what had been previously reported.
Policies and exogenous shocks have influenced financial development across countries, but other geographic, demographic, structural, and socio-economic factors have also presented hurdles to financial access and inclusion. High debt levels and substantial government borrowing constrained private credit and financial development in a number of countries. This forced some governments to rely heavily on domestic markets – particularly the banking system – to meet funding needs, which crowded out private financing. Policy failures and inconsistencies have also led to high and volatile inflation, as well as large swings in ether the nominal or real exchange rates for many countries over time, with implications for savings and investment behaviour. Similarly, Caribbean countries tend to be small, open economies, suffering from both climatic and economic vulnerabilities to external shocks, which have also influenced the development of financial sectors in the region. But other factors common to many countries throughout the world have also affected these outcomes, including policies and regulatory issues as well as socio-economic characteristics. Common and Country-Specific Impediments to Broader Inclusion Financial access and inclusion outcomes are closely and inextricably linked to financial development and depth. Shallow and underdeveloped sectors are rarely able to serve the needs of marginal and vulnerable communities. But other factors beyond financial depth and development also affect the ability of poorer people, rural communit ies, small and micro enterprises, or other marginalized and challenged groups to take full advantage of banking and finance. While impediments to financial access and inclusion can vary considerably across countries, and range from policy and regulatory hurdles to geographic and cultural factors, many have emerged as common challenges.
8
FINANCIAL INCLUSION: AN OVERVIEW
Figure 2. Financial Deepening for the C6 Countries (credit to private sector in percent of GDP)
Sources: World Bank, World Development Indicators; International Monetary Fund, World Economic Outlook; and authors’ calculations.
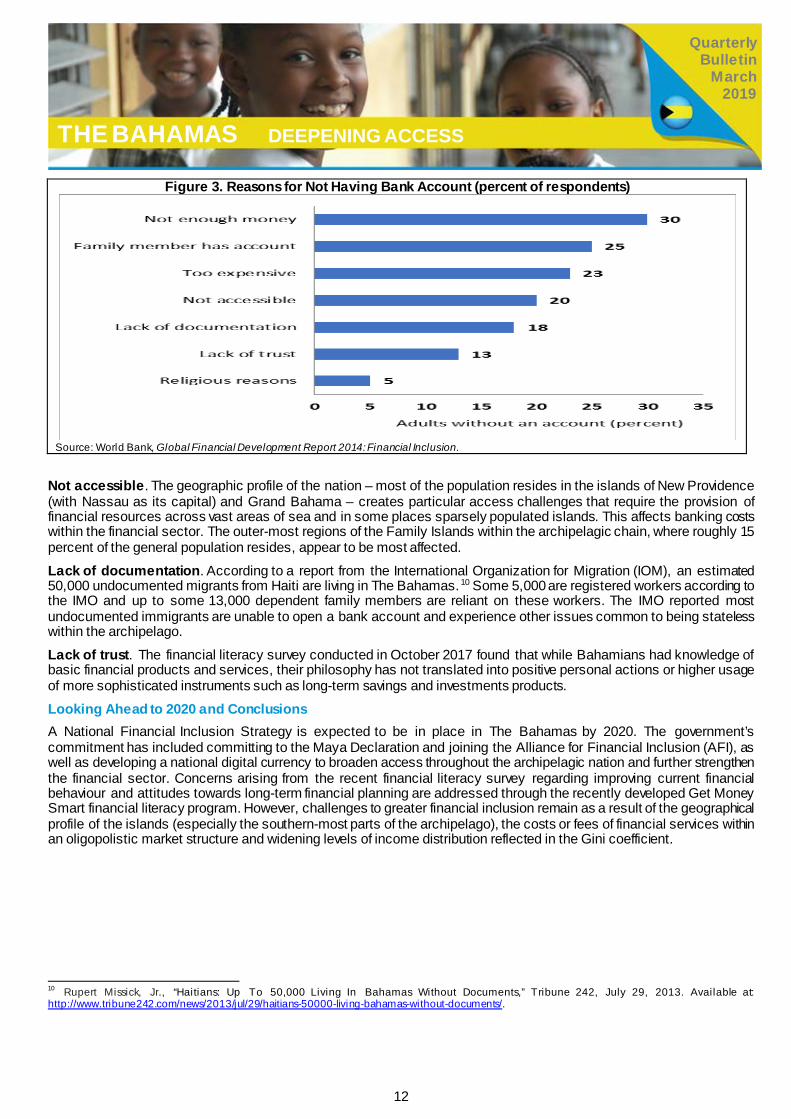
Cross-country evidence. For example, the World Bank’s Global Financial Development Report 2014: Financial Inclusion provided an extensive analysis of financial development, access, and inclusion issues. This analysis identified seven major reasons why people from both developed and developing countries do not own or use formal bank accounts, based on a cross-country survey of 70,000 unbanked individuals across regions. As shown in Figure 3, the survey found that a lack of financial resources (number 1), high costs of opening and maintaining accounts (number 3), lack of accessibility of financial service providers (number 4), and a lack of required documentation (number 5) were among the most common reasons for remaining outside of the formal financial system. Many of the impediments to financial inclusion identified from the cross-country survey are relevant to Caribbean countries.
Figure 3. Reasons for Not Having a Bank Account (percent of respondents)
Source: World Bank, 2014 Global Financial Development Report: Financial Inclusion. Note: Respondents could choose more than one reason.
Country Briefs The country-specific briefs in this Quarterly Bulletin focus on the above-mentioned issues in an effort to go beyond the headline data and examine the key factors that may be holding back financial development, access, and inc lusion in Caribbean countries. The analysis considers a number of related indicators linked to common challenges fac ing small and medium-sized enterprises and individuals in accessing credit and financial services. Related policy init iatives and options are also explored, with a view to highlighting country-specific recommendations with the potential to support broader financial access and inclusion.
5
15
25
35
45
55
65
75
1980
1981
1982
1983
1984
1985
1986
1987
1988
1989
1990
1991
1992
1993
1994
1995
1996
1997
1998
1999
2000
2001
2002
2003
2004
2005
2006
2007
2008
2009
2010
2011
2012
2013
2014
2015
2016
The Bahamas Guyana Jamaica Suriname Trinidad and Tobago Barbados
5
13
18
20
23
25
30
0 5 10 15 20 25 30 35
7. Religious Reasons6. Lack of Trust
5. Lack of Documentation4. Not Accessible3. Too Expensive
2. Family Member has Account1. Not Enough Money
Adults w ithout an account (percent)

9
Quarterly Bulletin
March 2019
THE BAHAMAS DEEPENING ACCESS
Contributor: Allan Wright
Introduction The Bahamas has benefited from a new structural and fiscal culture that has seen reform of public sector financial management and the introduction of cost-cutting measures, along with new fiscal responsibility legislation targeting the budget deficit and gradually reducing the debt burden. Despite the progress, however, concerns remain regarding putting in place measures to enhance private sector competitiveness by lowering the cost of capital and improving access to finance within the archipelagic nation. The promotion of financial deepening, access, and inclusion will help reduce economic bottlenecks slowing private sector growth and help the economy reach higher levels of potential growth. Through the Central Bank of The Bahamas (CBoB), the government has committed to support the development of a National Financial Inclusion Strategy by 2020. Committing to the Maya Declaration and joining the Alliance for Financial Inclusion, along with committing to introduce a digital version of the Bahamian currency by 2020, are all part of current financial deepening efforts. The aim is to broaden levels of access to banking and payments services throughout the country. In addition, the government has started plans to develop a credit bureau by 2020 to help foster trust and accountability between supervised financial institutions and their customers. Through its anti-money laundering/combatting the financing of terrorism guidelines released in the fourth quarter of 2018, the government has developed a simplified due diligence standard for low-risk natural person. Commercial banks have been encouraged to lower account fees for customers with a lower economic profile. It is expected that the adoption of these measures will gradually strengthen the existing financial system and deepen access for residents of the archipelago. This brief will examine results of recent surveys on financial access, develop key inclusion indicators, and show possible impediments to further progress on inclusion within the financial sector. Costs of Finance and Access to Finance – Survey Results
The costs of finance and access to finance are identified as major constraints to private sector productivity and growth. As shown in Figure 1, firms responding to the 2014 PROTEqIN Caribbean Enterprise Survey ranked access to and the costs of finance as among the most significant constraints to firm-level productivity and performance.1 Other challenges identified by survey participants included workforce skills and education, competitor practices, electricity, and the tax administration. Key drivers of these constraints are the level of development of domestic financial markets, and structural factors impeding access to finance and inclusion. The remainder of this brief focuses on factors driving these concerns regarding the costs of finance and access to it, particularly matters that may relate to policies or other institutional issues that can be influenced by public policies or other types of focused reform.
1 Productivity, Technology, and Innovation in the Caribbean (PROTEqIN) is an enterprise and indicator survey first undertaken as part of the World Bank’s 2010 Latin American and Caribbean Enterprise Surveys (LACES). It was last updated in 2014.
Highlights
• The government of The Bahamas has committed to the development of a National Financial Inclusion Strategy by 2020. • The 2018 National Financial Literacy Report (NFLR) shows that the country’s performance levels fall within the ranges
estimated for G20 countries. • The financial literacy campaign, Get Money Smart, developed from the NFLR 2018. Its aim is to improve the financial capability
of all residents of The Bahamas. • Challenges exist as a result of the geographical profile of the islands, the costs of financial services within an oligopolistic
market structure, and differences in levels of income distribution that are widening.

10
Quarterly Bulletin
March 2019
THE BAHAMAS DEEPENING ACCESS
Figure 1. Constraints to Firm Productivity and Performance according to the 2014 PROTEqIN Caribbean Enterprise Survey (number of firms responding)
Source: 2014 PROTEqIN Caribbean Enterprise Survey. Note: Population results based on number of firms sampled in each country. * Individual cost and access to finance indicators were aggregated to produce the result in this bar. The CBoB commissioned a financial survey of a representative sample of the population in October 2017.2 The survey established a framework to promote financial literacy and develop financial benchmarks. The main findings were that literacy performance levels of the archipelagic nation fell within the ranges estimated for G20 countries,1 that is, The Bahamas’ performance was not measured within the outlier range. However, the survey found that existing knowledge of financial products did not translate into positive changes in personal behaviour. There remains scope for further education of Bahamian households on several long-term savings and investments instruments, beyond the standard primary deposit and loan services provided by financial institutions (National Financial Literacy Report 2018). The survey also covered the areas of financial behaviour and attitudes towards longer-term financial planning. Financial behaviour was evenly divided between those who seek to spend now before saving versus those who save first before spending. Most residents expressed concern about finding viable financial options to achieve their long-term goals. Findings regarding the use of financial buffers as a measure of security varied, as some 48 percent of households had up to six months of income saved for emergencies, versus 13 percent that had only one month or less of savings.
2 This survey was administered randomly by telephone to 1,000 residents throughout The Bahamas, with each respondent interviewed for an average of 18.4 minutes. The sample results were then weighted to reflect the demographic distribution of the latest population census. Persons were polled on their knowledge and use of financial products, and their familiarity with certain financial concepts. In l ine with international benchmarking, including features of the approach used by the Organisation for Economic Co-operation and Development, individuals were tested on their understanding of key concepts such as the effect of interest rates and inflation on savings and the purchasing power of money (Central Bank of The Bahamas National Financial Literacy Report 2018) 1 See the “2017 G20/OECD Report on Adult Financial Literacy in G20 Countries.” Available at: http://www.oecd.org/finance/g20-oecd-infe-report-adult-financial-literacy-in-g20-countries.htm.
-
50
100
150
200
250
300
350
400
450
500
Inad
equa
tely
edu
cate
dw
orkf
orce
Acc
ess
to fi
nanc
e (e
.g.
colla
tera
l)
Pra
ctic
es o
f com
petit
ors
Ele
ctric
ity
Tax
adm
inis
tratio
n
Pol
itica
l env
ironm
ent
Labo
r reg
ulat
ions
Tran
spor
tatio
n
Acc
ess
to la
nd fo
rex
pans
ion/
relo
catio
n
Tele
com
mun
icat
ions
Cus
tom
s an
d Tr
ade
regu
latio
ns
Cos
t of f
inan
ce (e
.g.
inte
rest
rate
s)
Bus
ines
s lic
ensi
ng a
ndpe
rmits
Crim
e, th
eft a
nd d
isor
der
Cor
rupt
ion
Mac
roec
onom
icen
viro
nmen
t
Tax
rate
s
Major obstacle Very severe obstacle

11
Quarterly Bulletin
March 2019
THE BAHAMAS DEEPENING ACCESS
The financial literacy campaign, Get Money Smart, 2 was developed from the recent survey. Its aim is to improve the financial capability of all residents of The Bahamas.3 Credit Market Depth The Bahamas’ credit markets are relatively robust and above the level of many regional peers. Figure 2 illustrates that the country’s ratio of domestic private credit to GDP of 54 percent in 2015 was above the regional average for Latin America and the Caribbean (49 percent), and ahead of all other C6 countries except Barbados.4 In this context, the financial sector is relatively well developed and functionally dynamic, and it provides several different types of intermediation, as credit remains strong and on par or above other major financial economies.
Figure 2. Domestic Credit to Private Sector, 2015 (percent of GDP)
Sources: World Bank, World Development Indicators; International Monetary Fund, World Economic Outlook database; and author’s calculations.
Country-Specific Barriers to Access and Inclusion As shown in Figure 3, cross-country surveys have identified seven major challenges to financial access and inclusion: ((1) not enough money, (2) family member has an account, (3) costs of opening and maintaining accounts are too expensive, (4) lack of accessibility, (5) lack of documentation, (6) lack of trust, and (7) religious reasons. A number of these are relevant to Jamaica and are discussed below. Not enough money. The Bahamas is a high-income country,7 and indices of general wealth have remained relatively steady. However, the Gini coefficient of income distribution increased from .44 in 2009 to .46 in 2011 (PAHO Annual report 2012), indicating that the income share of the top 20 percent of the population was about 16 times the share of the bottom 20 percent (IMF Article IV Report 2015). 8 The evidence suggests that inequality among the residents of The Bahamas is a leading factor in financial inequality. Too expensive. The cost of financial services reflected in rising lending rates limits access to credit and strengthens barriers to financial inclusion. Spreads between deposit and lending rates increased by almost 3 percent from 2010 to an estimated level of 10.4 percent in 2018, roughly 2 percent higher than countries in the Latin America and Caribbean region. The oligopolistic nature of the commercial banking market limits price competition within a profitable sector.9 Return on equity (ROE) levels were favourably measured at 6.8 percent in 2017, slightly below the 7.9 percent level at the end of 2016 (Central Bank of The Bahamas 2018 Report).
2 See https://www.getmoneysmartbahamas.com/. 3 The CBoB, in partnership with the Clearing Banks Association, will disseminate information through the media and special events early in 2019. 4 The C6 countries are The Bahamas, Barbados, Guyana, Jamaica, Suriname, and Trinidad and Tobago. 7 Per capita GDP measured at over US$30,500 (IMF Article IV Report 2018). 8 A Gini index coefficient of zero implies perfect income equality, and a coefficient of 100 implies perfect inequality. 9 The definition of an oligopoly is a five-firm concentration ratio of more than 50 percent (this means that the five biggest firms have more than 50 percent of the total market share).
The Bahamas (54)
-
20
40
60
80
100
120
12
Quarterly Bulletin
March 2019
THE BAHAMAS DEEPENING ACCESS
Figure 3. Reasons for Not Having Bank Account (percent of respondents)
Source: World Bank, Global Financial Development Report 2014: Financial Inclusion.
Not accessible. The geographic profile of the nation – most of the population resides in the islands of New Providence (with Nassau as its capital) and Grand Bahama – creates particular access challenges that require the provision of financial resources across vast areas of sea and in some places sparsely populated islands. This affects banking costs within the financial sector. The outer-most regions of the Family Islands within the archipelagic chain, where roughly 15 percent of the general population resides, appear to be most affected. Lack of documentation. According to a report from the International Organization for Migration (IOM), an estimated 50,000 undocumented migrants from Haiti are living in The Bahamas.10 Some 5,000 are registered workers according to the IMO and up to some 13,000 dependent family members are reliant on these workers. The IMO reported most undocumented immigrants are unable to open a bank account and experience other issues common to being stateless within the archipelago. Lack of trust. The financial literacy survey conducted in October 2017 found that while Bahamians had knowledge of basic financial products and services, their philosophy has not translated into positive personal actions or higher usage of more sophisticated instruments such as long-term savings and investments products. Looking Ahead to 2020 and Conclusions A National Financial Inclusion Strategy is expected to be in place in The Bahamas by 2020. The government’s commitment has included committing to the Maya Declaration and joining the Alliance for Financial Inclusion (AFI), as well as developing a national digital currency to broaden access throughout the archipelagic nation and further strengthen the financial sector. Concerns arising from the recent financial literacy survey regarding improving current financial behaviour and attitudes towards long-term financial planning are addressed through the recently developed Get Money Smart financial literacy program. However, challenges to greater financial inclusion remain as a result of the geographical profile of the islands (especially the southern-most parts of the archipelago), the costs or fees of financial services within an oligopolistic market structure and widening levels of income distribution reflected in the Gini coefficient.
10 Rupert Missick, Jr., “Haitians: Up To 50,000 Living In Bahamas Without Documents,” Tribune 242, July 29, 2013. Available at: http://www.tribune242.com/news/2013/jul/29/haitians-50000-living-bahamas-without-documents/.

13
Quarterly Bulletin
March 2019
THAT WAS QUICK
FINANCIAL DEVELOPMENT AND INCLUSION
Quarterly Bulletin
March 2018
Contributor: Laura Giles Álvarez
Introduction Restoring macroeconomic stability and promoting private sector activity will be necessary to facilitate faster and more inclusive development in Barbados. Following years of slow growth, recurring fiscal deficits, and unsustainably high debt levels (over 150 percent of GDP in 2018), the Government of Barbados launched further fiscal and macroeconomic reforms in 2018, known as the Barbados Economic Recovery and Transformation Plan (BERT). BERT will be underpinned by a four-year adjustment program with the International Monetary Fund (IMF). Key pillars of this effort include further fiscal consolidation measures, debt restructuring, economic and growth enhancing reforms. In this context, major challenges include the fact that the business environment remains weak – Barbados ranked 129th out of 190 countries in the World Bank’s 2019 Doing Business Report – and access to finance remains inadequate. This chapter focuses on factors contributing to these challenges, and policies or other interventions that may be warranted to overcome related hurdles. Costs of Finance and Access to Finance – Survey Results
Figure 1. Constraints to Firm Productivity and Performance according to the 2014 PROTEqIN Caribbean Enterprise Survey (number of firms responding)
Source: 2014 PROTEqIN Caribbean Enterprise Survey. Note: Population results based on the number of firms sampled in each country.
Access and cost of finance are identified as key challenges to private sector operations in Barbados. As shown in Figure 1, firms responding to the 2014 PROTEqIN Caribbean Enterprise Survey found the costs of finance and access to financial services to be among the most commonly reported constraints to firm productivity and performance, along with electricity, workforce skills, access to land, taxes, and other factors. 1 This result is reinforced by the World Bank’s 2019 Doing Business Report, which ranks Barbados 144th out of 190 countries on getting credit – well below the average
1 Productivity, Technology, and Innovation in the Caribbean (PROTEqIN) is an enterprise and indicator survey first undertaken as part of the World Bank’s 2010 Latin American and Caribbean Enterprise Surveys (LACES). It was last updated in 2014.
- 100 200 300 400 500 600 700 800 900
1,000
Ele
ctric
ity
Acc
ess
to fi
nanc
e (e
.g.
colla
tera
l)
Inad
equa
tely
edu
cate
dw
orkf
orce
Cos
t of f
inan
ce (e
.g.
inte
rest
rate
s)
Acc
ess
to la
nd fo
rex
pans
ion/
relo
catio
n
Tax
rate
s
Tele
com
mun
icat
ions
Tax
adm
inis
tratio
n
Tran
spor
tatio
n
Cus
tom
s an
d Tr
ade
regu
latio
ns
Pra
ctic
es o
f com
petit
ors
Cor
rupt
ion
Labo
r reg
ulat
ions
Bus
ines
s lic
ensi
ng a
ndpe
rmits
Mac
roec
onom
icen
viro
nmen
t
Pol
itica
l env
ironm
ent
Crim
e, th
eft a
nd d
isor
der
Major obstacle Very severe obstacle
Highlights
• A weak business climate, as well as firms’ cost and access to finance have been identified as key challenges to development in Barbados.
• The macroeconomic and fiscal environment, current bureaucratic processes and some features of the institutional and regulatory framework likely hinder access and increase cost of finance for firms.
• Policy recommendations include supporting faster growth and macroeconomic stability, addressing regulatory and related hurdles, promoting more information on creditworthiness and pursuing a financial inclusion strategy.

14
Quarterly Bulletin
March 2019
THAT WAS QUICK
FINANCIAL DEVELOPMENT AND INCLUSION
Quarterly Bulletin
March 2018
for Latin America and the Caribbean. The remainder of this chapter focuses on factors driving concerns regarding the costs of and access to finance, particularly those that may relate to policies or other institutional issues. Credit Market Depth and Access Credit markets in Barbados are deep relative to regional peers, but relatively underdeveloped when compared to other countries at similar income levels. Figure 2 highlights that Barbados’ ratio of domestic private sector credit to GDP, of about 62 percent in 2015, was higher than the average for Latin American and Caribbean countries (at 49 percent) and all other C6 countries. 2,3 However, this was lower than the averages for high-income and middle-income countries (at 147 percent and 95 percent, respectively). In this context, while Barbados compares favourably with countries in the region, progress is required in order catch up with other countries around the world at similarly levels of per capita income.
Figure 2. Domestic Credit to Private Sector, 2015 (percent of GDP)
Sources: World Bank, World Development Indicators; International Monetary Fund, World Economic Outlook database; and author’s calculations.
Country-Specific Barriers to Financial Access and Inclusion As shown in Figure 3, cross-country surveys have identified seven major challenges to financial access and inclusion: (1) not enough money, (2) family member has an account, (3) costs of opening and maintaining accounts are too expensive, (4) lack of accessibility, (5) lack of documentation, (6) lack of trust, and (7) religious reasons. A number of these are relevant to Barbados and are discussed below.
Figure 3. Reasons for Not Having Bank Account (percent of respondents)
Source: World Bank, Global Financial Development Report 2014: Financial Inclusion.
Not enough money. Lack of wealth and the unavailability of financial resources have been reported as the most significant impediments to financial access and inclusion across surveyed countries in the 2014 World Bank Global 2 Includes funds provided to the private sector by f inancial corporations—for example, loans, purchases of non-equity securities, trade credit, and other accounts receivable establishing a claim. Data for 2015 w ere used as they provided the broadest available cross-country series for comparison. 3 The C6 countries are The Bahamas, Barbados, Guyana, Jamaica, Suriname, and Trinidad and Tobago.
Barbados (62)
-
20
40
60
80
100
120
513
1820
2325
30
0 5 10 15 20 25 30 35Religious reasons
Lack of documentation
Too expensive
Not enough money
Adults w ithout an account (percent)

15
Quarterly Bulletin
March 2019
THAT WAS QUICK
FINANCIAL DEVELOPMENT AND INCLUSION
Quarterly Bulletin
March 2018
Financial Development Report. With per capita GNI of US$15,558 in 2015, Barbados is classified as a high-income economy (the category includes countries with per capita GNI of US$12,056 or more), placing it near the top of the distribution for all countries in Latin America and the Caribbean. Despite a relatively high incidence of poverty (with an individual poverty rate of 25.7 percent in 2016), the country fares well in terms of income distribution. As shown in Figure 4, Barbados’ Gini index of 32 in 2016 compares well relative to other C6 countries, as well as with the Latin American regional average of 48. In this context, unlike many other countries in the region, lack of resources is not likely to be the most significant impediment to financial access and inclusion in Barbados.
Not accessible. Unlike several other countries in the region, physical access to financial services appears to be adequate in Barbados, while burdensome account registration and other bureaucratic processes do seem to pose challenges. Despite having only about 32 percent of its population living in urban areas, the small size of the country (431 km2) means that bank access points are readily available. For example, there were 128 automated bank teller machines (ATMs) per 1,000 km2 in Barbados in 2016, compared to the average of about 54 ATMs per 1,000 km2 for all C6 countries.4 Along with adequate road and transport networks, limit any challenges that might stem from physical access to financial services. However, firms and residents alike report facing burdensome documentation and other administrative requirements for establishing accounts and accessing financial services – for example, “know-your-customer” and disclosure requirements – that can impact costs and limit access to financial services. Lack of trust. The degree to which people have confidence in the financial system has been identified as a key impediment to financial access and inclusion across countries. Barbados has a well-capitalized and liquid financial system, that has remained strong and stable throughout the domestic public debt restructuring. Between 2013 and 2017, total financial system assets grew at a healthy pace, and loan to deposit ratios were buoyant—ranging between 62% and 70%. Financial system liquidity also increased over the period, as measured by the ratio of liquid assets to total assets—reaching 27% in 2016 and 2017. In this context, firms and other knowledgeable market participants are likely to have confidence in the system as a whole. Another factor that is closely associated with trust is the level of financial literacy – that is, knowledge regarding the nature and benefits of the banking system. Some countries have undertaken surveys to assess levels of financial literacy,5 but no in-depth survey-based analysis has been undertaken for Barbados. A useful proxy closely linked to financial literacy is the level of higher education. In this context, Barbados performs well by international standards, ranking 30th out of 138 countries for which data is available with a gross enrolment rate in tertiary education of 65 percent in 2011, and an average of 15.4 years of schooling. This is in line with member countries of the
4 IMF Financial Access Survey, see: http://data.imf.org/?sk=E5DCAB7E-A5CA-4892-A6EA-598B5463A34C 5 For a discussion of financial l iteracy surveys and related methodologies, see http://www.oecd.org/finance/financial-education/2015finlitmeasurementexercise.htm.
Figure 4. Income Inequality, 2013 (Gini coefficient)
Sources: World Bank, World Development Indicators. The value for Barbados is for 2016 from the Barbados Standard of Living Conditions Survey 2016/2017. Note: A Gini index coefficient of zero implies perfect income equality, and a coefficient of 100 implies perfect inequality.
010203040506070
Sw
eden
(25.
1)S
lova
kia
(26)
Rom
ania
(27.
4)G
erm
any
(28.
3)A
ustri
a (2
9.2)
Luxe
mbo
urg
(30.
8)N
ethe
rland
s (3
0.9)
Hun
gary
(31.
2)B
angl
ades
h (3
2.1)
Nep
al (3
2.8)
Mal
i (33
)E
thio
pia
(33.
6)A
zerb
aija
n (3
3.7)
Gre
ece
(34.
3)S
pain
(34.
7)Jo
rdan
(35.
4)G
uine
a-Bi
ssau
(35.
5)U
nite
d Ki
ngdo
m (3
6)C
ambo
dia
(36)
Sri
Lank
a (3
6.4)
Lao
PD
R (3
6.7)
Tanz
ania
(37
.6)
Bhu
tan
(38.
1)B
enin
(38.
6)To
go (3
9.3)
Bur
kina
Fas
o (3
9.8)
Djib
outi
(40)
Nic
arag
ua (4
0.5)
Mor
occo
(40.
9)C
ôte
d'Iv
oire
(41.
5)A
ngol
a (4
2.7)
Phi
lippi
nes
(43)
Mad
agas
car (
44.1
)A
rgen
tina
(44.
5)Ja
mai
ca (4
5.5)
Mal
aysi
a (4
6.2)
Con
go (
47.3
)P
eru
(48.
1)E
cuad
or (4
9.3)
Sao
Tom
e (5
0.8)
Pan
ama
(51.
9)Le
soth
o (5
2.5)
Bra
zil (
54.7
)B
oliv
ia (
56.3
)Za
mbi
a (5
7.5)
Sou
th A
frica
(63
.1)
Sey
chel
les
(65.
8)
Barbados 32

16
Quarterly Bulletin
March 2019
THAT WAS QUICK
FINANCIAL DEVELOPMENT AND INCLUSION
Quarterly Bulletin
March 2018
Organisation for Economic Co-operation and Development (Figure 5). 6 In this context, a lack of trust is not likely to present a major barrier to access or inclusion.
Figure 5. Tertiary Education, 2011 (gross enrolment rate in percent)
Source: World Bank, World Development Indicators.
Conclusions and Areas for Reform Barbados has strong outcomes in many areas related to financial development and inclusion, but also suffers from a number of challenges that could be addressed through policies and reforms. Barbados is a high-income country with a strong and stable banking system, and abundant infrastructure. It also has strong indicators in terms of education linked to financial literacy. However, enterprise surveys as well as other surveys report that the costs of and access to finance remain key impediments to growth and development, suggesting that further efforts are needed to improve conditions and support faster private-sector-led growth. In this context, a number of challenges common to countries across the world have been identified as relevant to Barbados, suggesting that the following policy interventions or other reforms in related areas should be considered, including: • Promoting faster growth and macroeconomic stability. Despite Barbados’ high levels of income and relatively
strong development outcomes when compared to other countries in the region, efforts to ensure that policies are consistent with long-term macroeconomic stability are important for supporting financial sector development and access.
• Regulatory and related hurdles. Market participants report that burdensome administrative and documentary requirements for establishing accounts and undertaking various types of transactions, constitute challenges to financial access and inclusion. Policymakers and regulators should consider ways to reduce related barriers, to the extent that this can be accomplished without compromising prudential and related standards.
• Availability of information regarding credit histories and financial risks. Lack of information regarding credit risks inherent to would-be borrowers has been reported by financial institutions as a significant impediment to credit and other financial transactions. A lack of credit registries or other related institutions in Barbados has likely supported increased borrowing costs and collateral requirements in order to manage uncertainty and risks. In this context, policymakers, regulators, and private sector participants should focus on developing related infrastructure and supporting regulation to help address information gaps, which would support more competitive pricing of services.
• A comprehensive financial inclusion strategy. Many countries in the region and around the world have, with the support and assistance of international development partners, developed comprehensive financial development and inclusion strategies. These strategies tend to focus on a holistic approach to identifying policy failures and infrastructure and institutional gaps, as well as other country-specific barriers to access and inclusion.7 Barbados has yet to initiate such a process but doing so could serve as an important catalyst for progress in related areas.
6 By this measure, Barbados ranks 40th out of 188 countries for expected years of schooling (of children) in 2013. See http://hdr.undp.org/en/content/expected-years-schooling-children-years. 7 For example, see Jamaica’s recently launched Financial Inclusion Strategy, which has been developed and implemented with support from the Inter-American Development Bank. Available at: http://boj.org.jm/pdf/Jamaica_NFIS_Final_Draft.pdf.
0
20
40
60
80
100
Gre
ece
(107
)Fi
nlan
d (9
4.9)
Slov
enia
(85.
9)Sp
ain
(83.
2)Ic
elan
d (8
1.4)
Lith
uani
a (8
0.7)
Aust
ria (7
8.5)
Denm
ark
(76.
7)Ne
ther
lands
(75.
8)Ch
ile (7
4.2)
Swed
en (7
2.8)
Belg
ium
(69.
8)Eu
ro a
rea
(67.
6)Is
rael
(65.
8)Cz
ech
Rep
ublic
(65.
5)Sa
n M
arin
o (6
4.2)
Hung
ary (
62.5
)Ja
pan
(60.
1)Un
ited
King
dom
(59.
4)Fr
ance
(58.
7)Cr
oatia
(57.
2)M
ongo
lia (5
5.6)
Arm
enia
(53.
3)Se
rbia
(51.
5)Le
bano
n (4
9.7)
Iran,
Isla
mic
Rep.
(48.
3)Co
sta R
ica
(47.
1)Ba
hrai
n (4
3.9)
Colom
bia
(43.
5)Pa
nam
a (4
2.1)
Saud
i Ara
bia
(40.
2)M
oldo
va (3
9.4)
Jord
an (3
6.6)
Tuni
sia (3
4.8)
Berm
uda
(31.
1)Ph
ilippi
nes (
30.8
)El
Sal
vado
r (27
.3)
Om
an (2
7)Eg
ypt (
25.8
)Ch
ina (2
5.2)
Viet
nam
(24.
7)Ta
jikist
an (2
2.1)
Cabo
Ver
de (2
0.7)
Azer
baija
n (1
9.6)
Bots
wana
(17.
7)St
. Luc
ia (1
6.3)
Cam
bodi
a (1
5.9)
Sri L
anka
(15.
2)Ne
pal (
14.3
)Ba
nglad
esh
(13.
2)Ca
mer
oon
(12.
3)G
uyan
a (1
1.6)
Gui
nea
(10.
6)Ni
geria
(10.
1)Se
nega
l (9.
7)Co
ngo,
Rep
. (8.
6)Bh
utan
(8.4
)Co
mor
os (8
)Rw
anda
(6.8
)Es
watin
i (6)
Mal
i (5.
4)M
ozam
bique
(4.8
)Ug
anda
(4.3
)M
adag
asca
r (4)
Afgh
anist
an (3
.6)
The
Gam
bia
(3.4
)Se
yche
lles (
2.5)
Nige
r (1.
4)
Barbados: 65.4

17
FINANCIAL DEVELOPMENT AND INCLUSION
Quarterly Bulletin
March 2019
Highlights • The Bank of Guyana launched its National Payment System Development Plan in 2018. It aims to build a robust, safe,
efficient, modern and inclusive payment system. Additionally, the National Payment System Bill was passed in 2018. • The Deposit Insurance Bill was also passed in 2018, partially protecting depositors in cases of financial institution
insolvency.
Contributors: Victor Gauto, Henry Mooney, Elton Bollers
Introduction Progress with economic and financial development in Guyana has been strong in recent years, though challenges remain in terms of broadening access to finance, particularly for the most vulnerable. Guyana has seen strong growth since 2006, with an average annual GDP grow rate of nearly 4 percent per year over the las t 10 years. This is considerably stronger than the less than 1 percent average annual growth rate for C6 countries over the same period, and the Latin American and Caribbean average of 1.8 percent per year.1 The global commodity price boom of the last decade contributed rapid economic growth, given Guyana’s wealth of resources. Economic act ivity and performance become more broad-based in recent years, with the non-mining sector estimated to have grown by 4.3 percent in 2018. The medium-term outlook remains positive, particularly driven by many oil discoveries since 2015, the latest of which was announced in February 2019. In this context, both the public and private sectors have been undertaking activities in anticipation of this new oil and gas windfall, with significant new oil product ion set to start as early as 2020. This should bring considerable benefits to the economy and bolster fiscal revenues. Costs of Finance and Access to Finance – Survey Results
Figure 1. Constraints to Firm Productivity and Performance according to the 2014 PROTEqIN Caribbean Enterprise Survey (number of firms responding)
Source: 2014 PROTEqIN Caribbean Enterprise Survey. Note: Population results based on the number of firms sampled in each country. A lack of access to finance and the high costs of financial services have been identified by many firms as important constraints to private sector productivity and expansion. As shown in Figure 1, the costs of finance and access to finance are considered significant constraints to private sector growth and development by many firms responding to the 2014 PROTEqIN Caribbean Enterprise Survey.2 Electricity, tax rates, customs and trade 1 The C6 countries are The Bahamas, Barbados, Guyana, Jamaica, Suriname, and Trinidad and Tobago. 2 Productivity, Technology, and Innovation in the Caribbean (PROTEqIN) is an enterprise and indicator survey f irst undertaken as part of the World Bank’s 2010 Latin American and Caribbean Enterprise Surveys (LACES). It w as last updated in 2014.
-
50
100
150
200
250
300
350
Ele
ctric
ity
Tax
rate
s
Cus
tom
s an
d Tr
ade
regu
latio
ns
Pol
itica
l env
ironm
ent
Tele
com
mun
icat
ions
Cor
rupt
ion
Mac
roec
onom
ic e
nviro
nmen
t
Crim
e, th
eft a
nd d
isor
der
Cos
t of f
inan
ce (e
.g. i
nter
est
rate
s)
Inad
equa
tely
edu
cate
dw
orkf
orce
Tax
adm
inis
tratio
n
Pra
ctic
es o
f com
petit
ors
Acc
ess
to la
nd fo
rex
pans
ion/
relo
catio
n
Acc
ess
to fi
nanc
e (e
.g.
colla
tera
l)
Bus
ines
s lic
ensi
ng a
nd p
erm
its
Tran
spor
tatio
n
Labo
r reg
ulat
ions
Major obstacle Very severe obstacle

18
Quarterly Bulletin
March 2019
FINANCIAL DEVELOPMENT AND INCLUSION
regulations, and the political environment were also identified as important challenges.3 The remainder of this Brief focuses on factors driving these and related concerns regarding costs and access to finance, particularly those that may relate to policies or other institutional issues that can be influenced by public policies or other focused reforms. Credit Market Depth and Access Despite enviable economic performance, financial depth and development in Guyana has not kept pace with the region’s leaders. Figure 2 shows that Guyana’s ratio of domestic private sector credit to GDP of about 42 percent in 2015 was slightly lower than the average for both Latin American and Caribbean countries (at 49 percent), and also lower than that displayed by all other C6 countries except Jamaica and Suriname.4 Guyana’s private sector c redit to GDP ratio was also lower than the averages for high-income and middle-income countries (at 147 percent and 95 percent, respectively), as well as the average for North America (189 percent), East Asia and the Pacific (149 percent), and the European Union (98 percent).
Figure 2. Domestic Credit to Private Sector, 2015 (percent of GDP)
Sources: World Bank, World Development Indicators; International Monetary Fund, World Economic Outlook database; and author’s calculations. Country-Specific Barriers to Access and Inclusion As shown in Figure 3, cross-country surveys have identified seven major challenges to financial access and inclusion: (1) not enough money, (2) family member has an account, (3) costs of opening and maintaining accounts are too expensive, (4) lack of accessibility, (5) lack of documentation, (6) lack of trust, and (7) religious reasons. A number of these are relevant to Guyana and discussed below.
Figure 3. Reasons for Not Having Bank Account (percent of respondents)
Source: World Bank, Global Financial Development Report 2014: Financial Inclusion.
3 Electricity in Guyana is costly and subject to frequent pow er outages, leading many f irms to purchase or share pow er generators. 4 Credit markets refer to funds to the private sector from financial corporations – for example, loans, non-equity securities, trade credit, and other accounts receivable. Data for 2015 w ere used as they provided the broadest available cross-country series for comparison. Note that private credit to GDP rose to 62 percent in 2017. How ever, this increase does not reflect a signif icant increase in credit from the banking sector, w hich remained at about 36 percent of GDP in 2017, w hich is w ell below the average for the Latin America and Caribbean region of 45 percent in the same year.
Guyana (42)
-
20
40
60
80
100
120

19
Quarterly Bulletin
March 2019
FINANCIAL DEVELOPMENT AND INCLUSION
Not enough money. Despite strong economic performance and abundant natural resources, Guyana remains a lower-middle-income country. This is clearly an issue influencing financial development, access, and inclusion. While somewhat dated, the latest available data from 1998 showed that Guyana had considerable income inequality, with a Gini index coefficient of about 45 (panel 1 in Figure 4), where a coefficient of zero implies perfect income equality, and a coefficient of 100 implies perfect inequality. Similarly, the share of national income held by the richest 20 percent of the population was 50 percent in 1998 (panel 2 in Figure 4). In this context, the latest household budget survey in 2006 indicated that the share of the population living in poverty remained stable at 36 percent between 1999 and 2006 (Guyana Bureau of Statistics). While it is possible that more recent data could shed more light on current conditions, what is clear is that the level of per capita income, its distribution, and poverty levels in Guyana suggest that the most common impediment to financial access and inclusion reported across the world is of consequence for Guyana.
Figure 4. Income Inequality 1. Gini Coefficients, 2013*
2. Income Share Held by Top Quintile (percent average over 2010–2015*)
Sources: United Nations, Human Development Indicators; and World Bank, World Development Indicators. Note: A Gini index coefficient of zero implies perfect income equality, and a coefficient of 100 implies perfect inequality. *The latest available comparable data for Guyana date to 1998. Too expensive. High costs of financial services and the lack of competition for at least some categories of private lending appear to be significant barriers to inclusion. In this context, and as noted above, the cost of finance (e.g. , interest rates) was identified by the PROTEqIN Survey as an important constraint to firm productivity and performance. One related indicator is the spread between deposit and lending rates – that is, wide spreads make borrowing less attractive and/or feasible. In 2016, banks in Guyana had an average interest rate spread of about 12 percent, which was among the highest for all countries assessed (panel 1 in Figure 5). This was also considerably higher than the averages for middle- and low-income countries (6 percent and 8 percent, respectively). Another related indicator is return on equity (ROE) for commercial banks, which is a key measure of profitability. By this measure, Guyana’s banking system appears to be highly profitable, with an average ROE of about 14 percent for 2015, particularly when compared to other countries for which data were available (panel 2 in Figure 5). To put this in context, the average ROE for Caribbean countries was about 10 percent.5
5 This average excludes Haiti in the Caribbean.
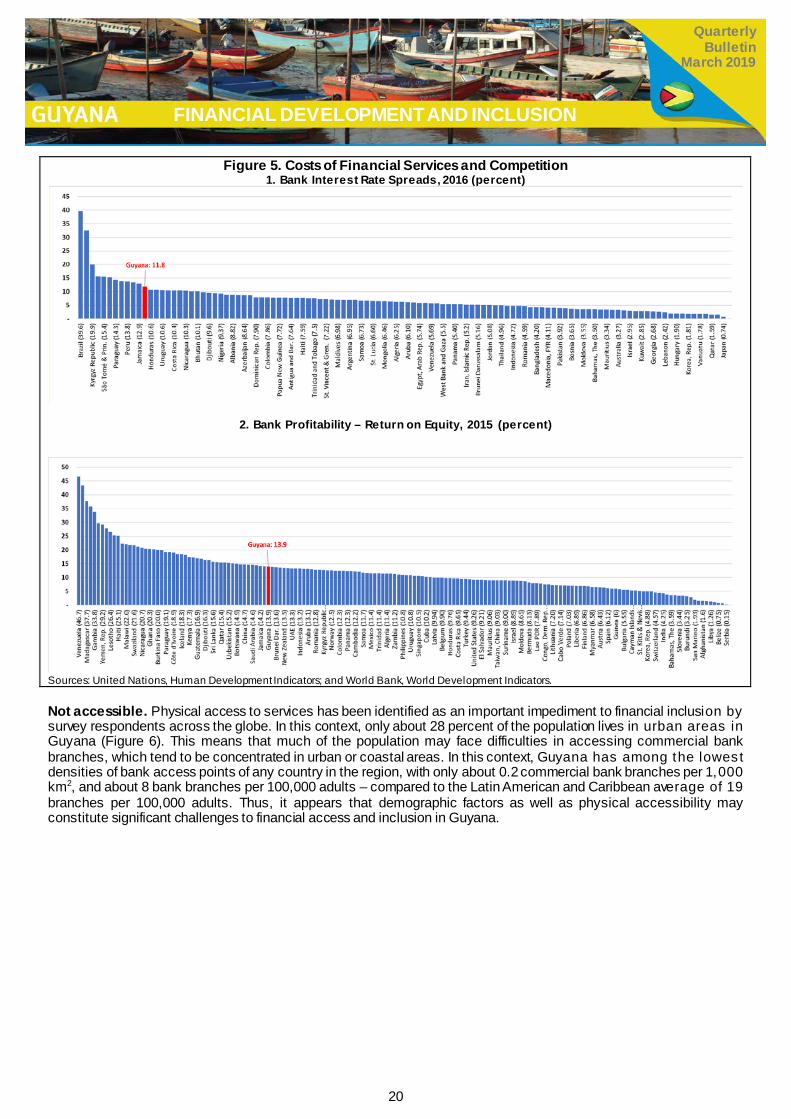
20
Quarterly Bulletin
March 2019
FINANCIAL DEVELOPMENT AND INCLUSION
Not accessible. Physical access to services has been identified as an important impediment to financial inclusion by survey respondents across the globe. In this context, only about 28 percent of the population lives in urban areas in Guyana (Figure 6). This means that much of the population may face difficulties in accessing commercial bank branches, which tend to be concentrated in urban or coastal areas. In this context, Guyana has among the lowest densities of bank access points of any country in the region, with only about 0.2 commercial bank branches per 1,000 km2, and about 8 bank branches per 100,000 adults – compared to the Latin American and Caribbean average of 19 branches per 100,000 adults. Thus, it appears that demographic factors as well as physical accessibility may constitute significant challenges to financial access and inclusion in Guyana.
Figure 5. Costs of Financial Services and Competition 1. Bank Interest Rate Spreads, 2016 (percent)
2. Bank Profitability – Return on Equity, 2015 (percent)
Sources: United Nations, Human Development Indicators; and World Bank, World Development Indicators.
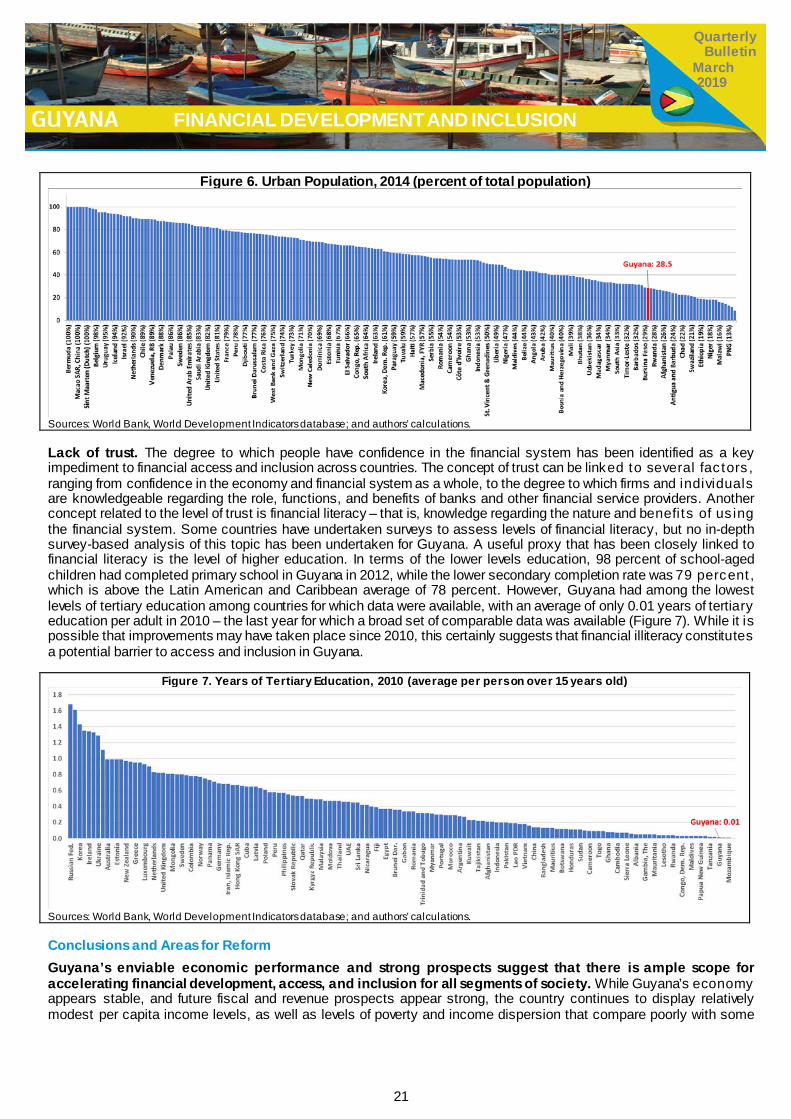
21
Quarterly Bulletin
March 2019
FINANCIAL DEVELOPMENT AND INCLUSION
Figure 6. Urban Population, 2014 (percent of total population)
Sources: World Bank, World Development Indicators database; and authors’ calculations.
Lack of trust. The degree to which people have confidence in the financial system has been identified as a key impediment to financial access and inclusion across countries. The concept of trust can be linked to several fac tors , ranging from confidence in the economy and financial system as a whole, to the degree to which firms and individuals are knowledgeable regarding the role, functions, and benefits of banks and other financial service providers. Another concept related to the level of trust is financial literacy – that is, knowledge regarding the nature and benefits of us ing the financial system. Some countries have undertaken surveys to assess levels of financial literacy, but no in-depth survey-based analysis of this topic has been undertaken for Guyana. A useful proxy that has been closely linked to financial literacy is the level of higher education. In terms of the lower levels education, 98 percent of school-aged children had completed primary school in Guyana in 2012, while the lower secondary completion rate was 79 percent , which is above the Latin American and Caribbean average of 78 percent. However, Guyana had among the lowest levels of tertiary education among countries for which data were available, with an average of only 0.01 years of tertiary education per adult in 2010 – the last year for which a broad set of comparable data was available (Figure 7). While it is possible that improvements may have taken place since 2010, this certainly suggests that financial illiteracy constitutes a potential barrier to access and inclusion in Guyana.
Figure 7. Years of Tertiary Education, 2010 (average per person over 15 years old)
Sources: World Bank, World Development Indicators database; and authors’ calculations. Conclusions and Areas for Reform Guyana’s enviable economic performance and strong prospects suggest that there is ample scope for accelerating financial development, access, and inclusion for all segments of society. While Guyana’s economy appears stable, and future fiscal and revenue prospects appear strong, the country continues to display relatively modest per capita income levels, as well as levels of poverty and income dispersion that compare poorly with some

22
Quarterly Bulletin
March 2019
FINANCIAL DEVELOPMENT AND INCLUSION
peers in the region. Financial market depth, while developing, also displays some scope for improvement. In this context, the government has introduced a plan to develop the national payments system, which wil l guide regulatory and financial infrastructure development. Related efforts may help to address regulatory and other bottlenecks with implications for financial inclusion. Additional reforms aimed at supporting faster financial deepening and a broadening of access to finance would also be desirable, including: • A comprehensive financial inclusion strategy. Many countries in the region and around the world have, with the
support and assistance of international development partners, developed comprehensive financial development and inclusion strategies. These strategies tend to focus on a holistic approach to identifying policy failures, infrastructure and institutional gaps, and other country-specific barriers to access and inclusion.6 Guyana could consider exploring and developing such a strategy, which might serve as an important catalyst for progress in related areas.
• Reducing the costs of finance. As noted above, banks in Guyana are quite profitable and display large loan-to-deposit spreads, particularly when compared with regional and global peers. High interest rates may s tem from a number of factors, including the funding structure of banks and the policies they face, including reserve and other regulatory requirements. It may also relate to the risks inherent to borrowers and their intended uses of funds. Issues such as the availability of information regarding borrower histories and risk profiles are also relevant . While more analysis is required to properly target reforms or policies, efforts undertaken in other countries to improve the availability of credit- and risk-related information have proven helpful, as have efforts to improve the capacity of market participants in developing business plans and lending proposals.
• Increasing physical and virtual access for customers. Given the large proportion of the population living outside urban areas, financial access could be expanded by increasing access points in underserved areas. The expansion of mobile and virtual banking services could help in this regard, supported by national payment system reforms and related regulatory revisions.
• Encouraging competition for banking services. Strong bank profitability may be an indication of a lack of competition in the sector, which would tend to drive down profits as competitors attempt to attract customers. In this context, authorities might consider fostering competition in the sector via regulatory or policy measures (e.g., barriers to bank entry or establishment), to the extent that these would not compromise system integrity and stability. Similarly, and in line with the previous recommendation, efforts to facilitate lower-cost virtual banking services (e.g., mobile banking) could help reduce the costs of financial service provision, as well as encourage the entry of new market participants.
• Enhancing financial literacy. Initiatives aimed at improving financial literacy, particularly for rural or undereducated populations, would encourage the unbanked to seek out traditional banking services, as well as more sophisticated products such as insurance or private pensions. This could be accomplished through targeted information campaigns, or other means of ensuring that underserved segments of the market have the information required to make better use of the system.
6 For example, see Jamaica’s recently launched Financial Inclusion Strategy, w hich has been developed and implemented w ith support from the Inter-American Development Bank. Available at: http://boj.org.jm/pdf/Jamaica_NFIS_Final_Draft.pdf.

23
Quarterly Bulletin
March 2018
THAT WAS QUICK
FINANCIAL DEVELOPMENT AND INCLUSION
Contributor: Henry Mooney
Introduction Despite tremendous progress with economic stabilization and reform, financial development and broader access are needed to accelerate growth in Jamaica. After years of successful reform, Jamaica is set to exit from IMF program support towards the end of 2019. Significant fiscal and economic reforms undertaken over this period have led to unprecedented economic stability, restored fiscal sustainability, and acted as a catalyst for improvements in market conditions and investor sentiment. Despite progress, the private sector reports that it is severely constrained by underdeveloped credit markets, high costs of finance, and a lack of access to funding. In this context, more rapid growth and poverty reduction will require efforts to promote financial deepening, access, and inclusion in Jamaica. Related indicators and impediments are explored below, with a focus on means of improving outcomes. Costs of Finance and Access to Finance – Survey Results The costs of finance and access to finance are identified as major constraints to private sector productivity and growth. As shown in Figure 1, firms responding to the 2014 PROTEqIN Caribbean Enterprise Survey ranked these two factors as among the most significant constraints on firm-level productivity and performance.1 Key drivers of these constraints are the level of development of domestic financial markets, and structural factors impeding access to finance and inclusion. Other challenges identified by survey participants include tax rates, competitor practices, crime and disorder, and corruption. The remainder of this brief focuses on factors driving these concerns regarding the costs and access to finance, particularly those that may relate to policies or other institutional issues that can be influenced by public policies or other types of focused reform.
Figure 1. Constraints on Firm Productivity and Performance 2014 PROTEqIN Caribbean Enterprise Survey (number of firms responding)
Source: 2014 PROTEqIN Caribbean Enterprise Survey. Note: Population results based on the number of firms sampled in each country.
1 Productivity, Technology, and Innovation in the Caribbean (PROTEqIN) is an enterprise and indicator survey first undertaken as part of the World Bank’s 2010 Latin American and Caribbean Enterprise Surveys (LACES). It was last updated in 2014.
-
500
1,000
1,500
2,000
2,500
3,000
Tax
rate
s
Pra
ctic
es o
f com
petit
ors
Crim
e, th
eft a
nd d
isor
der
Cos
t of f
inan
ce (e
.g.
inte
rest
rate
s)
Tax
adm
inis
tratio
n
Acc
ess
to fi
nanc
e (e
.g.
colla
tera
l)
Cor
rupt
ion
Ele
ctric
ity
Inad
equa
tely
edu
cate
dw
orkf
orce
Bus
ines
s lic
ensi
ng a
ndpe
rmits
Acc
ess
to la
nd fo
rex
pans
ion/
relo
catio
n
Tran
spor
tatio
n
Cus
tom
s an
d Tr
ade
regu
latio
ns
Pol
itica
l env
ironm
ent
Mac
roec
onom
icen
viro
nmen
t
Labo
r reg
ulat
ions
Tele
com
mun
icat
ions
Major obstacle Very severe obstacle
Highlights • Firms in Jamaica recently reported a lack of access to finance and high costs of funding to be among the most
significant barriers that they face to growth and productivity, along with other factors such as high taxes and crime. • Despite tremendous progress with economic and institutional reform, credit and financial markets in Jamaica remain
underdeveloped, and further efforts are needed to improve financial access and inclusion. • The government has introduced a national financial inclusion strategy to help address barriers, which include policy,
regulatory, and structural impediments to greater financial access, particularly among marginalized groups and micro-, small-, and medium-sized enterprises (MSMEs).
• This brief considers cross-country evidence regarding barriers to inclusion, and identifies several that are significant to Jamaica, including income disparities, bank competition, physical access, and financial literacy.
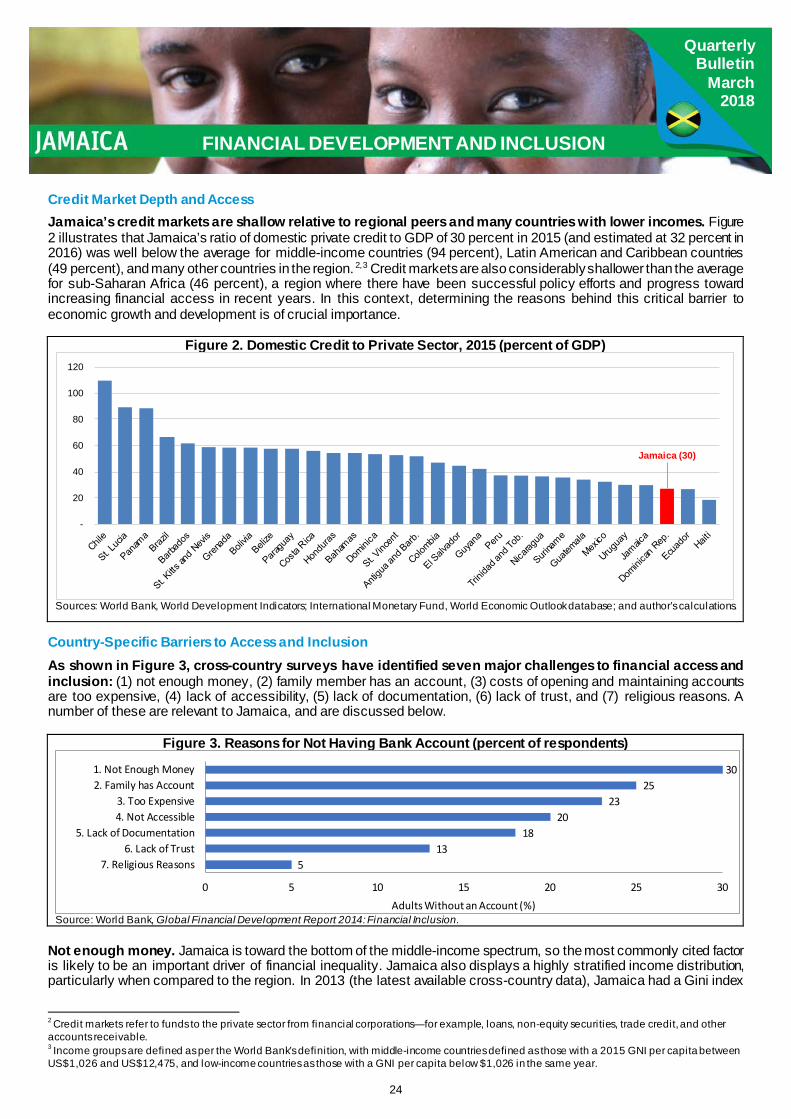
24
Quarterly Bulletin
March 2018
THAT WAS QUICK
FINANCIAL DEVELOPMENT AND INCLUSION
Credit Market Depth and Access Jamaica’s credit markets are shallow relative to regional peers and many countries with lower incomes. Figure 2 illustrates that Jamaica’s ratio of domestic private credit to GDP of 30 percent in 2015 (and estimated at 32 percent in 2016) was well below the average for middle-income countries (94 percent), Latin American and Caribbean countries (49 percent), and many other countries in the region. 2,3 Credit markets are also considerably shallower than the average for sub-Saharan Africa (46 percent), a region where there have been successful policy efforts and progress toward increasing financial access in recent years. In this context, determining the reasons behind this critical barrier to economic growth and development is of crucial importance.
Figure 2. Domestic Credit to Private Sector, 2015 (percent of GDP)
Sources: World Bank, World Development Indicators; International Monetary Fund, World Economic Outlook database; and author’s calculations.
Country-Specific Barriers to Access and Inclusion As shown in Figure 3, cross-country surveys have identified seven major challenges to financial access and inclusion: (1) not enough money, (2) family member has an account, (3) costs of opening and maintaining accounts are too expensive, (4) lack of accessibility, (5) lack of documentation, (6) lack of trust, and (7) religious reasons. A number of these are relevant to Jamaica, and are discussed below.
Figure 3. Reasons for Not Having Bank Account (percent of respondents)
Source: World Bank, Global Financial Development Report 2014: Financial Inclusion.
Not enough money. Jamaica is toward the bottom of the middle-income spectrum, so the most commonly cited factor is likely to be an important driver of financial inequality. Jamaica also displays a highly stratified income distribution, particularly when compared to the region. In 2013 (the latest available cross-country data), Jamaica had a Gini index
2 Credit markets refer to funds to the private sector from financial corporations—for example, loans, non-equity securities, trade credit, and other accounts receivable. 3 Income groups are defined as per the World Bank’s definition, with middle-income countries defined as those with a 2015 GNI per capita between US$1,026 and US$12,475, and low-income countries as those with a GNI per capita below $1,026 in the same year.
Jamaica (30)
-
20
40
60
80
100
120
513
1820
2325
30
0 5 10 15 20 25 30
7. Religious Reasons6. Lack of Trust
5. Lack of Documentation4. Not Accessible3. Too Expensive
2. Family has Account1. Not Enough Money
Adults Without an Account (%)
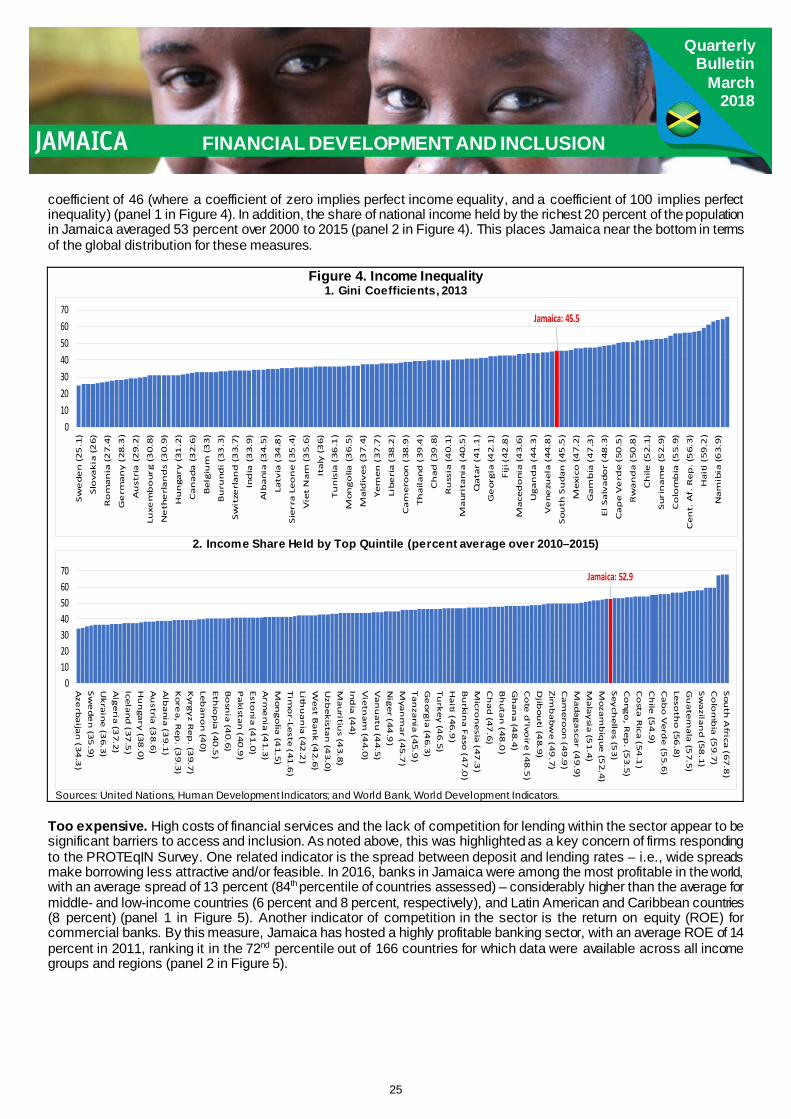
25
Quarterly Bulletin
March 2018
THAT WAS QUICK
FINANCIAL DEVELOPMENT AND INCLUSION
coefficient of 46 (where a coefficient of zero implies perfect income equality, and a coefficient of 100 implies perfect inequality) (panel 1 in Figure 4). In addition, the share of national income held by the richest 20 percent of the population in Jamaica averaged 53 percent over 2000 to 2015 (panel 2 in Figure 4). This places Jamaica near the bottom in terms of the global distribution for these measures.
Figure 4. Income Inequality 1. Gini Coefficients, 2013
2. Income Share Held by Top Quintile (percent average over 2010–2015)
Sources: United Nations, Human Development Indicators; and World Bank, World Development Indicators.
Too expensive. High costs of financial services and the lack of competition for lending within the sector appear to be significant barriers to access and inclusion. As noted above, this was highlighted as a key concern of firms responding to the PROTEqIN Survey. One related indicator is the spread between deposit and lending rates – i.e., wide spreads make borrowing less attractive and/or feasible. In 2016, banks in Jamaica were among the most profitable in the world, with an average spread of 13 percent (84th percentile of countries assessed) – considerably higher than the average for middle- and low-income countries (6 percent and 8 percent, respectively), and Latin American and Caribbean countries (8 percent) (panel 1 in Figure 5). Another indicator of competition in the sector is the return on equity (ROE) for commercial banks. By this measure, Jamaica has hosted a highly profitable banking sector, with an average ROE of 14 percent in 2011, ranking it in the 72nd percentile out of 166 countries for which data were available across all income groups and regions (panel 2 in Figure 5).
Jamaica: 45.5
010203040506070
Sw
ed
en
(2
5.1
)
Slo
vak
ia (
26
)
Ro
ma
nia
(2
7.4
)
Ge
rma
ny
(2
8.3
)
Au
stri
a (
29
.2)
Luxe
mb
ou
rg (
30
.8)
Ne
the
rla
nd
s (3
0.9
)
Hu
nga
ry (
31
.2)
Ca
na
da
(3
2.6
)
Be
lgiu
m (
33
)
Bu
run
di
(33
.3)
Sw
itze
rla
nd
(3
3.7
)
Ind
ia (
33
.9)
Alb
an
ia (
34
.5)
Latv
ia (
34
.8)
Sie
rra
Le
on
e (
35
.4)
Vie
t N
am
(3
5.6
)
Ita
ly (
36
)
Tu
nis
ia (
36
.1)
Mo
ng
olia
(3
6.5
)
Ma
ldiv
es
(37
.4)
Ye
me
n (
37
.7)
Lib
eri
a (
38
.2)
Ca
me
roo
n (
38
.9)
Th
ail
an
d (
39
.4)
Ch
ad
(3
9.8
)
Ru
ssia
(4
0.1
)
Ma
uri
tan
ia (
40
.5)
Qa
tar
(41
.1)
Ge
org
ia (
42
.1)
Fij
i (4
2.8
)
Ma
ced
on
ia (
43
.6)
Ug
an
da
(4
4.3
)
Ve
ne
zue
la (
44
.8)
So
uth
Su
da
n (
45
.5)
Me
xico
(4
7.2
)
Ga
mb
ia (
47
.3)
El
Sa
lva
do
r (4
8.3
)
Ca
pe
Ve
rde
(5
0.5
)
Rw
an
da
(5
0.8
)
Ch
ile (
52
.1)
Su
rin
am
e (
52
.9)
Co
lom
bia
(5
5.9
)
Ce
nt.
Af.
Re
p.
(56
.3)
Ha
iti
(59
.2)
Na
mib
ia (
63
.9)
Jamaica: 52.9
010203040506070
Aze
rba
ijan
(34
.3)
Sw
ed
en
(35
.9)
Uk
rain
e (3
6.3
)A
lge
ria (3
7.2
)Ice
lan
d (3
7.5
)H
un
gary (3
8.0
)A
ustria
(38
.6)
Alb
an
ia (3
9.1
)K
ore
a, R
ep
. (39
.3)
Kyrg
yz R
ep
. (39
.7)
Leb
an
on
(40
)E
thio
pia
(40
.5)
Bo
snia
(40
.6)
Pa
kistan
(40
.9)
Esto
nia
(41
.0)
Arm
en
ia (4
1.3
)M
on
go
lia (4
1.5
)T
imo
r-Leste
(41
.6)
Lithu
an
ia (4
2.2
)W
est B
an
k (4
2.6
)U
zbe
kista
n (4
3.0
)M
au
ritius (4
3.8
)In
dia
(44
)V
ietn
am
(44
.0)
Va
nu
atu
(44
.5)
Nig
er (4
4.9
)M
yan
ma
r (45
.7)
Ta
nza
nia
(45
.9)
Ge
org
ia (4
6.3
)T
urk
ey
(46
.5)
Ha
iti (46
.9)
Bu
rkina
Fa
so (4
7.0
)M
icron
esia
(47
.3)
Ch
ad
(47
.6)
Bh
uta
n (4
8.0
)G
ha
na
(48
.4)
Co
te d
'Ivoire
(48
.5)
Djib
ou
ti (48
.9)
Zim
ba
bw
e (4
9.7
)C
am
ero
on
(49
.9)
Ma
da
ga
scar (4
9.9
)M
ala
ysia
(51
.4)
Mo
zam
biq
ue
(52
.4)
Se
ych
elle
s (53
)C
on
go
, Re
p. (5
3.5
)C
osta
Rica
(54
.1)
Ch
ile (5
4.9
)C
ab
o V
erd
e (5
5.6
)Le
soth
o (5
6.8
)G
ua
tem
ala
(57
.5)
Sw
azila
nd
(58
.1)
Co
lom
bia
(59
.7)
So
uth
Africa
(67
.8)

26
Quarterly Bulletin
March 2018
THAT WAS QUICK
FINANCIAL DEVELOPMENT AND INCLUSION
Figure 5. Costs of Financial Services and Competition 1. Bank Interest Rate Spreads, 2016 (percent)
2. Bank Profitability – Return on Equity, 2015 (percent)
Sources: World Bank, World Development Indicators and Financial Development and Structure databases.
Not accessible. Access to services is a challenge relevant to Jamaica. In this context, only about 55 percent of the population resides in urban areas, where access points (e.g., bank branches) tend to be most concentrated (Figure 6).
Figure 6. Urban Population, 2016 (percent of total population)
Sources: World Bank, World Development Indicators database; and author’s calculations.
Lack of trust. A factor closely associated with trust is the level of financial literacy – that is, knowledge regarding the nature and benefits of using the financial system. Some countries have undertaken surveys to assess levels of financial literacy, but no such comprehensive analysis has been undertaken for Jamaica. An indicator that has been closely
Jamaica: 12.9
-
5
10
15
20
25
30
35
40
Braz
il (39
.6)
Kyrg
yz R
ep. (
19.9
)Sa
o To
me
(15.
4)Pa
ragu
ay (1
4.3)
Peru
(13.
8)Ja
mai
ca (1
2.9)
Hond
uras
(10.
6)Ur
ugua
y (10
.6)
Costa
Rica
(10.
4)Ni
cara
gua (
10.3
)Bh
utan
(10.
1)Dj
ibou
ti (9
.6)
Nige
ria (9
.37)
Alba
nia (
8.82
)Az
erba
ijan
(8.6
4)Do
m. R
ep. (
7.90
)Co
lom
bia
(7.8
6)Pa
pua N
G (7
.72)
Antig
ua (7
.64)
Haiti
(7.5
9)Tr
in. a
nd To
b. (7
.5)
St. V
ince
nt (
7.22
)M
aldive
s (6.
98)
Arge
ntin
a (6.
95)
Sam
oa (6
.73)
St. L
ucia
(6.6
0)M
ongo
lia (6
.46)
Alge
ria (6
.25)
Arub
a (6.
10)
Egyp
t (5.
74)
Vene
zuel
a (5.
69)
Wes
t Ban
k (5.
5)Pa
nam
a (5.
40)
Iran
(5.2
)Br
unei
(5.1
6)Jo
rdan
(5.0
8)Th
ailan
d (4
.96)
Indo
nesia
(4.7
2)Ro
man
ia (4
.59)
Bang
lades
h (4
.20)
Mac
edon
ia (4
.11)
Pakis
tan
(3.9
2)Bo
snia
(3.6
5)M
oldo
va (3
.55)
Baha
mas
(3.5
0)M
aurit
ius (
3.34
)Au
stra
lia (3
.27)
Israe
l (2.
95)
Kuw
ait (2
.85)
Geor
gia (
2.68
)Le
bano
n (2
.42)
Hung
ary (
1.90
)Ko
rea,
Rep.
(1.8
1)Va
nuat
u (1
.78)
Qata
r (1.
59)
Japa
n (0
.74)
Jamaica: 14.2
-
5
10
15
20
25
30
35
40
45
50
Vene
zuel
a (4
6.7)
Mad
agas
car (
37.7
)Ga
mbi
a, T
he (3
3.8)
Yem
en, R
ep. (
29.2
)Le
soth
o (2
6.4)
Haiti
(25.
1)M
alaw
i (22
.0)
Swaz
iland
(21.
6)Ni
cara
gua
(20.
7)Gh
ana
(20.
3)Bu
rkin
a Fa
so (2
0.0)
Para
guay
(19.
1)Co
te d
'Ivoi
re (1
8.9)
Icel
and
(18.
3)Ke
nya
(17.
3)Gu
atem
ala
(16.
9)Dj
ibou
ti (1
6.3)
Sri L
anka
(15.
6)Q
atar
(15.
4)Uz
beki
stan
(15.
2)Bo
tsw
ana
(14.
9)Ch
ina
(14.
7)Sa
udi A
rabi
a (1
4.6)
Jam
aica
(14.
2)Gu
yana
(13.
9)Br
unei
(13.
6)Ne
w Z
e. (1
3.5)
UAE
(13.
3)In
done
sia (1
3.2)
Arub
a (1
3.1)
Rom
ania
(12.
8)Ky
rgyz
Rep
. (12
.7)
Norw
ay (1
2.5)
Colo
mbi
a (1
2.3)
Pana
ma
(12.
3)Ca
mbo
dia
(12.
2)Sa
moa
(11.
7)M
exic
o (1
1.4)
Trin
idad
(11.
4)Al
geria
(11.
4)Za
mbi
a (1
1.2)
Phili
ppin
es (1
0.8)
Urug
uay
(10.
8)Si
ngap
ore
(10.
5)Cu
ba (1
0.2)
Latv
ia (9
.94)
Belg
ium
(9.9
0)Ho
ndur
as (9
.76)
Cost
a Ri
ca (9
.65)
Turk
ey (9
.44)
USA
(9.2
6)El
Sal
vado
r (9.
21)
Mau
ritiu
s (9.
06)
Taiw
an C
h. (9
.03)
Surin
ame
(9.0
0)Isr
ael (
8.89
)M
oldo
va (8
.65)
Berm
uda
(8.1
3)La
o PD
R (7
.89)
Cong
o DR
(7.5
)Li
thua
nia
(7.2
0)Ca
bo V
erde
(7.1
4)Po
land
(7.0
3)Li
beria
(6.8
9)Fi
nlan
d (6
.86)
Mya
nmar
(6.5
8)Au
stria
(6.4
3)Sp
ain
(6.1
2)Gu
inea
(6)
Bulg
aria
(5.5
5)Ca
yman
Is. (
5.37
)St
. Kitt
s (4
.96)
Kore
a, R
ep. (
4.88
)Sw
itzer
land
(4.5
7)In
dia
(4.2
5)Ba
ham
as (3
.59)
Slov
enia
(3.4
4)Bu
rund
i (3.
25)
San
Mar
ino
(1.9
3)Af
ghan
istan
(1.6
)Li
bya
(1.2
6)Be
lize
(0.7
5)Se
rbia
(0.1
5)
Jamaica: 54.6
0
10
20
30
40
50
60
70
80
90
100
Berm
uda
(100
%)
Mac
ao Ch
. (10
0%)
St. M
aarte
n (1
00%
)Be
lgium
(98%
)Ur
ugua
y (9
5%)
Icelan
d (9
4%)
Israe
l (92%
)Ne
ther
land
s (90
%)Ch
ile (8
9%)
Vene
zuela
(89%
)De
nmar
k (8
8%)
Pala
u (86
%)
Swed
en (8
6%)
UAE
(85%
)Sa
udi A
rabi
a (83
%)UK
(82%
)US
A (8
1%)
Fran
ce (7
9%)
Peru
(78%
)Dj
ibou
ti (7
7%)
Brun
ei (7
7%)
Costa
Rica
(76%
)W
est B
ank (
75%
)Sw
itzer
land
(74%
)Tu
rkey
(73%
)M
ongo
lia (7
1%)
N. Ca
ledon
ia (7
0%)
Dom
inica
(69%
)Es
toni
a (68
%)Tu
nisia
(67%
)El
Salva
dor (
66%)
Cong
o Re
p. (6
5%)
Sout
h Afri
ca (6
4%)
Irela
nd (6
3%)
Kore
a DR
(61%
)Pa
ragu
ay (5
9%)
Tuva
lu (5
9%)
Haiti
(57%
)M
aced
onia
(57%
)Se
rbia
(55%
)Ro
man
ia (5
4%)
Cam
eroo
n (54
%)
Cote
d'Iv
oire (
53%
)Gh
ana (
53%
)In
done
sia (5
3%)
St. V
incen
t (5
0%)
Liber
ia (4
9%)
Nige
ria (4
7%)
Mal
dives
(44%
)Be
lize
(44%
)An
gola
(43%
)Ar
uba (
42%)
Mau
ritius
(40%
)Bo
snia
(40%
)M
ali (3
9%)
Bhut
an (3
8%)
Uzbe
kista
n (36
%)M
adag
asca
r (34
%)M
yanm
ar (3
4%)
Sout
h Asia
(33%
)Tim
or-Le
ste (
32%)
Barb
ados
(32%
)Bu
rkin
a Fas
o (2
9%)
Rwan
da (2
8%)
Afgh
anist
an (2
6%)
Antig
ua (2
4%)
Chad
(22%
)Sw
azila
nd (2
1%)
Ethi
opia
(19%
)Ni
ger (
18%)
Mal
awi (1
6%)
PNG
(13%
)
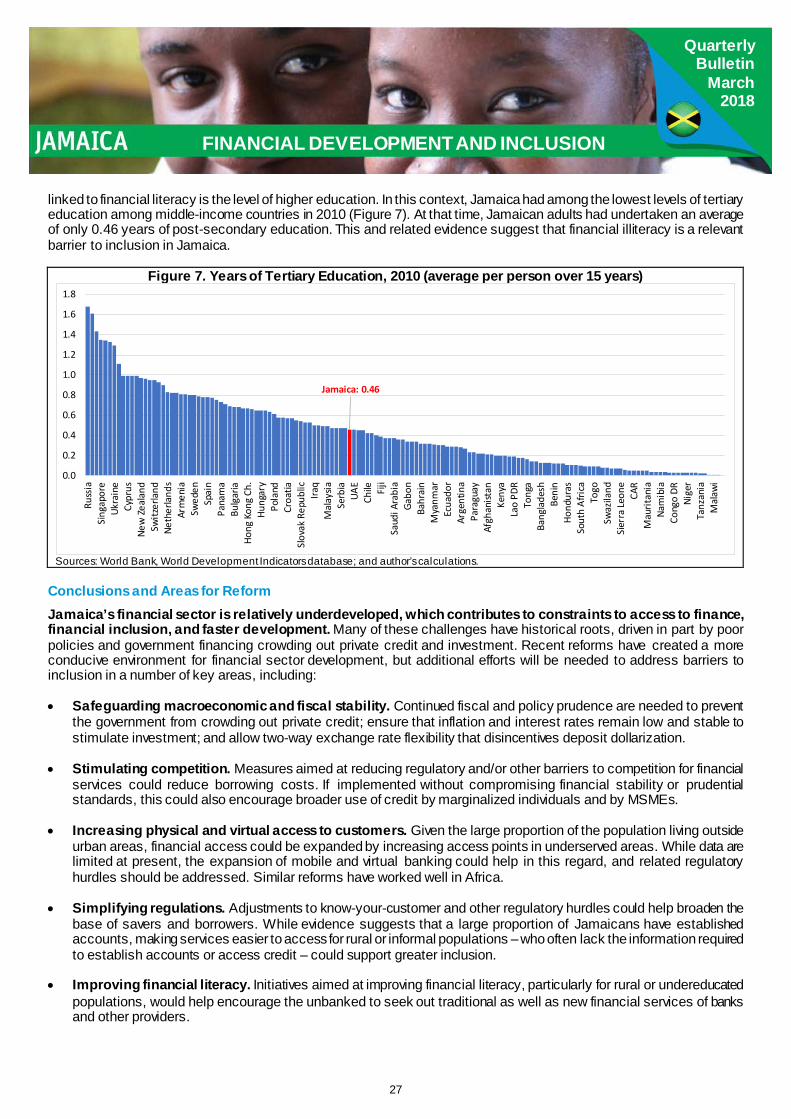
27
Quarterly Bulletin
March 2018
THAT WAS QUICK
FINANCIAL DEVELOPMENT AND INCLUSION
linked to financial literacy is the level of higher education. In this context, Jamaica had among the lowest levels of tertiary education among middle-income countries in 2010 (Figure 7). At that time, Jamaican adults had undertaken an average of only 0.46 years of post-secondary education. This and related evidence suggest that financial illiteracy is a relevant barrier to inclusion in Jamaica.
Figure 7. Years of Tertiary Education, 2010 (average per person over 15 years)
Sources: World Bank, World Development Indicators database; and author’s calculations.
Conclusions and Areas for Reform Jamaica’s financial sector is relatively underdeveloped, which contributes to constraints to access to finance, financial inclusion, and faster development. Many of these challenges have historical roots, driven in part by poor policies and government financing crowding out private credit and investment. Recent reforms have created a more conducive environment for financial sector development, but additional efforts will be needed to address barriers to inclusion in a number of key areas, including: • Safeguarding macroeconomic and fiscal stability. Continued fiscal and policy prudence are needed to prevent
the government from crowding out private credit; ensure that inflation and interest rates remain low and stable to stimulate investment; and allow two-way exchange rate flexibility that disincentives deposit dollarization.
• Stimulating competition. Measures aimed at reducing regulatory and/or other barriers to competition for financial
services could reduce borrowing costs. If implemented without compromising financial stability or prudential standards, this could also encourage broader use of credit by marginalized individuals and by MSMEs.
• Increasing physical and virtual access to customers. Given the large proportion of the population living outside urban areas, financial access could be expanded by increasing access points in underserved areas. While data are limited at present, the expansion of mobile and virtual banking could help in this regard, and related regulatory hurdles should be addressed. Similar reforms have worked well in Africa.
• Simplifying regulations. Adjustments to know-your-customer and other regulatory hurdles could help broaden the base of savers and borrowers. While evidence suggests that a large proportion of Jamaicans have established accounts, making services easier to access for rural or informal populations – who often lack the information required to establish accounts or access credit – could support greater inclusion.
• Improving financial literacy. Initiatives aimed at improving financial literacy, particularly for rural or undereducated
populations, would help encourage the unbanked to seek out traditional as well as new financial services of banks and other providers.
Jamaica: 0.46
0.0
0.2
0.4
0.6
0.8
1.0
1.2
1.4
1.6
1.8
Russ
iaSi
ngap
ore
Ukra
ine
Cypr
usNe
w Z
eala
ndSw
itzer
land
Neth
erla
nds
Arm
enia
Swed
enSp
ain
Pana
ma
Bulg
aria
Hong
Kon
g Ch
.Hu
ngar
yPo
land
Croa
tiaSl
ovak
Rep
ublic
Iraq
Mal
aysia
Serb
iaUA
ECh
ile Fiji
Saud
i Ara
bia
Gabo
nBa
hrai
nM
yanm
arEc
uado
rAr
gent
ina
Para
guay
Afgh
anist
anKe
nya
Lao
PDR
Tong
aBa
ngla
desh
Beni
nHo
ndur
asSo
uth
Afric
aTo
goSw
azila
ndSi
erra
Leon
eCA
RM
aurit
ania
Nam
ibia
Cong
o DR
Nige
rTa
nzan
iaM
alaw
i

28
Quarterly Bulletin
March 2019
FINANCIAL INCLUSION
Contributor: Jeetendra Khadan
Introduction Strengthening financial inclusion can support economic growth and development. Financial inclusion relates to the ease of access to, and the availability and usage of, the formal financial system by economic agents of an economy. There is growing evidence that suggests that higher levels of financial inclusion are associated with better social and economic outcomes such as lower income inequality, lower poverty, and higher economic growth. In this context, this section examines financial inclusion as it relates to the depth of the financial system and access to financing, and explores various indicators to identify the main barriers to access and inclusion with a focus on improving outcomes in Suriname. Costs of Finance and Access to Finance – Survey Results Access to finance and the costs of obtaining it are identified as major constraints to private sector productivity and growth. As shown in Figure 1, firms responding to the 2014 PROTEqIN Caribbean Enterprise Survey ranked the costs of finance and access to finance as among the most significant constraints on firm-level productivity and performance.1 Key drivers of these constraints include the level of development of domestic financial markets, and structural factors that impede access to finance and inclusion. Other challenges identified by survey participants include access to land for expansion and relocation, workforce education, corruption, competitor practices, and the political environment. The remainder of this chapter focuses on factors driving these concerns regarding the costs of and access to finance, particularly those that may relate to policies or other institutional issues that can be influenced by public policies or other types of focused reform.
Figure 1. Constraints on Firm Productivity and Performance according to the 2014 PROTEqIN Caribbean Enterprise Survey (number of firms responding)
Source: 2014 PROTEqIN Caribbean Enterprise Survey. Note: Population results based on the number of firms sampled in each country.
1 Productivity, Technology, and Innovation in the Caribbean (PROTEqIN) is an enterprise and indicator survey first undertaken as part of the World Bank’s 2010 Latin American and Caribbean Enterprise Surveys (LACES). It was last updated in 2014.
-
20
40
60
80
100
120
Acc
ess
to la
nd fo
rex
pans
ion/
relo
c.
Cos
t of f
inan
ce (e
.g.
inte
rest
rate
s)
Inad
equa
tely
educ
ated
wor
kfor
ce
Cor
rupt
ion
Acc
ess
to fi
nanc
e(e
.g. c
olla
tera
l)
Pra
ctic
es o
fco
mpe
titor
s
Pol
itica
l env
ironm
ent
Ele
ctric
ity
Tax
rate
s
Mac
roec
onom
icen
viro
nmen
t
Bus
ines
s lic
ensi
ngan
d pe
rmits
Cus
tom
s an
d Tr
ade
regu
latio
ns
Crim
e, th
eft a
nddi
sord
er
Tele
com
mun
icat
ions
Tran
spor
tatio
n
Tax
adm
inis
tratio
n
Labo
r reg
ulat
ions
Major obstacle Very severe obstacle
Highlights • Access to finance and the costs of obtaining it are identified as major constraints to private sector productivity and growth. • Suriname’s credit markets are relatively shallow compared to other countries in Latin America and the Caribbean. • The cost of financial services and limited competition for private lending can impede financial inclusion. • Tackling underlying challenges related to income inequality, poverty, accessibility constraints, credit bureaus and promoting
financial literacy could help to improve financial access and use in Suriname.

29
Quarterly Bulletin
March 2019
FINANCIAL INCLUSION
Credit Market Depth and Access Suriname’s credit markets are relatively shallow compared to other countries in Latin America and the Caribbean. A typical indicator for financial sector development is depth, which can be measured by the proportion of domestic private sector credit by banks to GDP. Comparable data for 2015 indicate that Suriname’s private sector credit ratio was 35 percent of GDP, which was lower than the average of 49.1 percent of GDP for Latin America and the Caribbean (Figure 2). It is important to note that this ratio has been steadily increasing during the past 10 years, from 24 percent of GDP in 2008. Nevertheless, the data on financial depth show that there are opportunities for the country’s financial sector to grow and space for the authorities to create incentives and regulations to increase its size.
Figure 2. Domestic Credit to Private Sector, 2015 (percent of GDP)
Sources: World Bank, World Development Indicators; International Monetary Fund, World Economic Outlook database; and author’s calculations.
Country-Specific Barriers to Access and Inclusion As outlined in Figure 3, cross-country surveys have identified seven major challenges to financial access and inclusion: (1) not enough money, (2) family member has an account, (3) costs of opening and maintaining accounts are too expensive, (4) lack of accessibility, (5) lack of documentation, (6) lack of trust, and (7) religious reasons. A number of these are relevant to Suriname, and are discussed below.
Figure 3. Reasons for Not Having Bank Account (percent of respondents)
Source: World Bank, Global Financial Development Report 2014: Financial Inclusion.
Income Constraints. Suriname is an upper-middle-income country that saw a 6 percent decline in GDP per capita (purchasing power parity) over 2014–2017, according to data from the World Bank. In 2013, the country had a relatively high level of inequality as reflected in a Gini index coefficient of 52.9 (a coefficient of zero implies perfect income equality, and a coefficient of 100 implies perfect inequality). This places Suriname in a relatively low position in terms of the global distribution (Figure 4). In addition, the 2017 Survey of Living Conditions for Suriname estimated an overall poverty
Suriname (35)
-
20
40
60
80
100
120
513
1820
2325
30
0 5 10 15 20 25 30
7. Religious Reasons6. Lack of Trust
5. Lack of Documentation4. Not Accessible3. Too Expensive
2. Family has Account1. Not Enough Money
Adults Without an Account (%)

30
Quarterly Bulletin
March 2019
FINANCIAL INCLUSION
headcount rate of 26 percent, a level that is comparable to other countries in the region. However, poverty in the interior was found to be much higher at 47.9 percent, with almost one in every two households classified as poor (Khadan 2018).2 The evidence suggests that involuntary exclusion could be due to insufficient income as manifested by inequality and poverty among residents.
Figure 4. Income Inequality (Gini coefficient)
Sources: United Nations, Human Development Indicators, and World Bank, World Development Indicators. Note: A coefficient of zero implies perfect income equality; a coefficient of 100 implies perfect inequality.
Cost of Financial Services. The cost of financial services and limited competition for private lending can impede financial inclusion. Indeed, in the 2014 PROTEqIN survey, almost 48 percent of firms in Suriname reported the cost of finance to be a moderate to very severe obstacle to their current operations. Additionally, data from the Central Bank of Suriname’s 2015 Financial Stability Report shows that the country’s banking system is highly concentrated, with the three largest banks holding about 80 percent of all banking assets. The high level of concentration in the banking sector could result in little competition and an environment of high interest rates. However, bank spreads (i.e., the difference in lending and deposit rates) was relatively low at 5.4 percent in 2016 (panel 1 of Figure 5) compared to the Latin American and Caribbean average of 7.5 percent, and declined marginally from 5.8 percent in 2008 to 5.4 percent in 2017. Return on equity, another indicator of competition in the sector, averaged 9 percent in 2015, ranking on the lower end of the distribution in the 35th percentile out of 166 countries for which data were available across all income groups and regions (panel 2 of Figure 5).
2 Khadan, J. 2018. “Suriname” in Beuermann W. Diether and Moisés J. Schwartz, B. (ed.), Nurturing institutions for a resil ient Caribbean. Inter-American Development Bank, Washington, D.C.
Suriname: 5.4
-
5
10
15
20
25
30
35
40
Braz
il (39
.6)Ky
rgyz
Repu
blic
(19.
9)Sã
o Tom
é (15
.4)Pa
ragu
ay (1
4.3)
Peru
(13.8
)Ja
maic
a (12
.9)
Hond
uras
(10.6
)Ur
ugua
y (10
.6)Co
sta R
ica (1
0.4)
Nica
ragu
a (10
.3)
Bhut
an (1
0.1)
Djib
outi
(9.6)
Nige
ria (9
.37)
Alba
nia (8
.82)
Azer
baija
n (8.
64)
Dom
inica
n Rep
ublic
(7.9
0)Co
lom
bia (
7.86)
Papu
a New
Gui
nea (
7.72)
Antig
ua an
d Bar
buda
(7.64
)Ha
iti (7
.59)
Trin
idad a
nd To
bago
(7.5
)St
. Vin
cent
(7.2
2)M
aldive
s (6.
98)
Arge
ntina
(6.9
5)Sa
moa
(6.7
3)St
. Luc
ia (6
.60)
Mon
golia
(6.46
)Al
geria
(6.25
)Ar
uba (
6.10)
Egyp
t, Ar
ab R
ep. (
5.74)
Vene
zuela
, RB
(5.69
)W
est B
ank a
nd G
aza (
5.5)
Pana
ma (
5.40)
Iran,
Islam
ic Re
p. (5
.2)
Brun
ei Da
russ
alam
(5.1
6)Jo
rdan
(5.08
)Th
ailan
d (4
.96)
Indo
nesia
(4.72
)Ro
man
ia (4
.59)
Bang
lades
h (4.2
0)M
aced
onia,
FYR
(4.11
)Pa
kista
n (3.
92)
Bosn
ia (3
.65)
Mol
dova
(3.5
5)Ba
ham
as, T
he (3
.50)
Mau
ritiu
s (3.
34)
Austr
alia (
3.27
)Isr
ael (
2.95
)Ku
wait
(2.8
5)Ge
orgia
(2.6
8)Le
bano
n (2.4
2)Hu
ngar
y (1.
90)
Kore
a, Re
p. (1
.81)
Vanu
atu
(1.78
)Qa
tar (
1.59
)Ja
pan
(0.74
)
Bank
Inte
rest
Rat
e Sp
read
s (%
, 201
6)
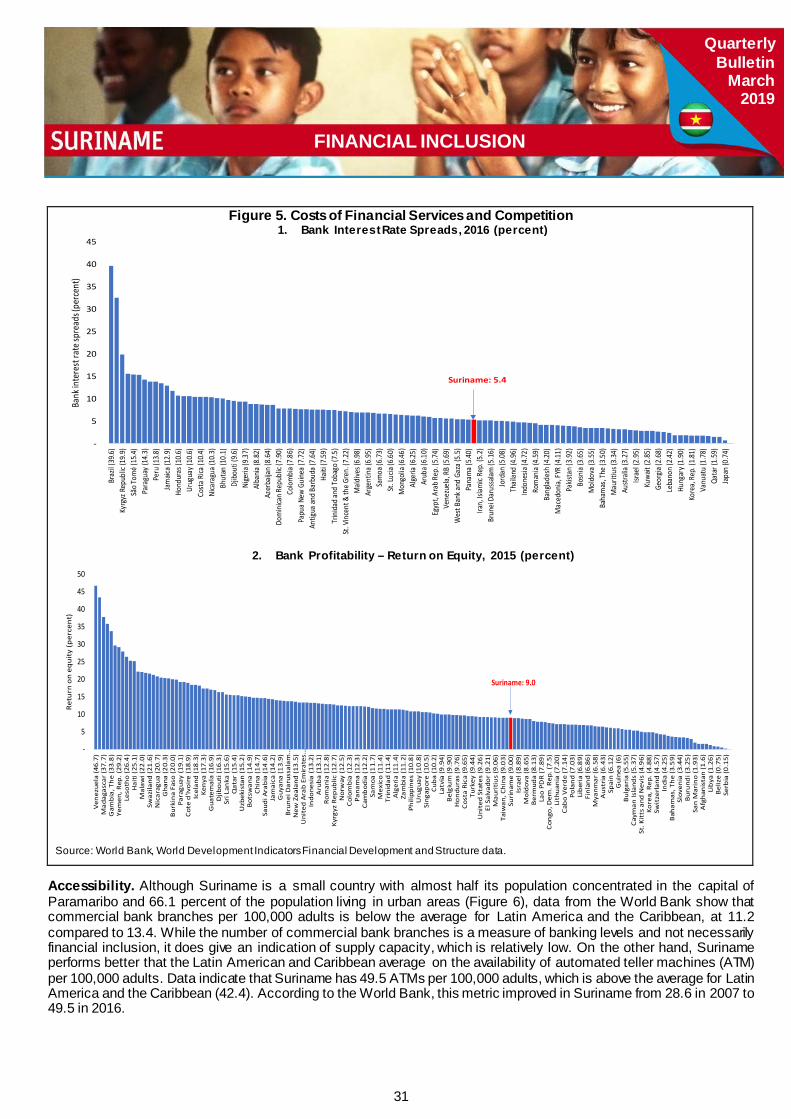
31
Quarterly Bulletin
March 2019
FINANCIAL INCLUSION
Figure 5. Costs of Financial Services and Competition 1. Bank Interest Rate Spreads, 2016 (percent)
2. Bank Profitability – Return on Equity, 2015 (percent)
Source: World Bank, World Development Indicators Financial Development and Structure data.
Accessibility. Although Suriname is a small country with almost half its population concentrated in the capital of Paramaribo and 66.1 percent of the population living in urban areas (Figure 6), data from the World Bank show that commercial bank branches per 100,000 adults is below the average for Latin America and the Caribbean, at 11.2 compared to 13.4. While the number of commercial bank branches is a measure of banking levels and not necessarily financial inclusion, it does give an indication of supply capacity, which is relatively low. On the other hand, Suriname performs better that the Latin American and Caribbean average on the availability of automated teller machines (ATM) per 100,000 adults. Data indicate that Suriname has 49.5 ATMs per 100,000 adults, which is above the average for Latin America and the Caribbean (42.4). According to the World Bank, this metric improved in Suriname from 28.6 in 2007 to 49.5 in 2016.
Suriname: 5.4
-
5
10
15
20
25
30
35
40
45
Braz
il (39
.6)Ky
rgyz
Repu
blic
(19.
9)Sã
o Tom
é (15
.4)Pa
ragu
ay (1
4.3)
Peru
(13.8
)Ja
maic
a (12
.9)
Hond
uras
(10.6
)Ur
ugua
y (10
.6)Co
sta R
ica (1
0.4)
Nica
ragu
a (10
.3)
Bhut
an (1
0.1)
Djib
outi
(9.6)
Nige
ria (9
.37)
Alba
nia (8
.82)
Azer
baija
n (8.
64)
Dom
inica
n Rep
ublic
(7.9
0)Co
lom
bia (
7.86)
Papu
a New
Gui
nea (
7.72)
Antig
ua an
d Bar
buda
(7.64
)Ha
iti (7
.59)
Trin
idad a
nd To
bago
(7.5
)St
. Vin
cent
& th
e Gre
n. (7
.22)
Mald
ives (
6.98
)Ar
gent
ina (6
.95)
Sam
oa (6
.73)
St. L
ucia
(6.6
0)M
ongo
lia (6
.46)
Alge
ria (6
.25)
Arub
a (6.1
0)Eg
ypt,
Arab
Rep
. (5.7
4)Ve
nezu
ela, R
B (5
.69)
Wes
t Ban
k and
Gaz
a (5.
5)Pa
nam
a (5.4
0)Ira
n, Is
lamic
Rep.
(5.2
)Br
unei
Daru
ssala
m (5
.16)
Jord
an (5
.08)
Thail
and
(4.9
6)In
done
sia (4
.72)
Rom
ania
(4.5
9)Ba
nglad
esh (
4.20)
Mac
edon
ia, FY
R (4
.11)
Pakis
tan (
3.92
)Bo
snia
(3.6
5)M
oldo
va (3
.55)
Baha
mas
, The
(3.5
0)M
aurit
ius (
3.34
)Au
strali
a (3.
27)
Israe
l (2.
95)
Kuwa
it (2
.85)
Geor
gia (2
.68)
Leba
non (
2.42)
Hung
ary (
1.90
)Ko
rea,
Rep.
(1.81
)Va
nuat
u (1
.78)
Qata
r (1.
59)
Japa
n (0
.74)
Bank
inte
rest
rate
spre
ads (
perc
ent)
Suriname: 9.0
-
5
10
15
20
25
30
35
40
45
50
Ven
ezue
la (
46.7
)M
adag
asca
r (3
7.7)
Gam
bia
, Th
e (3
3.8
)Ye
men
, Rep
. (29
.2)
Leso
tho
(26.
4)
Hai
ti (
25.1
)M
alaw
i (22
.0)
Swaz
iland
(21
.6)
Nic
arag
ua (2
0.7)
Gha
na (2
0.3)
Bur
kin
a Fa
so (2
0.0)
Para
guay
(19
.1)
Cot
e d
'Ivo
ire
(18.
9)Ic
elan
d (1
8.3
)Ke
nya
(17
.3)
Gua
tem
ala
(16.
9)D
jibo
uti (
16.3
)Sr
i Lan
ka (
15.6
)Q
atar
(15
.4)
Uzb
ekis
tan
(15.
2)
Bot
swan
a (1
4.9)
Chi
na (1
4.7)
Saud
i Ara
bia
(14
.6)
Jam
aica
(14
.2)
Guy
ana
(13.
9)B
run
ei D
arus
sala
m…
New
Zea
land
(13
.5)
Uni
ted
Ara
b Em
irat
es…
Indo
nesi
a (1
3.2)
Aru
ba
(13.
1)R
oman
ia (1
2.8
)Ky
rgyz
Rep
ublic
(12
.7)
Nor
way
(12
.5)
Col
omb
ia (
12.3
)Pa
nam
a (1
2.3
)C
amb
odia
(12
.2)
Sam
oa (1
1.7)
Mex
ico
(11.
4)Tr
inid
ad (
11.4
)A
lger
ia (1
1.4
)Za
mbi
a (1
1.2)
Phili
ppin
es (1
0.8
)U
rugu
ay (1
0.8)
Sing
apor
e (1
0.5)
Cub
a (1
0.2)
Latv
ia (9
.94)
Bel
giu
m (9
.90)
Ho
ndu
ras
(9.7
6)C
osta
Ric
a (9
.65)
Turk
ey (
9.44
)U
nite
d St
ates
(9.2
6)
El S
alva
dor
(9.2
1)M
auri
tiu
s (9
.06)
Taiw
an, C
hin
a (9
.03)
Suri
nam
e (9
.00)
Isra
el (
8.89
)M
old
ova
(8.6
5)B
erm
uda
(8.1
3)La
o P
DR
(7.8
9)
Con
go, D
em. R
ep. (
7.5)
Lith
uan
ia (
7.20
)C
abo
Ver
de
(7.1
4)
Pola
nd
(7.0
3)Li
ber
ia (6
.89)
Finl
and
(6.8
6)
Mya
nmar
(6.5
8)A
ustr
ia (6
.43)
Spai
n (6
.12)
Gui
nea
(6)
Bul
gari
a (5
.55)
Cay
man
Isla
nds
(5.3
7)St
. Kit
ts a
nd N
evis
(4.9
6)Ko
rea,
Rep
. (4.
88)
Swit
zerl
and
(4.5
7)In
dia
(4.2
5)B
aham
as, T
he
(3.5
9)Sl
oven
ia (
3.44
)B
uru
ndi (
3.25
)Sa
n M
arin
o (1
.93)
Afg
han
ista
n (1
.6)
Lib
ya (
1.26
)B
eliz
e (0
.75)
Serb
ia (0
.15)
Retu
rn o
n eq
uity
(per
cent
)

32
Quarterly Bulletin
March 2019
FINANCIAL INCLUSION
Trust. Trust is a critical driver of relationships among individuals and between individuals and institutions. Thus, establishing trust is an important ingredient for promoting financial inclusion. One of the main ways to build trust with bank customers or potential customers is through financial literacy – that is, improving knowledge about financial services and the benefits of using the financial system. In this context, there is need for a comprehensive analysis to assess levels of financial literacy in Suriname. While Suriname and other Caribbean countries are not included in global financial literary surveys, one proxy indicator is the share of the population with tertiary level education. This indicator, obtained from the 2016/2017 Survey of Living Conditions for Suriname, shows that the country has the second lowest share of the population with tertiary level education across Caribbean countries, at 12.6 percent of individuals between the ages of 25 and 65 years old), (Khadan 2018). 3
Figure 6. Urban Population, 2014 (percent of total population)
Sources: World Bank, World Development Indicators database; and author’s calculations.
Conclusions Suriname’s financial sector could be strengthened to support the country’s social and economic development. Suriname has been improving its financial regulatory framework and oversight functions. However, the depth of the financial sector is relatively shallow, and economic agents report constraints to accessing financing from commercial banks. In the case of Suriname, the literature and data indicate that tackling underlying factors such as income inequality, poverty, accessibility constraints, and the need to establish credit bureaus and promote financial literacy and education could help to improve financial access and use. Each of these areas require further research to develop policy responses that are tailored to the Suriname context.
3 Khadan, J. 2018. “Suriname” in Beuermann W. Diether and Moisés J. Schwartz, B. (ed.), Nurturing institutions for a resil ient Caribbean. Inter-American Development Bank, Washington, D.C.
Suriname: 66.1
0
10
20
30
40
50
60
70
80
90
100
Berm
uda
(100
%)
Mac
ao S
AR, C
hina
(100
%)
Sint
Maa
rten
(Dut
ch) (
100%
)Be
lgiu
m (9
8%)
Uru
guay
(95%
)Ic
elan
d (9
4%)
Isra
el (9
2%)
Net
herla
nds
(90%
)Ch
ile (8
9%)
Vene
zuel
a, R
B (8
9%)
Denm
ark
(88%
)Pa
lau
(86%
)Sw
eden
(86%
)U
nite
d Ar
ab E
mira
tes
(85%
)Sa
udi A
rabi
a (8
3%)
Uni
ted
King
dom
(82%
)U
nite
d St
ates
(81%
)Fr
ance
(79%
)Pe
ru (7
8%)
Djib
outi
(77%
)Br
unei
Dar
ussa
lam
(77%
)Co
sta
Rica
(76%
)W
est B
ank
and
Gaz
a (7
5%)
Switz
erla
nd (7
4%)
Turk
ey (7
3%)
Mon
golia
(71%
)N
ew C
aled
onia
(70%
)Do
min
ica
(69%
)Es
toni
a (6
8%)
Tuni
sia
(67%
)El
Sal
vado
r (66
%)
Cong
o, R
ep. (
65%
)So
uth
Afric
a (6
4%)
Irela
nd (6
3%)
Kore
a, D
em. R
ep. (
61%
)Pa
ragu
ay (5
9%)
Tuva
lu (5
9%)
Haiti
(57%
)M
aced
onia
, FYR
(57%
)Se
rbia
(55%
)Ro
man
ia (5
4%)
Cam
eroo
n (5
4%)
Cote
d'Iv
oire
(53%
)G
hana
(53%
)In
done
sia (5
3%)
St. V
ince
nt &
the…
Libe
ria (4
9%)
Nig
eria
(47%
)M
aldi
ves
(44%
)Be
lize
(44%
)An
gola
(43%
)Ar
uba
(42%
)M
aurit
ius (
40%
)Bo
snia
and
Her
zego
vina
…M
ali (
39%
)Bh
utan
(38%
)U
zbek
ista
n (3
6%)
Mad
agas
car (
34%
)M
yanm
ar (3
4%)
Sout
h As
ia (3
3%)
Tim
or-L
este
(32%
)Ba
rbad
os (3
2%)
Burk
ina
Faso
(29%
)Rw
anda
(28%
)Af
ghan
istan
(26%
)An
tigua
and
Bar
buda
(24%
)Ch
ad (2
2%)
Swaz
iland
(21%
)Et
hiop
ia (1
9%)
Nig
er (1
8%)
Mal
awi (
16%
)PN
G (1
3%)
Urb
an P
opul
atio
n (p
erce
nt o
f tot
al p
opul
atio
n)
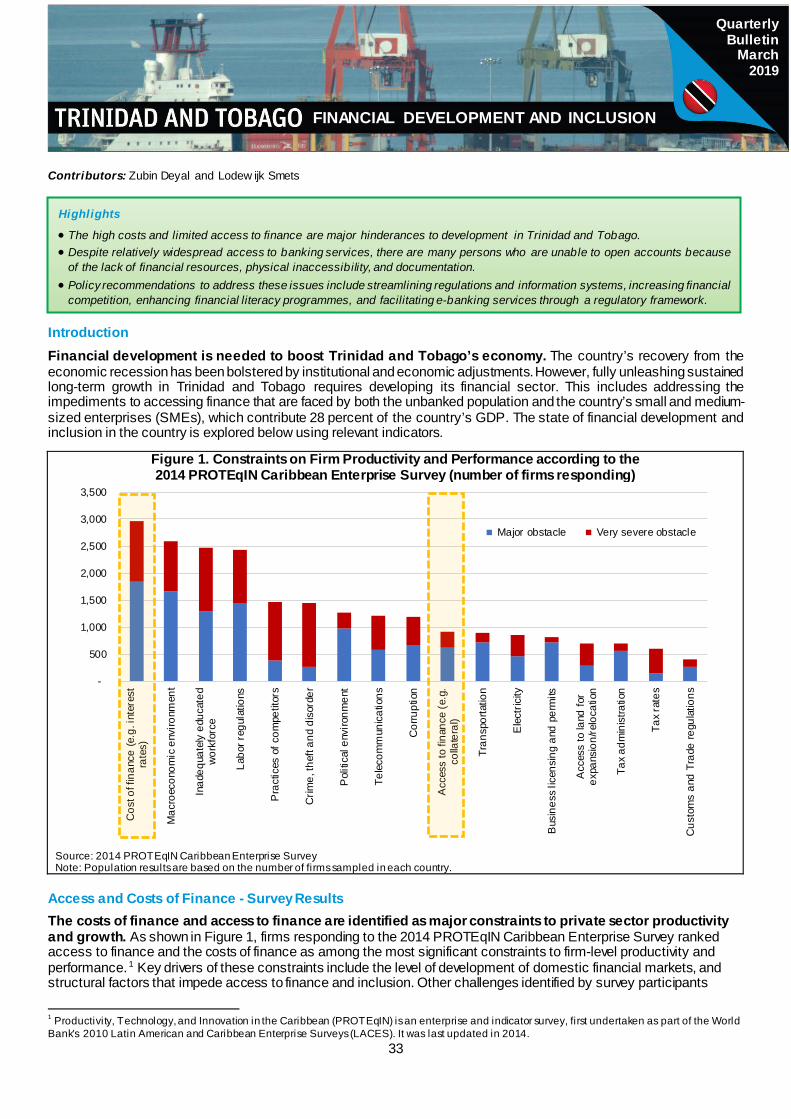
33
FINANCIAL DEVELOPMENT AND INCLUSION
Quarterly Bulletin
March 2019
Contributors: Zubin Deyal and Lodew ijk Smets
Introduction Financial development is needed to boost Trinidad and Tobago’s economy. The country’s recovery from the economic recession has been bolstered by institutional and economic adjustments. However, fully unleashing sustained long-term growth in Trinidad and Tobago requires developing its financial sector. This includes addressing the impediments to accessing finance that are faced by both the unbanked population and the country’s small and medium-sized enterprises (SMEs), which contribute 28 percent of the country’s GDP. The state of financial development and inclusion in the country is explored below using relevant indicators.
Access and Costs of Finance - Survey Results The costs of finance and access to finance are identified as major constraints to private sector productivity and growth. As shown in Figure 1, firms responding to the 2014 PROTEqIN Caribbean Enterprise Survey ranked access to finance and the costs of finance as among the most significant constraints to firm-level productivity and performance.1 Key drivers of these constraints include the level of development of domestic financial markets, and structural factors that impede access to finance and inclusion. Other challenges identified by survey participants
1 Productivity, Technology, and Innovation in the Caribbean (PROTEqIN) is an enterprise and indicator survey, first undertaken as part of the World Bank’s 2010 Latin American and Caribbean Enterprise Surveys (LACES). It was last updated in 2014.
Figure 1. Constraints on Firm Productivity and Performance according to the 2014 PROTEqIN Caribbean Enterprise Survey (number of firms responding)
Source: 2014 PROTEqIN Caribbean Enterprise Survey Note: Population results are based on the number of firms sampled in each country.
-
500
1,000
1,500
2,000
2,500
3,000
3,500
Cos
t of f
inan
ce (e
.g. i
nter
est
rate
s)
Mac
roec
onom
ic e
nviro
nmen
t
Inad
equa
tely
edu
cate
dw
orkf
orce
Labo
r reg
ulat
ions
Pra
ctic
es o
f com
petit
ors
Crim
e, th
eft a
nd d
isor
der
Pol
itica
l env
ironm
ent
Tele
com
mun
icat
ions
Cor
rupt
ion
Acc
ess
to fi
nanc
e (e
.g.
colla
tera
l)
Tran
spor
tatio
n
Ele
ctric
ity
Bus
ines
s lic
ensi
ng a
nd p
erm
its
Acc
ess
to la
nd fo
rex
pans
ion/
relo
catio
n
Tax
adm
inis
tratio
n
Tax
rate
s
Cus
tom
s an
d Tr
ade
regu
latio
ns
Major obstacle Very severe obstacle
Highlights
• The high costs and limited access to finance are major hinderances to development in Trinidad and Tobago. • Despite relatively widespread access to banking services, there are many persons who are unable to open accounts because
of the lack of financial resources, physical inaccessibility, and documentation. • Policy recommendations to address these issues include streamlining regulations and information systems, increasing financial
competition, enhancing financial literacy programmes, and facilitating e-banking services through a regulatory framework.

34
FINANCIAL DEVELOPMENT AND INCLUSION
Quarterly Bulletin
March 2019
include the macroeconomic environment, workforce skills and education, labour regulations, competitor practices, and crime and disorder. The remainder of this brief focuses on factors driving these concerns regarding the costs of finance and access to it, particularly those that may relate to policies or other institutional issues that can be influenced by public policies or other types of focused reform. Capital Market Depth and Access Despite a large and relatively inclusive financial sector, Trinidad and Tobago has limited private sector lending. The country is generally considered the financial centre of the English-speaking Caribbean region. As of March 2018, its commercial banks held TT$137 billion or 91 percent of GDP in total assets. Over 80 percent of the population has a bank account, which is the highest proportion in Latin America and the Caribbean (LAC), for which the average is 44 percent. However, the relatively low risk appetite of commercial banks results in limited lending, especially to projects in the non-energy sector. For this reason, domestic credit to the private sector stood at 37 percent of GDP in 2017 (Figure 2). This is 12 percentage points below the 49 percent average for Latin America and the Caribbean and is one of the lowest percentages in the region.
Figure 2. Domestic Credit to Private Sector, 2015 (percent of GDP)
Sources: World Bank, World Development Indicators; International Monetary Fund, World Economic Outlook database; and author’s calculations.
Country-Specific Barriers to Access and Inclusion As shown in Figure 3, cross-country surveys have identified seven major challenges to financial access and inclusion: (1) a lack of resources, (2) banking through a family member, (3) high costs of opening and maintaining accounts, (4) lack of accessibility, (5) lack of documentation, (6) lack of trust, (7) religious reasons. A number of these are relevant to Trinidad and Tobago, and are discussed below.
Figure 3. Reasons for Not Having Bank Account (percent of respondents)
Source: World Bank Global Financial Development Report 2014: Financial Inclusion
Trinidad & Tobago (37)
-
20
40
60
80
100
120

35
FINANCIAL DEVELOPMENT AND INCLUSION
Quarterly Bulletin
March 2019
There are six impediments that limit financial inclusion in Trinidad and Tobago. Even though Trinidad and Tobago scores well on financial inclusion, an estimated 20 percent of the population still does not have a bank account. The reasons for this include: not enough money to open an account (38 percent of the unbanked highlight this reason); banks being too expensive (31 percent) lack of trust in the banking system (29 percent); and lack of sufficient documentation to open an account (28 percent) (Figure 3). The remaining factors of banks being inaccessible and religious reasons score far lower, at 10 percent and 2 percent respectively. Income inequality has resulted in many people not having enough money to open or maintain a bank account, despite the country’s high-income status. The main commercial banks in Trinidad and Tobago all impose lower limits on the amounts required to open an account, and require that certain amounts be maintained in the account throughout is operation. Despite the country’s high-income classification, the proportion of individuals unable to meet these demands is sizable and is theorised to be due to the country’s income inequality. While recent estimates are lacking, data from the Caribbean Development Bank indicate that in 2006 the Gini coefficient was 39 (where a coefficient of zero implies perfect income equality and a coefficient of 100 implies perfect inequality) which puts Trinidad and Tobago in the 55th percentile in a global sample. Economic underperformance has prompted banks to raise fees, which has resulted in them becoming too expensive for some people. In response to worsening economic conditions and increased levels of non-performing loans over the past few years, banks in Trinidad and Tobago have raised their fees to cover losses and remain profitable. Banking service costs have since been raised to levels higher than the global average. As a percentage of income, costs stand at 66 percent, a whole 10 percentage points higher than the world’s average of 56 percent (Figure 4). The country is ranked in the 78th percentile for bank costs as a proportion of income. Moreover, the commercial bank spread of 7.5 percent is in the 66th percentile and well exceeds the global average of 5.7 percent (Figure 5). Limited tertiary education, low financial literacy, and the lasting effects of the collapse of the CLICO insurance company have resulted in a lack of trust in banks. Proper education emphasizes the importance of banks and addresses the common fallacies about these institutions. Trinidad and Tobago’s low average tertiary education (0.32 years versus the Latin America and Caribbean average of 0.40 and the global average of 0.43) (Figure 6) has resulted in a large number of unbanked persons distrusting the financial system. Although the government aims to address these perceptions through the National Financial Literacy Programme (NFLP) and the National Finance Education Committee launched in 2018, these arrangements have yet to be fully effective. Part of the public’s wariness about financial institutions has existed for nearly a decade since the billion-dollar bailout of CLICO by the government. The crash left a significant amount of the population distrusting both these institutions and the regulations governing them.
Figure 4. Bank Costs to Income, 2016 (percennt)
Source: WB WDI / Financial Development and Structure data.
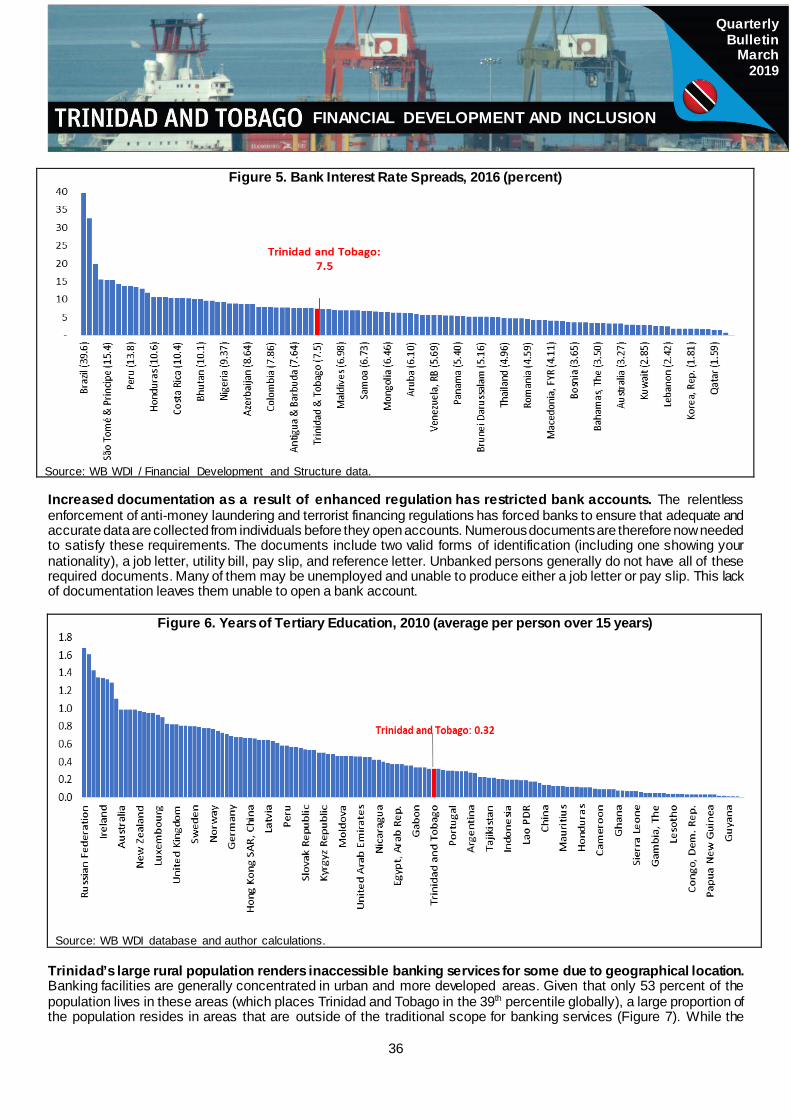
36
FINANCIAL DEVELOPMENT AND INCLUSION
Quarterly Bulletin
March 2019
Figure 5. Bank Interest Rate Spreads, 2016 (percent)
Source: WB WDI / Financial Development and Structure data. Increased documentation as a result of enhanced regulation has restricted bank accounts. The relentless enforcement of anti-money laundering and terrorist financing regulations has forced banks to ensure that adequate and accurate data are collected from individuals before they open accounts. Numerous documents are therefore now needed to satisfy these requirements. The documents include two valid forms of identification (including one showing your nationality), a job letter, utility bill, pay slip, and reference letter. Unbanked persons generally do not have all of these required documents. Many of them may be unemployed and unable to produce either a job letter or pay slip. This lack of documentation leaves them unable to open a bank account.
Figure 6. Years of Tertiary Education, 2010 (average per person over 15 years)
Source: WB WDI database and author calculations.
Trinidad’s large rural population renders inaccessible banking services for some due to geographical location. Banking facilities are generally concentrated in urban and more developed areas. Given that only 53 percent of the population lives in these areas (which places Trinidad and Tobago in the 39th percentile globally), a large proportion of the population resides in areas that are outside of the traditional scope for banking services (Figure 7). While the

37
FINANCIAL DEVELOPMENT AND INCLUSION
Quarterly Bulletin
March 2019
country’s highly developed technological infrastructure could solve the problems presented by geographic location, the low adoption of the technology into working e-banking frameworks has prevented it from being fully utilised.
Figure 7. Urban Population, 2014 (percent of total population)
Source: WB WDI database and author calculations.
Conclusions and Areas for Reform Although Trinidad and Tobago’s financial sector is large, it is still underdeveloped. While the country has a high number of individuals with bank accounts, there is very limited financing available, especially for the private sector. Actions to address the major impediments that restrict access to finance should seek to:
• Encourage competition. Arrangements should be pursued to increase the competition faced by banks. These include removal of barriers for alternative financial services, development of the small and medium sized equity market and incorporation of potentially disruptive financial technology by banks. These measures would increase the financing options available to the private sector and individuals, reducing their overall cost.
• Streamline regulations and information systems. Adjusting the regulations governing the opening of accounts would make them more accessible and inclusive as the required documentation would be reduced. There is a need for banks to develop information systems, especially to answer queries from the population living in rural areas. Such actions would support a more inclusive financial system.
• Improve arrangements designed to enhance financial literacy. While both the National Financial Literacy Programme and the National Finance Education Committee have been promising initiatives to improve financial literacy, greater funding and increased targeting of undereducated groups would make these initiatives more effective and ultimately increase national trust in banks.
• Facilitate e-banking services. This includes the use of a robust regulatory framework to encourage the development of mobile and virtual platforms that address the geographical impediments faced by the large number of persons living in the rural parts of the country.

38
Quarterly Bulletin
March 2019
FOSTERING FINANCIAL INCLUSION
Highlights
• Cost and access to credit is a key impediment to private sector operations in the OECS region. • Further initiatives aimed at enhancing financial literacy, reducing the costs of finance and developing a comprehensive financial
inclusion strategy could benefit the region.
Contributor: Kimberly Waithe
Introduction1 Evidence suggests that financial inclusion is important for growth, development, and poverty reduction. 2 However, the Organisation of Eastern Caribbean States (OECS) region has an underdeveloped financial sector along with rigidities in the business climate, particularly in the areas of access to finance and the costs of credit. Out of 190 countries in the World Bank’s 2019 Doing Business Report rankings on get t ing credit, the rankings for OECS countries range from 144th (Dominica and Grenada) to 161st (Antigua and Barbuda, St. Kitts and Nevis, St. Lucia, and St. Vincent and the Grenadines). Moreover, the OECS region’s getting credit score range between 25th and 30th out of 100, which is below the average for the rest of the small economies in the world that depend on tourism (ROSE-T) (42nd) and the C6 countries (46th) (Figure 1). 3 Economic activity remains weak in some countries in the OECS region, with real GDP growth estimated to range from 0.5 percent in Dominica and 0.6 percent in St. Lucia to 4.9 percent in Antigua and Barbuda in 2018. At the same time, poverty and unemployment rates are elevated in the region. Poverty levels range from 18 percent in Ant igua and Barbuda to 38 percent in Grenada. 4 Moreover, limited available data suggest that unemployment stood at 24 percent in St. Lucia and around 23 percent in St. Vincent and the Grenadines and Grenada in 2015. 5
This brief will analyse barriers to financial access and inclusion and explore areas for reform. Access and Costs of Finance – Survey Results Respondents to the 2014 PROTEqIN Caribbean Enterprise Survey cited access to finance as a major constraint to private sector operations in the OECS region. 6 Findings of the 2014 PROTEqIN Caribbean enterprise survey indicate that cost and access to finance is ranked as among the most significant obstacles to private sector operat ions in the OECS region. Other barriers identified by firms include an inadequately-educated workforce, the macroeconomic environment, and other factors (Figure 2). In addition, businesses in the OECS region depend heavily on their own resources for working capital and on retained earnings for investment, which puts substantial pressure on cash management. In 2014, around 60 percent of firms surveyed supplied over 90 percent of their financing with their own working capital. Their fixed assets accounted for about 70 percent of their financing. At the same time, the survey reported that higher collateral requirements constrained firms from receiving adequate financing from commercial
1 This brief focuses on developments in the independent member countries of the OECS: Antigua and Barbuda, Dominica, Gre n a d a, S t . K i tt s a n d Nevis, St. Vincent and the Grenadines, and St. Lucia. Figures exclude territories that are members of the OECS. 2 World Bank, Global Financial Development Report 2014: Financial Inclusion. 3 The ease of doing business score is reflected on a scale from 0 to 100, where 0 represents the lowest and 100 represents the best performance. 4 Caribbean Development Bank, “The Changing Nature of Poverty and Inequality in the Caribbean: New Issues, New Solutions,” May 2016. 5 International Monetary Fund, “Eastern Caribbean Currency Union, 2017 Discussion on Common Policies of Member Countries.” Press Release a n d Staff Report, IMF Country Report No. 17/150, June 2017. 6 Productivity, Technology, and Innovation in the Caribbean (PROTEqIN) is an enterprise and indicator survey first undertaken as pa rt o f th e Wo rl d Bank’s 2010 Latin American and Caribbean Enterprise Surveys (LACES). It was last updated in 2014.
Figure 1. Ease of Doing Business Score
Source: World Bank, 2019 Doing Business Report. Note: C6: The Bahamas, Barbados, Guyana, Jamaica, Suriname, and Trinidad and Tobago; OECS: Organisation of Eastern Caribbean States; ROSE-T = rest of the small economies in the world that are dependent on tourism.

39
Quarterly Bulletin
March 2019
FOSTERING FINANCIAL INCLUSION
banks. Firms in the region reported collateral required as a share of the total loan amount ranging from 137 percent in Antigua and Barbuda to 148 percent in Grenada.
Figure 2. Constraints to Firm Productivity and Performance according to the 2014 PROTEqIN Caribbean Enterprise Survey (number of firms responding)
Source: 2014 PROTEqIN Caribbean Enterprise Survey. Note: Population results based on the number of firms sampled in each country. Countries included: Antigua and Barbuda, Dominica, Gre n a da , S t . Kitts and Nevis, St. Lucia and St. Vincent and the Grenadines. Credit Market Depth and Access The OECS region’s credit markets are relatively shallow given its income levels and in comparison with other regional groups (Figure 3). As an indicator of financial sector depth, domestic private sector credit as a share of GDP in St. Lucia stood at 73 percent in 2016, making it the deepest private credit market in the OECS region. On the other hand, private credit in the other islands in the region ranged from 47 percent of GDP in Dominica to 54 percent of GDP in St. Kitts and Nevis and Grenada. While some OECS countries are on par with the average for Latin America and the Caribbean (49 percent of GDP), in comparison with its peers the region falls below the average for ROSE-T (76 percent of GDP) as well as the other middle-income countries.7
Country-Specific Barriers to Access and Inclusion The World Bank’s 2014 Global Financial Development Report: Financial Inclusion highlights seven main reasons for low levels of financial inclusion and access based on cross-country surveys. With respect to the OECS region, this analysis will cover four of these reasons: (1)
7 Middle-income economies are those in which 2016 GNI per capita was between US$1,006 and US$12,235.
-
100
200
300
400
500
600
700
800
900
Inad
equa
tely
educ
ated
wor
kfor
ce
Mac
roec
onom
icen
viro
nmen
t
Acc
ess
to fi
nanc
e(e
.g. c
olla
tera
l)
Cos
t of f
inan
ce (e
.g.
inte
rest
rate
s)
Ele
ctric
ity
Tax
rate
s
Crim
e, th
eft a
nddi
sord
er
Labo
r reg
ulat
ions
Tele
com
mun
icat
ions
Pol
itica
l env
ironm
ent
Tax
adm
inis
tratio
n
Tran
spor
tatio
n
Pra
ctic
es o
fco
mpe
titor
s
Cus
tom
s an
d Tr
ade
regu
latio
ns
Acc
ess
to la
nd fo
rex
pans
ion/
relo
catio
n
Cor
rupt
ion
Bus
ines
s lic
ensi
ngan
d pe
rmits
Major obstacle Very severe obstacle
Figure 3. Domestic Credit to Private Sector, 2016 (percent of GDP)
Source: World Bank, World Development Indicators. Note: ROSE-T = rest of the small economies in the world that are dependent on tourism.
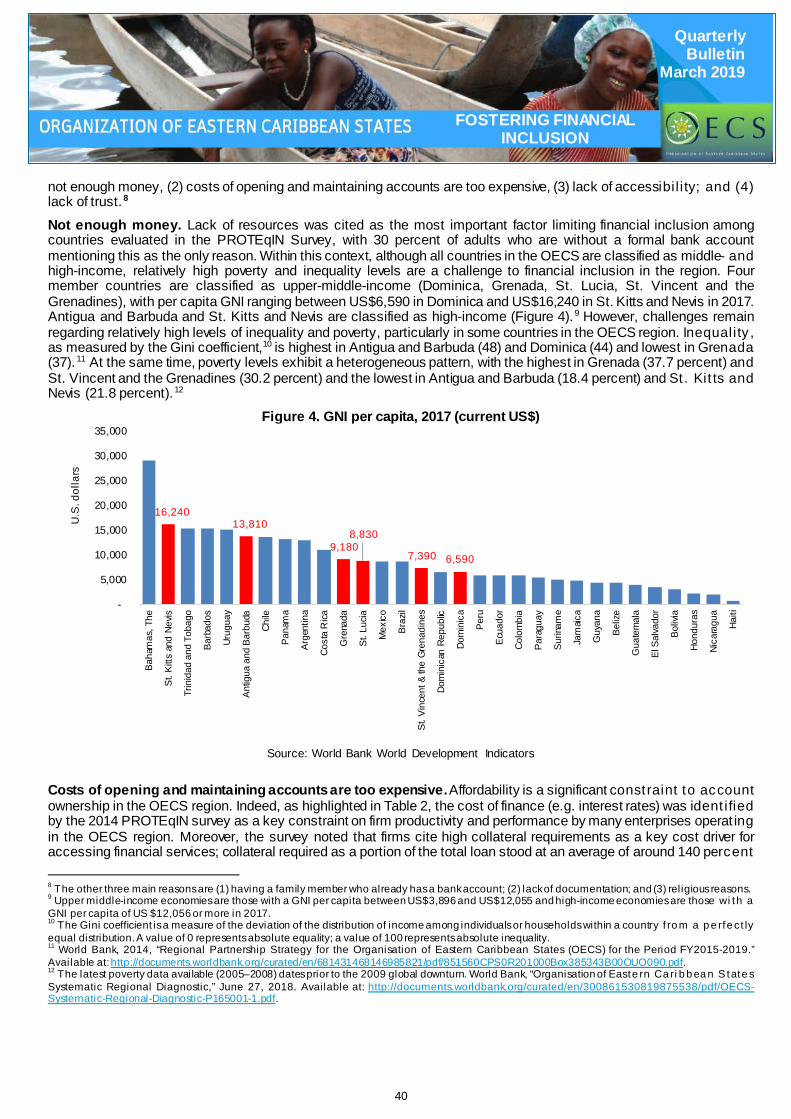
40
Quarterly Bulletin
March 2019
FOSTERING FINANCIAL INCLUSION
not enough money, (2) costs of opening and maintaining accounts are too expensive, (3) lack of accessibi l i ty; and (4) lack of trust. 8 Not enough money. Lack of resources was cited as the most important factor limiting financial inclusion among countries evaluated in the PROTEqIN Survey, with 30 percent of adults who are without a formal bank account mentioning this as the only reason. Within this context, although all countries in the OECS are classified as middle- and high-income, relatively high poverty and inequality levels are a challenge to financial inclusion in the region. Four member countries are classified as upper-middle-income (Dominica, Grenada, St. Lucia, St. Vincent and the Grenadines), with per capita GNI ranging between US$6,590 in Dominica and US$16,240 in St. Kitts and Nevis in 2017. Antigua and Barbuda and St. Kitts and Nevis are classified as high-income (Figure 4).9 However, challenges remain regarding relatively high levels of inequality and poverty, particularly in some countries in the OECS region. Inequality , as measured by the Gini coefficient,10 is highest in Antigua and Barbuda (48) and Dominica (44) and lowest in Grenada (37). 11 At the same time, poverty levels exhibit a heterogeneous pattern, with the highest in Grenada (37.7 percent) and St. Vincent and the Grenadines (30.2 percent) and the lowest in Antigua and Barbuda (18.4 percent) and St . Kit ts and Nevis (21.8 percent). 12
Figure 4. GNI per capita, 2017 (current US$)
Source: World Bank World Development Indicators
Costs of opening and maintaining accounts are too expensive. Affordability is a significant constraint to account ownership in the OECS region. Indeed, as highlighted in Table 2, the cost of finance (e.g. interest rates) was ident ified by the 2014 PROTEqIN survey as a key constraint on firm productivity and performance by many enterprises operat ing in the OECS region. Moreover, the survey noted that firms cite high collateral requirements as a key cost driver for accessing financial services; collateral required as a portion of the total loan stood at an average of around 140 percent 8 The other three main reasons are (1) having a family member who already has a bank account; (2) lack of documentation; and (3) religious reasons. 9 Upper middle-income economies are those with a GNI per capita between US$3,896 and US$12,055 and high-income economies are those wi th a GNI per capita of US $12,056 or more in 2017. 10 The Gini coefficient is a measure of the deviation of the distribution of income among individuals or households within a country f ro m a p e rfe ct ly equal distribution. A value of 0 represents absolute equality; a value of 100 represents absolute inequality. 11 World Bank, 2014, “Regional Partnership Strategy for the Organisation of Eastern Caribbean States (OECS) for the Period FY2015-2019.” Available at: http://documents.worldbank.org/curated/en/681431468146985821/pdf/851560CPS0R201000Box385343B00OUO090.pdf. 12 The latest poverty data available (2005–2008) dates prior to the 2009 global downturn. World Bank, “Organisation of Easte rn Ca ri b b ea n S tate s Systematic Regional Diagnostic,” June 27, 2018. Available at: http://documents.worldbank.org/curated/en/300861530819875538/pdf/OECS-Systematic-Regional-Diagnostic-P165001-1.pdf.
16,240 13,810
9,180 8,830
7,390 6,590
-
5,000
10,000
15,000
20,000
25,000
30,000
35,000
Baha
mas
, The
St. K
itts
and
Nevis
Trin
idad
and
Tob
ago
Barb
ados
Urug
uay
Antig
ua a
nd B
arbu
da
Chile
Pana
ma
Arge
ntin
a
Cost
a R
ica
Gre
nada
St. L
ucia
Mex
ico
Braz
il
St. V
ince
nt &
the
Gren
adin
es
Dom
inic
an R
epub
lic
Dom
inic
a
Peru
Ecua
dor
Colo
mbi
a
Para
guay
Surin
ame
Jam
aica
Guy
ana
Beliz
e
Gua
tem
ala
El S
alva
dor
Boliv
ia
Hond
uras
Nica
ragu
a
Haiti
U.S
.dol
lars
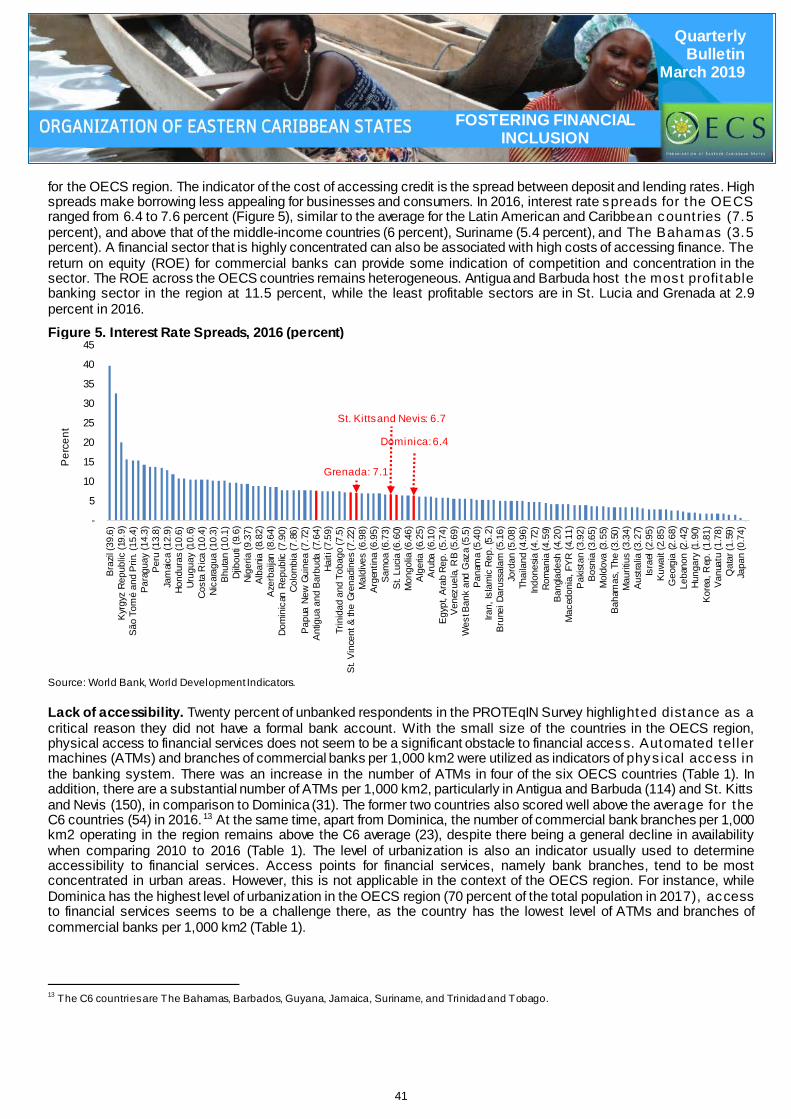
41
Quarterly Bulletin
March 2019
FOSTERING FINANCIAL INCLUSION
for the OECS region. The indicator of the cost of accessing credit is the spread between deposit and lending rates. High spreads make borrowing less appealing for businesses and consumers. In 2016, interest rate spreads for the OECS ranged from 6.4 to 7.6 percent (Figure 5), similar to the average for the Latin American and Caribbean countries (7.5 percent), and above that of the middle-income countries (6 percent), Suriname (5.4 percent), and The Bahamas (3.5 percent). A financial sector that is highly concentrated can also be associated with high costs of accessing finance. The return on equity (ROE) for commercial banks can provide some indication of competition and concentration in the sector. The ROE across the OECS countries remains heterogeneous. Antigua and Barbuda host the most profitable banking sector in the region at 11.5 percent, while the least profitable sectors are in St. Lucia and Grenada at 2.9 percent in 2016. Figure 5. Interest Rate Spreads, 2016 (percent)
Source: World Bank, World Development Indicators.
Lack of accessibility. Twenty percent of unbanked respondents in the PROTEqIN Survey highlighted distance as a critical reason they did not have a formal bank account. With the small size of the countries in the OECS region, physical access to financial services does not seem to be a significant obstacle to financial access. Automated tel ler machines (ATMs) and branches of commercial banks per 1,000 km2 were utilized as indicators of phys ical access in the banking system. There was an increase in the number of ATMs in four of the six OECS countries (Table 1). In addition, there are a substantial number of ATMs per 1,000 km2, particularly in Antigua and Barbuda (114) and St. Kitts and Nevis (150), in comparison to Dominica (31). The former two countries also scored well above the average for the C6 countries (54) in 2016.13 At the same time, apart from Dominica, the number of commercial bank branches per 1,000 km2 operating in the region remains above the C6 average (23), despite there being a general decline in availability when comparing 2010 to 2016 (Table 1). The level of urbanization is also an indicator usually used to determine accessibility to financial services. Access points for financial services, namely bank branches, tend to be most concentrated in urban areas. However, this is not applicable in the context of the OECS region. For instance, while Dominica has the highest level of urbanization in the OECS region (70 percent of the total population in 2017), access to financial services seems to be a challenge there, as the country has the lowest level of ATMs and branches of commercial banks per 1,000 km2 (Table 1).
13 The C6 countries are The Bahamas, Barbados, Guyana, Jamaica, Suriname, and Trinidad and Tobago.
Grenada: 7.1
St. Kitts and Nevis: 6.7
Dominica: 6.4
-
5
10
15
20
25
30
35
40
45
Braz
il (39
.6)
Kyrg
yz R
epub
lic (1
9.9)
São
Tom
é an
d Pr
in. (1
5.4)
Para
guay
(14.
3)Pe
ru (1
3.8)
Jam
aica
(12.
9)Ho
ndur
as (1
0.6)
Urug
uay
(10.
6)Co
sta
Rica
(10.
4)Ni
cara
gua
(10.
3)Bh
utan
(10.
1)Dj
ibou
ti (9
.6)
Nige
ria (9
.37)
Alba
nia (8
.82)
Azer
baija
n (8
.64)
Dom
inic
an R
epub
lic (7
.90)
Colo
mbi
a (7
.86)
Papu
a Ne
w Gu
inea
(7.7
2)An
tigua
and
Bar
buda
(7.6
4)Ha
iti (7
.59)
Trin
idad
and
Tob
ago
(7.5
)St
. Vin
cent
& th
e Gr
enad
ines
(7.2
2)M
aldi
ves
(6.9
8)Ar
gent
ina
(6.9
5)Sa
moa
(6.7
3)St
. Luc
ia (6
.60)
Mon
golia
(6.4
6)Al
geria
(6.2
5)Ar
uba
(6.1
0)Eg
ypt,
Arab
Rep
. (5.
74)
Vene
zuel
a, R
B (5
.69)
Wes
t Ban
k an
d G
aza
(5.5
)Pa
nam
a (5
.40)
Iran,
Isla
mic
Rep.
(5.2
)Br
unei
Dar
ussa
lam
(5.1
6)Jo
rdan
(5.0
8)Th
aila
nd (4
.96)
Indo
nesia
(4.7
2)Ro
man
ia (4
.59)
Bang
lade
sh (4
.20)
Mac
edon
ia, F
YR (4
.11)
Pakis
tan
(3.9
2)Bo
snia
(3.6
5)M
oldo
va (3
.55)
Baha
mas
, The
(3.5
0)M
aurit
ius
(3.3
4)Au
stra
lia (3
.27)
Isra
el (2
.95)
Kuwa
it (2
.85)
Geo
rgia
(2.6
8)Le
bano
n (2
.42)
Hung
ary
(1.9
0)Ko
rea,
Rep
. (1.
81)
Vanu
atu
(1.7
8)Q
atar
(1.5
9)Ja
pan
(0.7
4)
Per
cent
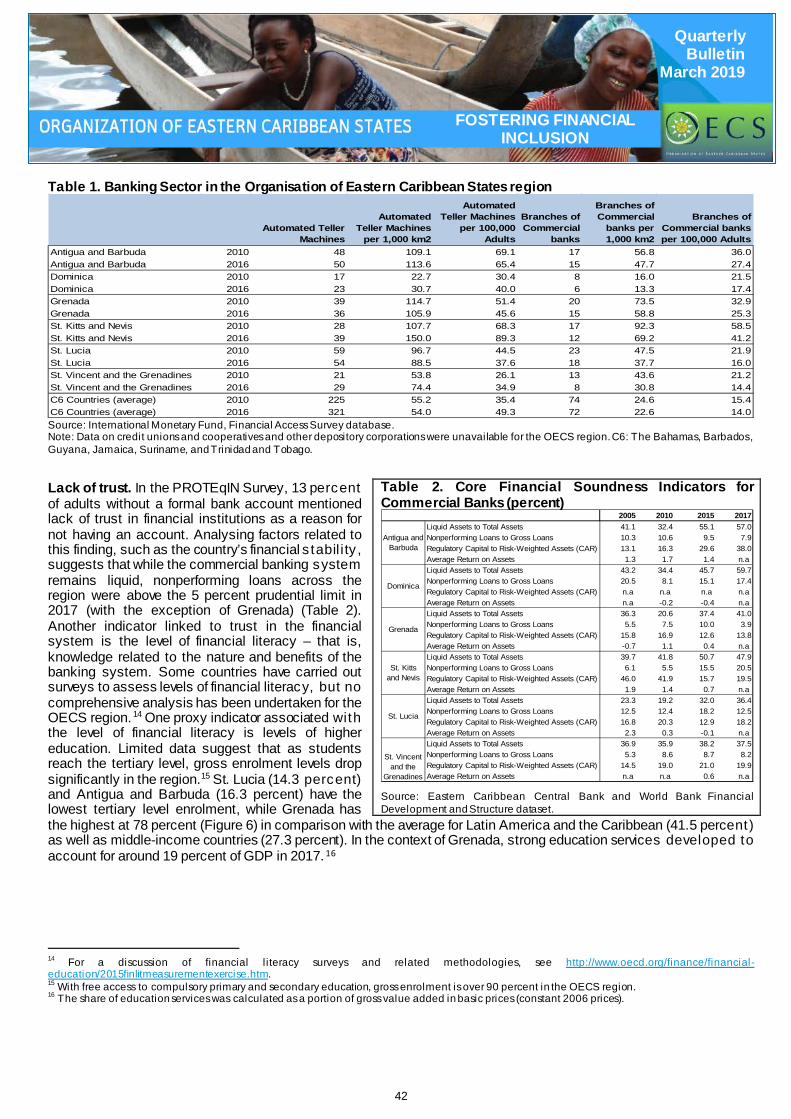
42
Quarterly Bulletin
March 2019
FOSTERING FINANCIAL INCLUSION
Table 1. Banking Sector in the Organisation of Eastern Caribbean States region
Source: International Monetary Fund, Financial Access Survey database. Note: Data on credit unions and cooperatives and other depository corporations were unavailable for the OECS region. C6: The Bahamas, Barbados, Guyana, Jamaica, Suriname, and Trinidad and Tobago. Lack of trust. In the PROTEqIN Survey, 13 percent of adults without a formal bank account mentioned lack of trust in financial institutions as a reason for not having an account. Analysing factors related to this finding, such as the country’s financial s tabil i ty , suggests that while the commercial banking system remains liquid, nonperforming loans across the region were above the 5 percent prudential limit in 2017 (with the exception of Grenada) (Table 2). Another indicator linked to trust in the financial system is the level of financial literacy – that is, knowledge related to the nature and benefits of the banking system. Some countries have carried out surveys to assess levels of financial literacy, but no comprehensive analysis has been undertaken for the OECS region.14 One proxy indicator associated with the level of financial literacy is levels of higher education. Limited data suggest that as students reach the tertiary level, gross enrolment levels drop significantly in the region.15 St. Lucia (14.3 percent) and Antigua and Barbuda (16.3 percent) have the lowest tertiary level enrolment, while Grenada has the highest at 78 percent (Figure 6) in comparison with the average for Latin America and the Caribbean (41.5 percent) as well as middle-income countries (27.3 percent). In the context of Grenada, strong education services developed to account for around 19 percent of GDP in 2017. 16
14 For a discussion of financial l iteracy surveys and related methodologies, see http://www.oecd.org/finance/financial-education/2015finlitmeasurementexercise.htm. 15 With free access to compulsory primary and secondary education, gross enrolment is over 90 percent in the OECS region. 16 The share of education services was calculated as a portion of gross value added in basic prices (constant 2006 prices).
Automated Teller Machines
Automated Teller Machines
per 1,000 km2
Automated Teller Machines
per 100,000 Adults
Branches of Commercial
banks
Branches of Commercial
banks per 1,000 km2
Branches of Commercial banks per 100,000 Adults
Antigua and Barbuda 2010 48 109.1 69.1 17 56.8 36.0Antigua and Barbuda 2016 50 113.6 65.4 15 47.7 27.4Dominica 2010 17 22.7 30.4 8 16.0 21.5Dominica 2016 23 30.7 40.0 6 13.3 17.4Grenada 2010 39 114.7 51.4 20 73.5 32.9Grenada 2016 36 105.9 45.6 15 58.8 25.3St. Kitts and Nevis 2010 28 107.7 68.3 17 92.3 58.5St. Kitts and Nevis 2016 39 150.0 89.3 12 69.2 41.2St. Lucia 2010 59 96.7 44.5 23 47.5 21.9St. Lucia 2016 54 88.5 37.6 18 37.7 16.0St. Vincent and the Grenadines 2010 21 53.8 26.1 13 43.6 21.2St. Vincent and the Grenadines 2016 29 74.4 34.9 8 30.8 14.4C6 Countries (average) 2010 225 55.2 35.4 74 24.6 15.4C6 Countries (average) 2016 321 54.0 49.3 72 22.6 14.0
Table 2. Core Financial Soundness Indicators for Commercial Banks (percent)
Source: Eastern Caribbean Central Bank and World Bank Financial Development and Structure dataset.
2005 2010 2015 2017Liquid Assets to Total Assets 41.1 32.4 55.1 57.0Nonperforming Loans to Gross Loans 10.3 10.6 9.5 7.9Regulatory Capital to Risk-Weighted Assets (CAR) 13.1 16.3 29.6 38.0Average Return on Assets 1.3 1.7 1.4 n.a Liquid Assets to Total Assets 43.2 34.4 45.7 59.7Nonperforming Loans to Gross Loans 20.5 8.1 15.1 17.4Regulatory Capital to Risk-Weighted Assets (CAR) n.a n.a n.a n.a Average Return on Assets n.a -0.2 -0.4 n.a Liquid Assets to Total Assets 36.3 20.6 37.4 41.0Nonperforming Loans to Gross Loans 5.5 7.5 10.0 3.9Regulatory Capital to Risk-Weighted Assets (CAR) 15.8 16.9 12.6 13.8Average Return on Assets -0.7 1.1 0.4 n.a Liquid Assets to Total Assets 39.7 41.8 50.7 47.9Nonperforming Loans to Gross Loans 6.1 5.5 15.5 20.5Regulatory Capital to Risk-Weighted Assets (CAR) 46.0 41.9 15.7 19.5Average Return on Assets 1.9 1.4 0.7 n.a Liquid Assets to Total Assets 23.3 19.2 32.0 36.4Nonperforming Loans to Gross Loans 12.5 12.4 18.2 12.5Regulatory Capital to Risk-Weighted Assets (CAR) 16.8 20.3 12.9 18.2Average Return on Assets 2.3 0.3 -0.1 n.a Liquid Assets to Total Assets 36.9 35.9 38.2 37.5Nonperforming Loans to Gross Loans 5.3 8.6 8.7 8.2Regulatory Capital to Risk-Weighted Assets (CAR) 14.5 19.0 21.0 19.9Average Return on Assets n.a n.a 0.6 n.a
St. Vincent and the
Grenadines
Antigua and Barbuda
Dominica
Grenada
St. Kitts and Nevis
St. Lucia
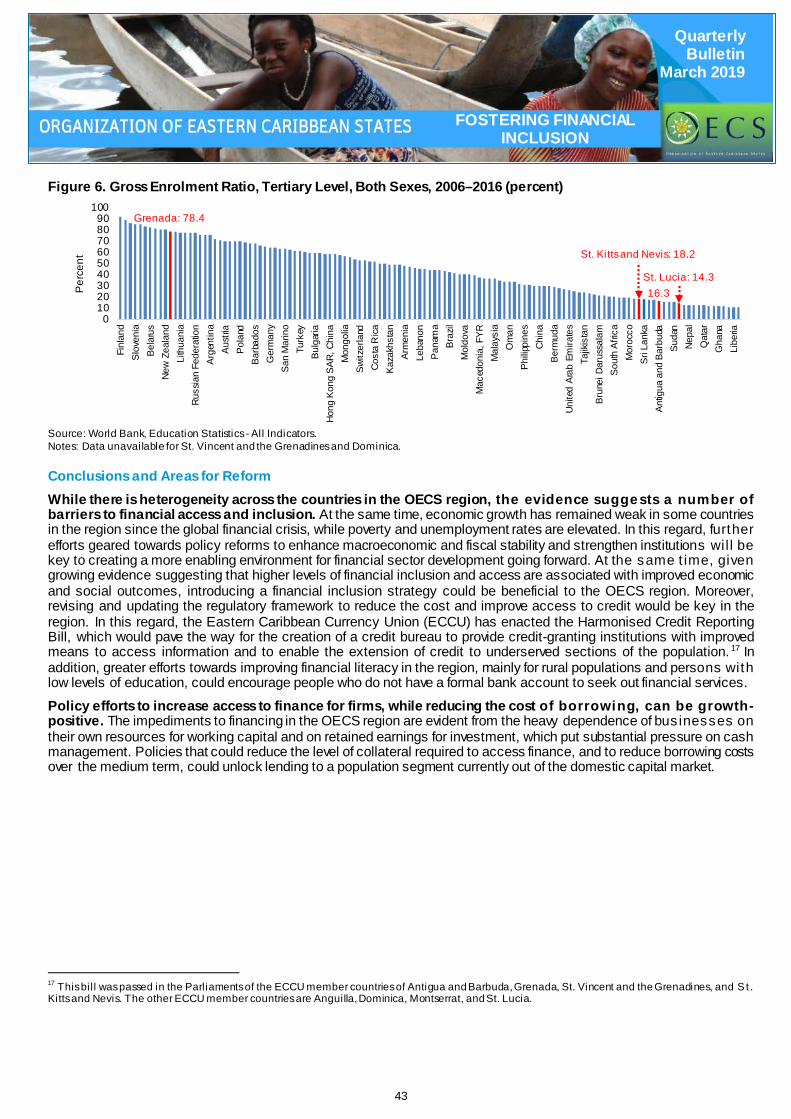
43
Quarterly Bulletin
March 2019
FOSTERING FINANCIAL INCLUSION
Figure 6. Gross Enrolment Ratio, Tertiary Level, Both Sexes, 2006–2016 (percent)
Source: World Bank, Education Statistics - All Indicators. Notes: Data unavailable for St. Vincent and the Grenadines and Dominica. Conclusions and Areas for Reform While there is heterogeneity across the countries in the OECS region, the evidence suggests a number of barriers to financial access and inclusion. At the same time, economic growth has remained weak in some countries in the region since the global financial crisis, while poverty and unemployment rates are elevated. In this regard, further efforts geared towards policy reforms to enhance macroeconomic and fiscal stability and strengthen institutions wil l be key to creating a more enabling environment for financial sector development going forward. At the same t ime, given growing evidence suggesting that higher levels of financial inclusion and access are associated with improved economic and social outcomes, introducing a financial inclusion strategy could be beneficial to the OECS region. Moreover, revising and updating the regulatory framework to reduce the cost and improve access to credit would be key in the region. In this regard, the Eastern Caribbean Currency Union (ECCU) has enacted the Harmonised Credit Reporting Bill, which would pave the way for the creation of a credit bureau to provide credit-granting institutions with improved means to access information and to enable the extension of credit to underserved sections of the population. 17 In addition, greater efforts towards improving financial literacy in the region, mainly for rural populations and persons with low levels of education, could encourage people who do not have a formal bank account to seek out financial services. Policy efforts to increase access to finance for firms, while reducing the cost of borrowing, can be growth-positive. The impediments to financing in the OECS region are evident from the heavy dependence of bus inesses on their own resources for working capital and on retained earnings for investment, which put substantial pressure on cash management. Policies that could reduce the level of collateral required to access finance, and to reduce borrowing costs over the medium term, could unlock lending to a population segment currently out of the domestic capital market.
17 This bil l was passed in the Parliaments of the ECCU member countries of Antigua and Barbuda, Grenada, St. Vincent and the Grenadines, and S t . Kitts and Nevis. The other ECCU member countries are Anguilla, Dominica, Montserrat, and St. Lucia.
Grenada: 78.4
St. Kitts and Nevis: 18.2
16.3St. Lucia: 14.3
0102030405060708090
100
Finl
and
Slov
enia
Bela
rus
New
Zea
land
Lith
uani
aRu
ssia
n Fe
dera
tion
Arge
ntin
aAu
stria
Pola
ndBa
rbad
osG
erm
any
San
Mar
ino
Turk
eyBu
lgar
iaHo
ng K
ong
SAR,
Chi
naM
ongo
liaSw
itzer
land
Cost
a R
icaKa
zakh
stan
Arm
enia
Leba
non
Pana
ma
Braz
ilM
oldo
vaM
aced
onia
, FYR
Mal
aysi
aO
man
Philip
pine
sCh
ina
Berm
uda
Unite
d Ar
ab E
mira
tes
Tajik
ista
nBr
unei
Dar
ussa
lam
Sout
h Af
rica
Mor
occo
Sri L
anka
Antig
ua a
nd B
arbu
daSu
dan
Nepa
lQ
atar
Gha
naLi
beria
Per
cent

Caribbean Region Quarterly Bulletin
For questions or comments please contact email [email protected]
Copyright © 2019 Inter-American Development Bank.This work is licensed under a Creative Commons IGO 3.0 Attribution-NonCommercial-NoDerivatives (CC-IGO BY-NC-ND 3.0 IGO) license (http://creativecommons.org/licenses/by-nc-nd/3.0/igo/legalcode) and may be reproduced with attribution to the IDB and for any non-commercial purpose. No derivative work is allowed. Any dispute related to the use of the works of the IDB that cannot be settled amicably shall be submitted to arbitration pursuant to the UNCITRAL rules. The use of the IDB’s name for any purpose other than for attribution, and the use of IDB’s logo shall be subject to a separate written license agreement between the IDB and the user and is not authorized as part of this CC-IGO license. Note that link provided above includes additional terms and conditions of the license. The opinions expressed in this publication are those of the authors and do not necessarily reflect the views of the Inter-American Development Bank, its Board of Directors, or the countries they represent.
blogs.iadb.org/caribbean-dev-trends
2018:II
2018 and BeyondVolume 7, Issue 2 | June 2018