cargurus, inc
TRANSCRIPT
UNITED STATESSECURITIES AND EXCHANGE COMMISSION
WASHINGTON, DC 20549
FORM 10-Q
(Mark One)☒ QUARTERLY REPORT PURSUANT TO SECTION 13 OR 15(d) OF THE SECURITIES EXCHANGE ACT OF
1934For the quarterly period ended June 30, 2021
OR
☐ TRANSITION REPORT PURSUANT TO SECTION 13 OR 15(d) OF THE SECURITIES EXCHANGE ACT OF1934
For the transition period from _________________ to _________________Commission File Number: 001-38233
CARGURUS, INC.(Exact Name of Registrant as Specified in its Charter)
Delaware 04-3843478(State or other jurisdiction of
incorporation or organization)(I.R.S. Employer
Identification No.)
2 Canal Park, 4th FloorCambridge, Massachusetts 02141
(Address of principal executive offices) (Zip Code)Registrant’s telephone number, including area code: (617) 354-0068
Securities registered pursuant to Section 12(b) of the Act:
Title of Each Class Trading Symbol Name of Exchange on Which RegisteredClass A Common Stock, par value $0.001 per share CARG The Nasdaq Stock Market LLC (Nasdaq Global Select Market)
Indicate by check mark whether the registrant (1) has filed all reports required to be filed by Section 13 or 15(d) of the Securities Exchange Act of 1934during the preceding 12 months (or for such shorter period that the registrant was required to file such reports), and (2) has been subject to such filing requirementsfor the past 90 days. Yes ☒ No ☐
Indicate by check mark whether the registrant has submitted electronically every Interactive Data File required to be submitted pursuant to Rule 405 ofRegulation S-T (§ 232.405 of this chapter) during the preceding 12 months (or for such shorter period that the registrant was required to submit suchfiles). Yes ☒ No ☐
Indicate by check mark whether the registrant is a large accelerated filer, an accelerated filer, a non-accelerated filer, smaller reporting company, or anemerging growth company. See the definitions of “large accelerated filer,” “accelerated filer,” “smaller reporting company,” and “emerging growth company” inRule 12b-2 of the Exchange Act.
Large accelerated filer ☒ Accelerated filer ☐Non-accelerated filer ☐ Small reporting company ☐ Emerging growth company ☐
If an emerging growth company, indicate by check mark if the registrant has elected not to use the extended transition period for complying with any new orrevised financial accounting standards provided pursuant to Section 13(a) of the Exchange Act. ☐
Indicate by check mark whether the registrant is a shell company (as defined in Rule 12b-2 of the Exchange Act). Yes ☐ No ☒
As of July 29, 2021, the registrant had 100,531,108 shares of Class A common stock, $0.001 par value per share, and 16,840,805 shares of Class B commonstock, par value $0.001 per share, outstanding.

Table of Contents
PagePART I. FINANCIAL INFORMATION 1Item 1. Financial Statements 1 Unaudited Condensed Consolidated Balance Sheets 1 Unaudited Condensed Consolidated Income Statements 2 Unaudited Condensed Consolidated Statements of Comprehensive Income 3 Unaudited Condensed Consolidated Statements of Redeemable Noncontrolling Interest and Stockholders’ Equity 4 Unaudited Condensed Consolidated Statements of Cash Flows 5 Notes to Unaudited Condensed Consolidated Financial Statements 6
Item 2. Management’s Discussion and Analysis of Financial Condition and Results of Operations 22Item 3. Quantitative and Qualitative Disclosures About Market Risk 40Item 4. Controls and Procedures 41 PART II. OTHER INFORMATION 42Item 1. Legal Proceedings 42Item 1A. Risk Factors 42Item 6. Exhibits 57Signatures 58
ii

SPECIAL NOTE REGARDING FORWARD‑LOOKING STATEMENTS
This report contains forward‑looking statements within the meaning of the federal securities laws, which statements involve substantial risks anduncertainties. Forward‑looking statements generally relate to future events or our future financial or operating performance. In some cases, you can identifyforward‑looking statements because they contain words such as “anticipates,” “believes,” “could,” “estimates,” “expects,” “intends,” “likely,” “may,”“might,” “plans,” “potential,” “predicts,” “projects,” “seeks,” “should,” “target,” “will,” “would,” or similar expressions and the negatives of those terms.Forward-looking statements contained in this report include, but are not limited to, statements about:
• our future financial performance, including our expectations regarding our revenue, cost of revenue, gross profit or gross margin, operatingexpenses, ability to generate cash flow, and ability to achieve, and maintain, future profitability;
• our growth strategies and our ability to effectively manage any growth;
• our belief that we are building the world’s most trusted and transparent automotive marketplace and creating a differentiated automotive searchexperience for consumers;
• our ability to deliver quality leads at a high volume for our dealer customers;
• our ability to maintain and acquire new customers;
• our ability to maintain and build our brand;
• our ability to succeed internationally;
• our ability to realize benefits from our acquisitions and successfully implement the integration strategies in connection therewith;
• our expectations regarding future share issuances and the exercise of put and call rights in connection with our acquisition of a majority interestin CarOffer, LLC, as well as the associated valuation of redeemable noncontrolling interests;
• the impact of competition in our industry and innovation by our competitors;
• the impact of accounting pronouncements;
• the impact of litigation;
• our ability to hire and retain necessary qualified employees to expand our operations;
• our ability to adequately protect our intellectual property;
• our ability to stay abreast of, and effectively comply with, new or modified laws and regulations that currently apply or become applicable toour business and our beliefs regarding our compliance therewith;
• our ability to overcome challenges facing the automotive industry ecosystem, including inventory supply problems, global supply chainchallenges, the global semiconductor chip shortage, changes to trade policies and other macroeconomic issues;
• failure to maintain an effective system of internal controls necessary to accurately report our financial results and prevent fraud;
• our expectations regarding cash generation and the sufficiency of our cash to fund our operations;
• the future trading prices of our Class A common stock;
• our expectation that we will realize the benefits of deferred tax assets;
• our expected returns on investments;
• our ability to realize cost savings and achieve other benefits for our business from our expense reduction efforts, the impact of such reductionson our business and the timing of payments associated with such efforts;
• our outlook for our Restricted Listings product;
• our expectations regarding future fee reductions for customers; and
• the impacts of the COVID-19 pandemic.
iii

You should not rely upon forward‑looking statements as predictions of future events. We have based the forward‑looking statements contained inthis report primarily on our current expectations and projections about future events and trends that we believe may affect our business, financial condition,operating results, and growth prospects. The outcome of the events described in these forward‑looking statements is subject to risks, uncertainties, andother factors described in the section titled “Risk Factors” and elsewhere in this report. Moreover, we operate in a very competitive and rapidly changingenvironment. New risks and uncertainties emerge from time to time, and it is not possible for us to predict all risks and uncertainties that could have animpact on the forward‑looking statements contained in this report. Further, our forward‑looking statements do not reflect the potential impact of any futureacquisitions, mergers, dispositions or joint ventures in which we may be involved, or investments we may make. We cannot assure you that the results,events, and circumstances reflected in the forward‑looking statements will be achieved or occur, and actual results, events, or circumstances could differmaterially from those described in the forward‑looking statements.
The forward‑looking statements made in this report relate only to events as of the date on which the statements are made. We undertake noobligation to update any forward‑looking statement made in this report to reflect events or circumstances after the date of this report or to reflect newinformation or the occurrence of unanticipated events, except as required by law.
iv
PART I—FINANCIAL INFORMATION
Item 1. Financial Statements.CarGurus, Inc.
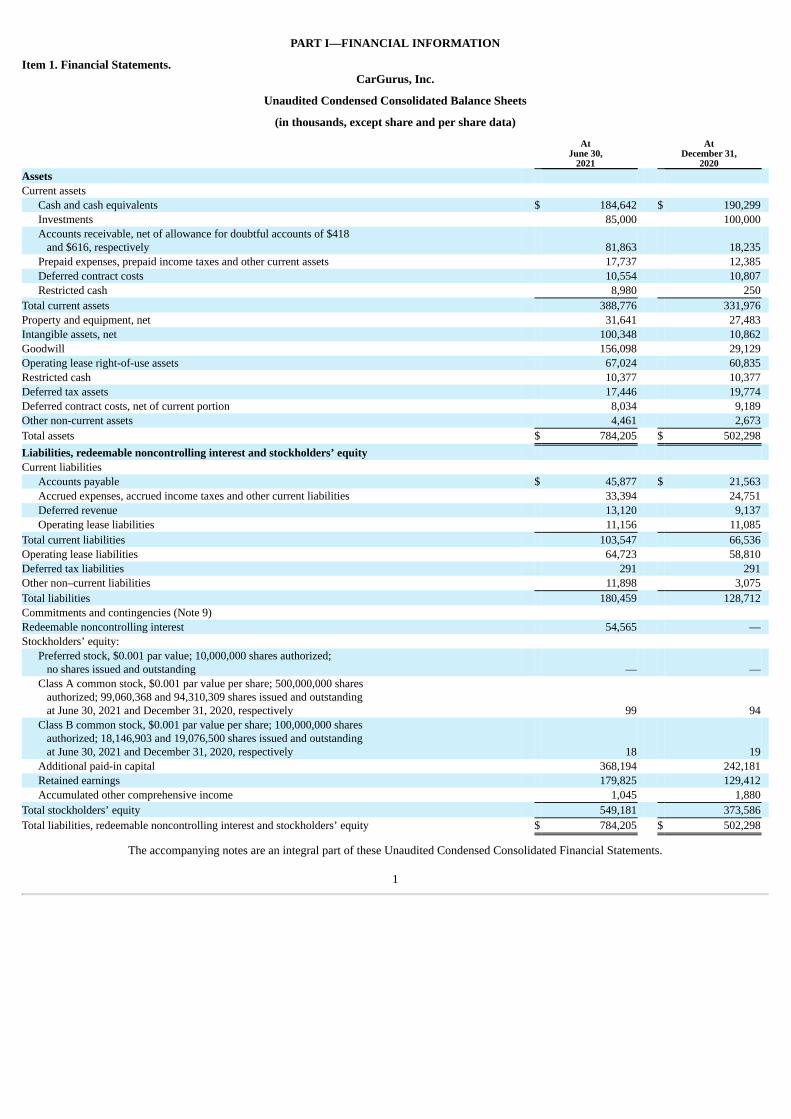
Unaudited Condensed Consolidated Balance Sheets
(in thousands, except share and per share data)
AtJune 30,
2021
AtDecember 31,
2020 Assets Current assets
Cash and cash equivalents $ 184,642 $ 190,299 Investments 85,000 100,000 Accounts receivable, net of allowance for doubtful accounts of $418 and $616, respectively 81,863 18,235 Prepaid expenses, prepaid income taxes and other current assets 17,737 12,385 Deferred contract costs 10,554 10,807 Restricted cash 8,980 250
Total current assets 388,776 331,976 Property and equipment, net 31,641 27,483 Intangible assets, net 100,348 10,862 Goodwill 156,098 29,129 Operating lease right-of-use assets 67,024 60,835 Restricted cash 10,377 10,377 Deferred tax assets 17,446 19,774 Deferred contract costs, net of current portion 8,034 9,189 Other non-current assets 4,461 2,673 Total assets $ 784,205 $ 502,298 Liabilities, redeemable noncontrolling interest and stockholders’ equity Current liabilities
Accounts payable $ 45,877 $ 21,563 Accrued expenses, accrued income taxes and other current liabilities 33,394 24,751 Deferred revenue 13,120 9,137 Operating lease liabilities 11,156 11,085
Total current liabilities 103,547 66,536 Operating lease liabilities 64,723 58,810 Deferred tax liabilities 291 291 Other non–current liabilities 11,898 3,075 Total liabilities 180,459 128,712 Commitments and contingencies (Note 9) Redeemable noncontrolling interest 54,565 — Stockholders’ equity:
Preferred stock, $0.001 par value; 10,000,000 shares authorized; no shares issued and outstanding — — Class A common stock, $0.001 par value per share; 500,000,000 shares authorized; 99,060,368 and 94,310,309 shares issued and outstanding at June 30, 2021 and December 31, 2020, respectively 99 94 Class B common stock, $0.001 par value per share; 100,000,000 shares authorized; 18,146,903 and 19,076,500 shares issued and outstanding at June 30, 2021 and December 31, 2020, respectively 18 19 Additional paid-in capital 368,194 242,181 Retained earnings 179,825 129,412 Accumulated other comprehensive income 1,045 1,880
Total stockholders’ equity 549,181 373,586 Total liabilities, redeemable noncontrolling interest and stockholders’ equity $ 784,205 $ 502,298
The accompanying notes are an integral part of these Unaudited Condensed Consolidated Financial Statements.
1
CarGurus, Inc.
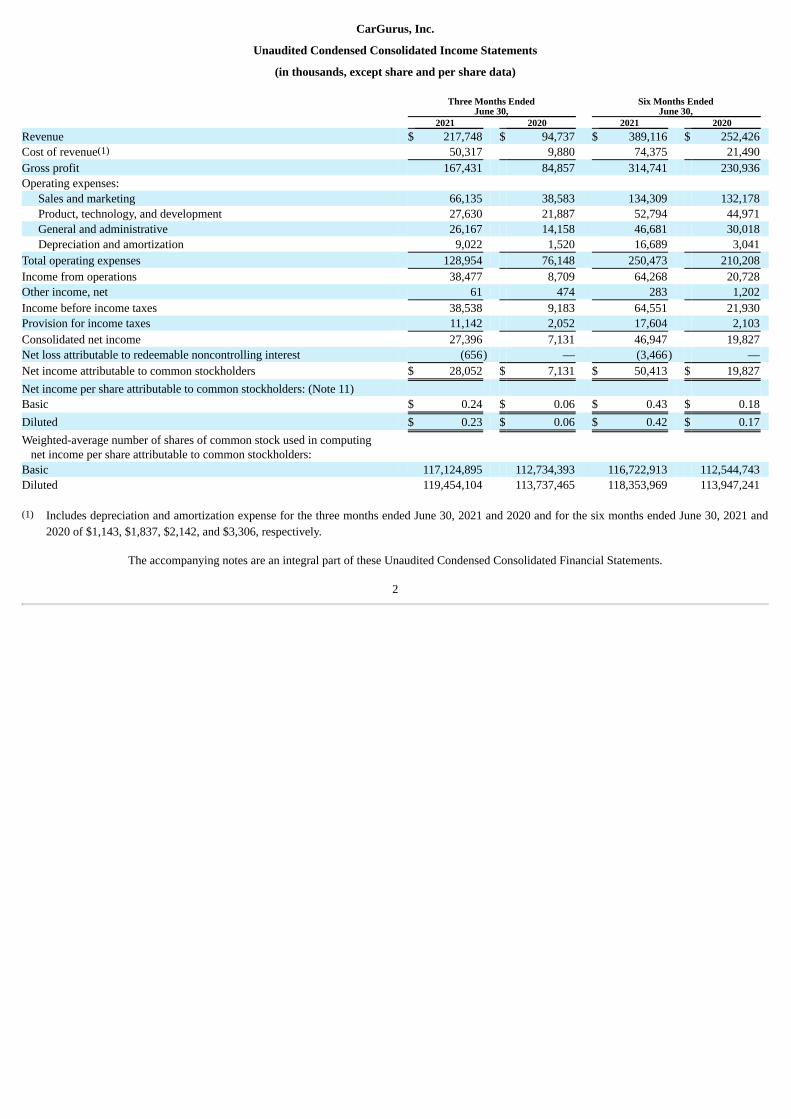
Unaudited Condensed Consolidated Income Statements
(in thousands, except share and per share data)
Three Months Ended
June 30, Six Months Ended
June 30, 2021 2020 2021 2020
Revenue $ 217,748 $ 94,737 $ 389,116 $ 252,426 Cost of revenue(1) 50,317 9,880 74,375 21,490 Gross profit 167,431 84,857 314,741 230,936 Operating expenses:
Sales and marketing 66,135 38,583 134,309 132,178 Product, technology, and development 27,630 21,887 52,794 44,971 General and administrative 26,167 14,158 46,681 30,018 Depreciation and amortization 9,022 1,520 16,689 3,041
Total operating expenses 128,954 76,148 250,473 210,208 Income from operations 38,477 8,709 64,268 20,728 Other income, net 61 474 283 1,202 Income before income taxes 38,538 9,183 64,551 21,930 Provision for income taxes 11,142 2,052 17,604 2,103 Consolidated net income 27,396 7,131 46,947 19,827 Net loss attributable to redeemable noncontrolling interest (656) — (3,466) — Net income attributable to common stockholders $ 28,052 $ 7,131 $ 50,413 $ 19,827 Net income per share attributable to common stockholders: (Note 11) Basic $ 0.24 $ 0.06 $ 0.43 $ 0.18 Diluted $ 0.23 $ 0.06 $ 0.42 $ 0.17 Weighted-average number of shares of common stock used in computing net income per share attributable to common stockholders: Basic 117,124,895 112,734,393 116,722,913 112,544,743 Diluted 119,454,104 113,737,465 118,353,969 113,947,241
(1) Includes depreciation and amortization expense for the three months ended June 30, 2021 and 2020 and for the six months ended June 30, 2021 and
2020 of $1,143, $1,837, $2,142, and $3,306, respectively.
The accompanying notes are an integral part of these Unaudited Condensed Consolidated Financial Statements.
2
CarGurus, Inc.
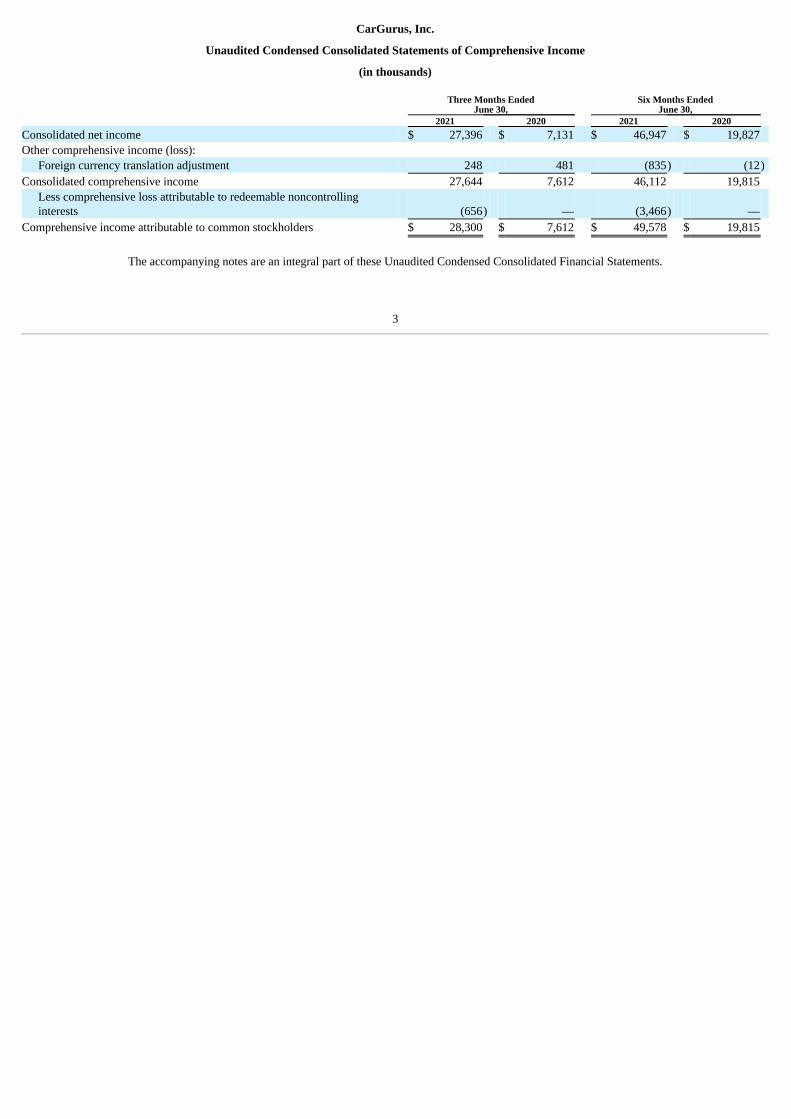
Unaudited Condensed Consolidated Statements of Comprehensive Income
(in thousands)
Three Months Ended
June 30, Six Months Ended
June 30, 2021 2020 2021 2020
Consolidated net income $ 27,396 $ 7,131 $ 46,947 $ 19,827 Other comprehensive income (loss):
Foreign currency translation adjustment 248 481 (835) (12)Consolidated comprehensive income 27,644 7,612 46,112 19,815
Less comprehensive loss attributable to redeemable noncontrollinginterests (656) — (3,466) —
Comprehensive income attributable to common stockholders $ 28,300 $ 7,612 $ 49,578 $ 19,815
The accompanying notes are an integral part of these Unaudited Condensed Consolidated Financial Statements.
3
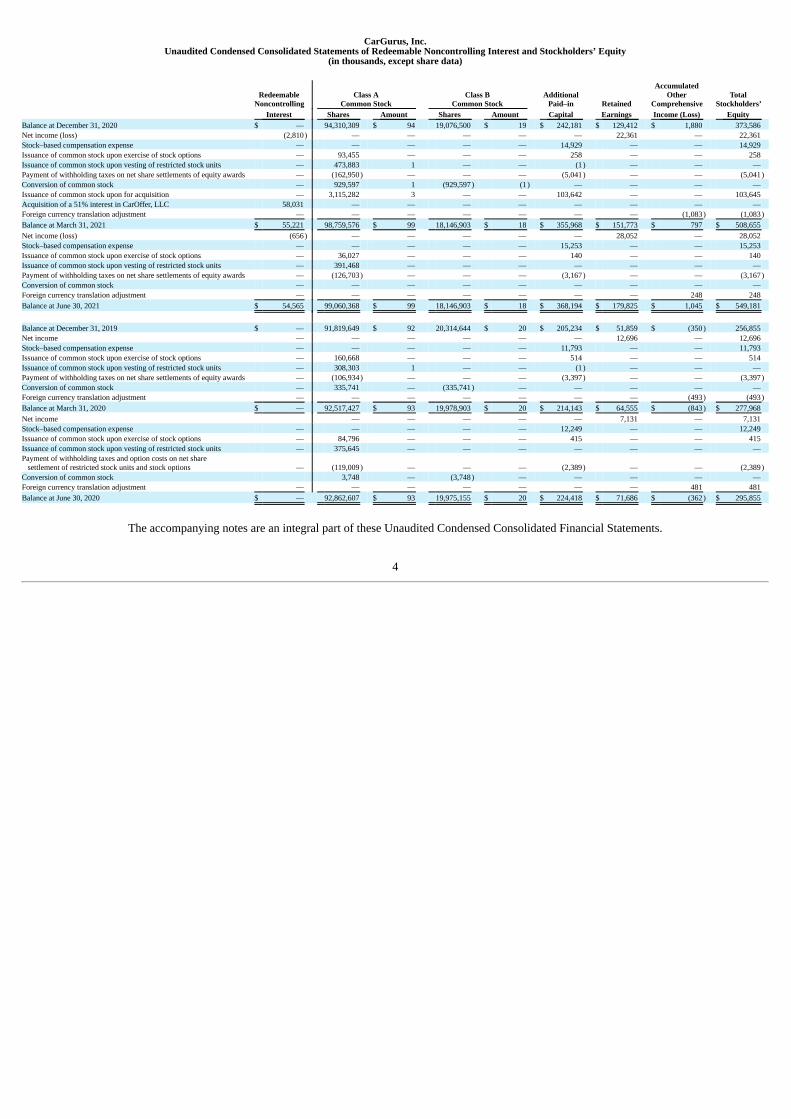
CarGurus, Inc.Unaudited Condensed Consolidated Statements of Redeemable Noncontrolling Interest and Stockholders’ Equity
(in thousands, except share data)
Redeemable
Noncontrolling Class A
Common Stock Class B
Common Stock Additional
Paid–in Retained
AccumulatedOther
Comprehensive Total
Stockholders’ Interest Shares Amount Shares Amount Capital Earnings Income (Loss) Equity
Balance at December 31, 2020 $ — 94,310,309 $ 94 19,076,500 $ 19 $ 242,181 $ 129,412 $ 1,880 373,586 Net income (loss) (2,810) — — — — — 22,361 — 22,361 Stock–based compensation expense — — — — — 14,929 — — 14,929 Issuance of common stock upon exercise of stock options — 93,455 — — — 258 — — 258 Issuance of common stock upon vesting of restricted stock units — 473,883 1 — — (1 ) — — — Payment of withholding taxes on net share settlements of equity awards — (162,950) — — — (5,041) — — (5,041)Conversion of common stock — 929,597 1 (929,597) (1 ) — — — — Issuance of common stock upon for acquisition — 3,115,282 3 — — 103,642 — — 103,645 Acquisition of a 51% interest in CarOffer, LLC 58,031 — — — — — — — — Foreign currency translation adjustment — — — — — — — (1,083) (1,083)Balance at March 31, 2021 $ 55,221 98,759,576 $ 99 18,146,903 $ 18 $ 355,968 $ 151,773 $ 797 $ 508,655 Net income (loss) (656) — — — — — 28,052 — 28,052 Stock–based compensation expense — — — — — 15,253 — — 15,253 Issuance of common stock upon exercise of stock options — 36,027 — — — 140 — — 140 Issuance of common stock upon vesting of restricted stock units — 391,468 — — — — — — — Payment of withholding taxes on net share settlements of equity awards — (126,703) — — — (3,167) — — (3,167)Conversion of common stock — — — — — — — — — Foreign currency translation adjustment — — — — — — — 248 248 Balance at June 30, 2021 $ 54,565 99,060,368 $ 99 18,146,903 $ 18 $ 368,194 $ 179,825 $ 1,045 $ 549,181
Balance at December 31, 2019 $ — 91,819,649 $ 92 20,314,644 $ 20 $ 205,234 $ 51,859 $ (350) 256,855 Net income — — — — — — 12,696 — 12,696 Stock–based compensation expense — — — — — 11,793 — — 11,793 Issuance of common stock upon exercise of stock options — 160,668 — — — 514 — — 514 Issuance of common stock upon vesting of restricted stock units — 308,303 1 — — (1 ) — — — Payment of withholding taxes on net share settlements of equity awards — (106,934) — — — (3,397) — — (3,397)Conversion of common stock — 335,741 — (335,741) — — — — — Foreign currency translation adjustment — — — — — — — (493) (493)Balance at March 31, 2020 $ — 92,517,427 $ 93 19,978,903 $ 20 $ 214,143 $ 64,555 $ (843) $ 277,968 Net income — — — — — 7,131 — 7,131 Stock–based compensation expense — — — — — 12,249 — — 12,249 Issuance of common stock upon exercise of stock options — 84,796 — — — 415 — — 415 Issuance of common stock upon vesting of restricted stock units — 375,645 — — — — — — — Payment of withholding taxes and option costs on net share settlement of restricted stock units and stock options — (119,009) — — — (2,389) — — (2,389)Conversion of common stock 3,748 — (3,748) — — — — — Foreign currency translation adjustment — — — — — — — 481 481 Balance at June 30, 2020 $ — 92,862,607 $ 93 19,975,155 $ 20 $ 224,418 $ 71,686 $ (362) $ 295,855
The accompanying notes are an integral part of these Unaudited Condensed Consolidated Financial Statements.
4

CarGurus, Inc.
Unaudited Condensed Consolidated Statements of Cash Flows
(in thousands)
Six Months Ended
June 30, 2021 2020
Operating Activities Consolidated net income $ 46,947 $ 19,827 Adjustments to reconcile consolidated net income to net cash provided by operating activities: Depreciation and amortization 18,831 6,347 Currency gain on foreign denominated transactions (30) (91)Deferred taxes 2,336 4,695 Provision for doubtful accounts 450 1,658 Stock-based compensation expense 28,747 23,375 Amortization of deferred contract costs 6,454 5,641 Changes in operating assets and liabilities:
Accounts receivable, net (47,982) 5,653 Prepaid expenses, prepaid income taxes, and other assets (4,018) 2,835 Deferred contract costs (5,098) (4,074)Accounts payable 15,333 (25,914)Accrued expenses, accrued income taxes, and other liabilities 15,580 (4,134)Deferred revenue 3,989 (1,788)Lease obligations (204) 898
Net cash provided by operating activities 81,335 34,928 Investing Activities Purchases of property and equipment (4,672) (2,571)Capitalization of website development costs (2,109) (1,695)Cash paid for acquisitions, net of cash acquired (64,273) (21,004)Investments in certificates of deposit (45,000) — Maturities of certificates of deposit 60,000 68,692 Net cash (used in) provided by investing activities (56,054) 43,422 Financing Activities Proceeds from exercise of stock options 398 929 Payment of finance lease obligations (13) (18)Payment of withholding taxes and option costs on net share settlement of restricted stock units and stock options (8,208) (5,786)Repayment of line of credit (14,250) — Net cash used in financing activities (22,073) (4,875)Impact of foreign currency on cash, cash equivalents, and restricted cash (135) 24 Net increase in cash, cash equivalents, and restricted cash 3,073 73,499 Cash, cash equivalents, and restricted cash at beginning of period 200,926 70,723 Cash, cash equivalents, and restricted cash at end of period $ 203,999 $ 144,222 Supplemental disclosure of cash flow information: Cash paid for income taxes $ 8,220 $ 26 Unpaid purchases of property and equipment $ 245 $ 7 Capitalized stock-based compensation expense in website development and internal-use software costs $ 1,435 $ 667 Cash paid for operating lease liabilities $ 8,064 $ 6,260 Obtaining a right-of-use asset in exchange for a finance lease liability $ 664 $ — Obtaining a right-of-use asset in exchange for an operating lease liability $ 12,336 $ — Issuance of stock for acquisition $ 103,645 $ —
The accompanying notes are an integral part of these Unaudited Condensed Consolidated Financial Statements.
5
CarGurus, Inc.
Notes to Unaudited Condensed Consolidated Financial Statements
(dollars in thousands, except share and per share data, unless otherwise noted)
1. Organization and Business Description
CarGurus, Inc. (the “Company”) is a multinational, online automotive platform for buying and selling vehicles that is building upon its industry-leading listings marketplace with both digital retail solutions and the CarOffer online wholesale platform. The CarGurus marketplace gives consumers theconfidence to purchase or sell a vehicle either online or in-person; and gives dealerships the power to accurately price, effectively market, instantly acquireand quickly sell vehicles, all with a nationwide reach. The Company uses proprietary technology, search algorithms and data analytics to bring trust,transparency and competitive pricing to the automotive shopping experience.
The Company is headquartered in Cambridge, Massachusetts and was incorporated in the State of Delaware on June 26, 2015.
The Company operates principally in the United States. In the United States, it also operates the Autolist online marketplace, which it wholly owns,and the CarOffer, LLC (“CarOffer”) digital wholesale marketplace, in which it has a 51% interest, as independent brands. In addition to the United States,the Company operates online marketplaces under the CarGurus brand in Canada and the United Kingdom. In the United Kingdom, it also operates thePistonHeads online marketplace, which it wholly owns, as an independent brand. The Company also operated online marketplaces in Germany, Italy, andSpain until it ceased the operations of each of these marketplaces in the second quarter of 2020.
The Company has subsidiaries in the United States, Canada, Ireland, and the United Kingdom. Additionally, it has two reportable segments, UnitedStates and International. See Note 13 of the Unaudited Condensed Consolidated Financial Statements included elsewhere in this Quarterly Report.
2. Summary of Significant Accounting Policies
Basis of Presentation
The accompanying interim condensed consolidated financial statements (the “Unaudited Condensed Consolidated Financial Statements”) areunaudited. The Unaudited Condensed Consolidated Financial Statements and related disclosures have been prepared in conformity with accountingprinciples generally accepted in the United States of America (“GAAP”). Any reference in these notes to applicable guidance is meant to refer to GAAP asfound in the Accounting Standards Codification (“ASC”) and Accounting Standards Update (“ASU”) of the Financial Accounting Standards Board(“FASB”).
The Unaudited Condensed Consolidated Financial Statements have also been prepared pursuant to the rules and regulations of the Securities andExchange Commission (“SEC”). Accordingly, certain information and footnote disclosures normally included in financial statements prepared inaccordance with GAAP have been condensed or omitted pursuant to such rules and regulations. The Unaudited Condensed Consolidated FinancialStatements reflect all adjustments, consisting of only normal recurring adjustments, necessary for the fair presentation of the Company’s financial positionas of June 30, 2021 and December 31, 2020, results of operations, comprehensive income, changes in shareholders’ equity for the three and six monthsended June 30, 2021 and 2020 and cash flows for the six months ended June 30, 2021 and 2020. These interim period results are not necessarily indicativeof the results to be expected for any other interim period or the full year.
The Unaudited Condensed Consolidated Financial Statements should be read in conjunction with the Company’s audited consolidated financialstatements and the notes thereto included in the Company’s Annual Report on Form 10-K for the year ended December 31, 2020, filed with the SEC onFebruary 12, 2021 (the “Annual Report”).
In the Unaudited Condensed Consolidated Statements of Cash Flows for the six months ended June 30, 2020, the Company presented other non-current liabilities with accrued expenses, accrued income taxes and other current liabilities to conform to the current year presentation as it did not meet thedisclosure threshold.
Principles of Consolidation
The accompanying Unaudited Condensed Consolidated Financial Statements include the accounts of the Company and its subsidiaries. Allintercompany balances and transactions have been eliminated in consolidation.
6
Subsequent Event Considerations
The Company considers events or transactions that occur after the balance sheet date but prior to the issuance of the financial statements to provideadditional evidence for certain estimates or to identify matters that require additional disclosure. The Company has evaluated all subsequent events anddetermined that there are no material recognized or unrecognized subsequent events requiring disclosure.
Use of Estimates
The preparation of the Unaudited Condensed Consolidated Financial Statements in conformity with GAAP requires management to make estimatesand assumptions that affect the reported amounts of assets and liabilities, and the disclosure of contingent assets and liabilities at the date of the financialstatements, and the reported amounts of revenue and expenses during the reporting period.
Although the Company regularly assesses these estimates, actual results could differ materially from these estimates. The Company bases its estimateson historical experience and various other assumptions that it believes to be reasonable under the circumstances. Actual results may differ frommanagement’s estimates if these results differ from historical experience, or other assumptions do not turn out to be substantially accurate, even if suchassumptions are reasonable when made. Changes in estimates are recorded in the period in which they become known.
Significant estimates relied upon in preparing the Unaudited Condensed Consolidated Financial Statements include the determination of salesallowance and variable consideration in the Company’s revenue recognition, allowance for doubtful accounts, the valuation of a redeemable noncontrollinginterest, the valuation of equity and liability-classified compensation awards under ASC 718, the expensing and capitalization of product, technology, anddevelopment costs for website development and internal‑use software, the valuation and recoverability of goodwill and intangible assets and other long-lived assets, and the recoverability of the Company’s net deferred tax assets and related valuation allowance. Accordingly, the Company considers these tobe its critical accounting policies, and believes that of the Company’s significant accounting policies, these policies involve the greatest degree of judgmentand complexity.
Concentration of Credit Risk
The Company has no significant off‑balance sheet risk, such as foreign exchange contracts, option contracts, or other foreign hedging arrangements.Financial instruments that potentially expose the Company to concentrations of credit risk consist primarily of cash, cash equivalents, investments, andtrade accounts receivable.
The Company maintains its cash, cash equivalents, and investments principally with accredited financial institutions of high credit standing. Althoughthe Company deposits its cash, cash equivalents, and investments with multiple financial institutions, its deposits may often exceed governmental insuredlimits.
Credit risk with respect to accounts receivable is dispersed due to the large number of customers. The Company routinely assesses thecreditworthiness of its customers. The Company generally has not experienced any material losses related to receivables from individual customers, orgroups of customers. The Company does not require collateral. Due to these factors, no additional credit risk beyond amounts provided for collection lossesis believed by management to be probable in the Company’s accounts receivable.
For the three and six months ended June 30, 2021 and 2020, no individual customer accounted for more than 10% of total revenue.
As of June 30, 2021, one customer accounted for 29% of net accounts receivable. As of December 31, 2020, one customer accounted forapproximately 10% of net accounts receivable.
Included in net accounts receivable at June 30, 2021 and December 31, 2020 are $6,012 and $7,426, respectively, of unbilled accounts receivablerelating primarily to advertising customers billed in a period subsequent to services rendered.
Significant Accounting Policies
The Unaudited Condensed Consolidated Financial Statements reflect the application of certain significant accounting policies as described below andelsewhere in these notes to the Unaudited Condensed Consolidated Financial Statements. As of June 30, 2021, the Company’s significant accountingpolicies and estimates, which are detailed in the Annual Report, have not changed, other than those impacted by the acquisition of a 51% interest inCarOffer and recently issued equity awards, as described below.
7
Redeemable Noncontrolling Interest
In connection with the Company’s acquisition of a 51% interest in CarOffer on January 14, 2021, the Company became a party with thenoncontrolling equity holders of CarOffer to the CarOffer Operating Agreement (as defined in Note 4 of the Unaudited Condensed Consolidated FinancialStatements included elsewhere in this Quarterly Report), which, among other matters, sets forth certain put and call rights described in Note 4 of theUnaudited Condensed Consolidated Financial Statements included elsewhere in this Quarterly Report. The CarOffer Operating Agreement provides theCompany with the right to purchase, and the noncontrolling equity holders with the right to sell to the Company, the noncontrolling CarOffer equityholders’ equity interests in CarOffer at a contractually defined formulaic purchase price, which is based on a multiple of earnings. As the purchase iscontingently redeemable at the option of the noncontrolling equity holders, the Company classifies the carrying amount of the redeemable noncontrollinginterests in the mezzanine section on the Unaudited Condensed Consolidated Balance Sheet, which is presented above the equity section and below theliabilities section. As of the acquisition date, the noncontrolling interest was recognized at fair value computed using the Least Square Monte CarloSimulation approach. Significant inputs to the model include market price of risk, volatility, correlation and risk-free rate.
Subsequent to the Company’s acquisition of the 51% interest on January 14, 2021, the redeemable noncontrolling interest is measured at the greater of
the amount that would be paid if settlement occurred as of the balance sheet date based on the contractually defined redemption value and its carryingamount adjusted for net loss attributable to the noncontrolling interest. Adjustments to the carrying value of the redeemable noncontrolling interestresulting from changes in the redemption value are recorded through retained earnings in the Unaudited Condensed Consolidated Balance Sheet.
Revenue Recognition – Other Revenue
The Company generates other revenue primarily from revenue relating to the wholesale sale of automobiles, display advertising revenue from automanufacturers and other auto-related brand advertisers and revenue from partnerships with financing services companies. CarOffer revenue is comprisedentirely of wholesale revenue.
Wholesale revenue includes transaction fees earned by CarOffer from facilitating the purchase and sale of vehicles between dealers, where CarOffercollects fees from both the buyer and seller. CarOffer also sells vehicles to dealers that CarOffer acquires at other marketplaces or directly from consumers– in these instances, CarOffer collects a transaction fee from the buyer. CarOffer also charges the buyer fees to perform inspection and transportationservices for all wholesale transactions.
For wholesale transactions, CarOffer generally does not control the vehicle and therefore acts as an agent in the transaction. Revenue earned from thefees for facilitating these wholesale transactions is recognized at a point in time when the vehicle is sold and revenue is recognized on a net basis.
For vehicles sold to dealers that are acquired at other marketplaces and directly from consumers, CarOffer recognizes the vehicles on its balance sheetin inventory for the short period of time it possesses the vehicle title and the fees received for the vehicle are typically recognized on a net basis. In limitedcircumstances, typically during an arbitration process, CarOffer acquires vehicles in transactions for which it is deemed to control the vehicle andtherefore is deemed to be the principal. In these situations, the inventory is recorded on the balance sheet and valued at the lower of cost or net realizablevalue. The Company records inventory within prepaid expenses, prepaid income taxes and other current assets within the Unaudited CondensedConsolidated Balance Sheets.
CarOffer is deemed to control both inspection and transportation services, as it is primarily responsible for fulfillment and therefore acts as a principal.CarOffer leverages a network of third-party inspection service providers and transportation carriers. Revenue from fees for inspection services isrecognized at the point in time when the inspection is performed and revenue from fees for transportation services is recognized over time as delivery iscompleted. Unearned revenue related to unsatisfied performance obligations is recorded as deferred revenue.
Stock‑Based Compensation
For stock‑based awards granted under the Company’s stock‑based compensation plans, the fair value of each award is determined on the date of grant.
For restricted stock units (“RSUs”) granted subject to service-based vesting conditions, the fair value is determined based on the closing price of theCompany’s Class A common stock, par value $0.001 per share (the “Class A common stock”), as reported on the Nasdaq Global Select Market on the dateof grant. RSUs granted subject to service-based vesting conditions generally vest over a four-year requisite service period.
8
For RSUs granted subject to market-based vesting conditions, the fair value is determined using the Monte Carlo simulation lattice model. Thedetermination of the fair value using this model is affected by the Company’s stock price performance relative to the companies listed on the S&P 500 as ofDecember 31, 2020 and a number of assumptions including volatility, correlation coefficient, risk-free interest rate and expected dividends. RSUs grantedsubject to market-based vesting conditions vest upon achievement of specified levels of market conditions.
For stock options granted, the fair value is determined on the date of grant using the Black‑Scholes option‑pricing model. The determination of thefair value is affected by the Company’s stock price and a number of assumptions including volatility, term, risk-free interest rate and dividend yield. Stockoptions granted generally have a term of ten years from the date of grant and generally vest over a four-year requisite service period.
In connection with the Company’s acquisition of a 51% interest in CarOffer, the unvested incentive units (“CO Incentive Units”) of CarOfferremained outstanding and will vest over the requisite service period. CO Incentive Units are liability-classified awards because the awards can be put to theCompany at a formula price such that the holders do not bear the risks and rewards associated with equity ownership. For liability-classified awards, thefair value is determined on the date of issuance using a Least Square Monte Carlo simulation model. The determination of the fair value is affected byCarOffer’s equity value, EBITDA and revenue forecasts that drive the exercise price of future call/put rights, as well as a number of assumptions includingmarket price of risk, volatility, correlation, and risk-free interest rate. Liability-classified awards are remeasured to fair value each period until settlement.
Grants are subject to the CarOffer 2020 Equity Incentive Plan, adopted effective November 24, 2020 (the “2020 CO Plan”), the applicable awardagreement, and the CarOffer Operating Agreement. Following the Company’s acquisition of the 51% interest in CarOffer on January 14, 2021, remainingunvested incentive interests will vest over a period of three (3) years, one third each on the first, second, and third anniversaries of January 14, 2021,provided that a grantee’s continuous service to CarOffer has not terminated on the applicable vesting date. Under the terms of the grants, vesting ofunvested incentive interests is accelerated in the event of (i) a change of control of CarOffer (which, for the avoidance of doubt, does not include theCompany’s acquisition of the 51% interest on January 14, 2021), (ii) the death or disability of the grantee, (iii) termination of the grantee’s employmentwith CarOffer without cause, or (iv) termination of grantee’s employment by the grantee for good reason. Upon termination of a grantee’s continuousservice to CarOffer voluntarily by the grantee (other than for good reason) or by CarOffer for cause, all of such grantee’s unvested incentive interests areforfeited. In addition, if a grantee’s continuous service terminates then CarOffer has the option to repurchase any outstanding incentive interests from thegrantee.
In addition to the 2020 CO Plan, on December 9, 2020 CarOffer entered into a Vesting Agreement (the “Vesting Agreement”) regarding the vestingof CarOffer equity interests beneficially owned by Bruce Thompson, the founder and CEO of CarOffer, and certain affiliated persons (the “T5 Holders”) inconnection with the Company’s anticipated acquisition of a 51% interest in CarOffer. Pursuant to the Vesting Agreement, 432,592 Class CO CarOffer units(the “Subject Units”) beneficially owned by the T5 Holders will vest in three (3) equal installments on the first, second, and third anniversary of the closingof the CarOffer Acquisition. As more particularly described in the Vesting Agreement, unvested Subject Units are subject to forfeiture in the event that Mr.Thompson’s relationship with CarOffer terminates other than in the event of a termination without cause (as defined in the Vesting Agreement) or due toMr. Thompson’s death or disability. The Vesting Agreement also provides for acceleration of any unvested Subject Units in the event of the termination ofMr. Thompson’s employment with CarOffer without cause, Mr. Thompson’s death or disability, or the consummation of an eligible liquidity event (asdefined in the Vesting Agreement).
The Company issues shares for RSUs and stock option exercises out of its shares available for issuance. The Company issues CO Incentive Units outof CarOffer’s units available for issuance. The Company accounts for forfeitures when they occur.
The Company recognizes compensation expense on a straight-line basis over the requisite service period for each separate vesting portion of theaward, with the amount of compensation expense recognized at any date at least equaling the portion of the grant-date fair value of the award that is vestedat that date.
The tax effect of differences between tax deductions related to stock compensation and the corresponding financial statement expense compensationare recorded to tax expense. Excess tax benefits recognized on stock‑based compensation expense are classified as an operating activity in the UnauditedCondensed Consolidated Statements of Cash Flows.
9
Recent Accounting Pronouncements Adopted
Income Taxes
In December 2019, the FASB issued ASU 2019-12, Income Taxes – Simplifying the Accounting for Income Taxes (“ASU 2019-12”). ASU 2019-12simplifies the accounting for income taxes by removing several exceptions in the current standard and adding guidance to reduce complexity in certainareas, such as requiring that an entity reflect the effect of an enacted change in tax laws or rates in the annual effective tax rate computation in the interimperiod that includes the enactment date. The standard is effective for fiscal years, and interim periods within those fiscal years, beginning after December15, 2020, with early adoption permitted. The Company adopted the guidance on January 1, 2021. The adoption did not have an impact on the UnauditedCondensed Consolidated Financial Statements.
Recent Accounting Pronouncements Not Yet Adopted
From time to time, new accounting pronouncements are issued by the FASB or other standard setting bodies and adopted by the Company on or priorto the specified effective date. Unless otherwise discussed, the Company believes that the impact of recently issued standards that are not yet effective willnot have a material impact on its financial position or results of operations upon adoption. As of June 30, 2021, there are no new accountingpronouncements that the Company is considering adopting. 3. Revenue Recognition
Revenue Recognition
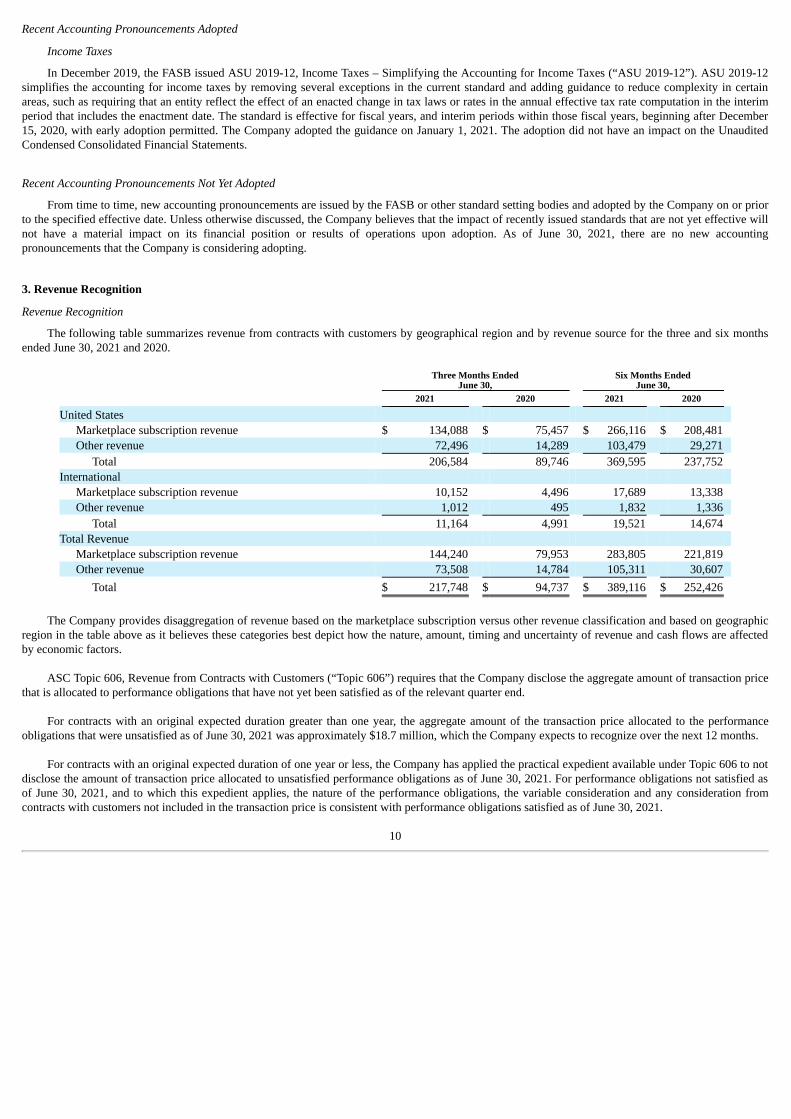
The following table summarizes revenue from contracts with customers by geographical region and by revenue source for the three and six monthsended June 30, 2021 and 2020.
Three Months Ended
June 30, Six Months Ended
June 30, 2021 2020 2021 2020
United States Marketplace subscription revenue $ 134,088 $ 75,457 $ 266,116 $ 208,481 Other revenue 72,496 14,289 103,479 29,271
Total 206,584 89,746 369,595 237,752 International
Marketplace subscription revenue 10,152 4,496 17,689 13,338 Other revenue 1,012 495 1,832 1,336
Total 11,164 4,991 19,521 14,674 Total Revenue
Marketplace subscription revenue 144,240 79,953 283,805 221,819 Other revenue 73,508 14,784 105,311 30,607
Total $ 217,748 $ 94,737 $ 389,116 $ 252,426
The Company provides disaggregation of revenue based on the marketplace subscription versus other revenue classification and based on geographic
region in the table above as it believes these categories best depict how the nature, amount, timing and uncertainty of revenue and cash flows are affectedby economic factors.
ASC Topic 606, Revenue from Contracts with Customers (“Topic 606”) requires that the Company disclose the aggregate amount of transaction pricethat is allocated to performance obligations that have not yet been satisfied as of the relevant quarter end.
For contracts with an original expected duration greater than one year, the aggregate amount of the transaction price allocated to the performanceobligations that were unsatisfied as of June 30, 2021 was approximately $18.7 million, which the Company expects to recognize over the next 12 months.
For contracts with an original expected duration of one year or less, the Company has applied the practical expedient available under Topic 606 to notdisclose the amount of transaction price allocated to unsatisfied performance obligations as of June 30, 2021. For performance obligations not satisfied asof June 30, 2021, and to which this expedient applies, the nature of the performance obligations, the variable consideration and any consideration fromcontracts with customers not included in the transaction price is consistent with performance obligations satisfied as of June 30, 2021.
10
Revenue recognized during the three months ended June 30, 2021 and 2020 and the six months ended June 30, 2021 and 2020, from amounts includedin deferred revenue at the beginning of the period, was approximately $11,986, $5,042, $9,137 and $9,984, respectively.
In response to the COVID-19 pandemic, the Company reduced the subscription fees for paying dealers by at least 50% on all marketplacesubscriptions for the April and May 2020 service periods, as well as provided a fee reduction on all June 2020 marketplace subscriptions of 20% for payingdealers in the United States and Canada and 50% for paying dealers in the United Kingdom. These fee reductions resulted in a modification to contractswith initial contractual periods greater than one month. For any contract modified, the Company calculated the remaining transaction price and allocatedthe consideration over the remaining performance obligations. The Company also waived subscription fees for paying dealers in the United Kingdom forthe December 2020 and February 2021 service periods. These fee reductions are included in the Company’s variable consideration assessment. The feereductions had an immaterial impact on the Company’s revenues for the three and six months ended June 30, 2021 and a material impact on the Company’srevenues for the three and six months ended June 30, 2020.
4. Acquisitions
On January 14, 2021, the Company acquired a 51% interest in CarOffer, which provides an automated instant vehicle trade platform and is based inAddison, Texas, pursuant to the terms of a Membership Interest Purchase Agreement (the “Purchase Agreement”) dated as of December 9, 2020 (the“Agreement Date”), as amended, by and among the Company, CarOffer, CarOffer Investors Holding, LLC, a Delaware limited liability company(“TopCo”), each of the Members of TopCo (the “Members”), and Bruce T. Thompson, an individual residing in Texas (the “Members’Representative”). This acquisition (the “CarOffer Acquisition”) is intended to add wholesale vehicle purchasing and selling capabilities to CarGurus’portfolio of dealer offerings and create a complete and efficient digital solution for dealers to sell and acquire vehicles at both retail and wholesale.
Upon consummation of the transactions contemplated by the Purchase Agreement (the “Closing”), the Company acquired a 51% interest in CarOffer
for an aggregate consideration of $173,155 (the “Total Consideration”), such Total Consideration consisting of (a) shares of Class A common stock in theaggregate amount of $103,645 (the “Stock Consideration”) and (b) $69,510 in cash (the “Cash Consideration”). The number of shares of Class A commonstock issued following the Closing in connection with the Stock Consideration was 3,115,282, which was calculated by reference to a value of $22.51 pershare, which equals the volume-weighted average closing price per share of Class A common stock on the Nasdaq Stock Market for the 28 consecutivetrading days ending on the third Business Day (as defined in the Purchase Agreement) preceding the Agreement Date. Pursuant to the Purchase Agreement,the remaining equity in CarOffer (the “Remaining Equity”) is being retained by the then-current equity holders of CarOffer and subject to certain call andput arrangements discussed below.
Pursuant to the Purchase Agreement, the Company established a retention pool in an aggregate amount of $8,000 in the form of RSUs to be issued
pursuant to the Company’s standard form of RSU agreement under the 2017 Plan, (i) $6,000 of which was granted to certain CarOffer employees followingthe Closing in accordance with the terms of the Purchase Agreement and (ii) $2,000 of which is available for issuance to future CarOffer employees inaccordance with the terms of the Purchase Agreement. RSUs issued from the retention pool will be subject to vesting based on rendering of future services.
As of June 30, 2021, the Company incurred total acquisition-related costs of $2,647 related to the CarOffer Acquisition, of which $65 and $709 was
incurred during the three and six months ended June 30, 2021, respectively, and recorded as general and administrative operating expenses within theUnaudited Condensed Consolidated Income Statements. Acquisition-related costs were excluded from the purchase price allocation as they were primarilycomprised of legal, professional and consulting expenses.
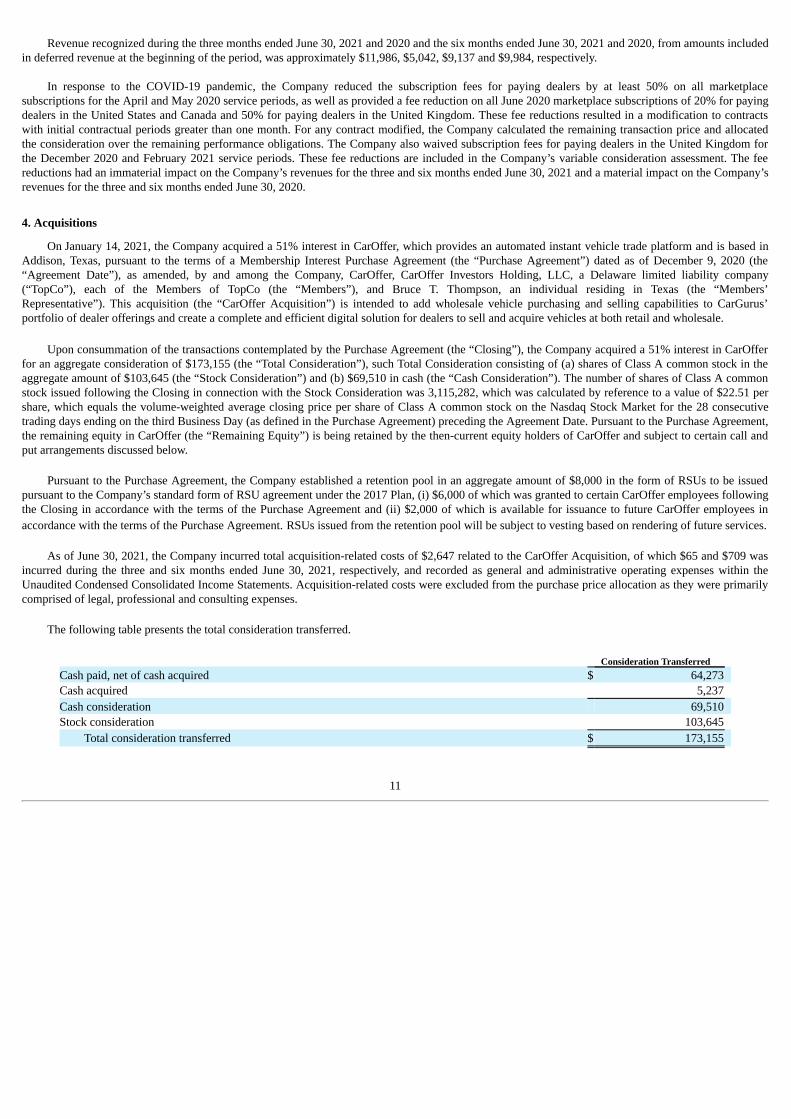
The following table presents the total consideration transferred.
Consideration Transferred Cash paid, net of cash acquired $ 64,273 Cash acquired 5,237 Cash consideration 69,510 Stock consideration 103,645
Total consideration transferred $ 173,155
11
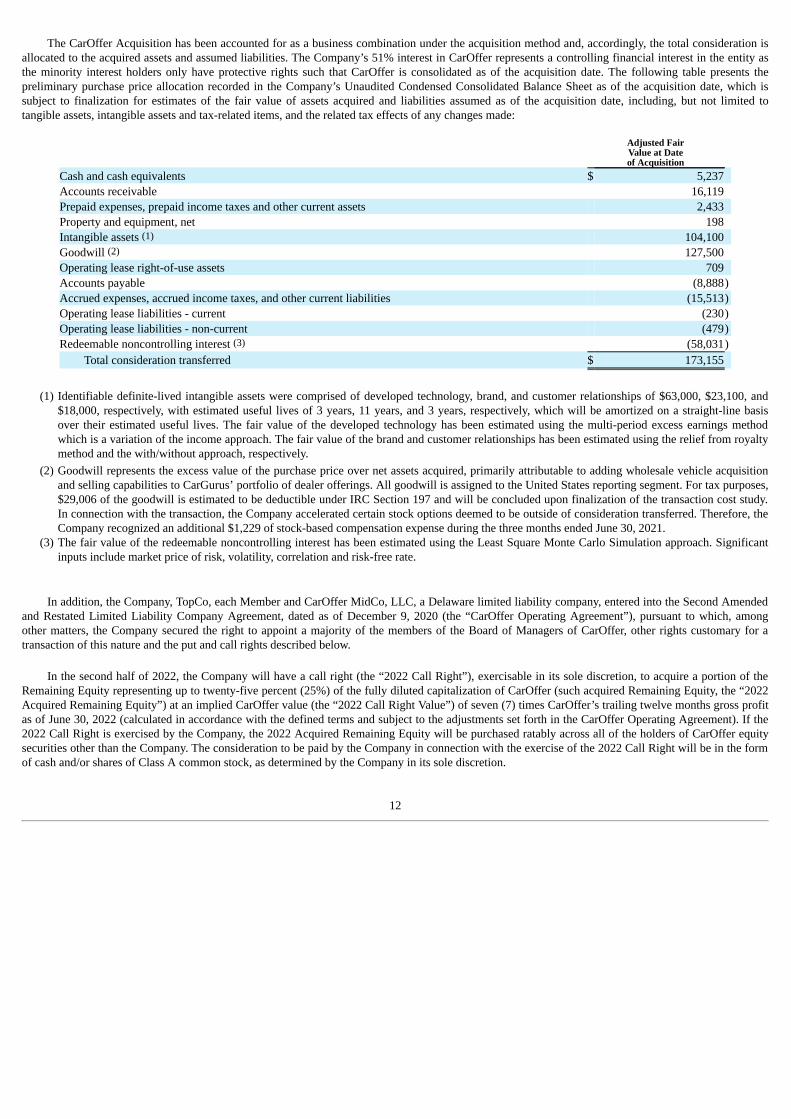
The CarOffer Acquisition has been accounted for as a business combination under the acquisition method and, accordingly, the total consideration isallocated to the acquired assets and assumed liabilities. The Company’s 51% interest in CarOffer represents a controlling financial interest in the entity asthe minority interest holders only have protective rights such that CarOffer is consolidated as of the acquisition date. The following table presents thepreliminary purchase price allocation recorded in the Company’s Unaudited Condensed Consolidated Balance Sheet as of the acquisition date, which issubject to finalization for estimates of the fair value of assets acquired and liabilities assumed as of the acquisition date, including, but not limited totangible assets, intangible assets and tax-related items, and the related tax effects of any changes made:
Adjusted FairValue at Dateof Acquisition
Cash and cash equivalents $ 5,237 Accounts receivable 16,119 Prepaid expenses, prepaid income taxes and other current assets 2,433 Property and equipment, net 198 Intangible assets (1) 104,100 Goodwill (2) 127,500 Operating lease right-of-use assets 709 Accounts payable (8,888)Accrued expenses, accrued income taxes, and other current liabilities (15,513)Operating lease liabilities - current (230)Operating lease liabilities - non-current (479)Redeemable noncontrolling interest (3) (58,031)
Total consideration transferred $ 173,155
(1) Identifiable definite-lived intangible assets were comprised of developed technology, brand, and customer relationships of $63,000, $23,100, and
$18,000, respectively, with estimated useful lives of 3 years, 11 years, and 3 years, respectively, which will be amortized on a straight-line basisover their estimated useful lives. The fair value of the developed technology has been estimated using the multi-period excess earnings methodwhich is a variation of the income approach. The fair value of the brand and customer relationships has been estimated using the relief from royaltymethod and the with/without approach, respectively.
(2) Goodwill represents the excess value of the purchase price over net assets acquired, primarily attributable to adding wholesale vehicle acquisitionand selling capabilities to CarGurus’ portfolio of dealer offerings. All goodwill is assigned to the United States reporting segment. For tax purposes,$29,006 of the goodwill is estimated to be deductible under IRC Section 197 and will be concluded upon finalization of the transaction cost study.In connection with the transaction, the Company accelerated certain stock options deemed to be outside of consideration transferred. Therefore, theCompany recognized an additional $1,229 of stock-based compensation expense during the three months ended June 30, 2021.
(3) The fair value of the redeemable noncontrolling interest has been estimated using the Least Square Monte Carlo Simulation approach. Significantinputs include market price of risk, volatility, correlation and risk-free rate.
In addition, the Company, TopCo, each Member and CarOffer MidCo, LLC, a Delaware limited liability company, entered into the Second Amendedand Restated Limited Liability Company Agreement, dated as of December 9, 2020 (the “CarOffer Operating Agreement”), pursuant to which, amongother matters, the Company secured the right to appoint a majority of the members of the Board of Managers of CarOffer, other rights customary for atransaction of this nature and the put and call rights described below.
In the second half of 2022, the Company will have a call right (the “2022 Call Right”), exercisable in its sole discretion, to acquire a portion of theRemaining Equity representing up to twenty-five percent (25%) of the fully diluted capitalization of CarOffer (such acquired Remaining Equity, the “2022Acquired Remaining Equity”) at an implied CarOffer value (the “2022 Call Right Value”) of seven (7) times CarOffer’s trailing twelve months gross profitas of June 30, 2022 (calculated in accordance with the defined terms and subject to the adjustments set forth in the CarOffer Operating Agreement). If the2022 Call Right is exercised by the Company, the 2022 Acquired Remaining Equity will be purchased ratably across all of the holders of CarOffer equitysecurities other than the Company. The consideration to be paid by the Company in connection with the exercise of the 2022 Call Right will be in the formof cash and/or shares of Class A common stock, as determined by the Company in its sole discretion.
12
In the second half of 2024, (a) the Company will have a call right (the “2024 Call Right”), exercisable in its sole discretion, to acquire all, and not lessthan all, of the Remaining Equity that it has not acquired pursuant to the 2022 Call Right and the Closing, at the greater of (i) (x) one hundred milliondollars ($100,000,000), and (y) the 2022 Call Right Value, whichever is less, and (ii) an implied CarOffer value of twelve (12) times CarOffer’s trailingtwelve months EBITDA as of June 30, 2024 (in each case calculated in accordance with the defined terms and subject to the adjustments set forth inthe CarOffer Operating Agreement), and (b) the representative of the holders of the Remaining Equity will have a put right (the “2024 Put Right”),exercisable in his, her or their sole discretion, to have the holders of the Remaining Equity sell to the Company, all, and not less than all, of the RemainingEquity at an implied CarOffer value of twelve (12) times CarOffer’s trailing twelve months EBITDA as of June 30, 2024 (calculated in accordance with thedefined terms and subject to the adjustments set forth in the CarOffer Operating Agreement). The determination of whether the 2024 Call Right or the 2024Put Right is ultimately exercised is as set forth in the CarOffer Operating Agreement. The consideration to be paid by the Company in connection with theexercise of either the 2024 Call Right or the 2024 Put Right, as applicable, will be in the form of cash and/or shares of Class A common stock, asdetermined by the Company in its sole discretion.
The foregoing summary of the Purchase Agreement, the CarOffer Operating Agreement and the transactions contemplated thereby does not purport to
be complete and is subject to, and qualified in its entirety by, the full text of the Purchase Agreement and the CarOffer Operating Agreement, which arefiled as exhibits to the Annual Report.
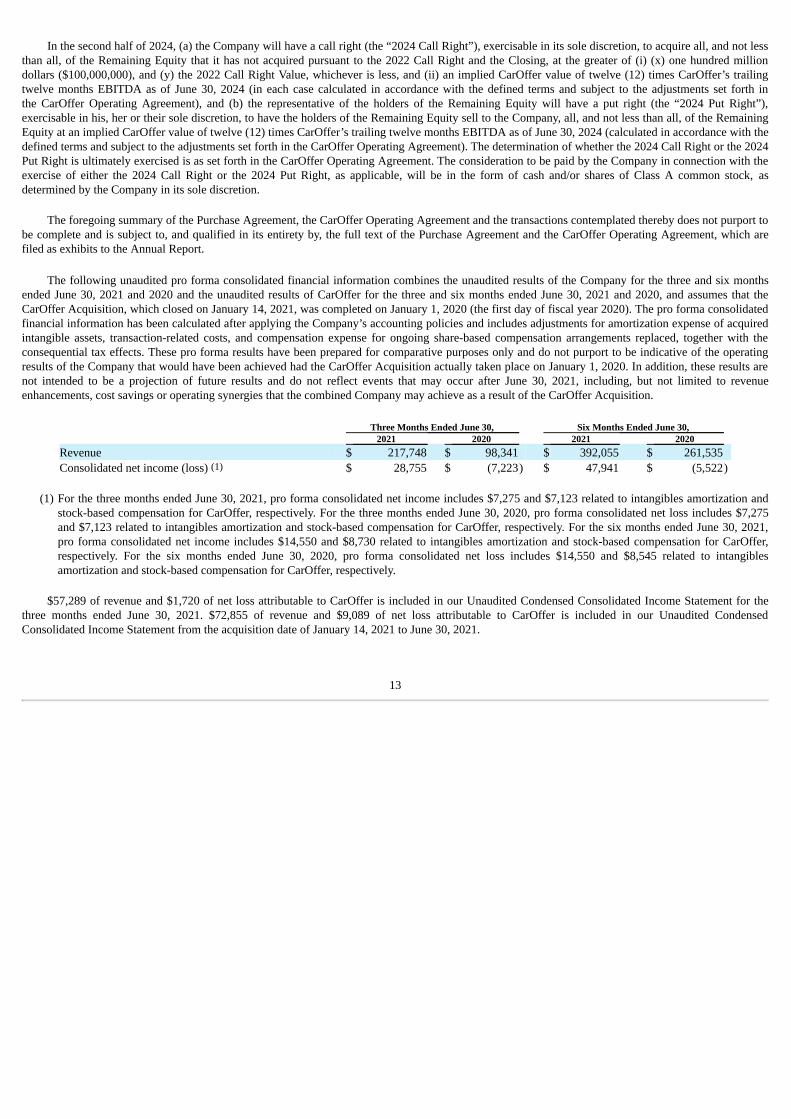
The following unaudited pro forma consolidated financial information combines the unaudited results of the Company for the three and six months
ended June 30, 2021 and 2020 and the unaudited results of CarOffer for the three and six months ended June 30, 2021 and 2020, and assumes that theCarOffer Acquisition, which closed on January 14, 2021, was completed on January 1, 2020 (the first day of fiscal year 2020). The pro forma consolidatedfinancial information has been calculated after applying the Company’s accounting policies and includes adjustments for amortization expense of acquiredintangible assets, transaction-related costs, and compensation expense for ongoing share-based compensation arrangements replaced, together with theconsequential tax effects. These pro forma results have been prepared for comparative purposes only and do not purport to be indicative of the operatingresults of the Company that would have been achieved had the CarOffer Acquisition actually taken place on January 1, 2020. In addition, these results arenot intended to be a projection of future results and do not reflect events that may occur after June 30, 2021, including, but not limited to revenueenhancements, cost savings or operating synergies that the combined Company may achieve as a result of the CarOffer Acquisition.
Three Months Ended June 30, Six Months Ended June 30, 2021 2020 2021 2020
Revenue $ 217,748 $ 98,341 $ 392,055 $ 261,535 Consolidated net income (loss) (1) $ 28,755 $ (7,223) $ 47,941 $ (5,522)
(1) For the three months ended June 30, 2021, pro forma consolidated net income includes $7,275 and $7,123 related to intangibles amortization and
stock-based compensation for CarOffer, respectively. For the three months ended June 30, 2020, pro forma consolidated net loss includes $7,275and $7,123 related to intangibles amortization and stock-based compensation for CarOffer, respectively. For the six months ended June 30, 2021,pro forma consolidated net income includes $14,550 and $8,730 related to intangibles amortization and stock-based compensation for CarOffer,respectively. For the six months ended June 30, 2020, pro forma consolidated net loss includes $14,550 and $8,545 related to intangiblesamortization and stock-based compensation for CarOffer, respectively.
$57,289 of revenue and $1,720 of net loss attributable to CarOffer is included in our Unaudited Condensed Consolidated Income Statement for the
three months ended June 30, 2021. $72,855 of revenue and $9,089 of net loss attributable to CarOffer is included in our Unaudited CondensedConsolidated Income Statement from the acquisition date of January 14, 2021 to June 30, 2021.
13
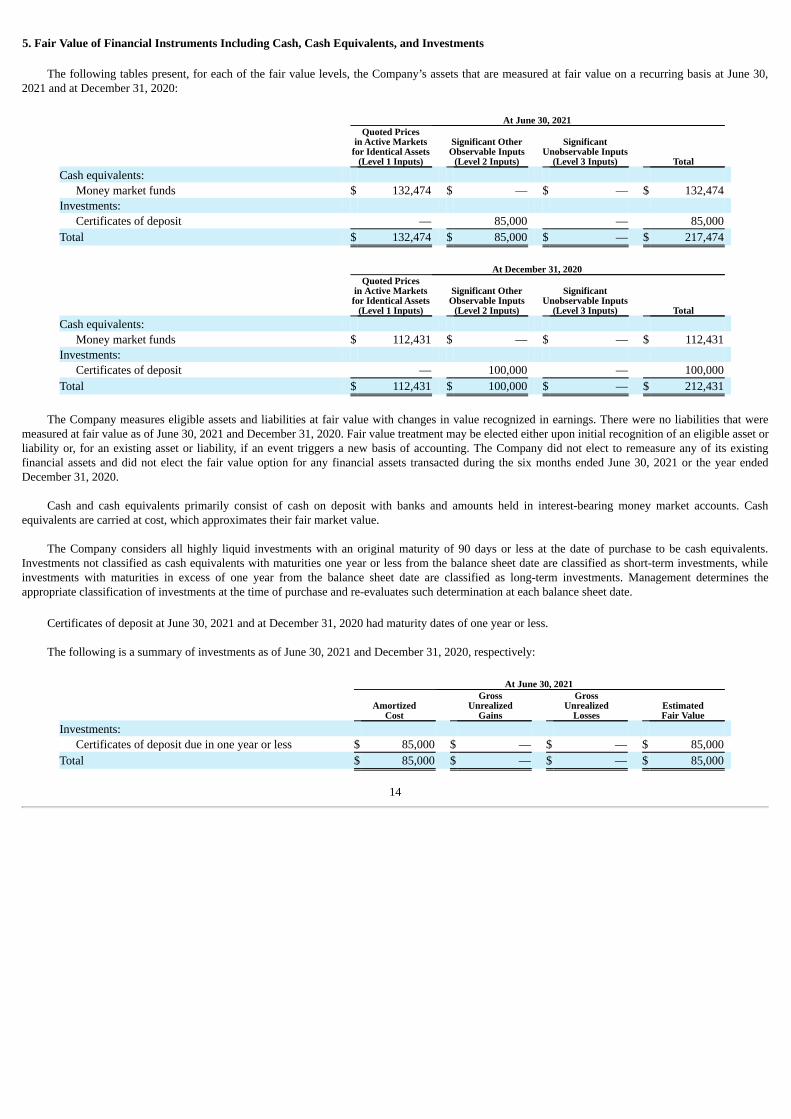
5. Fair Value of Financial Instruments Including Cash, Cash Equivalents, and Investments
The following tables present, for each of the fair value levels, the Company’s assets that are measured at fair value on a recurring basis at June 30,2021 and at December 31, 2020:
At June 30, 2021
Quoted Pricesin Active Markets
for Identical Assets(Level 1 Inputs)
Significant OtherObservable Inputs
(Level 2 Inputs)
SignificantUnobservable Inputs
(Level 3 Inputs) Total Cash equivalents:
Money market funds $ 132,474 $ — $ — $ 132,474 Investments:
Certificates of deposit — 85,000 — 85,000 Total $ 132,474 $ 85,000 $ — $ 217,474
At December 31, 2020
Quoted Pricesin Active Marketsfor Identical Assets
(Level 1 Inputs)
Significant OtherObservable Inputs
(Level 2 Inputs)
SignificantUnobservable Inputs
(Level 3 Inputs) Total Cash equivalents:
Money market funds $ 112,431 $ — $ — $ 112,431 Investments:
Certificates of deposit — 100,000 — 100,000 Total $ 112,431 $ 100,000 $ — $ 212,431
The Company measures eligible assets and liabilities at fair value with changes in value recognized in earnings. There were no liabilities that weremeasured at fair value as of June 30, 2021 and December 31, 2020. Fair value treatment may be elected either upon initial recognition of an eligible asset orliability or, for an existing asset or liability, if an event triggers a new basis of accounting. The Company did not elect to remeasure any of its existingfinancial assets and did not elect the fair value option for any financial assets transacted during the six months ended June 30, 2021 or the year endedDecember 31, 2020.
Cash and cash equivalents primarily consist of cash on deposit with banks and amounts held in interest-bearing money market accounts. Cashequivalents are carried at cost, which approximates their fair market value.
The Company considers all highly liquid investments with an original maturity of 90 days or less at the date of purchase to be cash equivalents.Investments not classified as cash equivalents with maturities one year or less from the balance sheet date are classified as short-term investments, whileinvestments with maturities in excess of one year from the balance sheet date are classified as long-term investments. Management determines theappropriate classification of investments at the time of purchase and re-evaluates such determination at each balance sheet date.
Certificates of deposit at June 30, 2021 and at December 31, 2020 had maturity dates of one year or less.
The following is a summary of investments as of June 30, 2021 and December 31, 2020, respectively:
At June 30, 2021
Amortized
Cost
GrossUnrealized
Gains
GrossUnrealized
Losses EstimatedFair Value
Investments: Certificates of deposit due in one year or less $ 85,000 $ — $ — $ 85,000
Total $ 85,000 $ — $ — $ 85,000
14
At December 31, 2020
Amortized
Cost
GrossUnrealized
Gains
GrossUnrealized
Losses EstimatedFair Value
Investments: Certificates of deposit due in one year or less $ 100,000 $ — $ — $ 100,000
Total $ 100,000 $ — $ — $ 100,000
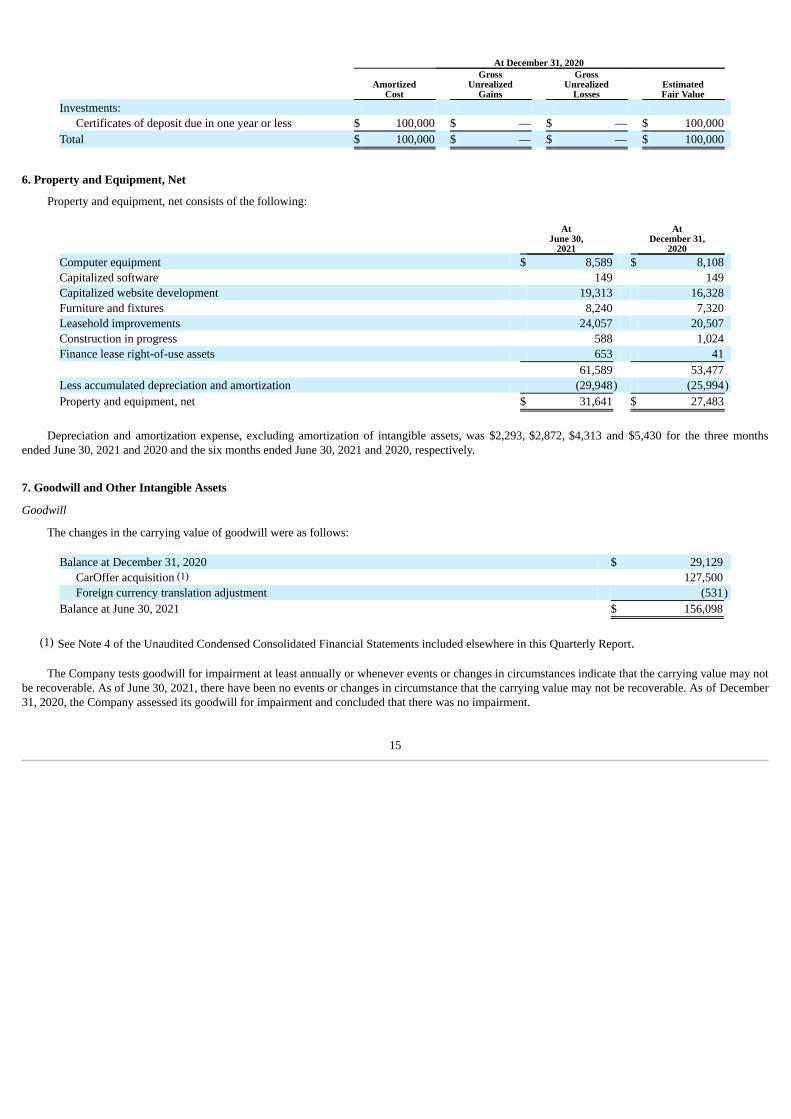
6. Property and Equipment, Net
Property and equipment, net consists of the following:
AtJune 30,
2021
AtDecember 31,
2020 Computer equipment $ 8,589 $ 8,108 Capitalized software 149 149 Capitalized website development 19,313 16,328 Furniture and fixtures 8,240 7,320 Leasehold improvements 24,057 20,507 Construction in progress 588 1,024 Finance lease right-of-use assets 653 41 61,589 53,477 Less accumulated depreciation and amortization (29,948) (25,994)Property and equipment, net $ 31,641 $ 27,483
Depreciation and amortization expense, excluding amortization of intangible assets, was $2,293, $2,872, $4,313 and $5,430 for the three months
ended June 30, 2021 and 2020 and the six months ended June 30, 2021 and 2020, respectively.
7. Goodwill and Other Intangible Assets
Goodwill
The changes in the carrying value of goodwill were as follows:
Balance at December 31, 2020 $ 29,129 CarOffer acquisition (1) 127,500 Foreign currency translation adjustment (531)
Balance at June 30, 2021 $ 156,098
(1) See Note 4 of the Unaudited Condensed Consolidated Financial Statements included elsewhere in this Quarterly Report.
The Company tests goodwill for impairment at least annually or whenever events or changes in circumstances indicate that the carrying value may notbe recoverable. As of June 30, 2021, there have been no events or changes in circumstance that the carrying value may not be recoverable. As of December31, 2020, the Company assessed its goodwill for impairment and concluded that there was no impairment.
15
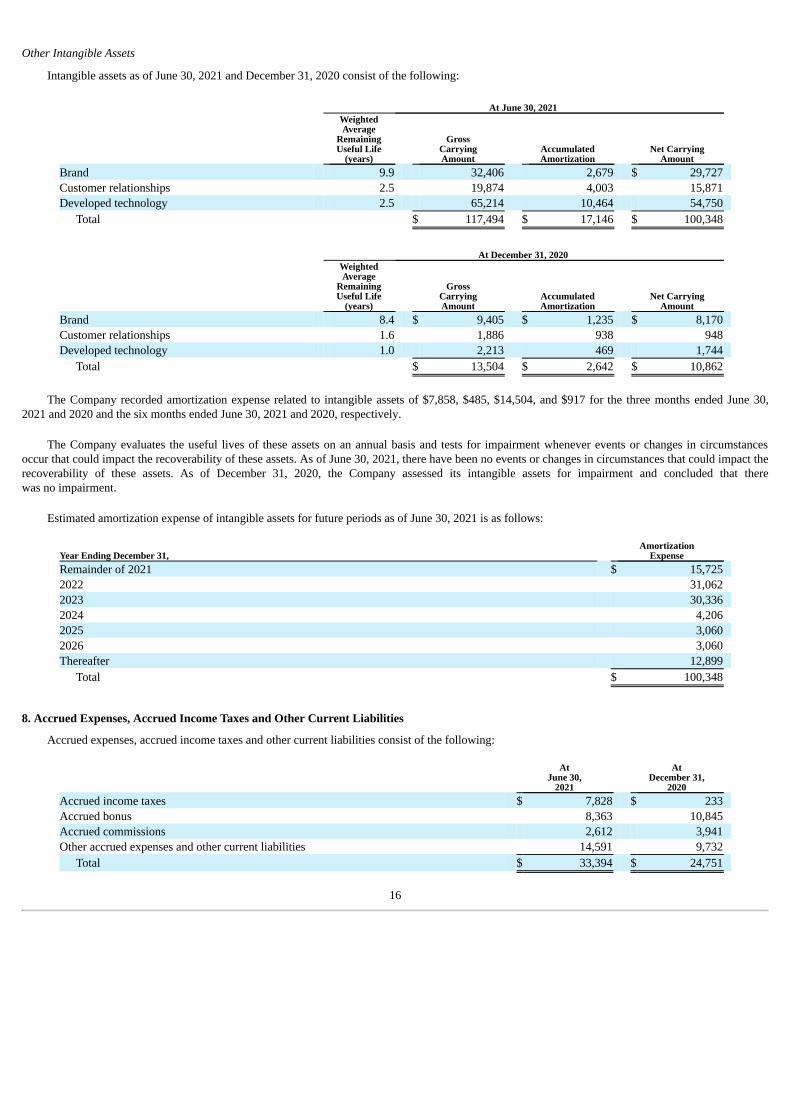
Other Intangible Assets
Intangible assets as of June 30, 2021 and December 31, 2020 consist of the following:
At June 30, 2021
WeightedAverage
RemainingUseful Life
(years)
GrossCarryingAmount
AccumulatedAmortization
Net CarryingAmount
Brand 9.9 32,406 2,679 $ 29,727 Customer relationships 2.5 19,874 4,003 15,871 Developed technology 2.5 65,214 10,464 54,750
Total $ 117,494 $ 17,146 $ 100,348 At December 31, 2020
WeightedAverage
RemainingUseful Life
(years)
Gross
CarryingAmount
AccumulatedAmortization
Net CarryingAmount
Brand 8.4 $ 9,405 $ 1,235 $ 8,170 Customer relationships 1.6 1,886 938 948 Developed technology 1.0 2,213 469 1,744
Total $ 13,504 $ 2,642 $ 10,862
The Company recorded amortization expense related to intangible assets of $7,858, $485, $14,504, and $917 for the three months ended June 30,2021 and 2020 and the six months ended June 30, 2021 and 2020, respectively.
The Company evaluates the useful lives of these assets on an annual basis and tests for impairment whenever events or changes in circumstancesoccur that could impact the recoverability of these assets. As of June 30, 2021, there have been no events or changes in circumstances that could impact therecoverability of these assets. As of December 31, 2020, the Company assessed its intangible assets for impairment and concluded that therewas no impairment.
Estimated amortization expense of intangible assets for future periods as of June 30, 2021 is as follows:
Year Ending December 31, Amortization
Expense Remainder of 2021 $ 15,725 2022 31,062 2023 30,336 2024 4,206 2025 3,060 2026 3,060 Thereafter 12,899
Total $ 100,348
8. Accrued Expenses, Accrued Income Taxes and Other Current Liabilities
Accrued expenses, accrued income taxes and other current liabilities consist of the following:
AtJune 30,
2021
AtDecember 31,
2020 Accrued income taxes $ 7,828 $ 233 Accrued bonus 8,363 10,845 Accrued commissions 2,612 3,941 Other accrued expenses and other current liabilities 14,591 9,732
Total $ 33,394 $ 24,751
16

9. Commitments and Contingencies
Contractual Obligations and Commitments
All of the Company’s property, equipment, and internal-use software have been purchased with cash with the exception of amounts related to unpaidproperty and equipment and internal use software and amounts related to obligations under finance leases as disclosed in the Unaudited CondensedConsolidated Statements of Cash Flows as of June 30, 2021. The Company has no material long-term purchase obligations outstanding with any vendor orthird party.
Leases
The Company’s primary operating lease obligations consist of various leases for office space in: Boston, Massachusetts; Cambridge, Massachusetts;San Francisco, California; Addison, Texas; Plano, Texas; and Dublin, Ireland. The Company also has an operating lease obligation for data center space inNeedham, Massachusetts.
As of June 30, 2021, there were no material changes in the Company’s material leases from those disclosed in the Annual Report, other than asdiscussed below.
On January 25, 2021, CarOffer entered into a sublease in Addison, Texas at 15601 Dallas Parkway for approximately 61,826 square feet of officespace with a non-cancellable lease term through 2030. The sublease commenced on March 1, 2021. CarOffer’s monthly base rent for the premises, which ispayable from January 1, 2022, will initially be approximately $152, and will increase each year up to a maximum monthly base rent of approximately$185. In connection with the sublease, CarOffer entered into a financing lease arrangement for furniture and fixtures used in connection with its operations.The term of the financing lease is for the entire period of the sublease. The monthly rent for the furniture and fixtures is included in the sublease monthlyrent, with ownership of the furniture and fixtures transferring to CarOffer at the expiration of the lease term. Monthly rent payments are allocated basedupon the relative fair value of the office space and furniture of 95% and 5%, respectively. Upon commencement, the right of use asset for the office spaceand furniture was $12,336 and $664, respectively.
On July 1, 2019, CarOffer entered into a sublease in Plano, Texas at 2701 East Plano Parkway, for the lease of approximately 26,971 square feet ofoffice space with a non-cancellable lease term through 2023. The sublease commenced on July 1, 2019. CarOffer’s monthly base rent for the premises,which is payable from July 1, 2019, was initially approximately $21, and will increase each year up to maximum monthly base rent of $22. The Companyacquired the lease as part of the CarOffer Acquisition.
The Company’s leases in Boston, Massachusetts, Cambridge, Massachusetts and San Francisco, California have associated letters of credit, which arerecorded as restricted cash within the Unaudited Condensed Consolidated Balance Sheet. At June 30, 2021 and December 31, 2020, restricted cash was$19,357 and $10,627, respectively, and primarily related to cash held at a financial institution in an interest‑bearing cash account as collateral for the lettersof credit related to the contractual provisions for the Company’s building leases. Restricted cash at June 30, 2021 also includes pass-through payments fromcustomers related to the Company’s wholesale business. At June 30, 2021 and December 31, 2020, portions of restricted cash were classified as a short-term asset and long‑term asset, as disclosed on the Unaudited Condensed Consolidated Balance Sheet.
Acquisitions
On January 14, 2021, the Company completed the CarOffer Acquisition, details of which are described in Note 4 of the Unaudited CondensedConsolidated Financial Statements included elsewhere in this Quarterly Report.
Legal Matters
From time to time the Company may become involved in legal proceedings or be subject to claims arising in the ordinary course of its business. TheCompany is not presently subject to any pending or threatened litigation that it believes, if determined adversely to the Company, individually, or takentogether, would reasonably be expected to have a material adverse effect on its business or financial results.
Guarantees and Indemnification Obligations
In the ordinary course of business, the Company enters into agreements with its customers, partners and service providers that include commercialprovisions with respect to licensing, infringement, indemnification, and other common provisions. The Company does not, in the ordinary course, agree toguaranty or indemnification obligations for the Company under its contracts with customers.
17
Based on historical experience and information known at June 30, 2021 and December 31, 2020, the Company has not incurred any costs for guarantees orindemnities.
10. Stock-based Compensation
Equity Incentive Plans
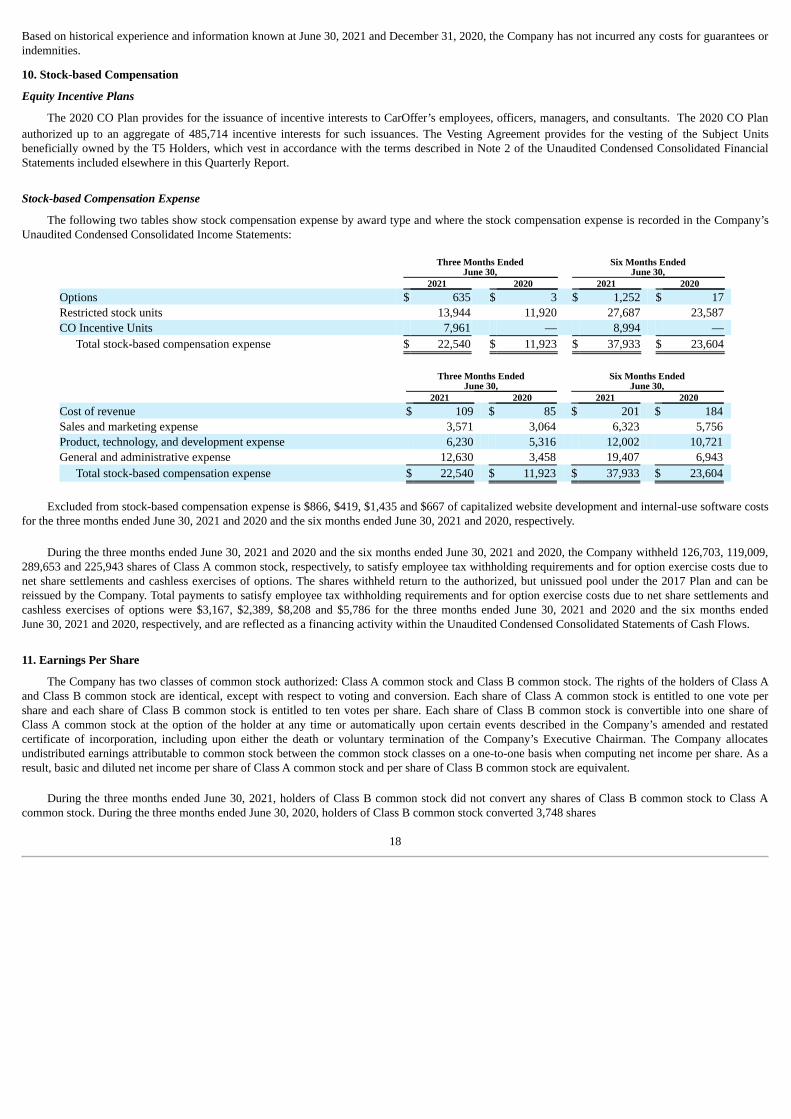
The 2020 CO Plan provides for the issuance of incentive interests to CarOffer’s employees, officers, managers, and consultants. The 2020 CO Planauthorized up to an aggregate of 485,714 incentive interests for such issuances. The Vesting Agreement provides for the vesting of the Subject Unitsbeneficially owned by the T5 Holders, which vest in accordance with the terms described in Note 2 of the Unaudited Condensed Consolidated FinancialStatements included elsewhere in this Quarterly Report.
Stock-based Compensation Expense
The following two tables show stock compensation expense by award type and where the stock compensation expense is recorded in the Company’sUnaudited Condensed Consolidated Income Statements:
Three Months Ended
June 30, Six Months Ended
June 30, 2021 2020 2021 2020
Options $ 635 $ 3 $ 1,252 $ 17 Restricted stock units 13,944 11,920 27,687 23,587 CO Incentive Units 7,961 — 8,994 —
Total stock-based compensation expense $ 22,540 $ 11,923 $ 37,933 $ 23,604
Three Months EndedJune 30,
Six Months EndedJune 30,
2021 2020 2021 2020 Cost of revenue $ 109 $ 85 $ 201 $ 184 Sales and marketing expense 3,571 3,064 6,323 5,756 Product, technology, and development expense 6,230 5,316 12,002 10,721 General and administrative expense 12,630 3,458 19,407 6,943
Total stock-based compensation expense $ 22,540 $ 11,923 $ 37,933 $ 23,604
Excluded from stock-based compensation expense is $866, $419, $1,435 and $667 of capitalized website development and internal-use software costs
for the three months ended June 30, 2021 and 2020 and the six months ended June 30, 2021 and 2020, respectively.
During the three months ended June 30, 2021 and 2020 and the six months ended June 30, 2021 and 2020, the Company withheld 126,703, 119,009,289,653 and 225,943 shares of Class A common stock, respectively, to satisfy employee tax withholding requirements and for option exercise costs due tonet share settlements and cashless exercises of options. The shares withheld return to the authorized, but unissued pool under the 2017 Plan and can bereissued by the Company. Total payments to satisfy employee tax withholding requirements and for option exercise costs due to net share settlements andcashless exercises of options were $3,167, $2,389, $8,208 and $5,786 for the three months ended June 30, 2021 and 2020 and the six months endedJune 30, 2021 and 2020, respectively, and are reflected as a financing activity within the Unaudited Condensed Consolidated Statements of Cash Flows.
11. Earnings Per Share
The Company has two classes of common stock authorized: Class A common stock and Class B common stock. The rights of the holders of Class Aand Class B common stock are identical, except with respect to voting and conversion. Each share of Class A common stock is entitled to one vote pershare and each share of Class B common stock is entitled to ten votes per share. Each share of Class B common stock is convertible into one share ofClass A common stock at the option of the holder at any time or automatically upon certain events described in the Company’s amended and restatedcertificate of incorporation, including upon either the death or voluntary termination of the Company’s Executive Chairman. The Company allocatesundistributed earnings attributable to common stock between the common stock classes on a one‑to‑one basis when computing net income per share. As aresult, basic and diluted net income per share of Class A common stock and per share of Class B common stock are equivalent.
During the three months ended June 30, 2021, holders of Class B common stock did not convert any shares of Class B common stock to Class Acommon stock. During the three months ended June 30, 2020, holders of Class B common stock converted 3,748 shares
18

of Class B common stock to Class A common stock. During the six months ended June 30, 2021 and 2020, holders of Class B common stock converted929,597 and 339,489 shares of Class B common stock to Class A common stock, respectively.
Basic net income per share (“Basic EPS”) is computed by dividing net income attributable to common stockholders and adjusted to reflect changes inthe redemption value of the redeemable noncontrolling interest, if applicable, by the weighted-average number of common shares outstanding during thereporting period. The Company computes the weighted-average number of common shares outstanding during the reporting period using the total numberof shares of Class A common stock and Class B common stock outstanding as of the last day of the previous year plus the weighted-average of anyadditional shares issued and outstanding during the reporting period.
Diluted net income per share (“Diluted EPS”) gives effect to all potentially dilutive securities. Diluted EPS is computed by dividing net incomeattributable to common stockholders by the weighted-average number of common shares outstanding during the reporting period using (i) the number ofshares of common stock used in the Basic EPS calculation as indicated above, (ii) if dilutive, the incremental weighted-average common stock that theCompany would issue upon the exercise of stock options and the vesting of RSUs, (iii) if dilutive, market-based performance awards based on the numberof shares that would be issuable as of the end of the reporting period assuming the end of the reporting period was also the end of the contingency period.The dilutive effect of these common stock equivalents is reflected in diluted earnings per share by application of the treasury stock method. The if-converted method is used to calculate the number of shares issuable upon exercise of the 2024 Put Right, inclusive of CarOffer noncontrolling interest andincentive units, that would be issuable as of the end of the reporting period assuming the end of the reporting period was also the end of the contingencyperiod.
The following table presents a reconciliation of the numerator and denominator used in the calculation of basic and diluted net income per share:
Three Months Ended
June 30, Six Months Ended
June 30, 2021 2020 2021 2020
Numerator: Consolidated net income $ 27,396 $ 7,131 $ 46,947 $ 19,827 Less: Net income (loss) attributable to redeemable noncontrollinginterest (656) — (3,466) — Net income attributable to common stockholders — basic $ 28,052 $ 7,131 $ 50,413 $ 19,827 Add: Net income (loss) attributable to redeemable noncontrollinginterest (656) — (656) — Net income attributable to common stockholders — diluted $ 27,396 $ 7,131 $ 49,757 $ 19,827 Denominator: Weighted-average number of shares of common stock used in computing net income per share attributable to common stockholders — basic 117,124,895 112,734,393 116,722,913 112,544,743
Dilutive effect of share equivalents resulting from stock options 450,512 674,063 481,802 735,474 Dilutive effect of share equivalents resulting from unvested restricted stock units 300,916 329,009 360,363 667,024 Dilutive effect of share equivalents resulting from CarOffer incentive units and noncontrolling interest 1,577,781 — 788,891 — Weighted-average number of shares of common stock used in computing net income per share attributable to common stockholders — diluted 119,454,104 113,737,465 118,353,969 113,947,241
Net income per share attributable to common stockholders: Basic $ 0.24 $ 0.06 $ 0.43 $ 0.18 Diluted $ 0.23 $ 0.06 $ 0.42 $ 0.17
19
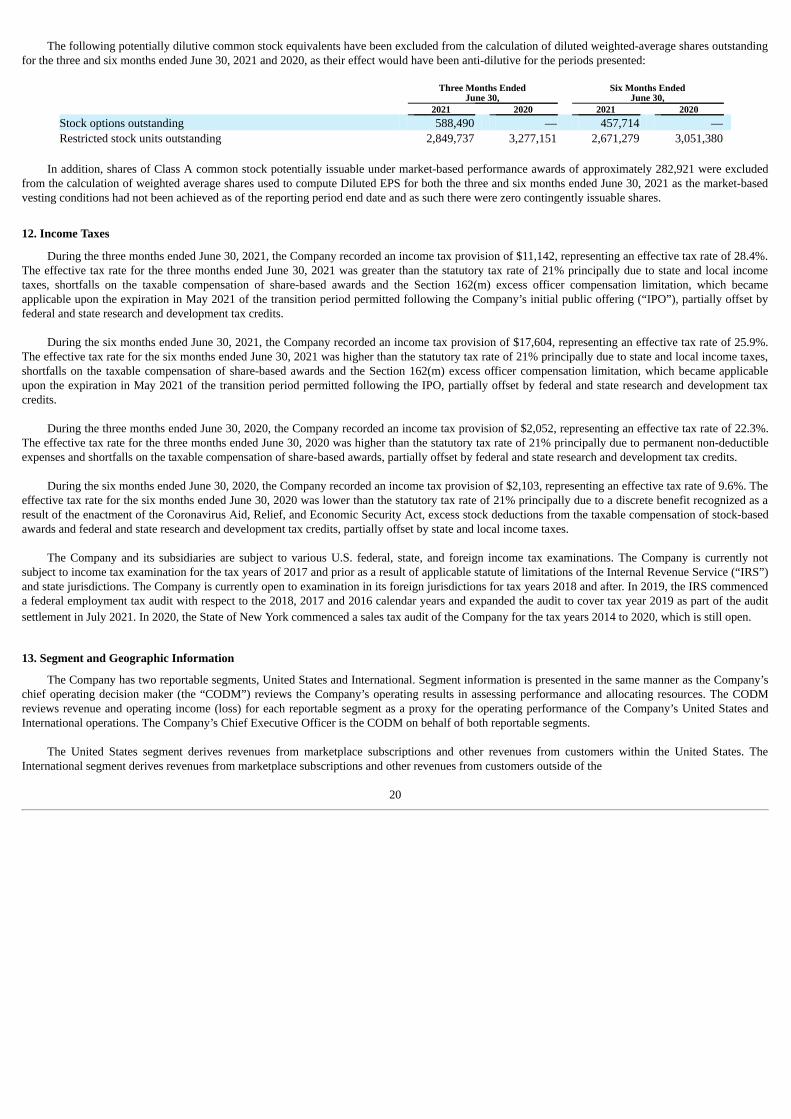
The following potentially dilutive common stock equivalents have been excluded from the calculation of diluted weighted-average shares outstandingfor the three and six months ended June 30, 2021 and 2020, as their effect would have been anti-dilutive for the periods presented:
Three Months Ended
June 30, Six Months Ended
June 30, 2021 2020 2021 2020
Stock options outstanding 588,490 — 457,714 — Restricted stock units outstanding 2,849,737 3,277,151 2,671,279 3,051,380
In addition, shares of Class A common stock potentially issuable under market-based performance awards of approximately 282,921 were excluded
from the calculation of weighted average shares used to compute Diluted EPS for both the three and six months ended June 30, 2021 as the market-basedvesting conditions had not been achieved as of the reporting period end date and as such there were zero contingently issuable shares.
12. Income Taxes
During the three months ended June 30, 2021, the Company recorded an income tax provision of $11,142, representing an effective tax rate of 28.4%.The effective tax rate for the three months ended June 30, 2021 was greater than the statutory tax rate of 21% principally due to state and local incometaxes, shortfalls on the taxable compensation of share-based awards and the Section 162(m) excess officer compensation limitation, which becameapplicable upon the expiration in May 2021 of the transition period permitted following the Company’s initial public offering (“IPO”), partially offset byfederal and state research and development tax credits.
During the six months ended June 30, 2021, the Company recorded an income tax provision of $17,604, representing an effective tax rate of 25.9%.The effective tax rate for the six months ended June 30, 2021 was higher than the statutory tax rate of 21% principally due to state and local income taxes,shortfalls on the taxable compensation of share-based awards and the Section 162(m) excess officer compensation limitation, which became applicableupon the expiration in May 2021 of the transition period permitted following the IPO, partially offset by federal and state research and development taxcredits.
During the three months ended June 30, 2020, the Company recorded an income tax provision of $2,052, representing an effective tax rate of 22.3%.The effective tax rate for the three months ended June 30, 2020 was higher than the statutory tax rate of 21% principally due to permanent non-deductibleexpenses and shortfalls on the taxable compensation of share-based awards, partially offset by federal and state research and development tax credits.
During the six months ended June 30, 2020, the Company recorded an income tax provision of $2,103, representing an effective tax rate of 9.6%. Theeffective tax rate for the six months ended June 30, 2020 was lower than the statutory tax rate of 21% principally due to a discrete benefit recognized as aresult of the enactment of the Coronavirus Aid, Relief, and Economic Security Act, excess stock deductions from the taxable compensation of stock-basedawards and federal and state research and development tax credits, partially offset by state and local income taxes.
The Company and its subsidiaries are subject to various U.S. federal, state, and foreign income tax examinations. The Company is currently notsubject to income tax examination for the tax years of 2017 and prior as a result of applicable statute of limitations of the Internal Revenue Service (“IRS”)and state jurisdictions. The Company is currently open to examination in its foreign jurisdictions for tax years 2018 and after. In 2019, the IRS commenceda federal employment tax audit with respect to the 2018, 2017 and 2016 calendar years and expanded the audit to cover tax year 2019 as part of the auditsettlement in July 2021. In 2020, the State of New York commenced a sales tax audit of the Company for the tax years 2014 to 2020, which is still open. 13. Segment and Geographic Information
The Company has two reportable segments, United States and International. Segment information is presented in the same manner as the Company’schief operating decision maker (the “CODM”) reviews the Company’s operating results in assessing performance and allocating resources. The CODMreviews revenue and operating income (loss) for each reportable segment as a proxy for the operating performance of the Company’s United States andInternational operations. The Company’s Chief Executive Officer is the CODM on behalf of both reportable segments.
The United States segment derives revenues from marketplace subscriptions and other revenues from customers within the United States. TheInternational segment derives revenues from marketplace subscriptions and other revenues from customers outside of the
20
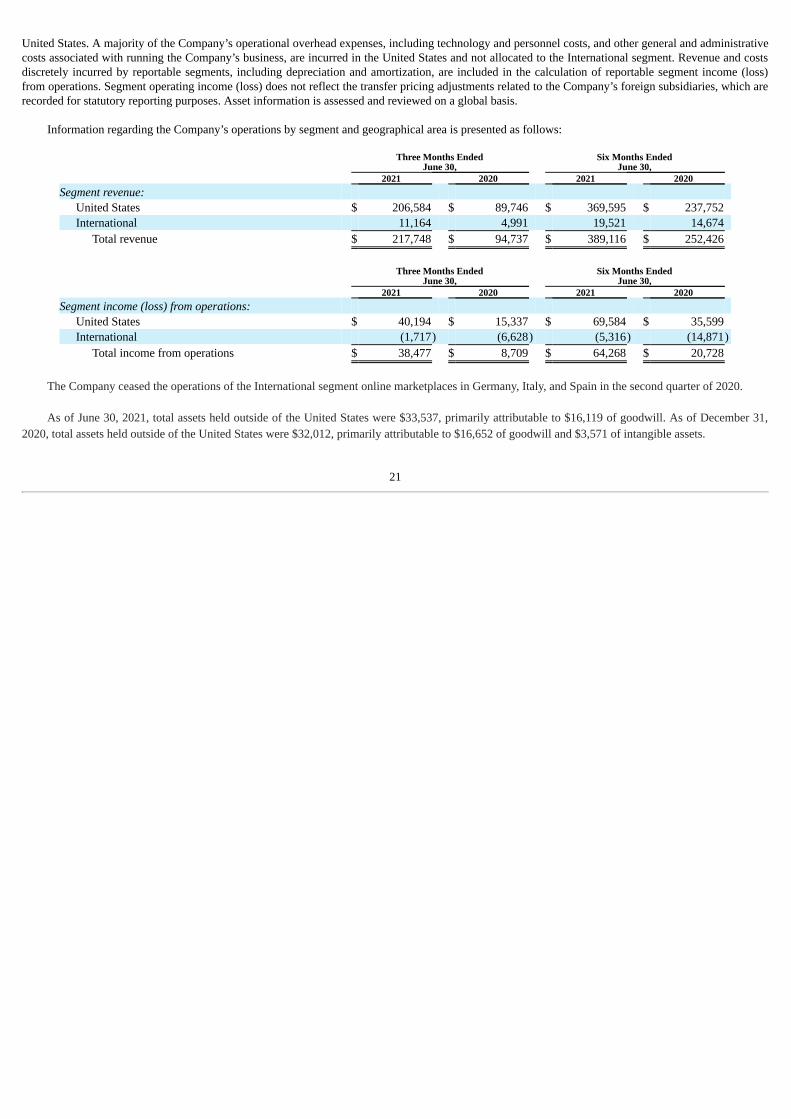
United States. A majority of the Company’s operational overhead expenses, including technology and personnel costs, and other general and administrativecosts associated with running the Company’s business, are incurred in the United States and not allocated to the International segment. Revenue and costsdiscretely incurred by reportable segments, including depreciation and amortization, are included in the calculation of reportable segment income (loss)from operations. Segment operating income (loss) does not reflect the transfer pricing adjustments related to the Company’s foreign subsidiaries, which arerecorded for statutory reporting purposes. Asset information is assessed and reviewed on a global basis.
Information regarding the Company’s operations by segment and geographical area is presented as follows:
Three Months Ended
June 30, Six Months Ended
June 30, 2021 2020 2021 2020
Segment revenue: United States $ 206,584 $ 89,746 $ 369,595 $ 237,752 International 11,164 4,991 19,521 14,674
Total revenue $ 217,748 $ 94,737 $ 389,116 $ 252,426
Three Months EndedJune 30,
Six Months EndedJune 30,
2021 2020 2021 2020 Segment income (loss) from operations:
United States $ 40,194 $ 15,337 $ 69,584 $ 35,599 International (1,717) (6,628) (5,316) (14,871)
Total income from operations $ 38,477 $ 8,709 $ 64,268 $ 20,728
The Company ceased the operations of the International segment online marketplaces in Germany, Italy, and Spain in the second quarter of 2020. As of June 30, 2021, total assets held outside of the United States were $33,537, primarily attributable to $16,119 of goodwill. As of December 31,
2020, total assets held outside of the United States were $32,012, primarily attributable to $16,652 of goodwill and $3,571 of intangible assets.
21

Item 2. Management’s Discussion and Analysis of Financial Condition and Results of Operations.
You should read the following discussion and analysis of our financial condition and results of operations together with our Unaudited CondensedConsolidated Financial Statements, and the related notes thereto, appearing elsewhere in this Quarterly Report on Form 10-Q, or Quarterly Report, andour consolidated financial statements and the related notes and other financial information included in our Annual Report on Form 10-K for the yearended December 31, 2020, filed with the Securities and Exchange Commission, or SEC, on February 12, 2021, or our Annual Report. Some of theinformation contained in this discussion and analysis or elsewhere in this Quarterly Report, including information with respect to our plans and strategyfor our business and our performance and future success, includes forward-looking statements that involve risks and uncertainties. See “Special NoteRegarding Forward-Looking Statements.” You should review the “Risk Factors” section of this Quarterly Report for a discussion of important factors thatcould cause actual results to differ materially from the results described in or implied by the forward-looking statements contained in the followingdiscussion and analysis. In this discussion, we use financial measures that are considered non-GAAP financial measures under SEC rules. These rulesregarding non-GAAP financial measures require supplemental explanation and reconciliation, which are included elsewhere in this Quarterly Report.Investors should not consider non-GAAP financial measures in isolation from or in substitution for, financial information presented in compliance withUnited States generally accepted accounting principles, or GAAP.
Company Overview
CarGurus is a multinational, online automotive platform for buying and selling vehicles that is building upon its industry-leading listings marketplacewith both digital retail solutions and the CarOffer online wholesale platform. The CarGurus marketplace gives consumers the confidence to purchase or sella vehicle either online or in-person; and gives dealerships the power to accurately price, effectively market, instantly acquire and quickly sell vehicles, allwith a nationwide reach. We use our proprietary technology, search algorithms and data analytics to bring trust, transparency and competitive pricing to theautomotive shopping experience.
We are headquartered in Cambridge, Massachusetts and were incorporated in the State of Delaware on June 26, 2015.
We operate principally in the United States. In the United States, we also operate the Autolist online marketplace, which we wholly own, and CarOfferdigital wholesale marketplace, in which we have a 51% interest, as independent brands. In addition to the United States, we operate online marketplacesunder the CarGurus brand in Canada and the United Kingdom. In the United Kingdom, we also operate the PistonHeads online marketplace, which wewholly own, as an independent brand. We also operated online marketplaces in Germany, Italy, and Spain until we ceased the operations of each of thesemarketplaces in the second quarter of 2020.
We have subsidiaries in the United States, Canada, Ireland, and the United Kingdom. Additionally, we have two reportable segments, United Statesand International. See Note 13 of the Unaudited Condensed Consolidated Financial Statements included elsewhere in this Quarterly Report.
We generate marketplace subscription revenue from dealers primarily through Listings and Dealer Display subscriptions. We generate other revenueprimarily from revenue relating to the wholesale sale of automobiles, display advertising revenue from auto manufacturers and other auto-related brandadvertisers and revenue from partnerships with financing services companies.
Our revenue for the three months ended June 30, 2021 was $217.7 million, a 130% increase from $94.7 million of revenue in the three months endedJune 30, 2020. For the three months ended June 30, 2021, we generated consolidated net income of $27.4 million and Adjusted EBITDA of $66.4 million,compared to consolidated net income of $7.1 million and Adjusted EBITDA of $27.5 million for the three months ended June 30, 2020.
Our revenue for the six months ended June 30, 2021 was $389.1 million, a 54% increase from $252.4 million of revenue in the six months endedJune 30, 2020. For the six months ended June 30, 2021, we generated consolidated net income of $46.9 million and Adjusted EBITDA of $117.0 million,compared to consolidated net income of $19.8 million and Adjusted EBITDA of $55.2 million for the six months ended June 30, 2020.
See “Adjusted EBITDA” below for more information regarding our use of Adjusted EBITDA, a non-GAAP financial measure, and a reconciliation ofAdjusted EBITDA to our consolidated net income.
COVID-19 Update
The COVID-19 pandemic has caused an international health crisis and resulted in significant disruptions to the global economy as well as businessesand capital markets around the world. Our operations have been materially adversely affected by a range of factors related to the COVID-19 pandemic. InMarch 2020, we temporarily closed all of our offices and began requiring our employees to work remotely until further notice, which has disrupted how weoperate our business. In addition, in an effort to limit the spread of COVID-
22
19, many countries, as well as states and localities in the United States, implemented or mandated significant restrictions on travel and commerce, shelter-in-place or stay-at-home orders, and business closures. Fluctuation in infection rates in the regions in which we operate has resulted in periodic changes inrestrictions that vary from region to region and may require rapid response to new or reinstated orders. Many of these orders resulted in restrictions on theability of consumers to buy and sell automobiles by restricting operations at dealerships and/or by closing or reducing the services provided by certainservice providers upon which dealerships rely. In addition, these restrictions and continued concern about the spread of the disease have impacted carshopping by consumers and disrupted the operations of car dealerships, which has adversely affected the market for automobile purchases. The automotiveindustry is also facing inventory supply problems, including for reasons attributable to the COVID-19 pandemic and other macroeconomic issues, such asthe global semiconductor chip shortage, which have adversely affected the amount of inventory on our websites.
As a result of the travel and commerce restrictions and the impact on their businesses, a number of our dealer customers temporarily closed or areoperating on a reduced capacity, and many dealerships are facing significant financial challenges. Such closures and circumstances led some paying dealersto cancel their subscriptions and/or reduce their spending with us, which has had a material adverse effect on our revenues and our business.
Further, because of the significant financial challenges that dealerships have faced, we took measures to help our paying dealers maintain theirbusiness health during the COVID-19 pandemic, including by proactively reducing the subscription fees for paying dealers for certain service periods. As aresult, the level of fees we received from paying dealers materially decreased during the year ended December 31, 2020, resulting in a material decline inour revenue and a material adverse effect to our business. In addition, despite our proactive fee reductions during the second quarter of 2020, weexperienced increased customer cancellation rates and slowed paying dealer additions, which materially and adversely affected our business for the yearended December 31, 2020. We have also experienced increased account delinquencies from dealer customers challenged by the COVID-19 pandemic thatfailed to pay us on time or at all. However, since the second quarter of 2020, cancellations by paying dealers have begun to stabilize, which we believeresulted from the resumption of consumer activity as well as the fee reductions that we provided to our customers. Additionally, while we suspendedcharging subscription fees for paying dealers in the United Kingdom for the February 2021 service period, during the three and six months ended June 30,2021, we returned to normal contractual billings in all other markets. Although the fee reductions had a material adverse effect on our revenue for the yearended December 31, 2020 and for the three and six months ended June 30, 2020, they did not have a material adverse impact on the three and six monthsended June 30, 2021.
These effects from the COVID-19 pandemic on our revenue caused us to implement certain cost-savings measures across our business, whichdisrupted our business and operations during the year ended December 31, 2020. For example, during the second quarter of 2020, we initiated a cost-savings initiative, or the Expense Reduction Plan, that included a reduction in our workforce, a limitation in discretionary spend across our business, andour ceasing certain international operations and expansion efforts. In particular, we ceased marketplace operations in Germany, Italy, and Spain, and haltedany new international expansion efforts, which we believe will allow us to focus our financial and human capital resources on our more establishedinternational markets in Canada and the United Kingdom. We also reduced consumer marketing across both algorithmic traffic acquisition and brand spendduring the year ended December 31, 2020 in comparison to the year ended December 31, 2019 in an effort to reduce expenses and as a result of suppresseddealer inventory and the resulting reduced demand for leads by dealers. However, since the second quarter of 2020, we have increased our consumermarketing expenses as consumer activity increased and governments implemented re-opening policies.
We continue to monitor and assess the effects of the COVID-19 pandemic on our commercial operations, including the impact on our revenue.However, we cannot at this time accurately predict what effects these conditions will ultimately have on our future revenue and operations. See the “RiskFactors” section of this Quarterly Report for further discussion of the impacts of the COVID-19 pandemic on our business.
Key Business Metrics
We regularly review a number of metrics, including the key metrics listed below, to evaluate our business, measure our performance, identify trendsaffecting our business, formulate financial projections, and make operating and strategic decisions. We believe it is important to evaluate these metrics forthe United States and International segments. The International segment derives revenues from marketplace subscriptions and other revenues fromcustomers outside of the United States. International markets perform differently from the United States market due to a variety of factors, including ouroperating history in each market, our rate of investment, market size, market maturity, competition and other dynamics unique to each country. The metricspresented below exclude CarOffer as we believe such metrics are either not applicable for the CarOffer business or do not provide a meaningful way toevaluate the CarOffer business.
23
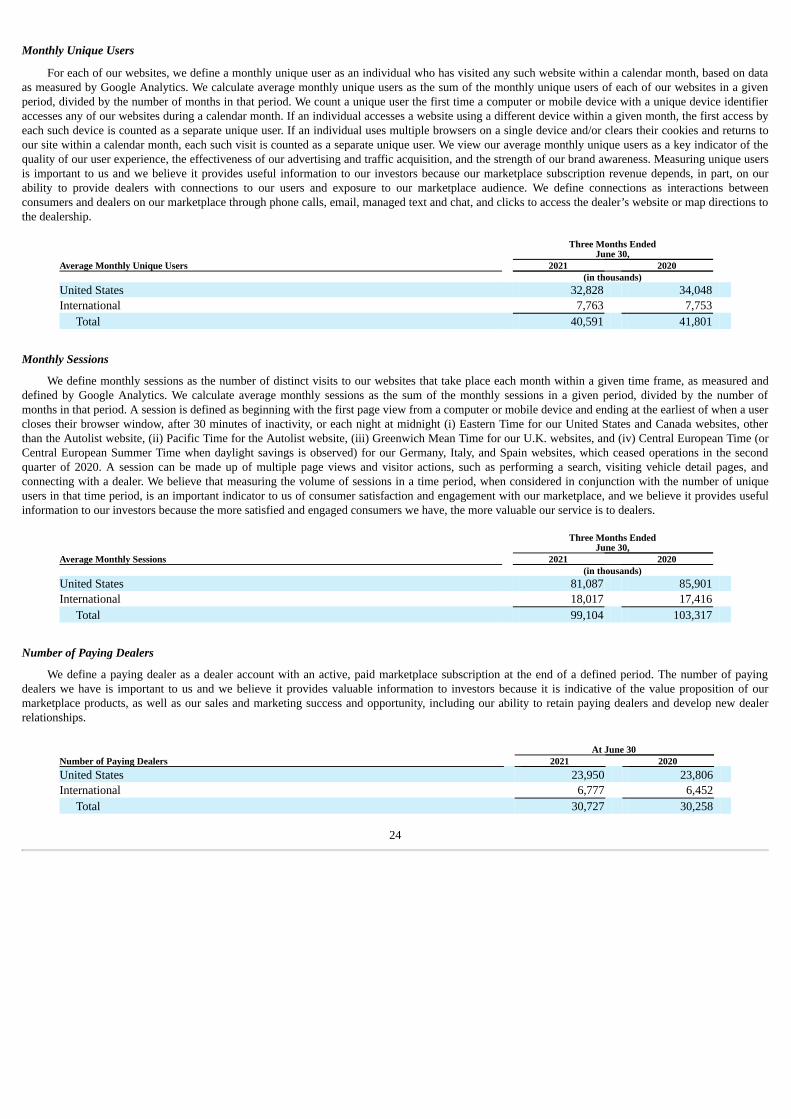
Monthly Unique Users
For each of our websites, we define a monthly unique user as an individual who has visited any such website within a calendar month, based on dataas measured by Google Analytics. We calculate average monthly unique users as the sum of the monthly unique users of each of our websites in a givenperiod, divided by the number of months in that period. We count a unique user the first time a computer or mobile device with a unique device identifieraccesses any of our websites during a calendar month. If an individual accesses a website using a different device within a given month, the first access byeach such device is counted as a separate unique user. If an individual uses multiple browsers on a single device and/or clears their cookies and returns toour site within a calendar month, each such visit is counted as a separate unique user. We view our average monthly unique users as a key indicator of thequality of our user experience, the effectiveness of our advertising and traffic acquisition, and the strength of our brand awareness. Measuring unique usersis important to us and we believe it provides useful information to our investors because our marketplace subscription revenue depends, in part, on ourability to provide dealers with connections to our users and exposure to our marketplace audience. We define connections as interactions betweenconsumers and dealers on our marketplace through phone calls, email, managed text and chat, and clicks to access the dealer’s website or map directions tothe dealership.
Three Months Ended
June 30, Average Monthly Unique Users 2021 2020 (in thousands) United States 32,828 34,048
International 7,763 7,753
Total 40,591 41,801
Monthly Sessions
We define monthly sessions as the number of distinct visits to our websites that take place each month within a given time frame, as measured anddefined by Google Analytics. We calculate average monthly sessions as the sum of the monthly sessions in a given period, divided by the number ofmonths in that period. A session is defined as beginning with the first page view from a computer or mobile device and ending at the earliest of when a usercloses their browser window, after 30 minutes of inactivity, or each night at midnight (i) Eastern Time for our United States and Canada websites, otherthan the Autolist website, (ii) Pacific Time for the Autolist website, (iii) Greenwich Mean Time for our U.K. websites, and (iv) Central European Time (orCentral European Summer Time when daylight savings is observed) for our Germany, Italy, and Spain websites, which ceased operations in the secondquarter of 2020. A session can be made up of multiple page views and visitor actions, such as performing a search, visiting vehicle detail pages, andconnecting with a dealer. We believe that measuring the volume of sessions in a time period, when considered in conjunction with the number of uniqueusers in that time period, is an important indicator to us of consumer satisfaction and engagement with our marketplace, and we believe it provides usefulinformation to our investors because the more satisfied and engaged consumers we have, the more valuable our service is to dealers.
Three Months Ended
June 30, Average Monthly Sessions 2021 2020 (in thousands) United States 81,087 85,901
International 18,017 17,416
Total 99,104 103,317
Number of Paying Dealers
We define a paying dealer as a dealer account with an active, paid marketplace subscription at the end of a defined period. The number of payingdealers we have is important to us and we believe it provides valuable information to investors because it is indicative of the value proposition of ourmarketplace products, as well as our sales and marketing success and opportunity, including our ability to retain paying dealers and develop new dealerrelationships.
At June 30 Number of Paying Dealers 2021 2020 United States 23,950 23,806 International 6,777 6,452
Total 30,727 30,258
24
Quarterly Average Revenue per Subscribing Dealer (QARSD)
We define QARSD, which is measured at the end of a fiscal quarter, as the marketplace subscription revenue during that trailing quarter divided bythe average number of paying dealers in that marketplace during the quarter. We calculate the average number of paying dealers for a period by adding thenumber of paying dealers at the end of such period and the end of the prior period and dividing by two. This information is important to us, and we believeit provides useful information to investors, because we believe that our ability to grow QARSD is an indicator of the value proposition of our products andthe return on investment, or ROI, that our paying dealers realize from our products. In addition, increases in QARSD, which we believe reflect the value ofexposure to our engaged audience in relation to subscription cost, are driven in part by our ability to grow the volume of connections to our users and thequality of those connections, which result in increased opportunity to upsell package levels and cross-sell additional products to our paying dealers.
At June 30 Quarterly Average Revenue per Subscribing Dealer (QARSD) 2021 2020 United States $ 5,550 $ 3,047 International $ 1,491 $ 643 Consolidated $ 4,657 $ 2,517
Adjusted EBITDA
To provide investors with additional information regarding our financial results, we monitor and have presented within this Quarterly Report,Adjusted EBITDA, which is a non‑GAAP financial measure. This non‑GAAP financial measure is not based on any standardized methodology prescribedby United States generally accepted accounting principles, or GAAP, and is not necessarily comparable to similarly titled measures presented by othercompanies.
We define Adjusted EBITDA as consolidated net income, adjusted to exclude: depreciation and amortization, stock‑based compensation expense,acquisition-related expenses, restructuring expenses, other income, net, provision for income taxes, and net income attributable to the minority interest inacquired entities. We have presented Adjusted EBITDA within this Quarterly Report, because it is a key measure used by our management and board ofdirectors to understand and evaluate our operating performance, generate future operating plans, and make strategic decisions regarding the allocation ofcapital. In particular, we believe that the exclusion of certain items in calculating Adjusted EBITDA can produce a useful measure for period‑to‑periodcomparisons of our business.
We use Adjusted EBITDA to evaluate our operating performance and trends and make planning decisions. We believe Adjusted EBITDA helpsidentify underlying trends in our business that could otherwise be masked by the effect of the expenses that we exclude. Accordingly, we believe thatAdjusted EBITDA provides useful information to investors and others in understanding and evaluating our operating results, enhancing the overallunderstanding of our past performance and future prospects, and allowing for greater transparency with respect to key financial metrics used by ourmanagement in its financial and operational decision‑making. In addition, we evaluate our Adjusted EBITDA in relation to our revenue. We refer to this asAdjusted EBITDA margin and define it as Adjusted EBITDA divided by total revenue.
Our Adjusted EBITDA is not prepared in accordance with GAAP, and should not be considered in isolation of, or as an alternative to, measuresprepared in accordance with GAAP. There are a number of limitations related to the use of Adjusted EBITDA rather than consolidated net income, which isthe most directly comparable GAAP equivalent. Some of these limitations are:
• Adjusted EBITDA excludes depreciation and amortization expense and, although these are non‑cash expenses, the assets being depreciated mayhave to be replaced in the future;
• Adjusted EBITDA excludes stock‑based compensation expense, which will be, for the foreseeable future, a significant recurring expense for ourbusiness and an important part of our compensation strategy;
• Adjusted EBITDA excludes transaction and one-time acquisition-related expenses incurred by us during a reporting period, which may not bereflective of our operational performance during such period, for acquisitions that have been completed as of the filing date of our annual orquarterly report (as applicable) relating to such period;
• Adjusted EBITDA excludes restructuring expenses incurred by us during a reporting period, which may not be reflective of our operationalperformance during such period;
• Adjusted EBITDA excludes other income, net which primarily includes transition service agreement income, interest income earned on our cash,cash equivalents, and investments, sublease income and net foreign exchange gains and losses;
25
• Adjusted EBITDA excludes the provision for income taxes;
• Adjusted EBITDA excludes the income attributable to the minority interest in acquired entities, adjusted for all prior limitations to AdjustedEBITDA as described above; and
• other companies, including companies in our industry, may calculate Adjusted EBITDA differently, which reduces its usefulness as a comparativemeasure.
Because of these limitations, we consider, and you should consider, Adjusted EBITDA together with other operating and financial performancemeasures presented in accordance with GAAP.
The following table presents a reconciliation of Adjusted EBITDA to consolidated net income, the most directly comparable measure calculated inaccordance with GAAP, for each of the periods presented.
Three Months Ended
June 30, Six Months Ended
June 30, 2021 2020 2021 2020
Reconciliation of Adjusted EBITDA: (in thousands) (in thousands) Consolidated net income $ 27,396 $ 7,131 $ 46,947 $ 19,827 Depreciation and amortization 10,165 3,357 18,831 6,347 Stock-based compensation expense 22,540 11,923 37,933 23,604 Acquisition-related expenses 65 24 709 968 Restructuring expenses (1) — 3,514 — 3,514 Other income, net (61) (474) (283) (1,202)Provision for income taxes 11,142 2,052 17,604 2,103 Consolidated Adjusted EBITDA 71,247 27,527 121,741 55,161 Net income attributable to redeemable noncontrolling interest (4,805) — (4,737) — Adjusted EBITDA $ 66,442 $ 27,527 $ 117,004 $ 55,161
1) Excludes stock-based compensation expense of $753 for the three and six months ended June 30, 2020 related to the Expense Reduction Plan, as
the amount is already included within the stock-based compensation line item in the Reconciliation of Adjusted EBITDA.
Components of Unaudited Condensed Consolidated Income Statements
We derive revenue from two sources: (1) marketplace subscription revenue, which consists primarily of Listings and Dealer Display subscriptions,and (2) other revenue, which consists primarily of revenue relating to the wholesale sale of automobiles, display advertising revenue from automanufacturers and other auto‑related brand advertisers and revenue from partnerships with financing services companies.
Marketplace Subscription Revenue
We offer multiple types of marketplace Listings packages to our dealers for our CarGurus U.S. platform (availability varies on our othermarketplaces): Restricted Listings (formerly referred to as Basic Listings), which is free; and various levels of Listings packages, which each require a paidsubscription under a monthly, quarterly, semiannual, or annual subscription basis.
Our subscriptions for customers generally auto-renew on a monthly basis and are cancellable by dealers with 30 days’ advance notice at the end of thecommitted term, although during the second quarter of 2020 we did not require 30 days’ advance notice of termination from dealers who cancelled as aresult of the COVID-19 pandemic. Subscription pricing is determined based on a dealer’s inventory size, region, and our assessment of the connections andROI the platform will provide them and is subject to discounts and/or fee reductions that we may offer from time to time. We also offer all dealers on ourplatform access to our Dealer Dashboard, which includes a performance summary, Dealer Insights tool, and user review management platform. Onlydealers subscribing to a paid Listings package have access to the Pricing Tool, Market Analysis tool and our IMV Scan tool.
In addition to displaying inventory in our marketplace and providing access to the Dealer Dashboard, we offer dealers subscribing to certain of ourListings packages other subscription advertising and customer acquisition products and enhancements, including Dealer Display, which is marketed underour Real-time Performance Marketing suite. With Dealer Display, dealers can buy display advertising that appears in our marketplace, on other sites on theinternet and/or on Facebook, a highly converting social platform. Such advertisements can be targeted by the user’s geography, search history, CarGuruswebsite activity (including showing a consumer
26
relevant vehicles from a dealer’s inventory that the consumer has not yet discovered on our marketplace), and a number of other targeting factors, allowingdealers to increase their visibility with in-market consumers and drive qualified traffic for dealers.
We also offer paid Listings packages for the Autolist website and paid Listings and display products for the PistonHeads website.
Other Revenue
Other revenue consists of revenue relating to the wholesale sale of automobiles, which includes transaction fees earned by CarOffer from facilitatingthe purchase and sale of vehicles between dealers, where CarOffer collects fees from both the buyer and seller. CarOffer also sells vehicles to dealers thatCarOffer acquires at other marketplaces or directly from consumers – in these instances, CarOffer collects a transaction fee from the buyer. CarOffer alsocharges the buyer fees to perform inspection and transportation services for all wholesale transactions.
Other revenue also consists of non-dealer display advertising revenue from auto manufacturers and other auto-related brand advertisers sold on a costper thousand impressions, or CPM, basis. An impression is an advertisement loaded on a web page. In addition to advertising sold on a CPM basis, we alsohave advertising sold on a cost per click basis. Auto manufacturers and other brand advertisers can execute advertising campaigns that are targeted across awide variety of parameters, including demographic groups, behavioral characteristics, specific auto brands, categories such as Certified Pre-Owned, andsegments such as hybrid vehicles.
Other revenue also includes revenue from partnerships with certain financing services companies pursuant to which we enable eligible consumers onour CarGurus U.S. website to pre-qualify for financing on cars from dealerships that offer financing through such companies. We primarily generaterevenue from these partnerships based on the number of funded loans from consumers who pre-qualify with our lending partners through our site.
We also offer non-dealer display products for the Autolist and PistonHeads websites.
For a description of our revenue accounting policies, see “— Critical Accounting Policies and Significant Estimates.”
Cost of Revenue
Cost of revenue includes costs incurred to support revenue relating to the wholesale sale of automobiles. These costs include the costs to facilitate thepurchase and sale of vehicles between dealers and from fulfilling buy orders from dealers through the acquisition of vehicles at auction. The primary costsincurred for wholesale transactions include the costs to transport and inspect vehicles, certain salaries, benefits, incentive compensation and stock-basedcompensation for employees directly involved in the fulfillment and support of transactions, allocated overhead costs and other third-party costs. In limitedcircumstances, typically during an arbitration process, CarOffer acquires vehicles in transactions for which it is deemed to control the vehicle andrecognizes the cost of the vehicle through cost of revenue when the vehicle is sold.
Cost of revenue also includes costs related to supporting and hosting our digital product offerings. These costs include salaries, benefits, incentivecompensation, and stock-based compensation for our customer support team and third-party service provider costs such as advertising, data center andnetworking expenses, allocated overhead costs, depreciation expense associated with our property and equipment, and amortization of capitalized websitedevelopment costs. We allocate overhead costs, such as rent and facility costs, information technology costs, and employee benefit costs, to all departmentsbased on headcount. As such, general overhead expenses are reflected in cost of revenue and each operating expense category. We expect these expenses toincrease as we continue to scale our business and introduce new products.
Operating Expenses
Sales and Marketing
Sales and marketing expenses consist primarily of personnel and related expenses for our sales and marketing team, including salaries, benefits,incentive compensation, commissions, stock-based compensation, and travel costs; costs associated with consumer marketing, such as traffic acquisition,brand building, and public relations activities; costs associated with dealer marketing, such as content marketing, customer and promotional events, andindustry events; amortization of internal-use software; and allocated overhead costs. A portion of our commissions that are related to obtaining a newcontract is capitalized and amortized over the estimated benefit period of customer relationships. All other sales and marketing costs are expensed asincurred. We expect sales and marketing expenses to fluctuate from quarter to quarter as we respond to the COVID-19 pandemic and changes in themacroeconomic and competitive landscapes affecting our consumer audience and brand awareness, which will impact our quarterly results of operations.
27
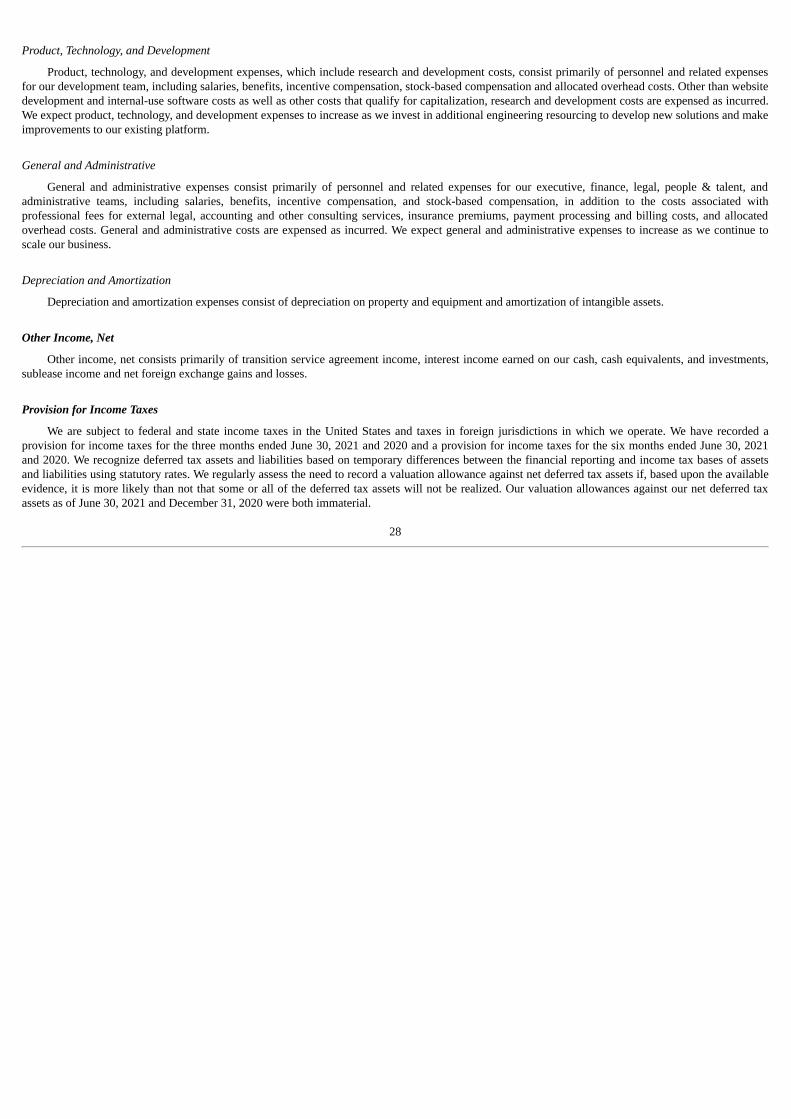
Product, Technology, and Development
Product, technology, and development expenses, which include research and development costs, consist primarily of personnel and related expensesfor our development team, including salaries, benefits, incentive compensation, stock-based compensation and allocated overhead costs. Other than websitedevelopment and internal-use software costs as well as other costs that qualify for capitalization, research and development costs are expensed as incurred.We expect product, technology, and development expenses to increase as we invest in additional engineering resourcing to develop new solutions and makeimprovements to our existing platform.
General and Administrative
General and administrative expenses consist primarily of personnel and related expenses for our executive, finance, legal, people & talent, andadministrative teams, including salaries, benefits, incentive compensation, and stock-based compensation, in addition to the costs associated withprofessional fees for external legal, accounting and other consulting services, insurance premiums, payment processing and billing costs, and allocatedoverhead costs. General and administrative costs are expensed as incurred. We expect general and administrative expenses to increase as we continue toscale our business.
Depreciation and Amortization
Depreciation and amortization expenses consist of depreciation on property and equipment and amortization of intangible assets.
Other Income, Net
Other income, net consists primarily of transition service agreement income, interest income earned on our cash, cash equivalents, and investments,sublease income and net foreign exchange gains and losses.
Provision for Income Taxes
We are subject to federal and state income taxes in the United States and taxes in foreign jurisdictions in which we operate. We have recorded aprovision for income taxes for the three months ended June 30, 2021 and 2020 and a provision for income taxes for the six months ended June 30, 2021and 2020. We recognize deferred tax assets and liabilities based on temporary differences between the financial reporting and income tax bases of assetsand liabilities using statutory rates. We regularly assess the need to record a valuation allowance against net deferred tax assets if, based upon the availableevidence, it is more likely than not that some or all of the deferred tax assets will not be realized. Our valuation allowances against our net deferred taxassets as of June 30, 2021 and December 31, 2020 were both immaterial.
28
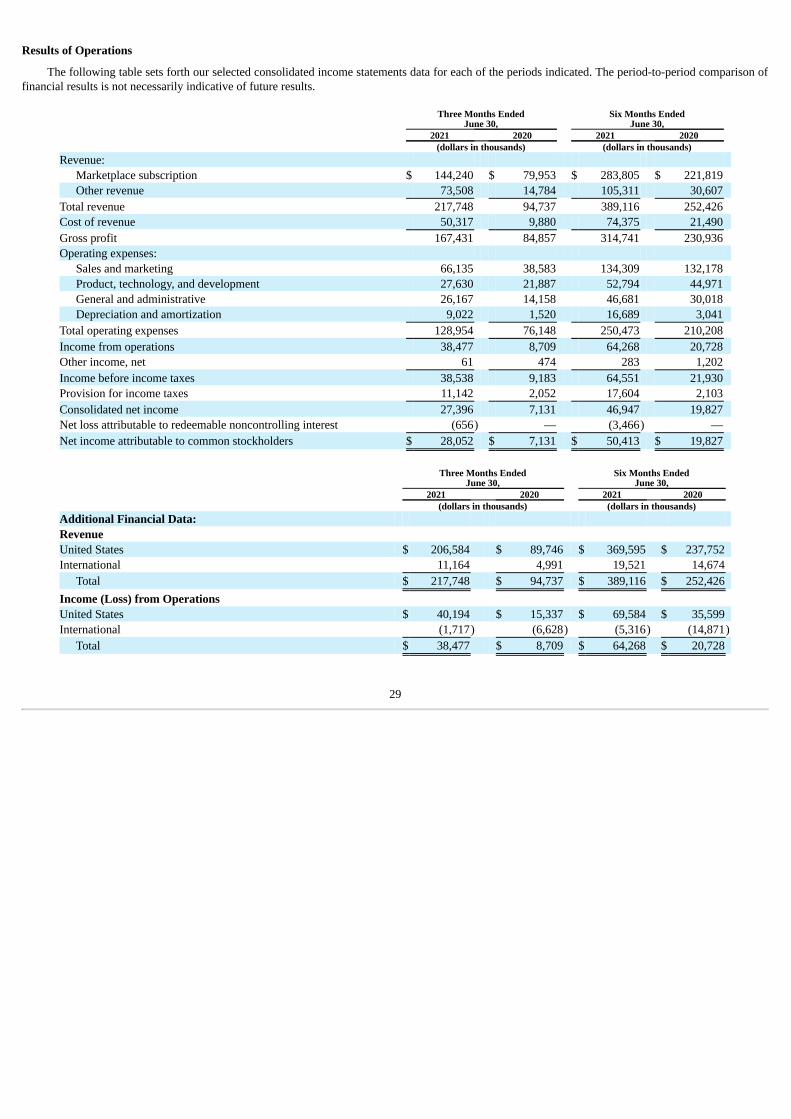
Results of Operations
The following table sets forth our selected consolidated income statements data for each of the periods indicated. The period-to-period comparison offinancial results is not necessarily indicative of future results.
Three Months Ended
June 30, Six Months Ended
June 30, 2021 2020 2021 2020 (dollars in thousands) (dollars in thousands)
Revenue: Marketplace subscription $ 144,240 $ 79,953 $ 283,805 $ 221,819 Other revenue 73,508 14,784 105,311 30,607
Total revenue 217,748 94,737 389,116 252,426 Cost of revenue 50,317 9,880 74,375 21,490 Gross profit 167,431 84,857 314,741 230,936 Operating expenses:
Sales and marketing 66,135 38,583 134,309 132,178 Product, technology, and development 27,630 21,887 52,794 44,971 General and administrative 26,167 14,158 46,681 30,018 Depreciation and amortization 9,022 1,520 16,689 3,041
Total operating expenses 128,954 76,148 250,473 210,208 Income from operations 38,477 8,709 64,268 20,728 Other income, net 61 474 283 1,202 Income before income taxes 38,538 9,183 64,551 21,930 Provision for income taxes 11,142 2,052 17,604 2,103 Consolidated net income 27,396 7,131 46,947 19,827 Net loss attributable to redeemable noncontrolling interest (656) — (3,466) — Net income attributable to common stockholders $ 28,052 $ 7,131 $ 50,413 $ 19,827
Three Months EndedJune 30,
Six Months EndedJune 30,
2021 2020 2021 2020 (dollars in thousands) (dollars in thousands)
Additional Financial Data: Revenue United States $ 206,584 $ 89,746 $ 369,595 $ 237,752 International 11,164 4,991 19,521 14,674
Total $ 217,748 $ 94,737 $ 389,116 $ 252,426 Income (Loss) from Operations United States $ 40,194 $ 15,337 $ 69,584 $ 35,599 International (1,717) (6,628) (5,316) (14,871)
Total $ 38,477 $ 8,709 $ 64,268 $ 20,728
29
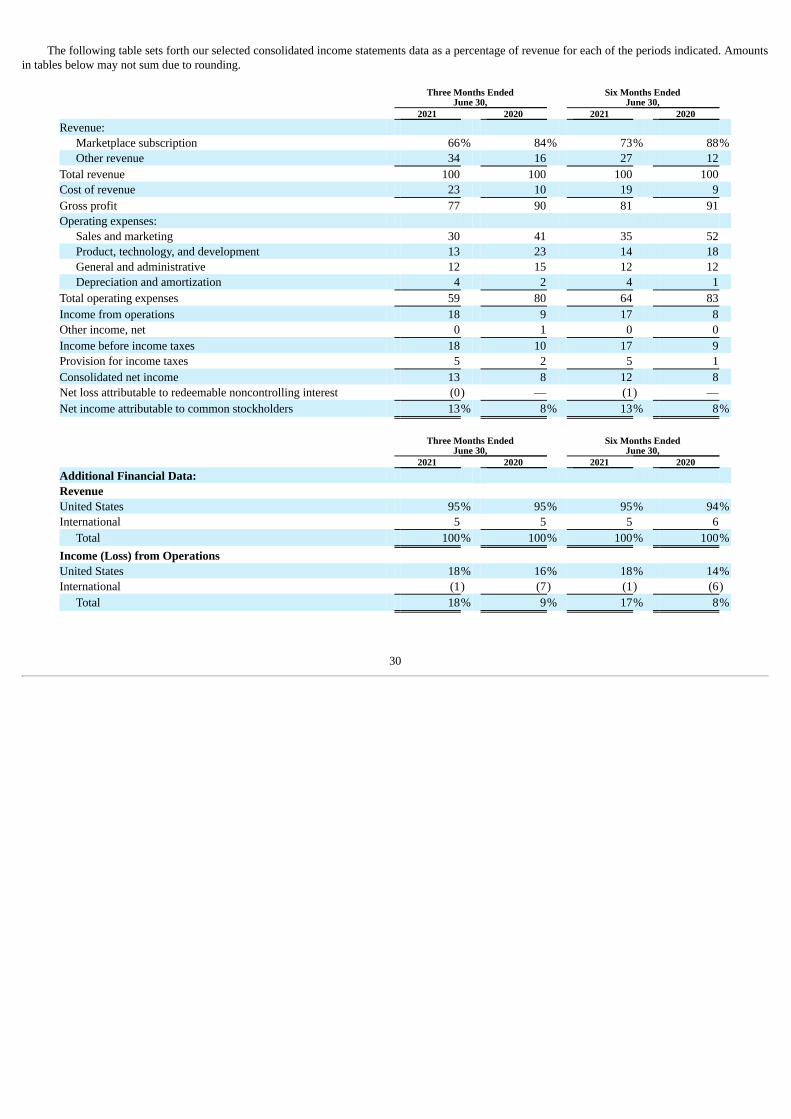
The following table sets forth our selected consolidated income statements data as a percentage of revenue for each of the periods indicated. Amountsin tables below may not sum due to rounding.
Three Months Ended
June 30, Six Months Ended
June 30, 2021 2020 2021 2020
Revenue: Marketplace subscription 66% 84% 73% 88%Other revenue 34 16 27 12
Total revenue 100 100 100 100 Cost of revenue 23 10 19 9 Gross profit 77 90 81 91 Operating expenses:
Sales and marketing 30 41 35 52 Product, technology, and development 13 23 14 18 General and administrative 12 15 12 12 Depreciation and amortization 4 2 4 1
Total operating expenses 59 80 64 83 Income from operations 18 9 17 8 Other income, net 0 1 0 0 Income before income taxes 18 10 17 9 Provision for income taxes 5 2 5 1 Consolidated net income 13 8 12 8 Net loss attributable to redeemable noncontrolling interest (0) — (1) — Net income attributable to common stockholders 13% 8% 13% 8%
Three Months EndedJune 30,
Six Months EndedJune 30,
2021 2020 2021 2020 Additional Financial Data: Revenue United States 95% 95% 95% 94%International 5 5 5 6
Total 100% 100% 100% 100%Income (Loss) from Operations United States 18% 16% 18% 14%International (1) (7) (1) (6)
Total 18% 9% 17% 8%
30

For the three months ended June 30, 2021 and 2020
Revenue
Revenue by Source
Three Months Ended
June 30, Change 2021 2020 Amount % (dollars in thousands)
Revenue Marketplace subscription $ 144,240 $ 79,953 $ 64,287 80%Other revenue 73,508 14,784 58,724 397%
Total $ 217,748 $ 94,737 $ 123,011 130%Percentage of total revenue: Marketplace subscription 66% 84% Other revenue 34 16
Total 100% 100%
Overall revenue increased by $123.0 million, or 130%, in the three months ended June 30, 2021 compared to the three months ended June 30, 2020.
Other revenue increased by 397% and marketplace subscription revenue increased by 80%.
Marketplace subscription revenue increased by $64.3 million in the three months ended June 30, 2021 compared to the three months ended June 30,2020 and represented 66% of total revenue for the three months ended June 30, 2021 and 84% of total revenue for the three months ended June 30, 2020.The increase was due primarily to the approximately $50 million impact of fee reductions that we provided to our paying dealers during the second quarterof 2020 in response to the COVID-19 pandemic, of which approximately $47 million resulted in revenue reductions during such quarter, with theremaining impact spread over the life of the contract term. The increase in marketplace subscription revenue was also due in part to expansion across ourdealer base. The expansion was driven by rate increases and product upgrades for existing dealers and signing on new dealers with higher average monthlyrecurring revenue.
Other revenue increased by $58.7 million in the three months ended June 30, 2021 compared to the three months ended June 30, 2020 and represented34% of total revenue for the three months ended June 30, 2021 and 16% of total revenue for the three months ended June 30, 2020. The increase was dueprimarily to a $57.3 million increase in wholesale revenue due to our acquisition of a 51% interest in CarOffer.
Revenue by Segment
Three Months Ended
June 30, Change 2021 2020 Amount % (dollars in thousands)
Revenue United States $ 206,584 $ 89,746 $ 116,838 130%International 11,164 4,991 6,173 124%
Total $ 217,748 $ 94,737 $ 123,011 130%Percentage of total revenue: United States 95% 95% International 5 5
Total 100% 100%
United States revenue increased $116.8 million, or 130%, in the three months ended June 30, 2021 compared to the three months ended June 30,
2020. The increase was due primarily to a $57.3 million increase in wholesale revenue due to our acquisition of a 51% interest in CarOffer. Additionally,the increase was due to approximately $44 million in revenue reductions during the second quarter of 2020 as a result of the impact of fee reductions thatwe provided to our United States paying dealers during such quarter in response to the COVID-19 pandemic. The increase in United States revenue wasalso due in part to expansion across our dealer base. The expansion was driven by rate increases and product upgrades for existing dealers and signing onnew dealers with higher average monthly recurring revenue.
31

International revenue increased $6.2 million, or 124%, in the three months ended June 30, 2021 compared to the three months ended June 30, 2020.
The increase was due primarily to approximately $3 million in revenue reductions during the second quarter of 2020 as a result of the impact of feereductions that we provided to our international paying dealers during such quarter in response to the COVID-19 pandemic. The increase in internationalrevenue was also due in part to expansion across our dealer base. The expansion was driven by rate increases and product upgrades for existing dealers andsigning on new dealers with higher average monthly recurring revenue.
Cost of Revenue
Three Months Ended
June 30, Change 2021 2020 Amount % (dollars in thousands)
Cost of revenue $ 50,317 $ 9,880 $ 40,437 409%Percentage of total revenue 23% 10%
Cost of revenue increased $40.4 million, or 409%, in the three months ended June 30, 2021 compared to the three months ended June 30, 2020. The
increase was due primarily to $38.9 million in cost of revenue attributable to our wholesale offerings from CarOffer. Operating Expenses
Sales and Marketing Expenses
Three Months Ended
June 30, Change 2021 2020 Amount % (dollars in thousands)
Sales and marketing $ 66,135 $ 38,583 $ 27,552 71%Percentage of total revenue 30% 41%
Sales and marketing expenses increased $27.6 million, or 71%, in the three months ended June 30, 2021 compared to the three months ended June 30,
2020. The increase was due primarily to a $19.8 million increase in advertising costs and a $1.5 million increase in marketing costs relative to advertisingand marketing costs in the second quarter of 2020, during which we implemented cost savings efforts in response to the COVID-19 pandemic. The increasewas also due in part to a $4.6 million increase in salaries and employee-related costs. The increase in salaries and employee-related costs was primarilydriven by an increase in commissions expense, resulting from a decrease of capitalizable costs to obtain contracts and an increase of non-capitalizable coststo obtain contracts. The increase in sales and marketing expenses was also due in part to a $0.7 million increase in consultant and recruiting expenses and a$0.5 million increase in software subscriptions. The increase for the three months ended June 30, 2021 is inclusive of a $4.2 million increase in sales andmarketing expenses associated with CarOffer.
Product, Technology, and Development Expenses
Three Months Ended
June 30, Change 2021 2020 Amount % (dollars in thousands)
Product, technology, and development $ 27,630 $ 21,887 $ 5,743 26%Percentage of total revenue 13% 23%
Product, technology, and development expenses increased $5.7 million, or 26%, in the three months ended June 30, 2021 compared to the three
months ended June 30, 2020. The increase was due primarily to a $3.7 million increase in salaries and employee-related costs, exclusive of stock-basedcompensation expense, which increased $0.9 million. The increase in salaries and employee-related costs was due primarily to a 35% increase in headcountdue in part to our acquisition of CarOffer, and an increase in expected bonus attainment in comparison to the three months ended June 30, 2020 due toimproved performance since the outset of the COVID-19 pandemic. The increase in stock-based compensation expense was due primarily to therevaluation of certain liability-based stock awards and annual retention grants. The increase in product, technology and development expenses was also dueto a $1.2 million increase in consultant expenses. The increase for the three months ended June 30, 2021 is inclusive of a $1.8 million increase in product,technology,
32

and development expenses associated with CarOffer.
General and Administrative Expenses
Three Months Ended
June 30, Change 2021 2020 Amount % (dollars in thousands)
General and administrative $ 26,167 $ 14,158 $ 12,009 85%Percentage of total revenue 12% 15%
General and administrative expenses increased $12.0 million, or 85%, in the three months ended June 30, 2021 compared to the three months ended
June 30, 2020. The increase was due primarily to a $1.3 million increase in salaries and employee related costs, exclusive of stock-based compensationexpense, which increased $9.2 million. The increase in salaries and employee-related costs was due primarily to a 21% increase in headcount due primarilyto our acquisition of CarOffer, and an increase in expected bonus attainment in comparison to the three months ended June 30, 2020 due to improvedperformance since the outset of the COVID-19 pandemic. The increase in stock-based compensation expense was due primarily to the revaluation ofcertain liability-based stock awards and annual retention grants. The increase in general and administrative expenses is also due in part to a $0.9 millionincrease in costs related to payment processing and billing due to increased customer transactions as a result of increased revenue and a $0.5 millionincrease in consulting expenses. The increase for the three months ended June 30, 2021 is inclusive of a $7.1 million increase in general and administrativeexpenses associated with CarOffer.
Depreciation and Amortization Expenses
Three Months Ended
June 30, Change 2021 2020 Amount % (dollars in thousands)
Depreciation and amortization $ 9,022 $ 1,520 $ 7,502 494%Percentage of total revenue 4% 2%
Depreciation and amortization expenses increased $7.5 million, or 494%, in the three months ended June 30, 2021 compared to the three months
ended June 30, 2020, due primarily to an increase in amortization of intangible assets related to the acquired intangible assets from CarOffer.
Other Income, Net
Three Months Ended
June 30, Change 2021 2020 Amount %
(dollars in thousands) Other income, net $ 61 $ 474 $ (413) (87)%Percentage of total revenue 0% 1%
Total other income, net decreased $0.4 million, or 87%, in the three months ended June 30, 2021 compared to the three months ended June 30, 2020,
due primarily to a $0.3 million decrease in interest income as a result of a decline in interest rates associated with our investments in certificates of depositduring the three months ended June 30, 2021.
Provision for Income Taxes
Three Months Ended
June 30, Change 2021 2020 Amount % (dollars in thousands)
Provision for income taxes $ 11,142 $ 2,052 $ 9,090 443%Percentage of total revenue 5% 2%
33
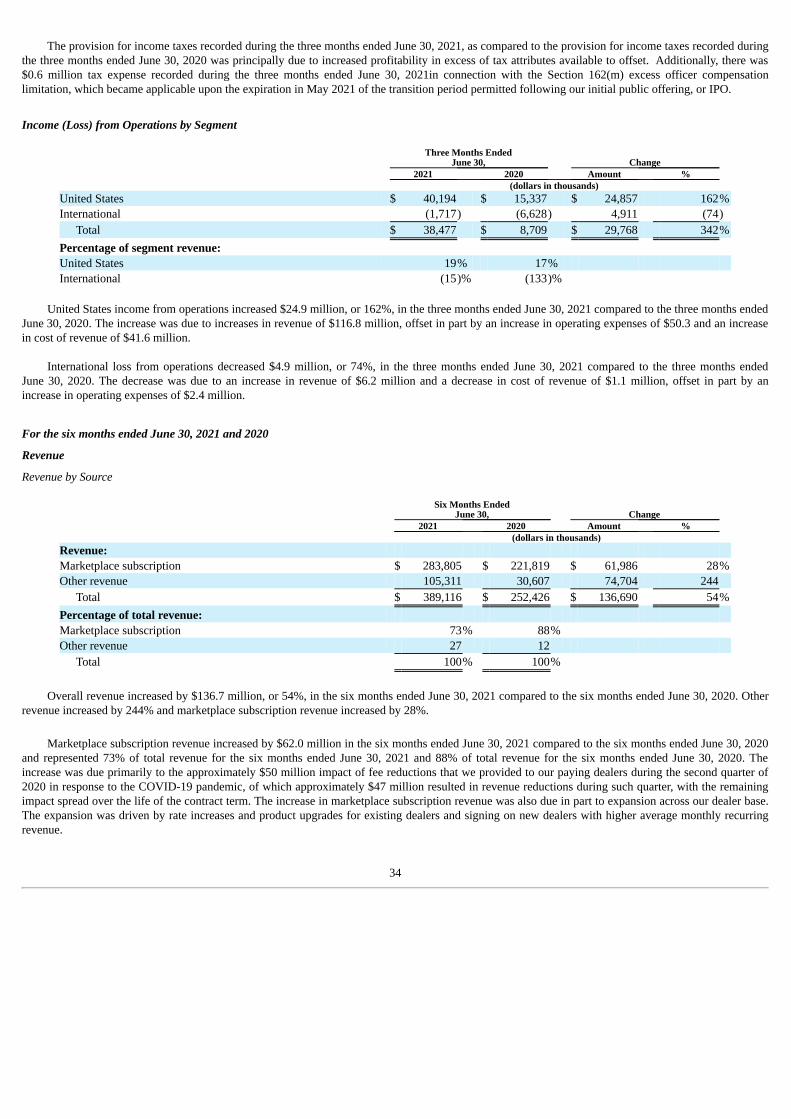
The provision for income taxes recorded during the three months ended June 30, 2021, as compared to the provision for income taxes recorded duringthe three months ended June 30, 2020 was principally due to increased profitability in excess of tax attributes available to offset. Additionally, there was$0.6 million tax expense recorded during the three months ended June 30, 2021in connection with the Section 162(m) excess officer compensationlimitation, which became applicable upon the expiration in May 2021 of the transition period permitted following our initial public offering, or IPO.
Income (Loss) from Operations by Segment
Three Months Ended
June 30, Change 2021 2020 Amount % (dollars in thousands)
United States $ 40,194 $ 15,337 $ 24,857 162%International (1,717) (6,628) 4,911 (74)
Total $ 38,477 $ 8,709 $ 29,768 342%Percentage of segment revenue: United States 19% 17% International (15)% (133)%
United States income from operations increased $24.9 million, or 162%, in the three months ended June 30, 2021 compared to the three months ended
June 30, 2020. The increase was due to increases in revenue of $116.8 million, offset in part by an increase in operating expenses of $50.3 and an increasein cost of revenue of $41.6 million.
International loss from operations decreased $4.9 million, or 74%, in the three months ended June 30, 2021 compared to the three months endedJune 30, 2020. The decrease was due to an increase in revenue of $6.2 million and a decrease in cost of revenue of $1.1 million, offset in part by anincrease in operating expenses of $2.4 million.
For the six months ended June 30, 2021 and 2020
Revenue
Revenue by Source
Six Months Ended
June 30, Change 2021 2020 Amount % (dollars in thousands)
Revenue: Marketplace subscription $ 283,805 $ 221,819 $ 61,986 28%Other revenue 105,311 30,607 74,704 244
Total $ 389,116 $ 252,426 $ 136,690 54%Percentage of total revenue: Marketplace subscription 73% 88% Other revenue 27 12
Total 100% 100%
Overall revenue increased by $136.7 million, or 54%, in the six months ended June 30, 2021 compared to the six months ended June 30, 2020. Other
revenue increased by 244% and marketplace subscription revenue increased by 28%. Marketplace subscription revenue increased by $62.0 million in the six months ended June 30, 2021 compared to the six months ended June 30, 2020
and represented 73% of total revenue for the six months ended June 30, 2021 and 88% of total revenue for the six months ended June 30, 2020. Theincrease was due primarily to the approximately $50 million impact of fee reductions that we provided to our paying dealers during the second quarter of2020 in response to the COVID-19 pandemic, of which approximately $47 million resulted in revenue reductions during such quarter, with the remainingimpact spread over the life of the contract term. The increase in marketplace subscription revenue was also due in part to expansion across our dealer base.The expansion was driven by rate increases and product upgrades for existing dealers and signing on new dealers with higher average monthly recurringrevenue.
34
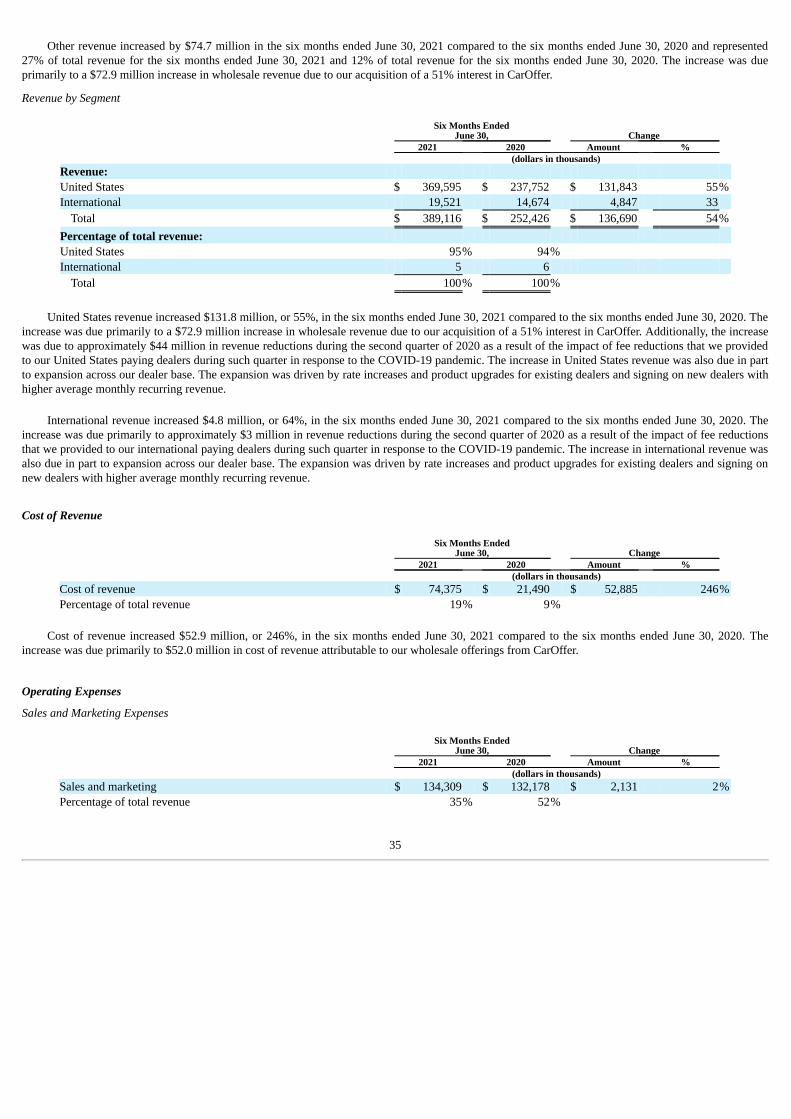
Other revenue increased by $74.7 million in the six months ended June 30, 2021 compared to the six months ended June 30, 2020 and represented27% of total revenue for the six months ended June 30, 2021 and 12% of total revenue for the six months ended June 30, 2020. The increase was dueprimarily to a $72.9 million increase in wholesale revenue due to our acquisition of a 51% interest in CarOffer.
Revenue by Segment
Six Months Ended
June 30, Change 2021 2020 Amount % (dollars in thousands)
Revenue: United States $ 369,595 $ 237,752 $ 131,843 55%International 19,521 14,674 4,847 33
Total $ 389,116 $ 252,426 $ 136,690 54%Percentage of total revenue: United States 95% 94% International 5 6
Total 100% 100%
United States revenue increased $131.8 million, or 55%, in the six months ended June 30, 2021 compared to the six months ended June 30, 2020. The
increase was due primarily to a $72.9 million increase in wholesale revenue due to our acquisition of a 51% interest in CarOffer. Additionally, the increasewas due to approximately $44 million in revenue reductions during the second quarter of 2020 as a result of the impact of fee reductions that we providedto our United States paying dealers during such quarter in response to the COVID-19 pandemic. The increase in United States revenue was also due in partto expansion across our dealer base. The expansion was driven by rate increases and product upgrades for existing dealers and signing on new dealers withhigher average monthly recurring revenue.
International revenue increased $4.8 million, or 64%, in the six months ended June 30, 2021 compared to the six months ended June 30, 2020. The
increase was due primarily to approximately $3 million in revenue reductions during the second quarter of 2020 as a result of the impact of fee reductionsthat we provided to our international paying dealers during such quarter in response to the COVID-19 pandemic. The increase in international revenue wasalso due in part to expansion across our dealer base. The expansion was driven by rate increases and product upgrades for existing dealers and signing onnew dealers with higher average monthly recurring revenue.
Cost of Revenue
Six Months Ended
June 30, Change 2021 2020 Amount % (dollars in thousands)
Cost of revenue $ 74,375 $ 21,490 $ 52,885 246%Percentage of total revenue 19% 9%
Cost of revenue increased $52.9 million, or 246%, in the six months ended June 30, 2021 compared to the six months ended June 30, 2020. The
increase was due primarily to $52.0 million in cost of revenue attributable to our wholesale offerings from CarOffer. Operating Expenses
Sales and Marketing Expenses
Six Months Ended
June 30, Change 2021 2020 Amount % (dollars in thousands)
Sales and marketing $ 134,309 $ 132,178 $ 2,131 2%Percentage of total revenue 35% 52%
35

Sales and marketing expenses increased $2.1 million, or 2%, in the six months ended June 30, 2021 compared to the six months ended June 30, 2020.The increase was due primarily to a $4.6 million increase in salaries and employee-related costs. The increase in salaries and employee-related costs wasprimarily driven by an increase in commissions expense, resulting from a decrease of capitalizable costs to obtain contracts and an increase of non-capitalizable costs to obtain contracts. The increase in sales and marketing expense was also due in part to an increase of $1.3 million in marketing costsrelative to marketing costs in the second quarter of 2020, during which we implemented cost savings efforts in response to the COVID-19 pandemic. Thisincrease was offset in part by a decrease of $3.8 million in advertising costs due to a gain in efficiency of algorithmic traffic acquisition and a deliberatereduction in spend as a result of marketing conditions, strong consumer demand for cars and automotive inventory supply issues due to globalsemiconductor chip shortage. The increase for the six months ended June 30, 2021 is inclusive of a $5.1 million increase in sales and marketing expensesassociated with CarOffer.
Product, Technology, and Development Expenses
Six Months Ended
June 30, Change 2021 2020 Amount % (dollars in thousands)
Product, technology, and development $ 52,794 $ 44,971 $ 7,823 17%Percentage of total revenue 14% 18%
Product, technology, and development expenses increased $7.8 million, or 17%, in the six months ended June 30, 2021 compared to the six months
ended June 30, 2020. The increase was due primarily to a $6.0 million increase in salaries and employee-related costs, exclusive of stock-basedcompensation expense, which increased $1.3 million. The increase in salaries and employee-related costs was due primarily to a 35% increase inheadcount, due in part to our acquisition of CarOffer, and an increase in expected bonus attainment in comparison to the six months ended June 30, 2020due to improved performance since the outset of the COVID-19 pandemic. The increase in stock-based compensation expense was due primarily to annualretention grants and the revaluation of certain liability-based stock awards. The increase for the six months ended June 30, 2021 is inclusive of a $2.8million increase in product, technology, and development expenses associated with CarOffer.
General and Administrative Expenses
Six Months Ended
June 30, Change 2021 2020 Amount % (dollars in thousands)
General and administrative $ 46,681 $ 30,018 $ 16,663 56%Percentage of total revenue 12% 12%
General and administrative expenses increased $16.7 million, or 56%, in the six months ended June 30, 2021 compared to the six months ended
June 30, 2020. The increase was due primarily to a $2.1 million increase in salaries and employee-related costs, exclusive of stock-based compensationexpense, which increased $12.5 million. The increase in salaries and employee-related costs was due primarily to a 21% increase in headcount, dueprimarily to our acquisition of CarOffer, and an increase in expected bonus attainment in comparison to the six months ended June 30, 2020 due toimproved performance since the outset of the COVID-19 pandemic. The increase in stock-based compensation expense was due primarily to therevaluation of certain liability-based stock awards and annual retention grants. The increase in general and administrative expenses is also due in part to a$0.9 million increase in consulting expenses and a $0.8 million increase in costs related to payment processing and billing due to increased customertransactions as a result of increased revenue. The increase for the six months ended June 30, 2021 is inclusive of a $9.1 million increase in general andadministrative expenses associated with CarOffer.
Depreciation and Amortization Expenses
Six Months Ended
June 30, Change 2021 2020 Amount % (dollars in thousands)
Depreciation and amortization $ 16,689 $ 3,041 $ 13,648 449%Percentage of total revenue 4% 1%
36
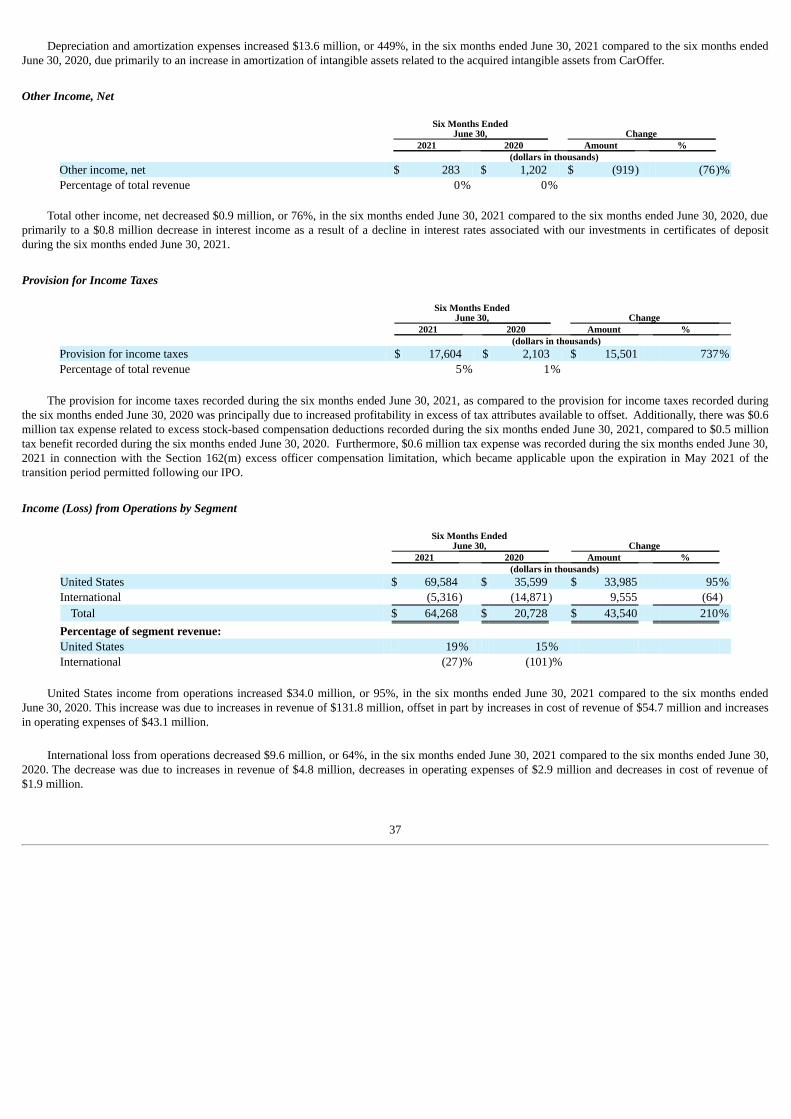
Depreciation and amortization expenses increased $13.6 million, or 449%, in the six months ended June 30, 2021 compared to the six months endedJune 30, 2020, due primarily to an increase in amortization of intangible assets related to the acquired intangible assets from CarOffer.
Other Income, Net
Six Months Ended
June 30, Change 2021 2020 Amount %
(dollars in thousands) Other income, net $ 283 $ 1,202 $ (919) (76)%Percentage of total revenue 0% 0%
Total other income, net decreased $0.9 million, or 76%, in the six months ended June 30, 2021 compared to the six months ended June 30, 2020, due
primarily to a $0.8 million decrease in interest income as a result of a decline in interest rates associated with our investments in certificates of depositduring the six months ended June 30, 2021.
Provision for Income Taxes
Six Months Ended
June 30, Change 2021 2020 Amount % (dollars in thousands)
Provision for income taxes $ 17,604 $ 2,103 $ 15,501 737%Percentage of total revenue 5% 1%
The provision for income taxes recorded during the six months ended June 30, 2021, as compared to the provision for income taxes recorded during
the six months ended June 30, 2020 was principally due to increased profitability in excess of tax attributes available to offset. Additionally, there was $0.6million tax expense related to excess stock-based compensation deductions recorded during the six months ended June 30, 2021, compared to $0.5 milliontax benefit recorded during the six months ended June 30, 2020. Furthermore, $0.6 million tax expense was recorded during the six months ended June 30,2021 in connection with the Section 162(m) excess officer compensation limitation, which became applicable upon the expiration in May 2021 of thetransition period permitted following our IPO.
Income (Loss) from Operations by Segment
Six Months Ended
June 30, Change 2021 2020 Amount % (dollars in thousands)
United States $ 69,584 $ 35,599 $ 33,985 95%International (5,316) (14,871) 9,555 (64)
Total $ 64,268 $ 20,728 $ 43,540 210%Percentage of segment revenue: United States 19% 15% International (27)% (101)%
United States income from operations increased $34.0 million, or 95%, in the six months ended June 30, 2021 compared to the six months ended
June 30, 2020. This increase was due to increases in revenue of $131.8 million, offset in part by increases in cost of revenue of $54.7 million and increasesin operating expenses of $43.1 million.
International loss from operations decreased $9.6 million, or 64%, in the six months ended June 30, 2021 compared to the six months ended June 30,
2020. The decrease was due to increases in revenue of $4.8 million, decreases in operating expenses of $2.9 million and decreases in cost of revenue of$1.9 million.
37
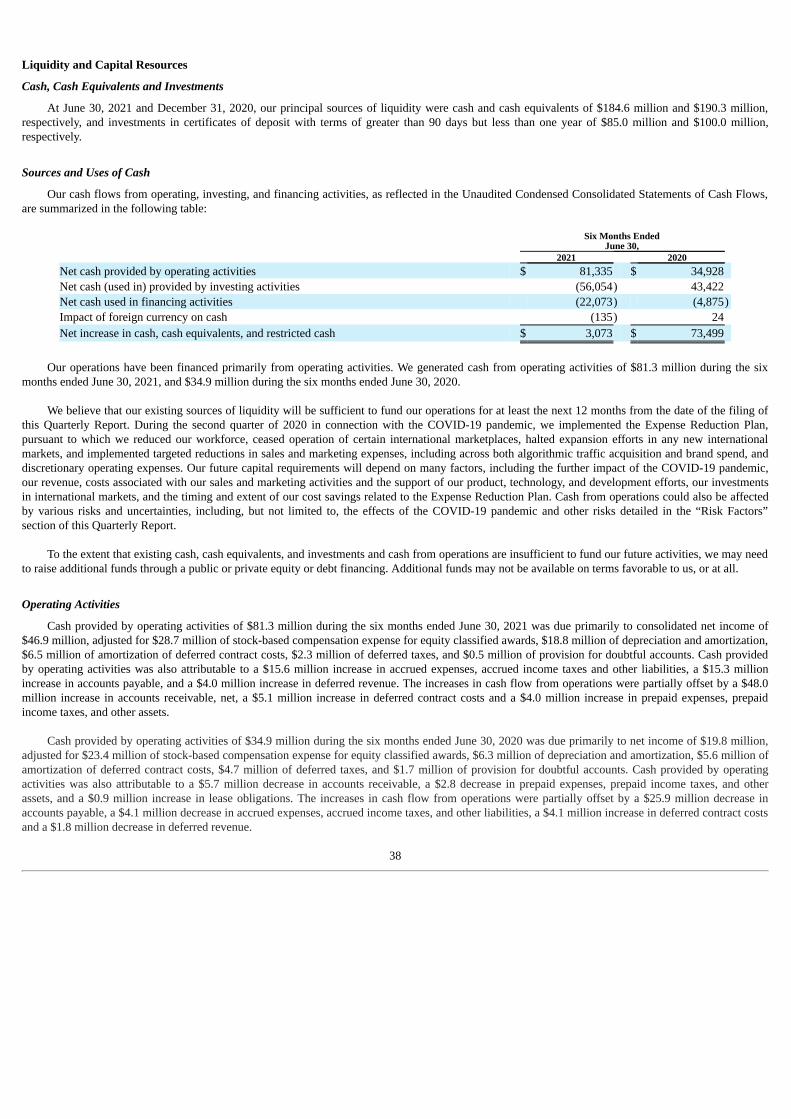
Liquidity and Capital Resources
Cash, Cash Equivalents and Investments
At June 30, 2021 and December 31, 2020, our principal sources of liquidity were cash and cash equivalents of $184.6 million and $190.3 million,respectively, and investments in certificates of deposit with terms of greater than 90 days but less than one year of $85.0 million and $100.0 million,respectively.
Sources and Uses of Cash
Our cash flows from operating, investing, and financing activities, as reflected in the Unaudited Condensed Consolidated Statements of Cash Flows,are summarized in the following table:
Six Months Ended
June 30, 2021 2020
Net cash provided by operating activities $ 81,335 $ 34,928 Net cash (used in) provided by investing activities (56,054) 43,422 Net cash used in financing activities (22,073) (4,875)Impact of foreign currency on cash (135) 24 Net increase in cash, cash equivalents, and restricted cash $ 3,073 $ 73,499
Our operations have been financed primarily from operating activities. We generated cash from operating activities of $81.3 million during the six
months ended June 30, 2021, and $34.9 million during the six months ended June 30, 2020.
We believe that our existing sources of liquidity will be sufficient to fund our operations for at least the next 12 months from the date of the filing ofthis Quarterly Report. During the second quarter of 2020 in connection with the COVID-19 pandemic, we implemented the Expense Reduction Plan,pursuant to which we reduced our workforce, ceased operation of certain international marketplaces, halted expansion efforts in any new internationalmarkets, and implemented targeted reductions in sales and marketing expenses, including across both algorithmic traffic acquisition and brand spend, anddiscretionary operating expenses. Our future capital requirements will depend on many factors, including the further impact of the COVID-19 pandemic,our revenue, costs associated with our sales and marketing activities and the support of our product, technology, and development efforts, our investmentsin international markets, and the timing and extent of our cost savings related to the Expense Reduction Plan. Cash from operations could also be affectedby various risks and uncertainties, including, but not limited to, the effects of the COVID-19 pandemic and other risks detailed in the “Risk Factors”section of this Quarterly Report.
To the extent that existing cash, cash equivalents, and investments and cash from operations are insufficient to fund our future activities, we may needto raise additional funds through a public or private equity or debt financing. Additional funds may not be available on terms favorable to us, or at all.
Operating Activities
Cash provided by operating activities of $81.3 million during the six months ended June 30, 2021 was due primarily to consolidated net income of$46.9 million, adjusted for $28.7 million of stock-based compensation expense for equity classified awards, $18.8 million of depreciation and amortization,$6.5 million of amortization of deferred contract costs, $2.3 million of deferred taxes, and $0.5 million of provision for doubtful accounts. Cash providedby operating activities was also attributable to a $15.6 million increase in accrued expenses, accrued income taxes and other liabilities, a $15.3 millionincrease in accounts payable, and a $4.0 million increase in deferred revenue. The increases in cash flow from operations were partially offset by a $48.0million increase in accounts receivable, net, a $5.1 million increase in deferred contract costs and a $4.0 million increase in prepaid expenses, prepaidincome taxes, and other assets.
Cash provided by operating activities of $34.9 million during the six months ended June 30, 2020 was due primarily to net income of $19.8 million,adjusted for $23.4 million of stock-based compensation expense for equity classified awards, $6.3 million of depreciation and amortization, $5.6 million ofamortization of deferred contract costs, $4.7 million of deferred taxes, and $1.7 million of provision for doubtful accounts. Cash provided by operatingactivities was also attributable to a $5.7 million decrease in accounts receivable, a $2.8 decrease in prepaid expenses, prepaid income taxes, and otherassets, and a $0.9 million increase in lease obligations. The increases in cash flow from operations were partially offset by a $25.9 million decrease inaccounts payable, a $4.1 million decrease in accrued expenses, accrued income taxes, and other liabilities, a $4.1 million increase in deferred contract costsand a $1.8 million decrease in deferred revenue.
38

Investing Activities
Cash used in investing activities of $56.1 million during the six months ended June 30, 2021 was due to $64.3 million of cash paid for acquisitions,net of cash acquired, $4.7 million of purchases of property and equipment and $2.1 million related to the capitalization of website development costs, offsetin part by $60 million of maturities of certificates of deposit, net of investments in certificates of deposit of $45 million.
Cash provided by investing activities of $43.4 million during the six months ended June 30, 2020 was due to maturities of certificates of deposit of$68.7 million, offset in part by $21.0 million of cash paid for acquisitions, $2.6 million of purchases of property and equipment, and $1.7 million related tothe capitalization of website development costs.
Financing Activities
Cash used in financing activities of $22.1 million during the six months ended June 30, 2021 was due primarily to CarOffer’s repayment of a line ofcredit of $14.3 million and our payment of withholding taxes on net share settlements of restricted stock units of $8.2 million, partially offset by $0.4million related to the proceeds from the issuance of common stock related to the exercise of vested stock options.
Cash used in financing activities of $4.9 million during the six months ended June 30, 2020 was due primarily to the payment of withholding taxes onnet share settlements of restricted stock units of $5.8 million, partially offset by $0.9 million related to the proceeds from the issuance of common stockrelated to the exercise of vested stock options.
Contractual Obligations and Known Future Cash Requirements
As of June 30, 2021, there were no material changes in our contractual obligations and commitments from those disclosed in our Annual Report, otherthan those appearing in the notes to the Unaudited Condensed Consolidated Financial Statements appearing elsewhere in this Quarterly Report, which arehereby incorporated by reference.
Off-Balance Sheet Arrangements
As of June 30, 2021 and December 31, 2020, we did not have any off-balance sheet arrangements, or leases that are less than twelve months induration, that have or are reasonably likely to have a current or future material effect on our financial condition, changes in financial condition, revenues orexpenses, results of operations, liquidity, capital expenditures, or capital resources.
Critical Accounting Policies and Significant Estimates
The preparation of the Unaudited Condensed Consolidated Financial Statements in conformity with GAAP requires us to make estimates andassumptions that affect the reported amounts of assets and liabilities, and the disclosure of contingent assets and liabilities at the date of the financialstatements, and the reported amounts of revenue and expenses during the reporting period.
Although we regularly assess these estimates, actual results could differ materially from these estimates. We base our estimates on historicalexperience and various other assumptions that we believe to be reasonable under the circumstances. Actual results may differ from our estimates if theseresults differ from historical experience, or other assumptions do not turn out to be substantially accurate, even if such assumptions are reasonable whenmade. Changes in estimates are recorded in the period in which they become known.
Significant estimates relied upon in preparing the Unaudited Condensed Consolidated Financial Statements include the determination of salesallowance and variable consideration in our revenue recognition, allowance for doubtful accounts, the valuation of redeemable noncontrolling interest,valuation of equity and liability-classified compensation awards under ASC 718, the expensing and capitalization of product, technology, and developmentcosts for website development and internal-use software, the valuation and recoverability of goodwill, intangible assets and other long-lived assets, and therecoverability of our net deferred tax assets and related valuation allowance. Accordingly, we consider these to be our critical accounting policies.
For a detailed explanation of the judgments made in these areas, refer to Note 2 to our Unaudited Condensed Consolidated Financial Statementsappearing elsewhere in this Quarterly Report and “Management’s Discussion and Analysis of Financial Condition and Results of Operations” in ourAnnual Report.
39
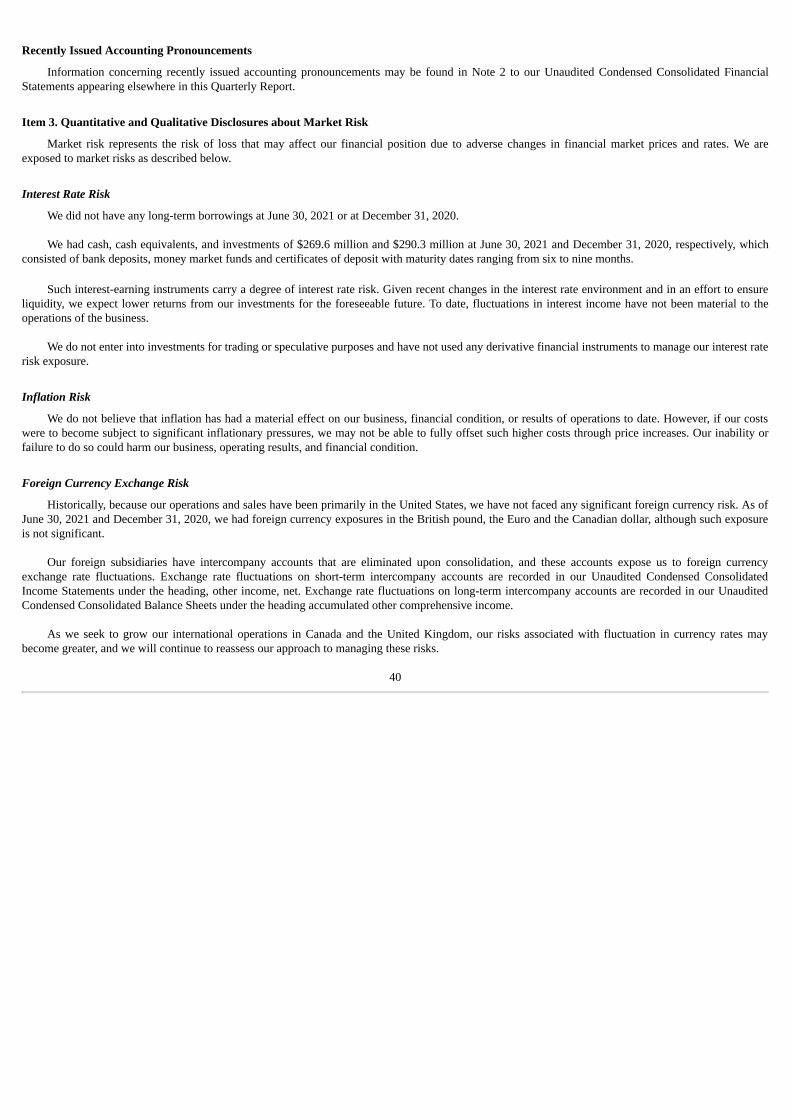
Recently Issued Accounting Pronouncements
Information concerning recently issued accounting pronouncements may be found in Note 2 to our Unaudited Condensed Consolidated FinancialStatements appearing elsewhere in this Quarterly Report.
Item 3. Quantitative and Qualitative Disclosures about Market Risk
Market risk represents the risk of loss that may affect our financial position due to adverse changes in financial market prices and rates. We areexposed to market risks as described below.
Interest Rate Risk
We did not have any long-term borrowings at June 30, 2021 or at December 31, 2020.
We had cash, cash equivalents, and investments of $269.6 million and $290.3 million at June 30, 2021 and December 31, 2020, respectively, whichconsisted of bank deposits, money market funds and certificates of deposit with maturity dates ranging from six to nine months.
Such interest-earning instruments carry a degree of interest rate risk. Given recent changes in the interest rate environment and in an effort to ensureliquidity, we expect lower returns from our investments for the foreseeable future. To date, fluctuations in interest income have not been material to theoperations of the business.
We do not enter into investments for trading or speculative purposes and have not used any derivative financial instruments to manage our interest raterisk exposure.
Inflation Risk
We do not believe that inflation has had a material effect on our business, financial condition, or results of operations to date. However, if our costswere to become subject to significant inflationary pressures, we may not be able to fully offset such higher costs through price increases. Our inability orfailure to do so could harm our business, operating results, and financial condition.
Foreign Currency Exchange Risk
Historically, because our operations and sales have been primarily in the United States, we have not faced any significant foreign currency risk. As ofJune 30, 2021 and December 31, 2020, we had foreign currency exposures in the British pound, the Euro and the Canadian dollar, although such exposureis not significant.
Our foreign subsidiaries have intercompany accounts that are eliminated upon consolidation, and these accounts expose us to foreign currencyexchange rate fluctuations. Exchange rate fluctuations on short-term intercompany accounts are recorded in our Unaudited Condensed ConsolidatedIncome Statements under the heading, other income, net. Exchange rate fluctuations on long-term intercompany accounts are recorded in our UnauditedCondensed Consolidated Balance Sheets under the heading accumulated other comprehensive income.
As we seek to grow our international operations in Canada and the United Kingdom, our risks associated with fluctuation in currency rates maybecome greater, and we will continue to reassess our approach to managing these risks.
40

Item 4. Controls and Procedures
Evaluation of Disclosure Controls and Procedures
Our management, with the participation of our principal executive officer and principal financial officer, has evaluated the effectiveness of ourdisclosure controls and procedures (as defined in Rules 13a-15(e) and 15d-15(e) under the Securities Exchange Act of 1934, as amended, or the ExchangeAct), as of the end of the period covered by this Quarterly Report. Based on such evaluation, our principal executive officer and principal financial officerhave concluded that as of such date, our disclosure controls and procedures were effective.
Changes in Internal Control Over Financial Reporting
There was no change in our internal control over financial reporting (as defined in Rules 13a-15(f) and 15d-15(f) under the Exchange Act) thatoccurred during the period covered by this Quarterly Report that has materially affected, or is reasonably likely to materially affect, our internal controlover financial reporting.
41
PART II—OTHER INFORMATION
Item 1. Legal Proceedings.
From time to time we may become involved in legal proceedings or be subject to claims arising in the ordinary course of our business. We are notpresently subject to any pending or threatened litigation that we believe, if determined adversely to us, would individually, or taken together, reasonably beexpected to have a material adverse effect on our business or financial results.
Item 1A. Risk Factors.
Investing in our Class A common stock involves a high degree of risk. You should carefully consider the risks and uncertainties described below,together with all of the other information contained in this Quarterly Report, including “Management’s Discussion and Analysis of Financial Conditionand Results of Operations” and our consolidated financial statements and related notes, before evaluating our business. Our business, financial condition,operating results, cash flow, and prospects could be materially and adversely affected by any of these risks or uncertainties. In that event, the trading priceof our Class A common stock could decline. See “Special Note Regarding Forward‑Looking Statements.”
Risks Related to Our Business and Industry
Our business has been, and we expect it to continue to be, adversely affected by the COVID-19 pandemic.
The COVID-19 pandemic has caused an international health crisis and resulted in significant disruptions to the global economy as well as businessesand capital markets around the world. Our operations have been materially adversely affected by a range of factors related to the COVID-19 pandemic. InMarch 2020, we temporarily closed all of our offices and began requiring our employees to work remotely until further notice, which has disrupted andmay continue to disrupt how we operate our business. In addition, in an effort to limit the spread of COVID-19, many countries, as well as states andlocalities in the United States, implemented or mandated and continue to implement or mandate significant restrictions on travel and commerce, shelter-in-place or stay-at-home orders, and business closures. Fluctuation in infection rates in the regions in which we operate has resulted in periodic changes inrestrictions that vary from region to region and may require rapid response to new or reinstated orders. Many of these orders resulted in, and may continueto result in, restrictions on the ability of consumers to buy and sell automobiles by restricting operations at dealerships and/or by closing or reducing theservices provided by certain service providers upon which dealerships rely. In addition, these restrictions and continued concern about the spread of thedisease have impacted car shopping by consumers and disrupted the operations of car dealerships, which has adversely affected and may continue toadversely affect the market for automobile purchases.
The automotive industry is also facing, and may continue to face, inventory supply problems, including for reasons attributable to the COVID-19pandemic and other macroeconomic issues, such as the global semiconductor chip shortage. This decline in vehicle inventory has led to an increase in bidsper vehicle at auction and corresponding increases to wholesale auction prices. As the price of replenishing inventory through wholesale auctions hasincreased, dealers have increased, and may continue to increase, the prices they charge consumers. A high volume of price increases on vehicle sales at arapid rate could impact our proprietary Instant Market Values, or IMV, and distribution of Deal Ratings. In addition, if our paying dealers continue tooperate at reduced inventory levels or with increased costs, they may reduce or be unwilling to increase their advertising spend with us and/or mayterminate their subscriptions at the conclusion of the committed term. Our ability to add new paying dealers or increase our fees with dealers may beimpeded if dealers perceive they have less of a need for our products and services because of their limited inventory. Inventory challenges in theautomotive industry have adversely impacted, and could continue to adversely impact, the amount of inventory on our websites, which could contribute toa decline in the number of consumer visits to our websites and/or the number of connections between consumers and dealers through our marketplaces.These inventory-related issues resulting from the COVID-19 pandemic and other macroeconomic issues may materially and adversely impact our business,financial condition and results of operations.
As a result of the travel and commerce restrictions and the impact on their businesses, a number of our dealer customers temporarily closed or areoperating on a reduced capacity, and many dealerships are facing significant financial challenges. Such closures and circumstances led some paying dealersto cancel their subscriptions and/or reduce their spending with us, which has had and may continue to have a material adverse effect on our revenues and onour business. Additionally, in response to the increasing cancelations and the drop in consumer demand at the beginning of the COVID-19 pandemic, wereduced our spending on brand advertising and traffic acquisition, which contributed to fewer consumers using our platform during the year endedDecember 31, 2020 and each of the three months ended March 31, 2021 and June 30, 2021 compared to the prior periods, which in turn has, and maycontinue to, materially and adversely affect our business. While we have since restored a portion of that historical consumer spend, we may not in thefuture
42
fully restore prior spending levels if we elect to redirect our investments elsewhere, including in favor of new product development. If such a strategy werenot to result in the benefits that we expect, our business could be harmed. Our business relies on the ability of consumers to borrow funds to acquireautomobiles and banks and other financing companies may limit or restrict lending to consumers as a result of the economic impacts of the COVID-19pandemic, which may also materially and adversely affect our business.
Further, because of the significant financial challenges that dealerships have faced and continue to face as a result of the COVID-19 pandemic, wetook measures to help our paying dealers maintain their business health during the COVID-19 pandemic, including by proactively reducing the subscriptionfees for paying dealers for certain service periods. As a result, the level of fees we received from paying dealers materially decreased during the year endedDecember 31, 2020, resulting in a material decline in our revenue and a material adverse effect to our business. In addition, despite our proactive feereductions during the second quarter of 2020, we experienced increased customer cancellation rates and slowed paying dealer additions, which materiallyand adversely affected our business for the year ended December 31, 2020. We may again in the future experience increased cancellations and/or slowedpaying dealer additions and as a result may decide to re-institute further billings relief as we continue to assess the effects of the COVID-19 pandemic onour paying dealers and business operations. During the COVID-19 pandemic, we have also experienced, and may continue to experience, increased accountdelinquencies from dealer customers challenged by the COVID-19 pandemic that failed to pay us on time or at all.
These effects from the COVID-19 pandemic on our revenue caused us to implement certain cost-savings measures across our business, whichdisrupted our business and operations during the year ended December 31, 2020. For example, during the second quarter of 2020, we initiated a cost-savings initiative that included a reduction in our workforce, a limitation in discretionary spend across our business and our ceasing of certain internationaloperations and expansion efforts. We also reduced consumer marketing across both algorithmic traffic acquisition and brand spend during the year endedDecember 31, 2020 in comparison to the prior year in an effort to reduce expenses and as a result of suppressed dealer inventory and resulting reduceddemand for leads from dealers. Despite these measures, we may not achieve the costs savings or attract consumer visits at the levels we expect, whichwould adversely impact our cash flows and financial condition. These expense reduction activities, and any future cost savings actions that we may take,may yield unintended consequences, such as loss of key employees, undesired attrition, and the risk that we may not achieve the anticipated cost savings atthe levels we expect, any of which may have a material adverse effect on our results of operations and/or financial condition. If the COVID-19 pandemicmaterially impacts our revenues in the future, we may also decide that additional disruptive measures are necessary to reduce our operating expenses.
The global nature of the COVID-19 pandemic has also had, and will continue to have, a significant impact on our international businesses. Due to thecrisis, we ceased marketplace operations in Germany, Italy, and Spain, and halted any new international expansion efforts, which we believe will allow usto focus our financial and human capital resources on our more established international markets in Canada and the United Kingdom. Failure by us tosucceed in these two markets, however, would materially and adversely affect our business and potential growth.
We continue to monitor and assess the effects of the COVID-19 pandemic on our commercial operations, including the impact on our revenue.However, we cannot at this time accurately predict what effects these conditions will ultimately have on our operations due to uncertainties relating to theduration of the pandemic, the extent and effectiveness of governmental responses and other preventative, treatment and containment actions ordevelopments, including the distribution of vaccines, shifts in behavior going forward, and the length or severity of the travel and commerce restrictionsimposed by relevant governmental authorities. Nor can we predict the adverse impact on the global economies and financial markets in which we operate,which may have a significant negative impact on our business, financial condition and results of operations.
Our business is substantially dependent on our relationships with dealers. If a significant number of dealers terminate their subscription agreementswith us, our business and financial results would be materially and adversely affected.
Our primary source of revenue consists of subscription fees paid to us by dealers for access to enhanced features on our automotive marketplaces. Oursubscription agreements with dealers generally may be terminated by us with 30 days’ notice and by dealers with 30 days’ notice at the end of thecommitted term. The majority of our contracts with dealers currently provide for one-month committed terms and do not contain contractual obligationsrequiring a dealer to maintain its relationship with us beyond the committed term. Accordingly, these dealers may cancel their subscriptions with us inaccordance with the terms of their subscription agreements. A dealer’s decision to cancel its subscription with us may be influenced by several factors,including national and regional dealership associations, national and local regulators, automotive manufacturers, consumer groups, and consolidated dealergroups. If any of these influential groups indicate that dealers should not enter into or maintain subscription agreements with us, this belief could becomeshared by dealers and we may lose a number of our paying dealers. If a significant number of our paying dealers terminate their subscriptions with us, ourbusiness and financial results would be materially and adversely affected.
43
If we fail to maintain or increase the number of dealers that pay subscription fees to us, or fail to maintain or increase the fees paid to us forsubscriptions, our business and financial results would be materially and adversely affected.
As a result of the COVID-19 pandemic, many paying dealers cancelled their subscriptions with us (including, in some cases, with our permissionprior to the end of the applicable contract term and notice period), which caused a material adverse impact on our revenues during the year endedDecember 31, 2020, and it is possible that additional dealers will cancel their subscriptions as they continue to experience the effects of the COVID-19pandemic. If paying dealers do not receive the volume of consumer connections that they expect during their subscription period, do not experience thelevel of car sales they expect from those connections, or fail to attribute consumer connections or sales to our platform, they may terminate theirsubscriptions at the conclusion of the committed term. If we fail to maintain or expand our base of paying dealers or fail to maintain or increase the level offees that we receive from them, our business and financial results would be materially and adversely affected.
We allow dealers to list their inventory in CarGurus marketplaces for free; however, we impose certain limitations on such free listings, such ascapping the number of leads that non-paying dealers in the U.S. may receive within a 30-day period, not displaying non-paying dealer identity and contactinformation, and prohibiting access to the paid features of our marketplaces. We continue to adapt our free listings product, Restricted Listings, in ourCarGurus marketplaces and in the future, we may decide to impose additional restrictions on Restricted Listings or modify the services available to non-paying dealers. These changes to our Restricted Listings product may result in less inventory being displayed to consumers, which may impair our effortsto attract consumers, and cause non-paying dealers to receive fewer leads and connections, which may make it more difficult for us to convert such dealersto paying dealers. If dealers do not subscribe to our paid offerings at the rates we expect, our business and financial results would be materially andadversely affected.
If dealers or other advertisers reduce their advertising spending with us and we are unable to replace the reduced advertising spending, our advertisingrevenue and business would be harmed.
A significant amount of revenue is derived from advertising revenues generated primarily through advertising sales, including display advertising andaudience targeting services, to dealers, auto manufacturers, and other auto-related brand advertisers. We compete for this advertising revenue with otheronline automotive marketplaces and with television, print media, and other traditional advertising channels. Our ability to attract and retain advertisers andto generate advertising revenue depends on a number of factors, including our ability to: increase the number of consumers using our marketplaces;compete effectively for advertising spending with other online automotive marketplaces; continue to develop our advertising products; keep pace withchanges in technology and the practices and offerings of our competitors; and offer an attractive ROI to our advertisers for their advertising spend with us.
Our agreements with dealers for display advertising generally include terms ranging from one month to one year and may be terminated by us with30 days’ notice and by dealers with 30 days’ notice at the end of the committed term. The contracts do not contain contractual obligations requiring anadvertiser to maintain its relationship with us beyond the committed term. Certain of our other advertising contracts, including those with automanufacturers, typically do not have ongoing commitments to advertise in our marketplaces beyond a committed term. As a result of the COVID-19pandemic, some advertisers have cancelled or reduced their advertising with us, which has caused a material adverse impact on our revenues during theyear ended December 31, 2020 compared to the prior period, and it is possible that advertising customers will continue to cancel or reduce their advertisingwith us as they continue to experience the effects of the COVID-19 pandemic. In addition, a reduction in consumer visits to our sites as a result of theCOVID-19 pandemic resulted in the delivery of fewer impressions for our advertising customers than anticipated during the year ended December 31, 2020and each of the three months ended March 31, 2021 and June 30, 2021 compared to the prior periods, which has caused, and may continue to cause, anadverse impact on our advertising revenues. We may not succeed in capturing a greater share of our advertisers’ spending if we are unable to convinceadvertisers of the effectiveness or superiority of our advertising offerings as compared to alternative channels. If current advertisers reduce their advertisingspending with us and we are unable to replace such reduced advertising spending, our advertising revenue and business and financial results would beharmed.
If we fail to fully realize anticipated transaction synergies from our acquisition of a 51% interest in CarOffer, or if the CarOffer business fails to growat the rate we expect, our revenue and business would be harmed.
In January 2021, we completed our acquisition of a 51% interest in CarOffer, which adds wholesale vehicle acquisition and selling capabilities to ourportfolio of dealer offerings. Achievement of our anticipated transaction synergies and our ability to grow the CarOffer business depends on a number offactors, including, but not limited to, our ability to: expand the number of dealers engaging on the CarOffer platform; retain existing customers and increasethe share of wholesale transactions which they complete on the CarOffer platform; attract prospective customers who have historically purchased or soldvehicles through physical auctions and may choose not to transact online; and successfully compete with competitors, including other online vehicleauction companies and large, national offline vehicle auction companies that are expanding into the online channel and have launched online auctions inconnection with their physical auctions. If our anticipated transaction synergies do not fully materialize and/or the CarOffer business fails to grow at therate we expect, our revenue and business would be harmed.
44
Industry conditions such as a significant change in vehicle retail prices or a decline in the used vehicle inventory supply coming to the wholesalemarket could also adversely impact CarOffer’s business and growth. For example, if retail prices for used vehicles rise relative to retail prices for newvehicles, it could make buying a new vehicle more attractive to consumers than buying a used vehicle, which could result in reduced used vehiclewholesale sales on the CarOffer platform. Used vehicle dealers may also decide to retail more of their vehicles on their own rather than selling them on theCarOffer platform, which could adversely impact the volume of vehicles offered for sale on the CarOffer platform and the demand for those used vehicles.Inventory challenges in the automotive industry, including for reasons attributable to the COVID-19 pandemic, could also contribute to a decrease in thesupply of vehicles coming to the wholesale market and reduce the number of vehicles sold on the CarOffer platform. An inability by CarOffer to retaincustomers and/or increase or find alternative sources of vehicle supply would adversely impact our revenue and business.
If we are unable to provide a compelling vehicle search experience to consumers through our platform, the number of connections between consumersand dealers using our marketplaces may decline and our business and financial results would be materially and adversely affected.
If we fail to continue to provide a compelling vehicle search experience to consumers, the number of connections between consumers and dealersthrough our marketplaces could decline, which in turn could lead dealers to suspend listing their inventory in our marketplaces, cancel their subscriptions,or reduce their spending with us. If dealers pause or cancel listing their inventory in our marketplaces, we may not be able to attract a large consumeraudience, which may cause other dealers to pause or cancel their use of our marketplaces. This reduction in the number of dealers using our marketplaceswould likely materially and adversely affect our marketplaces and our business and financial results. As consumers increasingly use their mobile devices toaccess the internet and our marketplaces, our success depends, in part, on our ability to provide consumers with a robust and user-friendly experiencethrough their mobile devices. We believe that our ability to provide a compelling vehicle search experience, both on desktop computers and through mobiledevices, is subject to a number of factors, including our ability to: maintain attractive marketplaces for consumers and dealers; continue to innovate andintroduce products for our marketplaces; launch new products that are effective and have a high degree of consumer engagement; display a wide variety ofautomobile inventory to attract more consumers to our websites; provide mobile applications that engage consumers; maintain the compatibility of ourmobile applications with operating systems, such as iOS and Android, and with popular mobile devices running such operating systems; and access andanalyze a sufficient amount of data to enable us to provide relevant information to consumers, including pricing information and accurate vehicle details.
We rely on internet search engines to drive traffic to our websites, and if we fail to appear prominently in the search results, our traffic would declineand our business would be adversely affected.
We rely, in part, on internet search engines such as Google, Bing, and Yahoo! to drive traffic to our websites. The number of consumers we attract toour marketplaces from search engines is due in part to how and where our websites rank in unpaid search results. These rankings can be affected by anumber of factors, many of which are not under our direct control and may change frequently. For example, when a consumer searches for a vehicle in aninternet search engine, we rely on a high organic search ranking of our webpages to refer the consumer to our websites. Our competitors’ internet searchengine optimization efforts may result in their websites receiving higher search result rankings than ours, or internet search engines could change theirmethodologies in a way that would adversely affect our search result rankings. If internet search engines modify their methodologies in ways that aredetrimental to us, if our efforts to improve our search engine optimization are unsuccessful or less successful than our competitors’ internet search engineoptimization efforts, our ability to attract a large consumer audience could diminish and traffic to our marketplaces could decline. In addition, internetsearch engine providers could provide dealer and pricing information directly in search results, align with our competitors, or choose to develop competingproducts. Reductions in our own search advertising spend or more aggressive spending by our competitors could also cause us to incur higher advertisingcosts and/or reduce our market visibility to prospective users. Our websites have experienced fluctuations in organic and paid search result rankings in thepast, and we anticipate fluctuations in the future. Any reduction in the number of consumers directed to our websites through internet search engines couldharm our business and operating results.
Any inability by us to develop new products, or achieve widespread consumer and dealer adoption of those products, could negatively impact ourbusiness and financial results.
Our success depends on our continued innovation to provide products that make our marketplaces, websites, and mobile applications useful forconsumers and dealers or that otherwise provide value to consumers and dealers. We anticipate that over time we may reach a point when investments inour current products are less productive and the growth of our revenue will require more focus on developing new products for consumers and dealers.These new products must be widely adopted by consumers and dealers in order for us to continue to attract consumers to our marketplaces and dealers toour products and services. Accordingly, we must continually invest resources in product, technology, and development in order to improve theattractiveness and comprehensiveness of our marketplaces and their related products and effectively incorporate new internet and mobile technologies intothem. Our ability to engage in these activities may decline as a result of the impact of the COVID-19 pandemic and our cost-savings initiatives on ourbusiness. These product, technology, and development expenses may include costs of hiring additional personnel, engaging third-party service providersand conducting other research and development activities. In addition, revenue relating to new products is typically unpredictable and our new productsmay have lower gross margins, lower retention rates, and higher marketing and sales costs than our
45
existing products. We are likely to continue to modify our pricing models for both existing and new products so that our prices for our offerings reflect thevalue those offerings are providing to consumers and dealers. Our pricing models may not effectively reflect the value of products to dealers, and, if we areunable to provide marketplaces and products that consumers and dealers want to use, they may reduce or cease the use of our marketplaces and products.Without innovative marketplaces and related products, we may be unable to attract additional, unique consumers or retain current consumers, which couldaffect the number of dealers that become paying dealers and the number of advertisers that want to advertise in our marketplaces, as well as the amountsthat they are willing to pay for our products, which could, in turn, negatively impact our business and financial results.
We may be unable to maintain or grow relationships with data providers, or may experience interruptions in the data they provide, which may create aless valuable or transparent shopping experience and negatively affect our business and operating results.
We obtain data from many third-party data providers, including inventory management systems, automotive website providers, customer relationshipmanagement systems, dealer management systems, governmental entities, and third-party data licensors. Our business relies on our ability to obtain data for thebenefit of consumers and dealers using our marketplaces. For example, our success in each market is dependent in part upon our ability to obtain and maintaininventory data and other vehicle information for those markets. The large amount of inventory and vehicle information available in our marketplaces is criticalto the value we provide for consumers. The loss or interruption of such inventory data or other vehicle information could decrease the number of consumersusing our marketplaces. We could experience interruptions in our data access for a number of reasons, including difficulties in renewing our agreements withdata providers, changes to the software used by data providers, efforts by industry participants to restrict access to data, increased fees we may be charged bydata providers and the effects of the COVID-19 pandemic. Our marketplaces could be negatively affected if any current provider terminates its relationshipwith us or our service from any provider is interrupted. If there is a material disruption in the data provided to us, the information that we provide to consumersand dealers using our marketplaces may be limited. In addition, the quality, accuracy, and timeliness of this information may suffer, which may lead to a lessvaluable and less transparent shopping experience for consumers using our marketplaces and could negatively affect our business and operating results.
The failure to build, maintain and protect our brands would harm our ability to attract a large consumer audience and to expand the use of ourmarketplaces by consumers and dealers.
While we are focused on building our brand recognition, maintaining and enhancing our brands will depend largely on the success of our efforts tomaintain the trust of consumers and dealers and to deliver value to each consumer and dealer using our marketplaces. Our ability to protect our brands isalso impacted by the success of our efforts to optimize our significant brand spend and overcome the intense competition in brand marketing across ourindustry, including competitors that may imitate our messaging. In addition, as a result of suppressed dealer inventory and resulting reduced demand forleads by dealers since the onset of the COVID-19 pandemic, we reduced our brand spend and we may decide to continue to suppress our brand spend in thefuture depending on the continued impact of the COVID-19 pandemic. If consumers believe that we are not focused on providing them with a betterautomobile shopping experience, or if we fail to overcome brand marketing competition and maintain a differentiated value proposition in consumers’minds, our reputation and the strength of our brands may be adversely affected.
Complaints or negative publicity about our business practices and culture, our management team and employees, our marketing and advertisingcampaigns, our compliance with applicable laws and regulations, the integrity of the data that we provide to consumers, data privacy and security issues,and other aspects of our business, irrespective of their validity, could diminish consumers’ and dealers’ confidence and participation in our marketplacesand could adversely affect our brands. There can be no assurance that we will be able to maintain or enhance our brands, and failure to do so would harmour business growth prospects and operating results.
Portions of our platform enable consumers and dealers using our marketplaces to communicate with one another and other persons seekinginformation or advice on the internet. Claims of defamation or other injury could be made against us for content posted on our websites. In addition,negative publicity and user sentiment generated as a result of fraudulent or deceptive conduct by users of our marketplaces could damage our reputation,reduce our ability to attract new users or retain our current users, and diminish the value of our brands.
Our past growth is not indicative of our future growth, and our ability to grow our revenue in the future is uncertain due to the impact of the COVID-19 pandemic.
Our revenue decreased to $551.5 million for the year ended December 31, 2020 from $588.9 million for the year ended December 31, 2019,representing a 6% decrease between such periods – which we primarily attribute to the approximately $50 million impact of fee reductions that weprovided to our paying dealers during the second quarter of 2020 in response to the COVID-19 pandemic – and increased to $389.1 million for the sixmonths ended June 30, 2021 from $252.4 million for the six months ended June 30, 2020, representing a 54% increase between such periods. Our revenuefor the remainder of 2021 and beyond may continue to be impacted by the COVID-19 pandemic. In addition, we will not be able to grow as expected, or atall, if we fail to: increase the number of consumers using our marketplaces; maintain and expand the number of dealers that subscribe to our marketplacesand maintain and increase the fees that they are paying; attract and retain advertisers placing advertisements in our marketplaces; further improve thequality of our marketplaces and introduce high quality new products; and increase the number of connections between consumers and dealers using
46
our marketplaces and connections to paying dealers, in particular. If our revenue declines further or fails to grow, investors’ perceptions of our businessmay be adversely affected, and the market price of our Class A common stock could decline.
We may require additional capital to pursue our business objectives and respond to business opportunities, challenges, or unforeseen circumstances. Ifwe are unable to generate sufficient cash flows or if capital is not available to us, our business, operating results, financial condition, and prospectscould be adversely affected.
If we are unable to generate sufficient cash flows, we would require additional capital to pursue our business objectives and respond to businessopportunities, challenges, or unforeseen circumstances, including the effects of the COVID-19 pandemic, as well as to make marketing expenditures toimprove our brand awareness, develop new products, further improve our platform and existing products, enhance our operating infrastructure, and acquirecomplementary businesses and technologies. Accordingly, we may need to engage in equity or debt financings to secure additional funds. However,additional funds may not be available when we need them on terms that are acceptable to us or at all. Volatility in the credit markets, particularly as a resultof the COVID-19 pandemic, may also have an adverse effect on our ability to obtain debt financing. If we are unable to obtain adequate financing orfinancing on terms satisfactory to us when we require it, our ability to continue to pursue our business objectives and to respond to business opportunities,challenges, or unforeseen circumstances could be significantly limited, and our business, operating results, financial condition, and prospects could beadversely affected.
Our international operations involve risks that may differ from, or are in addition to, our domestic operational risks.
While we ceased operations of our marketplaces in Germany, Italy and Spain and stopped development of emerging marketplaces, we continue tooperate marketplaces in the United Kingdom and Canada, which are less familiar competitive environments and involve various risks, including the need toinvest significant resources and the likelihood that returns on such investments will not be achieved for several years, or possibly at all. We expect tocontinue to incur losses in the United Kingdom and Canada, and face various other challenges.
For example, in the United Kingdom and Canada, we were not the first market entrant, and our competitors may be more established or otherwisebetter positioned than we are to succeed. Our competitors may offer services to dealers that make dealers dependent on them, such as hosting dealers’websites and providing inventory feeds for dealers, which would make it difficult to attract dealers to our marketplaces. Dealers may also be parties toagreements with other dealers and syndicates that prevent them from being able to access our marketplaces. Any of these barriers could impede ouroperations in our international markets, which could affect our business and potential growth.
In addition to English, we have made portions of our marketplaces available in French and Spanish. We may have difficulty in modifying ourtechnology and content for use in non-English-speaking market segments or gaining acceptance by users in non-English-speaking market segments. Ourability to manage our business and conduct our operations internationally requires considerable management attention and resources, and is subject to theparticular challenges of supporting a business in an environment of multiple languages, cultures, customs, legal and regulatory systems, alternative disputeresolution systems, and commercial infrastructures. Operating internationally may subject us to different risks or increase our exposure in connection withcurrent risks, including risks associated with: recruiting, managing and retaining qualified multilingual employees, including sales personnel; adapting ourwebsites and mobile applications to conform to local consumer behavior; increased competition from local websites and mobile applications and potentialpreferences by local populations for local providers; compliance with applicable foreign laws and regulations, including different privacy, censorship, andliability standards and regulations, and different intellectual property laws; providing solutions in different languages and for different cultures, which mayrequire that we modify our solutions and features so they are culturally relevant in different countries; the enforceability of our intellectual property rights;credit risk and higher levels of payment fraud; compliance with anti-bribery laws, including compliance with the Foreign Corrupt Practices Act and theUnited Kingdom Bribery Act; currency exchange rate fluctuations; adverse changes in trade relationships among foreign countries and/or between theUnited States and such countries, including as related to the United Kingdom’s exit from the European Union, or the EU, commonly referred to as “Brexit”;double taxation of our international earnings and potentially adverse tax consequences arising from the tax laws of the United States or the foreignjurisdictions in which we operate; and higher costs of doing business internationally.
Dealer closures or consolidations could reduce demand for our products, which may decrease our revenue.
In the past, the number of United States dealers has declined due to dealership closures and consolidations as a result of factors such as globaleconomic downturns or other macroeconomic issues. When dealers consolidate, the services they previously purchased separately are often purchased bythe combined entity in a lesser quantity or for a lower aggregate price than before, leading to volume compression and loss of revenue. Further dealershipconsolidations or closures could reduce the aggregate demand for our products and services. If dealership closures and consolidations occur in the future,our business, financial position and results of operations could be materially and adversely affected.
47
We depend on key personnel to operate our business, and if we are unable to retain, attract and integrate qualified personnel, or if we experienceturnover of our key personnel, our ability to develop and successfully grow our business could be materially and adversely affected.
We believe our success has depended, and continues to depend, on the efforts and talents of our executives and employees. Our future successdepends on our continuing ability to attract, develop, motivate, and retain highly qualified and skilled employees. Qualified individuals are in high demand,and we may incur significant costs to attract and retain them, and we may become less competitive in attracting and retaining employees as a result of ourexpense reduction efforts due to the COVID-19 pandemic. In addition, any unplanned turnover or our failure to develop an adequate succession plan forany of our executive officers or key employees, or the reduction in their involvement in the management of our business, could materially adversely affectour ability to execute our business plan and strategy, and we may not be able to find adequate replacements on a timely basis, or at all. Our executiveofficers and other employees are at-will employees, which means they may terminate their employment relationships with us at any time, and theirknowledge of our business and industry would be extremely difficult to replace. We cannot ensure that we will be able to retain the services of anymembers of our senior management or other key employees. If we do not succeed in attracting well-qualified employees or retaining and motivatingexisting employees, our business could be materially and adversely affected.
In January 2021, we announced the promotion of Jason Trevisan from Chief Financial Officer and President, International to the role of ChiefExecutive Officer, and the transition of Langley Steinert from Chief Executive Officer to Executive Chairman. Additionally, Scot Fredo, our former SeniorVice President, Financial Planning & Analysis, was appointed to succeed Jason Trevisan in the role of Chief Financial Officer. Furthermore, effective July1, 2021, Kyle Lomeli separated from the Company in his role as Chief Technology Officer. We may face risks related to these and other transitions in ourleadership team, including the disruption of our operations and the depletion of our institutional knowledge base.
We may be subject to disputes regarding the accuracy of Instant Market Values, Deal Ratings, Dealer Ratings, New Car Price Guidance and otherfeatures of our marketplaces.
We provide consumers using our CarGurus marketplaces with our proprietary IMV, Deal Ratings, and Dealer Ratings, as well as other features to helpthem evaluate vehicle listings, including price guidance for new car listings, or New Car Price Guidance. Our valuation models depend on the inventorylisted on our sites as well as public information regarding automotive sales. If the inventory on our site declines significantly, or if the number ofautomotive sales declines significantly or used car sales prices become volatile, whether as a result of the COVID-19 pandemic or otherwise, our valuationmodels may not perform as expected. Revisions to or errors in our automated valuation models, or the algorithms that underlie them, may cause the IMV,the Deal Rating, New Car Price Guidance, or other features to vary from our expectations regarding the accuracy of these tools. In addition, from time totime, regulators, consumers, dealers and other industry participants may question or disagree with our IMV, Deal Rating, Dealer Rating or New Car PriceGuidance. Any such questions or disagreements could result in distraction from our business or potentially harm our reputation, could result in a decline inconsumers’ use of our marketplaces and could result in legal disputes.
We are subject to a complex framework of laws and regulations, many of which are unsettled, still developing and contradictory, which have in thepast, and could in the future, subject us to claims, challenge our business model, or otherwise harm our business.
Various aspects of our business are, may become, or may be viewed by regulators from time to time as subject, directly or indirectly, to United Statesfederal, state and local laws and regulations, and to foreign laws and regulations.
Local Motor Vehicle Sales, Advertising and Brokering, and Consumer Protection Laws
The advertising and sale of new and used motor vehicles is highly regulated by the jurisdictions in which we do business. Although we do not sellmotor vehicles, and although we believe that vehicle listings on our sites are not themselves advertisements, regulatory authorities or third parties couldtake the position that some of the laws or regulations applicable to dealers or to the manner in which motor vehicles are advertised and sold generally aredirectly applicable to our business. These advertising laws and regulations are frequently subject to multiple interpretations and are not uniform fromjurisdiction to jurisdiction, sometimes imposing inconsistent requirements with respect to new or used motor vehicles. If our marketplaces and relatedproducts are determined to not comply with relevant regulatory requirements, we or dealers could be subject to civil and criminal penalties, including fines,or the award of significant damages in class actions or other civil litigation, as well as orders interfering with our ability to continue providing ourmarketplaces and related products and services in certain jurisdictions. In addition, even absent such a determination, to the extent dealers are uncertainabout the applicability of such laws and regulations to our business, we may lose, or have difficulty increasing the number of paying dealers, which wouldaffect our future growth.
If regulators or other third parties take the position that our marketplaces or related products violate applicable brokering, bird-dog, consumer protection,consumer finance or advertising laws or regulations, responding to such allegations could be costly, could require us to pay significant sums in settlements,could require us to pay civil and criminal penalties, including fines, could interfere with our ability to continue providing our marketplaces and related productsin certain jurisdictions, or could require us to make adjustments to our marketplaces and related products or the manner in which we derive revenue fromdealers using our platform, any or all of which could
48
result in substantial adverse publicity, termination of subscriptions by dealers, decreased revenues, distraction for our employees, increased expenses, anddecreased profitability.
Federal Laws and Regulations
The United States Federal Trade Commission, or the FTC, has the authority to take actions to remedy or prevent acts or practices that it considers tobe unfair or deceptive and that affect commerce in the United States. If the FTC takes the position in the future that any aspect of our business, includingour advertising and privacy practices, constitutes an unfair or deceptive act or practice, responding to such allegations could require us to defend ourpractices and pay significant damages, settlements, and civil penalties, or could require us to make adjustments to our marketplaces and related productsand services, any or all of which could result in substantial adverse publicity, distraction for our employees, loss of participating dealers, lost revenues,increased expenses, and decreased profitability.
Our platforms enable us, dealers, and users to send and receive text messages and other mobile phone communications. The TCPA, as interpreted andimplemented by the FCC and federal and state courts, impose significant restrictions on utilization of telephone calls and text messages to residential andmobile telephone numbers as a means of communication, particularly if the prior express consent of the person being contacted has not been obtained.Violations of the TCPA may be enforced by the FCC, by state attorneys general, or by others through litigation, including class actions. Furthermore,several provisions of the TCPA, as well as applicable rules and orders, are open to multiple interpretations, and compliance may involve fact-specificanalyses.
Any failure by us, or the third parties on which we rely, to adhere to, or successfully implement, appropriate processes and procedures in response toexisting or future laws and regulations could result in legal and monetary liability, fines and penalties, or damage to our reputation in the marketplace, anyof which could have a material adverse effect on our business, financial condition, and results of operations. Even if the claims are meritless, we may berequired to expend resources and pay costs to defend against regulatory actions or third-party claims. Additionally, any change to applicable laws or theirinterpretations that further restricts the way consumers and dealers interact through our platforms, or any governmental or private enforcement actionsrelated thereto, could adversely affect our ability to attract customers and could harm our business, financial condition, results of operations, and cashflows.
Antitrust and Other Laws
Antitrust and competition laws prohibit, among other things, any joint conduct among competitors that would lessen competition in the marketplace.A governmental or private civil action alleging the improper exchange of information, or unlawful participation in price maintenance or other unlawful oranticompetitive activity, even if unfounded, could be costly to defend and could harm our business, results of operations, financial condition, and cashflows.
Claims could be made against us under both United States and foreign laws, including claims for defamation, libel, invasion of privacy, falseadvertising, intellectual property infringement, or claims based on other theories related to the nature and content of the materials disseminated by ourmarketplaces and on portions of our websites. Our defense against any of these actions could be costly and involve significant time and attention of ourmanagement and other resources. If we become liable for information transmitted in our marketplaces, we could be directly harmed and we may be forcedto implement new measures to reduce our exposure to this liability.
The foregoing description of laws and regulations to which we are or may be subject is not exhaustive, and the regulatory framework governing ouroperations is subject to continuous change. We are, and we will continue to be, exposed to legal and regulatory risks including with respect to privacy, tax,law enforcement, content, intellectual property, competition, and other matters. The enactment of new laws and regulations or the interpretation of existinglaws and regulations, both domestically and internationally, may affect the operation of our business, directly or indirectly, which could result in substantialregulatory compliance costs, civil or criminal penalties, including fines, adverse publicity, loss of subscribing dealers, lost revenues, increased expenses,and decreased profitability. Further, investigations by governmental agencies, including the FTC, into allegedly anticompetitive, unfair, deceptive or otherbusiness practices by us or dealers using our marketplaces, could cause us to incur additional expenses and, if adversely concluded, could result insubstantial civil or criminal penalties and significant legal liability, or orders requiring us to make adjustments to our marketplaces and related products andservices.
Our business is subject to risks related to the larger automotive industry ecosystem, which could have a material adverse effect on our business,revenue, results of operations, and financial condition.
Decreases in consumer demand could adversely affect the market for automobile purchases and, as a result, reduce the number of consumers using ourplatform. Consumer purchases of new and used automobiles generally decline during recessionary periods and other periods in which disposable income isadversely affected. Purchases of new and used automobiles are typically discretionary for consumers and have been, and may continue to be, affected bynegative trends in the economy, including: the effects of the COVID-19 pandemic, the cost of energy and gasoline; the availability and cost of credit; risinginterest rates; reductions in business and consumer confidence; stock market volatility; and increased unemployment.
49

Further, in recent years the market for motor vehicles has experienced rapid changes in technology and consumer demands. Self-driving technology,ride sharing, transportation networks, and other fundamental changes in transportation could impact consumer demand for the purchase of automobiles. Areduction in the number of automobiles purchased by consumers could adversely affect dealers and car manufacturers and lead to a reduction in otherspending by these groups, including targeted incentive programs.
In addition, our business may be negatively affected by challenges to the larger automotive industry ecosystem, including global supply chainchallenges, the global semiconductor chip shortage, changes to trade policies, including tariff rates and customs duties, trade relations between the UnitedStates and China and other macroeconomic issues, including the ongoing effects of the COVID-19 pandemic. These factors could have a material adverseeffect on our business, revenue, results of operations, and financial condition.
Making decisions that we believe are in the best interests of our marketplaces may cause us to forgo short-term gains in pursuit of potential butuncertain long-term growth.
In the past, we have forgone, and we will in the future continue to forgo, certain expansion or short-term revenue opportunities that we do not believeare in the long-term best interests of our marketplaces, even if such decisions negatively impact our results of operations in the short term. For example,during select monthly service periods in 2020 and 2021, we provided paying dealers with marketplace subscriptions at no cost or at a discount in an effortto help our paying dealers maintain their business health during the COVID-19 pandemic. However, such strategies may not result in the long-term benefitsthat we expect, in which case our user traffic and engagement, business, and financial results could be harmed.
A significant disruption in service on our websites or mobile applications could damage our reputation and result in a loss of consumers, which couldharm our business, brands, operating results, and financial condition.
Our brands, reputation, and ability to attract consumers, dealers, and advertisers depend on the reliable performance of our technology infrastructureand content delivery. We have experienced, and we may in the future experience, interruptions with our systems. Interruptions in these systems, whetherdue to system failures, computer viruses, ransomware, physical or electronic break-ins, or otherwise, could affect the security or availability of ourmarketplaces on our websites and mobile applications, and prevent or inhibit the ability of dealers and consumers to access our marketplaces. For example,past disruptions have impacted our ability to activate customer accounts and manage our billing activities in a timely manner. Such interruptions could alsoresult in third parties accessing our confidential and proprietary information, including our intellectual property. Problems with the reliability or security ofour systems could harm our reputation, harm our ability to protect our confidential and proprietary information, result in a loss of consumers and dealers,and result in additional costs.
Substantially all of the communications, network, and computer hardware used to operate our platforms is located in the United States near each ofBoston, Massachusetts and Dallas, Texas, and internationally near each of London, England and Dublin, Ireland. Although we can host our U.S. CarGurus’marketplace from two alternative locations in the United States and we believe our systems are redundant, there may be exceptions for certain hardware orsoftware. In addition, we do not own or control the operation of these facilities. We also use third-party hosting services to back up some data but do notmaintain redundant systems or facilities for some of the services. A disruption to one or more of these systems may cause us to experience an extendedperiod of system unavailability, which could negatively impact our relationship with consumers, customers and advertisers. Our systems and operations arevulnerable to damage or interruption from fire, flood, power loss, telecommunications failure, terrorist attacks, acts of war, electronic and physical break-ins, computer viruses, earthquakes, and similar events. The occurrence of any of these events could result in damage to our systems and hardware or couldcause them to fail. In addition, we may not have sufficient protection or recovery plans in certain circumstances.
Problems faced by our third-party web hosting providers could adversely affect the experience consumers have while using our marketplaces. Ourthird-party web hosting providers could close their facilities without adequate notice. Any financial difficulties, up to and including bankruptcy, faced byour third-party web hosting providers or any of the service providers whose services they use, which may be exacerbated as a result of the COVID-19pandemic, may have negative effects on our business, the nature and extent of which are difficult to predict. If our third-party web hosting providers areunable to keep up with our capacity needs, our business could be harmed.
Any errors, defects, disruptions, or other performance or reliability problems with our network operations could cause interruptions in access to ourmarketplaces as well as delays and additional expense in arranging new facilities and services and could harm our reputation, business, operating results,and financial condition. Although we carry insurance, it may not be sufficient to compensate us for the potentially significant losses, including the potentialharm to the future growth of our business, that may result from interruptions in our service as a result of system failures.
50

We collect, process, store, transfer, share, disclose, and use consumer information and other data, and our actual or perceived failure to protect suchinformation and data or respect users’ privacy could damage our reputation and brands and harm our business and operating results.
Some functions of our marketplaces involve the storage and transmission of consumers’ information, such as IP addresses, contact information ofusers who connect with dealers and profile information of users who create accounts on our marketplaces, as well as dealers’ information. We also processand store personal and confidential information of our vendors, partners, and employees. Some of this information may be private, and security breachescould expose us to a risk of loss or exposure of this information, which could result in potential liability, litigation, and remediation costs. For example,hackers could steal our users’ profile passwords, names, email addresses, phone numbers, and other personal information. We rely on encryption andauthentication technology licensed from third parties to effect secure transmission of such information. Like all information systems and technology, ourwebsites, mobile applications, and information systems are subject to computer viruses, break-ins, phishing attacks, attempts to overload the systems withdenial-of-service or other attacks, ransomware, and similar incidents or disruptions from unauthorized use of our computer systems, any of which couldlead to interruptions, delays, or website shutdowns, and could cause loss of critical data and the unauthorized disclosure, access, acquisition, alteration, anduse of personal or other confidential information. If we experience compromises to our security that result in website or mobile application performance oravailability problems, the complete shutdown of our websites or mobile applications, or the loss or unauthorized disclosure, access, acquisition, alteration,or use of confidential information, consumers, customers, advertisers, partners, vendors, and employees may lose trust and confidence in us, and consumersmay decrease the use of our websites or stop using our websites entirely, dealers may stop or decrease their subscriptions with us, and advertisers maydecrease or stop advertising on our websites.
Further, outside parties have attempted and will likely continue to attempt to fraudulently induce employees, consumers, or advertisers to disclosesensitive information in order to gain access to our information or our consumers’, dealers’, advertisers’, and employees’ information. As cyber-attacksincrease in frequency and sophistication, our cyber-security and business continuity plans may not be effective in anticipating, preventing and effectivelyresponding to all potential cyber-risk exposures. In addition, because the techniques used to obtain unauthorized access, disable or degrade service, orsabotage systems change frequently, often are not recognized until after having been launched against a target, and may originate from less regulated andremote areas around the world, we may be unable to proactively address these techniques or to implement adequate preventative measures.
Any or all of the issues above could adversely affect our brand reputation, negatively impact our ability to attract new consumers and increaseengagement by existing consumers, cause existing consumers to curtail or stop use of our marketplaces or close their accounts, cause existing dealers andadvertisers to cancel their contracts, cause employees to terminate their employment, cause employment candidates to be unwilling to pursue employmentopportunities or accept employment offers, and or subject us to governmental or third-party lawsuits, investigations, regulatory fines, or other actions orliability, thereby harming our business, results of operations, and financial condition.
There are numerous federal, national, state, and local laws and regulations in the United States and around the world regarding privacy and thecollection, processing, storage, sharing, disclosure, use, cross-border transfer, and protection of personal information and other data. These laws andregulations are evolving, are subject to differing interpretations, may be costly to comply with, may result in regulatory fines or penalties, may subject us tothird-party lawsuits, may be inconsistent between countries and jurisdictions, and may conflict with other requirements.
We seek to comply with industry standards and are subject to the terms of our privacy policies and privacy-related obligations to third parties, as wellas all applicable laws and regulations relating to privacy and data protection. However, it is possible that these obligations may be interpreted and appliedin new ways or in a manner that is inconsistent from one jurisdiction to another and may conflict with other rules or our practices and that new regulationscould be enacted. Several proposals have recently become effective or are pending, as applicable, before federal, state, local, and foreign legislative andregulatory bodies that could significantly affect our business, including the General Data Protection Regulation in the EU, or the GDPR, which went intoeffect on May 25, 2018, the California Consumer Privacy Act, or the CCPA, which went into effect on January 1, 2020, and the California Privacy RightsAct, or the CPRA, and the Virginia Consumer Data Protection Act, or the VCDPA, each of which goes into effect on January 1, 2023. The GDPR andCCPA in particular have already required, and along with the CPRA and VCDPA, may further require, us to change our policies and procedures and may inthe future require us to make changes to our marketplaces and other products. These and other requirements could reduce demand for our marketplaces andother offerings, require us to take on more onerous obligations in our contracts and restrict our ability to store, transfer, and process data, which mayseriously harm our business. Similarly, Brexit and the Schrems II decision of the Court of Justice of the EU may require us to change our policies andprocedures and, if we are not in compliance, may also seriously harm our business. We may not be entirely successful in our efforts to comply with theevolving regulations to which we are subject due to various factors within our control, such as limited internal resource allocation, or outside our control,such as a lack of vendor cooperation, new regulatory interpretations, or lack of regulatory guidance in respect of certain GDPR, CCPA, CPRA or VCDPArequirements.
51

Any failure or perceived failure by us to comply with United States and international data protection laws and regulations, our privacy policies, or ourprivacy-related obligations to consumers, customers, employees and other third parties, or any compromise of security that results in the unauthorizedrelease or transfer of sensitive information, which could include personal information or other user data, may result in governmental investigations,enforcement actions, regulatory fines, litigation, criminal penalties, or public statements against us by consumer advocacy groups or others, and couldcause consumers and dealers to lose trust in us, which could significantly impact our brand reputation and have an adverse effect on our business.Additionally, if any third party that we share information with experiences a security breach or fails to comply with its privacy-related legal obligations orcommitments to us, such matters may put employee, consumer or dealer information at risk and could in turn expose us to claims for damages or regulatoryfines or penalties and harm our reputation, business, and operating results.
Our ability to attract consumers to our own websites and to provide certain services to our customers depends on the collection of consumer data fromvarious sources, which may be restricted by consumer choice, privacy restrictions, and developments in laws, regulations and industry standards.
The success of our consumer marketing and the delivery of internet advertisements for our customers depends on our ability to leverage data,including data that we collect from our customers, data we receive from our publisher partners and third parties, and data from our operations. Usingcookies and non-cookie-based technologies, such as mobile advertising identifiers, we collect information about the interactions of users with ourcustomers’ and publishers’ digital properties (including, for example, information about the placement of advertisements and users’ shopping or otherinteractions with our customers’ websites or advertisements). Our ability to successfully leverage such data depends on our continued ability to access anduse such data, which could be restricted by a number of factors, including: increasing consumer adoption of “do not track” mechanisms as a result oflegislation including GDPR, CCPA, CPRA and VCDPA; privacy restrictions imposed by web browser developers, advertising partners or other softwaredevelopers that impair our ability to understand the preferences of consumers by limiting the use of third-party cookies or other tracking technologies ordata indicating or predicting consumer preferences; and new developments in, or new interpretations of, privacy laws, regulations and industry standards.
Each of these developments could materially impact our ability to collect consumer data and deliver relevant internet advertisements to attractconsumers to our websites or to deliver targeted advertising for our advertising customers. If we are unsuccessful in evolving our advertising and marketingstrategies to adapt to and mitigate these evolving consumer data limitations, our business results could be materially impacted.
We have been, and may again be, subject to intellectual property disputes, which are costly to defend and could harm our business and operatingresults.
We have been, and expect in the future to be, subject to claims and litigation alleging that we infringe others’ intellectual property rights, including thetrademarks, copyrights, patents, and other intellectual property rights of third parties, including from our competitors or non-practicing entities. We mayalso learn of possible infringement to our trademarks, copyrights, patents, and other intellectual property. In addition, we could be subject to lawsuits whereconsumers and dealers posting content on our websites disseminate materials that infringe the intellectual property rights of third parties.
Patent and other intellectual property litigation may be protracted and expensive, and the results are difficult to predict and may result in significantsettlement costs or payment of substantial damages. Many potential litigants, including patent holding companies, have the ability to dedicate substantiallygreater resources to enforce their intellectual property rights and to defend claims that may be brought against them. Furthermore, a successful claimantcould secure a judgment that requires us to stop offering some features or prevents us from conducting our business as we have historically done or maydesire to do in the future. We might also be required to seek a license and pay royalties for the use of such intellectual property, which may not be availableon commercially acceptable terms, or at all. Alternatively, we may be required to modify our marketplaces and features while we develop non-infringingsubstitutes, which could require significant effort and expense and may ultimately not be successful.
In addition, we use open source software in our platform and will use open source software in the future. From time to time, we may face claims fromcompanies that incorporate open source software into their products, claiming ownership of, or demanding release of, the source code, the open sourcesoftware, or derivative works that were developed using such software, or otherwise seeking to enforce the terms of the applicable open source license.These claims could also result in litigation, require us to purchase a costly license or require us to devote additional product, technology, and developmentresources to change our platforms or services, any of which would have a negative effect on our business and operating results. Even if these matters do notresult in litigation or are resolved in our favor or without significant cash settlements, these matters, and the time and resources necessary to litigate orresolve them, could harm our business, our operating results, and our reputation.
Failure to adequately protect our intellectual property could harm our business and operating results.
Our business depends on our intellectual property, the protection of which is crucial to the success of our business. We rely on a combination ofpatent, trademark, trade secret, and copyright law and contractual restrictions to protect our intellectual property. In
52

addition, we attempt to protect our intellectual property, technology, and confidential information by requiring our employees and consultants to enter intoconfidentiality and assignment of inventions agreements and third parties to enter into nondisclosure agreements as we deem appropriate. Despite ourefforts to protect our proprietary rights, unauthorized parties may attempt to copy aspects of our platform’s features, software, and functionality or obtainand use information that we consider proprietary.
Competitors may adopt trademarks or trade names similar to ours, thereby harming our ability to build brand identity and possibly leading to userconfusion. In addition, there could be potential trade name or trademark infringement claims brought by owners of other registered trademarks, ortrademarks that incorporate variations of our trademarks. We have registered the CARGURUS and CG logos, as well as the word-mark CARGURUS, inthe U.S., Canada and the United Kingdom.
We currently hold the “CarGurus.com” internet domain name and various other related domain names relating to our brands. The regulation ofdomain names is subject to change. Regulatory bodies could establish additional top-level domains, appoint additional domain name registrars, or modifythe requirements for holding domain names. As a result, we may not be able to acquire or maintain all domain names that use the names of our brands. Inaddition, third parties have created and may in the future create copycat or squatter domains to deceive consumers, which could harm our brands, interferewith our ability to register domain names, and result in additional costs.
We may be unable to halt the operations of websites that aggregate or misappropriate our data.
From time to time, third parties may misappropriate our data through website scraping, robots, or other means and aggregate this data with data fromother sources. In addition, copycat websites may misappropriate data in our marketplaces and attempt to imitate our brands or the functionality of ourwebsites. If we become aware of such activities, we intend to employ technological or legal measures in an attempt to halt their operations. However, wemay be unable to detect and remedy all such activities in a timely manner. In some cases, our available remedies may not be adequate to protect us againstthe impact of such operations. Regardless of whether we can successfully enforce our rights against these third parties, any measures that we may takecould require us to expend significant financial or other resources, which could harm our business, results of operations, and financial condition. Inaddition, to the extent that such activity creates confusion among consumers or advertisers, our brands and business could be harmed.
Seasonality and other factors may cause fluctuations in our operating results and our marketing spend.
Across the retail automotive industry, consumer purchases are typically greatest in the first three quarters of each year, due in part to the introductionof new vehicle models from manufacturers and the seasonal nature of consumer spending, and our consumer-marketing spend generally fluctuatesaccordingly. This seasonality has not been immediately apparent historically due to the overall growth of other operating expenses. In addition, reduction ofour marketing spend in response to COVID-19-related expense management and shifts in demand from dealers and consumers could impact the efficiencyof our marketing spend. As our growth rates moderate or cease, the impact of these seasonality trends and other influences on our results of operationscould become more pronounced. In addition, the volume of wholesale vehicle sales fluctuates from quarter to quarter and as a result of macroeconomicissues, such as the global semiconductor chip shortage, which may have a corresponding impact on our results of operations. This variability is caused byseveral factors including the timing of used vehicles available for sale from selling customers, the seasonality of the retail market for used vehicles and/orinventory challenges in the automotive industry, which affect the demand side of the wholesale industry.
Failure to deal effectively with fraud or other illegal activity could lead to potential legal liability, harm our business, cause us to lose paying dealercustomers and adversely affect our reputation, financial performance and prospects for growth.
Based on the nature of our business, we are exposed to potential fraudulent and illegal activity in our marketplaces, including: listings of automobilesthat are not owned by the purported dealer or that the dealer has no intention of selling at the listed price; receipt of fraudulent leads that we may send toour dealers; and deceptive practices in our peer-to-peer marketplace. The measures we have in place to detect and limit the occurrence of such fraudulentand illegal activity in our marketplaces may not always be effective or account for all types of fraudulent or other illegal activity. Further, the measures thatwe use to detect and limit the occurrence of fraudulent and illegal activity must be dynamic, as technologies and ways to commit fraud and illegal activityare continually evolving. Failure to limit the impact of fraudulent and illegal activity on our websites could lead to potential legal liability, harm ourbusiness, cause us to lose paying dealer customers and adversely affect our reputation, financial performance and prospects for growth.
Risks Related to Our Class A Common Stock
Our founder controls a majority of the voting power of our outstanding capital stock, and, therefore, has control over key decision-making and couldcontrol our actions in a manner that conflicts with the interests of other stockholders.
Primarily by virtue of his holdings in shares of our Class B common stock, which has a ten-to-one voting ratio compared to our Class A commonstock, Langley Steinert, our founder, Chairman of the Board and Executive Chairman, is able to exercise voting rights with respect to a majority of thevoting power of our outstanding capital stock and therefore has the ability to control the outcome of
53
matters submitted to our stockholders for approval, including the election of directors and any merger, consolidation, or sale of all or substantially all of ourassets. This concentrated control could delay, defer, or prevent a change of control, merger, consolidation, or sale of all or substantially all of our assets thatour other stockholders support, or conversely this concentrated control could result in the consummation of such a transaction that our other stockholdersdo not support. This concentrated control could also discourage a potential investor from acquiring our Class A common stock, which might harm thetrading price of our Class A common stock. In addition, Mr. Steinert has significant influence in the management and major strategic investments of ourcompany as a result of his position as Executive Chairman, and his ability to control the election or replacement of our directors. As Chairman of the Boardand our Executive Chairman, Mr. Steinert owes a fiduciary duty to our stockholders and must act in good faith in a manner he reasonably believes to be inthe best interests of our stockholders. If Mr. Steinert’s status as an officer and a director is terminated, his fiduciary duties to our stockholders will alsoterminate, but his voting power as a stockholder will not be reduced as a result of such termination unless such termination is either made voluntarily byMr. Steinert or due to Mr. Steinert’s death, or if the sum of the number of shares of our capital stock held by Mr. Steinert, by any Family Member of Mr.Steinert, and by any Permitted Entity of Mr. Steinert (as such terms are defined in our amended and restated certificate of incorporation), assuming theexercise and settlement in full of all outstanding options and convertible securities and calculated on an as-converted to Class A common stock basis, is lessthan 9,091,484 shares. As a stockholder, even a controlling stockholder, Mr. Steinert is entitled to vote his shares in his own interests, which may notalways be aligned with the interests of our other stockholders.
We believe that Mr. Steinert’s continued control of a majority of the voting power of our outstanding capital stock is beneficial to us and is in the bestinterests of our stockholders. In the event that Mr. Steinert no longer controls a majority of the voting power, whether as a result of the disposition of someor all his shares of Class A or Class B common stock, the conversion of the Class B common stock into Class A common stock in accordance with itsterms, or otherwise, our business or the trading price of our Class A common stock may be adversely affected.
The multiple class structure of our common stock has the effect of concentrating voting control with our founder and certain other holders of ourClass B common stock, which will limit or preclude the ability of our stockholders to influence corporate matters.
Our Class B common stock has ten votes per share and our Class A common stock has one vote per share. Our founder and certain of his affiliateshold a substantial number of the outstanding shares of our Class B common stock and therefore hold a substantial majority of the voting power of ouroutstanding capital stock. Because of the ten-to-one voting ratio between our Class B and Class A common stock, the holders of our Class B common stockcollectively control a majority of the combined voting power of our common stock and therefore are able to control all matters submitted to ourstockholders for approval so long as the shares of Class B common stock represent at least 9.1% of all outstanding shares of our Class A and Class Bcommon stock. This concentrated control will limit or preclude the ability of our other stockholders to influence corporate matters for the foreseeablefuture.
Transfers by holders of Class B common stock will generally result in those shares converting into Class A common stock, subject to limitedexceptions, such as certain transfers effected for estate planning or charitable purposes. The conversion of Class B common stock into Class A commonstock has had and will continue to have the effect, over time, of increasing the relative voting power of those holders of Class B common stock who retainsuch shares. If, for example, Mr. Steinert retains a significant portion of his holdings of Class B common stock, he could continue to control a majority ofthe combined voting power of our outstanding capital stock.
The trading price of our Class A common stock has been and may continue to be volatile and the value of our stockholders’ investment in our stockcould decline.
The trading price of our Class A common stock has been and may continue to be volatile and fluctuate substantially. The trading price of our Class Acommon stock depends on a number of factors, including those described in this “Risk Factors” section, many of which are beyond our control and may notbe related to our operating performance. Factors that could cause fluctuations in the trading price of our Class A common stock include the following:changes in the operating performance and stock market valuations of other technology companies generally, or those in our industry in particular; sales ofshares of our Class A common stock by us or our stockholders; adverse changes to recommendations regarding our stock by securities analysts that coverus; failure of securities analysts to maintain coverage of us, changes in financial estimates by any securities analysts who follow our company, or our failureto meet these estimates or the expectations of investors; announcements by us or our competitors of new products; the public’s reaction to our issuances ofearnings guidance or other public announcements and filing; real or perceived inaccuracies in our key metrics; actions of an activist stockholder; actual oranticipated changes in our operating results or fluctuations in our operating results or developments in our business, our competitors’ businesses, or thecompetitive landscape generally; litigation involving us or investigations by regulators into our operations or those of our competitors; developments ordisputes concerning our proprietary rights; announced or completed acquisitions of businesses or technologies by us or our competitors; new laws orregulations or new interpretations of existing laws or regulations applicable to our business; changes in accounting standards, policies, or guidelines; anysignificant change in our management; changes in the automobile industry; and general economic conditions, including as related to the COVID-19pandemic.
54
Our status as a “controlled company” could make our Class A common stock less attractive to some investors or otherwise harm the trading price ofour Class A common stock.
More than 50% of our voting power is held by Mr. Steinert. As a result, we are a “controlled company” under the corporate governance rules forNasdaq-listed companies and may elect not to comply with certain Nasdaq corporate governance requirements. We rely and have relied on certain or all ofthese exemptions. Accordingly, should the interests of our controlling stockholder differ from those of other stockholders, the other stockholders may nothave the same protections afforded to stockholders of companies that are subject to all of the corporate governance rules for Nasdaq-listed companies. Ourstatus as a controlled company could make our Class A common stock less attractive to some investors or otherwise harm our stock price.
General Risk Factors
We participate in a highly competitive market, and pressure from existing and new companies may adversely affect our business and operating results.
We face significant competition from companies that provide listings, car-shopping information, lead generation, marketing, wholesale, and car-buying services designed to help consumers and dealers shop for cars and to enable dealers to reach these consumers. Our competitors include: onlineautomotive marketplaces and websites; internet search engines; peer-to-peer marketplaces; social media marketplaces; sites operated by automobiledealers; online dealerships; and vehicle auction companies. We compete with these and other companies for a share of dealers’ overall marketing budget foronline and offline media marketing spend and we compete with these and other companies in attracting consumers to our websites. To the extent thatdealers view alternative marketing and media strategies to be superior to our marketplaces, we may not be able to maintain or grow the number of dealerssubscribing to, and advertising on, our marketplaces, and our business and financial results may be adversely affected. We also expect that new competitorswill continue to enter the online automotive retail and wholesale industries with competing marketplaces, products, and services, and that existingcompetitors will expand to offer competing products or services, which could have an adverse effect on our business and financial results.
Our competitors could significantly impede our ability to expand the number of dealers using our marketplaces or could offer discounts that couldsignificantly impede our ability to maintain our pricing structure. Our competitors may also develop and market new technologies that render our existingor future platforms and associated products less competitive, unmarketable, or obsolete. In addition, if our competitors develop platforms with similar orsuperior functionality to ours, or if our web traffic declines, we may need to decrease our subscription and advertising fees. If we are unable to maintain ourcurrent pricing structure due to competitive pressures, our revenue would likely be reduced and our financial results would be negatively affected.
Our existing and potential competitors may have significantly more financial, technical, marketing, and other resources than we have, which mayallow them to offer more competitive pricing and the ability to devote greater resources to the development, promotion, and support of their marketplaces,products, and services. They may also have more extensive automotive industry relationships than we have, longer operating histories, and greater namerecognition. In addition, these competitors may be able to respond more quickly with technological advances and to undertake more extensive marketing orpromotional campaigns than we can. To the extent that any competitor has existing relationships with dealers or auto manufacturers for marketing or dataanalytics solutions, those dealers and auto manufacturers may be unwilling to partner with us. If we are unable to compete with these competitors, thedemand for our marketplaces and related products and services could substantially decline.
We rely on third-party service providers and strategic partners for many aspects of our business, and any failure to maintain these relationships or tosuccessfully integrate certain third-party platforms could harm our business.
Our success depends upon our relationships with third parties, including, among others, our payment processor, our data center hosts, our informationtechnology providers and our data providers for inventory and vehicle information. If these third parties experience difficulty meeting our requirements orstandards, have adverse audit results, violate the terms of our agreements or applicable law, fail to obtain or maintain applicable licenses, or if therelationships we have established with such third parties expire or otherwise terminate, it could make it difficult for us to operate some aspects of ourbusiness, which could damage our business and reputation. In addition, if such third-party service providers or strategic partners were to cease operations,temporarily or permanently, face financial distress or other business disruptions, increase their fees, or if our relationships with these providers or partnersdeteriorate or terminate, whether as a result of the COVID-19 pandemic or otherwise, we could suffer increased costs and we may be unable to provideconsumers with content or provide similar services until an equivalent provider could be found or we could develop replacement technology or operations.In addition, if we are unsuccessful in identifying or finding high-quality partners, if we fail to negotiate cost-effective relationships with them, or if weineffectively manage these relationships, it could have an adverse impact on our business and financial results.
Our enterprise systems require that we integrate the platforms hosted by certain third-party service providers. We are responsible for integrating theseplatforms and updating them to maintain proper functionality. Issues with these integrations, our failure to properly
55
update third-party platforms or any interruptions to our internal enterprise systems could harm our business by causing delays in our ability to quote,activate service and bill new and existing customers on our platform.
We must maintain proper and effective internal control over financial reporting and any failure to maintain the adequacy of these internal controlsmay adversely affect investor confidence in our company and, as a result, the value of our Class A common stock.
We are required, pursuant to Section 404 and the related rules adopted by the SEC, to furnish a report by management on, among other things, theeffectiveness of our internal control over financial reporting on an annual basis. This assessment includes disclosure of any material weaknesses identifiedby our management in our internal control over financial reporting. During the evaluation and testing process, if we identify and fail to remediate one ormore material weaknesses in our internal control over financial reporting, we will be unable to assert that our internal controls are effective.
In addition, our independent registered public accounting firm must attest to the effectiveness of our internal control over financial reporting underSection 404. Our independent registered public accounting firm may issue a report that is adverse to us in the event it is not satisfied with the level at whichour controls are documented, designed or operating. We may not be able to remediate any future material weaknesses, or to complete our evaluation, testingand required remediation in a timely fashion. We are also required to disclose significant changes made to our internal control procedures on a quarterlybasis. Our compliance with Section 404 requires that we incur substantial accounting expense and expend significant management efforts.
Any failure to maintain internal control over financial reporting could severely inhibit our ability to accurately report our financial condition or resultsof operations. If we are unable to assert that our internal control over financial reporting is effective or our independent registered public accounting firm isunable to express an opinion on the effectiveness of our internal control over financial reporting when it is required to issue such opinion, we could loseinvestor confidence in the accuracy and completeness of our financial reports, the market price of our Class A common stock could decline, and we couldbe subject to sanctions or investigations by Nasdaq, the SEC or other regulatory authorities.
We expect our results of operations to fluctuate on a quarterly and annual basis.
Our revenue and results of operations could vary significantly from period to period and may fail to match expectations as a result of a variety offactors, some of which are outside of our control, including the effects of the COVID-19 pandemic. Our results may vary as a result of fluctuations in thenumber of dealers subscribing to our marketplaces and the size and seasonal variability of our advertisers’ marketing budgets. As a result of the potentialvariations in our revenue and results of operations, period-to-period comparisons may not be meaningful and the results of any one period should not berelied on as an indication of future performance. In addition, our results of operations may not meet the expectations of investors or public market analystswho follow us, which may adversely affect the trading price of our Class A common stock.
We could be subject to adverse changes in tax laws, regulations and interpretations, plus challenges to our tax positions.
We are subject to taxation in the United States and certain other jurisdictions in which we operate. Changes in applicable tax laws or regulations maybe proposed or enacted that could materially and adversely affect our effective tax rate, tax payments, results of operations, financial condition and cashflows. In addition, tax laws and regulations are complex and subject to varying interpretations. There is also uncertainty over sales tax liability as a result ofthe U.S. Supreme Court’s decision in South Dakota v. Wayfair, Inc., which could precipitate reactions by legislators, regulators and courts that couldadversely increase our tax administrative costs and tax risk, and negatively affect our overall business, results of operations, financial condition and cashflows. We are also regularly subject to audits by tax authorities. For example, we are currently under New York State sales and uses tax audit for tax years2014 – 2020. Any adverse development or outcome in connection with these tax audits, and any other audits or litigation, could materially and adverselyimpact our effective tax rate, tax payments, results of operations, financial condition and cash flows.
Confidentiality agreements may not adequately prevent disclosure of our trade secrets and other proprietary information.
In order to protect our technologies and processes, we rely in part on confidentiality agreements with our employees, independent contractors, andother advisors. These agreements may not effectively prevent disclosure of confidential information, including trade secrets, and may not provide anadequate remedy in the event of unauthorized disclosure of confidential information. To the extent that our employees, contractors, or other third partieswith whom we do business use intellectual property owned by others in their work for us, disputes may arise as to the rights to related or resulting know-how and inventions. In addition, any changes in, or unexpected interpretations of, intellectual property laws may compromise our ability to enforce ourtrade secret and intellectual property rights. Costly and time-consuming litigation could be necessary to enforce and determine the scope of our proprietaryrights, and failure to obtain or maintain protection of our trade secrets or other proprietary information could harm our business, results of operations,reputation, and competitive position.
56
Item 6. Exhibits.
The exhibits listed below are filed or incorporated by reference into this Quarterly Report. Incorporated by Reference ExhibitNumber
Exhibit Description
Form
FileNumber
FilingDate
ExhibitNumber
FiledHerewith
10.1# Amendment to Separation Agreement, dated May 4, 2021, by andbetween the Registrant and Kyle Lomeli.
10-Q 001-38233 May 7, 2021 10.4
31.1 Certification of Principal Executive Officer Pursuant to Rules 13a-14(a) and 15d-14(a) under the Securities Exchange Act of 1934, asAdopted Pursuant to Section 302 of the Sarbanes-Oxley Act of 2002.
X
31.2 Certification of Principal Financial Officer Pursuant to Rules 13a-14(a) and 15d-14(a) under the Securities Exchange Act of 1934, asAdopted Pursuant to Section 302 of the Sarbanes-Oxley Act of 2002.
X
32.1* Certification of Principal Executive Officer Pursuant to 18 U.S.C.Section 1350, as Adopted Pursuant to Section 906 of the Sarbanes-Oxley Act of 2002.
X
32.2* Certification of Principal Financial Officer Pursuant to 18 U.S.C.Section 1350, as Adopted Pursuant to Section 906 of the Sarbanes-Oxley Act of 2002.
X
101.INS Inline XBRL Instance Document – the instance document does notappear in the Interactive Data File because its XBRL tags areembedded with the Inline XBRL document.
101.SCH Inline XBRL Taxonomy Extension Schema Document. X101.CAL Inline XBRL Taxonomy Extension Calculation Linkbase Document. X101.DEF Inline XBRL Taxonomy Extension Definition Linkbase Document. X101.LAB Inline XBRL Taxonomy Extension Label Linkbase Document. X101.PRE Inline XBRL Taxonomy Extension Presentation Linkbase Document. X104 The cover page from the Registrant’s Quarterly Report on Form 10-
Q for the quarter ended June 30, 2021, formatted in Inline XBRL. X
# Indicates a management contract or compensatory plan.* The certifications furnished in Exhibit 32.1 and Exhibit 32.2 hereto are deemed to accompany this Quarterly Report and will not be deemed “filed” for
purposes of Section 18 of the Securities Exchange Act of 1934, as amended, except to the extent that the registrant specifically incorporates it byreference.
57

SIGNATURES
Pursuant to the requirements of the Securities Exchange Act of 1934, the registrant has duly caused this report to be signed on its behalf by theundersigned thereunto duly authorized. CarGurus, Inc. Date: August 5, 2021 By: /s/ Jason Trevisan Jason Trevisan
Chief Executive Officer(Principal Executive Officer)
Date: August 5, 2021 By: /s/ Scot Fredo Scot Fredo
Chief Financial Officer(Principal Financial Officer)
58

Exhibit 31.1
CERTIFICATION PURSUANT TORULES 13a-14(a) AND 15d-14(a) UNDER THE SECURITIES EXCHANGE ACT OF 1934,
AS ADOPTED PURSUANT TO SECTION 302 OF THE SARBANES-OXLEY ACT OF 2002
I, Jason Trevisan, certify that:
1. I have reviewed this Quarterly Report on Form 10-Q of CarGurus, Inc.;
2. Based on my knowledge, this report does not contain any untrue statement of a material fact or omit to state a material fact necessary to make thestatements made, in light of the circumstances under which such statements were made, not misleading with respect to the period covered by thisreport;
3. Based on my knowledge, the financial statements, and other financial information included in this report, fairly present in all material respects thefinancial condition, results of operations and cash flows of the registrant as of, and for, the periods presented in this report;
4. The registrant’s other certifying officer(s) and I are responsible for establishing and maintaining disclosure controls and procedures (as defined inExchange Act Rules 13a-15(e) and 15d-15(e)) and internal control over financial reporting (as defined in Exchange Act Rules 13a-15(f) and 15d-15(f)) for the registrant and have:
(a) Designed such disclosure controls and procedures, or caused such disclosure controls and procedures to be designed under our supervision, toensure that material information relating to the registrant, including its consolidated subsidiaries, is made known to us by others within thoseentities, particularly during the period in which this report is being prepared;
(b) Designed such internal control over financial reporting, or caused such internal control over financial reporting to be designed under oursupervision, to provide reasonable assurance regarding the reliability of financial reporting and the preparation of financial statements forexternal purposes in accordance with generally accepted accounting principles;
(c) Evaluated the effectiveness of the registrant's disclosure controls and procedures and presented in this report our conclusions about theeffectiveness of the disclosure controls and procedures, as of the end of the period covered by this report based on such evaluation; and
(d) Disclosed in this report any change in the registrant's internal control over financial reporting that occurred during the registrant's most recentfiscal quarter (the registrant's fourth fiscal quarter in the case of an annual report) that has materially affected, or is reasonably likely tomaterially affect, the registrant's internal control over financial reporting; and
5. The registrant's other certifying officer(s) and I have disclosed, based on our most recent evaluation of internal control over financial reporting, tothe registrant's auditors and the audit committee of the registrant's board of directors (or persons performing the equivalent functions):
(a) All significant deficiencies and material weaknesses in the design or operation of internal control over financial reporting which arereasonably likely to adversely affect the registrant's ability to record, process, summarize and report financial information; and
(b) Any fraud, whether or not material, that involves management or other employees who have a significant role in the registrant's internalcontrol over financial reporting.
Date: August 5, 2021 By: /s/ Jason Trevisan Jason Trevisan
Chief Executive Officer(Principal Executive Officer)
Exhibit 31.2
CERTIFICATION PURSUANT TORULES 13a-14(a) AND 15d-14(a) UNDER THE SECURITIES EXCHANGE ACT OF 1934,
AS ADOPTED PURSUANT TO SECTION 302 OF THE SARBANES-OXLEY ACT OF 2002
I, Scot Fredo, certify that:
1. I have reviewed this Quarterly Report on Form 10-Q of CarGurus, Inc.;
2. Based on my knowledge, this report does not contain any untrue statement of a material fact or omit to state a material fact necessary to make thestatements made, in light of the circumstances under which such statements were made, not misleading with respect to the period covered by thisreport;
3. Based on my knowledge, the financial statements, and other financial information included in this report, fairly present in all material respects thefinancial condition, results of operations and cash flows of the registrant as of, and for, the periods presented in this report;
4. The registrant’s other certifying officer(s) and I are responsible for establishing and maintaining disclosure controls and procedures (as defined inExchange Act Rules 13a-15(e) and 15d-15(e)) and internal control over financial reporting (as defined in Exchange Act Rules 13a-15(f) and 15d-15(f)) for the registrant and have:
(a) Designed such disclosure controls and procedures, or caused such disclosure controls and procedures to be designed under our supervision, toensure that material information relating to the registrant, including its consolidated subsidiaries, is made known to us by others within thoseentities, particularly during the period in which this report is being prepared;
(b) Designed such internal control over financial reporting, or caused such internal control over financial reporting to be designed under oursupervision, to provide reasonable assurance regarding the reliability of financial reporting and the preparation of financial statements forexternal purposes in accordance with generally accepted accounting principles;
(c) Evaluated the effectiveness of the registrant's disclosure controls and procedures and presented in this report our conclusions about theeffectiveness of the disclosure controls and procedures, as of the end of the period covered by this report based on such evaluation; and
(d) Disclosed in this report any change in the registrant's internal control over financial reporting that occurred during the registrant's most recentfiscal quarter (the registrant's fourth fiscal quarter in the case of an annual report) that has materially affected, or is reasonably likely tomaterially affect, the registrant's internal control over financial reporting; and
5. The registrant's other certifying officer(s) and I have disclosed, based on our most recent evaluation of internal control over financial reporting, tothe registrant's auditors and the audit committee of the registrant's board of directors (or persons performing the equivalent functions):
(a) All significant deficiencies and material weaknesses in the design or operation of internal control over financial reporting which arereasonably likely to adversely affect the registrant's ability to record, process, summarize and report financial information; and
(b) Any fraud, whether or not material, that involves management or other employees who have a significant role in the registrant's internalcontrol over financial reporting.
Date: August 5, 2021 By: /s/ Scot Fredo Scot Fredo
Chief Financial Officer(Principal Financial Officer)

Exhibit 32.1
CERTIFICATION PURSUANT TO18 U.S.C. SECTION 1350, AS ADOPTED PURSUANT TO
SECTION 906 OF THE SARBANES-OXLEY ACT OF 2002
In connection with the Quarterly Report on Form 10-Q of CarGurus, Inc. (the “Company”) for the period ending June 30, 2021 as filed with theSecurities and Exchange Commission on the date hereof (the “Report”), I, Jason Trevisan, Chief Executive Officer of the Company, certify, pursuant to 18U.S.C. § 1350, as adopted pursuant to § 906 of the Sarbanes-Oxley Act of 2002, that, based on my knowledge:
(1) The Report fully complies with the requirements of Section 13(a) or 15(d) of the Securities Exchange Act of 1934; and
(2) The information contained in the Report fairly presents, in all material respects, the financial condition and results of operations of theCompany.
Date: August 5, 2021 By: /s/ Jason Trevisan Jason Trevisan
Chief Executive Officer(Principal Executive Officer)

Exhibit 32.2
CERTIFICATION PURSUANT TO18 U.S.C. SECTION 1350, AS ADOPTED PURSUANT TO
SECTION 906 OF THE SARBANES-OXLEY ACT OF 2002
In connection with the Quarterly Report on Form 10-Q of CarGurus, Inc. (the “Company”) for the period ending June 30, 2021 as filed with theSecurities and Exchange Commission on the date hereof (the “Report”), I, Scot Fredo, Chief Financial Officer of the Company, certify, pursuant to 18U.S.C. § 1350, as adopted pursuant to § 906 of the Sarbanes-Oxley Act of 2002, that, based on my knowledge:
(1) The Report fully complies with the requirements of Section 13(a) or 15(d) of the Securities Exchange Act of 1934; and
(2) The information contained in the Report fairly presents, in all material respects, the financial condition and results of operations of theCompany.
Date: August 5, 2021 By: /s/ Scot Fredo Scot Fredo
Chief Financial Officer(Principal Financial Officer)