cargill emission inventory - port of vancouver · pdf filecargill emission inventory report...
TRANSCRIPT

CARGILL EMISSION INVENTORY
Prepared for: Cargill Ltd 801 Low Level Road North Vancouver, BC, V7L 1A7 Prepared by: Envirochem Services Inc. 206–267, West Esplanade North Vancouver, BC, V7M 1A5 www.envirochem.com
March 26, 2015

Cargill Emission Inventory Report Page i
Executive Summary
Cargill is a grain elevator marine terminal located on Burrard Inlet in North Vancouver, British Columbia handling shipments of different grains including wheat/durum, barley, peas, and canola. The Emission Inventory presented in this report supports a project approval application with the Port of Metro Vancouver (PMV) for an expansion in throughput at Cargill.
The proposed expansion will be achieved primarily by de-bottlenecking the existing rail track system, this will allow more trains to be unloaded per year with minimal environmental impact. This upgrade would realize the following benefits to the community:
• Improve efficiency of rail car movement through the terminal with track configuration modifications designed to meet plant productivity goals including:
o More cars per service = fewer rail car deliveries/day, = significantly less diesel locomotive noise and exhaust emissions;
o Significantly reduced car impact noises caused by releasing partial car strings
o Reduced noise and exhaust emissions by eliminating the need for a 250 BHP diesel shuttle wagon;
• Enhance the safe work environment by switch automation, lighting improvements, and worker access corridors; and
• The use of best available control technologies (BACT), designed to maintain good air quality in the area.
The changes will also enable more efficient rail and marine vessel scheduling, which is a vital component of terminal planning logistics.
This Emission Inventory considers air emissions for two cases:
• Base case: ~ 3.2 million tonnes grain handling for the year 2013; and
• Future expansion: 5 million tonnes grain handling by the year 2020.
The air contaminants considered for this emission inventory include carbon monoxide (CO), sulphur dioxide (SO2), nitrogen oxides (NOX), inhalable particulate matter (PM10), respirable particulate matter (PM2.5), total volatile organic compounds (VOC), ammonia (NH3), diesel particulate matter (DPM), black carbon (BC), and greenhouse gases (GHG) such as carbon dioxide (CO2), methane (CH4) and nitrous oxide (N2O). Black Carbon and GHGs are expressed as carbon dioxide equivalents (CO2e).
Cargill Emission Inventory

Cargill Emission Inventory Report Page ii
For ease of management and interpretation the emissions are broken down in to the three broad categories.
• Site wide (mainly the on–site) activities including o Terminal (on-site facility) operations including ship loading; o Ship engines and generators while at berth; and, o Train operations from Lynn Yard to Cargill and on-site shunting.
• Ship anchoring and maneuvering while in the PMV area (~9.3km west of First Narrows to the terminal berth)
• Electrical energy generated off-site and supplied by BC Hydro (indirect emissions)
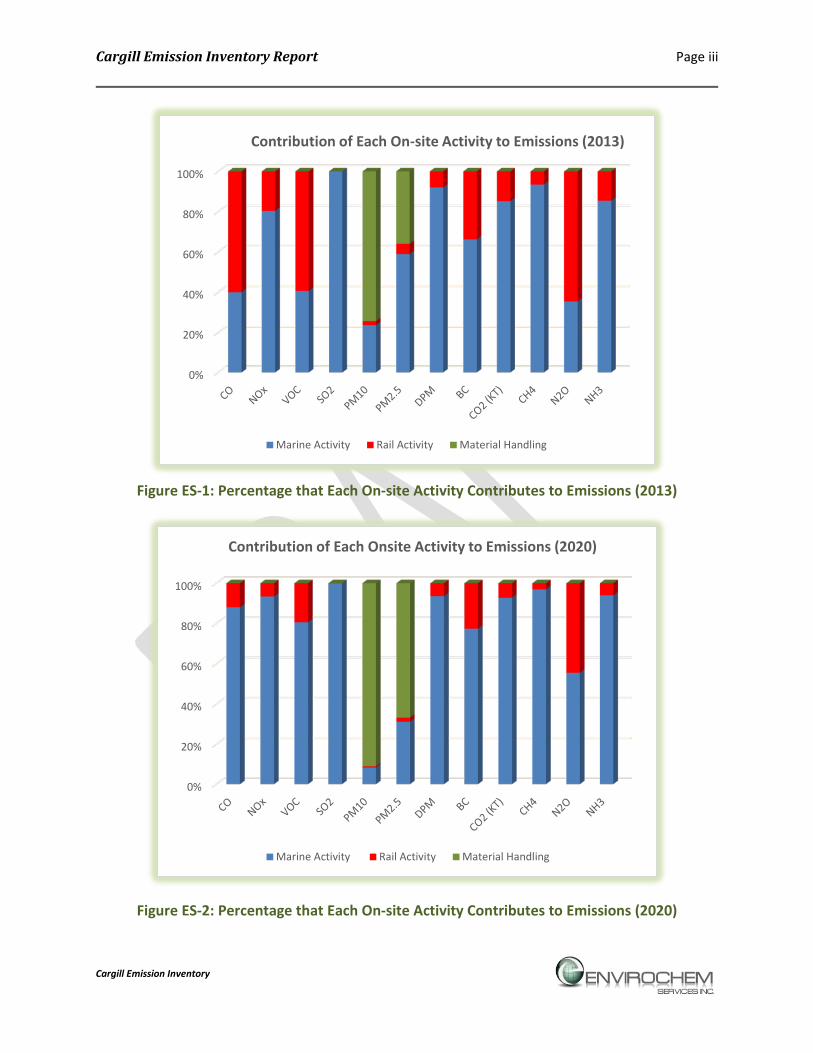
Emissions related to site wide operations are shown on Table ES-1, while Figure ES-1 and Figure ES-2 show the contribution of each activity to emissions for the base case (2013) and future scenario (2020). This inventory demonstrates that over the period 2013 to 2020 essentially all the site wide air emissions will be reduced (e.g. CO by 48%, NOx by 8%, VOC by 42%, SOx by 88%, PM2.5 by 20%, DPM by 58%, CO2e by 4% ...) with the exception of PM10 and CH4. PM10, which derives primarily from fugitive grain-dust emissions released during ship-loading and material handling, is projected to increase by 21%. This is less than percentage increase in throughput due to offsetting reductions in marine (berthing) and rail emissions resulting from the more efficient management of rail unloading. For example, the rail emissions in the future scenario are projected to be decreased by an average of ~67% for all of the contaminants due to upgrading the existing rail and locomotive systems. CH4, a greenhouse gas, emissions are projected to increase by 7%, however as CH4 emissions are very small, the total GHG (CO2e) emissions still decrease.
Emissions of CO, NOx, VOC, NH3, and GHG from off-site ship movements as shown on Table ES-2 increase due to the increasing in ship traffic necessary to move the larger volume of grain. However changes (tightening) in fuel sulphur standards and new combustion (control) technologies result in reduced emissions of SOx (down by 84%) while PM10, PM2.5, and DPM are all (down by ~40%).
Indirect emissions associated with off-site electricity generation, form a small portion of the total emissions and are projected to increase by about 38% with the increasing grain flow (Table ES-3). Additional details on the emissions from all of the various sources that make up each category are included in the report.
In summary the potential increase in on-site (operational) emissions resulting from the greater throughput are generally offset by improvements in fuel quality and technologies and by more efficient rail and locomotive management. Thus there is no need, nor requirement to amend or modify the existing Metro Vancouver Air Discharge Permit. Increased ship traffic and electrical use are projected to generate higher emissions offsite.
Cargill Emission Inventory
Cargill Emission Inventory Report Page iii
Figure ES-1: Percentage that Each On-site Activity Contributes to Emissions (2013)
Figure ES-2: Percentage that Each On-site Activity Contributes to Emissions (2020)
0%
20%
40%
60%
80%
100%
Contribution of Each On-site Activity to Emissions (2013)
Marine Activity Rail Activity Material Handling
0%
20%
40%
60%
80%
100%
Contribution of Each Onsite Activity to Emissions (2020)
Marine Activity Rail Activity Material Handling
Cargill Emission Inventory

Cargill Emission Inventory Report Page iv
Table ES-1: Projected Site-wide (On site) Cargill Air Emissions in 2013 and 2020
Year Emission Source
Contaminant (tonnes for assessment year)
CO NOx VOC SO2 PM10 PM2.5 DPM Climate Forcing PM as CO2e GHG as CO2e
NH3 BC CO2e20 CO2e100 CO2 CH4 N2O CO2e20 CO2e100
2013 (Base case)
Ships 3.678 33.371 0.994 14.683 2.162 2.002 2.002 0.285 912.0 256.5 1498.0 0.211 0.059 1532.0 1522.8 0.0044
Rail 5.510 8.130 1.450 0.004 0.179 0.174 0.174 0.145 464.0 130.5 403.2 0.023 0.165 449.4 453.2 0.0008
Material Handling - - - - 6.788 1.222 - - - - - - - - - -
Total 9.188 41.501 2.444 14.687 9.129 3.398 2.176 0.430 1376.0 387.0 1901.2 0.234 0.224 1981.4 1976.0 0.0052
2020 Future
Ships 4.237 35.854 1.147 1.695 0.926 0.847 0.850 0.166 529.9 149.0 1721.0 0.243 0.069 1760.4 1749.8 0.0039
Rail 0.575 2.530 0.276 0.001 0.060 0.058 0.058 0.048 154.9 43.6 134.0 0.008 0.055 149.5 150.8 0.0003
Material Handling - - - - 10.062 1.814 - - - - - - - - - -
Total 4.812 38.384 1.423 1.696 11.047 2.719 0.908 0.214 684.7 192.6 1855.0 0.250 0.125 1909.9 1900.6 0.0042
% Change * -48 -8 -42 -88 21 -20 -58 -50 -50 -50 -2 7 -45 -4 -4 -20 Note: (-) = <0.0001
*Negative numbers show decreasing of emission in the future (2020, 5 million tonnes) in compare to 2013 (Base case).
Table ES-2: Expected Off-Site Supply-Chain Air Emissions at Cargill
Year Emission Source
Contaminant (tonnes for assessment year)
CO NOx VOC SO2 PM10 PM2.5 DPM Climate Forcing PM as CO2e GHG as CO2e
NH3 BC CO2e20 CO2e100 CO2 CH4 N2O CO2e20 CO2e100 2013
(Base case) Ships 16.44 152.15 4.70 61.90 9.26 8.51 8.51 1.19 3795.1 1067.4 6619.3 0.92 0.26 6767.0 6727.1 0.0335
2020 Future Ships 25.11 215.33 7.14 9.81 5.44 5.00 4.98 0.94 2999.0 843.5 10119.5 1.41 0.40 10346.6 10285.4 0.0550
% Change 53 42 52 -84 -41 -41 -42 -21 -21 -21 53 53 54 53 53 64 Note: Marine supply chain extends to the Strait of Georgia (Salish Sea)
Table ES-3: Expected Indirect Air Emissions from Electricity Usage at Cargill
Year Contaminant (tonnes for assessment year)
CO NOx VOC SO2 PM10 PM2.5 DPM Climate Forcing PM as CO2e GHGs as CO2e
NH3 BC CO2 CH4 N2O CO2e20 CO2e100 2013
(Base case) 8.80 4.12 0.27 0.38 1.07 0.94 0.008 0.00013 0.41 0.12 259.0 0.030 0.007 264.0 262.0 0.0011
2020 Future 12.20 5.70 0.37 0.52 1.48 1.30 0.012 0.00018 0.57 0.16 359.0 0.041 0.010 365.0 363.0 0.0016
% Change 39 38 38 38 38 39 38 38 38 38 39 38 38 38 39 39
Cargill Emission Inventory

Cargill Emission Inventory Report Page v
Table of Contents GLOSSARY OF ACRONYMS AND ABBREVIATIONS ...................................................IX
1 INTRODUCTION............................................................................................. 1
2 SCOPE OF EMISSION INVENTORY .................................................................. 1
2.1 Spatial Scope / Assessment Area Boundaries ......................................................... 1 2.2 Temporal Scope ...................................................................................................... 4 2.3 Compounds of Potential Concern ........................................................................... 4 2.4 Continual Improvement .......................................................................................... 5
3 ACTIVITY LEVELS ........................................................................................... 6
3.1 Marine Vessels Activities ........................................................................................ 6 3.2 Rail Transport Activities .......................................................................................... 7
3.2.1 Existing System ................................................................................................. 7 3.2.2 New System Objectives .................................................................................... 9 3.2.3 New System Scope ........................................................................................... 9 3.2.4 New System Operation .................................................................................. 10
3.3 On-Site Material Handling Equipment and Stationary Source Activities ............. 11 3.4 Truck Shipments.................................................................................................... 14
4 QUALITATIVE DISCUSSION OF EMISSION ESTIMATES .................................. 15
5 EMISSION FACTORS AND RATES ................................................................. 16
5.1 Off-Road Equipment ............................................................................................. 16 5.1.1 Marine Vessels ............................................................................................... 16 5.1.2 Rail Transport ................................................................................................. 19 5.1.3 Climate Forcing PM (Black Carbon) ............................................................... 22
5.2 On-Site Material Handling Equipment and Stationary Source ............................. 23
6 SUMMARY OF RESULTS ............................................................................... 25
7 CONCLUSIONS............................................................................................. 27
APPENDIX A: AIR QUALITY AND LAND USE ..................................................... A-1
A.1 Air Quality Criteria ............................................................................................... A-2 A.2 Existing Air Quality ............................................................................................... A-3 A.3 Land Use in Cargill Area ....................................................................................... A-7
APPENDIX B: DETAILED EMISSION RATE CALCULATIONS ................................ B-1
B.1 Marine Emissions ................................................................................................. B-2 B.1.1 Ship Size ........................................................................................................ B-2
Cargill Emission Inventory

Cargill Emission Inventory Report Page vi
B.1.2 Ship Quantities .............................................................................................. B-3 B.1.3 Ship Activity Times ........................................................................................ B-3 B.1.4 Load Factors (LFs) .......................................................................................... B-5 B.1.5 Ship EFs ......................................................................................................... B-6 B.1.6 NOx EFs ......................................................................................................... B-7 B.1.7 SO2 and PM EFs ............................................................................................. B-9 B.1.8 Boilers ............................................................................................................ B-9 B.1.9 Tugboats ...................................................................................................... B-11 B.1.10 References................................................................................................... B-12
B.2 Rail Locomotive Emissions ................................................................................. B-14 B.2.1 Locomotive Parameters .............................................................................. B-15 B.2.2 Locomotive Activities .................................................................................. B-17 B.2.3 References................................................................................................... B-17
B.3 On-Site Material Handling and Stationary Source Equipment and Electricity .. B-18 B.3.1 Material Handling and Processing .............................................................. B-18 B.3.2 References................................................................................................... B-18
B.4 Electricity ............................................................................................................ B-23 B.4.1 References................................................................................................... B-23
APPENDIX C: SAMPLE PICTURES OF THE MATERIAL HANDLING EQUIPMENT AT CARGILL C-1
List of Tables Table 2-1: CO2 Equivalent Conversion Factors ............................................................................... 5
Table 3-1: Annual Activity for Marine Vessels, 2013 and 2020 ...................................................... 7
Table 3-2 :Annual Activity for Marine Vessels, 2013 and 2020 ...................................................... 7
Table 3-3: Projected Annual Rail Activity at Cargill in 2013 and 2020.......................................... 10
Table 3-4: Cargill grains shipments in the base case (2013) and future expansion (2020) .......... 11
Table 3-5: Cargill emission sources location and description ....................................................... 13
Table 5-1: Marine Vessel Emission Factors ................................................................................... 16
Table 5-2: 2013 Marine Vessel Emissions (tonnes/year) Baased on Ships Engine Type .............. 17
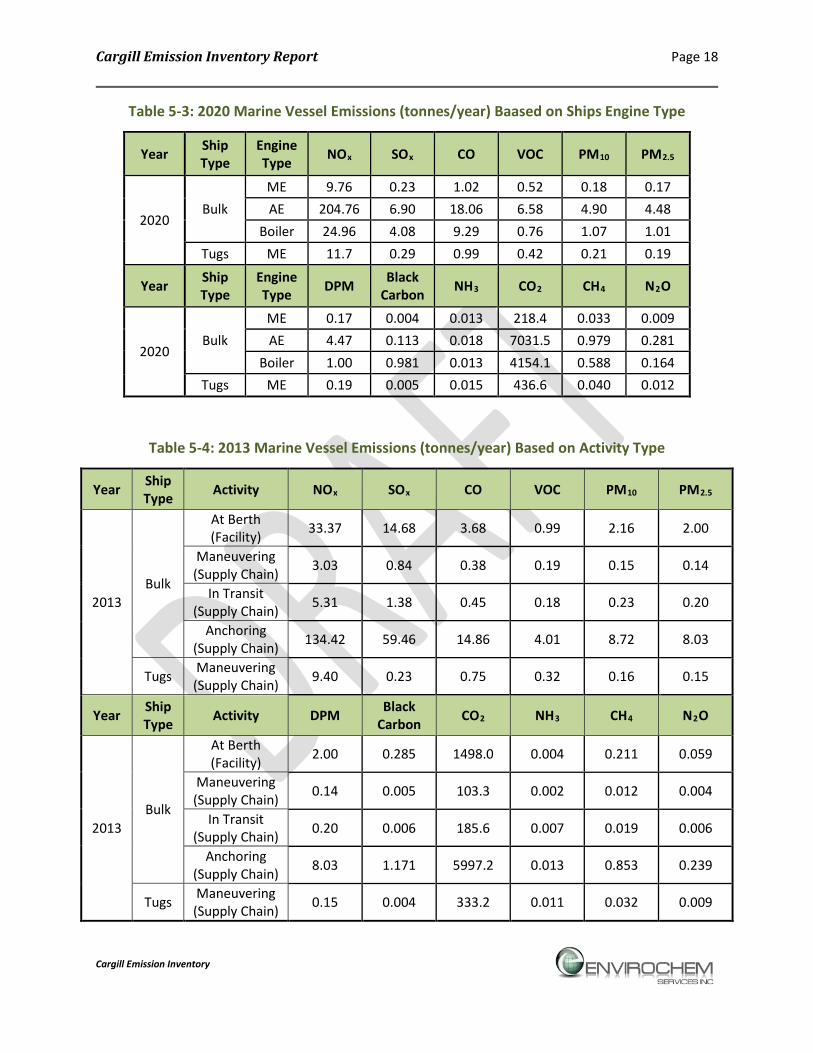
Table 5-3: 2020 Marine Vessel Emissions (tonnes/year) Baased on Ships Engine Type .............. 18
Table 5-4: 2013 Marine Vessel Emissions (tonnes/year) Based on Activity Type ........................ 18
Table 5-5: 2020 Marine Vessel Emissions (tonnes/year) Based on Activity Type ........................ 19
Cargill Emission Inventory

Cargill Emission Inventory Report Page vii
Table 5-6: U.S. EPA Locomotive Emission Standards.................................................................... 20
Table 5-7: Locomotive CAC Emission Rates .................................................................................. 21
Table 5-8: Rail Association of Canada EFs ..................................................................................... 21
Table 5-9: Locomotive GHG Emission Rates ................................................................................. 22
Table 5-10: Locomotive Climate Forcing PM Emission Rates ....................................................... 22
Table 5-11: Rail Emissions in the Base Case (2013) (tonnes/year) ............................................... 23
Table 5-12: Rail Emissions the Future (2020) (tonnes/year) ........................................................ 23
Table 5-13: PM Emission for Each Source Group and in Total for the Grain Processing (Facility Operation) in Cargill for the base case (2013) and 2020 (5 million tonnes) .............. 24
Table 6-1: Projected Site-wide (On site) Cargill Air Emissions in 2013 and 2020 ......................... 26
Table 6-2: Expected Off-Site Supply Chain Air Emissions at Cargill .............................................. 26
Table 6-3: Expected Indirect Air Emissions from Electricity Usage at Cargill ............................... 26
Table A-1: Air Quality Criteria for CACs ....................................................................................... A-2
Table A-2: Summary of Air Quality Observations at Station T6 (all wind directions).................. A-6
Table B-1: Ship Capacity and Engine Size ..................................................................................... B-3
Table B-2: Annual Ship Calls ......................................................................................................... B-3
Table B-3: Ship Activities Times ................................................................................................... B-5
Table B-4: Ship Load Factors ........................................................................................................ B-6
Table B-5: Low Load (ME load 0.1) Scale Factors ........................................................................ B-6
Table B-6: CO, VOC, CO2, CH4, NH3, N2O, Black Carbon EFs, g/kW-hr ........................................ B-7
Table B-7: IMO NOx Emission Limits ............................................................................................ B-7
Table B-8: Ship Age Distribution .................................................................................................. B-8
Table B-9: NOx Tier and EF by Ship Age ....................................................................................... B-8
Table B-10: NOx EFs ..................................................................................................................... B-8
Table B-11: SO2 and PM Adjustment Factors and Emission Factors ........................................... B-9
Table B-12: SO2 and PM Adjustment Factors for Boilers .......................................................... B-10
Table B-13: Boiler EFs, kg/tonne ................................................................................................ B-10
Cargill Emission Inventory

Cargill Emission Inventory Report Page viii
Table B-14: Boiler Fuel Consumption Rates .............................................................................. B-10
Table B-15: Tugboat EFs, g/kW-hr ............................................................................................. B-12
Table B-16: Switcher Locomotive Effective Power and Fuel Consumption............................... B-16
Table B-17: Locomotive Fleet Tier Mixtures .............................................................................. B-17
Table B-18: Calculating the emission rate for the grains other than Canola (Base case, 2013) B-19
Table B-19: Calculating the emission rate for Canola (Base case, 2013) ................................... B-20
Table B-20: Calculating the emission rate for the grains other than Canola and Canola meal pellets (5 million tonnes 2020) ................................................................................ B-21
Table B-21: Calculating the emission rate for Canola and Canola meal pellets (5 million tonnes 2020) ........................................................................................................................ B-22
Table B-22: Projected Electricity Consumption Data (kWh) ...................................................... B-23
Table B-23: Estimated Emission Factors Based on the B.C. Electrical Supply Mix (kg/kWh) .... B-23
List of Figures Figure 2-1: Cargill site ..................................................................................................................... 2
Figure 2-2: Cargill site, emission sources location and property line ............................................. 3
Figure 3-1: Existing Track System.................................................................................................... 8
Figure 3-2: Major process operations at Cargill site ..................................................................... 12
Figure 7-1: Percentage that Each On-site Activity Contributes to Emissions (2013) ................... 28
Figure 7-2: Percentage that Each On-site Activity Contributes to Emissions (2020) ................... 29
Figure A-1: Metro Vancouver Ambient Air Quality Monitoring Network ................................... A-3
Figure A-2: Location of MV station T6 ......................................................................................... A-4
Figure A-3: 2008-2012 Wind rose for Station T6 Second Narrows.............................................. A-5
Figure A-4: Land use in Cargill area .............................................................................................. A-7
Figure A-5: Plan objectives through land use in city of North Vancouver ................................... A-8
Figure B-1: Distance, Speed and Tug Assist Information for Ships in Transit and Manoeuvring B-5
Cargill Emission Inventory

Cargill Emission Inventory Report Page ix
Glossary of Acronyms and Abbreviations
List of Acronyms
AAQO Ambient Air Quality Objectives
AQMP Air Quality Management Plans
B.C. British Columbia
CAAQS Canadian Ambient Air Quality Standards
CAC Common Air Contaminant
CMV Commercial Marine Vessel
CWS Canada-wide Standards
GVRD Greater Vancouver Regional District
MAL maximum acceptable level
MDL maximum desirable level
MOE Ministry of the Environment
NAAQO National Ambient Air Quality Objectives
PMV Port Metro Vancouver
U.S. EPA United States Environmental Protection Agency
Contaminants
BC black carbon
CO carbon monoxide
CO2 carbon dioxide
CO2e20 carbon dioxide equivalent over twenty years
CO2e100 carbon dioxide equivalent over one hundred years
DPM diesel particulate matter
GHG greenhouse gas
NO nitric oxide
NO2 nitrogen dioxide
NOx nitrogen oxides
N2O nitrous oxide
PM particulate matter
PM10 inhalable particulate matter (particulate matter up to 10 micrometers in size)
PM2.5 fine particulate matter (particulate matter up to 2.5 micrometers in size)
SO2 sulphur dioxide
VOC volatile organic compound
Cargill Emission Inventory
Cargill Emission Inventory Report Page 1
1 INTRODUCTION
Cargill is a grain elevator/terminal located in Port Metro Vancouver (PMV) on Burrard Inlet in North Vancouver, British Columbia. Cargill handles/shipments of different grains including wheat/drum, barley, peas, and canola. The Emission Inventory presented in this report supports a project permit application with Port Metro Vancouver to accommodate the proposed new expanded operations. The proposed expansion would be achieved by de-bottlenecking the existing rail track system, thereby allowing more trains to be unloaded per year. This upgrade would realize the following benefits to the terminal and to the community:
• Improve efficiency of rail car movement through the terminal with track configuration modifications designed to meet plant productivity goals
o More cars per service = fewer rail car deliveries/day = significantly less noise and exhaust emissions from 3,000 HP diesel locomotives
o Significantly reduced car-impact noises presently caused by releasing partial car strings
o Reduced noise and exhaust emissions by eliminating the need for a 250 BHP diesel shuttle wagon
• Enhance the safe work environment by switch automation, lighting improvements, and worker access corridors
This Emission Inventory considers both site-wide and off-site air emissions, for the following two scenarios or cases:
• Base case: ~ 3.2 million tonnes grain handling for the year 2013; and
• Future expansion: 5 million tonnes grain handling for the year 2020
2 SCOPE OF EMISSION INVENTORY
2.1 SPATIAL SCOPE / ASSESSMENT AREA BOUNDARIES
The primary objective of this Emission Inventory is to evaluate the impact that proposed grain handling expansion (5 million tonnes) will have on site-wide air emissions. For ease of management and interpretation the emissions are broken down in to the three broad categories.
• Ship anchoring and maneuvering while in the PMV area (~9.3km west of First Narrows to the Cargill terminal berth) see Figure B-1 in Appendix B.
Cargill Emission Inventory

Cargill Emission Inventory Report Page 2
• Electrical energy generated off-site and supplied by BC Hydro (indirect emissions); and • Site wide (or mainly on–site) activities including
o Terminal (on-site facility) operations including ship loading; o Ship engines and generators while at berth; and, o Train operations from Lynn Yard to Cargill and on-site shunting.
The Cargill facility is located in an industrial area immediately surrounded by the inlet (marine area) to the south and residential areas to the north. The location of the terminal, the dock, and the rail lines are shown on Figure 2-1 and Figure 2-2.
Figure 2-1: Cargill site
Cargill Emission Inventory

Cargill Emission Inventory Report Page 3
Figure 2-2: Cargill site, emission sources location and property line
Cargill Emission Inventory

Cargill Emission Inventory Report Page 4
2.2 TEMPORAL SCOPE
Cargill is proposing to increase annual grain shipments from the current ~ 3.2 million tonnes to (2013) to 5 million tonnes by the year 2020. Therefore, this emission inventory considers 2013 as the base case year, which is prior to the proposed start of expansion, and 2020 as the future year when the maximum annual shipping capacity is achieved.
The emission estimates used for 2013 and 2020 incorporate activity levels for grain handling, marine vessels, and rail locomotives, at Cargill. The estimated emissions in each time period were based on detailed consideration of activity levels for each type of equipment associated with changes in commodity handling capacity.
2.3 COMPOUNDS OF POTENTIAL CONCERN
The primary source of emissions at the Cargill site is the combustion of fuel in rail locomotives, and ships and grain handling.
The primary compounds of potential concern are considered to include carbon monoxide (CO), sulphur dioxide (SO2), nitrogen oxides (NOX), inhalable particulate matter (PM10), respirable particulate matter (PM2.5), total volatile organic compounds (VOC), ammonia (NH3), diesel particulate matter (DPM), black carbon1, and greenhouse gases (GHG) such as carbon dioxide (CO2), methane (CH4) and nitrous oxide (N2O).
Releases of all other compounds are not considered to be significant based on the release thresholds established with the Environment Canada National Pollutants Release Inventory (NPRI) program, to which Cargill reports annually.
CO2 Equivalent Emissions
Black Carbon and greenhouse gases (CO2, N2O and CH4) are presented as CO2 equivalents (CO2e) and calculated by applying the Global Warming Potential (GWP) conversion factors presented in Table 2-1.
1 The particulate matter in diesel exhaust consists primarily of solid carbonaceous particles of black carbon and organic carbon, with the remaining mass composed of metals, ash, and semi-volatile organics and secondary particles such as sulfates and nitrates.
Cargill Emission Inventory

Cargill Emission Inventory Report Page 5
Table 2-1: CO2 Equivalent Conversion Factors
Contaminant GWP Conversion Factors*
20-year 100-year
CH4 86 34
N2O 268 298
Black Carbon 3200 900
* For CH4 and N2O, the GWP source is IPCC AR5 2013 (5th assessment) Ch8 Table 8.7 http://www.climatechange2013.org/images/report/WG1AR5_Chapter08_FINAL.pdf
For Black Carbon the GWP source is Bond et al. (2013) 2
For black carbon, Bond et al. (2013) estimated GWP values of 3,200 on a 20-year time scale and 900 on a 100-year time scale. According to Bond et al., black carbon and CO2 emission amounts with equivalent 100-year GWPs have different impacts on climate, temperature, rainfall, and the timing of these impacts. These and other differences raise questions about the appropriateness of using a single metric such as CO2e to compare black carbon and greenhouse gases. Moreover, Hodnebrog et al. (2014)3 have recently questioned the GWP of black carbon as estimated by Bond et al. (2013), indicating that there remains considerable uncertainty and debate about the relative magnitude of black carbon in climate forcing.
Air quality criteria in the Cargill site area is presented in Appendix A:
2.4 CONTINUAL IMPROVEMENT
Cargill has an active and ongoing program of continual improvement. In addition to the improvements in farming techniques and the actual grain quality discussed earlier, Cargill is also has ongoing programs to review and change the technology within the facility. For example, there are plans to update the emission points this year including increased static or enclosures to reduce air borne dust and energy usage; basement belts have now been enclosed eliminating two emission (Filter HA and Filter G) and near future plans call for improvements to bin top conveyors. In addition, the 5 million tonne scenario (2020) includes 1,637,000 of oil
2 Bond, T.C., S. J. Doherty, D.W. Fahey, P.M. Forster, T. Berntsen, B.J. DeAngelo, M.G. Flanner, S. Ghan, B. Kärcher, D. Koch, S. Kinne, Y. Kondo, P.K. Quinn, M.C. Sarofim, M.G. Schultz, M. Schulz, C. Venkataraman, H. Zhang, S. Zhang, N. Bellouin, S.K. Guttikunda, P.K. Hopke, M.Z. Jacobson, J.W. Kaiser, Z. Klimont, U. Lohmann, J.P. Schwarz, D. Shindell, T. Storelvmo, S.G. Warren, and C.S. Zender. 2013. Bounding the role of black carbon in the climate system: A scientific assessment. Journal of Geophysical Research: Atmospheres, 118:5380–5552
3 Hodnebrog, Ø., G. Myhre and B.H. Samset 2014. How shorter black carbon lifetime alters its climate effect. Nature Communications. www.nature.com/naturecommunications
Cargill Emission Inventory

Cargill Emission Inventory Report Page 6
seeds such as canola that generate essentially no emissions as the viscosity tends to hold the dust to the grain.
All grain processing and handling are through covered conveyor belts (from trains to the grain elevator and thence from storage to bulk carriers for overseas shipment) under partial vacuum, and all controlled dust sources are pneumatically conveyed to the baghouse units. These technologies are best available control technologies (BACT) and are designed to maintain good air quality in the area.
In summary Cargill has active environmental management and continual improvement programs that are demonstrated by the above operational and emission reduction modifications; their research in to emissions and controls (e.g. the Genesis Engineering Cascadia Report); their ambient monitoring dustfall stations, and their technology tracking and upgrading.
3 ACTIVITY LEVELS
An emissions inventory is generated through characterizing the activity levels of all significant sources of air emissions associated with site activities. The emissions estimates themselves are achieved by application of emission factors. The accuracy of the Cargill emissions inventory is directly dependent on the source characterization of marine, rail, and grain handling/processing, as well as on how representative the emission factors are for the type of activity being characterized. Activity levels at Cargill and related supply chain (as follows) were compiled for the base case (2013) and the future 5 million tonnes expansion (2020). To the extent possible, the future activity estimates are based on projected changes to throughput levels.
3.1 MARINE VESSELS ACTIVITIES
Cargill has two marine berths for loading grains onto ships. Air emissions associated with shipping activities are produced from commercial marine vessel (CMV) engines and the tugboats that assist in vessel maneuvering. When at berth or anchoring, ship’s auxiliary engines and boilers operate to power ship equipment, including the operation of cranes used for loading. When maneuvering or in transit, the ships main engines also operate for propulsion.
Annual ship calls, provided by Cargill, are based on projected commodity throughput for the base case (2013) and future (2020, 5 million tonnes) years.
Activity times for ships at berth were based on berth occupancy data provided by Cargill for 2013 and adjusted linearly according to throughput/ship changes for the relevant horizon years. Activity times for ships and tugs maneuvering and for ships in transit are based on the
Cargill Emission Inventory

Cargill Emission Inventory Report Page 7
distances travelled and speeds, which were estimated from information provided by PMV. Marine vessel activity is summarized in Table 3-1 and Table 3-2. As indicated in Table 3-1, there is no expected change in vessel capacity between 2013 and 2020, which is not controlled by Cargill, but is controlled by the shipping companies.
Table 3-1: Annual Activity for Marine Vessels, 2013 and 2020
Commodity Ship
Annual Throughput
(million tonnes)
Annual Ship Calls*
2013 2020 2013 2020
All grains
Panamax 65,000 DWT
1.3 1.95 20 30
Handymax 45,000 DWT
0.45 1.08 10 24
Handy 25,000 DWT
1.45 1.95 58 78
Total 3.2 5 88 132
*Each ship call, listed above is equal to two movements, one entering the Cargill site and the other leaving
Table 3-2 :Annual Activity for Marine Vessels, 2013 and 2020
Commodity Ship
Type and DWT
Activity Times (hr/ship call) In Transit Maneuvering At Berth Anchoring
2013 2020 2013 2020 2013 2020 2013 2020
All Grains Panamax
1 1 2 2 68 68 168 168 65,000
All Grains Handyma
x 1 1 2 2 56 56 168 168 45,000
All Grains Handy 1 1 2 2 33 33 168 168 25,000
For every ship call, 3 tugs spend 1.5 hours maneuvering in and 2 tugs spend 1.5 hours maneuvering out
3.2 RAIL TRANSPORT ACTIVITIES
3.2.1 Existing System
The existing system moves grain cars from the west to the east side of the track shed. The track shed has two operational dumpers. In the track shed the cars are indexed and slide-valves
Cargill Emission Inventory
Cargill Emission Inventory Report Page 8
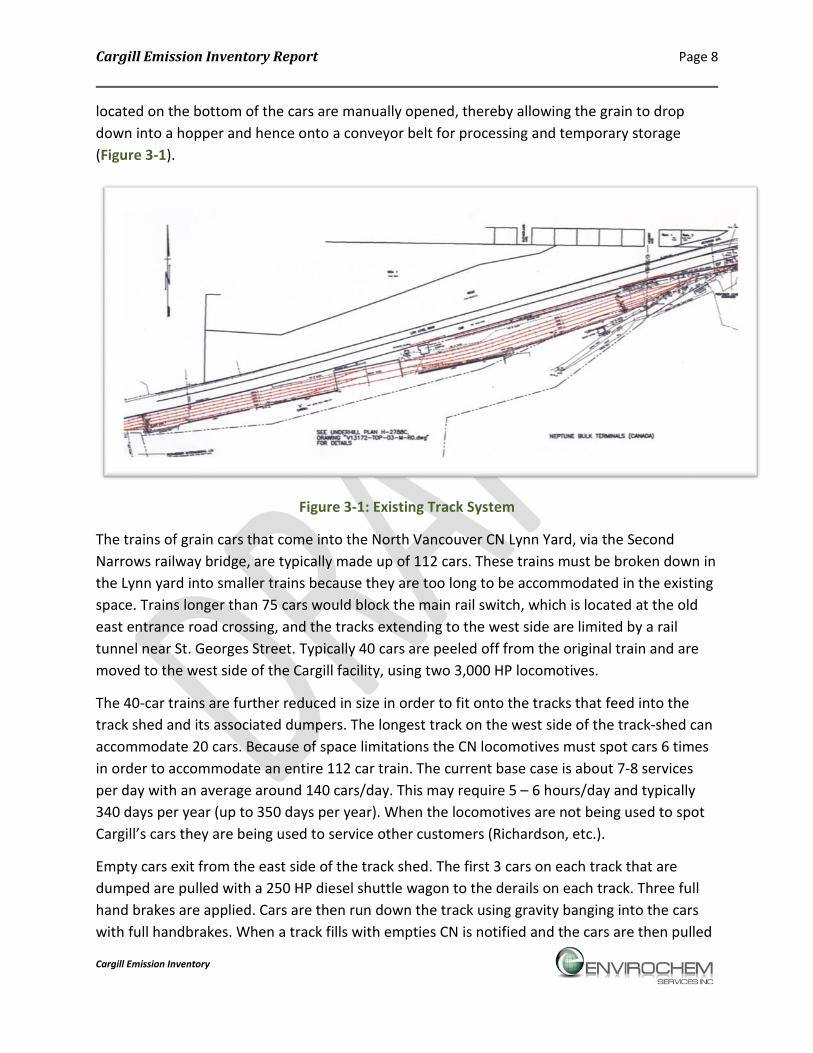
located on the bottom of the cars are manually opened, thereby allowing the grain to drop down into a hopper and hence onto a conveyor belt for processing and temporary storage (Figure 3-1).
Figure 3-1: Existing Track System
The trains of grain cars that come into the North Vancouver CN Lynn Yard, via the Second Narrows railway bridge, are typically made up of 112 cars. These trains must be broken down in the Lynn yard into smaller trains because they are too long to be accommodated in the existing space. Trains longer than 75 cars would block the main rail switch, which is located at the old east entrance road crossing, and the tracks extending to the west side are limited by a rail tunnel near St. Georges Street. Typically 40 cars are peeled off from the original train and are moved to the west side of the Cargill facility, using two 3,000 HP locomotives.
The 40-car trains are further reduced in size in order to fit onto the tracks that feed into the track shed and its associated dumpers. The longest track on the west side of the track-shed can accommodate 20 cars. Because of space limitations the CN locomotives must spot cars 6 times in order to accommodate an entire 112 car train. The current base case is about 7-8 services per day with an average around 140 cars/day. This may require 5 – 6 hours/day and typically 340 days per year (up to 350 days per year). When the locomotives are not being used to spot Cargill’s cars they are being used to service other customers (Richardson, etc.).
Empty cars exit from the east side of the track shed. The first 3 cars on each track that are dumped are pulled with a 250 HP diesel shuttle wagon to the derails on each track. Three full hand brakes are applied. Cars are then run down the track using gravity banging into the cars with full handbrakes. When a track fills with empties CN is notified and the cars are then pulled
Cargill Emission Inventory

Cargill Emission Inventory Report Page 9
to the Lynn yard using locomotives. The reassembly of the train is a major source of noise, as the empty cars bang into the reassembled train.
3.2.2 New System Objectives
• Improve efficiency of rail car movement through the terminal with track configuration modifications designed to meet plant productivity goals
o More cars per service = fewer rail car deliveries/day, less noise, and reduced diesel emissions
o Reduce car impact noises from releasing partial car strings
o Reduce noise and emissions by eliminating the need for a shuttle wagon
• Enhance the safe work environment by switch automation, lighting improvements, and worker access corridors
3.2.3 New System Scope
• Reconfigure existing track infrastructure with additional switches and trackage to allow deliveries of up to 120 cars per spot.
• Install a dedicated lead track from the CN yards to permit free access at any time to spot cars on the Cargill track yards
• Improve the existing berms/retaining walls alongside the track yard where necessary
• Re-commission a third dumper pit within the existing trackshed, c/w new hopper, conveyors and track upgrades so 2 dumpers can be in use at all times while a third track is locked out for spotting purposes.
• Install a new gate opener system for the third dumper.
• Install a new car indexing system for the entire trackshed to permit the control of up to 24 car strings without cutting and releasing cars
• Install a RFID system for automated car information management
• Upgraded rail signal system
• Upgraded lighting system in the track yards to provide illumination that meets provincial regulations without generating stray light upwards.
• Upgrade the current camera system to meet requirements of the new dumper and spotting arrangements
• Electrical and controls as required.
Cargill Emission Inventory

Cargill Emission Inventory Report Page 10
3.2.4 New System Operation
The reconfigured track system will have a new lead-in track on the west side so that the main north rail switch is not blocked by longer trains. In addition, the dumper operation will be bidirectional with no gravity feed or shuttle wagon required. Table 3-3 provides a listing of projected annual rail movements.
Table 3-3: Projected Annual Rail Activity at Cargill in 2013 and 2020
Activity All Products for Horizon Year
2013 2020
Condition Base case Increased Throughput
Throughput (million metric tonnes) ~ 3.2 5
Railcars Unloaded Per day 104 160
Operating Days Per Year 350 350
# of Railcars Unloaded Per year 36,400 56,000
Tonnes Per Railcar (average over all grains) 90 90
Switch yard Shuttle Wagon 250 BHP Eng* 1 0
Switch yard Loci Eng 3000 HP 1 1
Switchyard Loci Activity (hours) 1925 1050
Number of Railcars per Unit Train 112 112
Number of Delivery Trains/yr 325 500
# Locomotives/Del. Train 2 2
Delivery Trains Activity Hours Per Delivery 0.5 0.5
Delivery Trains Activity Hours Per Year 163 250
*The 250 BHP shuttle Wagon emission is a small source that will not be operational in the future scenario and was therefore not included in the base case.
Cargill Emission Inventory

Cargill Emission Inventory Report Page 11
The new system reduces railway spotting by unloading in two directions, using automated indexers. It can spot up to 75 cars up on the existing tracks on the west side and then a total of 45 cars on the second longest track for each of the 3 dumpers on the east side. It unloads the longest tracks on each of the 3 dumper pits from the west side, dumping only 2 pits at a time. When the longest track is dumped on each dumper it then pulls the east side loads and deposit the empty cars onto the tracks just previously pulled.
The new system will require about 4-5 locomotive spots (services) a day for an average of 175 cars, as each dumper is capable of being serviced separately with no downtime on an active dumper. This can be done using only 1-2 hours per day of locomotive service (up to 350 days per year.)
3.3 ON-SITE MATERIAL HANDLING EQUIPMENT AND STATIONARY SOURCE ACTIVITIES
On-site activity includes grain handling and processing by the electrically powered equipment including stakerakes, conveyors, etc. The three main activity levels associated with these emission sources are material receiving (unloading), handling/processing, and shipping (loading). Table 3-4 presents the annual grain shipments from Cargill in the base case (2013) and future expansion (2020).
Table 3-4: Cargill grains shipments in the base case (2013) and future expansion (2020)
Commodity
Annual Throughput (tonnes/yr)
Base Case (2013)
Future Expansion (2020)
Wheat/Durum 1,591,530 2,352,000 Barley 118,991 175,000 Peas 349,817 387,000
Soybeans - 199,000 Canola Meal Pellets - 250,000
Canola 1,154,555 1,637,000
Totals 3,214,893 5,000,000
As described above in this facility grains are received by railcars and all grain processing and handling are through covered conveyor belts (from trains to the grain elevator and thence from storage to bulk carriers for overseas shipment or to trucks for local shipment) under partial vacuum, and all controlled dust sources are pneumatically conveyed to the baghouse units. Major
Cargill Emission Inventory

Cargill Emission Inventory Report Page 12
process operations, emission sources and air pollution control systems at Cargill site are presented in Figure 2-2, Figure 3-2, and Table 3-5. At Cargill there is not any grain dryer.
Figure 3-2: Major process operations at Cargill site
Cargill Emission Inventory

Cargill Emission Inventory Report Page 13
Table 3-5: Cargill emission sources location and description
Source Number Source Description and location
2 (B1) Ventilation of cleaning battery No. 2 discharging through a Baghouse Exhaust(s)
3 (C2) Ventilation of cleaning threshers and car lead-out spout discharging through a Baghouse Exhaust(s)
4 (D1) Ventilation of the workhouse basement conveyors discharging through a Baghouse Exhaust(s)
5 (E1) Ventilation of cleaning battery No. 4 discharging through a Baghouse Exhaust(s) 6 (F) Ventilation of the seed plant cleaners discharging through a Baghouse Exhaust(s) 7 (G) Ventilation of equipment in Annex No. 1 discharging through a Baghouse Exhaust(s) 8 (HA) Ventilation of equipment in Annex No. 2 discharging through a Baghouse Exhaust(s)
10 (K) Waste transfer of dust from emission numbers 04, 05, 45, 46, 47, 48, 18 and 53 discharging through a Baghouse Exhaust(s)
11 (L) Waste transfer of dust from emission numbers 09 and 50 discharging through a Baghouse Exhaust(s)
12 (M) Ventilation of the north side of the shipping gallery discharging through a Baghouse Exhaust(s)
13 (N) Ventilation of the south side of the shipping gallery discharging through a Baghouse Exhaust(s)
14 (O) Ventilation of Mezzanine Floor and Garners discharging through a Baghouse Exhaust(s)
15 (H1) Ventilation of the track shed conveyors, elevating legs and receiving garners discharging through a Baghouse Exhaust(s)
16 (H2) Ventilation of the track shed conveyors, elevating legs and receiving garners discharging through a Baghouse Exhaust(s)
17 (R) Waste transfer of dust from emission number 12 and 13 discharging through a Baghouse Exhaust(s)
18 (V1) Ventilation of the No. 1 shipping belt system discharging through a Baghouse Exhaust(s) 19 (P1) Ventilation of the Hammer Mill No. 1 discharging through a Baghouse Exhaust(s) 20 (P2) Ventilation of the Hamer Mill No. 2 discharging through a Baghouse Exhaust(s) 21 (P3) Ventilation of the Hammer Mill No. 3 discharging through a Baghouse Exhaust(s) 22 (S) Ventilation of the bottom of Annex No. 3 discharging through a Baghouse Exhaust(s) 23 (T) Ventilation of the top of Annex No. 3 discharging through a Baghouse Exhaust(s)
24 (U) Waste transfer of dust from emission number 22 and 23 discharging through a Baghouse Exhaust(s)
24 Loading of marine vessels at Berths No. 1 and 2 discharging through a Marine Vessel Hold(s)
28 (A1) Ventilation of the workhouse bin and turn head floor discharging through a Baghouse Exhaust(s)
29 (A2) Ventilation of the workhouse turn head and top floor discharging through a Baghouse Exhaust(s)
30 (G1) Ventilation of the Annex No. 1 bin floor discharging through a Baghouse Exhaust(s)
Cargill Emission Inventory

Cargill Emission Inventory Report Page 14
Table 3-6: Cargill emission sources location and description (contrinued)
Source Number Source Description and location
31 (O1) Ventilation of the No. 1 oil seed cleaning operation of the old oil seed plant discharging through a Baghouse Exhaust(s)
32 (P4) Ventilation of the Hammer Mill No. 4 discharging through a Baghouse Exhaust(s) 33 (P5) Ventilation of Hammer Mill No. 5 discharging through a Baghouse Exhaust(s) 34 (C1) Ventilation of cleaning battery No. 1 discharging through a Baghouse Exhaust(s) 35 Truck loading station discharging from the truck container
38 (VSF) Ventilation from central vacuum process workhouse discharging through a Baghouse Exhaust(s)
39 (B2) Ventilation of cleaning battery No. 3 discharging through a Baghouse Exhaust(s) 40 (B3) Ventilation of cleaning battery No. 9 discharging through a Baghouse Exhaust(s)
41 (B4) Ventilation of B section tailings and screenings secondary cleaning equipment discharging through a Baghouse Exhaust(s)
42 (C3) Ventilation of workhouse basement conveyors and screws discharging through a Baghouse Exhaust(s)
43 (C4) Ventilation of C section tailings and screenings secondary cleaning equipment discharging through a Baghouse Exhaust(s)
44 (C5) Ventilation of shipping garners discharging through a Baghouse Exhaust(s) 45 (D2) Ventilation of cleaning battery No. 7 discharging through a Baghouse Exhaust(s) 46 (D3) Ventilation of cleaning battery No. 8 discharging through a Baghouse Exhaust(s) 47 (E2) Ventilation of cleaning battery No. 5 discharging through a Baghouse Exhaust(s) 48 (E3) Ventilation of cleaning battery No. 6 discharging through a Baghouse Exhaust(s) 49 (GSF) Ventilation of shipping gallery vacuum system discharging through a Baghouse Exhaust(s)
50 (HB) Ventilation of equipment in annex No. 2 basement discharging through a Baghouse Exhaust(s)
51 (J) Waste transfer of dust from emission number 02, 03, 15, 16, 39, 40, 41, 42, 43 and 44 discharging through a Baghouse Exhaust(s)
52 (O2) Ventilation of cleaning and by-product garners and bins discharging through a Baghouse Exhaust(s)
53 (V2) Ventilation of No. 2 shipping belt system discharging through a Baghouse Exhaust(s)
Sample pictures of the material handling equipment are presented in Appendix C.
3.4 TRUCK SHIPMENTS
In the base case (2013), about 1% of the total grain throughput (36,800 tonnes) were shipped from Cargill site via approximately 1200 trips of heavy-duty (diesel) trucks. In the 2020 it is estimated that truck shipment will amount to less than 1% (38,500 tonnes or 0.8%) of total throughput. Due to the small contribution of these sources, their emissions were not included in this study.
Cargill Emission Inventory

Cargill Emission Inventory Report Page 15
Emissions from the small on-site vehicle engines such as shuttle wagon (250HP – which will be eliminated in the future scenario) and vehicles such as trucks and private motor usage were not included in this emission inventory due to their relatively minor contributions.
4 QUALITATIVE DISCUSSION OF EMISSION ESTIMATES
The projected emissions from the landside terminal facility operations included in this emission inventory are estimated to be worst case, for a variety of reasons. First, as the baghouse filter controls used at the facility are best available control technology (BACT) and, based on current manufacturers performance guarantees and measurements at other sites, are anticipated to actually have higher performance (lower emissions) than included in this inventory.
In addition, EPA emission factors were derived from US grains are handled through elevators with minimal if any cleaning. The greater the cleaning the less dusting during ship loading.
Cargill cleans between 50-60% of what they receive. In cleaning they aspirate the grain first to remove dust, chaff, and light seeds (reduces dusting). This product goes to a reclaim system to recover any whole grain and broken grain. What is left over goes to a pellet mill where it is turned into an animal feed pellet. Cargill’s cleaning utilization is only 42% in a year so while fans may be running they are not emitting emissions for more than half of the year currently. In a 5 million tonne scenario this could expect that to rise to about 60% utilization indicating that there is capacity in the system that can handle the increased throughput.
Canadian grains themselves are different from US grains and export terminals in the US Pacific Northwest handle mainly corn and soybeans. They have a lower moisture content and the lower the moisture content the higher the dust emission. To provide better emission data Cargill conducted actual field measurements taken during the worst emission months in 20014. These Genesis factors have now been used by all west coast terminals in BC. The facts: that this study was conducted 14 years ago during the worst months for emissions; that there have been ongoing changes in farming techniques and grain quality; and that handling techniques and technologies have improved since then, support the observation that the emission factors used in this emission Inventory are likely to yield conservative (i.e. higher) estimates than actual emissions.
Ship emissions are projected to drop in 2015 (this year) as the new sulphur rules come into effect. Thus, with these in effect, the current (2015) ship emissions are projected to be less than the 2013 base case.
4 Genesis Engineering Inc., Cascadia Terminal Grain Dust Study (II), Dec 31, 2001
Cargill Emission Inventory

Cargill Emission Inventory Report Page 16
5 EMISSION FACTORS AND RATES
Activity-based emission factors relate to engine energy output (kWh), engine hours of use or vehicle distance travelled (km). Activity based emission factors were used to determine the majority of air emissions released on or near Cargill grounds and accounted for within the inventories. In each case, application of the emission factors follows a best-practices approach considered appropriate by both Canadian and U.S. regulatory agencies for port-related operations.
5.1 OFF-ROAD EQUIPMENT
5.1.1 Marine Vessels Activity-based emission factors for CMV and tugboat engines are shown in Table 5-1. These emission factors are derived from the most recent version of the Marine Emissions Inventory Tool (MEIT)5 developed by Transport Canada and Environment Canada.
Table 5-1: Marine Vessel Emission Factors
Ship Type
Engine Type Year units NOx SOx CO VOC PM10 PM2.5
Bulk
ME 2013
g/kW-h
17.5 4.2 1.4 0.60 0.72 0.66 2020 16.6 0.42 1.4 0.60 0.3 0.27
AE 2013 13.5 4.2 1.1 0.40 0.72 0.66 2020 12.5 0.42 1.1 0.40 0.3 0.27
Boiler 2013 kg/tonne
fuel 12.30 20.00 4.60 0.38 1.58 1.45
2020 12.30 2.00 4.60 0.38 0.53 0.49
Tugs ME 2013
g/kW-h 10 0.0063 1.5 0.27 0.25 0.23
2020 9.8 0.0063 1.5 0.27 0.25 0.23 Ship Type
Engine Type Year units DPM Black
Carbon NH3 CO2 CH4 N2O
Bulk
ME 2013
g/kW-h
0.66 0.007 0.021 621 0.060 0.017 2020 0.27 0.007 0.021 621 0.060 0.017
AE 2013 0.66 0.007 0.001 670 0.060 0.017 2020 0.27 0.007 0.001 670 0.060 0.017
Boiler 2013 kg/tonne
fuel 1.45 1.45 0.006 3188 0.29 0.08
2020 0.49 0.49 0.006 3188 0.29 0.08
Tugs ME 2013
g/kW-h 0.23 0.007 0.005 690 0.09 0.020
2020 0.23 0.007 0.005 690 0.09 0.020
5 MEIT, 2010, pp24-26.
Cargill Emission Inventory

Cargill Emission Inventory Report Page 17
CMV emission factors are listed for both main engines and auxiliary engines and are representative of the bulk carriers that transport grains. DPM estimates are nearly equivalent to PM2.5 estimates since most of the marine vessels consume diesel, so it was assumed DPM is equal to PM2.5 per the EPA NONROAD Model (U.S. EPA 2010).
The emission factors in Table 5-1 were combined with effective engine power settings and the activity levels discussed in section 3, to determine a set of emission rates in tonnes of pollutant per year according to the following general calculation:
Emissions (tonnes/yr) = [EF (g/kW-hr) * Traffic Count (ships/yr) * Ship Engine Size (kW/ship) * Load Factor * Activity time (hr) * 1 tonne/ 1000,000 g]
Details of the calculation methodology are discussed in Appendix B.1. Marine emissions are summarized in Table 5-2 and Table 5-3 based on ships engine type and also Table 5-4 and Table 5-5 based on activity type.
For the purposes of this inventory, it was assumed that main engine emissions occur during transit and maneuvering modes, auxiliary engine emissions occur during all modes, and boilers are operated during maneuvering, berthing, and anchorage.
Table 5-2: 2013 Marine Vessel Emissions (tonnes/year) Baased on Ships Engine Type
Year Ship Type
Engine Type NOx SOx CO VOC PM10 PM2.5
2013 Bulk
ME 7.10 1.57 0.69 0.36 0.32 0.30 AE 151.58 46.65 12.25 4.48 8.56 7.89
Boiler 17.45 28.13 6.42 0.53 2.37 2.19 Tugs ME 9.4 0.23 0.75 0.32 0.16 0.15
Year Ship Type
Engine Type DPM Black
Carbon NH3 CO2 CH4 N2O
2013 Bulk
ME 0.30 0.002 0.007 149.0 0.022 0.006 AE 7.89 0.054 0.011 4764.5 0.665 0.189
Boiler 2.19 1.411 0.008 2870.6 0.407 0.113 Tugs ME 0.15 0.004 0.011 333.2 0.032 0.009
Cargill Emission Inventory
Cargill Emission Inventory Report Page 18
Table 5-3: 2020 Marine Vessel Emissions (tonnes/year) Baased on Ships Engine Type
Year Ship Type
Engine Type NOx SOx CO VOC PM10 PM2.5
2020 Bulk
ME 9.76 0.23 1.02 0.52 0.18 0.17 AE 204.76 6.90 18.06 6.58 4.90 4.48
Boiler 24.96 4.08 9.29 0.76 1.07 1.01 Tugs ME 11.7 0.29 0.99 0.42 0.21 0.19
Year Ship Type
Engine Type DPM Black
Carbon NH3 CO2 CH4 N2O
2020 Bulk
ME 0.17 0.004 0.013 218.4 0.033 0.009 AE 4.47 0.113 0.018 7031.5 0.979 0.281
Boiler 1.00 0.981 0.013 4154.1 0.588 0.164 Tugs ME 0.19 0.005 0.015 436.6 0.040 0.012
Table 5-4: 2013 Marine Vessel Emissions (tonnes/year) Based on Activity Type
Year Ship Type Activity NOx SOx CO VOC PM10 PM2.5
2013 Bulk
At Berth (Facility) 33.37 14.68 3.68 0.99 2.16 2.00
Maneuvering (Supply Chain) 3.03 0.84 0.38 0.19 0.15 0.14
In Transit (Supply Chain) 5.31 1.38 0.45 0.18 0.23 0.20
Anchoring (Supply Chain) 134.42 59.46 14.86 4.01 8.72 8.03
Tugs Maneuvering (Supply Chain) 9.40 0.23 0.75 0.32 0.16 0.15
Year Ship Type Activity DPM Black
Carbon CO2 NH3 CH4 N2O
2013 Bulk
At Berth (Facility) 2.00 0.285 1498.0 0.004 0.211 0.059
Maneuvering (Supply Chain) 0.14 0.005 103.3 0.002 0.012 0.004
In Transit (Supply Chain) 0.20 0.006 185.6 0.007 0.019 0.006
Anchoring (Supply Chain) 8.03 1.171 5997.2 0.013 0.853 0.239
Tugs Maneuvering (Supply Chain) 0.15 0.004 333.2 0.011 0.032 0.009
Cargill Emission Inventory

Cargill Emission Inventory Report Page 19
Table 5-5: 2020 Marine Vessel Emissions (tonnes/year) Based on Activity Type
Year Ship Type Activity NOx SOx CO VOC PM10 PM2.5
2020 Bulk
At Berth (Facility) 35.85 1.69 4.24 1.15 0.93 0.85
Maneuvering (Supply Chain) 4.37 0.13 0.58 0.29 0.10 0.09
In Transit (Supply Chain) 7.75 0.22 0.69 0.29 0.14 0.13
Anchoring (Supply Chain) 191.51 9.17 22.86 6.14 4.99 4.59
Tugs Maneuvering (Supply Chain) 11.70 0.29 0.99 0.42 0.21 0.19
Year Ship Type Activity DPM Black
Carbon CO2 NH3 CH4 N2O
2020 Bulk
At Berth (Facility) 0.85 0.166 1721.0 0.004 0.24 0.069
Maneuvering (Supply Chain) 0.09 0.008 158.9 0.003 0.02 0.005
In Transit (Supply Chain) 0.13 0.007 285.5 0.010 0.03 0.009
Anchoring (Supply Chain) 4.57 0.917 9238.6 0.027 1.31 0.371
Tugs Maneuvering (Supply Chain) 0.19 0.005 436.5 0.015 0.04 0.012
Auxiliary engines are much smaller in size than main engines; therefore, they usually do not contribute a large proportion of the total exhaust emissions that a ship releases while maneuvering and in transit. However, at least one auxiliary engine is used at all times while ships are at berth and anchoring. Since berthed and anchoring times are much longer than the amount of time required to travel to/from the Strait of Georgia (Salish Sea), total auxiliary engine emissions constitute a dominant portion of the annual emissions attributable to CMVs.
5.1.2 Rail Transport
Cargill is adjacent to the Lynn yard, so rail emissions from Lynn yard to Cargill and on-site switching locomotive activities were considered in this study. Fleet characterization and assumption were derived from the previous studies conducted in the area (SENES 2014)6.
6 PCT Emission Inventory, prepared for Port Metro Vancouver, 2014, p30.
Cargill Emission Inventory

Cargill Emission Inventory Report Page 20
The general rail locomotive emissions calculation is as follows:
Emissions (tonnes/year) = [Emission Rate (kg/hr-locomotive) * Traffic Count (trips/period) * Locomotives (locomotives/trip) * Operating Time (hr) * 1 tonne/ 1000g]
or
Emissions (tonnes/year) = [Emission Rate (kg/hr-locomotive) * Operating Time (hr) * 1 tonne/ 1000g]
Emission rates for four of the CACs assessed, namely CO, NOx, VOCs, and PM, were derived from the U.S. EPA locomotive emission standards for switcher locomotives as published in the Locomotive Emissions Monitoring Program 2010. The emission rates for SO2 and GHGs (CH4 and N2O) were similarly derived from an EF provided by RAC. The emission rate for ammonia was assumed to be 0.005 g/L, identical to the rate used for the Delta port Third Berth Project (SENES 2007). CAC and GHG emission rates are detailed below. Emissions from shuttle wagon (250HP – which will be eliminated in the future scenario) were not included in this emission inventory due to their relatively minor contributions.
Table 5-6 summarizes the emission standards for the various tiers of switcher locomotives as adopted by the U.S. EPA. It has been assumed that locomotive engines purchased for Canadian railroads would be manufactured to the same emission standards because all locomotive engines used in Canada are now manufactured in the United States.
Table 5-6: U.S. EPA Locomotive Emission Standards
Tier Year of Manufacture Date Emission Standard (g/bhp-hr)
CO NOx VOCs PM Switch Locomotives
0 1973-2001 2010 8.0 11.8 2.10 0.26 1 2002-2004 2010 2.5 11.0 1.20 0.26 2 2005-2010 2013 2.4 8.1 0.60 0.13 3 2011-2014 2011 2.4 5.0 0.60 0.10 4 2015 or later 2015 2.4 1.3 0.14 0.03 Note: g/bhp-hr = grams per brake horsepower hour
Emission rates for all CACs of concern on a per locomotive basis are summarized in Table 5-7. Emission rates were calculated for each locomotive type and each engine setting based on the above emission standards and the appropriate locomotive total effective power (see Appendix B.2 for details). If multiple tiers of locomotives are expected to be in use, the above emission standards were blended based on the fleet tier mixture. As per the U.S. EPA recommendations for estimating emissions from compression ignition engines (U.S. EPA 2008), the relative PM2.5 emissions are estimated to be 97% of PM emissions while PM10 emissions are assumed to be equal to PM emissions.
Cargill Emission Inventory

Cargill Emission Inventory Report Page 21
SO2 emissions are not dependent upon the locomotive tier rating, but rather the sulphur content in the fuel. The Sulphur in Diesel Fuel Regulations limited fuel sulphur content to 15 ppm in 2012 for the production or import of fuel for use in locomotives. Although the sulphur limit for the sales of diesel fuel for use in locomotives is 500 ppm until 2012, the limit in 2015 is 15 ppm. Most of the SO2 emissions from Cargill were determined to come from ships and the additional contribution from the locomotives would be marginal. As a result, the sulphur content was assumed to be 15 ppm for 2013 and 2020. Emission rates were calculated for each locomotive type and each engine setting based on these EFs and the appropriate locomotive total effective fuel consumption shown in Appendix B.2.
Table 5-7: Locomotive CAC Emission Rates
Engine Setting
Horizon Year
Emission Rate (kg/hr) CO NOx VOC PM10 PM2.5 SO2 NH3
Switch
Idle 2013 2.43E-01 3.59E-01 6.38E-02 7.90E-03 7.67E-03 6.23E-04 1.28E-04 2020 7.60E-02 3.34E-01 3.65E-02 7.90E-03 7.67E-03 2.77E-04 1.28E-04
Work On-site/Off-site
2013 6.38E+00 9.42E+00 1.68E+00 2.07E-01 2.01E-01 3.51E-03 7.19E-04 2020 2.00E+00 8.78E+00 9.58E-01 2.07E-01 2.01E-01 3.51E-03 7.19E-04
Duty Cycle 2013 1.25E+00 1.84E+00 3.28E-01 4.06E-02 3.94E-02 1.14E-03 2.33E-04 2020 3.90E-01 1.72E+00 1.87E-01 4.06E-02 3.94E-02 1.14E-03 2.33E-04
Average 2013 2.62E+00 3.87E+00 6.91E-01 8.52E-02 8.27E-02 1.76E-03 3.60E-04 2020 8.22E-01 3.61E+00 3.94E-01 8.52E-02 8.27E-02 1.64E-03 3.60E-04
Table 5-8 summarizes the Rail Association of Canada’s EFs (RAC) applicable to all tiers of switching locomotives.
Table 5-8: Rail Association of Canada EFs
EF (kg/L)
CO2 CH4 N2O
2.66E+00 1.50E-04 1.10E-03
Cargill Emission Inventory
Cargill Emission Inventory Report Page 22
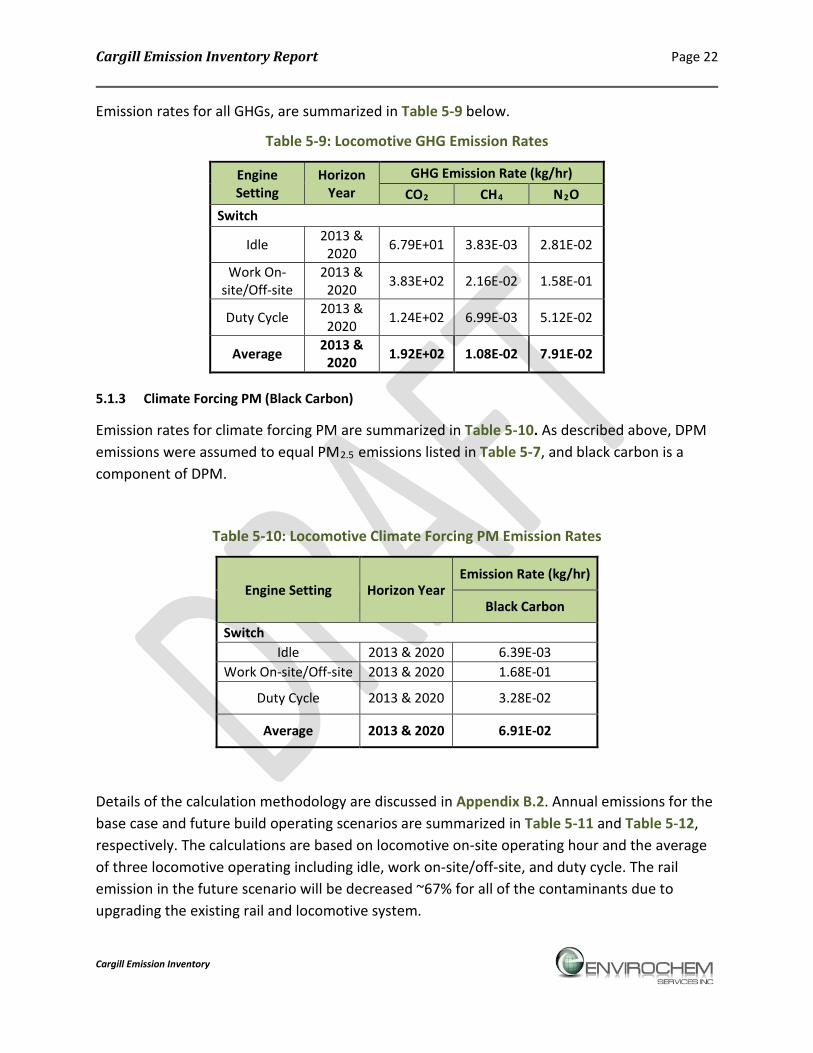
Emission rates for all GHGs, are summarized in Table 5-9 below.
Table 5-9: Locomotive GHG Emission Rates
Engine Setting
Horizon Year
GHG Emission Rate (kg/hr) CO2 CH4 N2O
Switch
Idle 2013 & 2020 6.79E+01 3.83E-03 2.81E-02
Work On-site/Off-site
2013 & 2020 3.83E+02 2.16E-02 1.58E-01
Duty Cycle 2013 & 2020 1.24E+02 6.99E-03 5.12E-02
Average 2013 & 2020 1.92E+02 1.08E-02 7.91E-02
5.1.3 Climate Forcing PM (Black Carbon)
Emission rates for climate forcing PM are summarized in Table 5-10. As described above, DPM emissions were assumed to equal PM2.5 emissions listed in Table 5-7, and black carbon is a component of DPM.
Table 5-10: Locomotive Climate Forcing PM Emission Rates
Engine Setting Horizon Year Emission Rate (kg/hr)
Black Carbon
Switch Idle 2013 & 2020 6.39E-03
Work On-site/Off-site 2013 & 2020 1.68E-01
Duty Cycle 2013 & 2020 3.28E-02
Average 2013 & 2020 6.91E-02
Details of the calculation methodology are discussed in Appendix B.2. Annual emissions for the base case and future build operating scenarios are summarized in Table 5-11 and Table 5-12, respectively. The calculations are based on locomotive on-site operating hour and the average of three locomotive operating including idle, work on-site/off-site, and duty cycle. The rail emission in the future scenario will be decreased ~67% for all of the contaminants due to upgrading the existing rail and locomotive system.
Cargill Emission Inventory

Cargill Emission Inventory Report Page 23
Table 5-11: Rail Emissions in the Base Case (2013) (tonnes/year)
Locomotive Type Activity NOx SOx CO VOC PM10 PM2.5
2013 (350 day x 6 hr)
Switch
Idle, Work On-site/Off-
site, Duty Cycle
8.13E+0 3.70E-03 5.51E+00 1.45E+00 1.79E-01 1.74E-01
Locomotive Type Activity DPM Black
Carbon CO2 NH3 CH4 N2O
2013 (350 day x 6 hr) Switch
Idle, Work On-site/Off-
site, Duty Cycle
1.74E-01 1.45E-01 4.03E+02 7.56E-04 2.30E-02 1.65E-01
Table 5-12: Rail Emissions the Future (2020) (tonnes/year)
Locomotive Type Activity NOx SOx CO VOC PM10 PM2.5
2020 (350 day x 2 hr) Switch
Idle, Work On-site/Off-
site, Duty Cycle
2.53E+00 1.15E-03 5.75E-01 2.76E-01 5.96E-02 5.79E-02
Locomotive Type Activity DPM Black
Carbon CO2 NH3 CH4 N2O
2020 (350 day x 2 hr) Switch
Idle, Work On-site/Off-
site, Duty Cycle
5.79E-02 4.84E-02 1.34E+02 2.52E-04 7.56E-03 5.54E-02
5.2 ON-SITE MATERIAL HANDLING EQUIPMENT AND STATIONARY SOURCE
The general approach for estimating emissions from Cargill grain handling operations sources was determined using the following equation:
Emission Rate = (Emission Factor) x (Activity) x (1-Control Efficiency) ER = EF x Activity x (1-CE) where: EF = Emission factor CE = Emission control efficiency Activity = Activity data, e.g. raw material processed/handled
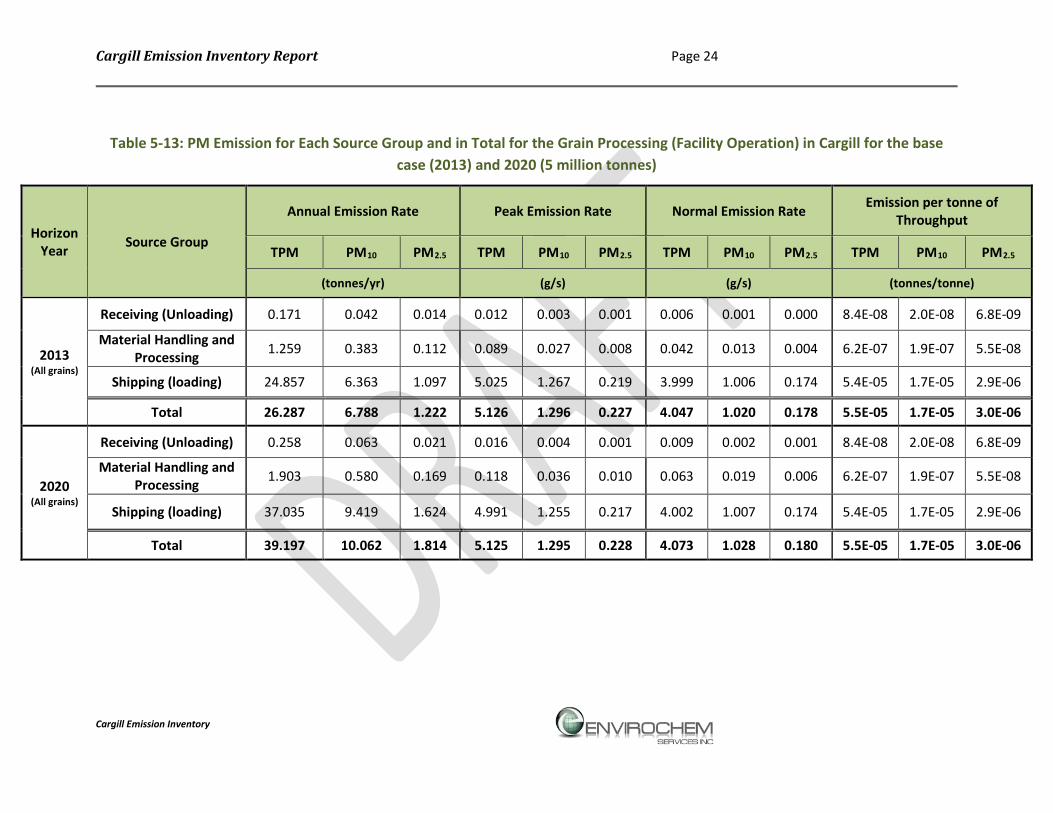
Table 5-13 presents PM emission for each source group and in total for the grain processing (facility operation) in Cargill for the base case (2013) and 2020 (5 million tonnes). The source activity, parameters, calculation methodologies, and resulting emission rates used in the emission inventory are presented in Appendix B:
Cargill Emission Inventory
Cargill Emission Inventory Report Page 24
Table 5-13: PM Emission for Each Source Group and in Total for the Grain Processing (Facility Operation) in Cargill for the base case (2013) and 2020 (5 million tonnes)
Horizon Year Source Group
Annual Emission Rate Peak Emission Rate Normal Emission Rate Emission per tonne of Throughput
TPM PM10 PM2.5 TPM PM10 PM2.5 TPM PM10 PM2.5 TPM PM10 PM2.5
(tonnes/yr) (g/s) (g/s) (tonnes/tonne)
2013 (All grains)
Receiving (Unloading) 0.171 0.042 0.014 0.012 0.003 0.001 0.006 0.001 0.000 8.4E-08 2.0E-08 6.8E-09
Material Handling and Processing 1.259 0.383 0.112 0.089 0.027 0.008 0.042 0.013 0.004 6.2E-07 1.9E-07 5.5E-08
Shipping (loading) 24.857 6.363 1.097 5.025 1.267 0.219 3.999 1.006 0.174 5.4E-05 1.7E-05 2.9E-06
Total 26.287 6.788 1.222 5.126 1.296 0.227 4.047 1.020 0.178 5.5E-05 1.7E-05 3.0E-06
2020 (All grains)
Receiving (Unloading) 0.258 0.063 0.021 0.016 0.004 0.001 0.009 0.002 0.001 8.4E-08 2.0E-08 6.8E-09
Material Handling and Processing 1.903 0.580 0.169 0.118 0.036 0.010 0.063 0.019 0.006 6.2E-07 1.9E-07 5.5E-08
Shipping (loading) 37.035 9.419 1.624 4.991 1.255 0.217 4.002 1.007 0.174 5.4E-05 1.7E-05 2.9E-06
Total 39.197 10.062 1.814 5.125 1.295 0.228 4.073 1.028 0.180 5.5E-05 1.7E-05 3.0E-06
Cargill Emission Inventory
Cargill Emission Inventory Report Page 25
6 SUMMARY OF RESULTS
The emission estimates used for 2013 and 2020 incorporated activity levels for marine vessels, rail locomotives, material handling and processing at Cargill, and also consider changes in fuel quality and the normal replacement of older equipment with newer equipment that meets new emission technology standards. The estimated emissions in each time period were based on detailed consideration of activity levels for each type of equipment associated with changes in commodity handling capacity.
Table 6-1 presents projected site-wide emissions, while Table 6-2 presents projected off-site emissions associated with the rail locomotive and ship supply chains and Table 6-3 presents indirect emission associated with the consumption of electricity at the Cargill site.
Cargill Emission Inventory

Cargill Emission Inventory Report Rev. 1 Page 26
Table 6-1: Projected Site-wide (On site) Cargill Air Emissions in 2013 and 2020
Year Emission Source
Contaminant (tonnes for assessment year)
CO NOx VOC SO2 PM10 PM2.5 DPM Climate Forcing PM as CO2e GHG as CO2e
NH3 BC CO2e20 CO2e100 CO2 CH4 N2O CO2e20 CO2e100
2013 (Base case)
Ships 3.678 33.371 0.994 14.683 2.162 2.002 2.002 0.285 912.0 256.5 1498.0 0.211 0.059 1532.0 1522.8 0.0044
Rail 5.510 8.130 1.450 0.004 0.179 0.174 0.174 0.145 464.0 130.5 403.2 0.023 0.165 449.4 453.2 0.0008
Material Handling - - - - 6.788 1.222 - - - - - - - - - -
Total 9.188 41.501 2.444 14.687 9.129 3.398 2.176 0.430 1376.0 387.0 1901.2 0.234 0.224 1981.4 1976.0 0.0052
2020 Future
Ships 4.237 35.854 1.147 1.695 0.926 0.847 0.850 0.166 529.9 149.0 1721.0 0.243 0.069 1760.4 1749.8 0.0039
Rail 0.575 2.530 0.276 0.001 0.060 0.058 0.058 0.048 154.9 43.6 134.0 0.008 0.055 149.5 150.8 0.0003
Material Handling - - - - 10.062 1.814 - - - - - - - - - -
Total 4.812 38.384 1.423 1.696 11.047 2.719 0.908 0.214 684.7 192.6 1855.0 0.250 0.125 1909.9 1900.6 0.0042
% Change * -48 -8 -42 -88 21 -20 -58 -50 -50 -50 -2 7 -45 -4 -4 -20 Note: (-) = <0.0001
*Negative numbers show decreasing of emission in the future (2020, 5 million tonnes) in compare to the base case (2013).
Table 6-2: Expected Off-Site Supply Chain Air Emissions at Cargill
Year Emission Source
Contaminant (tonnes for assessment year)
CO NOx VOC SO2 PM10 PM2.5 DPM Climate Forcing PM as CO2e GHG as CO2e
NH3 BC CO2e20 CO2e100 CO2 CH4 N2O CO2e20 CO2e100 2013
(Base case) Ships 16.44 152.15 4.70 61.90 9.26 8.51 8.51 1.19 3795.1 1067.4 6619.3 0.92 0.26 6767.0 6727.1 0.0335
2020 Future Ships 25.11 215.33 7.14 9.81 5.44 5.00 4.98 0.94 2999.0 843.5 10119.5 1.41 0.40 10346.6 10285.4 0.0550
% Change 53 42 52 -84 -41 -41 -42 -21 -21 -21 53 53 54 53 53 64 Note: Marine supply chain extends to the Strait of Georgia (Salish Sea)
Table 6-3: Expected Indirect Air Emissions from Electricity Usage at Cargill
Year
Contaminant (tonnes for assessment year)
CO NOx VOC SO2 PM10 PM2.5 DPM Climate Forcing PM as CO2e GHGs as CO2e
NH3 BC CO2 CH4 N2O CO2e20 CO2e100
2013 (Base case) 8.80 4.12 0.27 0.38 1.07 0.94 0.008 0.00013 0.41 0.12 259.0 0.030 0.007 264.0 262.0 0.0011
2020 (Future) 12.20 5.70 0.37 0.52 1.48 1.30 0.012 0.00018 0.57 0.16 359.0 0.041 0.010 365.0 363.0 0.0016
% Change 39 38 38 38 38 39 38 38 38 38 39 38 38 38 39 39
Cargill Emission Inventory

Cargill Emission Inventory Report Page 27
7 CONCLUSIONS
Cargill commissioned an assessment of total facility air emissions due to the industrial activity associated with the handling and transport of commodities at the Cargill site for the years 2013 and 2020. The assessment was completed to support a planned expansion at Cargill. The Emission Inventory presented in this report supports a Project Permit Application to Port Metro Vancouver to accommodate the proposed new expansion.
Total annual air emissions were estimated for Cargill operations for the years 2013 and 2020 by using projected annual ship, rail and site activities at the facility. The 3,200,000 tonnes of grain moved in the year 2013 was chosen as the base case, (2013 corresponds to the year prior to the expansion grains handling activities); the year 2020 was chosen as the expected future peak with 5,000,000 tonnes of grain annually.
To minimize the environmental impacts associated with the proposed expansion, it is proposed to achieve the expansion primarily by de-bottlenecking the existing rail track system, thereby allowing more trains to be unloaded per year. This upgrade would realize the following benefits to the community:
• Improve efficiency of rail car movement through the terminal with track configuration modifications designed to meet plant productivity goals
o More cars per service = fewer rail car deliveries/day, = significantly less diesel locomotive noise and exhaust emissions
o Significantly reduced car impact noises caused by releasing partial car strings
o Reduced noise and exhaust emissions by eliminating the need for a 250 BHP diesel shuttle wagon
• Enhance the safe work environment by switch automation, lighting improvements, and worker access corridors
The changes will also enable more efficient rail and marine vessel scheduling, which is a vital component of terminal planning logistics.
Cargill uses the best available control technologies (BACT), designed to maintain good air quality in the area. This inventory demonstrates that over the period 2013 to 2020 essentially all air emissions will be reduced (e.g. CO by 48%, NOx by 8%, VOC by 42%, SOx by 88%, PM2.5 by 20%, DPM by 58% ...) with the exception of CH4 and PM10. On-site PM10, which derives primarily from fugitive grain-dust emissions released during ship-loading and material handling, is projected to increase by 21%. This is less than the increase in production due to offsetting reductions in marine (berthing) emissions and rail emissions resulting from the more efficient management of rail unloading. CH4 emissions are projected to increase by 7% due to increased ship berthing fuel combustion.
Cargill Emission Inventory

Cargill Emission Inventory Report Page 28
Modern grain harvesting has significantly reduced the amount of dust that is associated with grain handling. Hence present and future fugitive grain-dust emissions released during ship-loading are expected to be lower than those shown here, which are based upon emission measurements taken during 2001.
Emissions of CO, NOx, VOC, NH3, and GHG from off-site ship movements increase due to the increasing in ship traffic necessary to move the larger volume of grain. However changes (tightening) in fuel sulphur standards and new combustion (control) technologies result in reduced emissions of SOx (down by 84%) and PM10 PM2.5 and DPM all (down by ~40%). The rail emissions in the future scenario are projected to be decreased ~67% for all of the contaminants due to upgrading the existing rail and locomotive system.
In summary the potential increase in on-site (operational) emissions resulting from the greater throughput are generally offset by improvements in fuel quality and technologies and by more efficient rail and locomotive management. Thus there is no need, nor requirement to amend or modify the existing Metro Vancouver Air Discharge Permit. Increased ship traffic and electrical use are projected to generate higher emissions offsite. Figure 7-1 and Figure 7-2 show the contribution of each activity in the total on-site emission for the base case and future scenarios.
Figure 7-1: Percentage that Each On-site Activity Contributes to Emissions (2013)
0%
20%
40%
60%
80%
100%
Contribution of Each On-site Activity to Emissions (2013)
Marine Activity Rail Activity Material Handling
Cargill Emission Inventory

Cargill Emission Inventory Report Page 29
Figure 7-2: Percentage that Each On-site Activity Contributes to Emissions (2020)
0%
20%
40%
60%
80%
100%
Contribution of Each Onsite Activity to Emissions (2020)
Marine Activity Rail Activity Material Handling
Cargill Emission Inventory

Cargill Emission Inventory Report Page 30
APPENDICES
Cargill Emission Inventory

Cargill Emission Inventory Report Page A-1
APPENDIX A: AIR QUALITY AND LAND USE
Cargill Emission Inventory
Cargill Emission Inventory Report Page A-2
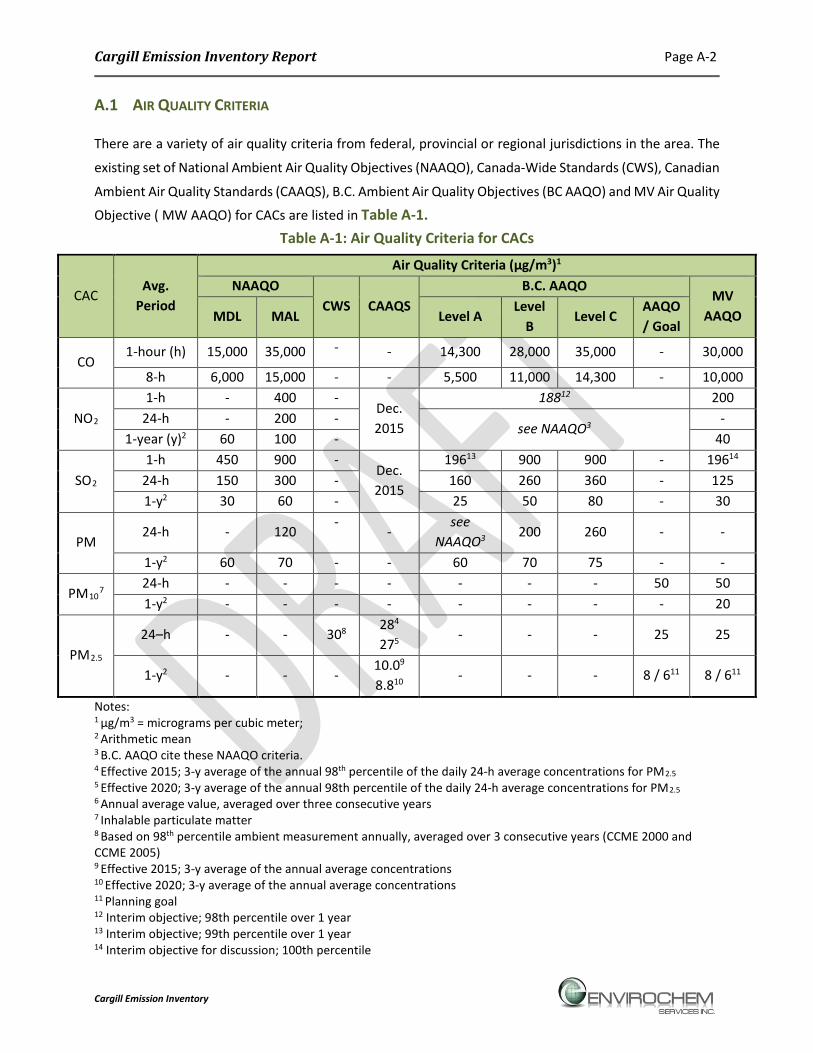
A.1 AIR QUALITY CRITERIA
There are a variety of air quality criteria from federal, provincial or regional jurisdictions in the area. The
existing set of National Ambient Air Quality Objectives (NAAQO), Canada-Wide Standards (CWS), Canadian
Ambient Air Quality Standards (CAAQS), B.C. Ambient Air Quality Objectives (BC AAQO) and MV Air Quality
Objective ( MW AAQO) for CACs are listed in Table A-1. Table A-1: Air Quality Criteria for CACs
CAC Avg.
Period
Air Quality Criteria (µg/m3)1 NAAQO
CWS CAAQS B.C. AAQO
MV AAQO MDL MAL Level A
Level B
Level C AAQO / Goal
CO 1-hour (h) 15,000 35,000 - - 14,300 28,000 35,000 - 30,000
8-h 6,000 15,000 - - 5,500 11,000 14,300 - 10,000
NO2 1-h - 400 -
Dec. 2015
18812 200 24-h - 200 -
see NAAQO3 -
1-year (y)2 60 100 - 40
SO2 1-h 450 900 -
Dec. 2015
19613 900 900 - 19614 24-h 150 300 - 160 260 360 - 125 1-y2 30 60 - 25 50 80 - 30
PM 24-h - 120
- -
see NAAQO3
200 260 - -
1-y2 60 70 - - 60 70 75 - -
PM107
24-h - - - - - - - 50 50 1-y2 - - - - - - - - 20
PM2.5 24–h - - 308
284
275 - - - 25 25
1-y2 - - - 10.09 8.810 - - - 8 / 611 8 / 611
Notes: 1 µg/m3 = micrograms per cubic meter; 2 Arithmetic mean 3 B.C. AAQO cite these NAAQO criteria. 4 Effective 2015; 3-y average of the annual 98th percentile of the daily 24-h average concentrations for PM2.5 5 Effective 2020; 3-y average of the annual 98th percentile of the daily 24-h average concentrations for PM2.5 6 Annual average value, averaged over three consecutive years 7 Inhalable particulate matter 8 Based on 98th percentile ambient measurement annually, averaged over 3 consecutive years (CCME 2000 and CCME 2005) 9 Effective 2015; 3-y average of the annual average concentrations 10 Effective 2020; 3-y average of the annual average concentrations 11 Planning goal 12 Interim objective; 98th percentile over 1 year 13 Interim objective; 99th percentile over 1 year 14 Interim objective for discussion; 100th percentile
Cargill Emission Inventory

Cargill Emission Inventory Report Page A-3
A.2 EXISTING AIR QUALITY
Metro Vancouver (MV), in conjunction with the Fraser Valley Regional District, operates a network of 27
air quality monitoring stations in the Lower Fraser Valley (LFV). Information gathered from the LFV Air
Quality Monitoring Network is used to support and guide MV’s Air Quality Management Plan (AQMP) for
the region.
The stations include North Vancouver Second Narrows (T6) is in relatively close proximity to the Cargill site
and supply chain operations. Figure A-1 and Figure A-2 depict the location the station relative to the
Cargill site.
Air quality monitoring stations will include emissions associated with traffic from on-road vehicles,
commercial and home heating (including fireplaces and wood or gas stoves), gas-powered gardening
equipment and backyard barbeques, restaurants, heavy-duty diesel-power construction and demolition
equipment, fishing boats and other small craft transiting through Burrard Inlet.
Figure A-1: Metro Vancouver Ambient Air Quality Monitoring Network
Cargill Emission Inventory

Cargill Emission Inventory Report Page A-4
Figure A-2: Location of MV station T6
Designated as Station T6 in the MV network of monitoring stations, the monitoring site is located in the
District of North Vancouver near Second Narrows Bridge. The T6 station provides monitoring data for CO,
NO, NO2, SO2, O3 and PM2.5, as well as the meteorological parameters of wind speed and wind direction.
The station was established in 1977 and is designated as “Special Purpose Industry’ since it is situated on
an active works yard adjacent to many nearby industrial emissions sources, and may not be representative
of air quality in surrounding residential areas.
MV provided five years of monitoring data for the T6 station site from January 2008 to the end of
December 2012. The meteorological data indicates that air flow is largely channeled parallel to the Central
Harbour of Burrard Inlet, with prevailing winds from the east and northeast as shown in Figure A-3. There
is a lower frequency of winds from the west, and relatively few winds from the north, northwest,
southwest and southeast.
Cargill Emission Inventory

Cargill Emission Inventory Report Page A-5
Figure A-3: 2008-2012 Wind rose for Station T6 Second Narrows
A summary of air quality observations over the period January 2008 to December 2012 for all wind
directions are provided in Table A-2 for Station T6 in North Vancouver.
Cargill Emission Inventory

Cargill Emission Inventory Report Page A-6
Table A-2: Summary of Air Quality Observations at Station T6 (all wind directions)
Year Parameter Concentration (µg/m3)
CO NO2 SO2 PM2.5 1-h 8-h 1-h 24-h 1-h 24-h 24-h
2008-2012
Max 3,062.5 978.1 141.9 62.4 183.8 40.5 24.6 Mean 217.0 216.9 26.8 26.9 5.4 5.4 4.9
Median 186.3 196.5 23.7 25.8 2.4 3.6 4.2 98th
percentile 512.4 455.6 65.4 49.9 37.0 20.7 13.6
2008 Max 3,062.5 768.5 130.1 59.4 90.6 26.7 19.8
Mean 247.2 246.4 28.4 28.5 5.1 5.2 5.3 Median 221.2 225.6 26.8 26.9 2.7 3.7 4.8
2009 Max 2,235.7 978.1 122.4 62.4 183.8 40.5 24.6
Mean 239.4 238.4 28.4 28.4 5.4 5.4 5.8 Median 209.6 214.0 24.9 27.6 2.7 3.6 4.8
2010 Max 1,036.4 628.8 120.5 62.3 119.9 32.3 11.7
Mean 222.7 222.7 26.2 26.1 5.9 5.9 3.7 Median 198.0 205.2 23.0 24.7 2.4 4.2 3.2
2011 Max 2,259.0 941.7 124.3 56.0 127.6 40.3 10.8
Mean 177.6 177.2 25.4 25.5 5.4 5.4 4.5 Median 163.0 167.4 22.4 24.7 1.6 3.6 4.2
2012 Max 2,072.7 609.9 141.9 56.1 83.9 31.3 18.3
Mean 198.8 198.7 25.8 25.8 5.3 5.3 4.9 Median 174.7 186.3 22.4 24.4 1.9 3.3 4.2
Air Quality Criteria1 14,300 5,500 200 200 196 125 25 Note: 1 The most stringent of criteria.
Cargill Emission Inventory
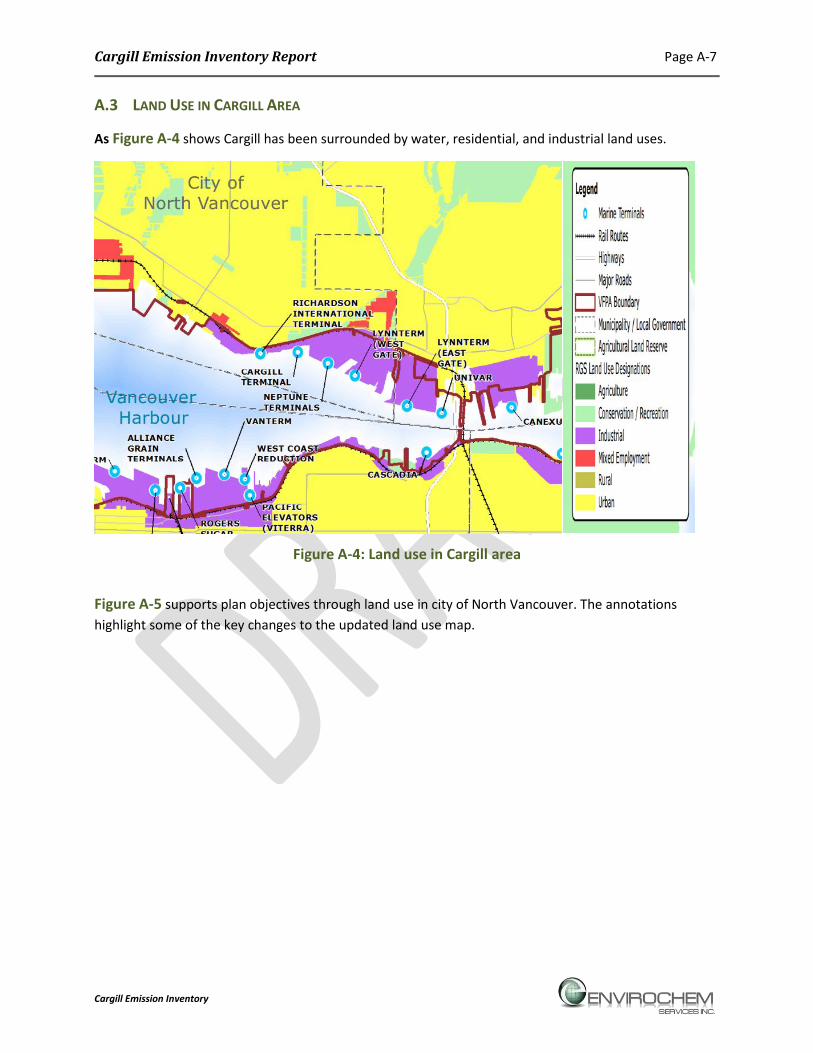
Cargill Emission Inventory Report Page A-7
A.3 LAND USE IN CARGILL AREA
As Figure A-4 shows Cargill has been surrounded by water, residential, and industrial land uses.
Figure A-4: Land use in Cargill area
Figure A-5 supports plan objectives through land use in city of North Vancouver. The annotations highlight some of the key changes to the updated land use map.
Cargill Emission Inventory

Cargill Emission Inventory Report Page A-8
Figure A-5: Plan objectives through land use in city of North Vancouver
Cargill Emission Inventory

Cargill Emission Inventory Report Page B-1
APPENDIX B: DETAILED EMISSION RATE CALCULATIONS
Cargill Emission Inventory
Cargill Emission Inventory Report Page B-2
B.1 MARINE EMISSIONS
Calculating emissions from ships involves the consideration of a number of parameters including:
• Ship size;
• Number of ships;
• Activity times;
• Ship locations;
• Ship age;
• Types and sizes of engines;
• The loading on the engines; and
• EFs and changes in EFs over time due to changes in fuel or engine technologies.
The general calculation of emissions for ships is as follows:
Emissions (tonnes/y) = [EF (g/kW-hr) * Traffic Count (ships/y) * Ship Engine Size (kW/ship) * Load Factor * Activity time (hr) * 1 tonne/ 1000,000 g]
Ships are considered to have three sources of combustion emissions: the main engine (ME), the auxiliary engines (AE), and the Boilers. Ship activities include maneuvering (from the Strait of Georgia (Salish Sea) to Cargill) and at berth. Load factors are specific to the activity and vary by ship type and combustion source, while EFs are primarily dependent on the type of ship and the combustion source. In some cases, where control technologies are mandated through legislation, EFs are also dependent on horizon year.
Tugboats are also included in the assessment and are discussed separately. Parameters used in the assessment are discussed in greater detail in the following sections.
B.1.1 Ship Size
Cargill provided the ship capacities presented in Table B-1. The corresponding main engine powers are based on propulsion trends in bulk carriers and tankers (Man Diesel 2004)7 and AE powers were calculated using the auxiliary power to main power ratio of 0.29 for bulk ships (Senes 2012 Deltaport).
7 Man Diesel 2004, Propulsion Trends, in Bulk Carriers, 2004 p11.
Cargill Emission Inventory
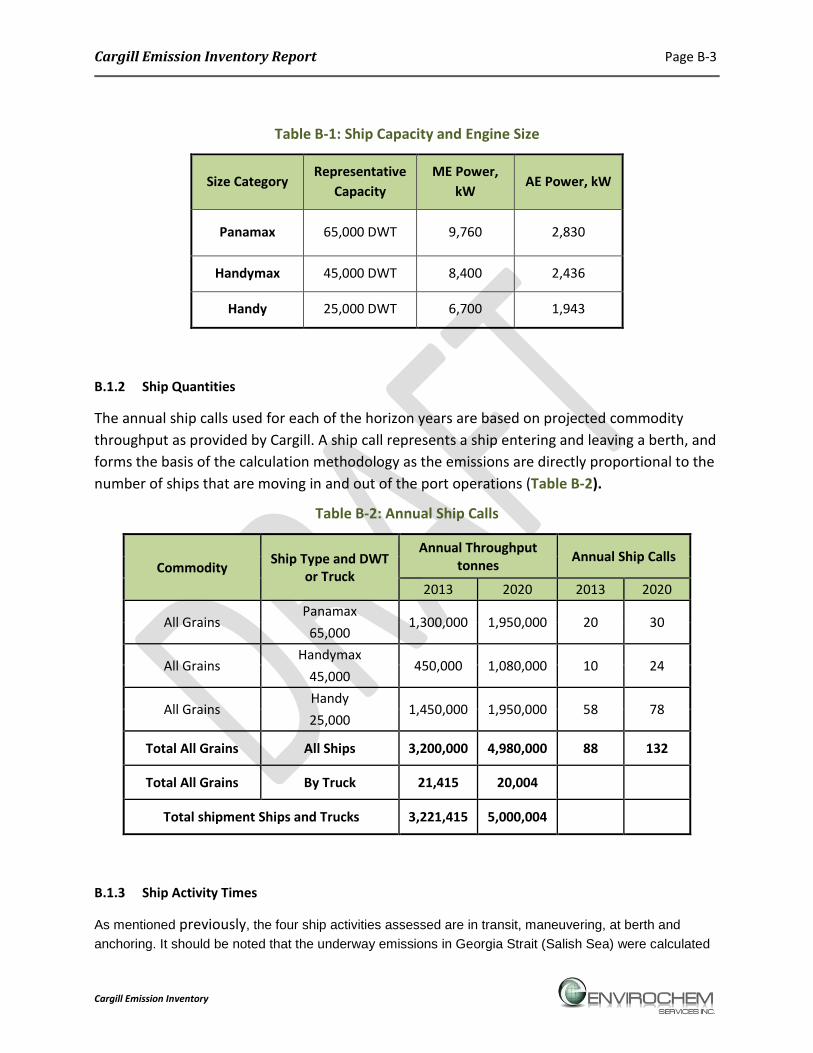
Cargill Emission Inventory Report Page B-3
Table B-1: Ship Capacity and Engine Size
Size Category Representative
Capacity ME Power,
kW AE Power, kW
Panamax 65,000 DWT 9,760 2,830
Handymax 45,000 DWT 8,400 2,436
Handy 25,000 DWT 6,700 1,943
B.1.2 Ship Quantities
The annual ship calls used for each of the horizon years are based on projected commodity throughput as provided by Cargill. A ship call represents a ship entering and leaving a berth, and forms the basis of the calculation methodology as the emissions are directly proportional to the number of ships that are moving in and out of the port operations (Table B-2).
Table B-2: Annual Ship Calls
Commodity Ship Type and DWT or Truck
Annual Throughput tonnes Annual Ship Calls
2013 2020 2013 2020
All Grains Panamax
1,300,000 1,950,000 20 30 65,000
All Grains Handymax
450,000 1,080,000 10 24 45,000
All Grains Handy
1,450,000 1,950,000 58 78 25,000
Total All Grains All Ships 3,200,000 4,980,000 88 132
Total All Grains By Truck 21,415 20,004
Total shipment Ships and Trucks 3,221,415 5,000,004
B.1.3 Ship Activity Times
As mentioned previously, the four ship activities assessed are in transit, maneuvering, at berth and anchoring. It should be noted that the underway emissions in Georgia Strait (Salish Sea) were calculated
Cargill Emission Inventory

Cargill Emission Inventory Report Page B-4
for a slow cruise vessel speed of 12 knots for all vessels (2005-2006 BC Ocean-Going Vessel Emissions Inventory Chamber of Shipping (COS) of BC)8. Since the Harbour Operations Manual does not specify a numerical speed limit in this portion of the harbour, the speed of all Cargill vessels in this portion of maneuvering mode operations has been assumed to be 9 knots for all Cargill vessels.
As ships approach the Cargill site, they slow down further to 6 knots, and this is often where tugs will begin to escort the ships to the Cargill berths. Some ships may receive escorts through the inner harbour to the Lions Gate Bridge, but this is not always the case. To be conservative, and to account for some ships that may have tug escorts, it has been assumed that tugs assist the ships all the way to Cargill. When berths are not available, ships wait in anchor mode in English Bay, west of the Lions Gate Bridge. Ships remain at berth while loading and unloading. Each of the four ship activities discussed above is associated with an applicable time frame for the activity.
Activity times for ships at berth were based on berth occupancy data provided by Cargill for 2013, and adjusted linearly according to throughput/ship changes for the relevant horizon years. Activity times for anchoring are provided by Cargill. The data provided is conservative in that some of the ships that stop at Cargill also call on other terminals. Due to the built-in conservatism and lack of anchoring data for 2020, the 2013 data is assumed to be representative for the base case and future horizon years. Activity times for ships and tugs maneuvering, and for ships in transit, are based on distances travelled, tug assist distances, and ship speed. These parameters, summarized in Figure B-1, were estimated based on professional knowledge and information provided by PMV from the Second Narrows MRA Procedures (PMV, 2010) and the Harbour Operations Manual (PMV, 2014).
8 BC Ocean-Going Vessel Emissions Inventory Chamber of Shipping (COS) of BC, 2007. In Appendix E. max vessel speed of 15 knots was considered for the bulk vessels in Strait of Georgia. For this study vessel speed of 12 knots for all vessels in this area was assumed.
Cargill Emission Inventory

Cargill Emission Inventory Report Page B-5
Figure B-1: Distance, Speed and Tug Assist Information for Ships in Transit and Manoeuvring
Activity times for all four ship activities and for tug maneuvering are summarized in Table B-3.
Table B-3: Ship Activities Times
Commodity Ship Type and DWT
Activity Times (hr/ship call)
In Transit Maneuvering At Berth Anchoring
2013 2020 2013 2020 2013 2020 2013 2020
All Grains Panamax
1 1 2 2 68 68 168 168 65,000
All Grains Handymax
1 1 2 2 56 56 168 168 45,000
All Grains Handy
1 1 2 2 33 33 168 168 25,000
B.1.4 Load Factors (LFs)
Load factors (LFs) vary by ship activity and engine type, but are constant across horizon years. LFs for ships are presented in Table B-4 based on MEIT 4.0 and the Chamber of Shipping of British Columbia emission inventory study completed in 2007 (COS 2007). The MEIT assumes
(Salish Sea)
Cargill Emission Inventory

Cargill Emission Inventory Report Page B-6
engine load factors of 55% for bulk carriers under slow cruise conditions. However, main engine load factors were more closely consistent with a 40% load (COS 2007)9. Therefore, emissions for underway vessels in slow cruise mode in this inventory calculated based on 40% main engine load factor.
Table B-4: Ship Load Factors
Ship Type Engine Type
In Transit Maneuvering Berthed Anchoring
Bulk ME 0.40 0.10 - - AE 0.30 0.30 0.29 0.28
The MEs are not operational while ships are berthed or anchoring. As per MEIT10 low load adjustment factors are applicable to marine engines at reduced load movements such as maneuvering. Scale factors by air contaminant in Table B-5 are used to adjust emission rates for all ships maneuvering with an ME load of 0.1.
Table B-5: Low Load (ME load 0.1) Scale Factors
NOx SOx CO HC PM10 PM2.5 DPM Black
Carbon CO2 NH3 CH4 N2O
1.22 1.0 2.0 2.83 1.38 1.38 1.38 1.38 1.0 1.0 1.0 1.0
B.1.5 Ship EFs
Ship EFs are from MEIT 4.0 and have the following considerations.
• All ships run on Heavy Fuel Oil (HFO) (note that the type of fuel used is controlled by shipping companies);
• EFs vary by ship type;
• EFs vary by engine type;
• Some EFs vary by horizon year; and
• Some EFs vary by ship age.
EFs for CO, VOC, CO2, NH3, CH4 and N2O are from MEIT 4.0 (Table B-6). Black Carbon EFs are from an emission monitoring program conducted on a Post-Panamax Class container ship off the coast of California by Murphy et al. (2009). It should be noted that 4-stroke and 2-stroke engines are respectively represented for AE and ME.
9 Chamber of Shipping of British Columbia emission inventory study completed in 2007, p26. 10 MEIT, 2010, p24.
Cargill Emission Inventory

Cargill Emission Inventory Report Page B-7
Table B-6: CO, VOC, CO2, CH4, NH3, N2O, Black Carbon EFs, g/kW-hr
Engine Type CO VOCs CO2 NH3 CH4 N2O Black
Carbon
AE
(4-stroke) 1.10 0.40 670 0.001 0.06 0.017 0.007
ME
(2-stroke) 1.40 0.60 621 0.021 0.06 0.017 0.007
These EFs are constant by horizon year and ship type. EFs for the remaining contaminants (NOx, SOx, PM10, and PM2.5) are calculated per the methodology discussed in the next sections.
B.1.6 NOx EFs
NOx EFs vary with horizon year to reflect improved technology in newer ships that results in lower NOx emissions. These improvements are driven by the International Maritime Organization (IMO) limits on NOx emissions from ship exhausts (Table B-7). Ships operating within 200 miles of the coastline of North America are considered to be within the zone of the North American Emission Control Area as of 2012.
Table B-7: IMO NOx Emission Limits
Tier Engine RPM ‘n’ NOx Emission
Limit (g/kW-hr)
Fuel Standard (max. sulphur
content) Year Relevance
Tier 1 n < 130 17.0
n/a 2000 Applies to all vessels
constructed during or after this year.
n = 130-2000 45 x n-0.2 n > 2000 9.8
SOx /FUEL
n/a n/a 1.00% 2010 Only applies to ECA areas.
Tier 2 n < 130 14.4
n/a 2011 Applies to all vessels
constructed during or after this year.
n = 130-2000 44 x n-0.23 n > 2000 7.7
SOx /FUEL
n/a n/a 0.10% 2015 Only applies to ECA areas.
Tier 3 n < 130 3.4
n/a 2021 Only applies to vessels operating in ECA area. n = 130-2000 9 x n-0.2
n > 2000 1.96 SOx
/FUEL n/a n/a 0.50% 2020 Applies to all areas, pending a 2018 fuel availability review.
Cargill Emission Inventory

Cargill Emission Inventory Report Page B-8
Average of ship age distribution assumed based on a report on propulsion trends in bulk carriers (Man Diesel 200411, SENES 2014)) is presented in Table B-8.
Table B-8: Ship Age Distribution
Fleet Age 2013 2020 0 to 5 years 20% 25%
6 to 10 years 20% 20% 11-15 years 15% 15% 16-20 years 15% 15% >20 years 30% 25%
NOx Tier allocation and the corresponding NOx EF (per Table B-7) by ship age are shown in Table B-9.
Table B-9: NOx Tier and EF by Ship Age
Ship Age Ranges (years)
Ave Construction Year
Tier NOx EF
Base case (2013)
Future (2020)
Base case (2013)
Future (2020)
Base case (2013) Future (2020) ME AE ME AE
0-5 2010 2015 Tier I Tier II 17 12.5 14.4 10.1 6-10 2005 2010 Tier I Tier I 17 12.5 17 12.5
11-15 2000 2005 Tier I Tier I 17 12.5 17 12.5 16-20 1995 2000 pre-Tier Tier I 18.1 14.7 17 12.5 >20 1985 1990 pre-Tier pre-Tier 18.1 14.7 18.1 14.7
Notes: Tier I-II ME EFs were obtained from Table B-7 Tier I-II AE EFs were calculated with equations from Table B-7 assuming AEs run at 600 rpm (SENES report 2014) Pre-Tier EFs were obtained from MEIT12.
Based on the ship age distribution (Table B-8), a weighted average of the EFs in Table B-9 is used in this assessment (Table B-10).
Table B-10: NOx EFs
Base case (2013) Future (2020) ME AE ME AE
17.5 13.5 16.6 12.5
11 Man Diesel 2004, Propulsion Trends, in Bulk Carriers, 2004 p7. 12 MEIT, 2010, P24.
Cargill Emission Inventory
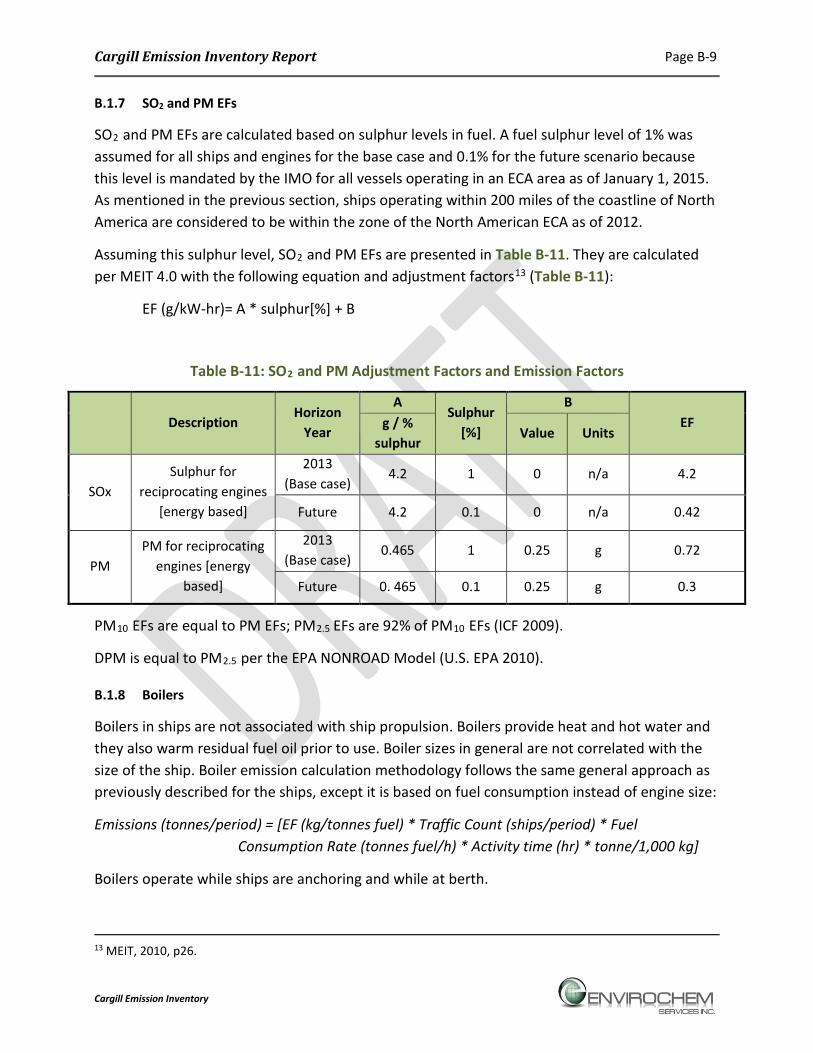
Cargill Emission Inventory Report Page B-9
B.1.7 SO2 and PM EFs
SO2 and PM EFs are calculated based on sulphur levels in fuel. A fuel sulphur level of 1% was assumed for all ships and engines for the base case and 0.1% for the future scenario because this level is mandated by the IMO for all vessels operating in an ECA area as of January 1, 2015. As mentioned in the previous section, ships operating within 200 miles of the coastline of North America are considered to be within the zone of the North American ECA as of 2012.
Assuming this sulphur level, SO2 and PM EFs are presented in Table B-11. They are calculated per MEIT 4.0 with the following equation and adjustment factors13 (Table B-11):
EF (g/kW-hr)= A * sulphur[%] + B
Table B-11: SO2 and PM Adjustment Factors and Emission Factors
Description Horizon
Year
A Sulphur
[%]
B EF g / %
sulphur Value Units
SOx Sulphur for
reciprocating engines [energy based]
2013 (Base case)
4.2 1 0 n/a 4.2
Future 4.2 0.1 0 n/a 0.42
PM PM for reciprocating
engines [energy based]
2013 (Base case)
0.465 1 0.25 g 0.72
Future 0. 465 0.1 0.25 g 0.3
PM10 EFs are equal to PM EFs; PM2.5 EFs are 92% of PM10 EFs (ICF 2009).
DPM is equal to PM2.5 per the EPA NONROAD Model (U.S. EPA 2010).
B.1.8 Boilers
Boilers in ships are not associated with ship propulsion. Boilers provide heat and hot water and they also warm residual fuel oil prior to use. Boiler sizes in general are not correlated with the size of the ship. Boiler emission calculation methodology follows the same general approach as previously described for the ships, except it is based on fuel consumption instead of engine size:
Emissions (tonnes/period) = [EF (kg/tonnes fuel) * Traffic Count (ships/period) * Fuel Consumption Rate (tonnes fuel/h) * Activity time (hr) * tonne/1,000 kg]
Boilers operate while ships are anchoring and while at berth.
13 MEIT, 2010, p26.
Cargill Emission Inventory
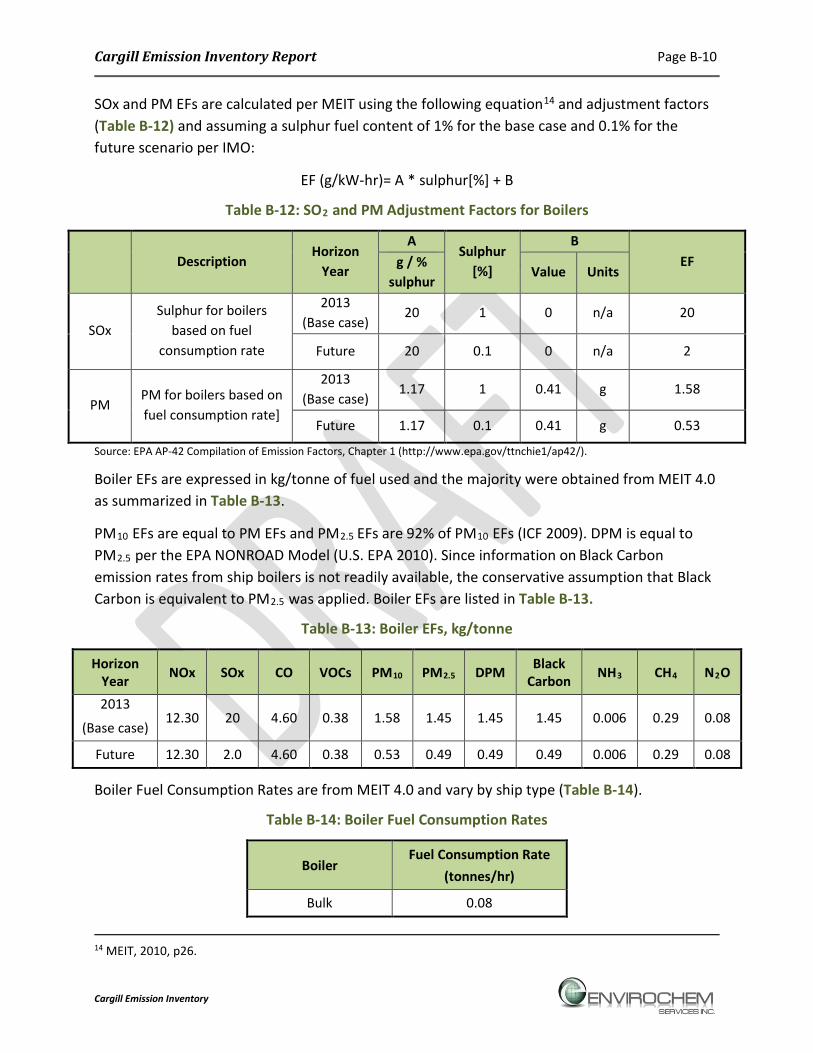
Cargill Emission Inventory Report Page B-10
SOx and PM EFs are calculated per MEIT using the following equation14 and adjustment factors (Table B-12) and assuming a sulphur fuel content of 1% for the base case and 0.1% for the future scenario per IMO:
EF (g/kW-hr)= A * sulphur[%] + B
Table B-12: SO2 and PM Adjustment Factors for Boilers
Description Horizon
Year
A Sulphur
[%]
B EF g / %
sulphur Value Units
SOx Sulphur for boilers
based on fuel consumption rate
2013 (Base case)
20 1 0 n/a 20
Future 20 0.1 0 n/a 2
PM PM for boilers based on fuel consumption rate]
2013 (Base case)
1.17 1 0.41 g 1.58
Future 1.17 0.1 0.41 g 0.53
Source: EPA AP-42 Compilation of Emission Factors, Chapter 1 (http://www.epa.gov/ttnchie1/ap42/).
Boiler EFs are expressed in kg/tonne of fuel used and the majority were obtained from MEIT 4.0 as summarized in Table B-13.
PM10 EFs are equal to PM EFs and PM2.5 EFs are 92% of PM10 EFs (ICF 2009). DPM is equal to PM2.5 per the EPA NONROAD Model (U.S. EPA 2010). Since information on Black Carbon emission rates from ship boilers is not readily available, the conservative assumption that Black Carbon is equivalent to PM2.5 was applied. Boiler EFs are listed in Table B-13.
Table B-13: Boiler EFs, kg/tonne
Horizon Year NOx SOx CO VOCs PM10 PM2.5 DPM Black
Carbon NH3 CH4 N2O
2013
(Base case) 12.30 20 4.60 0.38 1.58 1.45 1.45 1.45 0.006 0.29 0.08
Future 12.30 2.0 4.60 0.38 0.53 0.49 0.49 0.49 0.006 0.29 0.08
Boiler Fuel Consumption Rates are from MEIT 4.0 and vary by ship type (Table B-14).
Table B-14: Boiler Fuel Consumption Rates
Boiler Fuel Consumption Rate
(tonnes/hr)
Bulk 0.08
14 MEIT, 2010, p26.
Cargill Emission Inventory
Cargill Emission Inventory Report Page B-11
B.1.9 Tugboats
Tugboats assist the ships in maneuvering to and from the port. The tugboat emission calculation methodology follows the same general approach as previously described for the ships:
Emissions (tonnes/period) = [EF (g/kW-hr) * Traffic Count (tugs/period) * Tug Engine Size (kW/tug) * Load Factor * Activity time (hr) * 1 tonne/ 1000,000 g]
Assumptions include:
• Fuel type is marine diesel oil;
• Main engine load of 32% during maneuvering; and
• Engine power of 4500 kW.
Activity Times
Seven and a half hours of tug maneuvering per ship call is based on the following assumptions:
• 3 tugs per ship during approach;
• 2 tugs per ship during departure
• During approach and departure, tugs escort ships between the west end of the,
which take approximately 1.5 hours (as per Figure B-1)
LFs
A load factor of 32% during maneuvering is from a report evaluating tugboats prepared for CARB by the University of California (Varalakshmi, 2010). The 32% maneuvering load factor is further supported by the U.S. EPA’s Current Methodologies in Preparing Mobile Source Port-Related Emission Inventories (ICF 2009).
EFs
EFs were reviewed from a number of sources including previous studies completed for Roberts Bank terminals. MEIT 4.0 EFs are for international ocean going tugs and therefore not suitable for the harbour tugs in this study. Instead, NOx, CO, VOC, CH4, and N2O EFs for Category 1 Harbour Vehicles from the EPA’s Current Methodologies in Preparing Mobile Source Port-Related Emission Inventories (ICF 2009) are considered representative of the most current knowledge (Table B-15). To be conservative, Tier 0 EFs are used for the base case (2013) year (indicating all tugs were built prior to 1999), and Tier 1 EFs are used for the 2020 Future year (indicating all tugs were built 2000-2003). An NH3 EF specific to tugs is not available from the
Cargill Emission Inventory
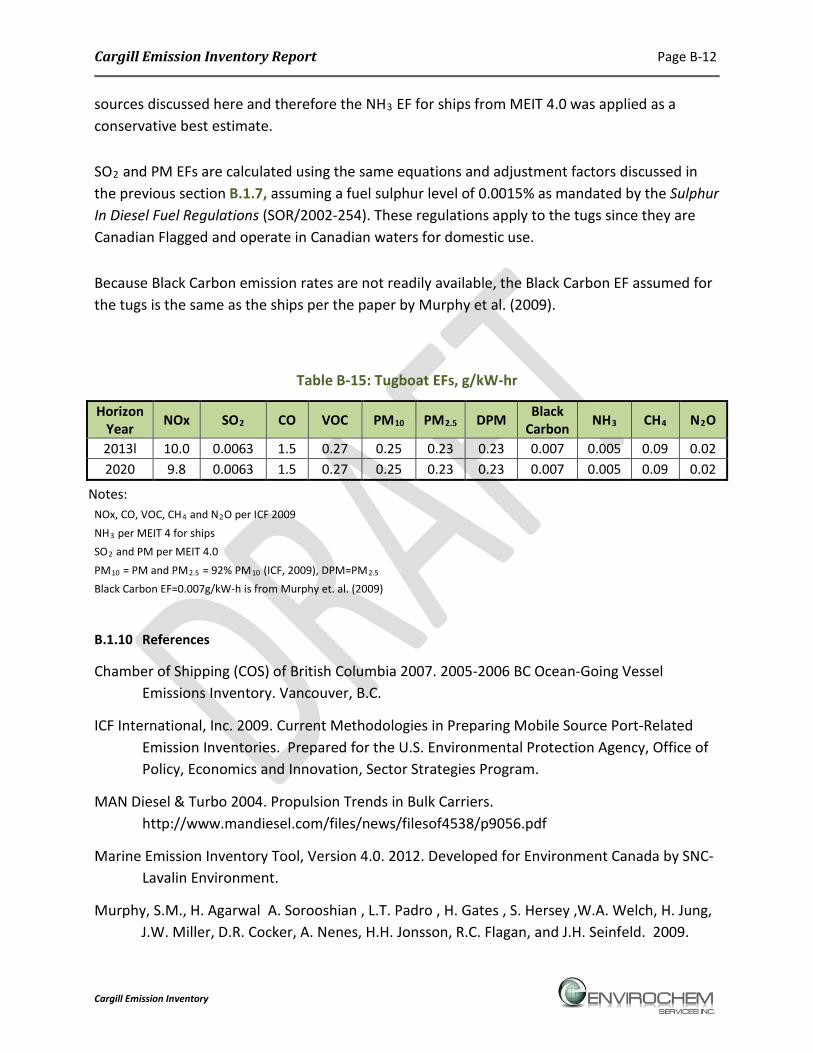
Cargill Emission Inventory Report Page B-12
sources discussed here and therefore the NH3 EF for ships from MEIT 4.0 was applied as a conservative best estimate.
SO2 and PM EFs are calculated using the same equations and adjustment factors discussed in the previous section B.1.7, assuming a fuel sulphur level of 0.0015% as mandated by the Sulphur In Diesel Fuel Regulations (SOR/2002-254). These regulations apply to the tugs since they are Canadian Flagged and operate in Canadian waters for domestic use.
Because Black Carbon emission rates are not readily available, the Black Carbon EF assumed for the tugs is the same as the ships per the paper by Murphy et al. (2009).
Table B-15: Tugboat EFs, g/kW-hr
Horizon Year NOx SO2 CO VOC PM10 PM2.5 DPM Black
Carbon NH3 CH4 N2O
2013l 10.0 0.0063 1.5 0.27 0.25 0.23 0.23 0.007 0.005 0.09 0.02 2020 9.8 0.0063 1.5 0.27 0.25 0.23 0.23 0.007 0.005 0.09 0.02
Notes: NOx, CO, VOC, CH4 and N2O per ICF 2009 NH3 per MEIT 4 for ships SO2 and PM per MEIT 4.0 PM10 = PM and PM2.5 = 92% PM10 (ICF, 2009), DPM=PM2.5 Black Carbon EF=0.007g/kW-h is from Murphy et. al. (2009)
B.1.10 References
Chamber of Shipping (COS) of British Columbia 2007. 2005-2006 BC Ocean-Going Vessel Emissions Inventory. Vancouver, B.C.
ICF International, Inc. 2009. Current Methodologies in Preparing Mobile Source Port-Related Emission Inventories. Prepared for the U.S. Environmental Protection Agency, Office of Policy, Economics and Innovation, Sector Strategies Program.
MAN Diesel & Turbo 2004. Propulsion Trends in Bulk Carriers. http://www.mandiesel.com/files/news/filesof4538/p9056.pdf
Marine Emission Inventory Tool, Version 4.0. 2012. Developed for Environment Canada by SNC-Lavalin Environment.
Murphy, S.M., H. Agarwal A. Sorooshian , L.T. Padro , H. Gates , S. Hersey ,W.A. Welch, H. Jung, J.W. Miller, D.R. Cocker, A. Nenes, H.H. Jonsson, R.C. Flagan, and J.H. Seinfeld. 2009.
Cargill Emission Inventory

Cargill Emission Inventory Report Page B-13
Comprehensive Simultaneous Shipboard and Airborne Characterization of Exhaust from a Modern Container Ship at Sea. Environmental Science & Technology, 43(13):4626-4640.
Port Metro Vancouver 2014. Harbour Operations Manual. Vancouver Fraser Port Authority, Vancouver, B.C.
SENES Consultants Limited 2012, Air Quality Assessment Deltaport Terminal, Road and Rail Improvement Project, Appendix A, prepared for Port Metro Vancouver, Vancouver, B.C., 2012
SENES Consultants Limited 2014. DRAFT Air Quality Assessment Roberts Bank Terminal 2, prepared for Port Metro Vancouver, Vancouver, B.C., 2014(DRAFT)
SENES Consultants Limited 2014. PCT Emission Inventory, prepared for Port Metro Vancouver, Vancouver, B.C., 2014.
SNC-Lavalin 2012. 2010 National Marine Emission Inventory for Canada. Prepared for Environment Canada and Transport Canada.
Starcrest Consulting Group, LLC 2012. 2011 Puget Sound Maritime Air Emissions Inventory. Prepared for the Puget Sound Maritime Air Forum,
U.S. Environmental Protection Agency. 2010. Exhaust and Crankcase EFs for Nonroad Engine Modeling - Compression-Ignition. Office of Transportation and Air Quality, Assessment and Standards Division. EPA-420-R-10-018, NR-009d, July 2010
Varalakshmi, J. et. al. 2010. Evaluating Emission Benefits of a Hybrid Tug Boat. Prepared for California Air Resources Board.
Cargill Emission Inventory

Cargill Emission Inventory Report Page B-14
B.2 RAIL LOCOMOTIVE EMISSIONS
The assessment of emissions from rail locomotives considered on-site switch yard locomotive activities. Emission projections from rail locomotives involved the consideration of a number of variables to define locomotive emission rates and activity levels including:
Emission Rate Variables
• Locomotive Parameters
• Power Rating
• Load Factors and Duty Cycle
• Fuel Consumption
• Fleet Tier Mixtures
• EFs
Activity Level Variables
• Traffic Counts
• Activity Time
• Idle Time
• Distance and Speed Travelled
Some of these variables, such as the traffic counts, have been derived and projected into the future using future throughput data from Cargill records and are therefore, considered to be accurate, site specific parameters. For other variables, a number of assumptions were applied in order to complete the calculations of emissions from locomotive operations. These include projections of how the fleet of locomotives in use at the Cargill could change over time and switcher locomotive duty cycle.
Approaches to calculating emission rates varied depending on the contaminant being assessed. In general, emission rates were defined for each contaminant based on EFs and locomotive parameters and varied based on the horizon year, locomotive type, and locomotive engine setting (i.e., idle, Work On-site/Off-site or switch yard duty cycle).
Cargill Emission Inventory

Cargill Emission Inventory Report Page B-15
The general rail locomotive emissions calculation is as follows:
Emissions (tonnes/year) = [Emission Rate (kg/hr-locomotive) * Traffic Count (trips/period) * Locomotives (locomotives/trip) * Operating Time (hr) * 1 tonne/ 1000g]
or Emissions (tonnes/year) = [Emission Rate (kg/hr-locomotive) * Operating Time (hr) * 1 tonne/
1000g]
Due to some of the assumptions that had to be applied in order to calculate rail locomotive emissions, there is a possibility that future emissions are over-estimated. For instance, work fuel consumption rates were assumed to be constant overall assessment years, whereas more efficient engines are anticipated to use less fuel in the future. Emission increases over time were generally tracked to increased activity at the sites, while decreases were generally noted when the quality of engines and fuel (e.g., sulphur content) improved.
B.2.1 Locomotive Parameters
The parameters used to estimate the rail locomotive EFs include power rating, load factors, fuel consumption rates, duty cycles, and projected locomotive fleet tier mixtures for each horizon year. The switchers in the locomotive fleet are assumed to have power ratings of 3000 hp. Load factors, fuel consumption rates and duty cycles used in the assessment as well as the calculated total effective power and fuel consumption rates are listed in Table B-16 for switcher locomotives.
The Railway Association of Canada (RAC) duty cycle for switcher locomotives as published in the Locomotive Emissions Monitoring Program 2010 (RAC) was used for all yard switcher locomotives that break apart and reassemble unit trains at Cargill. The load factors for the throttle settings were derived from the emission inventory prepared for the Port of Long Beach, CA (Starcrest 2011). It was assumed that the unit train delivery locomotives operate 50% in notch 2 and 50% in notch 3 from the Lynn yard switchyard to the Cargill site (SENES 2014).
The assumed fuel consumption rates for switcher work (all horizon years) and idle (horizon year 2013) were derived from Measurement and Evaluation of Fuels and Technologies for Passenger Rail Service in North Carolina (Department of Civil, Construction, and Environmental Engineering North Carolina State University 2012).
Cargill Emission Inventory

Cargill Emission Inventory Report Page B-16
Table B-16: Switcher Locomotive Effective Power and Fuel Consumption
Parameter Throttle Notch Position
Total Idle 1 2 3 4 5 6 7 8
Dynamic Brake
Load factor1 (%)
0.8 4.7 14.2 27.8 42.0 57.3 72.5 89.7 105.3 3.8 -
Effective Power [hp]
30 135 345 705 1050 1455 1920 2550 3000 30 -
Effective Fuel Consumption
[L/hr]2, 3 25.5 49.7 93.4 194.2 295.4 385.7 544.9 665.9 761.1 25.5 -
Idle
Percent of Time in Notch Position
100.0 - - - - - - - - - 100
Effective Power [hp]
30.4 - - - - - - - - - 30.4
Effective Fuel Consumption
[L/hr] 2, 3 25.5 - - - - - - - - - 25.5
Delivery Work On-Site/off-site
Percent of Time in Notch Position
- - 50.0 50.0 - - - - - - 100
Effective Power [hp]
- - 269.8 528.2 - - - - - - 798.0
Effective Fuel Consumption
[L/hr] 2, 3 - - 46.7 97.1 - - - - - - 143.8
Yard Switching Work On-Site
Duty Cycle (%)4 84.9 5.4 4.2 2.2 1.4 0.6 0.3 0.2 0.6 0.2 100
Effective Power [hp]
25.8 9.6 22.7 23.2 22.3 13.1 8.3 6.8 24.0 0.3 156
Effective Fuel Consumption
[L/hr] 2, 3 21.7 2.7 3.9 4.3 4.1 2.3 1.6 1.3 4.6 0.1 46.6
Sources: 1 The Port of Long Beach 2007 Air Emissions Inventory (Starcrest 2009) 2 Measurement and Evaluation of Fuels and Technologies for Passenger Rail Service in North Carolina (Department of Civil, Construction, and Environmental Engineering North Carolina State University 2012) 3 L/hr = liters per hour 4 Locomotive Emissions Monitoring Program 2010
Cargill Emission Inventory

Cargill Emission Inventory Report Page B-17
All switch locomotives in 2013 are assumed to be older engines meeting Tier 0 emission levels. Switch locomotives will be conservatively assumed to be replaced with Tier 1 engines and remain unchanged as Tier 1 engines for the balance of the horizon years (2020) (PCT Emission Inventory, SENES 2014). The projected locomotive fleet tier mixtures for each locomotive type and each horizon year are summarized in Table B-17.
Table B-17: Locomotive Fleet Tier Mixtures
Horizon Year Tier 0 Tier 1 Tier 2
Switcher Locomotives
2013 100% 0% 0%
2020 0% 100% 0% Source: B.C. Rail
B.2.2 Locomotive Activities
The number of switch yard locomotives on-site, formed the basis of the calculation methodology as the emissions are directly proportional to the number of locomotives. The emissions are also dependent on the operational time of each locomotive at each engine setting and an assumed travel speed.
B.2.3 References
SENES Consultants Limited 2007. Baseline Air Contaminant Emissions for Deltaport and Terminal 2 in 2005 and 2021. Prepared for the Vancouver Fraser Port Authority (currently Port Metro Vancouver), Vancouver, B.C.
SENES Consultants Limited 2014. PCT Emission Inventory, prepared for Port Metro Vancouver, Vancouver, B.C., 2014.
SENES Consultants Limited 2014. DRAFT Air Quality Assessment Roberts Bank Terminal 2, prepared for Port Metro Vancouver, Vancouver, B.C., March 2014(DRAFT)
Starcrest Consulting Group, LLC 2009. The Port of Long Beach Air Emissions Inventory - 2007. Prepared for the Port of Long Beach, California.
Starcrest Consulting Group, LLC 2011. Port of Los Angeles Inventory of Air Emissions - 2010. Prepared for the Port of Los Angeles, California.
Transport Canada. 2010. Locomotive Emissions Regulations Consultation Paper. http://www.tc.gc.ca/eng/policy/acs-consultations-paper-2158.htm
U.S. Environmental Protection Agency 2008. Regulatory Impact Analysis: Control of Emissions of Air Pollution from Locomotive Engines and Marine Compression Ignition Engines Less than 30 Liters per Cylinder. Assessment and Standards Division. Office of Transportation and Air Quality. EPA420-R-08-001a
Cargill Emission Inventory

Cargill Emission Inventory Report Page B-18
B.3 ON-SITE MATERIAL HANDLING AND STATIONARY SOURCE EQUIPMENT AND ELECTRICITY
B.3.1 Material Handling and Processing
The emission factors were extracted from U.S. EPA, AP-42, Chapter 9: Food and Agricultural Industries, Grain Elevators & Processes (section 9.9.1), Update May 2003 except for ship loading which is based on Dec 31, 2001 "CASCADIA TERMINAL GRAIN DUST STUDY (II)" report by Genesis Engineering Inc. (TPM emission factor = 0.0111 kg/tonne and 25% and 4.3% of TPM emission factor for PM10 and PM2.5 respectively).
Based on the conducted investigations by Genesis Engineering Inc. for this site, the PM emission from Canola handling is about 5% of any other grains such as Wheat emission, so 5% of the emission factors from emission rate for the grains other than Canola were used to calculate the PM emission rate from Canola.
Baghouse control efficiencies for the different size fractions of particulate matter were derived from the U.S. EPA, AP-42 Appendix B.2 document (99.5% control of PM10 and 99% control of PM2.5).
The general dust emissions calculation is as follows:
Emissions (tonnes/year) = [Annual Throughput (tonnes) * Emission Factor (kg/tonne) * (1-control efficiency) * 1tonne/1000kg]
The summary of the result are presented in Table B-18, Table B-19, Table B-20, and Table B-21.
B.3.2 References
Genesis Engineering Inc., Cascadia Terminal Grain Dust Study (II), Dec 31, 2001
U.S. EPA, AP-42, Chapter 9: Food and Agricultural Industries, Grain Elevators & Processes (section 9.9.1), Update May 2003
U.S. EPA, Compilation of Air Pollutant Emission Factors (AP-42) Volume I: Fifth Edition.
U.S. EPA, AP-42. 1990. Appendix B.2 Generalized Particle Size Distributions Document. http://www.epa.gov/ttn/chief/ap42/appendix/appb-2.pdf
Cargill Emission Inventory
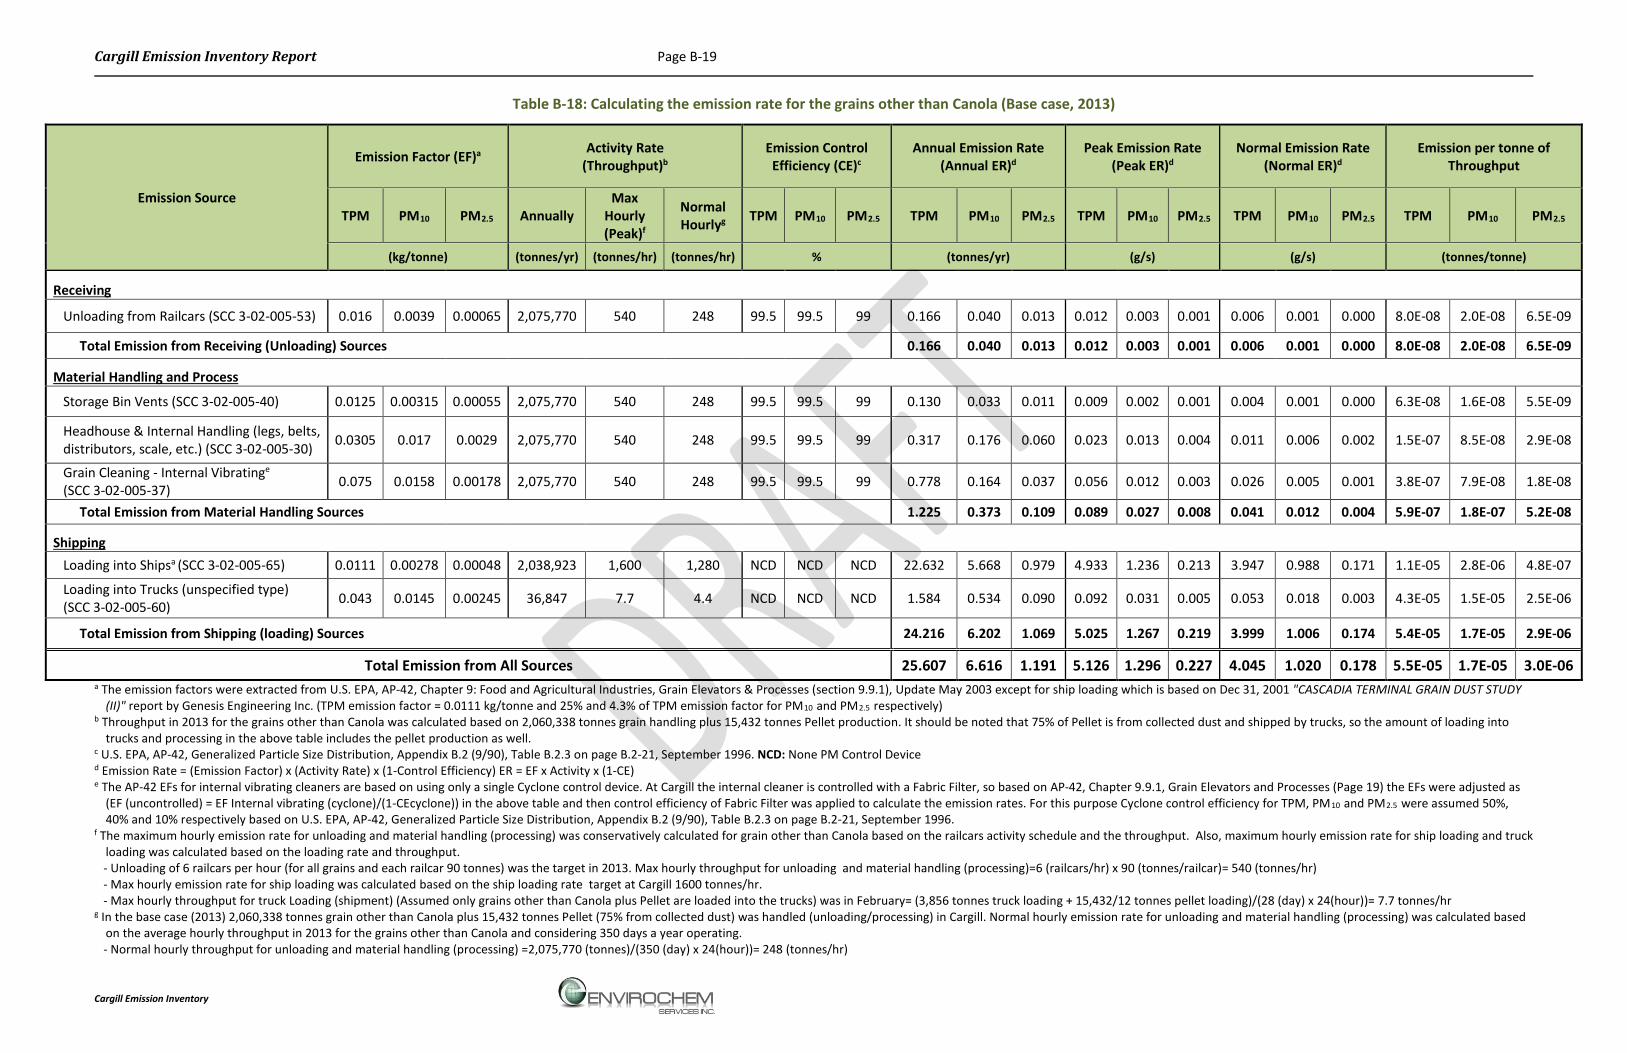
Cargill Emission Inventory Report Page B-19
Table B-18: Calculating the emission rate for the grains other than Canola (Base case, 2013)
Emission Source
Emission Factor (EF)a Activity Rate (Throughput)b
Emission Control Efficiency (CE)c
Annual Emission Rate (Annual ER)d
Peak Emission Rate (Peak ER)d
Normal Emission Rate (Normal ER)d
Emission per tonne of Throughput
TPM PM10 PM2.5 Annually Max
Hourly (Peak)f
Normal Hourlyg TPM PM10 PM2.5 TPM PM10 PM2.5 TPM PM10 PM2.5 TPM PM10 PM2.5 TPM PM10 PM2.5
(kg/tonne) (tonnes/yr) (tonnes/hr) (tonnes/hr) % (tonnes/yr) (g/s) (g/s) (tonnes/tonne)
Receiving
Unloading from Railcars (SCC 3-02-005-53) 0.016 0.0039 0.00065 2,075,770 540 248 99.5 99.5 99 0.166 0.040 0.013 0.012 0.003 0.001 0.006 0.001 0.000 8.0E-08 2.0E-08 6.5E-09
Total Emission from Receiving (Unloading) Sources 0.166 0.040 0.013 0.012 0.003 0.001 0.006 0.001 0.000 8.0E-08 2.0E-08 6.5E-09
Material Handling and Process
Storage Bin Vents (SCC 3-02-005-40) 0.0125 0.00315 0.00055 2,075,770 540 248 99.5 99.5 99 0.130 0.033 0.011 0.009 0.002 0.001 0.004 0.001 0.000 6.3E-08 1.6E-08 5.5E-09
Headhouse & Internal Handling (legs, belts, distributors, scale, etc.) (SCC 3-02-005-30) 0.0305 0.017 0.0029 2,075,770 540 248 99.5 99.5 99 0.317 0.176 0.060 0.023 0.013 0.004 0.011 0.006 0.002 1.5E-07 8.5E-08 2.9E-08
Grain Cleaning - Internal Vibratinge (SCC 3-02-005-37) 0.075 0.0158 0.00178 2,075,770 540 248 99.5 99.5 99 0.778 0.164 0.037 0.056 0.012 0.003 0.026 0.005 0.001 3.8E-07 7.9E-08 1.8E-08
Total Emission from Material Handling Sources 1.225 0.373 0.109 0.089 0.027 0.008 0.041 0.012 0.004 5.9E-07 1.8E-07 5.2E-08
Shipping Loading into Shipsa (SCC 3-02-005-65) 0.0111 0.00278 0.00048 2,038,923 1,600 1,280 NCD NCD NCD 22.632 5.668 0.979 4.933 1.236 0.213 3.947 0.988 0.171 1.1E-05 2.8E-06 4.8E-07
Loading into Trucks (unspecified type) (SCC 3-02-005-60) 0.043 0.0145 0.00245 36,847 7.7 4.4 NCD NCD NCD 1.584 0.534 0.090 0.092 0.031 0.005 0.053 0.018 0.003 4.3E-05 1.5E-05 2.5E-06
Total Emission from Shipping (loading) Sources 24.216 6.202 1.069 5.025 1.267 0.219 3.999 1.006 0.174 5.4E-05 1.7E-05 2.9E-06
Total Emission from All Sources 25.607 6.616 1.191 5.126 1.296 0.227 4.045 1.020 0.178 5.5E-05 1.7E-05 3.0E-06 a The emission factors were extracted from U.S. EPA, AP-42, Chapter 9: Food and Agricultural Industries, Grain Elevators & Processes (section 9.9.1), Update May 2003 except for ship loading which is based on Dec 31, 2001 "CASCADIA TERMINAL GRAIN DUST STUDY
(II)" report by Genesis Engineering Inc. (TPM emission factor = 0.0111 kg/tonne and 25% and 4.3% of TPM emission factor for PM10 and PM2.5 respectively) b Throughput in 2013 for the grains other than Canola was calculated based on 2,060,338 tonnes grain handling plus 15,432 tonnes Pellet production. It should be noted that 75% of Pellet is from collected dust and shipped by trucks, so the amount of loading into
trucks and processing in the above table includes the pellet production as well. c U.S. EPA, AP-42, Generalized Particle Size Distribution, Appendix B.2 (9/90), Table B.2.3 on page B.2-21, September 1996. NCD: None PM Control Device d Emission Rate = (Emission Factor) x (Activity Rate) x (1-Control Efficiency) ER = EF x Activity x (1-CE) e The AP-42 EFs for internal vibrating cleaners are based on using only a single Cyclone control device. At Cargill the internal cleaner is controlled with a Fabric Filter, so based on AP-42, Chapter 9.9.1, Grain Elevators and Processes (Page 19) the EFs were adjusted as
(EF (uncontrolled) = EF Internal vibrating (cyclone)/(1-CEcyclone)) in the above table and then control efficiency of Fabric Filter was applied to calculate the emission rates. For this purpose Cyclone control efficiency for TPM, PM10 and PM2.5 were assumed 50%, 40% and 10% respectively based on U.S. EPA, AP-42, Generalized Particle Size Distribution, Appendix B.2 (9/90), Table B.2.3 on page B.2-21, September 1996.
f The maximum hourly emission rate for unloading and material handling (processing) was conservatively calculated for grain other than Canola based on the railcars activity schedule and the throughput. Also, maximum hourly emission rate for ship loading and truck loading was calculated based on the loading rate and throughput.
- Unloading of 6 railcars per hour (for all grains and each railcar 90 tonnes) was the target in 2013. Max hourly throughput for unloading and material handling (processing)=6 (railcars/hr) x 90 (tonnes/railcar)= 540 (tonnes/hr) - Max hourly emission rate for ship loading was calculated based on the ship loading rate target at Cargill 1600 tonnes/hr. - Max hourly throughput for truck Loading (shipment) (Assumed only grains other than Canola plus Pellet are loaded into the trucks) was in February= (3,856 tonnes truck loading + 15,432/12 tonnes pellet loading)/(28 (day) x 24(hour))= 7.7 tonnes/hr g In the base case (2013) 2,060,338 tonnes grain other than Canola plus 15,432 tonnes Pellet (75% from collected dust) was handled (unloading/processing) in Cargill. Normal hourly emission rate for unloading and material handling (processing) was calculated based
on the average hourly throughput in 2013 for the grains other than Canola and considering 350 days a year operating. - Normal hourly throughput for unloading and material handling (processing) =2,075,770 (tonnes)/(350 (day) x 24(hour))= 248 (tonnes/hr)
Cargill Emission Inventory
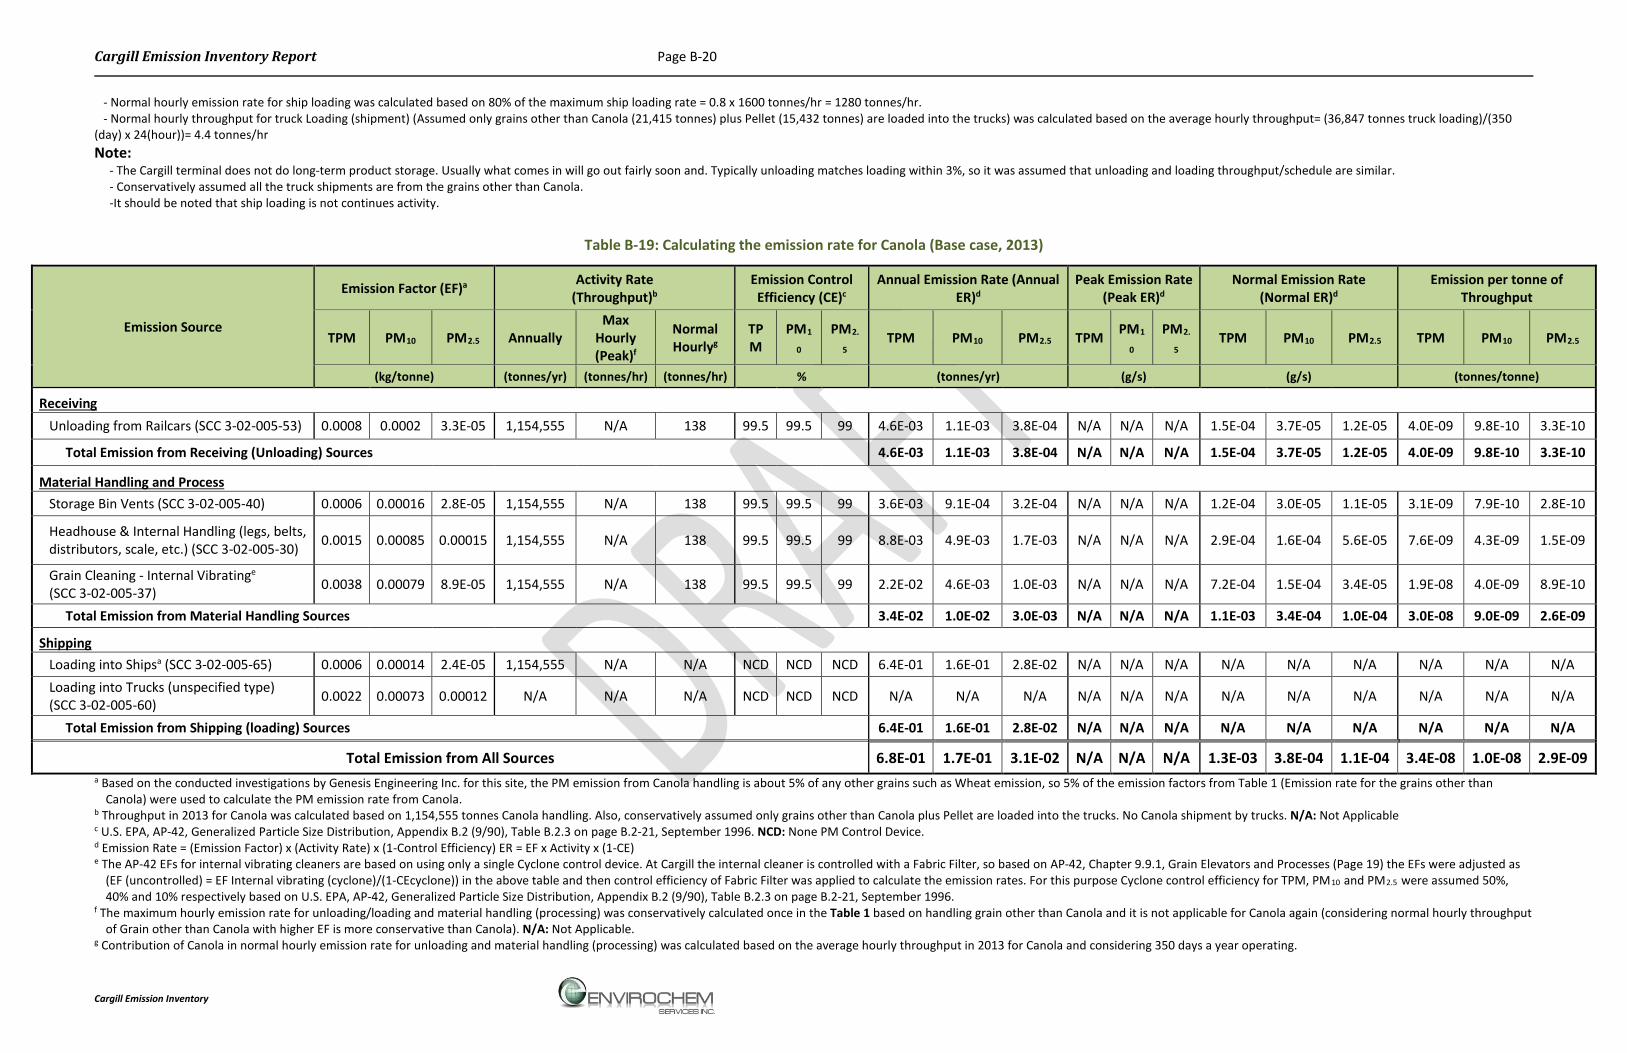
Cargill Emission Inventory Report Page B-20
- Normal hourly emission rate for ship loading was calculated based on 80% of the maximum ship loading rate = 0.8 x 1600 tonnes/hr = 1280 tonnes/hr. - Normal hourly throughput for truck Loading (shipment) (Assumed only grains other than Canola (21,415 tonnes) plus Pellet (15,432 tonnes) are loaded into the trucks) was calculated based on the average hourly throughput= (36,847 tonnes truck loading)/(350 (day) x 24(hour))= 4.4 tonnes/hr Note: - The Cargill terminal does not do long-term product storage. Usually what comes in will go out fairly soon and. Typically unloading matches loading within 3%, so it was assumed that unloading and loading throughput/schedule are similar. - Conservatively assumed all the truck shipments are from the grains other than Canola. -It should be noted that ship loading is not continues activity.
Table B-19: Calculating the emission rate for Canola (Base case, 2013)
Emission Source
Emission Factor (EF)a Activity Rate (Throughput)b
Emission Control Efficiency (CE)c
Annual Emission Rate (Annual ER)d
Peak Emission Rate (Peak ER)d
Normal Emission Rate (Normal ER)d
Emission per tonne of Throughput
TPM PM10 PM2.5 Annually Max
Hourly (Peak)f
Normal Hourlyg
TPM
PM1
0 PM2.
5 TPM PM10 PM2.5 TPM PM1
0 PM2.
5 TPM PM10 PM2.5 TPM PM10 PM2.5
(kg/tonne) (tonnes/yr) (tonnes/hr) (tonnes/hr) % (tonnes/yr) (g/s) (g/s) (tonnes/tonne)
Receiving Unloading from Railcars (SCC 3-02-005-53) 0.0008 0.0002 3.3E-05 1,154,555 N/A 138 99.5 99.5 99 4.6E-03 1.1E-03 3.8E-04 N/A N/A N/A 1.5E-04 3.7E-05 1.2E-05 4.0E-09 9.8E-10 3.3E-10
Total Emission from Receiving (Unloading) Sources 4.6E-03 1.1E-03 3.8E-04 N/A N/A N/A 1.5E-04 3.7E-05 1.2E-05 4.0E-09 9.8E-10 3.3E-10
Material Handling and Process Storage Bin Vents (SCC 3-02-005-40) 0.0006 0.00016 2.8E-05 1,154,555 N/A 138 99.5 99.5 99 3.6E-03 9.1E-04 3.2E-04 N/A N/A N/A 1.2E-04 3.0E-05 1.1E-05 3.1E-09 7.9E-10 2.8E-10
Headhouse & Internal Handling (legs, belts, distributors, scale, etc.) (SCC 3-02-005-30) 0.0015 0.00085 0.00015 1,154,555 N/A 138 99.5 99.5 99 8.8E-03 4.9E-03 1.7E-03 N/A N/A N/A 2.9E-04 1.6E-04 5.6E-05 7.6E-09 4.3E-09 1.5E-09
Grain Cleaning - Internal Vibratinge
(SCC 3-02-005-37) 0.0038 0.00079 8.9E-05 1,154,555 N/A 138 99.5 99.5 99 2.2E-02 4.6E-03 1.0E-03 N/A N/A N/A 7.2E-04 1.5E-04 3.4E-05 1.9E-08 4.0E-09 8.9E-10
Total Emission from Material Handling Sources 3.4E-02 1.0E-02 3.0E-03 N/A N/A N/A 1.1E-03 3.4E-04 1.0E-04 3.0E-08 9.0E-09 2.6E-09
Shipping Loading into Shipsa (SCC 3-02-005-65) 0.0006 0.00014 2.4E-05 1,154,555 N/A N/A NCD NCD NCD 6.4E-01 1.6E-01 2.8E-02 N/A N/A N/A N/A N/A N/A N/A N/A N/A Loading into Trucks (unspecified type) (SCC 3-02-005-60) 0.0022 0.00073 0.00012 N/A N/A N/A NCD NCD NCD N/A N/A N/A N/A N/A N/A N/A N/A N/A N/A N/A N/A
Total Emission from Shipping (loading) Sources 6.4E-01 1.6E-01 2.8E-02 N/A N/A N/A N/A N/A N/A N/A N/A N/A
Total Emission from All Sources 6.8E-01 1.7E-01 3.1E-02 N/A N/A N/A 1.3E-03 3.8E-04 1.1E-04 3.4E-08 1.0E-08 2.9E-09 a Based on the conducted investigations by Genesis Engineering Inc. for this site, the PM emission from Canola handling is about 5% of any other grains such as Wheat emission, so 5% of the emission factors from Table 1 (Emission rate for the grains other than
Canola) were used to calculate the PM emission rate from Canola. b Throughput in 2013 for Canola was calculated based on 1,154,555 tonnes Canola handling. Also, conservatively assumed only grains other than Canola plus Pellet are loaded into the trucks. No Canola shipment by trucks. N/A: Not Applicable c U.S. EPA, AP-42, Generalized Particle Size Distribution, Appendix B.2 (9/90), Table B.2.3 on page B.2-21, September 1996. NCD: None PM Control Device. d Emission Rate = (Emission Factor) x (Activity Rate) x (1-Control Efficiency) ER = EF x Activity x (1-CE) e The AP-42 EFs for internal vibrating cleaners are based on using only a single Cyclone control device. At Cargill the internal cleaner is controlled with a Fabric Filter, so based on AP-42, Chapter 9.9.1, Grain Elevators and Processes (Page 19) the EFs were adjusted as
(EF (uncontrolled) = EF Internal vibrating (cyclone)/(1-CEcyclone)) in the above table and then control efficiency of Fabric Filter was applied to calculate the emission rates. For this purpose Cyclone control efficiency for TPM, PM10 and PM2.5 were assumed 50%, 40% and 10% respectively based on U.S. EPA, AP-42, Generalized Particle Size Distribution, Appendix B.2 (9/90), Table B.2.3 on page B.2-21, September 1996.
f The maximum hourly emission rate for unloading/loading and material handling (processing) was conservatively calculated once in the Table 1 based on handling grain other than Canola and it is not applicable for Canola again (considering normal hourly throughput of Grain other than Canola with higher EF is more conservative than Canola). N/A: Not Applicable.
g Contribution of Canola in normal hourly emission rate for unloading and material handling (processing) was calculated based on the average hourly throughput in 2013 for Canola and considering 350 days a year operating.
Cargill Emission Inventory
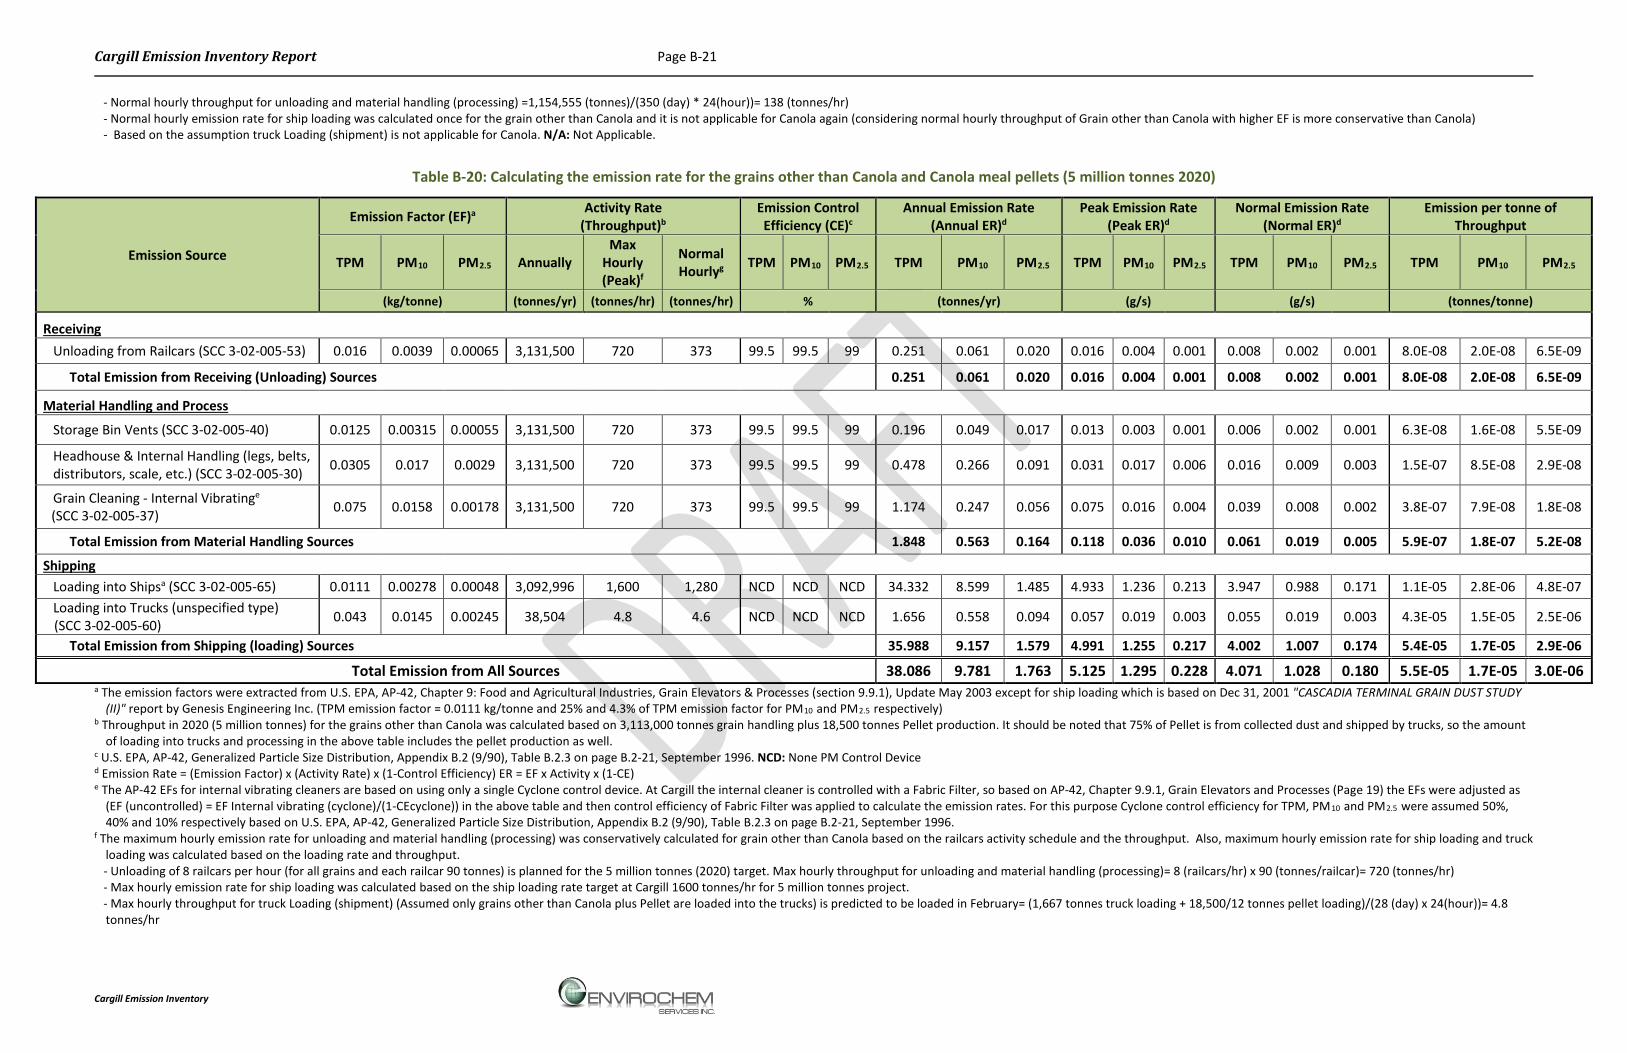
Cargill Emission Inventory Report Page B-21
- Normal hourly throughput for unloading and material handling (processing) =1,154,555 (tonnes)/(350 (day) * 24(hour))= 138 (tonnes/hr) - Normal hourly emission rate for ship loading was calculated once for the grain other than Canola and it is not applicable for Canola again (considering normal hourly throughput of Grain other than Canola with higher EF is more conservative than Canola) - Based on the assumption truck Loading (shipment) is not applicable for Canola. N/A: Not Applicable.
Table B-20: Calculating the emission rate for the grains other than Canola and Canola meal pellets (5 million tonnes 2020)
Emission Source
Emission Factor (EF)a Activity Rate (Throughput)b
Emission Control Efficiency (CE)c
Annual Emission Rate (Annual ER)d
Peak Emission Rate (Peak ER)d
Normal Emission Rate (Normal ER)d
Emission per tonne of Throughput
TPM PM10 PM2.5 Annually Max
Hourly (Peak)f
Normal Hourlyg TPM PM10 PM2.5 TPM PM10 PM2.5 TPM PM10 PM2.5 TPM PM10 PM2.5 TPM PM10 PM2.5
(kg/tonne) (tonnes/yr) (tonnes/hr) (tonnes/hr) % (tonnes/yr) (g/s) (g/s) (tonnes/tonne)
Receiving Unloading from Railcars (SCC 3-02-005-53) 0.016 0.0039 0.00065 3,131,500 720 373 99.5 99.5 99 0.251 0.061 0.020 0.016 0.004 0.001 0.008 0.002 0.001 8.0E-08 2.0E-08 6.5E-09
Total Emission from Receiving (Unloading) Sources 0.251 0.061 0.020 0.016 0.004 0.001 0.008 0.002 0.001 8.0E-08 2.0E-08 6.5E-09
Material Handling and Process
Storage Bin Vents (SCC 3-02-005-40) 0.0125 0.00315 0.00055 3,131,500 720 373 99.5 99.5 99 0.196 0.049 0.017 0.013 0.003 0.001 0.006 0.002 0.001 6.3E-08 1.6E-08 5.5E-09
Headhouse & Internal Handling (legs, belts, distributors, scale, etc.) (SCC 3-02-005-30) 0.0305 0.017 0.0029 3,131,500 720 373 99.5 99.5 99 0.478 0.266 0.091 0.031 0.017 0.006 0.016 0.009 0.003 1.5E-07 8.5E-08 2.9E-08
Grain Cleaning - Internal Vibratinge
(SCC 3-02-005-37) 0.075 0.0158 0.00178 3,131,500 720 373 99.5 99.5 99 1.174 0.247 0.056 0.075 0.016 0.004 0.039 0.008 0.002 3.8E-07 7.9E-08 1.8E-08
Total Emission from Material Handling Sources 1.848 0.563 0.164 0.118 0.036 0.010 0.061 0.019 0.005 5.9E-07 1.8E-07 5.2E-08
Shipping Loading into Shipsa (SCC 3-02-005-65) 0.0111 0.00278 0.00048 3,092,996 1,600 1,280 NCD NCD NCD 34.332 8.599 1.485 4.933 1.236 0.213 3.947 0.988 0.171 1.1E-05 2.8E-06 4.8E-07 Loading into Trucks (unspecified type) (SCC 3-02-005-60) 0.043 0.0145 0.00245 38,504 4.8 4.6 NCD NCD NCD 1.656 0.558 0.094 0.057 0.019 0.003 0.055 0.019 0.003 4.3E-05 1.5E-05 2.5E-06
Total Emission from Shipping (loading) Sources 35.988 9.157 1.579 4.991 1.255 0.217 4.002 1.007 0.174 5.4E-05 1.7E-05 2.9E-06
Total Emission from All Sources 38.086 9.781 1.763 5.125 1.295 0.228 4.071 1.028 0.180 5.5E-05 1.7E-05 3.0E-06 a The emission factors were extracted from U.S. EPA, AP-42, Chapter 9: Food and Agricultural Industries, Grain Elevators & Processes (section 9.9.1), Update May 2003 except for ship loading which is based on Dec 31, 2001 "CASCADIA TERMINAL GRAIN DUST STUDY
(II)" report by Genesis Engineering Inc. (TPM emission factor = 0.0111 kg/tonne and 25% and 4.3% of TPM emission factor for PM10 and PM2.5 respectively) b Throughput in 2020 (5 million tonnes) for the grains other than Canola was calculated based on 3,113,000 tonnes grain handling plus 18,500 tonnes Pellet production. It should be noted that 75% of Pellet is from collected dust and shipped by trucks, so the amount
of loading into trucks and processing in the above table includes the pellet production as well. c U.S. EPA, AP-42, Generalized Particle Size Distribution, Appendix B.2 (9/90), Table B.2.3 on page B.2-21, September 1996. NCD: None PM Control Device d Emission Rate = (Emission Factor) x (Activity Rate) x (1-Control Efficiency) ER = EF x Activity x (1-CE) e The AP-42 EFs for internal vibrating cleaners are based on using only a single Cyclone control device. At Cargill the internal cleaner is controlled with a Fabric Filter, so based on AP-42, Chapter 9.9.1, Grain Elevators and Processes (Page 19) the EFs were adjusted as
(EF (uncontrolled) = EF Internal vibrating (cyclone)/(1-CEcyclone)) in the above table and then control efficiency of Fabric Filter was applied to calculate the emission rates. For this purpose Cyclone control efficiency for TPM, PM10 and PM2.5 were assumed 50%, 40% and 10% respectively based on U.S. EPA, AP-42, Generalized Particle Size Distribution, Appendix B.2 (9/90), Table B.2.3 on page B.2-21, September 1996.
f The maximum hourly emission rate for unloading and material handling (processing) was conservatively calculated for grain other than Canola based on the railcars activity schedule and the throughput. Also, maximum hourly emission rate for ship loading and truck loading was calculated based on the loading rate and throughput.
- Unloading of 8 railcars per hour (for all grains and each railcar 90 tonnes) is planned for the 5 million tonnes (2020) target. Max hourly throughput for unloading and material handling (processing)= 8 (railcars/hr) x 90 (tonnes/railcar)= 720 (tonnes/hr) - Max hourly emission rate for ship loading was calculated based on the ship loading rate target at Cargill 1600 tonnes/hr for 5 million tonnes project. - Max hourly throughput for truck Loading (shipment) (Assumed only grains other than Canola plus Pellet are loaded into the trucks) is predicted to be loaded in February= (1,667 tonnes truck loading + 18,500/12 tonnes pellet loading)/(28 (day) x 24(hour))= 4.8
tonnes/hr
Cargill Emission Inventory
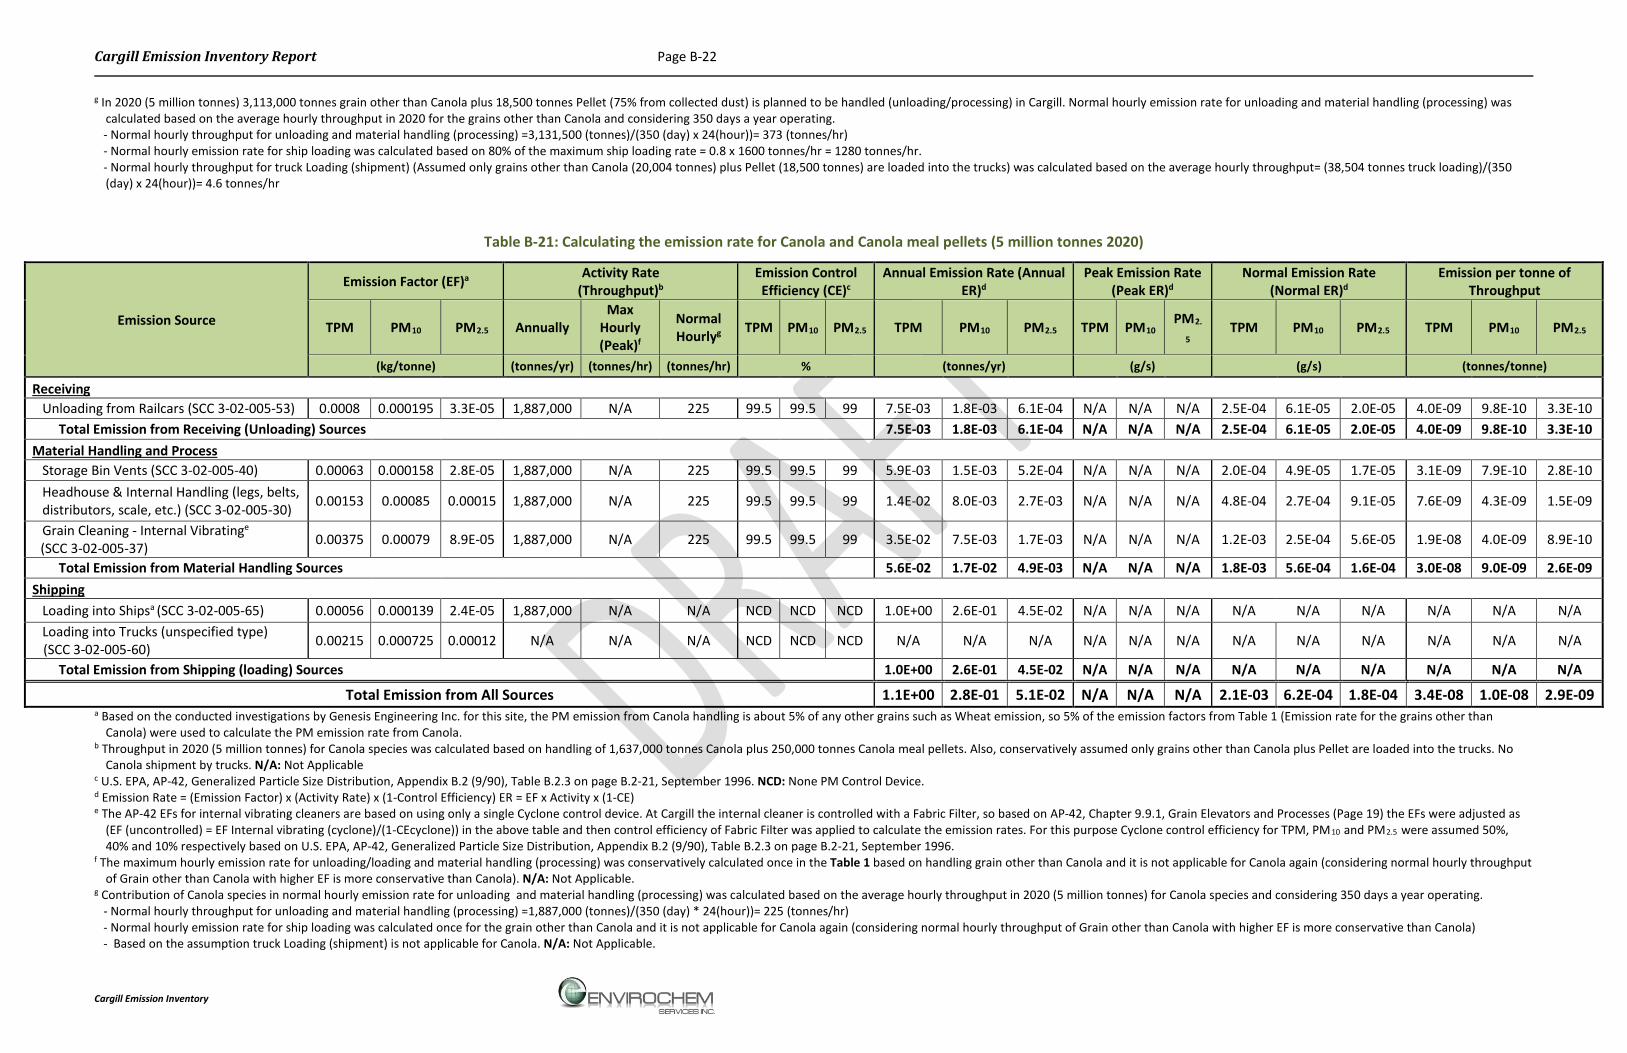
Cargill Emission Inventory Report Page B-22
g In 2020 (5 million tonnes) 3,113,000 tonnes grain other than Canola plus 18,500 tonnes Pellet (75% from collected dust) is planned to be handled (unloading/processing) in Cargill. Normal hourly emission rate for unloading and material handling (processing) was calculated based on the average hourly throughput in 2020 for the grains other than Canola and considering 350 days a year operating.
- Normal hourly throughput for unloading and material handling (processing) =3,131,500 (tonnes)/(350 (day) x 24(hour))= 373 (tonnes/hr) - Normal hourly emission rate for ship loading was calculated based on 80% of the maximum ship loading rate = 0.8 x 1600 tonnes/hr = 1280 tonnes/hr. - Normal hourly throughput for truck Loading (shipment) (Assumed only grains other than Canola (20,004 tonnes) plus Pellet (18,500 tonnes) are loaded into the trucks) was calculated based on the average hourly throughput= (38,504 tonnes truck loading)/(350
(day) x 24(hour))= 4.6 tonnes/hr
Table B-21: Calculating the emission rate for Canola and Canola meal pellets (5 million tonnes 2020)
Emission Source
Emission Factor (EF)a Activity Rate (Throughput)b
Emission Control Efficiency (CE)c
Annual Emission Rate (Annual ER)d
Peak Emission Rate (Peak ER)d
Normal Emission Rate (Normal ER)d
Emission per tonne of Throughput
TPM PM10 PM2.5 Annually Max
Hourly (Peak)f
Normal Hourlyg TPM PM10 PM2.5 TPM PM10 PM2.5 TPM PM10 PM2.
5 TPM PM10 PM2.5 TPM PM10 PM2.5
(kg/tonne) (tonnes/yr) (tonnes/hr) (tonnes/hr) % (tonnes/yr) (g/s) (g/s) (tonnes/tonne)
Receiving Unloading from Railcars (SCC 3-02-005-53) 0.0008 0.000195 3.3E-05 1,887,000 N/A 225 99.5 99.5 99 7.5E-03 1.8E-03 6.1E-04 N/A N/A N/A 2.5E-04 6.1E-05 2.0E-05 4.0E-09 9.8E-10 3.3E-10 Total Emission from Receiving (Unloading) Sources 7.5E-03 1.8E-03 6.1E-04 N/A N/A N/A 2.5E-04 6.1E-05 2.0E-05 4.0E-09 9.8E-10 3.3E-10 Material Handling and Process Storage Bin Vents (SCC 3-02-005-40) 0.00063 0.000158 2.8E-05 1,887,000 N/A 225 99.5 99.5 99 5.9E-03 1.5E-03 5.2E-04 N/A N/A N/A 2.0E-04 4.9E-05 1.7E-05 3.1E-09 7.9E-10 2.8E-10 Headhouse & Internal Handling (legs, belts, distributors, scale, etc.) (SCC 3-02-005-30) 0.00153 0.00085 0.00015 1,887,000 N/A 225 99.5 99.5 99 1.4E-02 8.0E-03 2.7E-03 N/A N/A N/A 4.8E-04 2.7E-04 9.1E-05 7.6E-09 4.3E-09 1.5E-09
Grain Cleaning - Internal Vibratinge
(SCC 3-02-005-37) 0.00375 0.00079 8.9E-05 1,887,000 N/A 225 99.5 99.5 99 3.5E-02 7.5E-03 1.7E-03 N/A N/A N/A 1.2E-03 2.5E-04 5.6E-05 1.9E-08 4.0E-09 8.9E-10
Total Emission from Material Handling Sources 5.6E-02 1.7E-02 4.9E-03 N/A N/A N/A 1.8E-03 5.6E-04 1.6E-04 3.0E-08 9.0E-09 2.6E-09 Shipping Loading into Shipsa (SCC 3-02-005-65) 0.00056 0.000139 2.4E-05 1,887,000 N/A N/A NCD NCD NCD 1.0E+00 2.6E-01 4.5E-02 N/A N/A N/A N/A N/A N/A N/A N/A N/A Loading into Trucks (unspecified type) (SCC 3-02-005-60) 0.00215 0.000725 0.00012 N/A N/A N/A NCD NCD NCD N/A N/A N/A N/A N/A N/A N/A N/A N/A N/A N/A N/A
Total Emission from Shipping (loading) Sources 1.0E+00 2.6E-01 4.5E-02 N/A N/A N/A N/A N/A N/A N/A N/A N/A
Total Emission from All Sources 1.1E+00 2.8E-01 5.1E-02 N/A N/A N/A 2.1E-03 6.2E-04 1.8E-04 3.4E-08 1.0E-08 2.9E-09 a Based on the conducted investigations by Genesis Engineering Inc. for this site, the PM emission from Canola handling is about 5% of any other grains such as Wheat emission, so 5% of the emission factors from Table 1 (Emission rate for the grains other than
Canola) were used to calculate the PM emission rate from Canola. b Throughput in 2020 (5 million tonnes) for Canola species was calculated based on handling of 1,637,000 tonnes Canola plus 250,000 tonnes Canola meal pellets. Also, conservatively assumed only grains other than Canola plus Pellet are loaded into the trucks. No
Canola shipment by trucks. N/A: Not Applicable c U.S. EPA, AP-42, Generalized Particle Size Distribution, Appendix B.2 (9/90), Table B.2.3 on page B.2-21, September 1996. NCD: None PM Control Device. d Emission Rate = (Emission Factor) x (Activity Rate) x (1-Control Efficiency) ER = EF x Activity x (1-CE) e The AP-42 EFs for internal vibrating cleaners are based on using only a single Cyclone control device. At Cargill the internal cleaner is controlled with a Fabric Filter, so based on AP-42, Chapter 9.9.1, Grain Elevators and Processes (Page 19) the EFs were adjusted as
(EF (uncontrolled) = EF Internal vibrating (cyclone)/(1-CEcyclone)) in the above table and then control efficiency of Fabric Filter was applied to calculate the emission rates. For this purpose Cyclone control efficiency for TPM, PM10 and PM2.5 were assumed 50%, 40% and 10% respectively based on U.S. EPA, AP-42, Generalized Particle Size Distribution, Appendix B.2 (9/90), Table B.2.3 on page B.2-21, September 1996.
f The maximum hourly emission rate for unloading/loading and material handling (processing) was conservatively calculated once in the Table 1 based on handling grain other than Canola and it is not applicable for Canola again (considering normal hourly throughput of Grain other than Canola with higher EF is more conservative than Canola). N/A: Not Applicable.
g Contribution of Canola species in normal hourly emission rate for unloading and material handling (processing) was calculated based on the average hourly throughput in 2020 (5 million tonnes) for Canola species and considering 350 days a year operating. - Normal hourly throughput for unloading and material handling (processing) =1,887,000 (tonnes)/(350 (day) * 24(hour))= 225 (tonnes/hr) - Normal hourly emission rate for ship loading was calculated once for the grain other than Canola and it is not applicable for Canola again (considering normal hourly throughput of Grain other than Canola with higher EF is more conservative than Canola) - Based on the assumption truck Loading (shipment) is not applicable for Canola. N/A: Not Applicable.
Cargill Emission Inventory
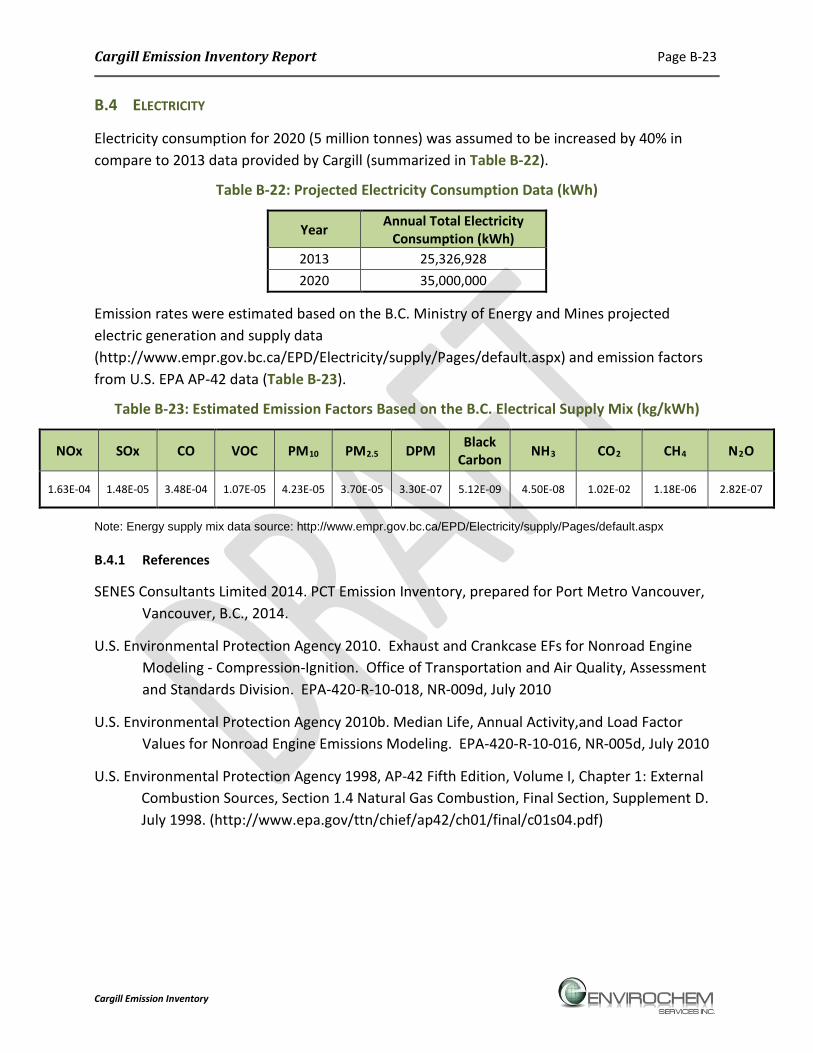
Cargill Emission Inventory Report Page B-23
B.4 ELECTRICITY
Electricity consumption for 2020 (5 million tonnes) was assumed to be increased by 40% in compare to 2013 data provided by Cargill (summarized in Table B-22).
Table B-22: Projected Electricity Consumption Data (kWh)
Year Annual Total Electricity Consumption (kWh)
2013 25,326,928 2020 35,000,000
Emission rates were estimated based on the B.C. Ministry of Energy and Mines projected electric generation and supply data (http://www.empr.gov.bc.ca/EPD/Electricity/supply/Pages/default.aspx) and emission factors from U.S. EPA AP-42 data (Table B-23).
Table B-23: Estimated Emission Factors Based on the B.C. Electrical Supply Mix (kg/kWh)
NOx SOx CO VOC PM10 PM2.5 DPM Black Carbon NH3 CO2 CH4 N2O
1.63E-04 1.48E-05 3.48E-04 1.07E-05 4.23E-05 3.70E-05 3.30E-07 5.12E-09 4.50E-08 1.02E-02 1.18E-06 2.82E-07
Note: Energy supply mix data source: http://www.empr.gov.bc.ca/EPD/Electricity/supply/Pages/default.aspx
B.4.1 References
SENES Consultants Limited 2014. PCT Emission Inventory, prepared for Port Metro Vancouver, Vancouver, B.C., 2014.
U.S. Environmental Protection Agency 2010. Exhaust and Crankcase EFs for Nonroad Engine Modeling - Compression-Ignition. Office of Transportation and Air Quality, Assessment and Standards Division. EPA-420-R-10-018, NR-009d, July 2010
U.S. Environmental Protection Agency 2010b. Median Life, Annual Activity,and Load Factor Values for Nonroad Engine Emissions Modeling. EPA-420-R-10-016, NR-005d, July 2010
U.S. Environmental Protection Agency 1998, AP-42 Fifth Edition, Volume I, Chapter 1: External Combustion Sources, Section 1.4 Natural Gas Combustion, Final Section, Supplement D. July 1998. (http://www.epa.gov/ttn/chief/ap42/ch01/final/c01s04.pdf)
Cargill Emission Inventory

Cargill Emission Inventory Report Page C-1
APPENDIX C: SAMPLE PICTURES OF THE MATERIAL HANDLING EQUIPMENT AT CARGILL
Cargill Emission Inventory

Cargill Emission Inventory Report Page C-2
Aerial View 1 Showing Baghouse Filter Collectors
Aerial View 2 Showing Baghouse Filter Collectors
Cargill Emission Inventory
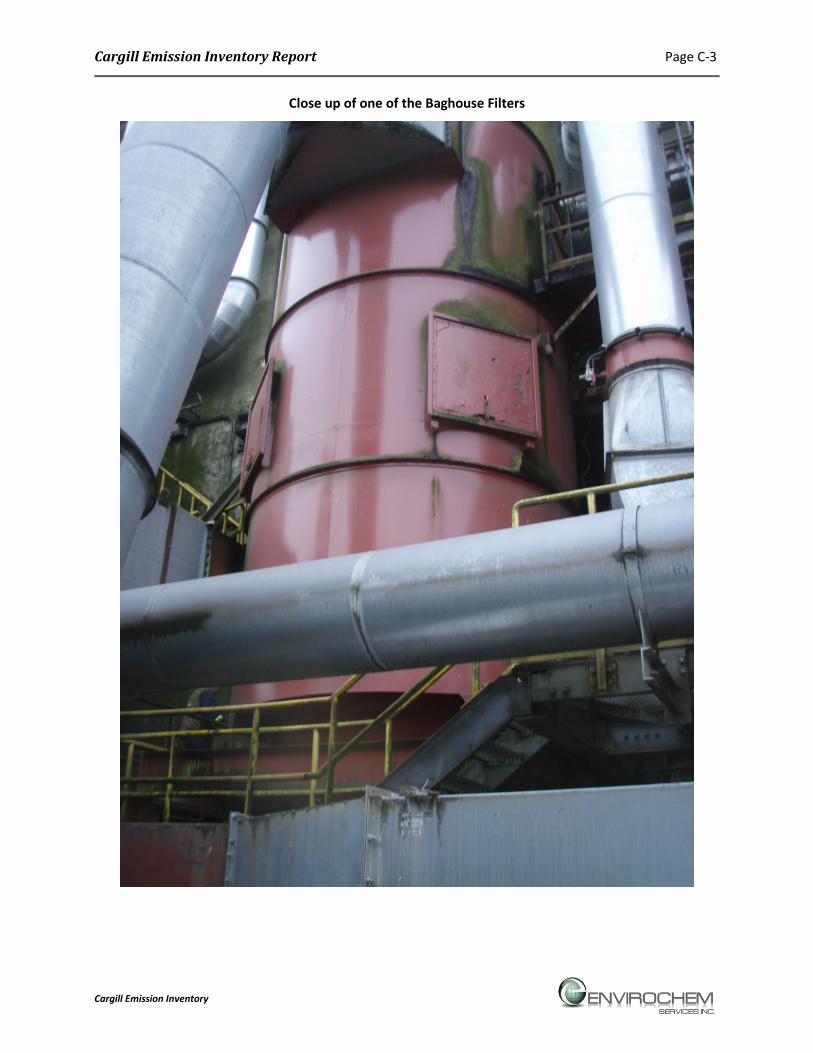
Cargill Emission Inventory Report Page C-3
Close up of one of the Baghouse Filters
Cargill Emission Inventory

Cargill Emission Inventory Report Page C-4
Enclosed Ducting
Enclosed Conveyors
Cargill Emission Inventory