carepre: an intelligent clinical decision assistance system · carepre: an intelligent clinical...
TRANSCRIPT

CarePre: An Intelligent Clinical DecisionAssistance System
Zhuochen Jin1, Jingshun Yang1, Shuyuan Cui1, David Gotz2, Jimeng Sun3, Nan Cao1∗
1. Intelligent Big Data Visualization Lab, Tongji University, China∗ [email protected]
2. University of North Carolina at Chapel Hill, USA3. Georgia Institute of Technology, USA
Abstract—Clinical decision support systems (CDSS) are widelyused to assist with medical decision making. However, CDSStypically require manually curated rules and other data whichare difficult to maintain and keep up-to-date. Recent systemsleverage advanced deep learning techniques and electronic healthrecords (EHR) to provide a more timely and precise results.Many of these techniques have been developed with a commonfocus on predicting upcoming medical events. However, while theprediction results from these approaches are promising, theirvalue is limited by their lack of interpretability. To addressthis challenge, we introduce CarePre , an intelligent clinicaldecision assistance system. The system extends a state-of-the-artdeep learning model to predict upcoming diagnosis events fora focal patient based on his/her historical medical records. Thesystem includes an interactive framework together with intuitivevisualizations designed to support diagnosis, treatment outcomeanalysis, and the interpretation of the analysis results. Wedemonstrate the effectiveness and usefulness of CarePre systemby reporting results from a quantities evaluation of the predictionalgorithm and a case study and three interviews with seniorphysicians.
I. INTRODUCTION
Medical decision making is fraught with uncertainty. Itinvolves not only deciding what disease a patient may have, butalso which treatments to choose from a set of possible alter-natives [35]. Motivated by these challenges, clinical decisionsupport systems (CDSS) have gained increasing usage in re-cent years. CDSS are computer-based systems which integrateinto the clinical workflow to help physicians determine whichquestions to ask, which tests to order, and which procedures toperform [39], [43]. However, typical CDSS require manuallycurated knowledge bases that are difficult to maintain andkeep up-to-date, thus limiting their usage in real world clinicalscenarios [32].
The rapid development of machine learning techniques andthe increasing availability of electronic health records (EHR)has stimulated great interest in harnessing EHR data to helpdrive CDSS. It is widely believed that high quality EHR datain the context of CDSS has the potential to reduce errors andprovide more precise results [5], [7], [8], [27]. To this end,many techniques have been developed to extract meaningfulinsights from EHR data with a common focus on prediction ofupcoming medical events (e.g., a diagnosis or treatment) [13],[20]. In particular, a series of deep learning-based predictionmodels [11], [12], [49] have successfully demonstrated thathigh accuracy predictions are possible. However, the utility ofthese methods is greatly limited by their lack of interpretabil-ity. The ideal intelligent medical event prediction system must
provide results that are both accurate and interpretable througha user-friendly interface.
However, achieving both accuracy and interpretability ischallenging as they are often achieved via contradictory de-sign decisions. The highest accuracy prediction is often ob-tained when using more complex prediction methods, whereassimpler models with lower accuracy are often more inter-pretable [6]. Attempts have been made to improve the in-terpretability of more complex prediction models [12], [49].However, these approaches are still too complex for users withlittle or no technical training, such as medical doctors.
To address the above issues, we introduce CarePre , anintelligent clinical decision assistance system. CarePre predictsthe risks of a patient being diagnosed in the future with certaindiseases based on his/her historical electronic health records.The system extends a state-of-the-art deep prediction modelthat is specifically designed for predicting medical events, andemploys intuitive visualization techniques to help interpret theprediction results without reducing the complexity of the un-derlying model. In particular, CarePre supports interpretationby (1) framing the prediction results in the context of a groupof similar patients, and (2) analyzing the factors that influencethe prediction results to help physicians make a more informedclinical decision. The contributions of the paper include:
• System Design. We introduce a comprehensive clinicaldecision assistance system for predicting a patient’s riskof future diagnosis for certain diseases, and estimatingthe outcome of different treatments based on the patient’selectronic health records. The system design is guided byresults from a pilot study with two senior physicians.
• Exploratory Analysis. We propose an interactive frame-work that supports detailed exploration for both (1) inter-pretation of prediction results in the context of historicaland similar medical records, and (2) analysis of potentialtreatment outcomes.
• Evaluation. We evaluate the system via a quantitativeevaluation of the algorithm, a case study with a seniorphysician, and three interviews with three case studiesusing real-world medical data with three senior physi-cians. We describe the case studies and results frominterviews with each physician. These results provideevidence regarding the usefulness of the system.
arX
iv:1
811.
0221
8v1
[cs
.HC
] 6
Nov
201
8

II. RELATED WORKS
In this section, we provide an overview of previous researchthat is most relevant to our work including: (1) clinicaldecision support systems (CDSS), (2) prediction models inmedicine, and (3) visualization of electronic health records.
A. Clinical Decision Support Systems
Existing clinical decision support systems (CDSS) canbe primarily summarized into two major types: Knowledge-based and Non-knowledge-based [3]. Knowledge-based sys-tems, which are are most commonly used, typically organizeknowledge about diseases and the associations of symptomsin the form of if-then rules. For example, Dayan et al. [15]introduced the traumatic brain injury (TBI) prediction rules ina CDSS to foresee risks of TBI. Laleci et al. [28] utilized aguideline-based CDSS to help manage the personal care plansof elders. Rodriguez et al. [42] introduced a “send & hold”system, utilizing clinical decision support rules to reduce theavoidable vitamin testing.
Non-knowledge-based systems are usually developed basedon machine learning techniques that can automatically learnthe associations between symptoms and diseases from elec-tronic health record (EHR) data [3]. It has been shown thatEHR data not only helps improve the precision of analysisresults [5], [18], but also greatly improves the robustness ofa CDSS due to the availability of rich and diverse EHR datagathered during the daily clinical encounters [11], [48]. Whencompared to knowledge-based systems, these systems greatlyreduce the human efforts required to manually build and up-date a large knowledge database [32]. However, these systemstypically suffer from a lack of interpretablity of the analysisresults [32], and a lack of user-friendly interfaces to facilitateefficient results inspection [4], [8]. CarePre leverages the ad-vantages of machine learning techniques and electronic healthrecords, while also providing a comprehensive visualization-based design to support result inspection and interpretation.
B. Prediction Models in Medicine
Prediction models have played an increasingly importantrole in the medical domain, for both diagnosis and prog-nosis [44]. Recent research has often focused on leveragingdeep learning techniques to make predictions more accurateand precise [51]. These techniques have been used to supportpublic health analysis [9], [53], [54], medical research [46],[14], [52], and clinical practice [1], [29], [24]. Some deeplearning techniques have been developed to assess risk forspecific conditions, such as the diagnosis of heart disease [1],[40], [50], cancer [10], [14], [52], and mental health [2], [22],[41].
Most relevant to our work, other research has focused onpredicting upcoming medical events (e.g., a future diagnosis ortreatment) based on electronic health records (EHR). Examplesin this area include Jagannatha et al. [24], who used EHR datato train a bidirectional recurrent neural network (RNN) formedication and disease prediction. Choi et al. [11] developedDoctor AI, a generic RNN model that use historical EHR
to predict the clinical events as well as the time to the nextvisit. Following this work, Choi et al. [12] further introducedRetain, a state-of-the-art, high-accuracy prediction model thatwas specifically designed to predicting ‘signal’ events (i.e,heart failure) based on EHR data. Our system extends thismodel to predict multiple events, as motivated by our designrequirements.
Interpreting results from prediction models is a recognizedchallenge, and it is especially difficult for models that leveragedeep learning. Existing interpretation techniques can largelycategorized into two categories: (1) global model analysis,which employs visualization techniques to represent the in-ternal structure of a deep learning model [31], [45], [30],and (2) instance-based analysis, which monitors changes toresults in response to changes in model input [26], [36].CarePre adopts the instance-based analysis approach via aset of interactive visualization designs that allow users toadjust/delete/add medical events within a patients’ historicalmedical records explore their impact on the prediction result.
C. Visual Analysis of Electronic Health Records
Many visual analysis systems have been developed forrepresenting and analyzing electronic health records. Most ofthese summarize a large set of EHR data into a flow-based rep-resentation that reveals the frequent patterns of medical eventsequences [33], [38] and the outcomes yielded by differentcare plans [47], [37]. However, these techniques are typicallychallenged by event sequences of varied length that containlarge numbers of event types. These real-world properties ofmedical data can often lead to cluttered and less meaningfulvisualizations when sequences vary dramatically. To overcomethis limitation, Gotz et al. [19] introduced DecisionFlow, inwhich sequences with different length and large numbersof even types are visualized based on several key events.This hides the complexity introduced by other non-key eventtypes. Guo et al. [21] introduced ET2, in which the sequencesare aligned based on dynamic time wrapping and segmentedinto stages shown with more details to help illustrate theprogression of a disease in context of a care plan. Du etal. [16], [17] introduced visual analysis systems to predictupcoming events or recommend the next procedure by sum-marizing a set of similar event sequences without using anyprediction model, thus producing results with limited accuracy.CarePre leverages many of the advances contributed by thesevisualization techniques, and supports multiple visualization-based views to help users exploration and interpret predictionresults.
III. PILOT STUDY
Our pilot study followed a multi-session design, and in-volved two senior physicians with over 15 year’s clinicalexperience in two hospitals in a major city in China. The goalof the pilot study was to determine detailed requirements toguide the subsequent system design.
Session 1: Initial Requirements. Interviews were per-formed with each of the two senior physicians, during which
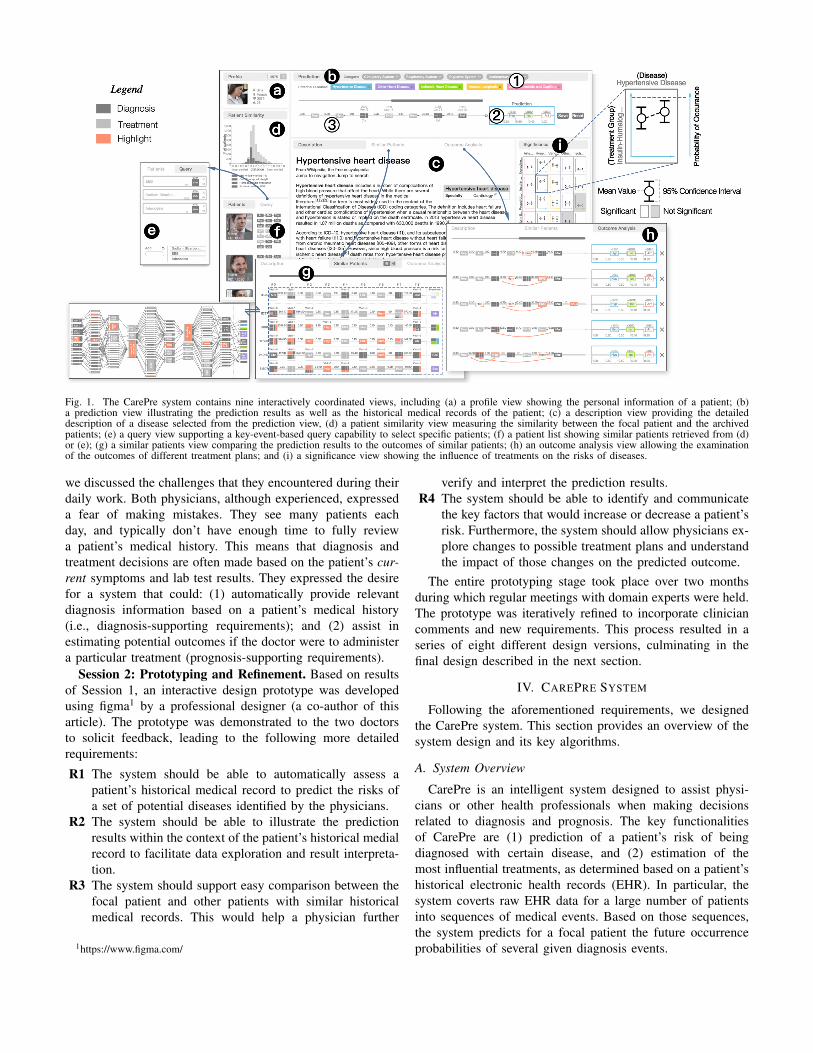
Fig. 1. The CarePre system contains nine interactively coordinated views, including (a) a profile view showing the personal information of a patient; (b)a prediction view illustrating the prediction results as well as the historical medical records of the patient; (c) a description view providing the detaileddescription of a disease selected from the prediction view, (d) a patient similarity view measuring the similarity between the focal patient and the archivedpatients; (e) a query view supporting a key-event-based query capability to select specific patients; (f) a patient list showing similar patients retrieved from (d)or (e); (g) a similar patients view comparing the prediction results to the outcomes of similar patients; (h) an outcome analysis view allowing the examinationof the outcomes of different treatment plans; and (i) a significance view showing the influence of treatments on the risks of diseases.
we discussed the challenges that they encountered during theirdaily work. Both physicians, although experienced, expresseda fear of making mistakes. They see many patients eachday, and typically don’t have enough time to fully reviewa patient’s medical history. This means that diagnosis andtreatment decisions are often made based on the patient’s cur-rent symptoms and lab test results. They expressed the desirefor a system that could: (1) automatically provide relevantdiagnosis information based on a patient’s medical history(i.e., diagnosis-supporting requirements); and (2) assist inestimating potential outcomes if the doctor were to administera particular treatment (prognosis-supporting requirements).
Session 2: Prototyping and Refinement. Based on resultsof Session 1, an interactive design prototype was developedusing figma1 by a professional designer (a co-author of thisarticle). The prototype was demonstrated to the two doctorsto solicit feedback, leading to the following more detailedrequirements:
R1 The system should be able to automatically assess apatient’s historical medical record to predict the risks ofa set of potential diseases identified by the physicians.
R2 The system should be able to illustrate the predictionresults within the context of the patient’s historical medialrecord to facilitate data exploration and result interpreta-tion.
R3 The system should support easy comparison between thefocal patient and other patients with similar historicalmedical records. This would help a physician further
1https://www.figma.com/
verify and interpret the prediction results.R4 The system should be able to identify and communicate
the key factors that would increase or decrease a patient’srisk. Furthermore, the system should allow physicians ex-plore changes to possible treatment plans and understandthe impact of those changes on the predicted outcome.
The entire prototyping stage took place over two monthsduring which regular meetings with domain experts were held.The prototype was iteratively refined to incorporate cliniciancomments and new requirements. This process resulted in aseries of eight different design versions, culminating in thefinal design described in the next section.
IV. CAREPRE SYSTEM
Following the aforementioned requirements, we designedthe CarePre system. This section provides an overview of thesystem design and its key algorithms.
A. System Overview
CarePre is an intelligent system designed to assist physi-cians or other health professionals when making decisionsrelated to diagnosis and prognosis. The key functionalitiesof CarePre are (1) prediction of a patient’s risk of beingdiagnosed with certain disease, and (2) estimation of themost influential treatments, as determined based on a patient’shistorical electronic health records (EHR). In particular, thesystem coverts raw EHR data for a large number of patientsinto sequences of medical events. Based on those sequences,the system predicts for a focal patient the future occurrenceprobabilities of several given diagnosis events.

Fig. 2. The interaction pipeline of CarePre system consists of three steps,including: (1) a pre-diagnosis step in which physicians initially diagnosis afocal patient according to his/her symptoms and lab tests; (2) a diagnosis-support step in which the system automatically estimates the risk of each thepotential diseases determined in the previous step, and in which physicianscan verify the results by comparison to the medical records of a set of similarpatients; and (3) the treatment outcome analysis step in which physicians cancompare and evaluate the expected outcomes of different treatment plans.
Fig. 1 illustrates the CarePre user interface. It consists often views, many of which utilize data visualization techniquesto facilitate an intuitive data representation and interpre-tation. These views can be categorized into three classesbased on their functionality: (1) diagnosis-supporting views(Fig. 1(a,b,c)), (2) similar patients retrieval and comparisonviews (Fig. 1(d-g)), (3) treatment outcome analysis views(Fig. 1(b,h,i)).
These views support the system’s interaction pipeline asshown in Figure 2. The pipeline includes three main steps,beginning with a physician making an initial diagnosis usinghis/her own knowledge and experiences, based on a focalpatient’s current symptoms and lab tests. The potential diag-noses from this stage or entered into the system (Fig. 1(b-1)),which automatically estimates the patient’s risks in terms ofbeing diagnosed in the future with the diseases given his/herhistorical medical records (Fig. 1(b-2)). The doctor can explorethe details of the historical medical records (Fig. 1(b-3)),and issue a query to fetch a set of similar patients to helpcontextualize and interpret the prediction results (Fig. 1(d,f,g)).Third, the doctor can examine alternative treatment plans byexamining and comparing the expected outcomes of each asestimated by the system (Fig. 1(h,i)).
B. Diagnosis Support
CarePre system assists a typical diagnosis procedure bypredicting the next medical event given an event sequencerepresenting a patient’s medical record (R1). More specifically,the system, the system predicts the next diagnosis (i.e., thepotential diseases a patient may have) based on the patient’sprevious diagnoses and treatments. The prediction resultsand the patient’s historical medical data are illustrated in aninteractive timeline visualization to facilitate data and resultexploration (R2).
1) Prediction Model: To predict the next diagnosis, weutilize a deep learning model with two recurrent neural net-works [23] to predict the likelihood of occurrence for a set ofpotential diseases selected by physicians based on a patient’shistorical medical record. The model extends the design usedin Retain [12] to predict multiple medical events at the same
Fig. 3. The structure of Retain: Taken a sequence x1, · · · , xt as input, themodel can predict the distribution of possible diagnosis in three steps: (a) theembedding step, (b,c) the attention steps, (d) the final prediction step.
time. Our model was trained using a subset of the MIMICdataset [25], which contains the electronic health records of46,521 patients. Prior to training, the data were cleaned byremoving the low frequency and irrelevant event types.
Fig. 3 illustrates the structure of the model. The modelpredicts subsequent medical events based on an input eventsequence [x1, ..., xt], where xi is a multi-hot vector thatcaptures the occurrences of events at each time point. Giventhis input, an embedding layer is used to project each of theinput events into a latent feature vector vi (Fig. 3(a)). Afterthat, vi is further concatenated with di, the duration betweenthe i-th event in the sequence and the prediction time, which isdenoted as vi = [vi, di]. This combined vector is the input fortwo recurrent neural networks (RNNs) as shown in Fig. 3(b,c).
The first network, RNNα (Fig. 3(b)), takes the informationof all events at each time points into consideration to ensure ahigh accuracy prediction result. The outputs of the model, i.e.,(α1, ..., αt) are weights that indicate the accumulated influenceon the prediction results at each time point.
The second network, RNNβ (Fig. 3(c)), estimates theinfluence of each individual event at each time point in time onthe prediction results. These estimates facilitate interpretationof the prediction results. The output, (β1, ..., βt), are vectorsat different time points with each field in a vector representingthe influence of an individual event on the prediction results.A positive / negative field value corresponds to an event thatis associated with an increase / decrease in the occurrenceprobability of the predicted event, respectively.
The results from the overall model are calculated using asoftmax layer, which predicts the occurrence probability ofeach event as follows:
yt = softmax(Woutot + eout)
where Wout and eout are the parameters to be learned in thesoftmax-layer; ot is the context vector at time point t, whichwe define as a combination of the previous outputs:
ot =t∑i=1
αiβi � vi
where � is the element-wise multiplication operator.

The model is trained based on the following loss function:
L = − 1
N
N∑k=1
1
T (k)
T (k)∑t=1
(bwyTt log(yt) + (1− yt)T log(1− yt))
where N is the number of samples, T (k) is the length ofthe sequence in each sample, yt is the ground truth, andyt represents the prediction results. bw is a vector that isincluded within the loss function to address the presence ofhighly skewed training data. Each field in bw is calculatedas 1/log(n) where n indicates the number of occurrencesof an event within the training samples. bw helps overcomeskewed distributions within the training samples by reducingthe marginal importance of additional event occurrences forhigh frequency events. Finally, we estimate the influence of ahistorical event s occurring at timestamp t to the predictionresults based on αt and βt as follows:
Influence(s, t) = αtWout(βt � Wemb[:, s])
where Wemb is the weight matrix of the input layer thattransforms the input sequence into feature vectors, and Wout isthe weight matrix of the output layer (i.e., the softmax-layer)that transforms the latent vector into probabilities.
Fig. 4. The visual design of the prediction view includes (a) the medical eventsequence leading up to the time point of prediction, and (b) the predictionbox showing the most likely diagnoses in order of predicted probabilities.
2) Visualization: We represent a patient’s electronic med-ical record as a sequence of medical events, which are dis-played using rectangular nodes arranged horizontally in orderof event occurrence as shown in Fig. 4(a). To avoid overlaps(during periods of time with multiple medical events) andlarge gaps (during periods of time where medical events areinfrequent), the event nodes are spaced with equal distancebetween them. The actual event times are marked above theevent nodes using text labels.
Successive event nodes are depicted with a duration barconnecting the nodes, and each bar is labeled with thetime span between events. When multiple events occur atthe same time (as is common in medical data), a treemap-based representation is used to compactly represent the multi-event information within a single rectangular node. All eventsare color-coded by event type, with dark gray representingtreatments and light gray representing diagnoses. Hovering themouse over on event node causes the node to be highlighted inorange and triggers the display of a tooltip showing additionalevent details. Scrolling and zooming operations allow forfurther exploration of the patient’s medical history.
The prediction results are visualized within a box locatedto the right of the event sequence visualization (Fig. 4(b)).The prediction box contains a series of rectangular nodes, one
for each of the most likely predicted diagnosis events for thepatient. Each rectangular nodes is color-coded by diagnosistype, where the set of possible diagnoses are pre-chosen bya physician using the dropdown list shown in Fig. 1(b-1).This choice is determined by the physician based on theirpre-diagnosis of the patient’s condition.
The order (from left to right) of the event nodes insidethe prediction box are determined by the predicted occurrenceprobability of the events. Therefore, the left-most event boxwithin the prediction box corresponds to the diagnosis thatis predicted to be most likely for the patient. The predictedlikelihood of each diagnosis event decreases as the boxes movetoward the right of the prediction box. The color saturation foreach box indicates the prevalence of the predicted diagnosiswithin the medical records for a population of similar patients.
Users can clicking on a diagnosis event to view more detailsabout the predicted diagnosis. Available information includesa general description of the diagnosis, symptoms, causes,diagnosis methods, treatments, and typical prognosis. Thesedetails are displayed within the description view for physiciansto review.
Fig. 5. Medical event sequences for similar patients are visualized as either(a) individual sequences or (b) an aggregated flow diagram. Part (c) shows amore detailed illustration of the aggregate view.
C. Similar Patient Retrieval and Comparison
As identified in the pilot study, a key requirement for clini-cians is the ability to compare the focal patient and predictionresults to other patients with similar medical records (R3).CarePre allows users to retrieve similar patients in two ways:(1) via brushing a patient similarity histogram (Fig. 1(d)), and(2) via explicit queries using key medical events (Fig. 1(e)).Similar patients retrieved via either interface are displayedin a patient list (Fig. 1(f)) which depicts a detailed eventsequence for each similar patient (Fig. 1(g)) to allow detailedcomparisons.
1) Patient Similarity and Sequence Alignment.: To supportthe above functions, CarePre adopts a distance measure toquantify the similarity between events sequences that is ro-bust to differences in sequence length and timing. To this

end, CarePre uses the event-to-vector and sequence align-ment techniques first introduced in ET2 [21]. Specifically, avector representation of each event in a set of sequences isfirst calculated based on a neural network model. Sequencesare then aligned temporally using a dynamic time workingalgorithm (DTW) [34], and distances are calculated usingthe event vectors. The algorithm measures similarity betweensequences by estimating the similarity between each pair ofevents respectively in these sequences based on the Euclideandistance of the corresponding event vectors.
2) Visualization.: The patient similarity view displays eventsequence data for both the focal patient and the patients mostsimilar to him/her. The event sequences for similar patients arealigned to the focal patient and visualized in parallel as shownin Fig. 5(a). We divide each of the similar sequences into twoparts: (1) a history section, which best matches with focalpatient’s historical medical records up to the current point intime (Fig. 5(a-1)), and (2) an outcome section which depictsthe outcomes observed for the similar patients in comparisonto the predicted outcome results for the focal patient (Fig. 5(a-2)). This view adopts a visual design that is similar to theprediction view.
To support more effective one-to-many comparison betweenthe focal patient and the set of selected similar patients,we aggregate the medical event sequences for the similarpatients into a flow-based visualization that illustrates theoverall evolution of diseases and treatments within the groupover time. In this view, each medical event is visualized asa compound rectangular. The height of the node representsthe number of patients with the corresponding event at thecorresponding time stage, which is also displayed as a textlabel in the leading rectangle (Fig. 5(b-1)). The node’s middlerectangle (Fig. 5(b-2)) shows the event name. Finally, severalconnection glyphs on the right edge of the node (Fig. 5(b-3))depict connections (via the linking lines) to subsequent nodeswhich occur in the next time stage (Fig. 5(b-4)). The height ofeach connection glyph indicates the number of patients whosemedical record includes the corresponding event transition.The width of the connection glyphs corresponds to the averageduration of the transition.
D. Treatment Outcome Analysis
The CarePre system provides a set of interactive analysiscapabilities to identify key factors that effect the predictionresults, and make more informed treatment plan decisions.This is accomplished through interactions that edit the focalpatient’s event within the prediction view (Fig. 1(b)) and visualcomparison of the edited seqeunces in the outcome analysisview (Fig. 1(h)).
The outcome analysis capability is summarized in Fig. 6.Users can edit the focal patient’s original event sequenceusing four interactive operations: (1) adding a new event,(2) removing an existing event, (3) adjusting the order ofevents, and (4) changing the duration between events. Updatedprediction results are calculated in real time in response to anyedit operation is performed, and users have the option to save
Fig. 6. We enable four interactions for outcome analysis: Removing,Moving, Duration Adjustment, and Adding. The adjusted event sequencesare highlighted on the left side with annotations as shown in the figure. Thecorresponding predicted outcomes are shown on the right side of the view.
an edited event sequence (and resulting prediction) as a newentry within the outcome analysis view. This allows cliniciansto compare edited event sequences to explore how changesin a patient’s medical record (i.e., a new treatment, or theabsence of a co-morbidity) impacts the prediction results. Tosupport this activity, the view highlights each of the user’sevent sequence edits in orange (Fig. 6), and uses coordinatedhighlighting to link predictions of the same medical eventacross edited sequences (e.g., the same predicted diagnosis ap-pearing for two different edited versions of the focal patient’smedical record). Users can also zoom in/out on the predictionbox to retrieve more detailed views. These interactions helpcommunicate changes in risk between sequences, especiallywhen the same events (but with different probability) arepredicted for alternative edited sequences.
A common use case for these features is when a physicianinvestigates the potential outcomes of different treatments. Thephysician can create multiple edited sequences by adding thepotential treatment events to the end of the focal patient’soriginal medical record. Viewing the predicted results underthe assumption of alternative treatments can help the clinicianunderstand the impact of each treatment option. Alternatively,a physician could create alternative versions of a patient’smedical record by removing individual events. This wouldfacilitate model interpretation by allowing a clinician to seethe impact of a given feature on the prediction result.
Finally, to support further analysis of the contribution ofkey events to the predicted outcomes, CarePre computes thedegree to which of each potential treatment is associatedwith each of the prediction targets within the similar patientpopulation. These associations are displayed in the significanceview (Fig. 1(i)) as a matrix where each row is a treatmentgroup and each column is a predicted disease. The rows areclustered to group related treatments using the event-vectortechnique presented earlier in this section.
Each cell in the matrix includes a diagram that shows thechange of a disease’s mean occurrence probability (shownin y-axis) and 95% confidence interval within the subset ofsimilar patients with the treatment (left plot) vs. those withoutthe treatment (right plot). Cells with statistically significant

Retain Retain ExtendedNeg Log Likelihood 0.2834± 0.0036 0.2768 ± 0.0036
AUC 0.8294± 0.0022 0.8307 ± 0.0026Precision 0.8126± 0.0053 0.8126± 0.0054Recall@2 0.6859± 0.0081 0.6943 ± 0.0082Recall@4 0.8954± 0.0027 0.8973 ± 0.0032
TABLE ICOMPARISON OF PREDICTION PERFORMANCE
differences are highlighted with a white background.
V. EVALUATION
This section presents results from three forms of evaluation:quantitative experiments to measure the prediction model’sperformance, a case study with a senior Chinese physician,and interviews with three physicians in both USA and China.
A. Evaluation of the Prediction Model
We compared the performance of our model (with ex-tensions for multi-event prediction) to the original Retainsingle-event prediction model [12] from which our model wasderived. More specifically, medical records for patients withcardiovascular disease and at least one hospitalization werechosen from the MIMIC dataset, and their medical recordswere transformed into one or more event sequences based ona 6-month time window. Each sequence ended at a hospitaladmission event and started six months prior. As a result,7,537 patients were selected and 64,269 sequence sampleswere generated. These samples were divided into the trainingand testing sets using a 7:3 ratio. We further cleaned thesequences by preserving only diagnosis and treatment events.Both the original and extended Retain models were trainedusing the training samples to predict the risk of five highlyprevalent heart and cardiovascular diseases. The disease riskswere simultaneously predicted using a single extended Retainmodel. Meanwhile, five independent models (one for eachdisease) were trained for the original Retain model design. Theperformance measurements in Table I show that our extendedmodel performed similarly to (slightly better than) the original.
B. Case Study
We conducted a case study with a senior inpatient car-diovascular doctor with over 20 years’ clinical experience inChina. During the study, we first introduced CarePre systemand the doctor was invited to use the system for himself.After getting familiar with the system’s functions, the doctorwere asked to perform a series of tasks including interpretingprediction results, making a treatment decision, and estimatingthe future outcomes for different treatment plans. The studylasted for about two hours, and the doctor was encouraged toask questions or make comments at any time.
Fig. 7 shows the results of our study. After reviewing thepatient’s historical medical records (Fig. 7(a)), the doctor said“this patient is being treated with some typical medicines suchas metoprolol and furosemide.” He also noted that the patientsuffered from diabetes after noticing regular insulin injectionswithin their medical records. According to the predictionresults, the patient had a high risk of heart failure in the future.The doctor mentioned “it is possible as the diabetes may leadto coronary disease and finally develop into heart failure.”
The doctor was impressed by the similar patient view (theaggregated form) as shown in Fig. 7(b). He selected the groupof patients with heart failure for further inspection, and thecorresponding disease progression paths were automaticallyhighlighted by the system. He believed this view was “veryinformative,” and that the click-to-highlight function was ableto “clearly show the progression of an outcome in contextof treatments.” He felt this view gave him more confidencein the prediction results as “it provides specific evidence [tosupport the prediction results].” He also mentioned that thisview would be particularly useful for medical researchers as “itillustrates many examples following different treatment plans”(see annotations in Fig. 7(b)).
The doctor was also interested in the system’s outcomeanalysis function. Specifically, he first made a care plan forthe focal patient by adding multiple treatments (e.g., fentanyl,furosemide, insulin, and metoprolol) to the end of the patientsexisting medical record as shown in Fig 7(d). In response, therisk of heart failure and hypertensive disease both decreased.Next, the doctor removed all of the events for furosemide(a common medicine used for heart failure patients to treatfluid build-up) from the sequence, resulting in a significantincrease heart failure risk. This also revealed in the view seenin Fig. 7(c), showing, for example, that injections of insulinhad a significant effect on reducing the risk of heart failure.Finally, the doctor moved all insulin to the end of the sequenceto mimic a scenario in which the patient delayed diabetestreatment. This resulted in a further increase in heart failurerisk. The correctness of the various predictions were verifiedby the doctor.
C. Domain Expert Interview
In addition to the case study, we conducted in-depth inter-views with three other senior physicians. To avoid bias, thesedoctors were different from the doctors interviewed in thepilot study. Two of the three physicians were Chinese doctors(E1,2), each with 15 years of clinical experience in treatingcardiovascular diseases. The third expert (E3) was a seniorphysician in USA. During each interview, doctors were given ahalf-hour interactive demonstration of our system. The doctorswere then invited to use the system on their own. We providedthe doctors with the case study tasks as a reference, but theywere encouraged to freely experiment with the system. Afterthe experts were finished exploring the system’s functionality,we conducted a semi-structured interview which incorporatedseveral questions about overall usefulness, ease of use, generalpros and cons of the prototype system, visualization designs,and insights obtained from using the system. Each interviewlasted for approximately 1.5 hours, and the entire session wasrecorded. We summarize the collected feedback into threethemes.
1) Diagnosis Support: All three experts appreciated oursystem design and believed that estimating the risk of potentialdiseases for a patient was useful and helpful in their dailywork. All three felt that the system could contribute to animproved diagnosis process. E1 said “I need to take care of
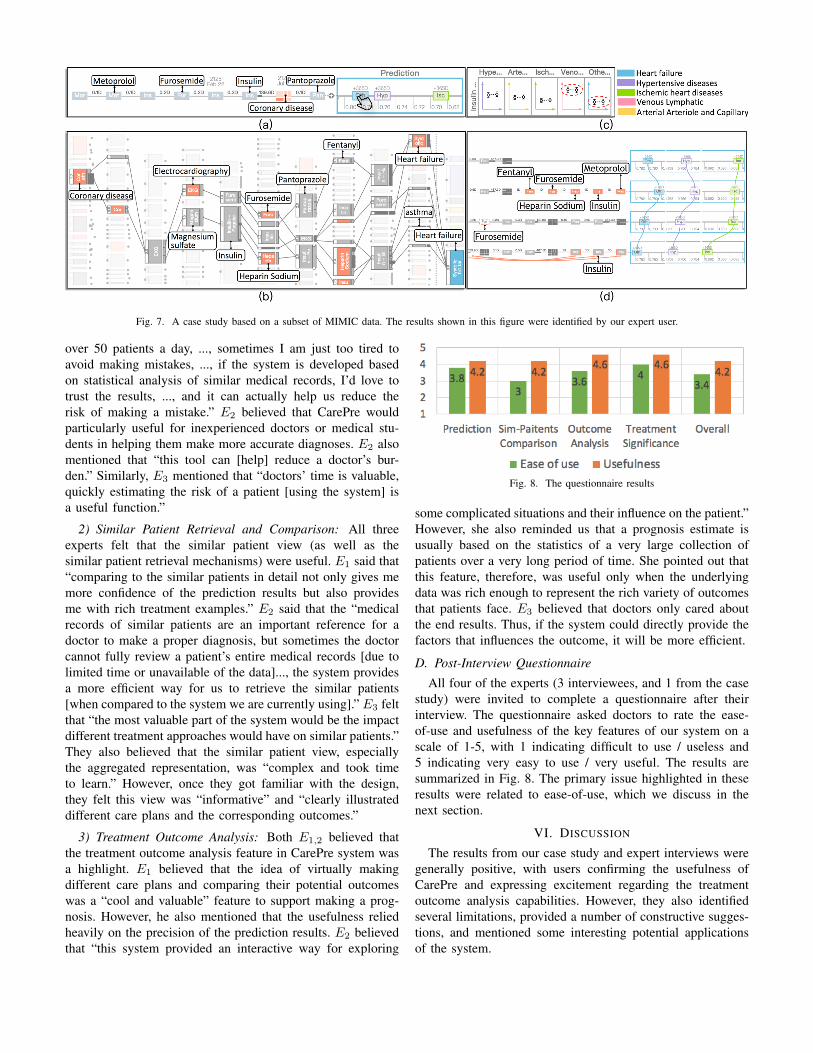
Fig. 7. A case study based on a subset of MIMIC data. The results shown in this figure were identified by our expert user.
over 50 patients a day, ..., sometimes I am just too tired toavoid making mistakes, ..., if the system is developed basedon statistical analysis of similar medical records, I’d love totrust the results, ..., and it can actually help us reduce therisk of making a mistake.” E2 believed that CarePre wouldparticularly useful for inexperienced doctors or medical stu-dents in helping them make more accurate diagnoses. E2 alsomentioned that “this tool can [help] reduce a doctor’s bur-den.” Similarly, E3 mentioned that “doctors’ time is valuable,quickly estimating the risk of a patient [using the system] isa useful function.”
2) Similar Patient Retrieval and Comparison: All threeexperts felt that the similar patient view (as well as thesimilar patient retrieval mechanisms) were useful. E1 said that“comparing to the similar patients in detail not only gives memore confidence of the prediction results but also providesme with rich treatment examples.” E2 said that the “medicalrecords of similar patients are an important reference for adoctor to make a proper diagnosis, but sometimes the doctorcannot fully review a patient’s entire medical records [due tolimited time or unavailable of the data]..., the system providesa more efficient way for us to retrieve the similar patients[when compared to the system we are currently using].” E3 feltthat “the most valuable part of the system would be the impactdifferent treatment approaches would have on similar patients.”They also believed that the similar patient view, especiallythe aggregated representation, was “complex and took timeto learn.” However, once they got familiar with the design,they felt this view was “informative” and “clearly illustrateddifferent care plans and the corresponding outcomes.”
3) Treatment Outcome Analysis: Both E1,2 believed thatthe treatment outcome analysis feature in CarePre system wasa highlight. E1 believed that the idea of virtually makingdifferent care plans and comparing their potential outcomeswas a “cool and valuable” feature to support making a prog-nosis. However, he also mentioned that the usefulness reliedheavily on the precision of the prediction results. E2 believedthat “this system provided an interactive way for exploring
Fig. 8. The questionnaire results
some complicated situations and their influence on the patient.”However, she also reminded us that a prognosis estimate isusually based on the statistics of a very large collection ofpatients over a very long period of time. She pointed out thatthis feature, therefore, was useful only when the underlyingdata was rich enough to represent the rich variety of outcomesthat patients face. E3 believed that doctors only cared aboutthe end results. Thus, if the system could directly provide thefactors that influences the outcome, it will be more efficient.
D. Post-Interview Questionnaire
All four of the experts (3 interviewees, and 1 from the casestudy) were invited to complete a questionnaire after theirinterview. The questionnaire asked doctors to rate the ease-of-use and usefulness of the key features of our system on ascale of 1-5, with 1 indicating difficult to use / useless and5 indicating very easy to use / very useful. The results aresummarized in Fig. 8. The primary issue highlighted in theseresults were related to ease-of-use, which we discuss in thenext section.
VI. DISCUSSION
The results from our case study and expert interviews weregenerally positive, with users confirming the usefulness ofCarePre and expressing excitement regarding the treatmentoutcome analysis capabilities. However, they also identifiedseveral limitations, provided a number of constructive sugges-tions, and mentioned some interesting potential applicationsof the system.

A. Limitations
The major limitations of CarePre system include ease-of-use, data quality, and a lack input methods.
1) Ease-Of-Use: Although all of the experts acknowledgedthe usefulness of the system, they also mentioned that learninghow to use it took essential time away from a doctor. All ofthe experts were familiar with traditional statistical diagramssuch as histograms and line charts, however they needed somepractice to read some of the more complex views introduced inCarePre . However, they also believed these new designs weremore informative when compared to more familiar statisticalcharts. They also felt that the difficulty mainly comes fromthe lack training. For example, E2 said “we (doctors) spendyears in school to learn how to make diagnosis based onthose [traditional] statistical tools and diagrams, ..., your toolis obviously more informative but we just need more time toget familiar with it.” Second, operating multiple coordinatedviews also take some effort. Both E1,3 mentioned that it wouldeasier to use if the tool could directly generate and print outa report without as many interactions. E3 also said “it willbe easier to use if you could somehow separate the views ofthree different functions apart into multiple pages and guidethe operation in a step to step manner instead of packing themall together.”
2) Data Quality: The Chinese physicians were concernedabout the quality of the training data which directly influencedon our analysis results. Both E1,2 mentioned that the qualityof the electronic health records collected in Chinese hospitalswere much worse than that of the MIMIC dataset. Theymentioned that in medical data in China was primarily free-text, and that many hospitals in China were just started to useelectronic health record systems. That limits the longitudinalextent of data that could be used as input to the system. Forthis reason, they believed that CarePre might not be as usefulin Chinese hospitals right away. E3 also mentioned that thetreatment outcome analysis should be based on a larger datasetcollected within a longer time window (e.g., several years).Although the current system demonstrated the usefulness ofthe function, more data will need to be imported into thesystem before being applied in real clinical scenarios.
3) Lack of input methods: E1 also felt that althoughCarePre was useful, the design was not sufficient as it haslimited ways for clinicians to enter new medical data. Inparticular, she said “when compared to the existing system,your tool focus more on the analysis, but lacks of a convenientmethod for me to enter medical records in the text form”.
B. Implications
Our experts also raised many implications of the system,which can be summarized into two broad categories.
1) From Knowledge-Sharing to Experience-Sharing: All ofthe experts believed that CarePre would be especially usefulfor junior physicians, medical students or other inexperiencedhealth professionals. They believed that since the predictionmodel in CarePre is trained based on the treatment records
made by experienced physicians, it would capture those doc-tors’ experiences. In comparison, most existing knowledge-based systems only share medical knowledge. In particular,E1,2 mentioned that in China there are many undeveloped ruralareas with poor health systems where doctors are less experi-enced and less well-trained. The CarePre system would helpprovide information to these doctors based on the experienceof more senior clinicians. This maps to typical doctor trainingtechniques, where doctors first learn from medical textbooksbefore a long period of training under the supervision of seniordoctors to help them gain knowledge through experience.
2) From Doctors to Other Users: Our experts also sug-gested many other potential application scenarios for theCarePre system. For example, E1 believed that our systemwould be very useful for analysts in a medical insurancecompany. “It can help an insurance company estimate the riskof a patient in a more efficient way" said by E1. Both E1
and E2 mentioned that our tool could be very helpful formedical research as it is “build based on statistical analysisand provides many advanced visual diagrams, illustrating theevidence of the analysis results". Both E2 and E3 felt thatCarePre system could also be directly used by a patient as “itsuggests the risk a patient may have" and “the patient maywant to spend more time investigating the functionality ofthe system". These scenarios greatly expend the applicationscope of CarePre system, though certain design changes maybe required for different applications.
VII. CONCLUSION
This paper introduced an intelligent clinical decision assis-tance system, CarePre , that uses large-scale EHR data to helpphysicians make decisions during their clinical workflow. Thesystem, designed based on requirements identified in a pilotstudy, provides clinical assistance through a state-of-the-artdeep learning prediction model as well as an interactive visualinterface for exploration and interpretation. The interactionpipeline of our system, consists of three major steps: (1)diagnosis support, (2) similar patients retrieval and compar-ison, and (3) treatment outcome analysis. We evaluated thesystem via a case study, expert interviews, and a quantitativeevaluation of the predictive model. The results from theseevaluations showed that the overall system provided valuableassistance to the clinical decision process. In the future, weplan to address the aforementioned issues and conduct a largerevaluation of the system in a local hospital so as to update thesystem’s models based on local patients’ conditions.
REFERENCES
[1] U Rajendra Acharya, Hamido Fujita, Shu Lih Oh, Yuki Hagiwara,Jen Hong Tan, and Muhammad Adam. Application of deep convolu-tional neural network for automated detection of myocardial infarctionusing ecg signals. Information Sciences, 415:190–198, 2017.
[2] Adrian Benton, Margaret Mitchell, and Dirk Hovy. Multi-task learningfor mental health using social media text. arXiv, 1712.03538, 2017.
[3] Eta S Berner and Tonya J La Lande. Overview of clinical decisionsupport systems. In Clinical decision support systems, pages 3–22.Springer, New York, 2007.

[4] Eta S Berner, George D Webster, Alwyn A Shugerman, James RJackson, James Algina, Alfred L Baker, Eugene V Ball, C Glenn Cobbs,Vincent W Dennis, Eugene P Frenkel, et al. Performance of fourcomputer-based diagnostic systems. New England Journal of Medicine,330(25):1792–1796, 1994.
[5] David Blumenthal and Marilyn Tavenner. The âAIJmeaningful useâAIregulation for electronic health records. New England Journal ofMedicine, 363(6):501–504, 2010.
[6] Leo Breiman et al. Statistical modeling: The two cultures (withcomments and a rejoinder by the author). Statistical science, 16(3):199–231, 2001.
[7] Jerome H Carter. Electronic medical records: a guide for clinicians andadministrators. ACP Press, Washington, 2001.
[8] Jerome H Carter. Design and implementation issues. In ClinicalDecision Support Systems, pages 64–98. Springer, New York, 2007.
[9] Ajay P Chainani, Santosh S Chikne, Nikunj D Doshi, Asim Z Karel,and Shanthi S Therese. Disease inference from health-related questionsvia fuzzy expert system. In Information and Communication Technologyfor Sustainable Development, pages 91–102. Springer, Singapore, 2018.
[10] Kumardeep Chaudhary, Olivier B Poirion, Liangqun Lu, and Lana XGarmire. Deep learning based multi-omics integration robustly predictssurvival in liver cancer. Clinical Cancer Research, 24(6):1248–1259,2017.
[11] Edward Choi, Mohammad Taha Bahadori, Andy Schuetz, Walter F Stew-art, and Jimeng Sun. Doctor ai: Predicting clinical events via recurrentneural networks. In Machine Learning for Healthcare Conference, pages301–318, Los Angeles, 2016. PMLR.
[12] Edward Choi, Mohammad Taha Bahadori, Jimeng Sun, Joshua Kulas,Andy Schuetz, and Walter Stewart. Retain: An interpretable predictivemodel for healthcare using reverse time attention mechanism. InAdvances in Neural Information Processing Systems, pages 3504–3512.Curran Associates, 2016.
[13] Jesse C Crosson, Christine Stroebel, John G Scott, Brian Stello, andBenjamin F Crabtree. Implementing an electronic medical record in afamily medicine practice: communication, decision making, and conflict.The Annals of Family Medicine, 3(4):307–311, 2005.
[14] Padideh Danaee, Reza Ghaeini, and David A Hendrix. A deep learningapproach for cancer detection and relevant gene identification. In Pacificsymposium on biocomputing, pages 219–229. World Scientific, 2017.
[15] PS Dayan, DW Ballard, E Tham, JM Hoffman, M Swietlik, SJ Deakyne,EA Alessandrini, L Tzimenatos, L Bajaj, DR Vinson, et al. Use oftraumatic brain injury prediction rules with clinical decision support.Pediatrics, 139(4):e20162709, 2017.
[16] Fan Du, Catherine Plaisant, Neil Spring, and Ben Shneiderman. Even-taction: Visual analytics for temporal event sequence recommendation.In Visual Analytics Science and Technology, pages 61–70, Baltimore,2016. IEEE.
[17] Fan Du, Catherine Plaisant, Neil Spring, and Ben Shneiderman. Findingsimilar people to guide life choices: Challenge, design, and evaluation.In Proceedings of the CHI Conference on Human Factors in ComputingSystems, pages 5498–5544, New York, 2017. ACM.
[18] Srinivas Emani, David Y Ting, Michael Healey, Stuart R Lipsitz,Andrew S Karson, and David W Bates. Physician beliefs about themeaningful use of the electronic health record: A follow-up study.Applied clinical informatics, 8(04):1044–1053, 2017.
[19] David Gotz and Harry Stavropoulos. Decisionflow: Visual analyticsfor high-dimensional temporal event sequence data. Transactions onvisualization and computer graphics, 20(12):1783–1792, 2014.
[20] Richard W Grant, Jonathan S Wald, Jeffrey L Schnipper, Tejal K Gandhi,Eric G Poon, E John Orav, Deborah H Williams, Lynn A Volk, andBlackford Middleton. Practice-linked online personal health records fortype 2 diabetes mellitus: a randomized controlled trial. Archives ofinternal medicine, 168(16):1776–1782, 2008.
[21] Shunan Guo, Zhuochen Jin, David Gotz, Fan Du, Hongyuan Zha,and Nan Cao. Visual progression analysis of event sequence data.Transactions on visualization and computer graphics, pages 1–1, 2018.
[22] Nils Yannick Hammerla, James Fisher, Peter Andras, Lynn Rochester,Richard Walker, and Thomas Plötz. Pd disease state assessment innaturalistic environments using deep learning. In Proceedings of theConference on Artificial Intelligence, pages 1742–1748, Austin, 2015.AAAI Press.
[23] Sepp Hochreiter and Jürgen Schmidhuber. Long short-term memory.Neural computation, 9(8):1735–1780, 1997.
[24] Abhyuday N Jagannatha and Hong Yu. Bidirectional rnn for medicalevent detection in electronic health records. In Proceedings of theconference. Association for Computational Linguistics, page 473. NIHPublic Access, 2016.
[25] Alistair EW Johnson, Tom J Pollard, Lu Shen, H Lehman Li-wei, Mengling Feng, Mohammad Ghassemi, Benjamin Moody, PeterSzolovits, Leo Anthony Celi, and Roger G Mark. Mimic-iii, a freelyaccessible critical care database. Scientific Data, 3:160035, 2016.
[26] Josua Krause, Adam Perer, and Kenney Ng. Interacting with predictions:Visual inspection of black-box machine learning models. In Proceedingsof the CHI Conference on Human Factors in Computing Systems, pages5686–5697, New York, 2016. ACM.
[27] Gilad J Kuperman, Dean F Sittig, M Michael Shabot, and J Teich.Clinical decision support for hospital and critical care. Journal ofHealthcare Information Management, 13:81–96, 1999.
[28] GB Erturkmen Laleci, Mustafa Yuksel, Bunyamin Sarigul, MikaelLilja, Rong Chen, and Theodoros N Arvanitis. Personalised care planmanagement utilizing guideline-driven clinical decision support systems.Studies in health technology and informatics, 247:750–754, 2018.
[29] Vernon Lawhern, Amelia Solon, Nicholas Waytowich, Stephen M Gor-don, Chou Hung, and Brent J Lance. Eegnet: a compact convolutionalneural network for eeg-based brain–computer interfaces. Journal ofneural engineering, 15(5):056013, 2018.
[30] Mengchen Liu, Jiaxin Shi, Kelei Cao, Jun Zhu, and Shixia Liu. Ana-lyzing the training processes of deep generative models. Transactionson visualization and computer graphics, 24(1):77–87, 2018.
[31] Mengchen Liu, Jiaxin Shi, Zhen Li, Chongxuan Li, Jun Zhu, and ShixiaLiu. Towards better analysis of deep convolutional neural networks.Transactions on visualization and computer graphics, 23(1):91–100,2017.
[32] George M Marakas. Decision support systems in the 21st century,volume 134. Prentice Hall Upper Saddle River, 2003.
[33] Megan Monroe, Rongjian Lan, Hanseung Lee, Catherine Plaisant, andBen Shneiderman. Temporal event sequence simplification. Transactionson visualization and computer graphics, 19(12):2227–2236, 2013.
[34] Meinard Müller. Dynamic time warping. Information retrieval for musicand motion, pages 69–84, 2007.
[35] Mark A Musen, Blackford Middleton, and Robert A Greenes. Clinicaldecision-support systems. In Biomedical informatics, pages 643–674.Springer, London, 2014.
[36] Anh Nguyen, Jason Yosinski, and Jeff Clune. Deep neural networks areeasily fooled: High confidence predictions for unrecognizable images.In Proceedings of the Conference on Computer Vision and PatternRecognition, pages 427–436, Boston, 2015. IEEE.
[37] Adam Perer and David Gotz. Data-driven exploration of care plans forpatients. In CHI Extended Abstracts on Human Factors in ComputingSystems, pages 439–444, Paris, 2013. ACM.
[38] Adam Perer, Fei Wang, and Jianying Hu. Mining and exploring carepathways from electronic medical records with visual analytics. Journalof biomedical informatics, 56:369–378, 2015.
[39] Abdur Rais and Ana Viana. Operations research in healthcare: a survey.International transactions in operational research, 18(1):1–31, 2011.
[40] Pranav Rajpurkar, Awni Y Hannun, Masoumeh Haghpanahi, CodieBourn, and Andrew Y Ng. Cardiologist-level arrhythmia detection withconvolutional neural networks. arXiv, 1707.01836, 2017.
[41] Daniele Ravi, Charence Wong, Benny Lo, and Guang-Zhong Yang.Deep learning for human activity recognition: A resource efficientimplementation on low-power devices. In Wearable and ImplantableBody Sensor Networks, pages 71–76, San Francisco, 2016. IEEE.
[42] Enrique Rodriguez-Borja, Africa Corchon-Peyrallo, Esther Barba-Serrano, Celia Villalba Martínez, and Arturo Carratala Calvo. âAIJsend& holdâAI clinical decision support rules improvement to reduce un-necessary testing of vitamins a, e, k, b1, b2, b3, b6 and c. ClinicalChemistry and Laboratory Medicine, 56(7):1063–1070, 2018.
[43] Amir Salehipour and Mohammad Mehdi Sepehri. Exact and heuristicsolutions to minimize total waiting time in the blood products distribu-tion problem. Advances in Operations Research, page 25, 2012.
[44] Ewout W Steyerberg. Clinical prediction models: a practical approachto development, validation, and updating. Springer, 2008.
[45] Hendrik Strobelt, Sebastian Gehrmann, Hanspeter Pfister, and Alexan-der M Rush. Lstmvis: A tool for visual analysis of hidden statedynamics in recurrent neural networks. Transactions on visualizationand computer graphics, 24(1):667–676, 2018.
[46] Thomas Unterthiner, Andreas Mayr, Günter Klambauer, and SeppHochreiter. Toxicity prediction using deep learning. arXiv, 1503.01445,2015.
[47] Krist Wongsuphasawat and David Gotz. Outflow: Visualizing patientflow by symptoms and outcome. In IEEE VisWeek Workshop on VisualAnalytics in Healthcare, pages 25–28. American Medical InformaticsAssociation, 2011.
[48] Po-Yen Wu, Chih-Wen Cheng, Chanchala D Kaddi, Janani Venugopalan,Ryan Hoffman, and May D Wang. –omic and electronic health recordbig data analytics for precision medicine. Transactions on biomedicalengineering, 64(2):263–273, 2017.
[49] Shuai Xiao, Junchi Yan, Mehrdad Farajtabar, Le Song, Xiaokang Yang,and Hongyuan Zha. Joint modeling of event sequence and time serieswith attentional twin recurrent neural networks. arXiv, 1703.08524,2017.

[50] Yan Yan, Xinbing Qin, Yige Wu, Nannan Zhang, Jianping Fan, and LeiWang. A restricted boltzmann machine based two-lead electrocardiogra-phy classification. In Wearable and Implantable Body Sensor Networks,pages 1–9. IEEE, 2015.
[51] Zhen-Jie Yao, Jie Bi, and Yi-Xin Chen. Applying deep learning to indi-vidual and community health monitoring data: A survey. InternationalJournal of Automation and Computing, 2018.
[52] S Yousefi, F Amrollahi, M Amgad, C Dong, JE Lewis, C Song,DA Gutman, SH Halani, JE Vega Velazquez, DJ Brat, et al. Predictingclinical outcomes from large scale cancer genomic profiles with deepsurvival models. Scientific Reports, 7(1):11707, 2017.
[53] Liang Zhao, Jiangzhuo Chen, Feng Chen, Wei Wang, Chang-Tien Lu,and Naren Ramakrishnan. Simnest: Social media nested epidemicsimulation via online semi-supervised deep learning. In Data Mining(ICDM), pages 639–648, Atlantic City, 2015. IEEE.
[54] Bin Zou, Vasileios Lampos, Russell Gorton, and Ingemar J Cox. Oninfectious intestinal disease surveillance using social media content.In Proceedings of the International Conference on Digital HealthConference, volume 6, pages 157–161, New York, 2016. ACM.