career and technical education in michigan: access …
TRANSCRIPT

JANUARY 2020
KEY FINDINGS:Approximately half of all Michigan students enroll in at least one CTE course during high school. Business, marketing, and health sciences are the most popular programs.
Female, Black, Hispanic, and economically disadvantaged students are less likely to participate in CTE. These differences are smaller among students who attend the same high school, suggesting disparities in opportunity rather than student demand drive statewide participation gaps.
More than 500,000 skilled trades jobs are expected to become available in Michigan through 2026, primarily in construction, manufacturing, healthcare, automotive technology, and information technology. While many CTE programs align with these high-demand fields, some exhibit low participation and completion rates.
1.
2.
3.
POLICY BRIEF | YOUTH POLICY LAB | GEORGIA POLICY LABS1
CAREER AND TECHNICAL EDUCATION IN MICHIGAN: ACCESS AND PARTICIPATION

2
CTE IN MICHIGAN: ACCESS AND PARTICIPATION
Despite record low unemployment and continued economic expansion in the U.S., economic insecurity remains pervasive throughout the population. Nearly 40 million Americans live in poverty and more than 8% of workers hold multiple jobs to make ends meet.i,ii
Facing these prospects, the path to economic security is unclear for many young people – especially those from disadvantaged backgrounds. Recent estimates indicate that a child born into the bottom fifth of the income distribution has just a 7.5% chance of reaching the top fifth in adulthood.iii,iv
While the idea of sending every student to college once enjoyed broad support as a means of combating these trends, the limits of this approach have become apparent. Approximately 40% of students who start college never obtain a degree. The statistics are even worse for low-income students, a mere 16% of whom ultimately graduate.v, vi Moreover, the share of student borrowers with more than $50,000 of debt increased from 2% in 1992 to 17% in 2014.vii Those interested in providing future generations with pathways to economic security thus face a difficult challenge. At a time when poverty and inequality are becoming entrenched in society, postsecondary education is proving an unreliable solution for many.
In part as a result of these trends, high school career and technical education (CTE) programs have emerged as a popular strategy for improving young people’s chances of finding – and keeping – stable jobs. Taught by former industry professionals and structured around hands-on projects, CTE aims to equip students with knowledge and skills to thrive in the workforce.
INTRODUCTIONGiven its potential to strengthen talent pipelines without requiring students to take on excessive debt, CTE has received bipartisan political support. Here in Michigan, both the Snyder (Republican) and Whitmer (Democrat) administrations have featured CTE in their plans to strengthen the state’s workforce. Under former Governor Snyder’s Marshall Plan for Talent, K-12 schools can receive grant funds by partnering with employers to develop or expand project-based curricula that lead to industry-recognized certificates (like those found in many CTE courses). In her first state budget recommendation, Governor Whitmer proposed changes to Michigan’s school funding formula to increase CTE resources by $50 million.viii
Despite this wealth of attention, we know relatively little about the efficacy of CTE programs. Stakeholders like parents, students, state and local administrators all have a vested interest in better understanding the predictors and outcomes of CTE participation. This brief aims to begin that conversation by shedding light on access to and enrollment in Michigan’s high school CTE programs.
Approximately 40% of students who start college never obtain a degree.
“”
POLICY BRIEF | YOUTH POLICY LAB | GEORGIA POLICY LABS

What is CTE?
High school CTE consists of coordinated course sequences, called Programs of Study, designed to prepare students to work in specific jobs. As of the 2018-19 school year, there were 52 state-recognized Programs of Study. All CTE programs in Michigan are organized around 16 federally recognized Career Clusters plus one in energy that the State petitioned to add. Although CTE is commonly conflated with traditional “vocational education” and therefore assumed to only involve the skilled trades, CTE actually encompasses a wide variety of fields. Programs range from auto collision repair to marketing to robotics. See the Appendix for a full list of programs and clusters.
Regardless of the Career Cluster in which they are housed, all programs share the common goal of fostering work readiness. Courses prioritize hands-on projects that mirror the workplace rather than the lecture format found in most traditional classrooms. They are taught by former industry professionals who must have 4,000 hours of recent and relevant work experience to receive teaching certification. As they progress through CTE programs, students are exposed to increasingly specialized content and may have the opportunity to earn industry-recognized credentials or college credit through their coursework. In some districts, students also have the opportunity to participate in internships and apprenticeships.
Programs of Study typically must cover 12 segments, which are groups of content standards set by the Michigan Department of Education Office of Career and Technical Education (MDE OCTE). An entire program’s worth of segments typically are distributed across three or four courses, which is modest relative to some other states. Students may stop a program at any point and are designated as participants, concentrators, or completers depending on how many segments they complete.
Relative to other aspects of education, local districts exercise a high degree of control over CTE operations. Michigan CTE programs are managed by a Career Education Planning District (CEPD), a group of geographically neighboring local educational districts. A CEPD administrator identifies the skills and programs needed in the region, and, in partnership with local schools, coordinates CTE program offerings across high schools and career academies. The CEPD administrator also creates new CTE programs and helps school districts improve existing programs.
Most CTE courses are housed at local schools or standalone technical centers, though some dual-enrollment programs operate on college campuses. If a specific program is not offered at a student’s local school, students may have the option to enroll in the program in a different school, district, intermediate school district (ISD), or area CTE center. Receiving districts ultimately decide whether or not to enroll students from neighboring districts. Enrollment in an ISD-, center-, or consortia-based program, however, is based on cooperative agreements among districts and ISDs.ix Districts provide busing for students who must travel to participate in a program.
3
CTE IN MICHIGAN: ACCESS AND PARTICIPATION
POLICY BRIEF | YOUTH POLICY LAB | GEORGIA POLICY LABS

How Popular is CTE?
Analyzing data from nine recent expected graduating classes (meaning an entering high school class identified by the year they were expected to graduate), we find that CTE is a common part of Michigan students’ high school experiences. Approximately half of each cohort has participated in at least one CTE course.
Figure 1: Roughly half of each expected graduating class participates in CTE during high school
Figure 2 focuses on the expected Class of 2018 to provide a recent snapshot of CTE in Michigan. Male students are roughly 20% (9 percentage points) more likely to participate in CTE than female students. A greater share of White students (54.2%) participate than do Black (41%) or Hispanic (44.1%) students. Economically disadvantaged students (i.e., those who qualify for free or reduced price lunch) participate at a level lower than the statewide average. Students who attend urban schools are significantly less likely to participate compared to students in suburban, town, and rural environments. Students enrolled in charter schools are 36 percentage points less likely to participate than their peers who attend traditional public schools.
Figure 2: CTE participation varies across groups among the expected class of 2018
4
While these data provide a broad overview of CTE enrollment in Michigan, we need to dig further to assess how participation compares across groups and communities. This is a relevant topic given current debates over CTE. Advocates claim that along with providing students valuable hard and soft skills directly relevant to the labor market, CTE can also motivate students to pursue additional education, either by completing high school or enrolling in specific postsecondary programs. Conversely, critics argue that CTE serves to track low-achieving and/or minority students into educational programs that do not prepare them for work beyond low-wage, entry-level positions. While this brief does not aim to settle this dispute, we can begin to shed light on what types of students are participating in CTE across Michigan.
We find similar patterns when examining completion rates, with the notable exception that female students are actually more likely than males to complete programs once enrolled. See the Appendix for further details.
The 17 distinct Career Clusters and 52 Programs of Study within CTE represent a broad spectrum of industries and occupations. We find that enrollment levels vary widely across clusters.
CTE IN MICHIGAN: ACCESS AND PARTICIPATION
POLICY BRIEF | YOUTH POLICY LAB | GEORGIA POLICY LABS
0%
25%
50%
75%
100%
'10 '11 '12 '13 '14 '15 '16 '17 '18
55%
46%
54%
44%
41%
50%
47%
41%
54%
54%
53%
39%
53%
16%
Male
Female
White
Hispanic
Black
Special Education
Economically Disadvantaged
Limited English Proficiency
Suburban
Rural
Town
Urban
Traditional Public School
Charter School
ALL STUDENTS51%
0% 60%

5
Figure 3: CTE participation varies by career cluster among the expected class of 2018
The most popular programs are business, marketing, and health sciences (see Figure 3). Public and human services exhibit the lowest participation levels. It is important to note that student interest is not the sole driver of program popularity. Because CTE courses are organized largely as project-based learning environments that afford students the opportunity to experience actual workplace conditions, certain programs require expensive equipment that can be cost prohibitive for some schools. This may explain why programs in business, marketing, and finance are so popular – they require little in the way of resources schools do not already possess.
CTE IN MICHIGAN: ACCESS AND PARTICIPATION
Can Access Explain Participation?
Figure 2 shows that Black, Hispanic, female, and economically disadvantaged students are less likely to participate in CTE programs throughout the state. The reason for these demographic participation gaps is unclear, however. On the one hand, it is possible that they result from lower relative interest in CTE (i.e., demand). On the other hand, it may be that students from these groups face reduced access to CTE programs (i.e., supply). That is, they may attend schools that typically offer fewer opportunities to participate in the first place.
Given this ambiguity, the ideal next step would be to identify the number of programs available to the typical student from each demographic group both within their own school and a reasonable driving distance. Juxtaposing these figures would allow us to determine whether and to what extent access is differentiated along racial, socioeconomic, or geographic lines. Unfortunately, comprehensive statewide data on which specific CTE programs are available at each high school does not yet exist.x The Youth Policy Lab is actively working with the available data to piece together this information.
In the meantime, we probe whether demographic participation gaps result from access to or demand for CTE by comparing students who attended the same high school. This allows us to “control for” access to CTE because all students within a school have the same number and types of programs available to them. We also employ a commonly used statistical technique called multiple regression analysis to account for a number of important student characteristics: gender, race/ethnicity, special education status, free or reduced lunch eligibility, neighborhood education level, eighth-grade attendance, and prior academic achievement as measured by standardized test scores. (See the Appendix for a full explanation of our analytic approach.)
POLICY BRIEF | YOUTH POLICY LAB | GEORGIA POLICY LABS
0% 20%
12%
11%
7%
7%
7%
5%
5%
5%
5%
5%
4%
3%
1%
1%
1%
< 1%
Business
Marketing
Health Sciences
Finance
Information Technology
Transportation
Agriculture
Arts, A/V & Communications
Architecture & Construction
STEM
Hospitality
Manufacturing
Education
Law, Public Safety & Security
Human Services
Government

6
Figure 4: The racial participation gap at the state level largely disappears at the school level, but the gender gap persists.
Note: For Black and Hispanic students the reference group is White students; for females it is males; for economically disadvantaged students it is economically secure students.
CTE IN MICHIGAN: ACCESS AND PARTICIPATION
If participation gaps shrink after looking within schools, this would indicate that participation differences at the state level result from unequal access across communities. If they persist (or grow), we can feel more confident that groups exhibit disparate levels of demand for CTE.
Figure 4 displays the results for the expected Class of 2018. Our results indicate that female students remain 9 percentage points less likely to participate in CTE relative to males who attend the same school. Racial disparities, however, are greatly diminished. The participation gap shrinks from roughly 12 percentage points for both Black and Hispanic students at the state level to 3 percentage points for the former and 2 points for the latter within schools. Students eligible for free or reduced price lunch become just 1 percentage point less likely to participate in CTE relative to their more affluent peers.
These results tell us that differences between school opportunities rather than student interest are driving racial and socioeconomic participation gaps at the state level. Female students, by contrast, seem to exhibit less demand for CTE compared to males.
Program Completion
While our analyses thus far have focused on participation levels, there are compelling reasons to investigate program completion rates as well. Current research indicates that the benefits of CTE enrollment are driven entirely by upper-level coursework, particularly in highly technical fields.xi This suggests that specialization in a field and completing a Program of Study may be critical. Indeed, Programs of Study are intentionally designed with this sort of progression in mind. MDE OCTE sets content standards to structure programs such that students are guided through a coherent sequence of training objectives. This raises the question of whether Michigan students are completing their programs and, moreover, whether they are more likely to complete some types of programs than others.
NO GAP
-15
-5
5
BLACK HISPANIC FEMALEECONOMICALLY
DISADVANTAGED
STATE LEVELparticipation gap
SCHOOL LEVELparticipation gap
POLICY BRIEF | YOUTH POLICY LAB | GEORGIA POLICY LABS
7
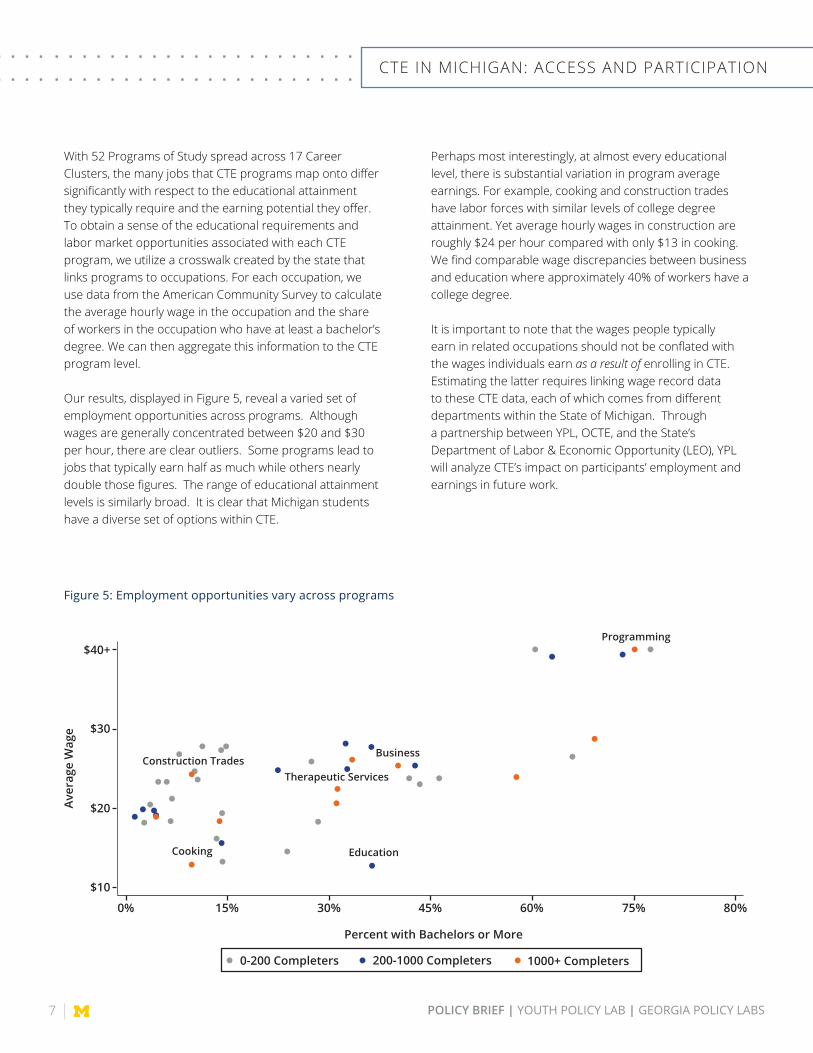
With 52 Programs of Study spread across 17 Career Clusters, the many jobs that CTE programs map onto differ significantly with respect to the educational attainment they typically require and the earning potential they offer. To obtain a sense of the educational requirements and labor market opportunities associated with each CTE program, we utilize a crosswalk created by the state that links programs to occupations. For each occupation, we use data from the American Community Survey to calculate the average hourly wage in the occupation and the share of workers in the occupation who have at least a bachelor’s degree. We can then aggregate this information to the CTE program level.
Our results, displayed in Figure 5, reveal a varied set of employment opportunities across programs. Although wages are generally concentrated between $20 and $30 per hour, there are clear outliers. Some programs lead to jobs that typically earn half as much while others nearly double those figures. The range of educational attainment levels is similarly broad. It is clear that Michigan students have a diverse set of options within CTE.
Perhaps most interestingly, at almost every educational level, there is substantial variation in program average earnings. For example, cooking and construction trades have labor forces with similar levels of college degree attainment. Yet average hourly wages in construction are roughly $24 per hour compared with only $13 in cooking. We find comparable wage discrepancies between business and education where approximately 40% of workers have a college degree.
It is important to note that the wages people typically earn in related occupations should not be conflated with the wages individuals earn as a result of enrolling in CTE. Estimating the latter requires linking wage record data to these CTE data, each of which comes from different departments within the State of Michigan. Through a partnership between YPL, OCTE, and the State’s Department of Labor & Economic Opportunity (LEO), YPL will analyze CTE’s impact on participants’ employment and earnings in future work.
Figure 5: Employment opportunities vary across programs
CTE IN MICHIGAN: ACCESS AND PARTICIPATION
Construction Trades
Cooking
Therapeutic Services
Business
Programming
Aver
age
Wag
e
Education
Percent with Bachelors or More
0-200 Completers 200-1000 Completers 1000+ Completers
$10
$20
$30
$40+
0% 15% 30% 45% 60% 75% 80%
POLICY BRIEF | YOUTH POLICY LAB | GEORGIA POLICY LABS

8
Table 1: Completion rates do not track participation rates
CTE IN MICHIGAN: ACCESS AND PARTICIPATION
Career Cluster Number of Completers Participation Rate Among All Students
Completion Rate Among Participants
Health Science 5,458 7.3% 64.6%
Marketing 4,256 10.6% 35.8%
Business 3,319 11.8% 24.3%
Information Technology 2,731 6.7% 33.6%
Arts & A/V 2,196 4.8% 40.4%
Finance 2,145 6.7% 28.6%
Architecture & Construction 2,036 4.8% 37.6%
Transportation 1,763 5.0% 30.7%
STEM 1,742 4.5% 32.4%
Manufacturing 1,716 3.4% 43.9%
Hospitality 1,535 3.7% 36.2%
Agriculture 1,516 5.0% 26.9%
Education 884 1.4% 55.5%
Law & Public Safety 867 1.2% 62.7%
Human Services 358 0.7% 46.4%
Government 89 0.4% 21.6%
POLICY BRIEF | YOUTH POLICY LAB | GEORGIA POLICY LABS
Some fields are especially relevant to Michigan’s continued economic recovery following the Great Recession. LEO has argued that convincing high school students to pursue careers in the skilled and professional trades is vital as more Baby Boomers retire.xii Over 500,000 skilled trades jobs are expected through 2026, primarily in construction, manufacturing, healthcare, automotive technology, and information technology.
Of the five Career Clusters that produce the most Completers, two are related to these high-demand fields: Health Science and Information Technology (see Table 1). With 5,458 completers among the expected Class of 2018, Health Science actually ranks as the highest among all clusters. Information Technology has produced the fourth-highest number of completers with 2,731. On the other hand, Marketing and Business, fields the state has not identified as likely to spur job growth, produce the second- and third-most completers (4,256 and 3,319, respectively). The three other “high-demand” fields – Construction, Transportation, and Manufacturing – have each produced similar numbers that rank near the middle of the pack among all clusters.
The number of students who complete a program is driven by both the number who participate and the fraction of participants who go on to complete. For this reason, it is important to consider both completion and participation rates when identifying ways to increase the number of completers in high-demand fields. While Health Science excels in both respects, the remaining four high-demand clusters would seem to require varying approaches. Table 1 shows that although Manufacturing and Construction exhibit decent completion rates, they have relatively low rates of participation. Conversely, Information Technology and Transportation are popular programs but turn only one out of every three participating students into a completer.
A couple of important caveats apply here. First, failing to complete a program is not necessarily an undesirable outcome. By trying a program, students may learn about their level of interest and comparative advantages in a given profession. Discovering that they ultimately wish to pursue a different path can be instructive. Second, as stated above, we have yet to rigorously study CTE’s effects on employment outcomes. The relationships we highlight here are merely descriptive and motivate future analyses.

9
Policymakers interested in providing future generations with pathways to economic security face a puzzling dilemma. Although poverty and inequality have been on the rise for some time, there is compelling reason to believe that postsecondary education – long considered the surest way to counter these forces – may not be the most effective route to long-term economic success for all young people. A significant share of students who begin college never obtain a degree and an increasing share of students are borrowing large sums to finance their educations. Thus, society must explore additional opportunities to equip young people with the knowledge and skills to buffer against the danger of economic insecurity. CTE represents a promising way of accomplishing that goal.
Here in Michigan, CTE is already a common part of many students’ high school experiences. Roughly half of each recent cohort has enrolled in CTE at some point during high school. That said, our analysis suggests that some racial groups may have substantively differential access to CTE. We see that Black and Hispanic students are less likely than their White peers to enroll in CTE at the state level but are essentially just as likely to participate within a given school. This finding highlights the need for continued research on how access to CTE may vary across communities. Ultimately, we need more comprehensive data on CTE course availability to support the State in their efforts to better understand CTE delivery in Michigan schools.
CONCLUSIONS AND POLICY IMPLICATIONS
We also presently lack compelling evidence about which programs (if any) lead to improved labor market outcomes. While states, districts, and even schools exercise a great deal of control over CTE program design and delivery compared to other aspects of education, we do not know much about the relationship between CTE and earnings or employment, for example. This is particularly problematic because CTE programs cover a wide range of industries and it is likely that costs and benefits of each similarly vary. Nuanced and reliable estimates of the effects of CTE participation, therefore, could help administrators make more informed decisions about how to allocate scare resources towards programs with the greatest chances of improving economic opportunity. The YPL research team will begin to shed light on this area in future work.
CTE IN MICHIGAN: ACCESS AND PARTICIPATION
POLICY BRIEF | YOUTH POLICY LAB | GEORGIA POLICY LABS

10
ENDNOTES
Beckhusen, J. (2019). Multiple jobholders in the United States: 2013. U.S. Census Bureau. Current Population Reports. P70BR-163.
Fontenot, K., Semega, J., & Kollar, M. (2018). Income and poverty in the United States: 2017. U.S. Census Bureau. Current Population Reports. P60-263.
Saez, E. (2013). Striking it richer: The evolution of top incomes in the United States. Pathways Magazine, 1-10.
Chetty, R. et al. (2014). Where is the land of opportunity? The geography of intergenerational mobility in the United States. The Quarterly Journal of Economics, 129(4), 1553-1623.
U.S. Department of Education, National Center for Education Statistics. (2015). Education Longitudinal Study of 2002 (ELS:2002), Postsecondary Attainment: Differences by Socioeconomic Status.
U.S. Department of Education, National Center for Education Statistics. (2018). The Condition of Education 2018 (NCES 2018-144), Undergraduate Retention and Graduation Rates.
Looney, A., & Yannelis, C. (2018). Borrowers with large balances: rising student debt and falling repayment rates. Washington D.C.: The Brookings Institution.
State of Michigan, Office of Governor Gretchen Whitmer, (2019, March 5). Gov. Gretchen Whitmer’s 2020 budget focused on roads, education, and clean water [Press release]. Retrieved from https://www.michigan.gov/whitmer/0,9309,7-387-90499-491245--,00.html
In Michigan, intermediate school districts are formal education agencies typically organized at the county level that incorporate multiple local districts. ISDs assist constituent local districts in providing programs and services such as CTE and special education. Local districts within an ISD can form consortia by agreeing to share CTE programs with one another. Consortia may not include all local districts within an ISD.
Two key data limitations prevent us from quantifying the access gap among Black, Hispanic, and economically disadvantaged students. First, our data do not contain a definitive and exhaustive list of CTE programs available at each high school or career technical center across Michigan. We can only observe which programs in a given school students have enrolled in after the courses concluded. Measuring access this way poses a critical limitation – namely, the fact that students have participated in a particular set of programs does not necessarily mean there were no other programs in which they might have enrolled. Second, the regulations that govern students’ ability to travel to participate in CTE make it especially challenging to determine access across campuses. The decision of whether or not to permit students from neighboring districts is left to the discretion of the receiving district. Moreover, some programs within a given high school may permit incoming students while others may not. Ultimately, idiosyncratic agreements between schools and districts determine who can travel where and for which programs. So although we are able to observe which CTE programs exist within a 30-minute radius of each school in the state, we do not have a way of differentiating between ones that do and do not accept students from other schools or districts. Counting all programs within a drivable distance could therefore inflate the number of programs that are truly accessible to students.
Kreisman, D., & Stange, K. (2017). Vocational and career tech education in American high schools: The value of depth over breadth. Education Finance and Policy, 1-72.
Barrett, M. (2019). Michigan launches $3M campaign to meet gap in skilled trades jobs by 2026. Retrieved from https://www.mlive.com/public-interest/2019/05/michigan-launches-3m-campaign-to-meet-gap-in-skilled-trades-jobs-by-2026.html
i
ii
iii
iv
v
vi
vii
viii
ix
x
xi
xii
CTE IN MICHIGAN: ACCESS AND PARTICIPATION
POLICY BRIEF | YOUTH POLICY LAB | GEORGIA POLICY LABS

11
Data
We use data drawn from student-level longitudinal data files provided by the Michigan Department of Education (MDE and the state Office of Career and Technical Education (OCTE) through the Michigan Center for Education Performance and Information (CEPI). K-12 student files provide yearly information about enrollment, attendance, graduation, and demographics for students enrolled in public Michigan K-12 schools each year. CTE student data contains CTE participation, completion, and courses taken as well as the related Classification of Instructional Program (CIP) codes and Career Clusters. We obtain some school-level variables from the National Center for Education Statistics’ Common Core of Data (CCD).
We also use data from the American Community Survey to determine the average wages and educational levels of people working in CTE-related occupations. We calculate the average wage and education level for each ACS occupation (OCC), and map each OCC into its 2010 Standard Occupational Classification (SOC2010). We in turn map these into CIP codes using the OCTE’s administrative list of anticipated occupations for each program of study and take the CIP-level weighted averages of the wage and education across occupations using the number of people in each occupation as weights.
APPENDIXWe limit our sample to first-time ninth graders who attended a Michigan public school (including charters) between the 2006-07 and 2014-15 school years (n=1,143,722 students). They comprise nine cohorts from the expected graduating classes of 2010 to 2018. We refer to the year of the expected graduation of an incoming ninth grade cohort as the cohort year. We exclude from the sample a small proportion of students for various reasons. First, we drop students who attended nontraditional public schools (n=46,156), a small school with fewer than 50 students (n=5,620), or students listed as attending state-operated, private, or elementary schools (n=98). Second, we drop students missing key demographic information including gender, eligibility for free or reduced-price lunch, or school size (n=2,380). We then use the CTE Student data to determine which of these students were CTE participant, concentrators, or completers and which programs they participated in.
CTE IN MICHIGAN: ACCESS AND PARTICIPATION
POLICY BRIEF | YOUTH POLICY LAB | GEORGIA POLICY LABS

12
Analysis and Methodology
Figure 1 CTE Participation by Cohort: This figure reports the fraction of students in each expected graduating class who ever participated in CTE while in high school. Each column represents one cohort and the shaded region of each column, the participation rate among students in that cohort. The sample is the full sample defined above.
Figure 2 CTE Participation by Demographics: This figure reports the participation rate of students with given characteristics. The sample is only the most recent cohort (2018). Student level variables come from K-12 data as recorded in the 9th grade year. School level variables come from the CCD and are defined in that same year. Groups are mutually exclusive within demographic categories (i.e., race, gender, etc.) but not across categories. Categories are not necessarily collectively exhaustive.
Figure 3 CTE Participation by Career Cluster: This figure reports the participation rate of students in each Career Cluster. The sample is only the most recent cohort (2018). Programs of study are defined by CIP code and are nested within Career Clusters. There are 17 career clusters, 16 of which are listed here. Students can participate in multiple programs (and therefore clusters) so the rates need not sum up to the overall participation rates.
APPENDIXThe blue dots are the regression coefficients for Black, Hispanic, female, and economically disadvantaged. They represent the average regression-adjusted difference in participation rates relative to whites, males, and economically secure students respectively.For the school-level gap, we estimate the same equation but with school fixed effects for each 9th grade school:
The school fixed effect controls for all of the unobserved determinants of CTE participation at the school. The orange dots are the estimated coefficients on the same characteristics now making within-school comparisons.
Figure 5 Education and Wages by Program: This figure displays the average wage and average education level in occupations related to each program. These variables are obtained by mapping occupation data from the ACS to the CTE programs offered in Michigan (see data portion of Appendix for details). It also shows the number of completers in each program from the 2018 cohort.
CTE IN MICHIGAN: ACCESS AND PARTICIPATION
Table 1 CTE Completion by Career Cluster: This table reports the number of completers, completion rate, and participation rate of students in each Career Cluster. Completion rates are calculated among CTE participants within a given cluster rather than the entire student population. The sample is only the most recent cohort (2018). Programs of study are defined by CIP code and are nested within Career Clusters. There are 17 career clusters, 16 of which are presented here.
Figure 4 Demographic Participation Gaps: This figure shows regression adjusted participation gaps. The sample is only the most recent cohort (2018). For the state level gap we estimated the equation
where Xist are student demographic and scholastic characteristics (gender, race, reduced price lunch, neighborhood education, eighth grade test scores and attendance, special education, and limited English proficiency).
POLICY BRIEF | YOUTH POLICY LAB | GEORGIA POLICY LABS

13
APPENDIXTable A1: 17 Career Clusters and associated Programs of Study
CTE IN MICHIGAN: ACCESS AND PARTICIPATION
Career Cluster CIP Code Program NameAgriculture, Food & Natural Resources
01.0000 Agriculture, Agricultural Operations and Related Sciences
01.0101 Agriculture, Food & Natural Resources
01.0601 Applied Horticulture and Horticultural Operations
01.0903 Animal Health & Veterinary Science
03.0000 Natural Resources and Conservation
03.0601 Zoo & Aquarium Management
26.1201 Biotechnology
Architecture & Construction 15.0403 Electro-Mechanical Technology
15.0612 Industrial Production
15.1301 Drafting and Design Technology
19.0605 Home Furnishings Equipment Installers and Consultants
46.0000 Construction Trades
46.0301 Electrical and Power Transmission Installation
46.0401 Building Maintenance
46.0502 Pipefitting Technology
46.0503 Plumbing Technology
47.0201 Heating, Air Conditioning, Ventilation and Refrigeration
Arts, A/V Technology & Communications
10.0202 Radio & TV Broadcasting Technology
10.0301 Graphics and Printing Technology and Communications
19.0906 Fashion Design
50.0101 Visual & Performing Arts
50.0401 Visual Communications Technology
Business, Management & Administration
52.0299 Business Administration Management and Operations
Education & Training 13.0000 Education General
Energy 46.0303 Electric Lineman
POLICY BRIEF | YOUTH POLICY LAB | GEORGIA POLICY LABS

14
APPENDIX
CTE IN MICHIGAN: ACCESS AND PARTICIPATION
Career Cluster CIP Code Program NameFinance 52.0800 Finance & Financial Management
Services
52.0803 Banking
52.1701 Insurance
Government & Public Administration 28.0301 Army (JROTC)
Health Science 26.0102 Biotechnology Medical Services
51.0000 Therapeutic Services
51.0707 Health Informatics
51.1000 Diagnostic Services
Hospitality & Tourism 12.0500 Cooking and Related Culinary Arts
12.9999 Personal and Culinary Services
Human Services 12.0400 Cosmetology
19.0700 Child and Custodial Care Services
Information Technology 11.0201 Computer Programming/Programmer
11.0801 Digital/Multimedia and Information Resources Design
11.0901 Computer Systems Networking and Telecommunications
11.1000 Information Technology
11.1001 Systems Administrator/Administrator
11.1003 Computer and Information Systems Security/Informat
Law, Public Safety, Corrections & Security
43.0100 Public Safety/Protective Services
Manufacturing 14.3601 Manufacturing Technology/Technician
47.0101 Electrical/Electronics Equipment Installation and Repair
47.0616 Marine Maintenance
48.0000 Precision Production Trades General
48.0501 Machine Tool Technology/Machinist
48.0508 Welding, Brazing and Soldering
48.0701 Woodworking General
Marketing 52.1999 Marketing, Sales and Service
Table A1: 17 Career Clusters and associated Programs of Study
POLICY BRIEF | YOUTH POLICY LAB | GEORGIA POLICY LABS

15
APPENDIX
CTE IN MICHIGAN: ACCESS AND PARTICIPATION
Career Cluster CIP Code Program NameScience, Technology, Engineering and Mathematics
14.4201 Mechatronics
15.0000 Engineering Technology
15.1306 Mechanical Drafting
Transportation, Distribution & Logistics
47.0399 Heavy Industrial Equipment Maintenance Technologies
47.0603 Collision Repair Technician
47.0604 Automotive Technician
47.0606 Small Engine & Related Equipment Repair
47.0607 Airframe Technology
47.0608 Power Plant Technology (Aircraft)
47.0609 Avionics Maintenance Technology
47.0613 Medium/Heavy Truck Technician
49.0101 Aeronautics/Aviation Aerospace Science & Technology
Table A1: 17 Career Clusters and associated Programs of Study
POLICY BRIEF | YOUTH POLICY LAB | GEORGIA POLICY LABS

16
APPENDIXTable A2: Completion Rates by Demographic Group (Expected Class of 2018)
CTE IN MICHIGAN: ACCESS AND PARTICIPATION
POLICY BRIEF | YOUTH POLICY LAB | GEORGIA POLICY LABS
Demographic Group Completion Rate (Among Participants)
All students 48.3%
Male 46.8%
Female 50.2%
White 50.8%
Hispanic 45.8%
Black 37.5%
Special Education 39.9%
Limited English Proficiency 41.6%
Suburban 48.6%
Rural 50.9%
Town 54.2%
Urban 39.8%
Traditional Public School 48.6%
Charter School 37.6%

17
CTE IN MICHIGAN: ACCESS AND PARTICIPATION
POLICY BRIEF | YOUTH POLICY LAB | GEORGIA POLICY LABS
DISCLAIMER
This analysis utilizes data obtained through a confidential data application process submitted to the Michigan Education Data Center (MEDC)/Michigan Education Research Institute (MERI). Youth Policy Lab at the University of Michigan requested data access and completed the analysis included in this report. The data are structured and maintained by the MERI-Michigan Education Data Center (MEDC). MEDC data is modified for analysis purposes using rules governed by MEDC and are not identical to those data collected and maintained by the Michigan Department of Education (MDE) and/or Michigan’s Center for Educational Performance and Information (CEPI). Results, information and opinions solely represent the analysis, information and opinions of the author(s) and are not endorsed by, or reflect the views or positions of, grantors, MDE and CEPI or any employee thereof.

18
The University of Michigan Youth Policy Lab helps community and government agencies make better decisions by measuring what really works. We’re data experts who believe that government can and must do better for the people of Michigan. We’re also parents and community members who dream of a brighter future for all of our children. At the Youth Policy Lab, we’re working to make that dream a reality by strengthening programs that address some of our most pressing social challenges.
We recognize that the wellbeing of youth is intricately linked to the wellbeing of families and communities, so we engage in work that impacts all age ranges. Using rigorous evaluation design and data analysis, we’re working closely with our partners to build a future where public investments are based on strong evidence, so all Michiganders have a pathway to prosperity.
Youth Policy Lab
University of Michigan Youth Policy Lab5201 Institute for Social Research426 Thompson StAnn Arbor, MI 48104
734-647-8829 @YouthPolicyLabyouthpolicylab.umich.edu
© 2019 by the Regents of the University of Michigan
The Career and Technical Education Policy Exchange (CTEx) is a multi-state policy lab dedicated to improving the quality of high school Career and Technical Education programs in the US. We work side-by-side with state and local partners in Massachusetts, Michigan, Rhode Island, and Tennessee to develop data-driven policy recommendations ensuring all students are ready for both college and career. CTEx provides actionable, evidence-based research directly to policymakers and practitioners. While part of our contribution is in compiling longitudinal databases, the lab also focuses on facilitating research on the causal impact of various aspects of CTE education on student success.
CTEX
Georgia State University Georgia Policy LabsCareer & Technical Education Policy Exchange14 Marietta St. NWAtlanta, GA 30303404-413-0140gpl.gsu.edu/career-technical-education-policy-exchange/
CTE IN MICHIGAN: ACCESS AND PARTICIPATION
POLICY BRIEF | YOUTH POLICY LAB | GEORGIA POLICY LABS
About the Authors
Brian A. Jacob is the Walter H. Annenberg Professor of EducationPolicy and Professor of Economics at the University of Michigan.His current research focuses on urban school reform, youthworkforce development and program evaluation.
Jeremy Guardiola is a project manager at the Youth Policy Lab. He focuses on workforce development programs and policies.
The Youth Policy Lab would like to thank the Michigan Department of Education Office of Career and Technical Education for their support of this work. We would also like to thank Thomas Goldring for preparing the data used in our research and conducting the initial analyses, and Michael Ricks for his work as a research assistant on this project.
Support the Youth Policy Lab’s efforts to use data for good.