cardiovascular system notes: physiology of the heart
TRANSCRIPT

Cardiovascular System Notes:
Physiology of the Heart
Interesting Heart Fact
Capillaries are so small it takes ten of them to equal the thickness of a human hair.
© 2013 Pearson Education, Inc.
Heart Physiology: Electrical Events Heart depolarizes and contracts without
nervous system stimulationRhythm can be altered by autonomic
nervous system

© 2013 Pearson Education, Inc.
Heart Physiology: Setting the Basic Rhythm Coordinated heartbeat is a function of
Presence of gap junctions
Intrinsic cardiac conduction system○ Network of noncontractile (autorhythmic) cells○ Initiate and distribute impulses coordinated
depolarization and contraction of heart

• PHYSIOLOGY OF THE HEART
• The Conducting System (electric)
1. Sinoatrial Node (SA)
• PACEMAKER OF HEART – starts each heartbeat
• located in wall of right atrium
• made of specialized myocardial cells
• sends impulse to both atria, causing them to contract
• called an intrinsic conduction or “nodal” system of specialized tissue

2. Atrioventricular Node (AV node)
• located at base of right atrium – receives impulse from SA node
SA Node
AV Node
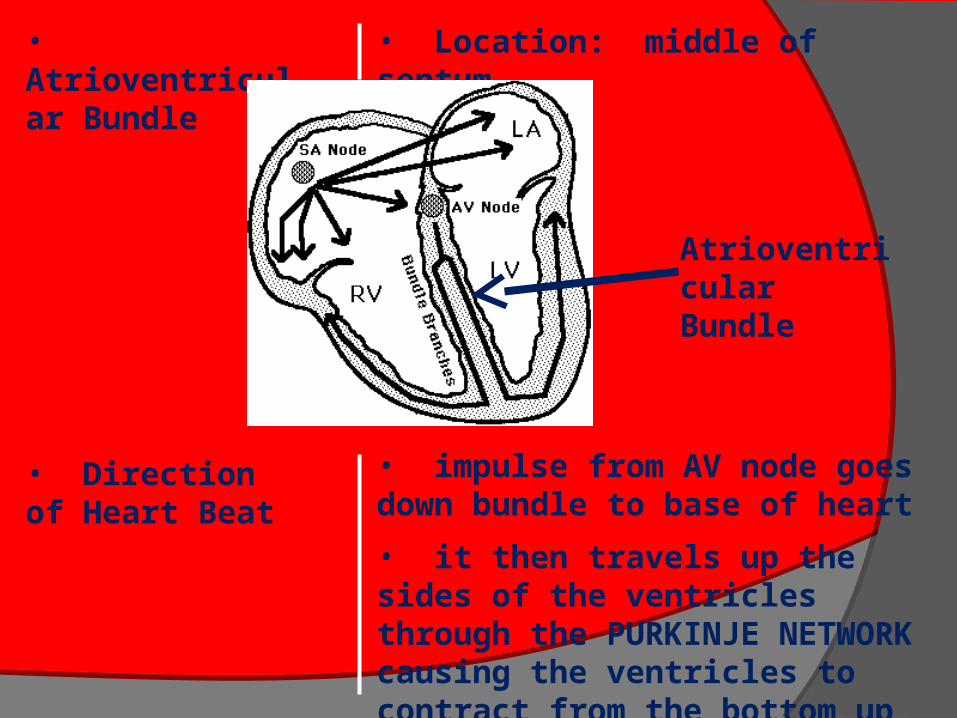
• Atrioventricular Bundle
• Location: middle of septum
• Direction of Heart Beat
• impulse from AV node goes down bundle to base of heart
• it then travels up the sides of the ventricles through the PURKINJE NETWORK causing the ventricles to contract from the bottom up
Atrioventricular Bundle

© 2013 Pearson Education, Inc.
Figure 18.15a Intrinsic cardiac conduction system and action potential succession during one heartbeat.
The sinoatrial (SA) node (pacemaker)generates impulses.
1
The impulsespause (0.1 s) at theatrioventricular(AV) node.
2
The atrioventricular(AV) bundleconnects the atriato the ventricles.
3
The bundle branches conduct the impulses through the interventricular septum.
4
The subendocardialconducting networkdepolarizes the contractilecells of both ventricles.
5
Superior vena cava Right atrium
Left atrium
Subendocardialconductingnetwork(Purkinje fibers)
Inter-ventricularseptum
Anatomy of the intrinsic conduction system showing the sequence ofelectrical excitation
Internodal pathway
Slide 1

• RATE OF HEART BEAT
• Factors affecting heart rate
• age, sex, physical activity, temperature, thought processes, chemicals (natural and otherwise)
• rate high at birth (100 – 140 bpm) – then declines steadily until average is reached (70 – 80 bpm)
• heart rate faster in females – slower in trained athletes

© 2013 Pearson Education, Inc.
Extrinsic Innervation of the Heart Heartbeat modified by ANS via cardiac
centers in medulla oblongataSympathetic rate and forceParasympathetic rate Cardioacceleratory center – sympathetic –
affects SA, AV nodes, heart muscle, coronary arteries
Cardioinhibitory center – parasympathetic – inhibits SA and AV nodes via vagus nerves

© 2013 Pearson Education, Inc.
Homeostatic Imbalances Defects in intrinsic conduction system
may causeArrhythmias - irregular heart rhythmsUncoordinated atrial and ventricular
contractionsFibrillation - rapid, irregular
contractions; useless for pumping blood circulation ceases brain death○ Defibrillation to treat
© 2013 Pearson Education, Inc.
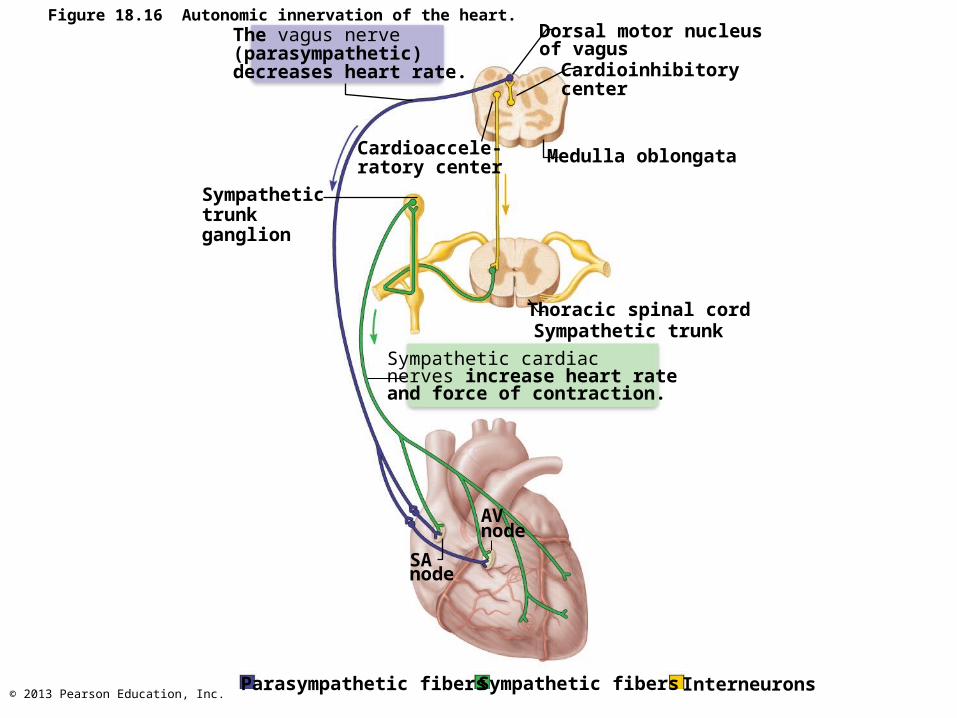
The vagus nerve(parasympathetic)decreases heart rate.
Dorsal motor nucleusof vagus
Cardioinhibitorycenter
Cardioaccele-ratory center
Medulla oblongata
Sympathetictrunkganglion
Thoracic spinal cordSympathetic trunk
Sympathetic cardiacnerves increase heart rateand force of contraction.
AVnode
SAnode
Parasympathetic fibers Sympathetic fibers Interneurons
Figure 18.16 Autonomic innervation of the heart.

• CARDIAC CYCLE
• the events of one complete heartbeat• length of cycle (heartbeat) is about 0.8 sec
• atria contract at the same time – as they relax, the ventricles contract
• SYSTOLE • contraction of ventricle
• DIASTOLE • relaxation of ventricle
• Cardiac Output
• amount of blood pumped out of each side of the heart in 1 minute
• heart rate X stroke volume
© 2013 Pearson Education, Inc.
Heart Sounds
Two sounds (lub-dup) associated with closing of heart valvesFirst as AV valves close; beginning of
systoleSecond as SL valves close; beginning of
ventricular diastolePause indicates heart relaxation
Heart murmurs - abnormal heart sounds; usually indicate incompetent or stenotic valves

© 2013 Pearson Education, Inc.
Aortic valve soundsheard in 2nd intercostalspace at right sternalmargin
Pulmonary valvesounds heard in 2ndintercostal space at leftsternal margin
Mitral valve soundsheard over heart apex(in 5th intercostal space)in line with middle ofclavicle
Tricuspid valve soundstypically heard in rightsternal margin of 5thintercostal space
Figure 18.20 Areas of the thoracic surface where the sounds of individual valves can best be detected.

© 2013 Pearson Education, Inc.
Mechanical Events: The Cardiac Cycle
• Cardiac cycle– Blood flow through heart during one complete
heartbeat: atrial systole and diastole followed by ventricular systole and diastole
– Systole—contraction – Diastole—relaxation– Series of pressure and blood volume changes

© 2013 Pearson Education, Inc.
Phases of the Cardiac Cycle
• 1. Ventricular filling—takes place in mid-to-late diastole– AV valves are open; pressure low – 80% of blood passively flows into ventricles– Atrial systole occurs, delivering remaining
20%– End diastolic volume (EDV): volume of
blood in each ventricle at end of ventricular diastole

© 2013 Pearson Education, Inc.
Phases of the Cardiac Cycle
• 2. Ventricular systole– Atria relax; ventricles begin to contract – Rising ventricular pressure closing of AV
valves– Isovolumetric contraction phase (all valves
are closed)– In ejection phase, ventricular pressure
exceeds pressure in large arteries, forcing SL valves open
– End systolic volume (ESV): volume of blood remaining in each ventricle after systole

© 2013 Pearson Education, Inc.
Phases of the Cardiac Cycle
• 3. Isovolumetric relaxation - early diastole– Ventricles relax; atria relaxed and filling– Backflow of blood in aorta and pulmonary
trunk closes SL valves• Causes dicrotic notch (brief rise in aortic
pressure as blood rebounds off closed valve)• Ventricles totally closed chambers
– When atrial pressure exceeds that in ventricles AV valves open; cycle begins again at step 1

© 2013 Pearson Education, Inc.
Electrocardiogram
Heart sounds
Left heartQRS
P T P
1st 2nd
Dicrotic notch120
Aorta
Left ventricle
Left atriumAtrial systole
80
40
0
Pre
ssure
(m
m H
g)
EDV
SV
ESV
120
50
Ventr
icula
rvolu
me (
ml)
Atrioventricular valves
Aortic and pulmonary valves
Phase
Open Closed Open
Closed Open Closed
1 2a 2b 3 1
Left atriumRight atriumLeft ventricleRight ventricle
Ventricularfilling
Atrialcontraction
Isovolumetriccontraction phase
Ventricularejection phase
Isovolumetricrelaxation
Ventricularfilling
Ventricular filling(mid-to-late diastole)
Ventricular systole(atria in diastole)
Early diastole
1 2a 2b 3
Figure 18.21 Summary of events during the cardiac cycle.

• PULSE & BLOOD PRESSURE• Pulse
• expansion & contraction of an artery as the left ventricle contracts
• normal is 70 – 80 bpm (there are exceptions to this)
• pulse can be found at many sites on the body
• Blood Pressure
• pressure blood exerts on the inner walls of blood vessels
• Measuring BP
• BP is a measure of the systolic pressure (ventricles contracting) OVER the diastolic pressure (ventricles relaxing)
• Example: • 110/70 is in normal range
• Factors affecting BP
• nervous system, blood volume (kidneys), temp, chemicals, diet, exercise

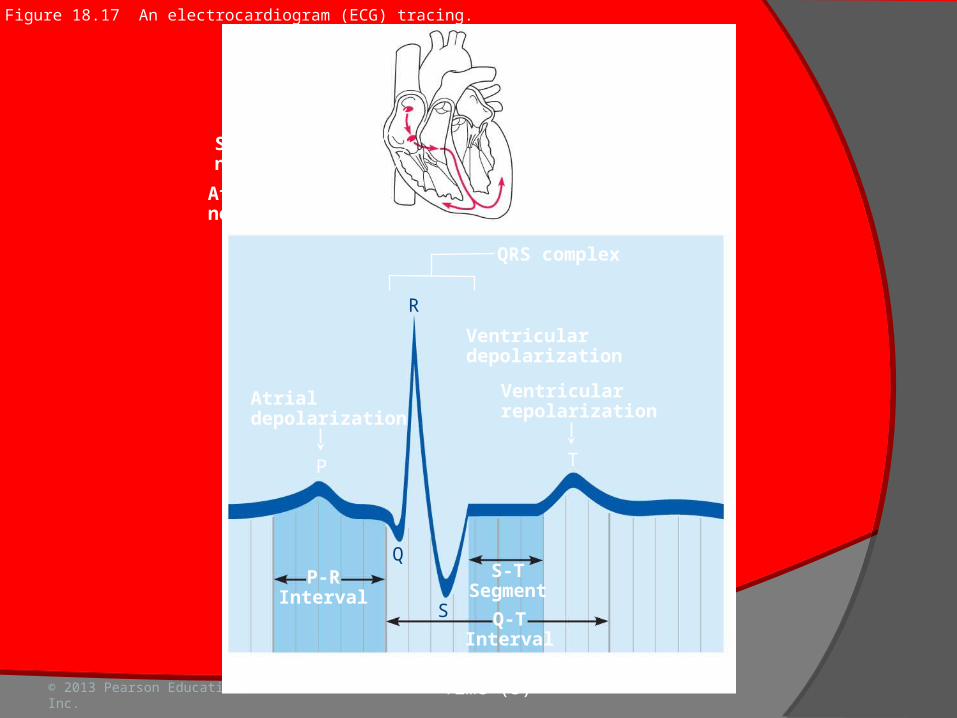
• The Electrocardiogram (EKG or ECG)
• amplifies electric current of heart producing distinct wave patterns

• P wave • depolarization of atria
• QRS Complex • depolarization of ventricles
• T wave • repolarization of ventricles
P wave
QRS Complex
T wave

© 2013 Pearson Education, Inc.
Electrocardiography
Electrocardiogram (ECG or EKG)Composite of all action potentials generated
by nodal and contractile cells at given time
Three waves:P wave – depolarization SA node atriaQRS complex - ventricular depolarization
and atrial repolarizationT wave - ventricular repolarization
© 2013 Pearson Education, Inc.
Sinoatrialnode
Atrioventricularnode
QRS complex
Ventriculardepolarization
Atrialdepolarization
Ventricularrepolarization
P-RInterval
S-TSegment
Q-TInterval
0 0.2 0.4 0.6 0.8Time (s)
R
Q
S
P T
Figure 18.17 An electrocardiogram (ECG) tracing.

© 2013 Pearson Education, Inc.
Figure 18.18 The sequence of depolarization and repolarization of the heart related to the deflection waves of an ECG tracing.
Slide 1
SA node
AV node
R
P T
QS
Atrial depolarization, initiated by the SA node, causes the P wave.
1
R
P T
QS
With atrial depolarization complete, the impulse is delayed at the AV node.
2
R
P T
QS
Ventricular depolarization begins at apex, causing the QRS complex. Atrial repolarization occurs.
3
R
P T
QS
R
P T
QS
SQ
P T
R
Ventricular depolarization is complete.4
5
6
Ventricular repolarization begins at apex, causing the T wave.
Ventricular repolarization is complete.
Depolarization Repolarization

© 2013 Pearson Education, Inc.
Homeostatic Imbalances
Tachycardia - abnormally fast heart rate (>100 beats/min)If persistent, may lead to fibrillation
Bradycardia - heart rate slower than 60 beats/minMay result in grossly inadequate blood
circulation in nonathletesMay be desirable result of endurance
training

© 2013 Pearson Education, Inc.
Homeostatic Imbalance
Congestive heart failure (CHF)Progressive condition; CO is so low that
blood circulation inadequate to meet tissue needs
Reflects weakened myocardium caused by○ Coronary atherosclerosis—clogged arteries○ Persistent high blood pressure○ Multiple myocardial infarcts○ Dilated cardiomyopathy (DCM)

© 2013 Pearson Education, Inc.
Homeostatic Imbalance
Pulmonary congestionLeft side fails blood backs up in lungs
Peripheral congestionRight side fails blood pools in body
organs edema
Failure of either side ultimately weakens other
Treat by removing fluid, reducing afterload, increasing contractility

© 2013 Pearson Education, Inc.
Developmental Aspects of the Heart Embryonic heart chambers
Sinus venosusAtriumVentricleBulbus cordis

© 2013 Pearson Education, Inc.
Figure 18.24 Development of the human heart.
Day 20: Endothelial tubes begin to fuse.
4a
4
3
2
1
Tubularheart
Day 22:Heart starts pumping.
Arterial end
Ventricle
Ventricle
Venous end
Day 24: Heart continues to elongate and starts to bend.
Arterial end
Atrium
Venous end
Day 28: Bending continues as ventricle moves caudally and atrium moves cranially.
Aorta
Superiorvena cava
Inferiorvena cava
Ductusarteriosus
Pulmonarytrunk
Foramenovale
Ventricle
Day 35: Bending is complete.
© 2013 Pearson Education, Inc.
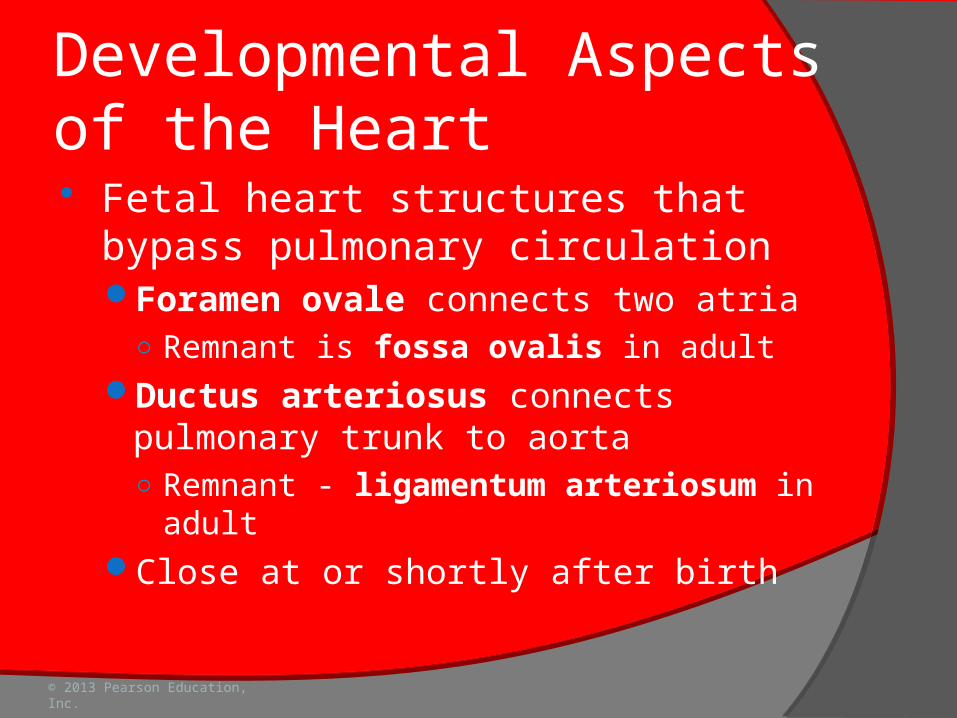
Developmental Aspects of the Heart Fetal heart structures that bypass
pulmonary circulationForamen ovale connects two atria
○ Remnant is fossa ovalis in adult Ductus arteriosus connects pulmonary
trunk to aorta○ Remnant - ligamentum arteriosum in adult
Close at or shortly after birth

© 2013 Pearson Education, Inc.
Developmental Aspects of the Heart Congenital heart defects
Most common birth defects; treated with surgery
Most are one of two types:○ Mixing of oxygen-poor and oxygen-rich blood,
e.g., septal defects, patent ductus arteriosus○ Narrowed valves or vessels increased
workload on heart, e.g., coarctation of aortaTetralogy of Fallot
○ Both types of disorders present

© 2013 Pearson Education, Inc.
Figure 18.25 Three examples of congenital heart defects.
Occurs inabout 1 in every500 births
Ventricular septal defect.The superior part of theinter-ventricular septum failsto form, allowing blood to mixbetween the two ventricles.More blood is shunted fromleft to right because the leftventricle is stronger.
Narrowedaorta
Occurs inabout 1 in every1500 births
Coarctation of the aorta.A part of the aorta isnarrowed, increasing theworkload of the left ventricle.
Occurs inabout 1 in every2000 births
Tetralogy of Fallot.Multiple defects (tetra =four): (1) Pulmonary trunktoo narrow and pulmonaryvalve stenosed, resulting in(2) hypertrophied rightventricle; (3) ventricularseptal defect; (4) aortaopens from both ventricles.

© 2013 Pearson Education, Inc.
Age-Related Changes Affecting the Heart Sclerosis and thickening of valve flaps Decline in cardiac reserve Fibrosis of cardiac muscle Atherosclerosis