cardiff economics working papers - carbsecon.comcarbsecon.com/wp/e2014_1.pdf · 2 cultures of...
TRANSCRIPT
Cardiff Economics Working Papers
Working Paper No. E2014/1
Cultures of Female Entrepreneurship
James Foreman-Peck and Peng Zhou
January 2014
Cardiff Business School
Aberconway Building
Colum Drive
Cardiff CF10 3EU
United Kingdom
t: +44 (0)29 2087 4000
f: +44 (0)29 2087 4419
business.cardiff.ac.uk
This working paper is produced for discussion purpose only. These working papers are expected to be
publishedin due course, in revised form, and should not be quoted or cited without the author’s written
permission.
Cardiff Economics Working Papers are available online from:
econpapers.repec.org/paper/cdfwpaper/ and
business.cardiff.ac.uk/research/academic-sections/economics/working-papers
Enquiries: [email protected]

1
Cultures of Female Entrepreneurship
James Foreman-Peck and Peng Zhou
Abstract
The present research shows how entrepreneurial culture contributes to the widely
noted difference in entrepreneurial propensities between men and women. The
consequences of the assumed differential importance of household and family
generate testable hypotheses about the gender effects of entrepreneurial culture. The
principal hypothesis is that there is a greater chance of females in ‘unentrepreneurial’
cultures being relatively entrepreneurial compared to males. Also women from
different entrepreneurial cultures show greater similarity of behaviour (lower
variance) than men. But proportionate gender gaps within entrepreneurial cultures are
less than those between males of different cultures. These hypotheses are tested on US
immigrant data from the 2000 census and are not rejected.
Key Words: Entrepreneurship, Culture, Gender, Migrants
JEL Classification: D01; J15; J23; J61; J16
Cardiff Business School
Cardiff University, Colum Drive,
Cardiff CF10 3EU UK
2
Cultures of Female Entrepreneurship1
James Foreman-Peck and Peng Zhou
How does entrepreneurial culture contribute to the widely noted difference in
entrepreneurial propensities between men and women (Acs, et al 2005; Verheul et al,
2006)? A prior question concerns the meaning of culture, influentially described as
‘the collective programming of the mind which distinguishes the members of one
group or category’ (Hofstede 2003 p5). A more expansive definition of culture is
“shared motives, values, beliefs, identities, and interpretations or meanings of
significant events that result from common experiences of members of collectives and
are transmitted across age generations” (House et al., 2001 p494). Entrepreneurial
culture then is the shared values and preferences of the group that affect the chances
of an individual becoming an entrepreneur.
Shared values and beliefs influence individual agent’s intentions to take
entrepreneurial action, but such action depends upon opportunity as well as intention
(van Praag and van Orphem 1995). Entrepreneurial opportunity varies with
institutional and macroeconomic conditions. Divergences between intention
(influenced by culture) and outcome (of entrepreneurial action) could be attributable
to such opportunities. A contribution of the present paper is to distinguish the effects
on entrepreneurship of opportunity constraints from those of culture. The approach
requires that migrants bear with them the culture from which they originated (a
proposition supported by Guiso et al. 2006 fig. 3). Consequently relative cultural
impacts on entrepreneurial action can be identified by considering the choices and
actions of these migrant groups in a common economic environment - the United
States.
1 Thanks to Francis J Greene, Yi Wang, and also to participants in the 2011 Madrid conference on
entrepreneurship hosted by the Fundacion Mapfre, in a Cardiff University workshop and in the 2011
ISBE annual conference, Sheffield.

3
Cultural values will influence gender roles and stereotypes, thereby determining
occupations –including entrepreneurship - considered appropriate for men or women
(Mueller 2004; Shinnar et al 2012). In addition to discrimination (which is an
institutional influence), women’s choice of entrepreneurship is linked with gender
ascription (Fischer et al 1993; Marlow and Patton 2005; Gupta et al 2009). Social
feminist theory suggests that the values of women and men differ because of
divergent socializations (Eddlestone and Powell 2008; Schwartz and Rubel-Lifschitz
2009). Socialization might explain why ‘fear of failure’ (stemming from dissimilar
values) and maternal influence (different cultural transmission), have a differential
impact on female and male entrepreneurship (Langowitz and Minniti 2007; Greene et
al 2011). But not all values affecting entrepreneurship differ between men and women
apparently – those for family life and job security for instance (Burke et al, 2002
Table III; Verheul et al 2006).
The present paper models cultural values as components of shared preference
functions. The reasons for these preferences are not addressed; they are taken as given.
The paper explores how values influence the probability of choosing entrepreneurship
through the allocation of time and other constraints. It does so by deducing and testing
the consequences of certain plausible assumptions. The properties of the model are
demonstrated to enhance plausibility. A critical element of the model for present
purposes is the assumption that for cultural reasons females place a higher value on
the family and the household than males. It follows that for cultural reasons, not
simply because of discrimination, genuine female entrepreneurship will be lower than
male. (Here it is especially important to distinguish between (non-entrepreneurial)
self-employment and entrepreneurship2
). Other cultural consequences are
demonstrated to follow from this result.
2Though in practice the distinction is usually hard to make. Entrepreneurship is generally reckoned to
involve some element of innovation. An attraction of (non-entrepreneurial) self-employment may be
the opportunity to choose the timing of work (see Parker (2009) on female entrepreneurship). By
contrast entrepreneurship typically involves a much greater time commitment than wage work,
dominating greater work timing autonomy.

4
Cultural groups are not necessarily only, or even mainly, differentiated by gender.
Shared experiences giving rise to common values, and the transmission of these
values, are likely to stem from being brought up in the same location. This ethnicity
dimension of culture and of entrepreneurial culture is also considered.
Related previous research includes that of Lofstrom (2003) who used US census data
to identify origin effects on immigrant self-employment as well. But Lofstrom
restricts the analysis to males and aggregates over what may be different cultural
groups, while, unlike the present study, comparing them to the indigenous population.
Close to the modelling approach here are the explicit utility functions of Carree and
Verheul (2009) and Verheul et al (2009). These papers separate the effect of
productivity from preferences on the time allocation of the self-employed by gender.
However, these studies are restricted to individuals from a single country, the
Netherlands, and they are not concerned with the choice between entrepreneurship
and non-entrepreneurship. In contrast to international cross-section studies estimating
cultural effects on entrepreneurship (e.g. Verheul et al 2006), the approach here does
not impose the restriction that all national entrepreneurial cultures are similar except
in the values of the indices by which they are measured. Moreover using individual
level data allows much greater precision than aggregated national data. Previous
research has demonstrated that male and female entrepreneurship differs but has not
convincing divided national cultural from other influences3.
The following section 1 sets out the model and the derived hypotheses. Section 2
describes the US data and how it is to be used in the study. The hypotheses about
3 For example Langowitz and Minnitti’s (2007) country fixed effects will conflate country-specific
institution effects on entrepreneurship with country-specific cultural effects not captured by the culture
variables.

5
female entrepreneurial culture, and the relation to family and household, are tested in
section 3. A concluding discussion in section 4 provides some qualifications and
suggestions for further research.
1. The Model
Cultural factors influence the average behaviour of the cultural group. The
preferences of a representative agent may be interpreted as the cultural values of the
set for which the agent is representative; they are values shared by members of the
group.
In the present model each culture potentially has a different culture function, with
different weights on consumption, leisure, entrepreneurship and family and household.
A group of persons for cultural reasons are assumed to derive well-being from
consumption of market goods and services ( C ), from time spent in leisure ( L ) and in
entrepreneurship ( 1E ) and from household and family goods and services (H), in a
CES function4. A materialistic culture places a greater weight on C for instance. The
relevance of a culture to entrepreneurship is identified by the relative weight attached
to entrepreneurship in the preference or culture function.
Also assumed is a collective (C-D) production function for market consumption
goods and services, with both entrepreneurship time ( 1E ) and employment time ( 2E )
as inputs. Household production supplies family and household goods and service (H)
using family time (F). Where U is the ‘culture function’, the well-being maximisation
problem can be formalised as:
1 2
1, , , , ,
max , , ,C L E E H F
U C L E H , subject to:
H BF, 1
1 2C AE E and 1 2 1L E E F
4 With the simpler C-D preference function and the same constraints some of the model properties
were not plausible.

6
, , , are weights assigned to consumption, leisure, entrepreneurial effort and
household services in the ‘culture’ function. A denotes the total productivity, while
is the income share of (output elasticity of time allocated to) entrepreneurship, in the
Cobb-Douglas production function. This productivity measure is also likely to be
culturally determined. Some cultures work well in organisations relative to
individually- a high value of 1 ; others do not. But the productivity line is not
pursued here. In the home production function B measures productivity; a higher
value means a greater return to family time5.
To solve the system we assume an elasticity of substitution for the ‘culture’ function
of 0.5, ε=0.3, α=β=γ=1 and initially also δ=1, as well as A=B=1. When work
productivity, A, increases, more of all desirable things can be obtained while
undesirable inputs to work can be reduced; employment propensity falls while
entrepreneurship propensity rises, along with market consumption, leisure, household
goods and services and family time. An increase in household productivity (B rises
for example because of the use of domestic appliances such as washing machines and
vacuum cleaners) raises entrepreneurship and employment propensities along with
market consumption and leisure as well as household services, while reducing family
time necessary to generate the now more abundant household services(see Appendix
A).
A culture with a higher leisure preference (bigger β) must have a lower relative
preference for entrepreneurship, employment and family. As expected, the simulation
for this set of preferences (with both elasticities of substitution 0.1 and 0.5) shows
lower everything except leisure.
If (relative to others) a culture does not especially favour time spent in
entrepreneurship but regards it as no different from time spent in employment (γ →0),
entrepreneurship is lower, as is consumption, while employment, household services,
5 In the interests of keeping the model simple (saving an extra parameter), for present purposes the
productivity of family time is much greater than entrepreneurship or market employment. This has the
consequence that, as the elasticity of substitution increases and the arguments of the culture function
become closer substitutes, family time and household production displace market activity,
entrepreneurial and employment.
7
family time and leisure are higher. On the other hand, entrepreneurship remains high
even when the productivity of entrepreneurship is very low, as long as it is favoured
by the culture. Only when an unentrepreneurial culture is combined with low
entrepreneurial productivity does entrepreneurship sink to very low levels – a
propensity of about 2 percent in the Appendix simulations. Changing the production
weights so that entrepreneurship is more important than employment (weight 0.6)
there are increases from the base case in consumption, leisure, entrepreneurship,
household production and family time commitment and a big fall in employment.
Productive efficiency matters more than preferences between work modes.
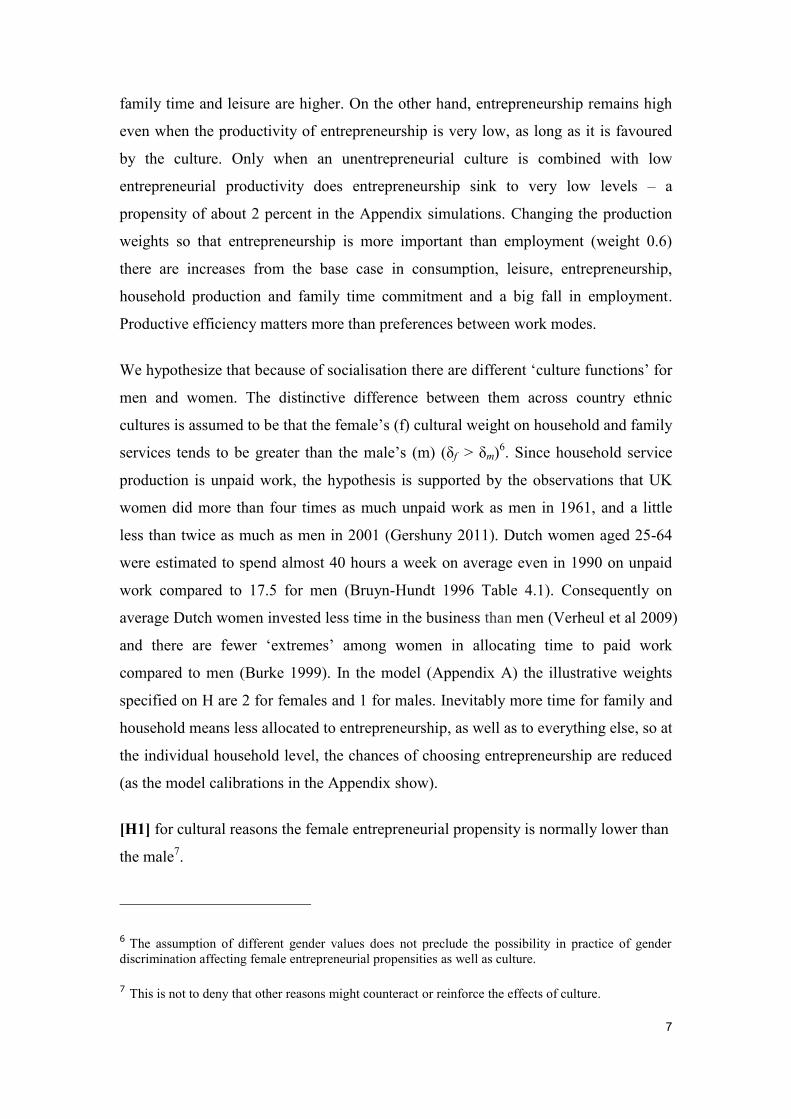
We hypothesize that because of socialisation there are different ‘culture functions’ for
men and women. The distinctive difference between them across country ethnic
cultures is assumed to be that the female’s (f) cultural weight on household and family
services tends to be greater than the male’s (m) (δf > δm)6. Since household service
production is unpaid work, the hypothesis is supported by the observations that UK
women did more than four times as much unpaid work as men in 1961, and a little
less than twice as much as men in 2001 (Gershuny 2011). Dutch women aged 25-64
were estimated to spend almost 40 hours a week on average even in 1990 on unpaid
work compared to 17.5 for men (Bruyn-Hundt 1996 Table 4.1). Consequently on
average Dutch women invested less time in the business than men (Verheul et al 2009)
and there are fewer ‘extremes’ among women in allocating time to paid work
compared to men (Burke 1999). In the model (Appendix A) the illustrative weights
specified on H are 2 for females and 1 for males. Inevitably more time for family and
household means less allocated to entrepreneurship, as well as to everything else, so at
the individual household level, the chances of choosing entrepreneurship are reduced
(as the model calibrations in the Appendix show).
[H1] for cultural reasons the female entrepreneurial propensity is normally lower than
the male7.
6 The assumption of different gender values does not preclude the possibility in practice of gender
discrimination affecting female entrepreneurial propensities as well as culture.
7 This is not to deny that other reasons might counteract or reinforce the effects of culture.
8
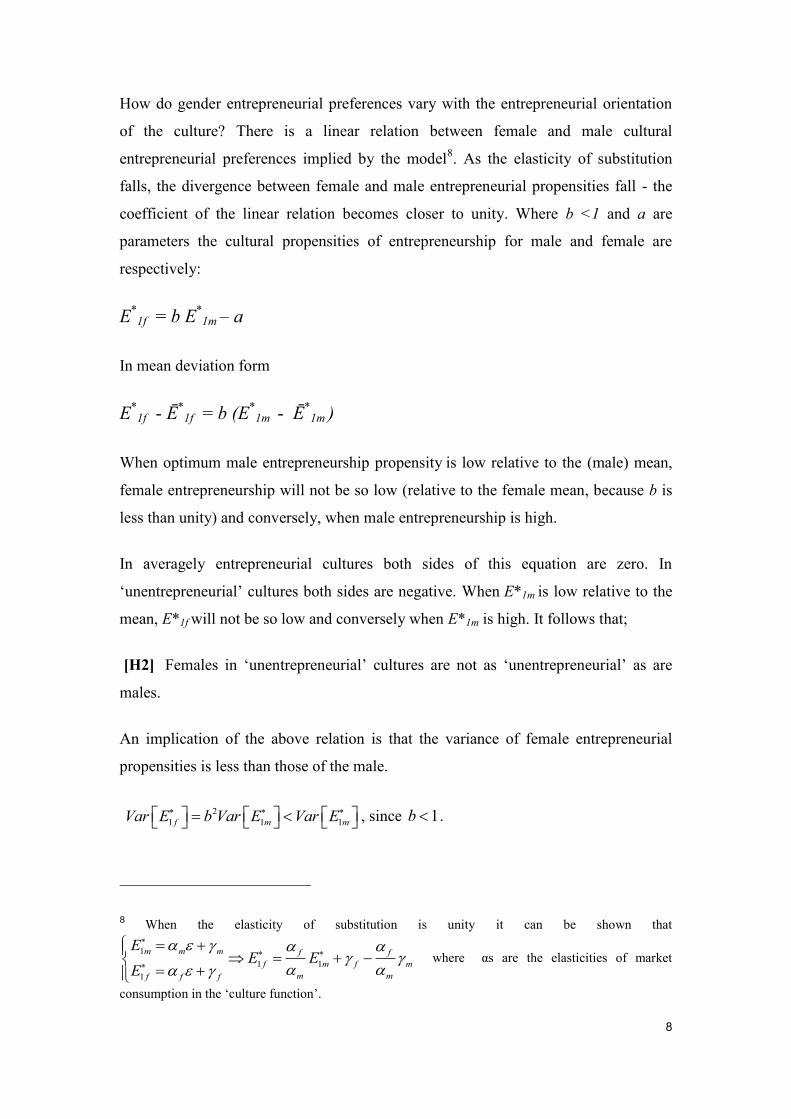
How do gender entrepreneurial preferences vary with the entrepreneurial orientation
of the culture? There is a linear relation between female and male cultural
entrepreneurial preferences implied by the model8. As the elasticity of substitution
falls, the divergence between female and male entrepreneurial propensities fall - the
coefficient of the linear relation becomes closer to unity. Where b <1 and a are
parameters the cultural propensities of entrepreneurship for male and female are
respectively:
E*
1f = b E*1m – a
In mean deviation form
E*
1f - Ē*
1f = b (E*
1m - Ē*
1m )
When optimum male entrepreneurship propensity is low relative to the (male) mean,
female entrepreneurship will not be so low (relative to the female mean, because b is
less than unity) and conversely, when male entrepreneurship is high.
In averagely entrepreneurial cultures both sides of this equation are zero. In
‘unentrepreneurial’ cultures both sides are negative. When E*1m is low relative to the
mean, E*1f will not be so low and conversely when E*1m is high. It follows that;
[H2] Females in ‘unentrepreneurial’ cultures are not as ‘unentrepreneurial’ as are
males.
An implication of the above relation is that the variance of female entrepreneurial
propensities is less than those of the male.
2
1 1 1f m mVar E b Var E Var E , since 1b .
8 When the elasticity of substitution is unity it can be shown that
1
1 1
1
m m m f f
f m f m
m mf f f
EE E
E
where αs are the elasticities of market
consumption in the ‘culture function’.
9
[H3]: Females are more similar in entrepreneurial propensity than are males for
reasons of entrepreneurial culture.
For family firms there is evidence of large cross-cultural differences between the
owners of family businesses but far smaller differences between male and female
family business owners (Lerner and Malach-Pines 2011). Baughn et al (2006)
indicate that countries with a low proportion of women entrepreneurs are likely also to
have overall low levels of entrepreneurial activity (TEA). Further, there is little
variability in the levels of entrepreneurship among these economies. These gender
gaps could be due to institutions but a logical consequence of H2, measuring
entrepreneurial gender differences by their ratio, yields a similar hypothesis.
Given f mE a bE , where both a and b are less than 1:
1m f mE E b E a
The variance of the difference is then:
2
1m f m mVar E E b Var E Var E
Therefore;
[H4] The entrepreneurial differences between males and females of the same culture
are less than the differences between males of the different cultures.
2. Method and Materials
Males and females brought up in common environment (in this case, origin country)
share a culture, but also differ in ways that give rise to variations in entrepreneurial
behaviour. The approach here is to distinguish between cultural impacts on the one
hand and non-family institutional and macroeconomic effects on the other, on female
entrepreneurship by comparing entrepreneurial propensities among migrants from
different origins in the common US environment- as measured by the US Census for

10
the year 20009. In this way the effects of gender discrimination (for instance) in
national origins may be eliminated—to the extent that the institutions of
discrimination have been left behind in the origin countries.
The focus is not on the absolute effect of culture (no comparison is drawn with those
born in the United States), but on the difference between immigrant cultures of origin.
Migrants may be more dynamic, or more restless, than the population as a whole, but
the comparison groups are other migrants who are likely to share these characteristics.
English immigrants in the US may not be quite the same the types as the population of
England as a whole, but the difference between English immigrants and German
immigrants (perhaps equally more dynamic or restless than their stay-at-home
compatriots) should be broadly similar to that between the English and Germans.
The immigrant groups studied are restricted to origin countries with at least a century
of history of migration to the US so that in the year of concern, 2000, there are
unlikely to be any ‘new immigrant’ effects (Hatton and Leigh 2011) (we also conduct
a test that confirms this proposition, see Appendix B). Purely cultural propensities—
where culture is normally assumed to be that of the country of origin—towards
entrepreneurship are then identified. However, this proposition only applies to relative
female entrepreneurial culture effects, unless it is clear that there is no relevant gender
discrimination in the United States in the year 2000. In the presence of such
discrimination the relationship between male and female entrepreneurial effects will
reflect not only culture but US institutional and other constraints as well.
A more exacting test for different gender ‘culture functions’ is whether the effect on
entrepreneurship of (generally family time-intensive) marriage differs between
genders in the way assumed by the model. If it does then at least some of the gender
differences in entrepreneurial propensity may be attributed to culture.
9 Five per cent samples from IPUMS (http://usa.ipums.org/usa/). All the variables in the analysis are
from this Census source. The sample is restricted to immigrants working outside agriculture.

11
By comparison with the widely used questionnaire approach, the method adopted here
to measuring the effect of culture is indirect. The ‘culture function’ itself is not
estimated or tested; only the behavioural consequences are. The method has the
advantage of imposing less structure on agents’ intentions and culture (or social
norms) than does the questionnaire. The questionnaire approach usually aggregates
attitudes and values that are both self-perceived and the perceptions of others, which
is controversial (Smith 2006). In recent studies cultural dimensions have multiplied
and questions been added to reflect new social interests (House et al 2001; Uhlaner
and Thurik 2007; Konig et al (2007). But a recent assessment concluded that many
hypotheses concerning the influence of these ‘direct’ cultural indices on
entrepreneurship are often contradictory (Hofstede et al 2004 p173). The alternative
indirect approach, outlined above, is to measure culture by what is left to explain of
entrepreneurship when the contribution of institutions, age, and other factors are
controlled (for example Grilo and Thurik 2006). In the indirect approach of the
present study there is nonetheless a sense in which culture is a variable affecting
entrepreneurship, for each country of origin identifier has an estimated marginal
(cultural) probability of entrepreneurship associated with it10
. Whether specific
origins, or ethnicity, matter for entrepreneurship is an empirical question with the
specification used here; is the particular origin a statistically significant influence
upon entrepreneurship chances or not?
10 Is it likely that omitted variables bias the estimated cultural effects? Might non-cultural influences on
entrepreneurship be transmitted by immigrant country of origin? This raises the question as to what
variables affecting entrepreneurship are influenced by culture themselves and should be excluded.
When an individual’s education is not controlled (it is in fact) and education differs by country of
origin, cultural effect estimates may differ. In any case the Census data set limits the number of
controls that can be included or excluded. This is the down side of the very large samples the US
Census makes available. The up side is the 217050 cases available for females and 282022 cases for
males in Table 2.

12
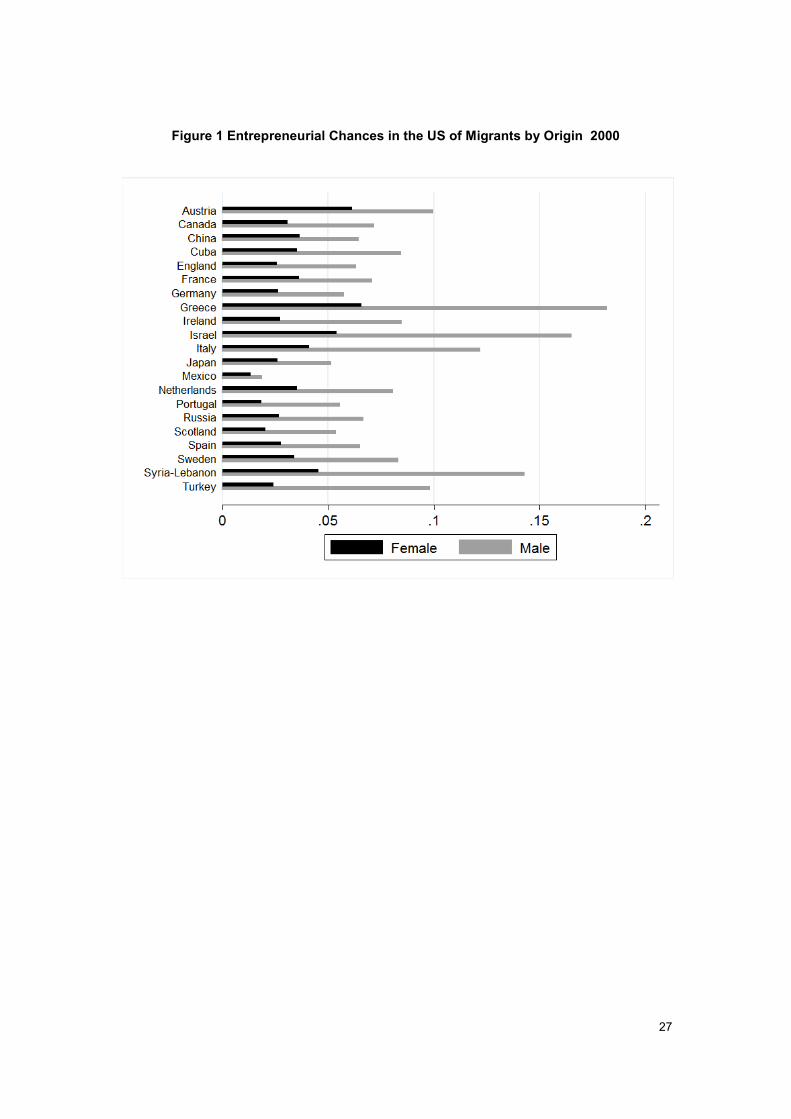
Entrepreneurs are defined as self-employed in incorporated businesses11
; immigrants
are unlikely to inherit firms so almost certainly this category will have started their
enterprise. The variable corresponding to E1* in the model is the entrepreneurship
ratio, or the chances of a member of a migrant group being an entrepreneur i.e. having
started a business. Figure 1 shows that male and female entrepreneurship chances vary
markedly across immigrant groups. Clearly, for no group does female
entrepreneurship anywhere near match that of males. But this could be because of
different agent characteristics.
<FIGURE 1 ABOUT HERE>
Individuals with higher education levels might have higher entrepreneurial
propensities. If female education levels were lower than males, this could contribute
to differences in entrepreneurship, rather than culture. Moreover, people with different
work experience tend to have different chances of becoming entrepreneurs. Without
addressing the impact of these factors, the simple entrepreneurship ratio of figure 1
might be misleading as an indicator of the entrepreneurial culture of immigrants’
origins. Taking them into account entails statistically controlling for these variables,
as well as for country of origin fixed effects. The origin country effects will then
isolate the pure marginal impact of culture on entrepreneurship, purged of other
influences (this is the alternative and preferred estimate of E*1).
Individual agent effects on entrepreneurial propensities might include wealth, working
through risk attitude perhaps. The need at first to acquire savings and work experience
increases entrepreneurship with age, and perhaps eventually diminishes it (Parker
2004). Information about entrepreneurial opportunities is likely to rise with duration
of immigrants’ residence in the United States, and with ability to speak English. Both
would then boost the likelihood of becoming an entrepreneur. By increasing
awareness of opportunities, formal education could increase entrepreneurial chances.
Marital status effects provide a test of a key assumption of the theoretical model; as
11 The only alternative in the Census categories is ‘other self-employed’. While recognising the
empirical classification employed in this study is a less than perfect match for genuine entrepreneurship
– and this limitation should be borne in mind – it compares favourably with many other published
empirical studies of entrepreneurship.
13
long as marriage implies greater commitment of family/ household time, the model
predicts different male and female coefficients. If the marital division of labour raises
(household) productivity (raises B), then both male and female chances of
entrepreneurship will increase with marriage but the female chances by less than male
(as long as the female has a greater weight on H).
Sectors in which employment or self-employment takes place measure the type of
work experience that may influence entrepreneurial choice. Also greater expected
rewards will increase the likelihood of an individual becoming an entrepreneur. This
last provides a link of entrepreneurial supply with the demand or opportunities for
entrepreneurship.
The choice of sector or industry for entrepreneurship depends on the return-risk
profile and entry barriers. Finance and business services offer high returns, while
wholesaling and retailing have much lower risk and entry barriers compared to other
industries. These activities then have higher chances of attracting entrepreneurs
starting up new businesses. Since the focus of the present study is only one country
(the USA), the possibility that culture can influence entrepreneurial opportunity can
be ignored12
.
The structural relations of entrepreneurial supply and opportunities have expected
returns, as well as entrepreneurial chances, in common. Solving them to eliminate
expected returns yields a reduced form equation of the equilibrium probability that an
immigrant of given gender might become an entrepreneur (Y):
Pr(Y=1)=f(culture [origin], marital status, education, wealth, native language
speaker, naturalisation, age, residence duration, sector) …..(1)
Equation (1) is estimated separately for males and females, using logit binary
occupational choice, as is conventional in this field (for example Blanchflower et al,
2001, Lofstrom, 2002, Grilo and Irigoyen, 2006).
12 Although US culture as well as institutions may be a reason for the higher level of US
entrepreneurship relative to all European countries, as noted by Grilo and Irigoyen (2006) among
others.
14
3. Results
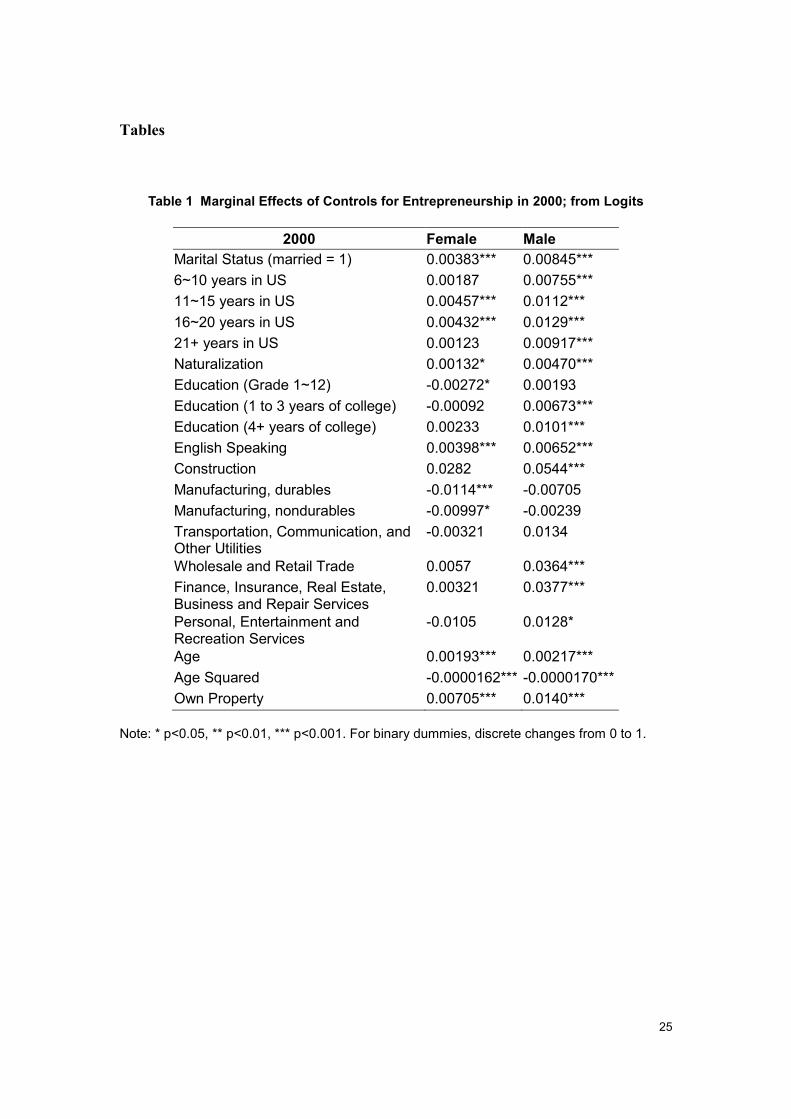
In equation (1) estimated on the US census data, some of the controls (Table 1)
showed substantial differences between males and females. Married women were
more likely to be entrepreneurs in 2000 than unmarried but the impact on their
chances of entrepreneurship was about half that of marriage for men. This is
consistent with the model assumption that female culture places a greater weight on
family time, as noted above13
.
Women’s maximum probability of entrepreneurship age was less than 60, while
men’s was almost 64. Education did not encourage immigrant female
entrepreneurship in 2000, in contrast to males. The positive effects of the proxy for
wealth, ‘own property’, on entrepreneurship probability for females was significantly
different from zero and half that of males, which was also approximately true for the
ability to speak English. Naturalisation and years of residence in the US did promote
entrepreneurship by women but much less strongly than they did for men; for instance
6-10 years residency (relative to the base category of 5 years or less) was a significant
contributor to male entrepreneurship but not to female.
TABLES 1 AND 2 ABOUT HERE
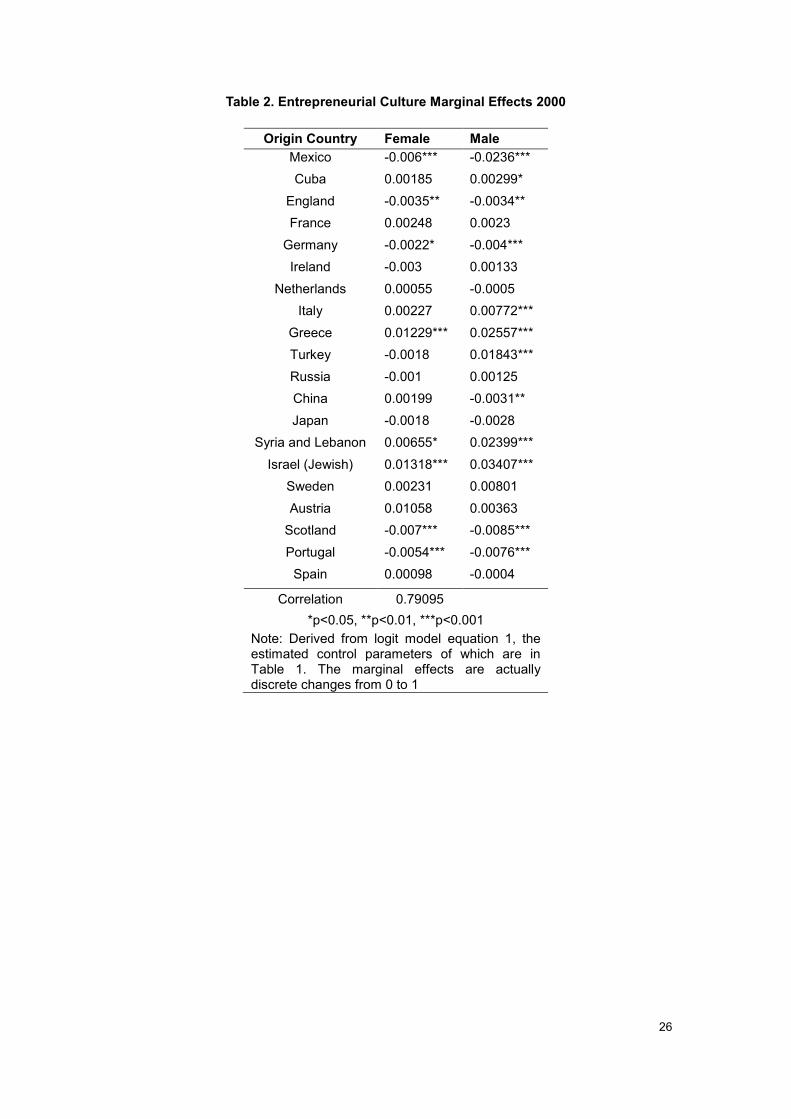
Table 2 uses the same estimated logit equation to identify conditional entrepreneurial
culture from the country of origin coefficients. From the migrant sample used for the
model, female entrepreneurship chances (0.024) are considerably lower than male
(0.044). From the ‘culture‘ coefficients it is apparent that culture plays an important
role. At one extreme Mexican males are associated with 2.34 percent lower chances of
entrepreneurship, while Mexican female chances are only 0.6 percent lower than the
female average. Adding up all the statistically significant female culture coefficients,
the net effect on female entrepreneurship probabilities is 0.1 percent, whereas the
same exercise for the male coefficients yields a percentage four times as large. With
13 It might be contended that the marriage coefficient differential reflects discrimination rather than
culture. But it is not clear that discrimination against potential and actual female entrepreneurs should
focus on their marital status any more or less than, say their education. Yet marriage does increase
female entrepreneurship in these groups and education does not.

15
this definition of entrepreneurial culture, implied by the use of the origin coefficients,
the evidence is consistent with H1, the hypothesis that for cultural reasons female
entrepreneurship will be lower than male.
The validity of H2, whereby females from more entrepreneurial cultures were
relatively less entrepreneurial than males but those from less than averagely
entrepreneurial source countries were rather more entrepreneurial, emerges strongly in
Table 2. For instance females from Greece in 2000 were significantly more
entrepreneurial than the female average. Their coefficient at 0.01229 was the second
largest in sample, but significantly less so than their male counterparts (about half),
who like the females had the second largest cultural effect in the sample. By contrast
German-originating females showed a higher cultural marginal propensity to
entrepreneurship (-.0022) than German-originating males (-.004) who were also less
entrepreneurial than their sample average (the fourth lowest)14
.
On the one hand females confirmed the importance of inherited entrepreneurial
culture from many countries in the year 2000 when the opportunity arose. But on the
other, their culturally-influenced behaviour differed from males with similar origins -
in the cases of those groups significantly more, or less, entrepreneurial than the
average. French, Dutch and English migrants, who were about averagely
entrepreneurial in the sample, exhibited no significant differences between male and
female cultural propensities.
FIGURE 2 ABOUT HERE
Figure 2 provides a systematic comparison by plotting the ‘culture’ coefficients for
females against males. The regression coefficient of the relationship is highly
significantly different from zero and from unity. The R-squared is 0.6256 and the F
14 The index of conditional entrepreneurial culture is an interval measure but does not have an absolute
zero. So with a different sample of migrants the zero point of average entrepreneurial culture could be
in a different place. While the interval between the coefficients is meaningful it is possible to rescale
the index, maintaining the relative intervals, so that the lowest entrepreneurship coefficient is set to
zero. If this is done the result is that entrepreneurial culture effect for females is always less than for
males.
16
statistic is 30. The OLS coefficient is 0.34 rising to 0.37 for Huber regression, robust
to outliers. It is the magnitude of this coefficient—together with the intercept not
significantly different from zero—that tests the female entrepreneurial culture
hypothesis H2, from which H3 and H4 are derived. The regression demonstrates that
for these countries as a whole, cultures giving rising to highly entrepreneurial males
also give rise to highly entrepreneurial females but to a much more limited extent
(H2). For entrepreneurial cultures that are less strong than average, female
entrepreneurial propensities diminish relative to the average by less than those of
males.
H3, that females are more similar in entrepreneurial propensity than are males for
reasons of entrepreneurial culture is shown by the standard deviations of the two
columns of Table 2; 0.0057 for females and 0.0132 for males.
H4: females in the present sample were quite differentiated by entrepreneurial culture
(8 out of 20 culture coefficients significantly different from zero) and quite similar in
their entrepreneurial propensities to males from the same origins (correlation 0.79).
The standard deviation of the difference between male and female culture coefficients
in Table 2 at 0.0094 is smaller than the standard deviation of the male coefficients of
0.0132. Entrepreneurial differences between males and females of the same culture
are less than the differences between males of the different cultures.
4. Concluding Discussion
The measure of cultural entrepreneurial propensities (E*
1), with which we have tested
the hypotheses, might be questioned. It attempts to control for influences on
individual entrepreneurship such as wealth, education and such like, to isolate the
origin entrepreneurial ‘residual’. But if the acquisition of wealth and education are
also entrepreneurial cultural features then the contribution of culture to female
entrepreneurship will be under-estimated. An alternative would be to test the
hypotheses simply with the immigrant entrepreneurship ratio index, the dependent
variable in the estimated model. This test attributes all (relative) entrepreneurial
chances to entrepreneurial culture, for variation in the institutional and
macroeconomic environment have been eliminated by selection of the common US
17
environment. It ignores the possible effects on entrepreneurship independent of
culture of some migrants being wealthy and educated and others less so. In so doing it
is likely to over-state the contribution of female entrepreneurial culture. The
downward biased estimates have been the focus of the discussion here.
The natural experiment provided by long established migration from many origins to
the United States has been exploited to distinguish the effect of entrepreneurial culture
from (non-family) institutions, macroeconomic conditions and the domestic
environment generally. It has demonstrated that there are wide variations in female
entrepreneurship, much of which can be ascribed to culture. Some of these variations
follow the widely noted pattern of female entrepreneurship as a whole - the lower
propensity than males to become an entrepreneur for instance. For this pattern we
have suggested an explanation, a greater female weight on family and household time,
confirmed by time use surveys, and we have derived and tested some predictions. In
particular, the differential gender effects of marriage on entrepreneurship chances,
supports the postulated weights.
In the US sample for cultural reasons there is a systematic relationship between male
and female entrepreneurial propensities. The relationship is that with highly
entrepreneurial cultures both males and females are highly entrepreneurial, though
women less so, while in cultures that do not favour entrepreneurship, females’
propensities are much closer to males. Two propositions follow from this relationship.
The first is that entrepreneurial propensities between women of different cultures are
more similar than those for men. The second is that the difference between male and
female entrepreneurial propensities from the same culture is less than the difference
between the entrepreneurial propensities of males from other cultures.
The modelling and the results are for the year 2000 for immigrant groups in the US. It
can be imagined that in other places and times cultures were, or will be, different. For
instance, cultural preferences may be identical between males and females and so
entrepreneurial behaviour differences disappear or at least are not attributable to
culture.
Further research with a larger sample of cultures could increase confidence in the
hypotheses advanced here. But for the tests to be convincing the additional cultures
18
would need to have a tradition of sending large numbers to the common environment
for several generations, as have those used in the present study. This is essential to
ensure that the chances of new immigration bias either in favour or against
entrepreneurship are eliminated.
References
Acs, Z.J., Arenius, P., Hay, M., and Minniti, M. 2005. Global entrepreneurship
monitor 2004 executive report. Babson Park, MA: Babson College. Available at
http://www.gemconsortium.org.
Arenius, P., and Minniti, M. 2005 Perceptual Variables and Nascent
Entrepreneurship. Small Business Economics, 24 3, p233-247
Baughn, C. C., Chua, B-L and Neupert, K. E. 2006. The Normative Context for
Women's Participation in Entrepreneurship: A Multicountry Study. Entrepreneurship:
Theory and Practice, 30, 5, 687-708
Beugelsdijk, S. 2007. Entrepreneurial Culture, Regional Innovativeness and
Economic Growth, Journal of Evolutionary Economics 17 187–210
Birley, S. 1989. Female entrepreneurs: Are they really different? Journal of Small
Business Management, 27(1), 32-37.
Blanchflower, D. G., Oswald, A. and Stutzer, A. 2001. Latent Entrepreneurship
across Nations, European Economic Review, May , 45, 4-6, pp. 680-91.
Blanchflower, D. G. and Shadforth, C. 2007. Entrepreneurship in the UK,
Foundations and Trends in Entrepreneurship, 3, 4, 257-364.
Brush C G 2006. Woman entrepreneurs: a research overview, M Casson et al The
Oxford Handbook of Entrepreneurship.
Burke, A.E., FitzRoy, F.R., and Nolan, M.A. 2002. Self-employment wealth and
job creation: The roles of gender, non-pecuniary motivation and entrepreneurial
ability. Small Business Economics, 19, 255-270.
Burke, R. J. 1999. Workaholism in organizations: Gender differences. Sex Roles,
41(5/6), 333-345.
Carree, M. and Verheu, I. 2009 Time allocation by the self-employed: the
determinants of the number of working hours in start-ups, Applied Economics Letters,
16, 1511-1515.
Collins, J. and Low, A., 2010 Asian Female Immigrant Entrepreneurs in Small and
Medium-Sized Businesses in Australia, Entrepreneurship and Regional Development,
19
January , v. 22, iss. 1, pp. 97-111.
Cowling, M. and Taylor, M. 2001. Entrepreneurial women and men: Two different
species? Small Business Economics, 16(3), 167-176.
Eddlestone, K. A. and Powell, G. N. 2008, The role of gender identity in
explaining sex differences in business owners' career satisfier preferences, Journal of
Business Venturing 23 244–256
Fischer E. M., Reuber, A. R. and Dyke, L. S. 1993 A theoretical overview and
extension of research on sex, gender, and entrepreneurship, Journal of Business
Venturing 8, 2, 151–168
Foreman-Peck, J. and Zhou, P. 2013 The Strength and Persistence of
Entrepreneurial Cultures, Journal of Evolutionary Economics 23 1 163-187
Gershuny, J. 2011 Time-Use Surveys and the Measurement of National Well-Being,
Centre for Time-use Research, Department of Sociology, University of Oxford
Greene, F. J., Han L and Marlow, S. 2011 Like Mother, Like Daughter? Analyzing
Maternal Influences Upon Women’s Entrepreneurial Propensity, Entrepreneurship
Theory and Practice, September
Grilo, I. and Irigoyen, J-M 2006, Entrepreneurship in the EU: To Wish and Not to
Be, Small Business Economics, 26, 4, 305-18.
Grilo I, and Thurik AR 2006 Entrepreneurship in the old and the new Europe. In:
Santarelli E (ed) Entrepreneurship, growth and innovation. Springer, Berlin
Heidelberg New York, pp 75–103
Guiso, L., Sapienza P. and Zingales L. 2006. Does culture affect economic
outcomes? Journal of Economic Perspectives 20, 2, 23–48.
Gupta V. K. , Turban D. B., Wasti S. A., and Sikdar A. 2009. The Role of Gender
Stereotypes in Perceptions of Entrepreneurs and Intentions to Become an
Entrepreneur, Entrepreneurship Theory and Practice 33 2 397-417
Hatton, T. J. and Leigh, A. 2011 Immigrants assimilate as communities, not just
as individuals, Journal of Population Economics 24 389–419
Hofstede, G. 2003 Cultures and Organizations: Software of the Mind, Profile Books
London
Hofstede, G. , Noorderhaven N G., Thurik A.R., Uhlaner L.M., Wennerkers A.
R.M. and Wilderman R. E. 2004 ‘Culture’s Role in Entrepreneurship: Self-
employment out of dissatisfaction’ in Brown T E and Ulijn J , eds Innovation,
Entrepreneurship and Cuture:The Interaction between Technology, Progress and
Economic Growth, Edward Elgar, Cheltenham UK and Northampton, MA USA

20
House, R., Javidan, M., and Dorfman, P. 2001. Project GLOBE: An Introduction.
Applied Psychology: An Internationa lReview, 50(4), 489-505.
König C., Steinmetz, H., Frese, M., Rauch A. and Wang, Z-M. 2007. ‘Scenario-
based scales measuring cultural orientations of business owners’, Journal of
Evolutionary Economics 17:211–239
Langowitz N. and Minniti M. 2007 The Entrepreneurial Propensity of Women,
Entrepreneurship Theory and Practice May 341-364
Laspita, S., Breugst, N., Heblich, S. and Patzelt H. 2012 Intergenerational
transmission of entrepreneurial intentions, Journal of Business Venturing, 27, 414–
435
Lerner, M. and Malach-Pines, A 2011 Gender and culture in family business: A
ten-nation study, International Journal of Cross Cultural Management vol. 11 no. 2
113-131
Lofstrom, M. 2002. Labour Market Assimilation and the self employment decision of
immigrant entrepreneurs. Journal of Population Economics, 15: 83-114.
Marlow, S. and Patton, D. 2005 All credit to men? Entrepreneurship, finance and
gender, Entrepreneurship: Theory and Practice 29 6 717 -735
Mitra, R. 2002. The growth pattern of women-run enterprises: An empirical study in
India. Journal of Developmental Entrepreneurship, 7(2), 217-237.
Mueller, S. L. 2004. Gender Gaps in Potential for Entrepreneurship Across Countries
and Cultures. Journal of Developmental Entrepreneurship, 9, 3, 199-220,
Mueller, S. L. and Thomas, A. S. 2000 Culture and Entrepreneurial Potential: A
Nine Country Study of Locus of Control and Innovativeness, Journal of Business
Venturing . 16, 51–75
Noorderhaven, N. , Thurik, R., Wennekers, S. and van Stel, A. 2004 ‘The Role of
Dissatisfaction and per Capita Income in Explaining Self-Employment across 15
European Countries’, Entrepreneurship: Theory and Practice, Fall, 447-466
Orser, B. J., Riding, A. L., and Manley, K. 2006 Women Entrepreneurs and
Financial Capital. Entrepreneurship: Theory and Practice, Sep., Vol. 30 Issue 5,
p643-665, 23p, 8
Parker, S. C. 2004. Economics of Self-Employment and Entrepreneurship.
Cambridge: Cambridge University Press.
Parker, S. C. 2009 The Economics of Entrepreneurship Cambridge University Press
21
Schwartz , S. H. and Rubel-Lifschitz T. 2009 Cross-National Variation in the Size
of Sex Differences in Values: Effects of Gender Equality, Journal of Personality and
Social Psychology, 97, 1, 171–185
Shinnar, R. S. , Giacomin, O. and Janssen, F. 2012 Entrepreneurial Perceptions and
Intentions: The Role of Gender and Culture, Entrepreneurship: Theory and Practice,
May 1042-2587
Smith, P. B. 2006 When elephants fight, the grass gets trampled: the GLOBE and
Hofstede projects, Journal of International Business Studies 37, 915–921.
Taylor, M. Z. and Wilson, S. 2012 Does culture still matter? The effects of
individualism on national innovation rates, Journal of Business Venturing 27, 234-247
Uhlaner L and Thurik R 2007 Postmaterialism influencing total entrepreneurial
activity across nations, Journal of Evolutionary Economics 17:161–185
Van Praag C M and van Ophem H 1995 Determinants of Willingness and
Opportunity to Start as an Entrepreneur, Kyklos 48 4 513-540
Verheul, I., Carree, M. and Thurik, R. 2009 Allocation and Productivity of Time in
New Ventures of Female and Male Entrepreneurs, Small Business Economics, 33, 3,
273-91.
Verheul, I., Van Stel, A. and Thurik, R. 2006 Explaining Female and Male
Entrepreneurship at the Country Level, Entrepreneurship and Regional Development,
18, 2, 151-83.
Wennekers S, Thurik R, van Stel A, Noorderhaven N 2007 Uncertainty avoidance
and the rate of business ownership across 21 OECD countries, 1976–2004. Journal
of Evolutionary Economics 17, 2, 133–160
22
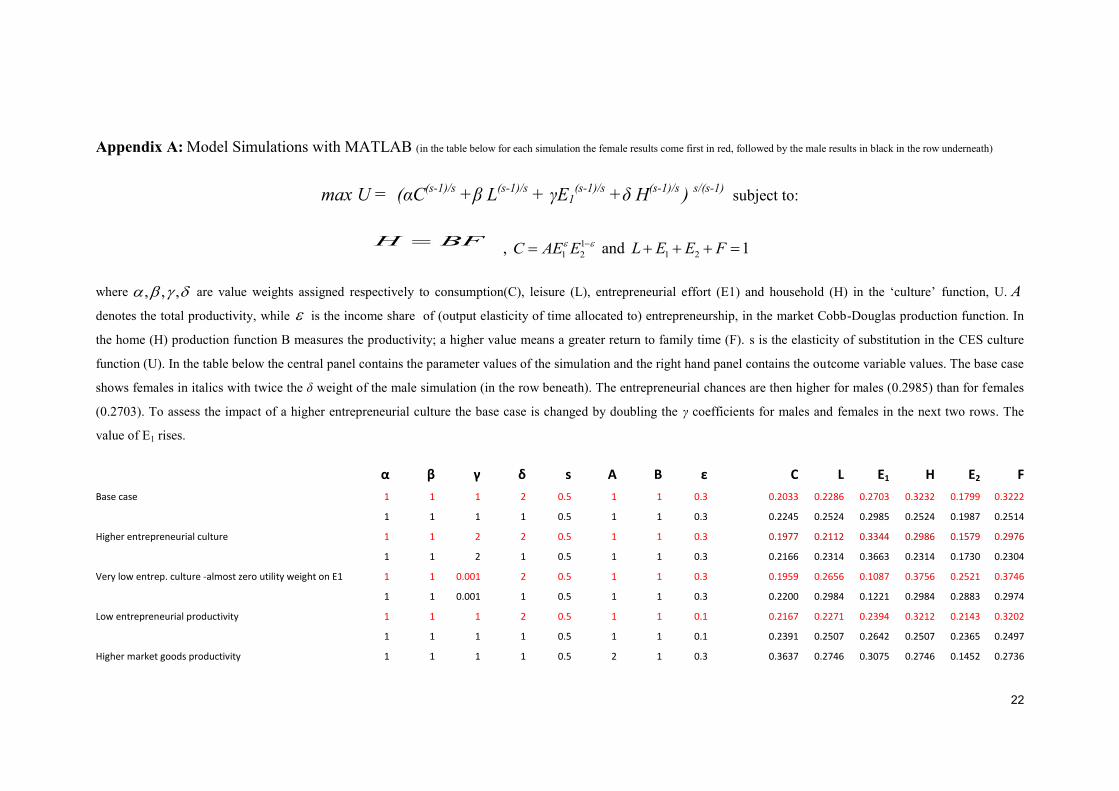
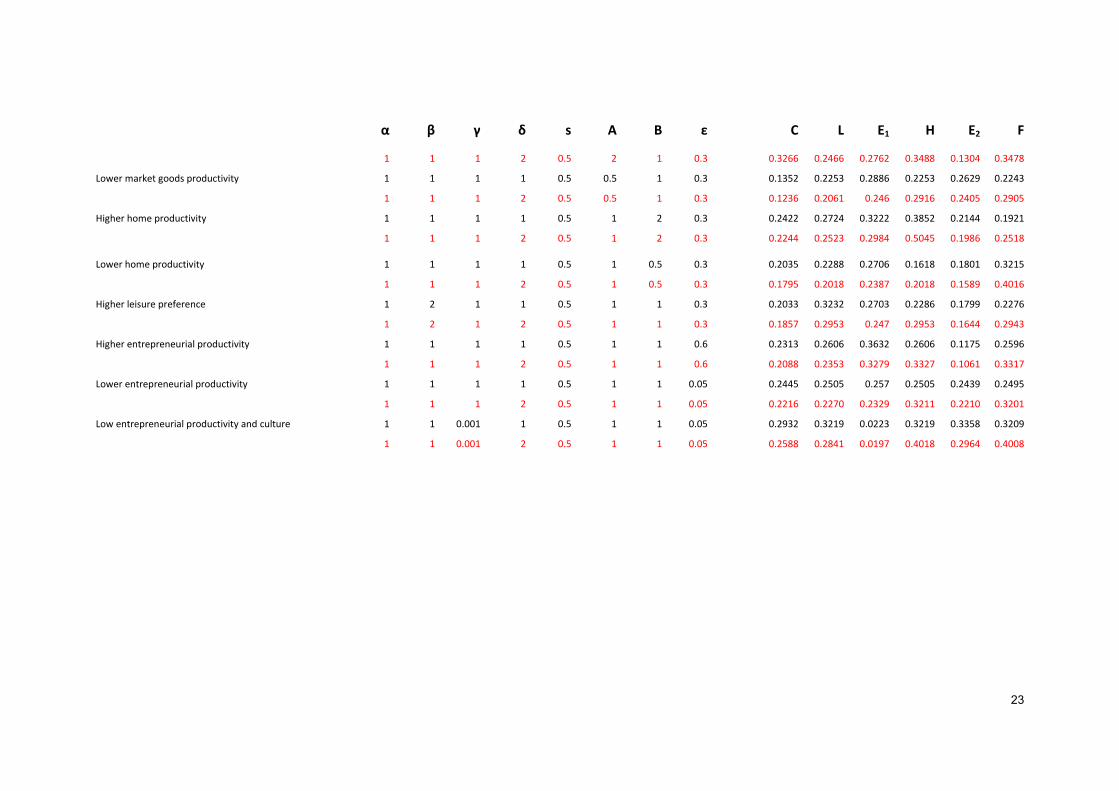
Appendix A: Model Simulations with MATLAB (in the table below for each simulation the female results come first in red, followed by the male results in black in the row underneath)
max U = (αC(s-1)/s
+β L(s-1)/s
+ γE1(s-1)/s
+δ H(s-1)/s
) s/(s-1)
subject to:
H BF, 1
1 2C AE E and 1 2 1L E E F
where , , , are value weights assigned respectively to consumption(C), leisure (L), entrepreneurial effort (E1) and household (H) in the ‘culture’ function, U. A
denotes the total productivity, while is the income share of (output elasticity of time allocated to) entrepreneurship, in the market Cobb-Douglas production function. In
the home (H) production function B measures the productivity; a higher value means a greater return to family time (F). s is the elasticity of substitution in the CES culture
function (U). In the table below the central panel contains the parameter values of the simulation and the right hand panel contains the outcome variable values. The base case
shows females in italics with twice the δ weight of the male simulation (in the row beneath). The entrepreneurial chances are then higher for males (0.2985) than for females
(0.2703). To assess the impact of a higher entrepreneurial culture the base case is changed by doubling the γ coefficients for males and females in the next two rows. The
value of E1 rises.
α β γ δ s A B ε
C L E1 H E2 F
Base case 1 1 1 2 0.5 1 1 0.3
0.2033 0.2286 0.2703 0.3232 0.1799 0.3222
1 1 1 1 0.5 1 1 0.3
0.2245 0.2524 0.2985 0.2524 0.1987 0.2514
Higher entrepreneurial culture 1 1 2 2 0.5 1 1 0.3
0.1977 0.2112 0.3344 0.2986 0.1579 0.2976
1 1 2 1 0.5 1 1 0.3
0.2166 0.2314 0.3663 0.2314 0.1730 0.2304
Very low entrep. culture -almost zero utility weight on E1 1 1 0.001 2 0.5 1 1 0.3
0.1959 0.2656 0.1087 0.3756 0.2521 0.3746
1 1 0.001 1 0.5 1 1 0.3
0.2200 0.2984 0.1221 0.2984 0.2883 0.2974
Low entrepreneurial productivity 1 1 1 2 0.5 1 1 0.1
0.2167 0.2271 0.2394 0.3212 0.2143 0.3202
1 1 1 1 0.5 1 1 0.1
0.2391 0.2507 0.2642 0.2507 0.2365 0.2497
Higher market goods productivity 1 1 1 1 0.5 2 1 0.3
0.3637 0.2746 0.3075 0.2746 0.1452 0.2736
23
α β γ δ s A B ε
C L E1 H E2 F 1 1 1 2 0.5 2 1 0.3
0.3266 0.2466 0.2762 0.3488 0.1304 0.3478
Lower market goods productivity 1 1 1 1 0.5 0.5 1 0.3
0.1352 0.2253 0.2886 0.2253 0.2629 0.2243
1 1 1 2 0.5 0.5 1 0.3
0.1236 0.2061 0.246 0.2916 0.2405 0.2905
Higher home productivity 1 1 1 1 0.5 1 2 0.3
0.2422 0.2724 0.3222 0.3852 0.2144 0.1921
1 1 1 2 0.5 1 2 0.3
0.2244 0.2523 0.2984 0.5045 0.1986 0.2518
Lower home productivity 1 1 1 1 0.5 1 0.5 0.3
0.2035 0.2288 0.2706 0.1618 0.1801 0.3215
1 1 1 2 0.5 1 0.5 0.3
0.1795 0.2018 0.2387 0.2018 0.1589 0.4016
Higher leisure preference 1 2 1 1 0.5 1 1 0.3
0.2033 0.3232 0.2703 0.2286 0.1799 0.2276
1 2 1 2 0.5 1 1 0.3
0.1857 0.2953 0.247 0.2953 0.1644 0.2943
Higher entrepreneurial productivity 1 1 1 1 0.5 1 1 0.6
0.2313 0.2606 0.3632 0.2606 0.1175 0.2596
1 1 1 2 0.5 1 1 0.6
0.2088 0.2353 0.3279 0.3327 0.1061 0.3317
Lower entrepreneurial productivity 1 1 1 1 0.5 1 1 0.05
0.2445 0.2505 0.257 0.2505 0.2439 0.2495
1 1 1 2 0.5 1 1 0.05
0.2216 0.2270 0.2329 0.3211 0.2210 0.3201
Low entrepreneurial productivity and culture 1 1 0.001 1 0.5 1 1 0.05
0.2932 0.3219 0.0223 0.3219 0.3358 0.3209
1 1 0.001 2 0.5 1 1 0.05
0.2588 0.2841 0.0197 0.4018 0.2964 0.4008
24
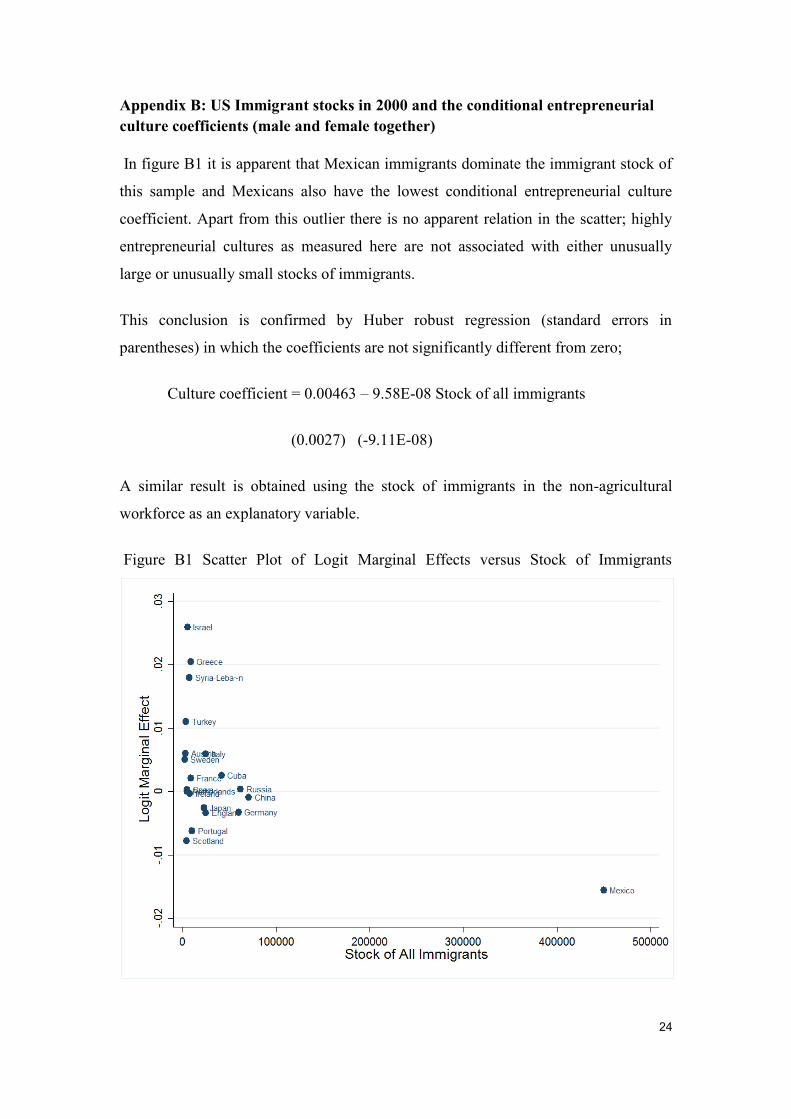
Appendix B: US Immigrant stocks in 2000 and the conditional entrepreneurial
culture coefficients (male and female together)
In figure B1 it is apparent that Mexican immigrants dominate the immigrant stock of
this sample and Mexicans also have the lowest conditional entrepreneurial culture
coefficient. Apart from this outlier there is no apparent relation in the scatter; highly
entrepreneurial cultures as measured here are not associated with either unusually
large or unusually small stocks of immigrants.
This conclusion is confirmed by Huber robust regression (standard errors in
parentheses) in which the coefficients are not significantly different from zero;
Culture coefficient = 0.00463 – 9.58E-08 Stock of all immigrants
(0.0027) (-9.11E-08)
A similar result is obtained using the stock of immigrants in the non-agricultural
workforce as an explanatory variable.
Figure B1 Scatter Plot of Logit Marginal Effects versus Stock of Immigrants
25
Tables
Table 1 Marginal Effects of Controls for Entrepreneurship in 2000; from Logits
2000 Female Male
Marital Status (married = 1) 0.00383*** 0.00845***
6~10 years in US 0.00187 0.00755***
11~15 years in US 0.00457*** 0.0112***
16~20 years in US 0.00432*** 0.0129***
21+ years in US 0.00123 0.00917***
Naturalization 0.00132* 0.00470***
Education (Grade 1~12) -0.00272* 0.00193
Education (1 to 3 years of college) -0.00092 0.00673***
Education (4+ years of college) 0.00233 0.0101***
English Speaking 0.00398*** 0.00652***
Construction 0.0282 0.0544***
Manufacturing, durables -0.0114*** -0.00705
Manufacturing, nondurables -0.00997* -0.00239
Transportation, Communication, and Other Utilities
-0.00321 0.0134
Wholesale and Retail Trade 0.0057 0.0364***
Finance, Insurance, Real Estate, Business and Repair Services
0.00321 0.0377***
Personal, Entertainment and Recreation Services
-0.0105 0.0128*
Age 0.00193*** 0.00217***
Age Squared -0.0000162*** -0.0000170***
Own Property 0.00705*** 0.0140***
Note: * p<0.05, ** p<0.01, *** p<0.001. For binary dummies, discrete changes from 0 to 1.
26
Table 2. Entrepreneurial Culture Marginal Effects 2000
Origin Country Female Male
Mexico -0.006*** -0.0236***
Cuba 0.00185 0.00299*
England -0.0035** -0.0034**
France 0.00248 0.0023
Germany -0.0022* -0.004***
Ireland -0.003 0.00133
Netherlands 0.00055 -0.0005
Italy 0.00227 0.00772***
Greece 0.01229*** 0.02557***
Turkey -0.0018 0.01843***
Russia -0.001 0.00125
China 0.00199 -0.0031**
Japan -0.0018 -0.0028
Syria and Lebanon 0.00655* 0.02399***
Israel (Jewish) 0.01318*** 0.03407***
Sweden 0.00231 0.00801
Austria 0.01058 0.00363
Scotland -0.007*** -0.0085***
Portugal -0.0054*** -0.0076***
Spain 0.00098 -0.0004
Correlation 0.79095
*p<0.05, **p<0.01, ***p<0.001
Note: Derived from logit model equation 1, the estimated control parameters of which are in Table 1. The marginal effects are actually discrete changes from 0 to 1
27
Figure 1 Entrepreneurial Chances in the US of Migrants by Origin 2000

28
Figure 2 Relation of female and male entrepreneurial cultures 2000
(logit coefficients)

29