carcinogenesis advance access published september 30, …€¦ · rna reverse transcription to cdna...
TRANSCRIPT

Accep
ted
Man
uscr
ipt
1
The mycotoxin aflatoxin B1 stimulates Epstein–Barr virus-induced B-cell transformation in in
vitro and in vivo experimental models
Rosita Accardi1,*, Henri Gruffat2,3,4,5, Cécilia Sirand1, Floriane Fusil2,3,4,5, Tarik Gheit1, Hector
Hernandez-Vargas1, Florence Le Calvez-Kelm1, Alexandra Traverse-Glehen6, François-Loïc
Cosset2,3,4,5, Evelyne Manet2,3,4,5, Christopher P. Wild1, Massimo Tommasino1
1Section of Infections, International Agency for Research on Cancer (IARC), World Health
Organization, Lyon, 69372, France
2EVIR & Oncogenic Herpesviruses Teams, International Center for Infectiology Research,
Université de Lyon, Lyon, 69007, France
3INSERM, U1111, Lyon, 69007, France
4Human Virology, Ecole Normale Supérieure de Lyon, Lyon, 69007, France
5Université Lyon 1, Centre International de Recherche en Infectiologie, Lyon, France
6Laboratoire d'anatomie et cytologie pathologiques, Centre Hospitalier Lyon-Sud, Lyon, 69495,
France
Running title: AFB1 stimulates EBV reactivation in vitro and in vivo
Keywords: AFB1, EBV, transformation, BZLF1
*Corresponding author: Rosita Accardi, Infections and Cancer Biology Group, International Agency for
Research on Cancer (IARC), World Health Organization, 69372 Lyon, France. Tel. 33 472738191, fax
33 472738442, E-mail [email protected]
© The Author 2015. Published by Oxford University Press. All rights reserved. For Permissions, please email: [email protected]
Carcinogenesis Advance Access published September 30, 2015 at U
niversity of Illinois, Chicago on O
ctober 2, 2015http://carcin.oxfordjournals.org/
Dow
nloaded from

Accep
ted
Man
uscr
ipt
2
Abstract
Although Epstein–Barr virus (EBV) infection is widely distributed, certain EBV-driven
malignancies are geographically restricted. EBV-associated Burkitt’s lymphoma (eBL) is endemic
in children living in sub-Saharan Africa. This population is heavily exposed to food contaminated
with the mycotoxin aflatoxin B1 (AFB1). Here, we show that exposure to AFB1 in in vitro and in
vivo models induces activation of the EBV lytic cycle and increases EBV load, two events that are
associated with an increased risk of eBL in vivo. AFB1 treatment leads to the alteration of cellular
gene expression, with consequent activations of signalling pathways, e.g. PI3K, that in turn
mediate reactivation of the EBV life cycle. Finally, we show that AFB1 triggers EBV-driven cellular
transformation both in primary human B cells and in a humanized animal model. In summary, our
data provide evidence for a role of AFB1 as a co-factor in EBV-mediated carcinogenesis.
Summary
Aflatoxin B1 (AFB1), a common food contaminant in sub-Saharan Africa, stimulates the EBV
replicative cycle and increases the oncogenic potential of EBV infection in in vitro and in vivo
models. AFB1 activates the PI3K signalling pathway and transcription of EBV lytic genes.
at University of Illinois, C
hicago on October 2, 2015
http://carcin.oxfordjournals.org/D
ownloaded from

Accep
ted
Man
uscr
ipt
3
Introduction
Epstein–Barr virus (EBV) belongs to the gammaherpesvirus family and is detected in 95% of the
world’s adult population. In most cases, the EBV infection is asymptomatic; however, EBV is
associated with several types of human B-cell malignancies. Despite the ubiquity of EBV infection
in the worldwide population, certain EBV-driven cancers have a high incidence in specific
geographical areas, i.e. endemic Burkitt's lymphoma (eBL) in equatorial Africa and
nasopharyngeal carcinoma in China. The geographically dependent incidence of these cancers
indicates that environmental or genetic factors also contribute to EBV-mediated carcinogenesis.
The EBV life cycle in B cells includes latent and lytic states. In the latent state, the virus exists as
a nuclear episome form associated with histones, and only a few viral genes are expressed.
When the virus enters the lytic state, all viral genes are expressed and rapid replication of the
viral genome occurs, until the cell is lysed and virus particles are released. Induction of the lytic
cycle depends on the expression of the viral gene BZLF1. This viral protein is an immediate-early
transcription factor responsible for the expression of the viral early genes, leading to viral DNA
replication. Under normal conditions, EBV infection is kept under tight control by the immune
system, the virus is present in the latent state in a restricted pool of resting B cells, and the lytic
cycle is only transiently activated in some differentiated cells to allow spread of the virus. Several
factors, e.g. immunosuppression or exposure to certain chemicals, can cooperate to induce
reactivation of viral replication [1-4], an event that appears to play an important role in the
development of EBV-induced malignancy [5]. The geographical co-distribution of certain EBV-
related cancers with one or more of these environmental factors supports their functional role in
the development of these diseases. Some of these factors are known: immune system failure and
co-infection with malaria parasites. The latter is considered a risk factor for the development of
eBL [6], probably due to its immunosuppressive effects and its ability to induce B-cell proliferation
[7] and activation of cellular oncogenes [8]. However, the extensive molecular alterations in BL
[9,10] suggest a more complex etiology of the disease, with involvement of multiple risk factors. In
addition, early studies reported negative or inverse associations between Plasmodium falciparum
prevalence and eBL [11-13].
at University of Illinois, C
hicago on October 2, 2015
http://carcin.oxfordjournals.org/D
ownloaded from

Accep
ted
Man
uscr
ipt
4
Aflatoxin B1 (AFB1) is a mycotoxin produced by Aspergillus fungi that has been clearly shown to
synergize with hepatitis B virus in the development of hepatocellular carcinoma (reviewed in [14]).
In Africa, the areas with high exposure to AFB1 through consumption of contaminated food,
particularly maize- and groundnut-based dietary staples, are situated in the lymphoma belt, so-
called due to the high incidence of eBL. In 1989, Henderson and co-workers showed that a few
carcinogens, including AFB1, have the ability to enhance EBV genome amplification. However,
no mechanistic findings were provided [15,16]. In this study, using in vitro and in vivo
experimental models, we further investigated the role of AFB1 in the EBV life cycle. Our data
show that AFB1 triggers EBV replication and viral-driven carcinogenesis and provide insights into
the underlying mechanisms.
Materials and methods
Cell culture. Peripheral B cells were purified from blood samples using the RosetteSep human
enrichment kit (Stemcell Technologies; 15064). Lymphoblastoid cell lines (LCLs) were generated
in this study by infection of primary B cells from different donors, as previously described [17].
Primary and immortalized B cells were cultured in RPMI 1640 medium (GIBCO; Invitrogen life
Technologies) supplemented with 10% FBS, 100 U/ml penicillin G, 100 mg/ml streptomycin, 2
mM L-glutamine, and 1 mM sodium pyruvate (PAA Laboratories). Cells were treated with AFB1
(Sigma; A6636) and AFB2 (Sigma; A9887) from a stock solution dissolved in DMSO (the length
of treatment and the concentrations used varied according to the cell type used and are indicated
in the Results section), or with 10 µM JNK inhibitor II SP600125 (VWR International; 420119), 10
µM SB 203580 (VWR International; 559398), 1.5 µM LY294002 (Euromedex; S1105), and 20 nM
AS605240 (Tocris Bioscience; 3578). In all experiments, cells were pre-incubated with the
different inhibitors for 2.5 hours before adding AFB1, and maintained for an additional 48 hours.
at University of Illinois, C
hicago on October 2, 2015
http://carcin.oxfordjournals.org/D
ownloaded from
Accep
ted
Man
uscr
ipt
5
Cell line authentication. The Raji (EBV-positive) and Louckes (EBV-negative) BL cell lines, part of
the cell line collection of Gilbert Lenoir at IARC, were thawed and used for the present study. The
cell lines were tested for EBV status by fluorescence in situ hybridization (FISH) and quantitative
PCR (qPCR). Raji cells were further authenticated by Multiplex human Cell line Authentication
Test (MCA), DKFZ, Heidelberg (http://www.multiplexion.de/en/cell-line-testing-service/multiplex-
human-cell-line-authentication).
RT-PCR and quantitative PCR. Total RNA was extracted using the Absolutely RNA Miniprep kit
(Stratagene). RNA reverse transcription to cDNA was carried out by RevertAid H Minus M-MuLV
Reverse Transcriptase (MBI Fermentas), according to the manufacturer’s protocol. qPCR was
performed in duplicate in each experiment, as previously described
[17]http://www.plospathogens.org/article/info%3Adoi%2F10.1371%2Fjournal.ppat.1003
186 - ppat.1003186-Fathallah1#ppat.1003186-Fathallah1. The PCR primer sequences are
indicated in Supplementary Table I.
In order to measure EBV genome copy number per cell, total DNA was extracted using the
QIAamp DNA mini kit (Qiagen) and measured by NanoDrop. Similar amounts of DNA were used
as a template for each qPCR performed with specific primers for the BDRF1 gene. Different
amounts of a vector containing the BDRF1 gene (1010 to 1 copies) were added to the PCR to
generate a standard curve. The copies of BDRF1 were normalized on cell number or on the
number of copies of the GAPDH gene. EBV viral load in mouse blood samples was measured as
previously described [18]; 100 µl of blood from each mouse was collected by retro-orbital
bleeding. The DNA was extracted using the QIAamp DNA mini kit and eluted in 100 µl of
nuclease-free water. Then, 5 µl of DNA was used for TaqMan PCR using primers and probes
designed on the EBV BamH1W segment: W1, 5′-GCAGCCGCCCAGTCTCT-3′; EBV W2, 5′-
ACAGACAGTGCACAGGAGCCT-3′; and EBVW probe, 5′-(6-carboxyfluorescein)
AAAAGCTGGCGCCCTTGCCTG(6-carboxytetramethylrhodamine)-3′. For each mouse, the PCR
was performed 3 times.
at University of Illinois, C
hicago on October 2, 2015
http://carcin.oxfordjournals.org/D
ownloaded from

Accep
ted
Man
uscr
ipt
6
Gene expression silencing. Gene silencing of PIK3CG was performed using PIK3CG (human)
unique 27mer siRNA duplexes (SR303524; OriGene). LCLs (1 × 10⁷) were transfected with the
siRNA (final concentration, 50 nM) by electroporation using the Neon Transfection System (10 µl
tips) (pulse voltage, 1350 V; pulse width, 40 ms). At 48 hours post-transfection, the cells were
collected and processed for RNA extraction. The levels of silencing were evaluated by qPCR
using PIK3CG specific primers (see Supplementary Table I for sequences).
Fluorescence immunostaining (FISH). FISH was performed as described in Calattini et al. [19].
Immunoblotting and antibodies. Whole-cell lysate extracts, sodium dodecyl sulfate-
polyacrylamide gel electrophoresis (SDS-PAGE), and immunoblotting (IB) were performed as
previously described [20,21]. The following antibodies were used for IB: anti-β-actin (C4; MP
Biomedicals), anti-LMP-1 Ab (S12; a gift from George Mosialos, Alexander Fleming Institute,
Varkiza, Greece), anti-P Ser 9 GSK3B (5080; Cell Signaling), anti-GSK3B (27C10; Cell
Signaling), anti-GFP (Santa Cruz), anti-BZLF1 [22], and anti-BMRF1 (MAb NCL-EADE31
Novocastra).
Chromatin immunoprecipitation. Chromatin immunoprecipitation (ChIP) was performed with
Diagenode Shearing ChIP and OneDay ChIP kits according to the manufacturer’s protocols. The
following antibodies were used: histone 3 lysine 4 trimethyl polyclonal antibody H3K27
(Epigentek) and acetyl-histone H4 (17-630; Millipore). The eluted DNA was used as template for
qPCR. Primers for quantitative ChIP are listed in Supplementary Table I. The value of binding
obtained for each antibody was calibrated on the input sample, normalized to the IgG values.
at University of Illinois, C
hicago on October 2, 2015
http://carcin.oxfordjournals.org/D
ownloaded from

Accep
ted
Man
uscr
ipt
7
Conditioning and reconstitution of NSG mice. Non-obese diabetic/severe combined
immunodeficient (NSG) mice were obtained from Charles River Laboratories (JAX™ mice strain;
NOD.Cg-Prkdcscid Il2rgtm1Wjl/SzJ mice) and bred as congenic mice. Mice were housed in the
animal facility ENS-PBES located in Lyon, France). Experiments were performed in accordance
with the institutional animal care guidelines upon approval of the protocols by the local ethics
committee. Newborn NSG mice 2–3 days old were subjected to an irradiation of 1 Gy, and 2 ×
105 fetal liver CD34+ cells derived from 6 different donors (CliniSciences; FL-CD34-002F) were
injected intra-hepatically. After 9 weeks, the level of humanization was estimated by FACS
analysis by assessing the levels of hCD45+ cells. Fourteen mice were identified and retained as
having more than 20% of hCD45+ blood cells (Supplementary Table IV indicates the sex of each
mouse). Two groups of 7 animals with similar average percentages of hCD45+ cells were
generated: group 1, 49.3% (±18.8% standard deviation [SD]); group 2, 42.7% (±18.6% SD).
Human stem cells from 5 different donors were equally represented in the two mouse groups.
Mice in group 1 received a daily intra-peritoneal (IP) injection of AFB1, while mice in group 2
received the same volume of DMSO. AFB1 concentration at the starting point was 50 µg/kg bw;
after 2 weeks, the AFB1 concentration used was increased to 70 µg/kg bw. After 4 weeks of
AFB1 treatment, 4 mice from each of group 1 (AFB1) and group 2 (DMSO) were infected with
EBV by IP injection (0.5 × 10⁵ EBV particles), while 3 mice from each group were mock-infected
and instead received an injection of PBS. After EBV infection, all mice were injected daily for 3
days with 100 µg/kg bw of AFB1 (group 1) or DMSO (group 2); during the second, third, and
fourth weeks post-infection, the mice received a maintenance dose of two IP injections per week
of AFB1 (70 µg/kg bw) or DMSO. One week post-infection, one of the 4 EBV-infected mice from
each group (AFB1 and DMSO) was sacrificed due to signs of severe illness and was excluded
from the analysis. Blood samples were collected at weeks 1, 2, and 3 by retro-orbital bleeding
and frozen to be processed later for determination of EBV viral load. All mice were sacrificed
between week 4 and week 6 post-infection. Blood and various organs (spleen, lymph node,
thymus, pancreas, kidney, liver, and lungs) of the mice were recovered at sacrifice. Organs were
fixed with 10% formalin and then paraffin-embedded. Half of each spleen was kept, and cellular
at University of Illinois, C
hicago on October 2, 2015
http://carcin.oxfordjournals.org/D
ownloaded from

Accep
ted
Man
uscr
ipt
8
suspensions were prepared by gently grinding the organs between two layers of a 40 µm strainer.
Cell suspensions were processed on a Ficoll gradient. Cells were frozen for later RNA extraction
for evaluation of the level of EBV gene expression. Immunohistochemical (IHC) and
immunofluorescence (IF) staining was performed on paraffin-embedded tissue sections of spleen,
following standard procedures. Staining was performed with the following primary antibodies:
NCL-EBV-CS1-4, monoclonal anti-human (Novocastra; dilution 1:100); anti-EBNA2, mouse
monoclonal (Abcam ab90543; dilution 1:1000); NCL-L-KI67-MM1, mouse monoclonal (Leica;
dilution 1:200), anti-human CD3, polyclonal rabbit (Dako A04542; dilution 1:1000), and anti-
human CD20y, mouse monoclonal (Dako M0755; dilution 1:2000). For IHC staining, images were
taken with a Nikon Eclipse E600 camera, and for IF staining, images were taken with an
immunofluorescence Axioplan2 microscope from Zeiss. Staining was analyzed blindly by the
pathologist.
Whole-genome expression analysis. Total RNA was isolated using TRIzol Reagent (Invitrogen)
according to the manufacturer’s instructions. RNA quantity and quality were assessed with an
ND-8000 spectrophotometer and bioanalyzer. 500 ng of total RNA was used for each Human HT-
12 Expression BeadChip (Illumina), as previously described [23]. Raw expression bead array
data were exported from GenomeStudio (version 2010.3, Illumina) into BRB-ArrayTools software
(version 4.3.1, developed by Richard Simon and the BRB-ArrayTools Development Team), as
previously described [23]. Data were normalized and annotated using the R/Bioconductor
package lumi [24]. The quality of the data was assessed by plotting the distribution of the intensity
for all probes, and a correlation between technical replicates was performed. Class comparison
between groups of bead arrays was done by computing a t-test separately for each gene using
the normalized log-transformed beta values. Only those probes with p value < 0.01, false
discovery rate (FDR) < 0.05, and fold change > 1.5 were considered differentially expressed.
Pathway analysis was done using the gene set comparison tool of BRB-ArrayTools, with a
minimum of 20 genes per pathway and p value < 0.005. Pre-defined BioCarta pathways were
used as a reference. Functional class scoring was used to identify differentially expressed
at University of Illinois, C
hicago on October 2, 2015
http://carcin.oxfordjournals.org/D
ownloaded from

Accep
ted
Man
uscr
ipt
9
categories among phenotype classes [25]. The significance values are based on testing the null
hypothesis that the list of genes that belong to a given category is a random selection from the
project gene list, against the alternative hypothesis that the list contains more genes differentially
expressed between the classes being compared.
Statistical analysis. Statistical significance was determined by the Student t-test. The p value of
each experiment is indicated in the corresponding figure legend. Error bars in the graphs
represent the SD.
Results
AFB1 increases EBV replication in primary and immortalized B cells
Based on previous findings [15,16], we first evaluated whether AFB1 treatment affects EBV
replication. Primary human B cells from different donors were pre-cultured in the presence of
different concentrations of AFB1 and subsequently infected with recombinant EBV virus
expressing the green fluorescent protein (GFP) gene (GFP-EBV). The treated cells were then
subjected to FACS analysis. As shown in Figure 1A, AFB1 treatment increased the number of
GFP-positive cells in a dose-dependent manner. Accordingly, when primary B cells were infected
with EBV, AFB1 significantly increased the number of immortalized B cells compared with mock-
infected cells (Figure 1B). Next, we determined whether the less toxic and carcinogenic
mycotoxin AFB2, which cannot be bio-activated to the reactive 8,9-epoxide [26], also increases
the efficiency of EBV infection. In contrast to AFB1, pre-incubation of primary B cells with AFB2 or
with DMSO alone (mock cells) resulted in a similar number of GFP-positive cells (Figure 1C) and
in similar values of mean fluorescence intensity (Figure 1D), indicating that AFB2 lacks the ability
of AFB1 to stimulate EBV infection.
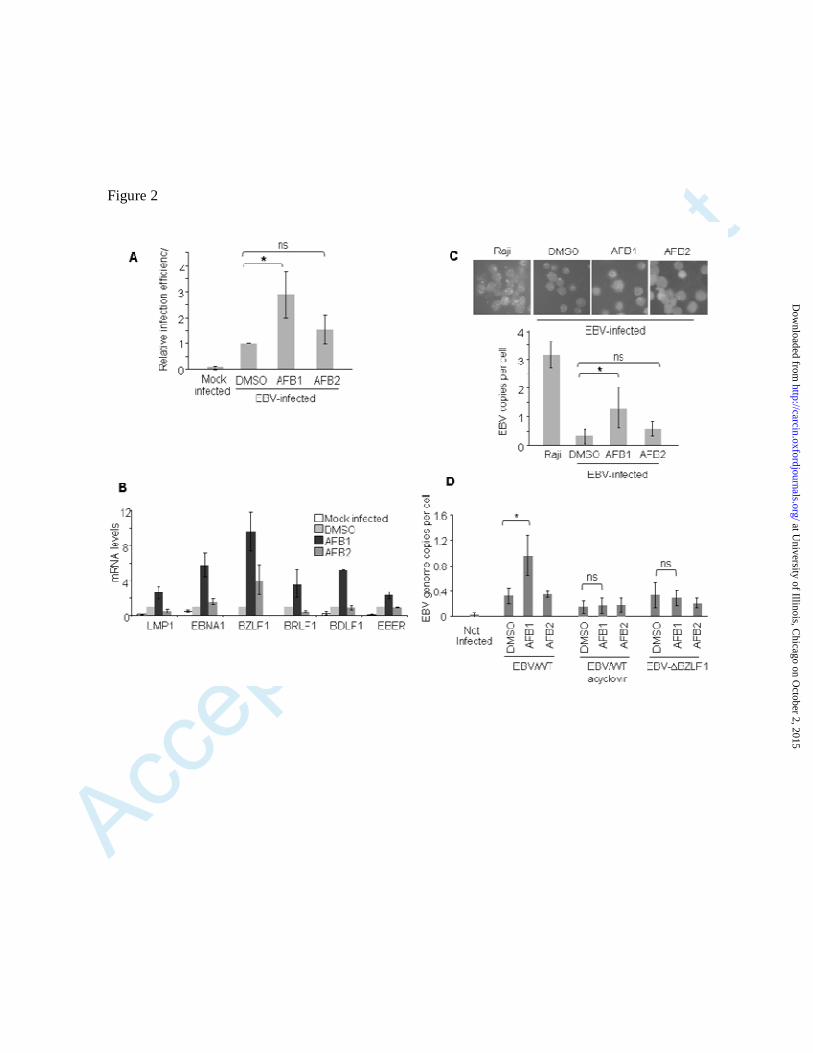
To validate these data in another experimental model, we performed similar experiments with
immortalized B cells (Louckes). As observed in primary B cells, pre-incubation with AFB1
stimulated EBV infection, as shown by the increased number of GFP-positive cells (Figure 2A).
at University of Illinois, C
hicago on October 2, 2015
http://carcin.oxfordjournals.org/D
ownloaded from

Accep
ted
Man
uscr
ipt
10
Although the GFP gene is inserted into the EBV genome, its expression is under the control of a
constitutive heterologous promoter. This implies that the expression level of the GFP protein was
not dependent on the EBV status. Therefore, to further corroborate our initial finding we used
additional strategies to monitor EBV infection. Quantitative RT-PCR revealed that expression of
several EBV genes was higher in AFB1-treated B cells compared with mock or AFB2-treated B
cells (Figure 2B). In situ hybridization staining, using EBV-specific probes, confirmed the
presence of an increased number of EBV genomes in cells pre-treated with AFB1 compared with
AFB2 or mock-treated cells (Figure 2C).
Taken together, these data show that AFB1 efficiently stimulates the EBV infection of B cells,
whereas AFB2 exposure resulted either in no change compared with DMSO control or in small
increases, but most often not statistically significant under the experimental design used.
AFB1 induces the EBV replicative cycle
The increase in EBV infection efficiency in AFB1-treated cells could be due to an effect of the
mycotoxin on viral entry and/or on EBV DNA replication. To discriminate between these two
possibilities, we exposed Louckes cells to AFB1 or AFB2 and subsequently infected them with
GFP-EBV in the presence or absence of a viral DNA replication inhibitor, acyclovir. Acyclovir
abolished the AFB1-dependent increase in the GFP signal and EBV genome copy number
(Figure 2D and Supplementary Figure 1A and B), suggesting that EBV DNA replication was
involved in the increased infection efficiency seen in AFB1-treated cells. To confirm this
observation, we used a replication-deficient virus (EBV∆BZLF1) [27]. Cells pre-treated with AFB1
and infected with the EBV∆BZLF1 recombinant virus showed similar infection efficiency to the
untreated cells infected with the wild-type virus (Figure 2D and Supplementary Figure 1A and B).
Previous studies reported that activation of the lytic cascade requires methylation of the CG
dinucleotide-containing motif (meZREs) within the promoters of BZLF1 target genes [28,29].
Louckes cells pre-treated with AFB1 for 48 hours and subsequently infected by EBV showed an
overall significant increase in methylation levels within the CpGs including the meZRE in the
promoter of the BZLF1 target genes BRLF1 and BBLF4 (Supplementary Figure 1C and D).
at University of Illinois, C
hicago on October 2, 2015
http://carcin.oxfordjournals.org/D
ownloaded from

Accep
ted
Man
uscr
ipt
11
Consistent with our other data, AFB2 did not significantly increase DNA methylation within these
EBV promoter regions (Supplementary Figure 1C and D). Future studies will be needed to
elucidate the exact mechanism by which AFB1 increases viral DNA methylation. Nevertheless,
these data indicate that AFB1 exerts its positive effect on EBV infection by stimulating the EBV
replicative program, rather than by facilitating virus entry.
Based on these findings, we next determined whether AFB1 was able to reactivate the EBV lytic
cycle in latently infected cells. To this end, we used LCLs that were previously infected and
immortalized by GFP-EBV. The addition of AFB1 to LCLs increased the GFP signal as well as the
EBV genome copy number in a dose-dependent manner (Figure 3A). We next evaluated whether
the induction of EBV replication by AFB1 is due to activation of the lytic cycle. A strong up-
regulation of EBV lytic gene expression (BZLF1, BRLF1, BdRF1, and BDLF1) was observed in
LCLs exposed to AFB1, whereas no significant changes were detected in the mRNA levels of the
two latent genes, EBNA1 and LMP1 (Figure 3B and C). In latently infected B cells, the promoter
of BZLF1 is inactivated by epigenetic changes [30]. In agreement with increased BZLF1
expression levels in LCLs treated with AFB1, ChIP experiments showed an enrichment of
markers of active chromatin, such as tri-methylation of histone 3 at lysine 4 (H3K4me3) as well as
histone 4 acetylation within the BZLF1 promoter region in the AFB1-treated cells (Figure 3D). In
contrast, only weak epigenetic changes were observed in the EBNA1 promoter region.
Together, these data show that AFB1 stimulates the lytic replication of EBV.
AFB1 alters B-cell gene expression
To gain insight into the mechanism involved in the AFB1-mediated reactivation of EBV lytic
replication, we evaluated whether AFB1 treatment alters B-cell gene expression. To do this, we
compared the whole-genome expression of AFB1-treated cells with that of the DMSO-treated
control cells, using bead arrays. AFB2-treated cells were also analyzed for comparison. The
quality of the bead arrays was assessed as described in Materials and Methods, followed by data
filtering and normalization. Unsupervised clustering was able to distinguish all experimental
conditions and showed that, in general, AFB1 and AFB2 induce similar transcriptome changes
at University of Illinois, C
hicago on October 2, 2015
http://carcin.oxfordjournals.org/D
ownloaded from

Accep
ted
Man
uscr
ipt
12
relative to DMSO-treated control cells (Supplementary Figure 2A). Direct class comparison
identified 273 differentially expressed genes in AFB1 relative to DMSO-treated cells (p value <
0.01, FDR < 0.05) (Supplementary Table II). A total of 156 genes were down-regulated, and 117
genes were overexpressed after AFB1 exposure (Supplementary Figure 2B). Analysis of the
expression profile of AFB2-treated cells revealed that the same genes deregulated by AFB1 are
also targeted by AFB2, although with less efficiency, as indicated by the dark red and dark green
colours in the heat map (Supplementary Figure 2B). Pathway enrichment analysis in response to
AFB1 treatment identified 29 significantly enriched pathways (Supplementary Table III-A). In
addition to cell death and cell cycle pathways, there was a significant enrichment in pathways
related to AKT, mitogen-activated protein kinases (MAPK), mTOR, and phosphoinositide-3-
kinase (PI3K) signalling. This is consistent with what was previously shown in AFB1-treated
hepatocytes [31]. To explore the significance of deregulation of these pathways, we performed
unsupervised clustering based on the relevant pathways, including AKT, MAPK, mTOR, and PI3K
(Supplementary Figure 2C). To this end, we selected all genes within each BioCarta pathway
regardless of their significance in the class comparison analysis. The identified genes within each
of these pathways discriminated between AFB1 and DMSO conditions (Supplementary Figure
2C). Similar findings were seen with clustering of the AFB2-treated samples (Figure 2C,
supplementary material). In agreement with the expression profile data, AFB1 and AFB2 are able
to deregulate the same cellular pathways (Supplementary Figure 2C and Supplementary Table
III-B). However, some pathways appear to be specifically deregulated by either AFB1 or AFB2
(Supplementary Table III-A vs -B). For instance, only AFB2 targets the Toll-like receptor pathway
or the IL6 pathway. In contrast, AFB1 deregulates the expression of players in the AKT pathway,
i.e. PIK3CG and PIK3CA (Supplementary Table III-A vs -B and highlighted genes in
Supplementary Figure 2C). A more stringent analysis conducted on genes differently expressed
in AFB1 or AFB2 compared with DMSO with p value <10−6 led to the identification of 11 cellular
genes that were significantly deregulated only by AFB1, including PIK3CG (Figure 4). Together,
these findings show that AFB1 is able to induce differential gene expression with specific
at University of Illinois, C
hicago on October 2, 2015
http://carcin.oxfordjournals.org/D
ownloaded from

Accep
ted
Man
uscr
ipt
13
enrichment in several signalling pathways that control the cell’s response to environmental
exposures.
The PI3K pathway is required for the AFB1-mediated activation of BZLF1 expression
Reactivation of the EBV lytic cycle in latently infected cells is mediated by several signalling
pathways, such as PI3K and MAPKs (e.g. p38 MAP kinase and Jun N-terminal kinase), which are
directly involved in the activation of the BZLF1 promoter [32]. Our array gene expression data
demonstrated that the PI3K catalytic subunit gamma (PI3KCG) is up-regulated by AFB1 and, at a
lower level, by AFB2. These data were subsequently validated by quantitative RT-PCR (Figure
5A). In addition, phosphorylation at serine 9 of GSK3B, a substrate of the PI3K/AKT pathway,
was strongly increased by AFB1 in LCLs compared with DMSO-treated cells (Figure 5B).
Importantly, treatment with chemical inhibitors of the PI3K pathway prevented the AFB1-mediated
activation of the lytic gene BZLF1, while not significantly altering the expression of EBNA1 (Figure
5C). Similarly, AFB1-mediated induction of BZLF1 expression was abolished by silencing the
expression of PI3KCG by siRNA (Figure 5D). The increase in the mRNA levels of BZLF1 and
PI3KCG induced by AFB1 is also dependent on the duration of exposure (24 hours for
experiments in Figure 5D and E and 48 hours for experiments in Figure 5A, B, and C). Finally,
transient transfection experiments performed with a BZLF1 promoter fused to the Luciferase gene
showed that AFB1 induces activation of the BZLF1 promoter in LCLs, which requires a functional
PI3K pathway (Figure 5E). The PI3K pathway inhibitor (LY234002) and the specific inhibitor of
PI3KCG (AS605240) abolish the AFB1-dependent BZLF1 promoter activation (Figure 5E). These
data suggest that activation of the PI3K pathway by AFB1 facilitates the recruitment of a positive
transcription factor to the BZLF1 promoter. Together, these data show that activation of the PI3K
pathway contributes to the AFB1-mediated stimulation of BZLF1 expression. In agreement with
the lower efficiency of AFB2 in stimulating the EBV life cycle, AFB2 has much reduced activity to
deregulate the expression of PIK3CG.
at University of Illinois, C
hicago on October 2, 2015
http://carcin.oxfordjournals.org/D
ownloaded from

Accep
ted
Man
uscr
ipt
14
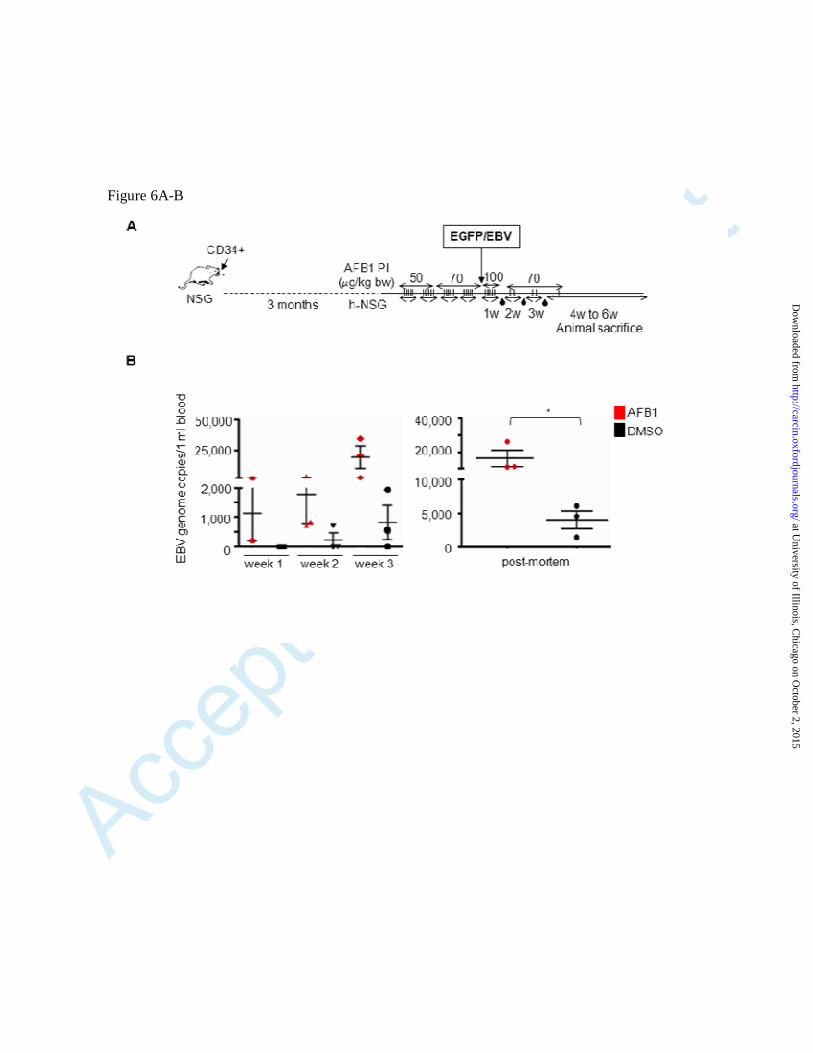
Chronic exposure of NSG mice to AFB1 increases EBV viral load in peripheral blood and EBV-
driven carcinogenesis
To corroborate our in vitro data, we evaluated the effects of AFB1 on EBV infection in an animal
model. Non-obese diabetic/severe combined immunodeficient (NOD/LtSz-scid/IL2Rynull) (NSG)
mice reconstituted with human CD34+ hematopoietic stem cells (huNSG) have been previously
used to study EBV infection [33,34]. Therefore, we established the protocol, schematically
represented in Figure 6A, to mimic chronic exposure to AFB1 in huNSG mice. Two groups of 6
animals with similar average percentages of hCD45+ cells were generated and exposed to AFB1
(group 1) or DMSO (group 2), as shown in Figure 6A and described in Materials and Methods,
and subjected to EBV infection (Figure 6A). All mice in the AFB1/EBV group and only one mouse
in the DMSO/EBV group showed signs of illness at sacrifice. Next, we determined EBV load in
blood of the two groups of mice by qPCR. Figure 6B (left panel) shows that 2 out of 3 mice in the
AFB1-exposed group had detectable EBV titer in their blood within the first week post-infection
and that all mice in that group had measurable EBV at the second week post-infection. At the
third week post-infection, EBV DNA was detected in the blood of AFB1-unexposed and AFB1-
exposed animals; however, the EBV titer was higher in the AFB1-exposed animals (Fig. 6B, left
panel). This difference in EBV load was still detectable in the blood of AFB1-unexposed and
AFB1-exposed mice after sacrifice (4–6 weeks post-infection) (Figure 6B, right panel).
Subsequently, we analyzed the EBV infection status in the spleens of all animals, since the
spleen is a site of lymphoma dissemination in mice [35]. Consistent with the data obtained from
the blood, we observed by IF and double IHC that the spleens of the AFB1-exposed mice had a
much higher number of EBNA2-positive B cells (CD20+ cells) (Figure 6C), a marker of type III
latency patterns of EBV gene expression that is associated with the transformed phenotype of
EBV-infected cells [36]. Accordingly, EBER RNA levels were higher in the AFB1-exposed mice
compared with the control mice (Figure 6D). Moreover, in line with the in vitro results, BZLF1
mRNA levels were significantly higher (p value <0.03) in the spleen of the AFB1-exposed mice
compared with the control mice (Figure 6E). Macroscopic analysis of the spleens of the sacrificed
mice revealed the presence of splenomegaly in all AFB1-exposed mice, whereas this was not
at University of Illinois, C
hicago on October 2, 2015
http://carcin.oxfordjournals.org/D
ownloaded from

Accep
ted
Man
uscr
ipt
15
observed in the AFB1-unexposed animals (Table I). Visual inspection of the spleens revealed that
only mice exposed to AFB1 and infected with EBV showed splenic nodules (Table I). Next,
histopathology assessments of the spleens were performed by the pathologist in a blinded
manner, without knowing the different treatments of the animals. Histological analysis of the
splenic nodules revealed that they are the results of white pulp hyperplasia (CD20+ island in
Figure 6F). Hematoxylin–eosin staining revealed a moderate enlargement of the white pulp in the
spleens of mice infected with EBV or exposed to AFB1, and a large increase in the size of the
white pulp islands, often coalescing, in all the mice exposed to both agents (Figure 6F). The
enlarged size of the spleen white pulp in these mice correlates well with the higher proliferation
levels of the cells measured by Ki67 immunostaining and with the presence of atypical
disseminated large B cells (Table I). Together, these two parameters indicate a potential early
stage of transformation. It was noted that one mouse in the DMSO/EBV-exposed group also
showed only a few disseminated large B cells. However, the cellular proliferation rate in the
spleen of that mouse was lower than that in the mice in the AFB1/EBV-exposed group. Only one
mouse infected by EBV in the absence of AFB1 showed a few disseminated large B cells in the
spleen, but with a lower proliferative rate compared with the AFB1/EBV-exposed mice (Table I).
Quantification of enlarged B cells double-positive for EBNA2 and CD20 revealed a significant
increase in their number in AFB1/EBV-exposed animals compared with EBV-exposed animals
(Figure 6G). Overall, the animal model data support that AFB1 stimulates EBV infection and can
therefore promote EBV-induced B-cell transformation.
Discussion
The fact that the EBV-associated eBL has a high incidence in sub-Saharan Africa strongly
suggests that environmental factors cooperate with the virus in the development of this
malignancy. Co-infection with malaria parasites is considered a risk factor for the development of
eBL [8]. However, the involvement of additional environmental factors in eBL development is
likely. Here, we show that the mycotoxin AFB1, which is a common food contaminant in the sub-
Saharan region and is ubiquitous in the blood of many of these populations [37], can directly
at University of Illinois, C
hicago on October 2, 2015
http://carcin.oxfordjournals.org/D
ownloaded from

Accep
ted
Man
uscr
ipt
16
stimulate the EBV replicative cycle and EBV-driven cellular transformation in in vitro and in vivo
experimental models. Our data confirm previous data from Henderson et al. showing that AFB1,
similarly to other carcinogens, can induce amplification of the EBV genome. Our findings are in
agreement with the concept that, despite activation of the EBV lytic cycle leading to cell death,
repeated cycles of reactivation would favour progression toward EBV-induced malignancy.
Evidence from different studies supports this hypothesis. For instance, treating transplant
recipients with antiviral drugs that inhibit lytic replication reduces the risk of EBV-associated
lymphomas [38,39]. In addition, LCLs generated by an EBV mutant defective for lytic replication
are less efficient that the wild-type (WT) virus in LCLs developing lymphoproliferative disease-like
lesions in SCID mice [40]. Accordingly, high EBV viral load and high levels of lytic antibodies are
associated with an increased risk of lymphoma in vivo [13]. Thus, our data support a role of AFB1
in eBL and/or other EBV-driven malignancies by reactivation of the EBV lytic cycle. Similarly to
other studies [41-44], our results also show that exposure to AFB1 leads to the reprogramming of
B-cell expression. Several pathways known to induce activation of the early lytic genes (e.g. p38
MAP kinase, MEKK4, and PI3K/Akt) were activated in AFB1-treated cells; this is similar to what
has been observed in AFB1-treated hepatocytes. Our findings show that the AFB1-induced
stimulation of the EBV lytic cycle is in part mediated by activation of the PI3K pathway. Moreover,
the inhibitors of p38 MAP kinase and Jun N-terminal kinase also impair the ability of AFB1 to
induce BZLF1 expression, indicating that these signalling pathways are also important for the
AFB1-mediated stimulation of the EBV life cycle.
In line with the known immunosuppressive role of AFB1, our RNA profiling analysis showed in
AFB1-treated B cells an altered expression of genes/pathways whose products play a role in
immune-system regulation, including 20 genes involved in the IL2 pathway (Supplementary Table
II). The exact mechanism by which AFB1 deregulates gene expression remains to be elucidated.
Although the effects of AFB2 exposure on EBV replication were far weaker than those of AFB1,
AFB2 showed a similar ability to AFB1 to alter gene expression and deregulate cellular pathways.
This observation excludes the requirement for the bio-activation of aflatoxins in the observed
events. In fact, in contrast to AFB1, AFB2 is not a substrate for epoxidation and is, therefore, less
at University of Illinois, C
hicago on October 2, 2015
http://carcin.oxfordjournals.org/D
ownloaded from

Accep
ted
Man
uscr
ipt
17
efficient in forming DNA and protein adducts and in inducing genotoxic damage. The fact that
there are gene expression changes has implications when considering the biological effects of
aflatoxins in addition to carcinogenesis [37]. Nevertheless, the finding that a subset of
genes/pathways are specifically deregulated in AFB1-treated cells compared with AFB2-treated
cells supports the functional difference between the two toxins in our experimental model.
Future studies will be needed to assess whether AFB1, by its mutagenic activity, targets c-myc,
because abnormal activation of c-myc, through either translocation or mutation in negative
regulatory sequences [45], is common to all BL [46-48]. It is noteworthy that AFB1 has been
found to induce c-myc expression in the livers of chronically exposed adult rats [49].
To the best of our knowledge, it is not known whether AFB1 can be metabolized in B cells.
Cytochrome P450 (CYP), in particular CYP3A4 and CYP1A2, are the enzymes responsible for
catalyzing the metabolic activation of AFB1 in the liver. Certain CYP enzymes are indeed
expressed in B cells, but to a lower level than in liver cells [50,51]. However, as the bio-activation
of AFB1 in organs other than liver has been reported [52,53], we cannot exclude that this event
takes place in B cells too.
Together, our in vitro and in vivo data provide mechanistic evidence for the ability of AFB1 to
induce the EBV replicative cycle and trigger EBV-induced B-cell transformation. Aflatoxin
exposure is ubiquitous in many sub-Saharan African populations, starting in utero and continuing
early in life, when it has adverse effects on child growth [37]. It is therefore plausible that chronic
exposure to this naturally occurring environmental toxin could be a significant risk factor for the
development of EBV-induced cancer.
Funding European Commission (FP7-HEALTH-2011-282562 to MT, RA, CS, and TG): Role of human papillomavirus infection and other co-factors in the aetiology of head and neck cancer in Europe and India (HPV-AHEAD). European Research Council (ERC-2008-AdG-233130-HEPCENT to FLC and FF): Molecular Analysis of Hepatitis C Virus Neutralization and Entry For the Development of Novel Antiviral Immunopreventive Strategies.
at University of Illinois, C
hicago on October 2, 2015
http://carcin.oxfordjournals.org/D
ownloaded from

Accep
ted
Man
uscr
ipt
18
Cancéropôle Lyon Auvergne Rhône-Alpes (CLARA) (EBV&AFB OncoStarter to RA, HHV, HG, EM and MT): Synergisme épigénétique entre l’AFB1 et l’EBV dans le développement du lymphome de Burkitt. La Ligue Nationale contre le Cancer (LNCC-EPI-SYNERGISM to RA, HHV, HG, EM and MT): Epigenetic synergism between AFB1 and EBV in lymphomagenesis. Acknowledgements
We are grateful to all members of the Infections and Cancer Biology Group for their support, and
to Sandrine McKay-Chopin- and Geoffroy Durand for technical assistance with the Expression
BeadChips RNA array. Analyses were performed using BRB-ArrayTools, developed by Richard
Simon and the BRB-ArrayTools Development Team. We thank J.F. Henry, N. Aguilera, and J.L.
Thoumas from the animal facility (PBES, Plateau de Biologie Expérimentale de la Souris, SFR
BioSciences Gerland - Lyon Sud, UMS3444/US8) and Fouzia Amirache for their help with
maintenance and treatment of mice, and Christine Carreira for support with the histopathology of
the mice. We would also like to thank Michael Pawlita for his collaborative help; John Groopman
and Cecilia Frecha for support in establishing the animal model protocol, Noel Whitaker for critical
reading, and Isabelle Rondy for her help with preparation of the manuscript. The authors thank
Karen Muller for editing the manuscript
at University of Illinois, C
hicago on October 2, 2015
http://carcin.oxfordjournals.org/D
ownloaded from

Accep
ted
Man
uscr
ipt
19
References
1. IARC Working Group on the Evaluation of Carcinogenic Risks to Humans (2012) Biological agents. Volume 100 B. A review of human carcinogens. IARC Monogr Eval Carcinog Risks Hum., vol. 100, pp. 1-441.
2. zur Hausen, H., et al. (1978) Persisting oncogenic herpesvirus induced by the tumour promotor TPA. Nature, 272, 373-5.
3. Luka, J., et al. (1979) Induction of the Epstein-Barr virus (EBV) cycle in latently infected cells by n-butyrate. Virology, 94, 228-31.
4. Moormann, A.M., et al. (2005) Exposure to holoendemic malaria results in elevated Epstein-Barr virus loads in children. J Infect Dis, 191, 1233-8.
5. Ma, S.D., et al. (2011) A new model of Epstein-Barr virus infection reveals an important role for early lytic viral protein expression in the development of lymphomas. J Virol, 85, 165-77.
6. Goldstein, J.A., et al. (1990) Burkitt's lymphoma and the role of Epstein-Barr virus. J Trop Pediatr, 36, 114-20.
7. Moormann, A.M., et al. (2007) Exposure to holoendemic malaria results in suppression of Epstein-Barr virus-specific T cell immunosurveillance in Kenyan children. J Infect Dis, 195, 799-808.
8. Torgbor, C., et al. (2014) A multifactorial role for P. falciparum malaria in endemic Burkitt's lymphoma pathogenesis. PLoS Pathog, 10, e1004170.
9. Love, C., et al. (2012) The genetic landscape of mutations in Burkitt lymphoma. Nat Genet, 44, 1321-5.
10. Dave, S.S., et al. (2006) Molecular diagnosis of Burkitt's lymphoma. N Engl J Med, 354, 2431-42.
11. Ziegler, J.L., et al. (1972) Burkitt's lymphoma and malaria. Trans R Soc Trop Med Hyg, 66, 285-91.
12. Feorino, P.M., et al. (1974) Malaria antibody levels in patients with Burkitt's lymphoma. Am J Trop Med Hyg, 23, 574-6.
13. Asito, A.S., et al. (2010) Elevated anti-Zta IgG levels and EBV viral load are associated with site of tumor presentation in endemic Burkitt's lymphoma patients: a case control study. Infect Agent Cancer, 5, 13.
14. Groopman, J.D., et al. (2008) Protective interventions to prevent aflatoxin-induced carcinogenesis in developing countries. Annu Rev Public Health, 29, 187-203.
15. Henderson, E., et al. (1991) EBV genome organization in lymphoblastoid cell lines established following enhancement with aflatoxin B1 and relevance to nasopharyngeal carcinoma. Epstein-Barr Virus and Human Disease, 24, 391-405.
16. Henderson, E.E., et al. (1989) Chemical carcinogen Epstein-Barr virus (EBV) synergism: EBV genome amplification and site-specific mutation during transformation. Int J Cancer, 43, 72-9.
at University of Illinois, C
hicago on October 2, 2015
http://carcin.oxfordjournals.org/D
ownloaded from

Accep
ted
Man
uscr
ipt
20
17. Fathallah, I., et al. (2010) EBV latent membrane protein 1 is a negative regulator of TLR9. J Immunol, 185, 6439-47.
18. Ryan, J.L., et al. (2004) Epstein-Barr virus quantitation by real-time PCR targeting multiple gene segments: a novel approach to screen for the virus in paraffin-embedded tissue and plasma. J Mol Diagn, 6, 378-85.
19. Calattini, S., et al. (2010) Detection of EBV genomes in plasmablasts/plasma cells and non-B cells in the blood of most patients with EBV lymphoproliferative disorders by using Immuno-FISH. Blood, 116, 4546-59.
20. Accardi, R., et al. (2006) Skin human papillomavirus type 38 alters p53 functions by accumulation of deltaNp73. EMBO Rep, 7, 334-40.
21. Accardi, R., et al. (2011) IkappaB kinase beta promotes cell survival by antagonizing p53 functions through DeltaNp73alpha phosphorylation and stabilization. Mol Cell Biol, 31, 2210-26.
22. Gruffat, H., et al. (2002) MEF2-mediated recruitment of class II HDAC at the EBV immediate early gene BZLF1 links latency and chromatin remodeling. EMBO Rep, 3, 141-6.
23. Ouzounova, M., et al. (2013) MicroRNA miR-30 family regulates non-attachment growth of breast cancer cells. BMC Genomics, 14, 139.
24. Du, P., et al. (2008) lumi: a pipeline for processing Illumina microarray. Bioinformatics, 24, 1547-8.
25. Pavlidis, P., et al. (2004) Using the gene ontology for microarray data mining: a comparison of methods and application to age effects in human prefrontal cortex. Neurochem Res, 29, 1213-22.
26. Wogan, G.N., et al. (1971) Structure-activity relationships in toxicity and carcinogenicity of aflatoxins and analogs. Cancer Res, 31, 1936-42.
27. Feederle, R., et al. (2000) The Epstein-Barr virus lytic program is controlled by the co-operative functions of two transactivators. Embo j, 19, 3080-9.
28. Woellmer, A., et al. (2012) BZLF1 governs CpG-methylated chromatin of Epstein-Barr Virus reversing epigenetic repression. PLoS Pathog, 8, e1002902.
29. Bhende, P.M., et al. (2004) The EBV lytic switch protein, Z, preferentially binds to and activates the methylated viral genome. Nat Genet, 36, 1099-104.
30. Murata, T., et al. (2012) Epigenetic histone modification of Epstein-Barr virus BZLF1 promoter during latency and reactivation in Raji cells. J Virol, 86, 4752-61.
31. Ma, Y., et al. (2012) Aflatoxin B1 up-regulates insulin receptor substrate 2 and stimulates hepatoma cell migration. PLoS One, 7, e47961.
32. Darr, C.D., et al. (2001) Epstein-Barr virus immediate-early protein BRLF1 induces the lytic form of viral replication through a mechanism involving phosphatidylinositol-3 kinase activation. J Virol, 75, 6135-42.
at University of Illinois, C
hicago on October 2, 2015
http://carcin.oxfordjournals.org/D
ownloaded from
Accep
ted
Man
uscr
ipt
21
33. Strowig, T., et al. (2009) Priming of protective T cell responses against virus-induced tumors in mice with human immune system components. J Exp Med, 206, 1423-34.
34. White, R.E., et al. (2012) EBNA3B-deficient EBV promotes B cell lymphomagenesis in humanized mice and is found in human tumors. J Clin Invest, 122, 1487-502.
35. Fredrickson, T.N., et al. (2000) Atlas of mouse hematopathology. Harwood Academic Publishers, Amsterdam, Netherlands.
36. Young, L.S., et al. (2003) Epstein-Barr virus and oncogenesis: from latent genes to tumours. Oncogene, 22, 5108-21.
37. Wild, C.P., et al. (2010) Mycotoxins and human disease: a largely ignored global health issue. Carcinogenesis, 31, 71-82.
38. Darenkov, I.A., et al. (1997) Reduced incidence of Epstein-Barr virus-associated posttransplant lymphoproliferative disorder using preemptive antiviral therapy. Transplantation, 64, 848-52.
39. Hanto, D.W., et al. (1982) Epstein-Barr virus-induced B-cell lymphoma after renal transplantation: acyclovir therapy and transition from polyclonal to monoclonal B-cell proliferation. N Engl J Med, 306, 913-8.
40. Hong, G.K., et al. (2005) Epstein-Barr virus lytic infection contributes to lymphoproliferative disease in a SCID mouse model. J Virol, 79, 13993-4003.
41. Merrick, B.A., et al. (2013) RNA-Seq profiling reveals novel hepatic gene expression pattern in aflatoxin B1 treated rats. PLoS One, 8, e61768.
42. Malvandi, A.M., et al. (2013) Biologically relevant doses of mixed aflatoxins B and G up-regulate MyD88, TLR2, TLR4 and CD14 transcripts in human PBMCs. Immunopharmacol Immunotoxicol, 35, 528-32.
43. Castelino, J.M., et al. (2014) Aflatoxin exposure is inversely associated with IGF1 and IGFBP3 levels in vitro and in Kenyan schoolchildren. Mol Nutr Food Res.
44. Pohland, A.E., et al. (1990) Microbial Toxins in Foods and Feeds - Cellular and Molecular Modes of Action. In Dowell,V.R.Jr.P.A.E.R.J.L. (ed.) Springer, 483-88.
45. Hecht, J.L., et al. (2000) Molecular biology of Burkitt's lymphoma. J Clin Oncol, 18, 3707-21.
46. Klein, G. (1983) Specific chromosomal translocations and the genesis of B-cell-derived tumors in mice and men. Cell, 32, 311-5.
47. Leder, P. (1985) Translocations among antibody genes in human cancer. IARC Sci Publ, 341-57.
48. Manolov, G., et al. (1972) Marker band in one chromosome 14 from Burkitt lymphomas. Nature, 237, 33-4.
49. Larson, P.S., et al. (1993) Modulation of c-myc gene expression in rat livers by aflatoxin B1 exposure and age. Fundam Appl Toxicol, 20, 316-24.
at University of Illinois, C
hicago on October 2, 2015
http://carcin.oxfordjournals.org/D
ownloaded from

Accep
ted
Man
uscr
ipt
22
50. Krovat, B.C., et al. (2000) Fingerprinting of cytochrome P450 and microsomal epoxide hydrolase gene expression in human blood cells. Toxicol Sci, 55, 352-60.
51. Bahari, A., et al. (2014) Cytochrome P450 isoforms are differently up-regulated in aflatoxin B(1)-exposed human lymphocytes and monocytes. Immunopharmacol Immunotoxicol, 36, 1-10.
52. Battista, J.R., et al. (1985) Prostaglandin H synthase-dependent epoxidation of aflatoxin B1. Carcinogenesis, 6, 1227-9.
53. Donnelly, P.J., et al. (1996) Biotransformation of aflatoxin B1 in human lung. Carcinogenesis, 17, 2487-94.
at University of Illinois, C
hicago on October 2, 2015
http://carcin.oxfordjournals.org/D
ownloaded from

Accep
ted
Man
uscr
ipt
23
Table and Figure Legends
Table I. Macroscopic and histological analysis of the spleens of sacrificed mice. Mice
spleens were collected at sacrifice, fixed, and paraffin-embedded. Hematoxylin–eosin and Ki67
staining were performed. The percentage of Ki67-positive cells and the presence of large B cells
in the mice spleens, evaluated blindly by the pathologist, are reported in the table.
Fig. 1. Primary B cells treated with AFB1 show increased EBV infection efficiency and
EBV-induced immortalization. (A) Primary B cells were pre-treated with increasing doses of
AFB1 (10–50 µM in DMSO). Cells were treated with the solvent DMSO as a negative control.
After 24 hours of treatment, the cells were washed and mock-infected or infected with a GFP-
EBV virus and analyzed by flow cytometry. The histograms show the average (±SD) (of 3
independent experiments) percentage of EBV-infected cells, measured as the percentage of
GFP-positive cells relative to that of the DMSO control (relative infection efficiency). (B) Primary B
cells were pre-treated with AFB1 (40 µM) or with DMSO for 36 hours. The cells were then
washed and 50 000 cells were infected with EBV at MOIs of 1 × 10⁵ GRU of virus and left to
outgrow for 5 weeks to allow the B cells to immortalize. The number of immortalized clones was
counted, and the histograms show the average (±SD) of 2 independent experiments performed
on B cells from different donors. The difference in the number of immortalized clones between the
AFB1-treated and DMSO-treated cells was significant (p value <0.05). (C) and (D) Primary B cells
were treated with AFB1 or AFB2 (50 µM) and infected as for panel A. At 24 hours post-infection,
the percentage of GFP-positive cells (C) (calculated as for panel A) as well as the mean
fluorescence intensity (MFI) (D) were measured by flow cytometry. The histograms show the
average (±SD) of independent experiments performed in cells from 2 different donors. The
differences in the percentage of GFP-positive cells and the MFI between the AFB1-treated and
DMSO-treated cells were significant (p value <0.003 and p value <0.03, respectively).
at University of Illinois, C
hicago on October 2, 2015
http://carcin.oxfordjournals.org/D
ownloaded from

Accep
ted
Man
uscr
ipt
24
Fig. 2. AFB1 treatment favours EBV infection in immortalized B cells. Louckes cells were
pre-treated with AFB1 or AFB2 (50 µM) for 48 hours, after which the cells were washed; 250 000
cells were seeded in 6-well plates and were mock-infected or infected with GFP-EBV
recombinant virus (2 × 10⁶ GRU/ml). At 24 hours post-infection, the cells were analyzed for the
percentage of GFP-positive cells (A). The histograms show the average (±SD) of 3 independent
experiments. (B) Cells were treated with AFB1 or AFB2 and infected as for panel A. At 48 hours
post-infection, cells were collected and processed for RNA extraction. The levels of expression of
the different EBV latent genes (LMP1, EBNA1, and EBER) and early or late lytic genes (BZLF1,
BRLF1, and BDLF1) were determined by qPCR and normalized to the levels of the housekeeping
gene GAPDH. The histograms show the average (±SD) of 3 independent experiments. (C)
Louckes cells were treated with AFB1 or AFB2 as for panel A, and then infected with WT (no
GFP) EBV. At 72 hours post-infection, the cells were collected and the number of EBV foci per
cell was assessed by fluorescence in situ hybridization analysis (FISH). The histograms show the
average (±SD) of 3 independent experiments. For each experiment the number of EBV-positive
foci per cell was counted (by double blind) from 4 different fields. The difference in the number of
EBV genomes per cell between the AFB1-treated and DMSO-treated cells was significant (p
value <0.02). (D) Louckes cells were pre-treated with AFB1 or AFB2 (50 µM). After 48 hours of
treatment, the cells were infected with GFP-EBV WT (EBV/WT) in the presence or absence of the
viral DNA polymerase inhibitor acyclovir (Merck Chemicals Calbiochem; 114798) used at 50
µg/ml and added to the cells at the same time as the virus. Cells were infected in parallel with a
replication-deficient mutant of EBV (EBV∆BZLF1). At 24 hours post-infection, the cells were
analyzed for the EBV viral load. The difference in the number of EBV genomes per cell between
the AFB1-treated and DMSO-treated cells was significant (p value <0.02) in cells infected with
EBV/WT, but not if they were treated with acyclovir or infected with EBV∆BZLF1.
at University of Illinois, C
hicago on October 2, 2015
http://carcin.oxfordjournals.org/D
ownloaded from

Accep
ted
Man
uscr
ipt
25
Fig. 3. AFB1 treatment of LCLs activates the expression of EBV lytic genes. LCLs were
treated with increasing doses of AFB1 (25 µM or 50 µM in DMSO, as indicated) for 48 hours.
After treatment, the cells were analyzed by FACS for the mean (green) fluorescence intensity
(MFI) (upper panel) and the number of EBV genome copies per cell (lower panel) (A). The
differences in the MFI and the number of EBV genomes per cell between AFB1-treated (50 µM)
and DMSO-treated cells were significant (p value <0.02, for each). The histograms show the
average (±SD) of 2 independent experiments. (B-C) Cells were treated as for panel A and were
then collected and processed for RNA extraction and total protein extraction. The mRNA
expression levels of EBV early and late genes were assessed by qPCR or protein levels by
immunoblot analysis. Louckes cells were included as a negative control. The histograms in panel
3B show the average (±SD) of 3 independent experiments. (D) Cells treated as for panel A were
fixed in formaldehyde and processed for ChIP analysis to assess the relative levels of total
acetylated histone 4 (H4 pan-ace) or tri-methylated lysine 4 on histone 3 (H3K4me3) on the
promoter of BZLF1 and EBNA1. Values shown in the histograms are expressed as the amount of
H3K4me3 and H4 pan-ace recruited on the two promoters in AFB1-treated cells with respect to
the levels detected in DMSO-treated cells (recruitment efficiency). The histograms show the
average (±SD) of 2 independent experiments. The differences in the recruitment efficiency of
H3K4me3 and H4 pan-ace on the BZLF1 promoter between AFB1-treated (50 µM) and DMSO-
treated cells were significant (p value <0.04 and p value <0.02, respectively).
Fig. 4. AFB1 treatment of B cells alters RNA expression. Louckes cells were pre-treated with
AFB1, AFB2 (50 µM), or DMSO. At 48 hours after treatment, cells were collected and processed
for RNA extraction followed by RNA expression profiling. The heat map (left panel) and Venn
diagram (right panel) were obtained by comparing the genes whose expression was significantly
(p value <10−6) deregulated by AFB1 or AFB2 vs DMSO.
at University of Illinois, C
hicago on October 2, 2015
http://carcin.oxfordjournals.org/D
ownloaded from

Accep
ted
Man
uscr
ipt
26
Fig. 5. AFB1-mediated activation of the EBV lytic cycle requires the PI3K pathway. (A)
Louckes cells were treated with AFB1 or AFB2 (50 µM) for 48 hours, collected and processed for
expression profile analysis. Genes specifically deregulated by AFB1 were identified via
bioinformatics analysis of the microarray results and validated by qPCR. The histograms show
the levels of PIK3CG mRNA in AFB1-treated cells relative to the levels of the same mRNA in the
mock-treated (DMSO) cells (relative PIK3CG mRNA levels) and shows the average (±SD) of 2
independent experiments. (B) LCLs were treated for 48 hours with AFB1 (50 µM) or DMSO, then
collected and analyzed by immunoblotting for the indicated antibodies. (C) LCLs were treated for
2.5 hours with the following inhibitors: the p38 MAP kinase inhibitor (SB203580), the Jun N-
terminal kinase inhibitor (JNK inhibitor II), and the PI3K inhibitor (LY294002). After that, cells were
treated with increasing doses of AFB1 (25 µM or 50 µM in DMSO, as indicated) for 48 hours,
collected and processed for RNA extraction. The mRNA levels of BZLF1 and EBNA1 in DMSO-
treated and AFB1-treated cells were assessed by qPCR and normalized to the levels of GAPDH.
The results in the histograms show the fold of expression (±SD) of BZLF1 and EBNA1 in AFB1-
treated cells relative to the levels of expression of the two viral genes in the mock-treated
(DMSO) cells. (D) LCLs were treated with siRNA against PIK3CG (siPIK3CG). Scramble siRNA
(scramble) was used as control. After siRNA treatment, the cells were treated for 24 hours with
increasing doses of AFB1 as indicated and collected for RNA extraction. The levels of BZLF1 and
PIK3CG were determined by qPCR and are shown in the histograms as for panel B. The
differences in the mRNA levels of BZLF1 and PIK3CG upon AFB1 treatment (50 µM) vs DMSO
were significant (p value <0.005 for each) in scramble siRNA-treated cells and not significant in
the presence of siPIK3CG. The histograms show the average (±SD) of 3 independent
experiments. (E) LCLs co-transfected with a BZLF1-promoter/Firefly luciferase and a Renilla
luciferase reporter constructs were treated as for panel B (AS605240 is a specific inhibitor of
PIK3CG). At 24 hours post-transfection, the Firefly luciferase activity was measured and values
were expressed relative to the Renilla luciferase fluorescence. The histograms show the average
(±SD) of 3 independent experiments performed in triplicate. The difference in the level of BZLF1
at University of Illinois, C
hicago on October 2, 2015
http://carcin.oxfordjournals.org/D
ownloaded from

Accep
ted
Man
uscr
ipt
27
promoter activity upon AFB1 treatment (50 µM) vs DMSO was significant (p value <0.05) in the
absence of inhibitors.
Fig. 6. Exposure to AFB1 of humanized NSG mice increases EBV viral load. (A) Schematic
representation of the AFB1 exposure/EBV infection protocol. After humanization, half of the mice
were injected on a daily basis with increasing doses of AFB1 (from 50 µg/kg bw to 70 µg/kg bw).
As a control, the same number of mice were injected with DMSO. After 4 weeks of treatment, 4
mice of the AFB1 group and 4 mice of the DMSO group were infected with EBV by IP injection.
After EBV infection, mice of the AFB1 group were injected for 3 days with 100 µg/kg bw and then
received a maintenance dose of AFB1 (2 IP a week of 70 µg/kg bw) during the second, third, and
fourth weeks post-infection. Blood samples were collected by retro-orbital bleeding at 1, 2, and 3
weeks post-infection. Between week 4 and week 6 post-infection, all mice were sacrificed. (B)
DNA was extracted from blood cells, and EBV genome copy number per ml of blood was
determined by TaqMan PCR. The histograms show the EBV viral load per ml of blood in the
infected animals treated with AFB1 (red dots) and DMSO (black dots) at 1, 2, and 3 weeks post-
infection (left panel) or at sacrifice (post-mortem) (right panel). The difference in EBV viral load in
blood samples collected at sacrifice between AFB1-treated mice and DMSO-treated mice was
significant (p value <0.04). (C) At sacrifice, half of each spleen was fixed and analyzed by
immunofluorescence (IF) or immunohistochemistry (IHC) for EBNA2 and CD20 double staining.
(D-E) Cells were purified from the spleen of the sacrificed mice and processed for RNA
extraction. The mRNA expression levels of EBER (D) and BZLF1 (E) genes determined by qPCR
are shown in the histograms. (F) Hematoxylin–eosin, Ki67, CD3, and CD20 staining of the spleen
of one mouse from each control group and from all infected mice are shown (magnification 10×
and 40×). In the spleen of the mouse 2-DMSO+EBV, the black arrows in the Ki67 staining
(magnitude 40×) show areas of extra-medullar hematopoiesis that are normally highly
proliferative, and therefore positively stained for Ki67. (G) The IF and IHC show an enlarged field
from a representative immunostaining of the spleens of mice treated with DMSO, DMSO+EBV, or
AFB1+EBV with antibodies for a specific marker of B cells (CD20) and EBNA2 (left panel). The
at University of Illinois, C
hicago on October 2, 2015
http://carcin.oxfordjournals.org/D
ownloaded from

Accep
ted
Man
uscr
ipt
28
histograms show the percentages of EBNA2/CD20 double-positive B cells with an atypical
enlarged phenotype in the spleen of AFB1-unexposed or AFB1-exposed mice (right panel). The
percentage of EBNA2/CD20 double-positive enlarged B cells was obtained by cell counting in 4
randomly selected fields in each spleen.
at University of Illinois, C
hicago on October 2, 2015
http://carcin.oxfordjournals.org/D
ownloaded from

Accep
ted
Man
uscr
ipt
29
Table I. Macroscopic and histological analysis of the spleens of sacrificed mice
Mouse Splenomegaly
> 1 cm
Splenic
nodules
% of Ki67+ cells
within white
pulp
Presence of
large B cells
1-DMSO no no 10 –
2-DMSO no no 10 rare
3-DMSO no no 10 –
1-AFB1 yes no 10 –
2-AFB1 yes no 10 rare
3-AFB1 yes no 10 –
1-DMSO+EBV yes no 20 yes
2-DMSO+EBV no no 10 rare
3-DMSO+EBV no no 10 rare
1-AFB1+EBV yes yes 45 yes
2-AFB1+EBV yes yes 50 yes
3-AFB1+EBV yes yes 50 yes
at University of Illinois, C
hicago on October 2, 2015
http://carcin.oxfordjournals.org/D
ownloaded from

Accep
ted
Man
uscr
iptFigure 1
at University of Illinois, C
hicago on October 2, 2015
http://carcin.oxfordjournals.org/D
ownloaded from
Accep
ted
Man
uscr
iptFigure 2
at University of Illinois, C
hicago on October 2, 2015
http://carcin.oxfordjournals.org/D
ownloaded from

Accep
ted
Man
uscr
iptFigure 3
at University of Illinois, C
hicago on October 2, 2015
http://carcin.oxfordjournals.org/D
ownloaded from

Accep
ted
Man
uscr
iptFigure 4
at University of Illinois, C
hicago on October 2, 2015
http://carcin.oxfordjournals.org/D
ownloaded from

Accep
ted
Man
uscr
iptFigure 5
at University of Illinois, C
hicago on October 2, 2015
http://carcin.oxfordjournals.org/D
ownloaded from
Accep
ted
Man
uscr
iptFigure 6A-B
at University of Illinois, C
hicago on October 2, 2015
http://carcin.oxfordjournals.org/D
ownloaded from

Accep
ted
Man
uscr
iptFigure 6C
at University of Illinois, C
hicago on October 2, 2015
http://carcin.oxfordjournals.org/D
ownloaded from

Accep
ted
Man
uscr
iptFigure 6D-E
at University of Illinois, C
hicago on October 2, 2015
http://carcin.oxfordjournals.org/D
ownloaded from

Accep
ted
Man
uscr
iptFigure 6F
at University of Illinois, C
hicago on October 2, 2015
http://carcin.oxfordjournals.org/D
ownloaded from

Accep
ted
Man
uscr
iptFigure 6G
at University of Illinois, C
hicago on October 2, 2015
http://carcin.oxfordjournals.org/D
ownloaded from