carbon trading eu ets - nasdaq · carbon trading european union allowances (euas) •traded within...
TRANSCRIPT

© Copyright 2011, The NASDAQ OMX Group, Inc. All rights reserved.
CARBON TRADING EU ETS CHARLES LAPIERRE

EU ETS SCHEME– CORNER STONE OF EU CLIMATE POLICY- TIME LINE
Kyoto framework : Protocol signed by 176 parties ( until now by 180) with a binding commitment to reduce emissions by 5% in relation to 1990 levels from 2008 to 2012 Kyoto Protocol established flexible mechanism: international trading, Clean Development Mechanism and Join Implementation European Climate Change Program (ECCP) – European response to climate challenges, provided fundamentals for emission trading and other emission mitigation programs EU Emission Trading Scheme – created under ECCP, a regional carbon market in advance of the first Kyoto commitment period
2008
Kyoto signed
2005 1997 2000
ECCP launched
EU ETS Phase I
First Kyoto period
EU ETS Phase II
2012
EU ETS Phase III
Second Kyoto period with bilateral agreements
New Climate treaty
2020 2015 2050
EU ROADMAP TO LOW CARBON
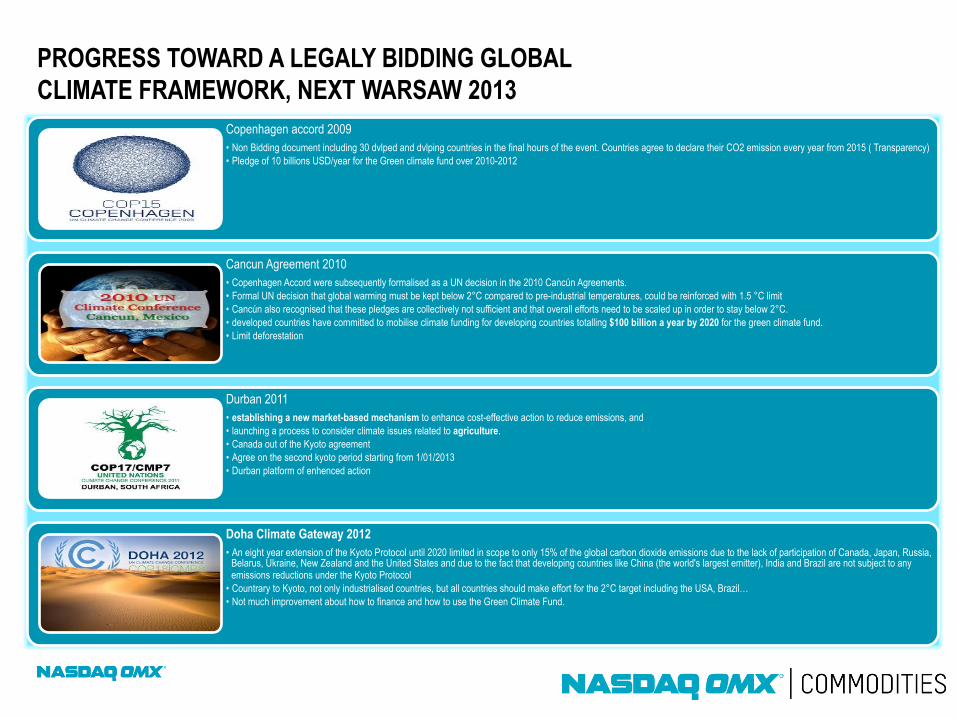
PROGRESS TOWARD A LEGALY BIDDING GLOBAL CLIMATE FRAMEWORK, NEXT WARSAW 2013
Copenhagen accord 2009 • Non Bidding document including 30 dvlped and dvlping countries in the final hours of the event. Countries agree to declare their CO2 emission every year from 2015 ( Transparency) • Pledge of 10 billions USD/year for the Green climate fund over 2010-2012
Cancun Agreement 2010 • Copenhagen Accord were subsequently formalised as a UN decision in the 2010 Cancún Agreements. • Formal UN decision that global warming must be kept below 2°C compared to pre-industrial temperatures, could be reinforced with 1.5 °C limit • Cancún also recognised that these pledges are collectively not sufficient and that overall efforts need to be scaled up in order to stay below 2°C. • developed countries have committed to mobilise climate funding for developing countries totalling $100 billion a year by 2020 for the green climate fund. • Limit deforestation
Durban 2011 • establishing a new market-based mechanism to enhance cost-effective action to reduce emissions, and • launching a process to consider climate issues related to agriculture. • Canada out of the Kyoto agreement • Agree on the second kyoto period starting from 1/01/2013 • Durban platform of enhenced action
Doha Climate Gateway 2012 • An eight year extension of the Kyoto Protocol until 2020 limited in scope to only 15% of the global carbon dioxide emissions due to the lack of participation of Canada, Japan, Russia,
Belarus, Ukraine, New Zealand and the United States and due to the fact that developing countries like China (the world's largest emitter), India and Brazil are not subject to any emissions reductions under the Kyoto Protocol
• Countrary to Kyoto, not only industrialised countries, but all countries should make effort for the 2°C target including the USA, Brazil… • Not much improvement about how to finance and how to use the Green Climate Fund.

EUROPEAN TRADING SCHEME ( CURRENT STATUS)
4
• TIMING : runs in three Phases, currently in Phase III ( 2013-2020)
• SCOPE:
- all EU Member states and Norway and Liechtenstein
- one greenhouse gas (GHG): carbon dioxide CO₂
- industries : energy , iron & steel; pulp & paper, mineral industry (building materials, cement, glass and ceramics); aviation ( from 2012)
- 10 000 industry installations that represent half of CO2 emissions in the EU
• CAP : All emissions are capped at the level that is expected to bring emission reductions ( compared with business as usual) – current cap 2,1 billion ton
Installations can trade allowances freely under the cap
• ALLOWANCE : EUA= 1 ton CO2e, CER=1 ton CO2e
• INFRASTRUCTURE : the system of national registries facilitates allocation transfer and cancellation of allowances ( and credits) and verification of emissions
• COST CONTAINMENT : allowed banking of allowances and credits to subseqent phase
• LINKAGE TO KYOTO , CDM and JI : 1,4 million allowed to import for compliance in Phase II , limits to import differ between Member States ( average 10% of allocation)
The first, large scale,
international cap-and –trade

• More ambitious EU – cap , on average 1,8 billion tCO2 equivalent a year • The allocation method will be harmonized across EU, auctioning of 50% of the cap • No more free allowances to power sector / free allowances only for carbon intensive industries • Support for twelve Carbon Capture and Storage ( CCS) from the auction revenues • Small scale emitters may opt out (the new threshold is 25000 tCO2 annual emissions or 35MW capacity ) • New greenhouse gases (GHG) included in the scheme: • - CO2 emissions from petrochemicals, ammonia and aluminium industries • - N2O emissions from nitric, adipic and glyocalic acid production • - perfluorocarbons from aluminium sector • New sectors will be covered as well: capture, transport and storage of GHG. These sectors will receive free allowances. Aviation will be included as of 2012 • A common EU registry that takes over many responsibilities of national emission registries
REVISED EU EMISSION DIRECTIVE VALID FOR PHASE III EU ETS
Centralization of the system
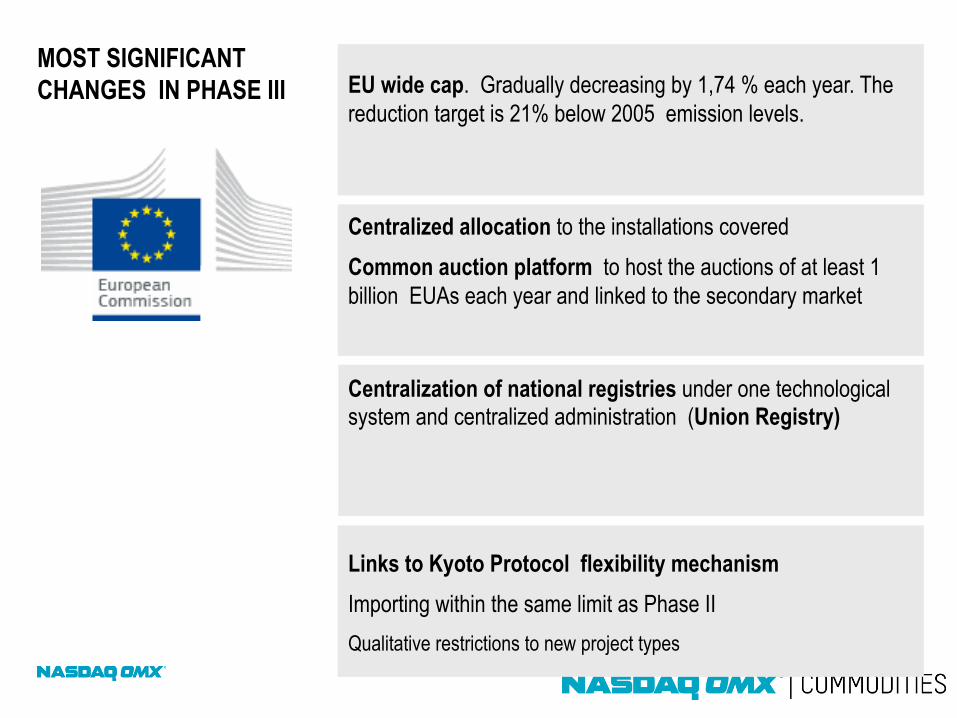
EU wide cap. Gradually decreasing by 1,74 % each year. The reduction target is 21% below 2005 emission levels.
MOST SIGNIFICANT CHANGES IN PHASE III
Centralized allocation to the installations covered Common auction platform to host the auctions of at least 1 billion EUAs each year and linked to the secondary market
Centralization of national registries under one technological system and centralized administration (Union Registry)
Links to Kyoto Protocol flexibility mechanism Importing within the same limit as Phase II Qualitative restrictions to new project types

LESSON LEARNT FROM PHASE I ( AND NOW PHASE II AS WELL )
April 2006 • Actual verified emissions 2005 turned out to reach 2Gt that is less than it had been initially allocated 2,2 Gt • The whole system was “long” • EUA market price lost two thirds of its value overnight (from
30 to 10 Euro/tCO2 ) • The market swiftly shifted focus from EUA Phase I to EUA
Phase II
0
5
10
15
20
25
30
35
2005 2006 2007
Price development EUA Phase I
EUR/tCO2
0
10
20
30
40
Jan-07 Jul-07 Jan-08 Jul-08 Jan-09 Jul-09 Jan-10 Jul-10 Jan-11 Jul-11 Jan-12
EUR/tCO2 EUA and CER prices
EUADEC-12 EUADEC-13 CERDEC-12
March 2012 • Actual emission does not reflect the changes in EU economic activity caused by financial crisis • The system is long again • EU market price is falling again • EU proposed to set-aside ( withold ) some amount of allowances to save the system from the crash • The decision is due to be voted by EU Parliament in June 2012, December 2012, February 2013... but it can take years to decide and implement …
”EU ETS… is dying under the weight of too many emission permits …” NGO Sandbag

CENTRALIZED ALLOCATION AND AUCTIONING
EU Commission itself will decide how many allowances each installation will receive, the allocation will be based on common industry benchmarks. Majority of EU power industry will need to buy allowances on auctions. More than 50% of all available allowances will be auctioned from 2013
Energy intensive industries and carbon leakage- guaranteed free allowances the whole Phase
Common auction platform for majority of EU Member States.
Germany, Great Britain and Poland opt-out and choose their own platforms
Regulated commodity exchanges are the most likely candidates to host EUA auctions
EUA AUCTION FORMAT • WEEKLY AUCTION • SINGLE ROUND, SEALED BID, • UNIFORM PRICE • NON DISCRIMINATORY
ACCESS • RESERVE PRICE ( PRICE
FLOOR) BASED ON SECONDARY CARBON MARKETS

• This new registry will be operated by the Commission and will replace all EU ETS registries currently hosted in the Member States
• The administration of the accounts will still be on the national ( Member State) level
• Exchanges and other marketplaces will be able to establish an electronic interface with the UR
• The common registry is likely to improve security and efficiency of transactions in the carbon market
• Migration to the common EU registry expected in mid-2012
PHASE III MIGRATION TO THE UNION REGISTRY (UR)
9
The centralization of EU ETS operation into single EU registry

Participants: fundamentals and financials, CDM/JI project developers
STRUCTURE OF THE EMISSION MARKET
Primary market:
Allocation and auctioning
Secondary market Bilateral trading - OTC trading - Exchange trading
Instruments: Spot
Futures and Forwards: majority for December delivery
Options on Futures: European style
62 % 38 %
EUA/CER secondary trading 2012
Exchange
OTC
Source Point Carbon
10
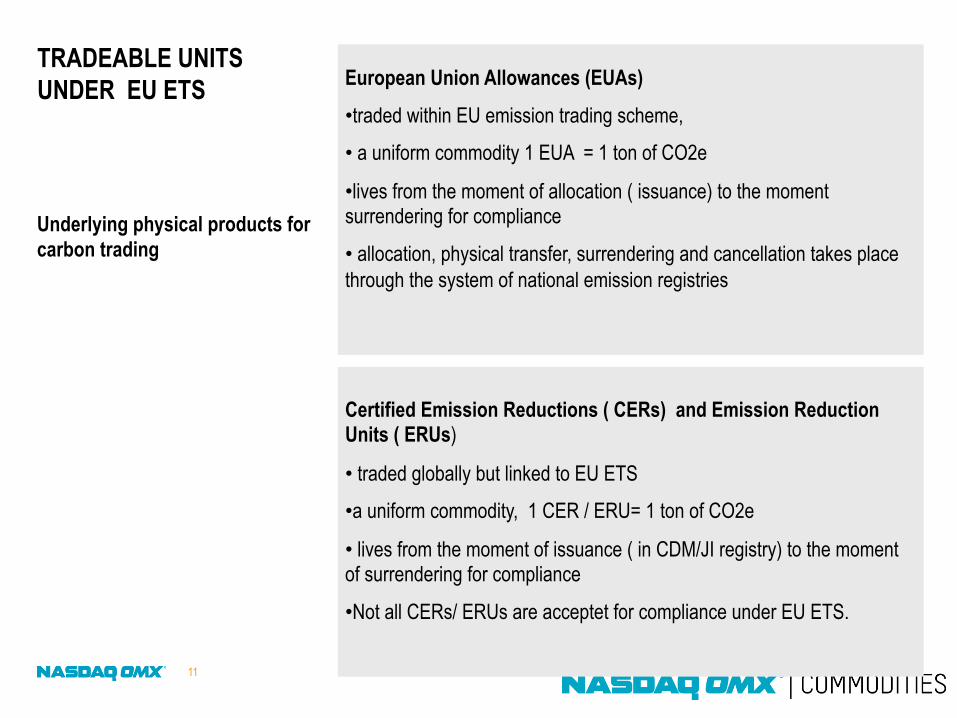
Certified Emission Reductions ( CERs) and Emission Reduction Units ( ERUs)
• traded globally but linked to EU ETS
• a uniform commodity, 1 CER / ERU= 1 ton of CO2e
• lives from the moment of issuance ( in CDM/JI registry) to the moment of surrendering for compliance
• Not all CERs/ ERUs are acceptet for compliance under EU ETS.
TRADEABLE UNITS UNDER EU ETS
Underlying physical products for carbon trading
European Union Allowances (EUAs)
• traded within EU emission trading scheme,
• a uniform commodity 1 EUA = 1 ton of CO2e
• lives from the moment of allocation ( issuance) to the moment surrendering for compliance
• allocation, physical transfer, surrendering and cancellation takes place through the system of national emission registries
11
CARBON TRADING AT NASDAQ OMX COMMODITIES

FROM POWER TO MULTI COMMODITY OFFERING
13
EXISTING PRODUCTS
POWER • Nordic Power • UK Power • German Power • Dutch Power
EMISSIONS • EUA • CER
Exchange and OTC Clearing
Futures, Forwards & Options
GAS • UK Gas
FUTURE DEVELOPMENTS
• Spark spreads • Coal • Freight • Gas • Other

European Union Allowances (EUA) phase II and III • Physical forward and futures contracts for 2013-2020 • Physical delivery for carbon derivatives ( futures) in March, June, September and December • EUA option contracts • EUA spot contract with delivery T+1 and settlement T+3 • CER/EUA spread, SWAP and STRIP 2013-2020
Certified Emission Reduction (CER) phase II Physical forward and futures contracts for 2013-2020 Physical delivery for carbon derivatives ( futures) in March, June, September and December CER option contracts CER spot contract Contract specification in accordance with EU ETS Directive Norwegian emission registry as the delivery point for the Clearing house
NASDAQ OMX CARBON OFFERING
NASDAQ OMX – first to launch the standardized exchange traded and cleared EUA contract in 2005
14

Products Code Example
Spot
EUADddmm-yy EUAD0408-10
CERDddmm-yy CERD0408-10
Futures NEmony NEMAR1 N for Nasdaq E for EUA MAR for March 1 for 2011
NCmony NCSEP2 N fro Nasdaq C for CER SEP for September 2 for 2012
Forward EUADEC-yy EUADEC-10 EUA for EUA DEC for December 10 for 2010
CERDEC-yy CERDEC-11 CER for CER DEC for December 11 for 2011
Options NEC/PMONY-XX NECSEP0-13.50 N for Nasdaq E for EUA C for Call SEP for September 0 for 2010 13.50 for strike price at 13.50
NCC/PMONY-XX NCPMAR1-15 N for Nasdaq C for CER P for Put MAR for March 1 for 2011 15 for strike price at 15
NASDAQ OMX COMMODITIES EUROPE CARBON PRODUCT CODES
Our emission products are EUA and CER contracts with physical delivery versus payment with the contract volume of 1000 EUAs or 1000 CERs respectively which both correspond to 1000 tonnes of CO2 emissions The detailed product specifications can be found in our Product Calendar: http://www.nasdaqomxcommodities.com/trading/practicaltradinginformation/productcalendar/
Exercises? Which products are these? NCDEC2, CERD2505-09, NCCJUN0-11, EUADEC-11, NEPDEC2-18 15

TRADING EUA/CER SPOT CONTRACT ( TIME-LINE)
Trading day (T) T+1 T+2 T+3
08:00 Market opens
18:00 Market closes
20:00 Net-seller transfer EUAs or CERs to NASDAQ account in the Norwegian (Union) Registry
11:00 Final collateral time: net-buyer makes payment available (cash margin)
18:00 EUAs/CERs transferred to buyer’s account in designated emission registry
Payment instructions to seller; cash transferred to sellers bank account
Cash available in sellers bank account
16

Trading a EUA/CER forward/future contract
Contract price
Trading period Last trading day (same as for the Spot contract)
Settlement period: T+1, T+2, T+3; same as for the spot contracts
20
23 24
26
21
Daily margin calls based on scenario risk & liquidation value. Can be covered by cash, guarantee or allowances. The EUA can be delivered at any time during the trading period
Closing price 25
18:00 20:00
Last point in time for transfer of EUA from seller to the Clearing house
Transfer from the clearing house to buyer
Market price
Trading closes
17

18

ANY QUESTIONS

THANK YOU