carbon system controls on co 2 increase biologic carbon pump in coastal and tropical ocean increase...
Post on 20-Dec-2015
213 views
TRANSCRIPT

Carbon System Controls on CO2
Increase biologicIncrease biologiccarbon pump incarbon pump incoastal andcoastal andtropical oceantropical ocean
Increase carbonIncrease carbonpump in Antarcticpump in Antarctic
Change chemistry ofChange chemistry ofAntarctic surface waterAntarctic surface water
Change chemistry of shallowChange chemistry of shallowSouthern Ocean subsurface waterSouthern Ocean subsurface water

High Latitude Stratification Sigman Sigman et alet al. (2004; . (2004;
NatureNature 428, 59-63) 428, 59-63) Cold climates Cold climates
promote polar ocean promote polar ocean stratificationstratification
Opal MAR decreased at Opal MAR decreased at ~2.7 mya~2.7 mya Fewer diatomsFewer diatoms
1515NNOMOM increased or did increased or did not changenot change Greater NOGreater NO33
2-2- utilization or no utilization or no change in NOchange in NO33
2-2- utilizationutilization
Indicates stratificationIndicates stratification

Density at Cold Temperatures Variation in seawater Variation in seawater
density as a function of density as a function of temperature, with temperature, with salinity at 35‰salinity at 35‰
Density of sea water Density of sea water increases less rapidly as increases less rapidly as the temperature drops the temperature drops towards freezing pointtowards freezing point
High latitude SST cold High latitude SST cold enough so winter enough so winter cooling did not have cooling did not have enough of an effect to enough of an effect to overcome salinity overcome salinity gradientsgradients
From Francois (2004; Nature 428 31-32)

Salinity Variations Today

Density (cooling)
Density as a function of depth in the modern wintertime Density as a function of depth in the modern wintertime Antarctic and changes in this density structure for Antarctic and changes in this density structure for uniform changes in seawater temperatureuniform changes in seawater temperature. Cooling . Cooling entire water column nearly doubles the vertical density entire water column nearly doubles the vertical density difference.difference.

Effect of Stratification on PCO2
Global cooling an important factor promoting Global cooling an important factor promoting high-latitude stratificationhigh-latitude stratification
Polar ocean stratification prevents deep ocean Polar ocean stratification prevents deep ocean ventilationventilation Traps more carbon in the deep seaTraps more carbon in the deep sea
During Quaternary climatic cyclesDuring Quaternary climatic cycles Interglacial periods sufficiently warm to allow Interglacial periods sufficiently warm to allow
deep water convection in Antarcticdeep water convection in Antarctic Not the North PacificNot the North Pacific
During glacial periodsDuring glacial periods Stratification in Antarctica and North PacificStratification in Antarctica and North Pacific Contribute to lower atmospheric COContribute to lower atmospheric CO22

Six factors may Six factors may contribute to glacial contribute to glacial atmospheric COatmospheric CO22 change change Four factors tied to Four factors tied to
carbon cycle through carbon cycle through changes inchanges in
Nutrient upwellingNutrient upwelling Antarctic surface Antarctic surface
water chemistrywater chemistry Factors contributing Factors contributing
most to drop in COmost to drop in CO22
Lower SSTLower SST Stronger biological Stronger biological
carbon pumpcarbon pump Increased COIncreased CO33
2-2- linked linked to changes in deep to changes in deep ocean circulationocean circulation

Ice-Driven Climate Responses Ice sheets can become drivers of climate Ice sheets can become drivers of climate
within the system becausewithin the system because Large heightLarge height
Influences wind direction and Influences wind direction and temperaturetemperature
Bright surfaceBright surfaceMajor albedo contrastMajor albedo contrast
Calve icebergsCalve icebergsDeliver cold fresh water to oceansDeliver cold fresh water to oceans

Glacier Climate Interactions Regions in close geographic proximity to Regions in close geographic proximity to
ice sheetice sheet The tempo of climate change is set by The tempo of climate change is set by
the change in ice sheetthe change in ice sheet Ice sheet has highest thermal inertiaIce sheet has highest thermal inertia

Ice-Driven Responses Orbital scale ice sheet Orbital scale ice sheet
rhythmsrhythms Quickly transferred Quickly transferred
to other parts of the to other parts of the climate systemclimate systemAtmosphereAtmosphereOceansOceans
Ice sheets respond Ice sheets respond to solar insolationto solar insolationOther systems Other systems
respond quickly respond quickly to change in ice to change in ice sheetssheets

Ocean Surface Temperature N. Atlantic SST should N. Atlantic SST should
respond to change in N. respond to change in N. Hemisphere glaciationsHemisphere glaciations SST track ice volume with SST track ice volume with
no lagno lag SST reconstruction from SST reconstruction from
faunal assemblagesfaunal assemblages Ice volume and SST follow Ice volume and SST follow
41,000 year cycles41,000 year cycles Similar relationships found Similar relationships found
in younger coresin younger cores Correlate with 100,000 Correlate with 100,000
year cyclesyear cycles

Mechanisms for Ocean Cooling Calving icebergs undoubtedly Calving icebergs undoubtedly
importantimportant Changes in windsChanges in winds
GCM sensitivity testsGCM sensitivity tests Clockwise flow of winds Clockwise flow of winds
initiated over ice sheetsinitiated over ice sheets• Cold winds blown over Cold winds blown over
N. AtlanticN. Atlantic• Replaced warm flow Replaced warm flow
from southwestfrom southwest Simulations predict 5-10°C Simulations predict 5-10°C
drop in SSTdrop in SST• Similar to documented Similar to documented
SST changeSST change

Cold Winds Affect Climate Pollen changes in FrancePollen changes in France
N. Europe’s climate N. Europe’s climate changedchanged
Warm and moist (trees)Warm and moist (trees) Cold and dry (herbs)Cold and dry (herbs)
Changes correlate with Changes correlate with ice volumeice volume
Cold winds from Cold winds from Scandinavian ice sheetsScandinavian ice sheets
N. Atlantic ocean colder N. Atlantic ocean colder than todaythan today
Relative warm N. Relative warm N. Atlantic moderates Atlantic moderates Europe’s winter Europe’s winter weatherweather

GCM Test of N. Atlantic SST Boundary conditionBoundary condition
N. Atlantic glacial SSTN. Atlantic glacial SST Output indicated Output indicated
cooling over N. cooling over N. Atlantic, European Atlantic, European maritime regions and maritime regions and central Eurasiacentral Eurasia
Produced lower rainfallProduced lower rainfall N. Hemisphere ice sheet N. Hemisphere ice sheet
growthgrowth Cooled N. AtlanticCooled N. Atlantic Cooled Europe and Cooled Europe and
AsiaAsia• Cooling occurred Cooling occurred
without lagwithout lag

Loess Plateaus Evidence of ice-driven Evidence of ice-driven
response found in Chinaresponse found in China Plateaus of wind-blown Plateaus of wind-blown
siltsilt Deposited by strong Deposited by strong
winds and dry winds and dry conditionsconditions
Loess deposition post-Loess deposition post-date weathered soil at date weathered soil at 2.75 mya2.75 mya Onset of dry conditions Onset of dry conditions
at glacial inceptionat glacial inception 100,000 year cycle 100,000 year cycle
over last 0.5 myover last 0.5 my

Onset of Loess Deposition Loss of N. Atlantic moistureLoss of N. Atlantic moisture
Cold and ice-covered N. AtlanticCold and ice-covered N. AtlanticStop moisture flow to Europe and Stop moisture flow to Europe and AsiaAsia
Siberian high-pressure centerSiberian high-pressure center Today source of strong winter windsToday source of strong winter winds
Could have strengthen during glaciersCould have strengthen during glaciers Windy and dry conditions deposited loessWindy and dry conditions deposited loess
Western N. PacificWestern N. Pacific Greenland ice sheetGreenland ice sheet

Summary Ice volume signal can be transferred far from Ice volume signal can be transferred far from
ice sheetsice sheets Altered wind patternsAltered wind patterns Changes in air and sea surface temperatureChanges in air and sea surface temperature Changes in rainfall over landChanges in rainfall over land
Northern Hemisphere ice sheet growthNorthern Hemisphere ice sheet growth Drives the climate signal on orbital time Drives the climate signal on orbital time
scalesscales Ice sheets respond to orbital forcingIce sheets respond to orbital forcingChanges in ice sheets drive other climate Changes in ice sheets drive other climate
responses in northern latitudesresponses in northern latitudes

Other Effects of N. Ice Sheets Aeolian deposition in Aeolian deposition in
western Indian Oceanwestern Indian Ocean Follows timing of ice Follows timing of ice
sheet growth and sheet growth and meltingmelting
More dust deposited More dust deposited from Arabian desertfrom Arabian desert During glacial intervals During glacial intervals
defined by defined by 1818O O maximamaxima
Less dust deposited Less dust deposited during interglacial during interglacial periodsperiods

Effects in South America Long cores from eastern Long cores from eastern
Columbian lakesColumbian lakes Pollen records that Pollen records that
alternate between alternate between grass and treesgrass and trees
100,000 year cycles100,000 year cyclesTrees grew during Trees grew during rapid warmingrapid warming
Grassland dominated Grassland dominated during slow cooling during slow cooling intervalsintervals

Effects in New Zealand
Marine sediment core Marine sediment core east of New Zealandeast of New Zealand Cyclic variations in tree Cyclic variations in tree
and grass pollenand grass pollen 100,000 year dominant 100,000 year dominant
cyclecycle
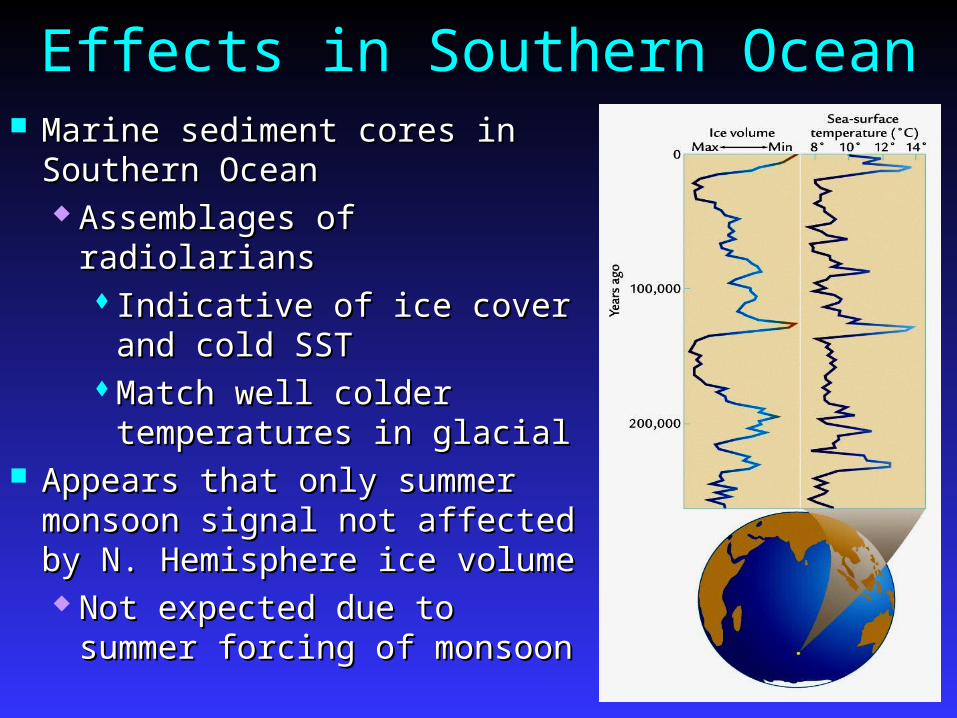
Effects in Southern Ocean Marine sediment cores in Marine sediment cores in
Southern OceanSouthern Ocean Assemblages of radiolariansAssemblages of radiolarians
Indicative of ice cover Indicative of ice cover and cold SSTand cold SST
Match well colder Match well colder temperatures in glacialtemperatures in glacial
Appears that only summer Appears that only summer monsoon signal not affected monsoon signal not affected by N. Hemisphere ice volumeby N. Hemisphere ice volume Not expected due to Not expected due to
summer forcing of monsoonsummer forcing of monsoon

Southern Hemisphere Surprises Large Antarctic ice sheets do not appear Large Antarctic ice sheets do not appear
to force S. Hemisphere glacial/interglacial to force S. Hemisphere glacial/interglacial changeschanges Most land mass of Antarctica now Most land mass of Antarctica now
coveredcoveredNot much room to grow so no major Not much room to grow so no major expansion of ice volumeexpansion of ice volume
In contrast, N. Hemisphere ice sheets In contrast, N. Hemisphere ice sheets fluctuated enormouslyfluctuated enormously If climate signals forced by ice sheetsIf climate signals forced by ice sheets
Probably forced by changes in N. Probably forced by changes in N. Hemisphere ice sheetsHemisphere ice sheets

Seasonal Changes in Precession
Although insolation Although insolation changes due to axial tilt in changes due to axial tilt in N and S Hemispheres in N and S Hemispheres in phasephase Precession changes are Precession changes are
out of phaseout of phaseWhen one hemisphere When one hemisphere
is warm (close to Sun)is warm (close to Sun)Other Hemisphere is Other Hemisphere is
coldcold Patterns of insolation Patterns of insolation
changes look differentchanges look different Phase of the precession Phase of the precession
cycle is reversed cycle is reversed between hemispheresbetween hemispheres

Phasing of Insolation and Ice Volume
41,000 and 23,000 year 41,000 and 23,000 year components of ice volumecomponents of ice volume Lag behind N. Lag behind N.
Hemisphere insolation Hemisphere insolation by physically by physically reasonable amountreasonable amount
41,000 year S. 41,000 year S. Hemisphere cycles has Hemisphere cycles has same lagsame lag 23,000 year ice volume 23,000 year ice volume
leads S. Hemisphere leads S. Hemisphere summer insolation summer insolation forcingforcing
Unreasonable Unreasonable relationshiprelationship

Global Transfer of Signals Changes in sea levelChanges in sea level
Creating more temperate maritime or harsh Creating more temperate maritime or harsh continental climate regionscontinental climate regions
Change in deep water circulationChange in deep water circulation Relatively warm and salty water directed away Relatively warm and salty water directed away
from Southern Hemisphere in Atlanticfrom Southern Hemisphere in Atlantic Atmospheric COAtmospheric CO22 levels levels
Lower glacial COLower glacial CO22 levels can cool entire planet levels can cool entire planet Reduce the amount of water vapor in Reduce the amount of water vapor in
atmosphereatmosphereMost reasonable explanation for widespread Most reasonable explanation for widespread
changeschanges•Which came first COWhich came first CO22 change or change or
glaciations?glaciations?

CO2 and Ice Volume Records of CORecords of CO22 and ice volume well correlated and ice volume well correlated
Both must be related ultimately to orbital changesBoth must be related ultimately to orbital changes Strong correlation also indicatesStrong correlation also indicates
Two records are linkedTwo records are linked

CO2 Drives Ice Sheets Sensible conclusion since COSensible conclusion since CO22 affects affects
temperature temperature Therefore ice sheet mass balanceTherefore ice sheet mass balance
However, COHowever, CO22 should lead ice volume should lead ice volume Pattern in records are not consistent Pattern in records are not consistent
with premisewith premiseNo persistent lag in signalsNo persistent lag in signals
Correlation between COCorrelation between CO22 and and temperature excellenttemperature excellent
COCO22 does not lead ice volume does not lead ice volume

Ice Sheets Drive CO2
COCO22 signal tracks closely ice volume signal tracks closely ice volume Similar to other ice-driven climate Similar to other ice-driven climate
signalssignals COCO22 record connected to changes in record connected to changes in
ocean circulation and carbon storageocean circulation and carbon storageOcean circulation responds quickly to Ocean circulation responds quickly to changes in climate forcingchanges in climate forcing
Timing of changes in COTiming of changes in CO22 and ice and ice volume match this expectationvolume match this expectation

CO2 Feedbacks COCO22 levels provide positive feedbacks to levels provide positive feedbacks to
climate systemclimate system Ice sheet growth caused COIce sheet growth caused CO22 decrease decrease
Lower COLower CO22 levels further cool climate levels further cool climate
•Increase ice sheet growthIncrease ice sheet growth COCO22 levels should also carry ice volume levels should also carry ice volume
signalsignalOther parts of climate systemOther parts of climate system
•Changes in temperature or Changes in temperature or moisturemoisture

Complete Story Unknown Text points to mismatches in COText points to mismatches in CO22 and ice and ice
volume/temperature recordsvolume/temperature records Mismatch with temperature is not as Mismatch with temperature is not as
great as believed only 2-3 years agogreat as believed only 2-3 years ago Mismatch with ice volume real?Mismatch with ice volume real?
However, records still insufficiently However, records still insufficiently refinedrefined•To answer clearly chicken and egg To answer clearly chicken and egg dilemmadilemma
Part of the uncertainty lies in poorly Part of the uncertainty lies in poorly dated ice coresdated ice cores