carbon quantity defines productivity while its quality
TRANSCRIPT

RESEARCH ARTICLE
Carbon quantity defines productivity while its quality definescommunity composition of bacterioplankton in subarctic ponds
Toni Roiha • Marja Tiirola •
Matteo Cazzanelli • Milla Rautio
Received: 14 April 2011 / Accepted: 12 December 2011
� Springer Basel AG 2011
Abstract Bacterial communities in 16 oligotrophic ponds
in Kilpisjarvi, subarctic Finland, were studied to test the
hypothesis that dissolved organic carbon (DOC) quantity
and quality differently influence bacterioplankton. The
ponds were located below and above treeline at 600 m
a.s.l., with 2–4 fold higher concentration of DOC below
treeline. The concentration of DOC changed during the
open-water season with highest values measured in mid-
summer. Bacterial production, abundance, biomass were
highest in mid-summer and correlated positively with the
concentration of DOC. Quality indices of DOC showed
that spring differed from the rest of the season. Highest
specific UV-absorbance (SUVA) and humification index
(HI), ratio a250/a265 and lowest fluorescence index (FI)
were found during spring compared to summer and
autumn, possibly indicating higher relative importance of
allochthonous carbon during spring and a seasonal effect of
photo-oxidation. According to Length Heterogeneity
Polymerase Chain Reaction (LH-PCR) analyses, bacterial
communities in spring were significantly different from
those later in the season, possible due to the introduction of
terrestrial bacteria associated with higher molecular weight
material in spring DOC. Comparison between ponds
situated above and below treeline revealed that bacteria
were more abundant and productive at lower altitudes,
which is probably connected to higher concentrations of
DOC. The results also suggest that increased temperature
and precipitation induced by global change and consequent
higher allochthonous DOC runoff from the catchment
could have a strong impact on biomass, productivity and
community composition of micro-organisms in subarctic
ponds and lakes.
Keywords Subarctic � DOC � Ponds � Bacterial biomass �Bacterial production � Bacterial community composition �Allochthonous carbon
Introduction
Heterotrophic bacterioplankton need organic carbon as an
energy source and their productivity in lakes is largely
determined by the amount of allochthonous (terrestrial)
DOC inputs from the catchment area (Tranvik 1988; Hessen
et al. 1990, 2004; Crump et al. 2003). In small subarctic and
arctic ponds, the importance of DOC inputs is also great but
varies spatially. Location of the water body, soil type of the
catchment, and annual variation in precipitation and runoff
all have a direct impact on allochthonous carbon loads and
hence on biomass and productivity of bacteria (ACIA 2005;
Hobbie and Laybourn-Parry 2008). Since the amount of
DOC in northern lakes is typically low (\5 mg C l-1), even
a small increase in DOC in runoff water may have strong
and rapid impacts on lake condition (e.g. light attenuation,
nutrient levels, benthic primary production) (Karlsson et al.
2009). Climate warming and increasing precipitation have
significant impacts on the interaction between the lake and
catchment area by increasing organic material inputs
T. Roiha (&) � M. Tiirola � M. Rautio
Department of Biological and Environmental Science,
University of Jyvaskyla, Jyvaskyla 40014, Finland
e-mail: [email protected]
T. Roiha � M. Rautio
Departement des sciences fondamentales, Centre for Northern
Studies (CEN), Universite du Quebec a Chicoutimi,
Quebec G7H 2B1, Canada
M. Cazzanelli
Freshwater Biological Laboratory, University of Copenhagen,
Hillerød 3400, Denmark
Aquat Sci
DOI 10.1007/s00027-011-0244-1 Aquatic Sciences
123

(ACIA 2005; McGuire et al. 2009). This carbon accumu-
lated in soils can contribute to adding green house gases by
releasing a part of the organic load from the drainage area to
the atmosphere by bacterial respiration (Hanson et al. 2003;
Walter et al. 2006; Laurion et al. 2010). Such changes likely
occur first at the polar treeline (Hobbie and Laybourn-Parry
2008).
The most distinct decline in DOC concentration occurs
when crossing the northern treeline (Vincent and Pienitz
1996; Rautio 2001), which in Scandinavia is the boundary
between the mountain birch forest and treeless tundra. This
boundary also represents a change in the quality of DOC
(Baron et al. 1991; Rautio and Vincent 2007). This change
is especially reflected in the coloured fraction of dissolved
organic matter pool (CDOM), which is primarily a com-
plex mixture of degraded terrestrial and aquatic plant
material having a strong influence on the underwater light
climate. Another factor influencing DOC quality in higher
latitudes is photo-oxidation, which probably plays notable
role in decomposing heavier carbon molecules (Lindell
et al. 1995, 1996). Ponds and lakes below treeline receive
higher concentrations of large molecular-sized allochtho-
nous carbon compounds compared to those above treeline.
Previous work has shown a relation between the source of
organic material and its fluorescence properties, making
optical spectroscopy a useful tool for the characterization
of the quality of dissolved organic matter (DOM) (Kalbitz
et al. 1999; Lindell et al. 1995; McKnight et al. 2001;
Weishaar et al. 2003).
Tranvik (1988) estimated that \15% of allochthonous
DOC is readily available for bacteria, although the large
relative amount of this DOC, in comparison to autoch-
thonous DOC, often makes it the dominant carbon source
for bacteria growth. Bacteria metabolizing allochthonous
carbon can provide an additional energy source for the
whole food web (Jones 1992; Karlsson et al. 2002; Pace
et al. 2004) and also releases bacterioplankton from
dependence on phytoplankton-derived autochthonous car-
bon (Jansson et al. 1999).
The change in catchment vegetation characteristics is
also reflected in the chemical and physical condition of the
respective water bodies, such as temperature, pH and
nutrient concentrations (Blom et al. 2000). This change in
water quality probably has an impact on bacterioplankton
dynamics. Biomass of bacteria and their biological effi-
ciency have been reported to be dependent on inorganic
nutrients (Simon et al. 1998; Graneli et al. 2004), tem-
perature (Ochs et al. 1995; Rae and Vincent 1998), UV
radiation (Laurion et al. 1997) and grazing by nanoflagel-
lates and cladocerans (Kankaala 1988; Laybourn-Parry and
Marshall 2003).
The purpose of our study was to find out how differ-
ences in the quantity and quality of DOC affect bacteria
communities in subarctic ponds across the northern treeline
in Finnish Lapland. This aim was achieved by studying
bacterioplankton parameters (abundance, productivity,
biomass, cell size and community composition) in relation
to environmental variables, including detailed spectro-
scopic analysis of water to estimate carbon quality.
Additionally, we describe the seasonal succession of bac-
terioplankton dynamics during the short northern summer
from ice-out in May–June to freezing in September and
give some insights into bacterioplankton community
composition changes in northern ponds. To our knowledge,
this is among the first studies to include carbon quality
indices when studying shifts in natural bacterioplankton
dynamics.
Methods
Field measurements, chlorophyll-a (chl-a)
and nanoflagellates
We sampled 16 small, shallow ponds in the Kilpisjarvi
region (69�N, 20�E) of NW Finnish Lapland along an
altitudinal gradient from 485 to 950 m a.s.l. (Fig. 1;
Table 1). These ponds, and especially their zooplankton
community structure, have been intensively studied earlier
(Rautio 1998, 2001; Mariash et al. 2011). The treeline of
mountain birch (Betula pubescens subsp. czerepanovii
(Orlova) Hamet-Ahti) is at around 600 m a.s.l. and eight
ponds were situated below treeline and eight ponds were
above or at treeline (Altitudinal). The ponds were distrib-
uted in five different areas: Malla, Tsahkal, Jeahkkas,
Siilasvuoma and Saana (Spatial) (Fig. 1). Surface area and
catchment area (mean area = 10.0 ha, range 0.6–42.0 ha)
of each pond was taken using geographical information
system (GIS). All 16 ponds were sampled three times in
2008: in May–June at the ice-out, in mid-July, and in
September 2–3 weeks before the ponds froze (Seasonal).
On each occasion, 3 separate surface water samples were
collected around the pond shoreline and mixed together as
a 2 L composite sample from which temperature,
Table 1 Physical characteristics from ponds below and above
treeline
\600 m [600 m
Lake area (ha) 0.3 (0.1–0.8) 0.8 (0.1–1.4)
Drainage area (ha) 3.6 (0.6–17.2) 17.3 (0.6–41.6)
Depth (m) 1.1 (0.5–2.0) 3.0 (0.5–7.5)
Altitude (m) 527 (485–570) 825 (600–950)
Numbers outside parentheses are averages from ponds in a group.
Numbers in parentheses are minimum and maximum values
T. Roiha et al.
123
conductivity and pH were measured immediately with a
YSI 63 or YSI Professional probe (YSI incorporated,
Yellow Springs, USA). Earlier sampling has shown that the
water column in all but the two deepest ponds (Ponds 15
and 16 in Fig. 1; 7.5 and 3 m, respectively) mix constantly.
A 200 ml subsample was filtered through a GFF filter and
frozen until spectrophotometric and spectrofluorometric
analysis of chl-a following the method by Nusch (1980).
Bias caused by phaeopigments was removed by measuring
the concentration from acidified chl-a samples (Yentsch
and Menzel 1963) and final calculations for chl-a concen-
tration were done according to Jeffrey and Walschmeyer
(1997). Sample water for enumeration of heterotrophic and
pigmented nanoflagellates was collected only in summer.
The sample was preserved with \0.2 lm filtered formal-
dehyde (1% final concentration). Three 20 ml replicates
were filtered through 0.6 lm, 25 mm black polycarbonate
filters. Samples were stained with 4-,6-diamido-2-phenyl-
indole (DAPI) with a final concentration of 5 lg ml-1.
Samples were counted for total heterotrophic (HNF) and
pigmented (PNF) nanoflagellates under UV excitation with
an epifluorescense microscope (Olympus BH-2) with
1,0009 magnification. Green excitation was used to dis-
criminate autotrophic and mixotrophic cells with pigments.
At least 50 cells from each filter were counted.
Carbon characterization
A 200 ml aliquot was filtered for DOC (0.2 lm cellulose
acetate filter) and sent to the Lapland Regional Environ-
ment Centre in Rovaniemi for immediate analysis by using
standard methods (Finnish Standards Association SFS-EN
1484:1997) of the National boards of Waters in Finland.
Another 200 ml subsample was filtered (0.2 lm cellulose
acetate filter) to acid-washed and sample-rinsed glass bot-
tles and stored in the dark at 4�C for further CDOM
analysis to characterize the quality of carbon. CDOM
absorption was measured in dual-beam mode with scanning
spectrophotometer (Cary 100 UV–Vis; Varian Inc. Walnut
Creek, USA) by using a 10-cm quartz acid-washed cuvette
especially designed for highly transparent waters. Scanning
was performed at 1 nm intervals between wavelengths 250
and 800 nm against MilliQ water. Mean value for wave-
lengths between 750 and 800 nm was used to minimize the
noise in null correction procedure. Absorption coefficients
were calculated as in Mitchell et al. (2003). Wavelengths
between 300 and 650 nm were chosen to calculate non-
linear regressions for CDOM properties (Stedmon et al.
2000). A suite of quality indices was calculated to char-
acterize organic carbon. SUVA parameter was determined
from DOC normalized absorption coefficient at the
60o 60o
70o
25o
70o
400 km
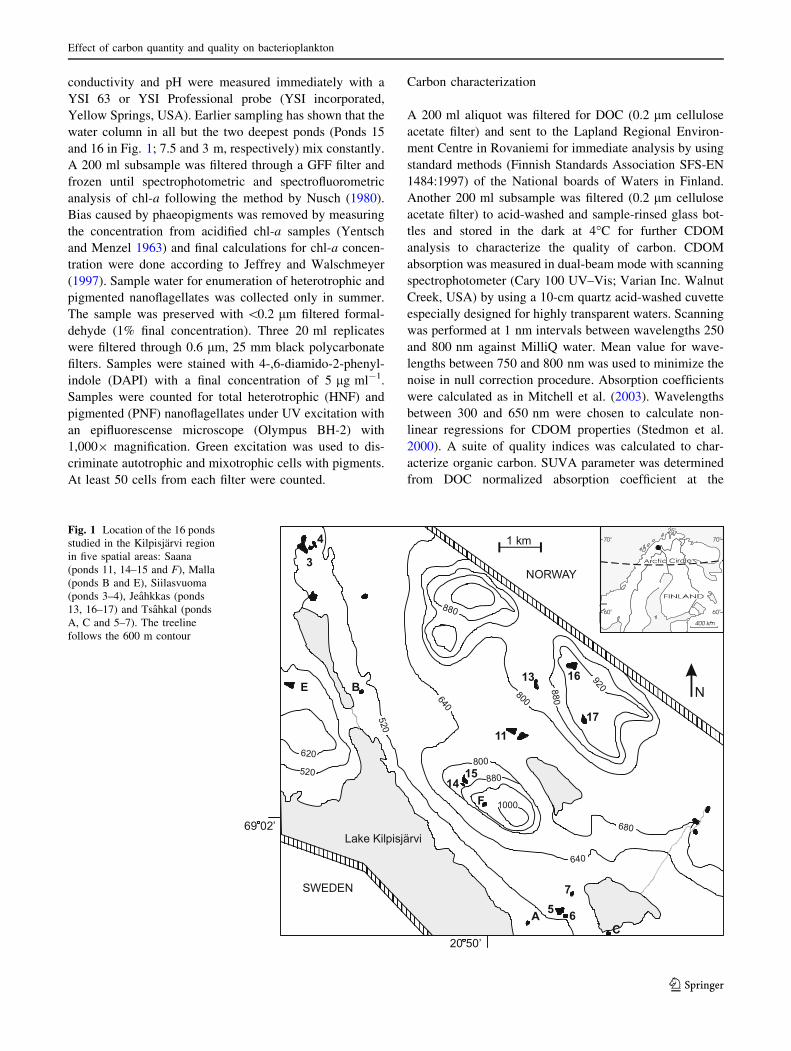
Fig. 1 Location of the 16 ponds
studied in the Kilpisjarvi region
in five spatial areas: Saana
(ponds 11, 14–15 and F), Malla
(ponds B and E), Siilasvuoma
(ponds 3–4), Jeahkkas (ponds
13, 16–17) and Tsahkal (ponds
A, C and 5–7). The treeline
follows the 600 m contour
Effect of carbon quantity and quality on bacterioplankton
123

wavelength 254 nm (Weishaar et al. 2003). Increasing
SUVA could indicate greater contribution of terrestrially
derived carbon (Hood et al. 2003, 2005). Another index
calculated was the ratio between absorbance at 250 and
365 nm that is known to increase with increased UV-
exposure, indicating importance of photo-oxidation (Lindell
et al. 1995).
In general, low molecular weight compounds, often of
autochthonous origin, fluoresce intensely at the lower end
and high molecular compounds of allochthonous origin at
the higher end of synchronous fluorescence (SF) spectra
(Stewart and Wetzel 1980). SF spectra were recorded
between 200 and 700 nm with 14 nm difference between
excitation and emission beams and with a slit width of 5
nm using a spectrofluorometer (Cary eclipse; Varian Inc.,
USA). SF spectra were corrected for blank (MilliQ),
baseline and inner-filter effect (Mobed et al. 1996).
Accuracy of the instrument was checked using Raman peak
correction. Ratio between SF relative intensity at 470 nm
over 360 nm was used as a humification index (HI), which
was proposed by Kalbitz et al. (1999) to represent the
degree of humification and polycondencation from sample
water. Simple fluorescence emission scans from 400 to
700 nm were performed with single excitation at 370 nm
to calculate Fluorescence index (FI), which is an index to
analyse the origin of fulvic acids from microbial versus
terrestrial sources. FI was calculated as the ratio of relative
fluorescence emission intensities at 450 nm over 500 nm as
proposed by McKnight et al. (2001).
Bacterial analyses
Bacterial abundance and biomass were determined from
sample water preserved with \0.2 lm filtered formalde-
hyde (2% final concentration). Three replicates of water
(2 ml each) were filtered with low pressure through a
0.2 lm, 25 mm black polycarbonate filter (Hobbie et al.
1977) 2–6 h after sampling. Bacteria were then stained with
4-,6-diamido-2-phenylindole (DAPI) with a final concen-
tration of 5 lg ml-1 (Porter and Feig 1980). DAPI stained
filters were stored in –20�C and in the dark. Samples were
counted under UV excitation with an epifluorescense
microscope (Leica Leitz DMRB) with 1,0009 magnifica-
tion. At least 400 cells from each filter were counted. For
biomass estimation, the length and width of the cells were
estimated from digital images using Cell C—program
(Selinummi et al. 2005). Biovolume was converted to bio-
mass using a coefficient of 0.308 pgC lm-3 (Fry 1988).
Productivity of heterotrophic bacteria was estimated
using tritiated leucine incorporation (Kirchman et al. 1985)
and a centrifugation method from Smith and Azam (1992).
Productivity measurements started 2–6 h after sampling
and were conducted in 1.5 ml Eppendorf vials with
triplicate samples and duplicate controls. 3H-leucine
(Specific activity 73 Ci mmol-1) was added to each vial to
obtain a final leucine concentration of 20 or 30 nM,
respectively. Two separate leucine concentrations were
used due to different saturation points found from low and
high altitude ponds. Time zero controls were terminated at
this point with addition of trichloroacetic acid (TCA; 5%
final concentration). Samples were incubated in the dark
and cold (4�C) for 2–4 h to remove the effect of temper-
ature. Immediately after incubation, TCA was added to
stop bacterial production. Samples were then stored for 2–6
weeks at -20�C and in the dark. Leucine concentration and
incubation time were estimated from saturation and incu-
bation time curves obtained experimentally from both low,
and high altitude ponds. Frozen samples were thawed at
room temperature for 30 min before centrifugation. All
vials were centrifuged approximately at 11,370 g
(12,000 rpm) for 10 min and the supernatant was removed.
This was done twice, and after the first supernatant
removal, the vials were rinsed by adding 1 ml of cold TCA
5%. After the second supernatant removal, 1 ml of scin-
tillation cocktail was added to the vials and they were
vortexed. Samples were stored in the dark for at least 24 h
and then radioassayed with a RackBeta scintillation coun-
ter (LKB Wallac, Model 1217-001). CPM values were
converted to DPM values using the quenching curves
installed in the scintillation counter. Coefficients from
Simon and Azam (1989) were used to calculate leucine
incorporation.
A total of 500 ml of unfiltered sample water was frozen
(-20�C) and kept in the dark for community composition
analysis. Bacterial DNA-extraction was done with a DNA
isolation kit (PowerSoilTM DNA, MOBIO Laboratories
Inc.). Frozen sample water was freeze-dried (Christ Alpha
1-4 LD Plus) to obtain at maximum 4 mg (on average
2.7 mg) of dried material. LH-PCR patterns are not sig-
nificantly affected by the initial template concentration
(Tiirola 2002). Dried material was diluted to bead tubes
provided by the kit and 100 ll of isolated DNA (1–10 ng)
was prepared following the isolation instructions. After
preparing the PCR-master mix containing 10 9 Biotools
buffer, IRD700 labelled forward primer 27F (50-AGAGTT
TGA TCM TGG CTC AG-3) (Lane 1991) and reverse
primer PRUN518r (50-ATTACC GCG GCT GCT GG-3)
(Muyzer et al. 1993), dNTPs mix, sterile water and biotools
polymerase) for PCR, it was mixed in a ratio of 24 ll
Master Mix to 1 ll template. Samples were then placed in
a Perkin-Elmer GeneAMP 9600 and PCR was performed to
amplify bacterial 16S rRNA-genes from the sample. The
PCR procedure included a denaturation step of 5 min at
95�C followed by 35 amplification cycles (94�C for 30 s
52�C for 1 min and 72�C for 15 min) and the final PCR-
product was stored at 4�C. Fragments were then separated
T. Roiha et al.
123

using agarose gel electrophoresis. An automated LI-COR
4200 sequencer (LI-COR BioTech, Lincoln, NE) was used
to run the electrophoresis gel for 6 h or overnight using 6%
Long Ranger denaturing polyacrylamide gel (FMC Bio-
products, Rocland, ME). The loading mixture (10% buffer,
33% Licor loading dye and 57% sterile water) and PCR-
product were mixed in a ratio of 19 ll of loading mixture
and 1 ll of PCR product and then loaded to the LI-COR
sequencer. The gel was then pre-run for 30 min and the run
was performed with size standards of 470, 527 and 553
base pairs. The data were analyzed using Quantity One
software (Bio-Rad Laboratories, Hercules, CA) and frag-
ments that represented over 0.5% of the summed fragment
area were taken into account in the final analysis. The
original method using measurements of small subunit
rRNA gene PCR amplicon length heterogeneity as an
illustration of community structure is based on Suzuki et al.
(1998). Although this method is robust and does not
allow identification of bacteria species, it still provides
an efficient tool to characterize changes in community
composition.
Statistical tests
Three statistical tests were run for all bacterial parameters.
First, multifactorial analysis of variance was used to
identify significant differences in mean values among
groups (seasonal, altitudinal and spatial). Second, Pear-
son’s correlation was used to test relationships among
bacterial parameters (abundance, production, biomass and
cell size) and physico-chemical properties (temperature,
conductivity, pH, DOC, chl-a, lake area, depth and alti-
tude) and DOM parameters (SUVA, FI, HI and a250/a365).
In the analysis of bacterial productivity, temperature was
not included as a variable as the productivity measurements
were carried out at a constant temperature of 4�C. Finally,
stepwise multiple regression analysis was also done with
all data (excluding chl-a that was measured only for
summer and autumn samples) to identify the variables best
explaining variation in bacterial abundance, production,
biomass and cell size (PASW Statistic 18). For the analy-
sis, bacterial production and biomass results were
transformed in logarithmic scale. In addition, independent
samples t test was used to evaluate differences in HNF and
PNF abundances between low and high altitude ponds
(PASW Statistic 18).
Main fragment size classes in LH-PCR data were nor-
malized by Bray–Curtis similarity and then analyzed (1)
seasonally, (2) altitudinally and (3) spatially with permu-
tational multivariate analysis of variance (MANOVA),
similarities between groups were tested with a Pair-wise
test. Statistically significant differences in MANOVA were
illustrated by canonical analysis of principal coordinates
(CAP). Statistic analyses for bacterial diversity were per-
formed with Primer 6.1.12 and Permanova? 1.0.2 (Primer-
E Ltd, UK).
Results
Some physical characteristics of the ponds are shown in
Table 1. In earlier studies (Rautio 1998, 2001), the ponds
were divided into three groups according to their location
in relation to treeline, but here the results from factor
analysis based on water temperature, pH, dissolved organic
carbon (DOC) and conductivity suggested separation into
just two groups: low altitude ponds below treeline (\600 m
a.s.l.) and high altitude ponds above treeline ([600 m
a.s.l.). Results of the environmental measurements are
shown in Table 2.
Highest bacterial abundance was measured in summer in
both pond groups, although this was more marked in low
altitude ponds. A seasonal trend was found in both low and
high altitude ponds with lowest cell densities in spring and
autumn and highest in summer, although cell density was
about two (1.9–2.2) times higher in low altitude ponds
(Fig. 2a). A similar seasonal trend was found in bacterial
production in low altitude ponds with low production in
spring and autumn and higher production in summer, but
no such trend was evident in high altitude ponds where
production remained low during the whole sampling season
(Fig. 2b). Two exceptionally high values for abundance
and productivity in spring could not be compared with
autumn values because one pond dried out during summer
and another sample was clearly contaminated with bottom
sediment, therefore these two data points were removed
from the statistical analyses. Bacterial production results
are likely underestimates when compared to the in situ
situation because the incubation temperature of 4�C was
lower than the in situ water temperature during summer
(ca. 14�C). On the other hand, a stable incubation tem-
perature removes the temperature variable from potential
factors affecting production rates and was done as our
focus was on carbon effects. Bacterial biomass showed
similar patterns to abundance and productivity. Lower
values were measured in spring and autumn and clearly
higher bacterial biomass was found during summer in low
altitude ponds. In high altitude ponds, spring and autumn
bacterial biomass were similar and only slightly higher
values were recorded in summer (Fig. 2c), although the
differences were not statistically significant. Cell size of
bacteria showed that larger bacteria were present in low
altitude ponds than in high altitude ponds (Fig. 2d).
Potential range of grazing impact on bacterioplankton
was assessed by counting abundances of heterotrophic
nanoflagellates (HNF) and pigmented nanoflagellates
Effect of carbon quantity and quality on bacterioplankton
123

(PNF) during summer. In ponds below (n = 4) treeline, the
abundance of HNF (447 ± 149 ind ml-1) was higher than
in ponds above (n = 7) treeline (308 ± 112 ind ml-1),
although the difference was not statistically significant
(t = 0.99, df = 6.3 and p = 0.358). Abundance of PNF
was at the same level in both pond groups (116 ± 71 and
108 ± 26 ind ml-1, respectively) and there was no statis-
tically significant difference (t = 0.38, df = 9 and
p = 0.711).
Changes between bacterial parameters (abundance,
production, biomass and cell size) and three different fac-
tors (seasonal, altitudinal and spatial) were tested with
multifactorial ANOVA to test if the found shifts in bacte-
rial parameter patterns were statistically significant.
Significant differences among means were found in almost
all cases, with only exceptions in altitudinal bacterial
production (F(1.27) = 3.20, p = 0.085) and bacterial cell
size among seasons (F(2.27) = 1.17, p = 0.327) and space
(F(4.27) = 2.24, p = 0.091) (Table 3). Seasonally, more
detailed examination among all bacterial parameters with
post hoc test (Tukey) revealed that summer was the most
distinct season. Spatial tests confirmed the results from the
altitudinal test that high altitude ponds differed from low
altitude ponds.
All correlations among bacterial parameters and envi-
ronmental data are provided in Table 4. Pearson’s
correlation analysis was used to estimate how all physico-
chemical parameters were connected to bacterial parame-
ters. The strongest significant positive correlations between
bacteria and environmental parameters were found
between DOC and bacterial abundance and biomass. These
bacterial variables acted very similarly to each other with
both having strong significant positive correlations with
chl-a and temperature. Bacterial production was measured
in stable temperature and therefore the temperature vari-
able was removed from the analysis. Otherwise, bacterial
production followed the same pattern with bacterial abun-
dance and biomass. Lake area, depth and altitude had a
significant negative correlation with bacterial abundance
and biomass, but not with bacterial production. Bacterial
cell size followed almost the same pattern with other
bacterial variables, having a positive correlation with
temperature and negative correlations with lake area and
depth. Also, fluorescence index (FI) had a strong negative
correlation with bacterial abundance and biomass, but
characterization of dissolved organic matter (DOM)
revealed that spectroscopically measured optical properties
of DOM did not follow the changes in DOC concentrations
Table 2 Seasonality of environmental characteristics of ponds below and above treeline
Spring Summer Autumn
\600 m [600 m \600 m [600 m \600 m [600 m
Temperature (�C) 6.0 2.0 16.5 12.0 7.4 6.4
(1.5–11.6) (0.6–4.5) (15.9–17.5) (9.7–15.7) (5.9–8.3) (5.0–7.8)
Conductivity (lS cm-1) 19.8 7.3 37.1 15.1 39.1 21.7
(8.6–28.8) (5.0–10.0) (16.2–71.1) (5.3–24.0) (12.2–70.5) (4.4–62.6)
pH 6.1 6.5 6.8 7.1 6.7 7.1
(5.3–6.6) (5.8–8.0) (5.6–7.4) (6.7–8.1) (5.2–7.7) (6.5–7.7)
Chl-a (lg l-1) – – 1.3 0.4 1.0 0.5
(0.6–2.2) (0.2–0.8) (0.4–2.6) (0.5–0.7)
DOC (mg l-1) 4.3 2.1 7.6 2.4 5.25 2.6
(2.6–6.9) (1.3–4.1) (3.9–13) (1.4–3.5) (2.4–8.8) (1.9–4.0)
SUVAa 8.3 8.6 7.1 4.7 5.4 3.4
(4.9–11.4) (6.5–9.9) (4.2–12.3) (3.4–6.4) (3.2–9.5) (2.5–4.6)
a250/a365b 4.4 4.5 4.8 5.1 5.4 5.8
(4.2–4.7) (4.1–5.1) (3.0–6.8) (4.3–5.8) (5.3–5.6) (4.6–6.6)
FIc 1.15 1.19 1.14 1.20 1.22 1.27
(1.11–1.24) (1.12–1.28) (1.02–1.30) (1.15–1.30) (1.05–1.31) (1.19–1.40)
HId 1.10 1.14 0.90 0.94 0.86 0.87
(0.95–1.20) (0.95–1.39) (0.80–1.07) (0.79–1.15) (0.68–1.00) (0.83–0.95)
Numbers outside of the parentheses are seasonal averages. Numbers inside parentheses are seasonal minimum and maximum valuesa Specific UV-absorbance (Weishaar et al. 2003)b Photo-oxidation index (Lindell et al. 1995)c Fluorescence index (McKnight et al. 2001)d Humification index (Kalbitz et al. 1999)
T. Roiha et al.
123

(Table 2). During spring when DOC was at minimum,
there was a clear peak in measured specific UV absorbance
(SUVA) and FI values that were significantly negatively
(n = 37, r = -0.64, p \ 0.001) correlated. Nevertheless,
there was a gradual shift in both SUVA and FI observed
during the season. Similarly to Jaffe et al. (2008), signifi-
cant changes in aromaticity of DOM between low and high
elevation ponds were found with lower SUVA and higher
FI indices, probably indicating less terrestrial associated
input in higher elevation ponds. No significant correlations
among bacterial variables and humidification index (HI)
and photo-oxidation index (a250/a365) were found.
Stepwise multiple regression analysis was done with all
data (environmental variables and DOM properties) to
identify variables best explaining changes in bacterial
abundance, production, biomass and cell size. DOC, tem-
perature and depth were found to be the best explaining
factors for changes in bacterial abundance and biomass
with relatively good explanatory power of 54% for abun-
dance and 58% for biomass. Bacterial production was best
explained by changes in DOC, although with rather low
explaining power of 24%, and temperature and lake area
were found to explain variation in bacterial cell size with a
power of 34% (Table 5).
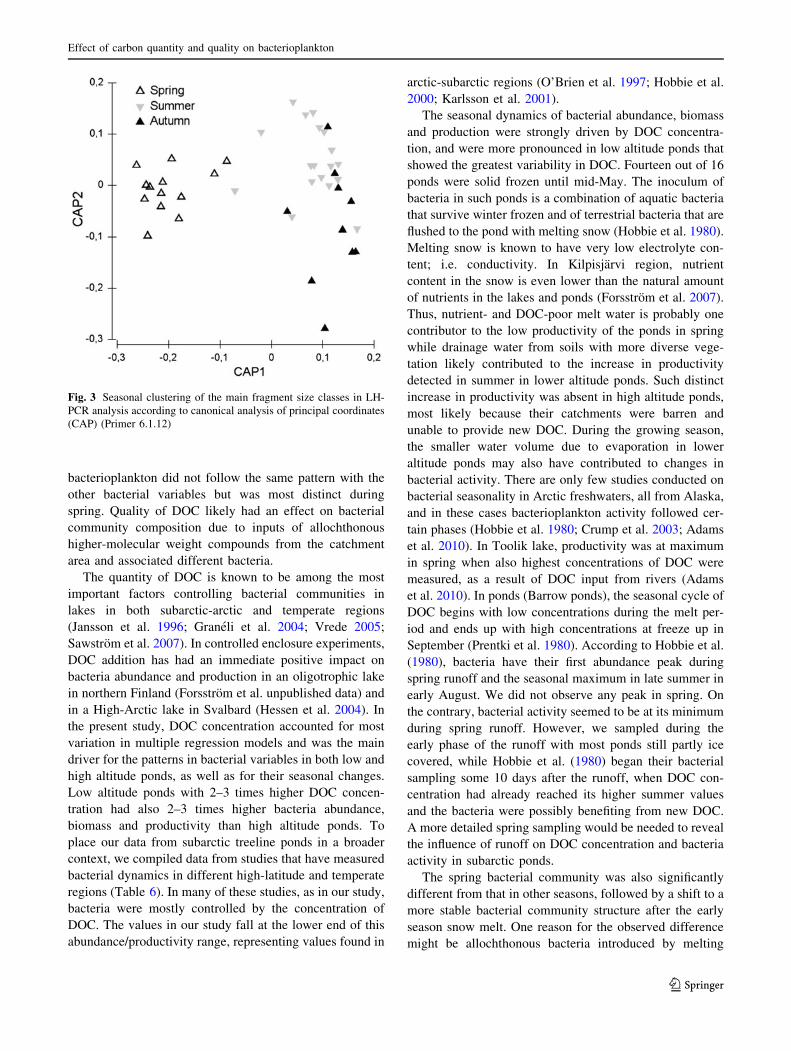
All together, 42 LH-PCR profiles were run and normal-
ized data were analyzed for possible changes in community
composition. The distributions of the main fragment size
classes in length heterogeneity PCR (LH-PCR) were ana-
lyzed using permutational MANOVA and canonical analysis
of principal coordinates (CAP) was used to illustrate the
difference. In the first run, seasonality (spring, summer and
autumn, Fig. 3) and altitude (below and above the treeline)
were included in MANOVA analyses. Results pointed out a
significant difference among seasons (F(2.34) = 5.10,
p \ 0.001) but no significant difference in altitudinal
(F(1.34) = 1.63, p = 0.059) group. When differences
among seasons were examined more carefully with pair-wise
tests, results showed a significant difference of spring versus
summer (t = 2.66, p \ 0.001) and spring versus autumn
(t = 2.61, p \ 0.001) but no difference between summer
versus autumn (t = 0.90, p = 0.622). In the second run,
spatial distribution (Saana, Malla, Jeahkkas, Siilasvuoma
a b
c d
Fig. 2 Mean bacterial parameters (a) abundance, (b) production, (c) biomass and (d) cells size in the different seasons in ponds below and above
treeline. Vertical lines represent standard error (PASW statistics 18)
Effect of carbon quantity and quality on bacterioplankton
123

and Tsahkal) and seasonality (spring, summer and autumn)
were included in permutational MANOVA. No significant
difference was found in the spatial (F(4.26) = 1.03,
p = 0.427) group and again a strong significant difference
was found in the seasonal (F(2.26) = 4.61, p\0.001) group.
Similarly to first run, pair-wise tests showed a significant
difference between spring vs. summer (t = 2.53, p \ 0.001)
and spring versus autumn (t = 2.42, p \ 0.001) but no dif-
ference between summer versus autumn (t = 1.03,
p = 0.372). Permutational MANOVA results clearly indi-
cate that seasonality has the most influence in
bacterioplankton community structure and spring was the
most distinct season among them.
Discussion
We studied the bacterioplankton in two environmentally
distinct habitats: subarctic ponds below and above treeline.
Productivity and seasonal dynamics of bacteria varied
significantly between these two ecotypes and were espe-
cially related to the concentration of DOC. Highest
bacterial density, biomass, productivity and cell size were
recorded in mid-summer during the time of maximum
DOC and temperature. Community structure of
Table 3 Multifactorial analysis of variance for logarithmic trans-
formed bacterial parameters (abundance, production, biomass and cell
size) with three different data sets; (1) seasonally, (2) altitudinally and
(3) spatially
f p
Abundance
Seasonal 7.2 0.003
Altitudinal 26.3 <0.001
Spatial 7.9 <0.001
Production
Seasonal 6.5 0.005
Altitudinal 3.2 0.085
Spatial 5.1 0.003
Biomass
Seasonal 6.8 0.004
Altitudinal 25.1 <0.001
Spatial 7.0 0.001
Cell size
Seasonal 1.2 0.326
Altitudina 4.4 0.045
Spatial 2.2 0.091
Significant differences are shown bold
Table 4 Pearson’s correlation (r- and p-value) for bacterial parameters (abundance, production, biomass and cell size) with all (n = 42) the environ-
mental data included
Temp. Cond. pH DOC Chl-aa Lake area Depth Alt. SUVAc FIc HIc a250/
a365c
Abundance 0.53 and<0.001
0.21 and
0.173
-0.10
and
0.519
0.67 and<0.001
0.65 and0.001
20.32and0.040
20.45and0.003
20.50and0.001
0.30 and
0.068
20.53 and0.001
-0.03
and
0.859
-0.29
and
0.078
Productionb x 0.29 and
0.066
-0.14
and
0.371
0.46 and0.002
0.47 and0.014
-0.10
and
0.527
-0.25
and
0.114
-0.24
and
0.130
0.17 and
0.318
-0.27 and
0.104
-0.20
and
0.242
-0.19
and
0.240
Biomassb 0.54 and<0.001
0.20 and
0.198
-0.15
and
0.350
0.67 and<0.001
0.64 and<0.001
-0.34and0.026
-0.46and0.002
-0.44and0.003
0.29 and
0.082
-0.54 and<0.001
-0.04
and
0.793
-0.25
and
0.119
Cell size 0.39 and0.010
0.11 and
0.485
-0.22
and
0.153
0.27 and
0.085
0.26 and
0.191
-0.39and0.010
-0.40and0.009
-0.05
and
0.757
0.21 and
0.214
-0.31 and
0.057
0.09 and
0.601
-0.28
and
0.087
Significant correlations are shown in bolda Chl-a concentration values are not available from spring (n = 27)b Production and biomass were transformed to logarithmic scalec Abbreviations as in the Table 2
Table 5 Stepwise multiple linear regression analysis for bacterial
parameters (abundance, production, biomass and cell size)
Explaining variables R2 Sig. F N
Abundance DOC, temperature
and depth
0.544 \0.001 13.114 36
Productiona, b DOC 0.236 0.002 10.813 36
Biomassa DOC, depth
and temperature
0.583 \0.001 15.363 36
Cell size Temperateure and
lake area
0.341 0.001 8.815 36
Tested environmental variables included temperature, conductivity,
pH, DOC, lake area, depth, altitude, SUVA (Specific UV-absor-
bance), FI (Fluorescence index), HI (Humification index) and a250/
a365 (Photo-oxidation index)a Bacterial production and biomass were transformed to logarithmic
scaleb Temperature was removed from the analysis
T. Roiha et al.
123
bacterioplankton did not follow the same pattern with the
other bacterial variables but was most distinct during
spring. Quality of DOC likely had an effect on bacterial
community composition due to inputs of allochthonous
higher-molecular weight compounds from the catchment
area and associated different bacteria.
The quantity of DOC is known to be among the most
important factors controlling bacterial communities in
lakes in both subarctic-arctic and temperate regions
(Jansson et al. 1996; Graneli et al. 2004; Vrede 2005;
Sawstrom et al. 2007). In controlled enclosure experiments,
DOC addition has had an immediate positive impact on
bacteria abundance and production in an oligotrophic lake
in northern Finland (Forsstrom et al. unpublished data) and
in a High-Arctic lake in Svalbard (Hessen et al. 2004). In
the present study, DOC concentration accounted for most
variation in multiple regression models and was the main
driver for the patterns in bacterial variables in both low and
high altitude ponds, as well as for their seasonal changes.
Low altitude ponds with 2–3 times higher DOC concen-
tration had also 2–3 times higher bacteria abundance,
biomass and productivity than high altitude ponds. To
place our data from subarctic treeline ponds in a broader
context, we compiled data from studies that have measured
bacterial dynamics in different high-latitude and temperate
regions (Table 6). In many of these studies, as in our study,
bacteria were mostly controlled by the concentration of
DOC. The values in our study fall at the lower end of this
abundance/productivity range, representing values found in
arctic-subarctic regions (O’Brien et al. 1997; Hobbie et al.
2000; Karlsson et al. 2001).
The seasonal dynamics of bacterial abundance, biomass
and production were strongly driven by DOC concentra-
tion, and were more pronounced in low altitude ponds that
showed the greatest variability in DOC. Fourteen out of 16
ponds were solid frozen until mid-May. The inoculum of
bacteria in such ponds is a combination of aquatic bacteria
that survive winter frozen and of terrestrial bacteria that are
flushed to the pond with melting snow (Hobbie et al. 1980).
Melting snow is known to have very low electrolyte con-
tent; i.e. conductivity. In Kilpisjarvi region, nutrient
content in the snow is even lower than the natural amount
of nutrients in the lakes and ponds (Forsstrom et al. 2007).
Thus, nutrient- and DOC-poor melt water is probably one
contributor to the low productivity of the ponds in spring
while drainage water from soils with more diverse vege-
tation likely contributed to the increase in productivity
detected in summer in lower altitude ponds. Such distinct
increase in productivity was absent in high altitude ponds,
most likely because their catchments were barren and
unable to provide new DOC. During the growing season,
the smaller water volume due to evaporation in lower
altitude ponds may also have contributed to changes in
bacterial activity. There are only few studies conducted on
bacterial seasonality in Arctic freshwaters, all from Alaska,
and in these cases bacterioplankton activity followed cer-
tain phases (Hobbie et al. 1980; Crump et al. 2003; Adams
et al. 2010). In Toolik lake, productivity was at maximum
in spring when also highest concentrations of DOC were
measured, as a result of DOC input from rivers (Adams
et al. 2010). In ponds (Barrow ponds), the seasonal cycle of
DOC begins with low concentrations during the melt per-
iod and ends up with high concentrations at freeze up in
September (Prentki et al. 1980). According to Hobbie et al.
(1980), bacteria have their first abundance peak during
spring runoff and the seasonal maximum in late summer in
early August. We did not observe any peak in spring. On
the contrary, bacterial activity seemed to be at its minimum
during spring runoff. However, we sampled during the
early phase of the runoff with most ponds still partly ice
covered, while Hobbie et al. (1980) began their bacterial
sampling some 10 days after the runoff, when DOC con-
centration had already reached its higher summer values
and the bacteria were possibly benefiting from new DOC.
A more detailed spring sampling would be needed to reveal
the influence of runoff on DOC concentration and bacteria
activity in subarctic ponds.
The spring bacterial community was also significantly
different from that in other seasons, followed by a shift to a
more stable bacterial community structure after the early
season snow melt. One reason for the observed difference
might be allochthonous bacteria introduced by melting
Fig. 3 Seasonal clustering of the main fragment size classes in LH-
PCR analysis according to canonical analysis of principal coordinates
(CAP) (Primer 6.1.12)
Effect of carbon quantity and quality on bacterioplankton
123

snow to complement the pond bacteria that survived winter.
Introduction of allochthonous bacteria is supported by our
DOM characterization, where we found a clear peak of al-
lochthonous derived carbon in our spring sampling with both
measured indices (SUVA and FI). Although labile autoch-
thonous carbon is preferentially used by aquatic bacteria, in
lakes with high terrestrial inputs, it is likely that bacteria are
more dependent on allochthonous DOC (Tranvik 1998;
Kritzberg et al. 2004). We therefore suggest that the spring
community was made of bacteria that were able to utilize
allochthonous carbon as their primary energy source.
We estimated the identity of the phyla that were
responsible for the community composition change using
European molecular biology laboratory (EMBL) database
on 16S rRNA-genes of a certain base pair (bp) length. Most
of the bacterial community structure difference between
spring and the two other seasons was mainly due to the
absence of 16S rRNA gene lengths 522, 502 and 501 bp
during spring. Both 501 and 502 bp 16rRNA gene lengths
are strongly related to appearance of Actinobacteria. Of all
reference sequences in the database, 74.1% of 501 bp and
85.7% of 502 bp long fragment sizes were assigned to
Actinobacteria. Third, 522 bp 16rRNA gene length was
assigned to Gamma- and Betaproteobacteria (41.3%),
Spirochaetes (29.9%) and Firmicutes (10.4%) from all
phyla identified in the database. Clone library results from
the small humic lake by Taipale et al. (2009) assigned the
502 bp to Actinobacteria and 522 bp to Betaproteobacteria
supporting our assignments based on database.
A gradual decrease was measured in SUVA and an
increase in FI values during the sampling season, indicating
less pronounced dominance of allochthonous carbon after
the spring. Seasonal differences in carbon quality indices
are likely linked to decreases in less allochthonous-origi-
nated carbon due to a smaller runoff in summer. Another
important factor for shifts in SUVA and FI might have
been photo-oxidation where refractory DOC (high molec-
ular weight particles) is transformed to lower molecular
weight particles (Lindell et al. 1995, 1996). Increased
concentrations of photodegradated DOC have shown to be
beneficial to bacterioplankton growth (Lindell et al. 1995;
Wetzel et al. 1995) especially in DOM rich lakes (Lindell
et al. 1995). Therefore this could be one explanation for the
highest bacterial densities and production observed in low
altitude ponds during summer. We also measured higher HI
during spring indicating that DOM entering the ponds from
drainage was less usable for biota than less humified DOM
during summer and autumn runoff, and therefore higher HI
could be one explanation for the absence of spring pro-
duction peak. Also, more stable HI values during summer
and autumn could partly explain that no compositional
changes in the community structure were found.
In addition to DOC in subarctic-arctic environments,
temperature and predation have been observed to affect
bacteria abundances (Ochs et al. 1995; Jurgens and Matz
2002). In our study, temperature was negatively dependent
on altitude and the greatest temperature difference between
low and high altitude ponds was 7.8�C in summer. The
correlation found between bacterial variables and temper-
ature indicates that temperature was one of the factors
influencing bacterial density, biomass and cell size at high
altitudes and in the beginning and end of the season.
However, availability of substrates is known to overcome
the negative effect of low temperature (Wiebe et al. 1992).
Our data supports this assumption because both DOC and
chl-a had stronger correlations with bacterial variables.
Also in regression analysis, temperature was only a sec-
ondary explanatory variable. HNF abundances in our study
were in the same range with studies by Hobbie et al. (2000)
and Laybourn-Parry and Marshall (2003), with slightly but
Table 6 Intersystem comparison among bacterial variables
Region Site Abundance
(9 109 l-1)
Biomass
(lg C l-1)
Production
(lg C l-1 d-1)
References
Arctic Lake Toolik, Alaska 0.2–3.0 – 1.6–22.4 (Hobbie et al. 2000; O’Brien
et al. 1997)
Tundra ponds, Barrow, Alaska 2.0–6.0 – – (Hobbie et al. 1980)
Ponds, high Arctic, Canada 2.1–6.5 – 0.38–0.47 (Graneli et al. 2004)
High Arctic lake, Franz Joseph Land 0.9–1.7 – 1.2–3.9 (Panzenbock et al. 2000)
Subarctic Lake Saanajarvi, Subarctic, Finlanda 0.9–1.1 2.5–4.8 0.24–0.33 Forsstrom et al. unpublished
Kilpisjarvi ponds, Subarctic, Finland 0.6–3.9 11.3–117.1 0.5–33.5 This study
Subarctic lakes, Sweden 0.4–2.5 9.2–66.1 0.4–7.7 (Karlsson et al. 2001)
Temperate Oligotrophic mesohumic, Lake
Paajarvi, Finland
1.4–3.7 – 1.8–13.6 (Tulonen 1993)
Temperate humic Lake Mekkojarvia 6.3–8.1 – 26–65 (Salonen et al. 1992)
Eutrophic lakes, Danmark 3.1–13.6 251–684 – (Bjørnsen 1986)
a Measurements were done in enclosures
T. Roiha et al.
123

not significantly higher abundances in ponds below tree-
line where, however, bacteria abundance in these ponds
was higher than in above treeline suggesting that HNF
predation was not severe. We assume that the top-down
grazing pressure from HNF exerted only a minor control on
bacterial communities (abundance, production and size)
compared to bottom-up control from abiotic variables as
suggested in Menge and Sutherland (1987) and Hahn and
Hofle (2001).
To conclude, the quantity and quality of DOC to a
large extent determines the utilization of DOC by bacte-
rioplankton. Changes in these measures are naturally seen
spatially and temporally, but they are also predicted to
change in a larger global scale as a result of shifts in
vegetation belts and precipitation. Arctic and subarctic
lakes and ponds are especially sensitive indicators of cli-
mate change, and increased air temperatures and
precipitation are likely to increase both the amount of
DOC and nutrients in these systems (ACIA 2005). In the
light of our results, substantial differences in the quality of
carbon can be expected in association to higher runoff
rates. Hence, climate change can be expected to increase
the productivity of bacterioplankton and change their
community structure in subarctic ponds. Whether the
observed bacteria community composition shift from
spring to summer resulted from selection and resource
competition for different types of carbon resources or was
merely a result of seasonal succession from dry (solid
frozen) to liquid phase of a pond, and associated terrestrial
and aquatic bacterial composition, needs more research.
Understanding the drivers behind such drastic community
shifts will help us make predictions for a warmer climate.
Arctic limnology has developed considerably during
recent years but there is still a need for better estimation
of changes in bacterioplankton communities in subarctic-
arctic lakes and ponds because of their crucial role in
aquatic food webs as well as in green house gas release
(Hanson et al. 2003; Walter et al. 2006; Laurion et al.
2010).
Acknowledgments We thank Laura Forsstrom, Heather Mariash
and Jonna Kuha for assistance in the field, Timo Marjomaki, Heikki
Hamalainen and Mathieu Cusson for advice on statistical analyses,
and Roger Jones for comments on an earlier manuscript version. We
thank Kilpisjarvi biological station for hospitability during field work.
The study was supported by the Societas pro Fauna et Flora Fennica,
the Haavikko Foundation, Lapland Atmosphere-Biosphere Facility
and the Finnish Academy of Science (grants 119205 and 140775).
References
ACIA (2005) Arctic climate impact assessment. Cambridge Univer-
sity Press, New York
Adams HE, Crump BC, Kling GW (2010) Temperature controls on
aquatic bacterial production and community dynamics in arctic
lakes and streams. Environ Microbiol 12:1319–1333
Baron J, McKnight DM, Denning AS (1991) Sources of dissolved and
particulate organic material in Loch Vale watershed, Rocky
Mountain National Park, Colorado, USA. Biogeochem 15:
89–110
Bjørnsen PK (1986) Automatic determination of bacterioplankton
biomass by image analysis. Appl Environ Microbiol
51:1199–1204
Blom T, Korhola A, Weckstrom J, Laing T, Snyder J, MacDonald G,
Smol J (2000) Physical and chemical characterization of small
subarctic headwater lakes in Finnish Lapland and Kola Penin-
sula. Verh Int Ver Limnol 27:316–320
Crump BC, Kling GW, Bahr M, Hobbie JE (2003) Bacterioplankton
community shifts in an Arctic lake correlate with seasonal
changes in organic matter source. Appl Environ Microbiol
69:2253–2268
Forsstrom L, Sorvari S, Rautio M, Sonninen E, Korhola A (2007)
Changes in physical and chemical limnology and plankton
during the spring melt period in a subarctic lake. Int Rev
Hydrobiol 92:301–325
Fry JC (1988) Determination of biomass. In: Austin B (ed) Methods
in aquatic bacteriology. John Wiley & Sons, New York,
pp 27–72
Graneli W, Bertilsson S, Philibert A (2004) Phosphorus limitation of
bacterial growth in high Arctic lakes and ponds. Aquat Sci
66:430–439
Hahn MW, Hofle MG (2001) Grazing of protozoa and its effect on
populations of aquatic bacteria. FEMS Microbiol Ecol
35:113–121
Hanson PC, Bade DL, Carpenter SR, Kratz TK (2003) Lake
metabolism: Relationships with dissolved organic carbon and
phosphorus. Limnol Oceanogr 48:1112–1119
Hessen DO, Andersen T, Lyche A (1990) Carbon metabolism in a
humic lake: Pool sizes and cycling through zooplankton. Limnol
Oceanogr 35:84–99
Hessen DO, Blomqvist P, Dahl-Hansen G, Drakare S, Lindstrom ES
(2004) Production and food web interactions of Arctic freshwa-
ter plankton and responses to increased DOC. Arch Hydrobiol
159:289–307
Hobbie JE, Laybourn-Parry J (2008) Heterotrophic microbial pro-
cesses in polar lakes. In: Vincent WF, Laybourn-Parry J (eds)
Polar lakes and rivers–limnology of arctic and antarctic aquatic
ecosystems. Oxford University Press, Oxford, pp 197–212
Hobbie JE, Daley RJ, Jasper S (1977) Use of nucleopore filters for
counting bacteria by fluorescence microscopy. Appl Environ
Microbiol 33:1225–1228
Hobbie JE, Traaen T, Rublee PA, Reed JP, Miller MC, Fenchel T
(1980) Decomposers, bacteria, and microbenthos. In: Hobbie JE
(ed) Limnology of tundra ponds Barrow. Alaska, Hutchinson &
Ross, pp 340–387
Hobbie JE, Bahr M, Bettez N, Rublee PA (2000) Microbial food webs
in oligotrophic arctic lakes. Microbial Biosystems: New Fron-
tiers, Proceedings of the 8th international symposium on
Microbial Ecology. Atlantic Canada society for Microbial
Ecology, Halifax, Canada, pp 293–298
Hood E, McKnight DM, Williams MW (2003) Sources and chemical
quality of dissolved organic carbon (DOC) across an alpine/
subalpine ecotone, Green Lakes Valley, Colorado Front Range,
United States. Wat Resour Res 39:1188
Hood E, Williams MW, McKnight DM (2005) Sources of dissolved
organic matter (DOM) in a Rocky Mountain stream using
chemical fractionation and stable isotopes. Biogeochem
74:231–255
Effect of carbon quantity and quality on bacterioplankton
123
Jaffe R, McKnight DM, Maie N, Cory R, McDowell WH, Campbell
JL (2008) Spatial and temporal variations in DOM composition
in ecosystems: The importance of long-term monitoring of
optical properties. J Geophys Res 113:G04032
Jansson M, Blomqvist P, Jonsson A, Bergstrom A-K (1996) Nutrient
limitation of bacterioplankton, autotrophic and mixotrophic
phytoplankton, and heterotrophic nanoflagellates in Lake Ortras-
ket. Limnol Oceanogr 41:1552–1559
Jansson M, Bergstrom A-K, Blomqvist P, Isaksson A, Jonsson A
(1999) Impact of allochthonous organic carbon on microbial
food web carbon dynamics and structure in Lake Ortrasket. Arch
Hydrobiol 144:409–428
Jeffrey SW, Walschmeyer NA (1997) Spetrophotometric and fluoro-
metric equations in common use in oceanography. In: Jeffrey
SW, Mantoura RFC, Wright SW (eds) Phytoplankton pigments
in oceanography. UNESCO publishing, Paris, pp 361–381
Jones RI (1992) The influence of humic substances on lacustrine
planktonic food-chains. Hydrobiol 229:73–91
Jurgens K, Matz C (2002) Predation as a shaping force for the
phenotypic and genotypic composition of planktonic bacteria.
Ant van Leeuwen 81:413–434
Kalbitz K, Geyer W, Geyer S (1999) Spectroscopic properties of
dissolved humic substances—a reflection of land use history in a
fen area. Biogeochem 47:219–238
Kankaala P (1988) The relative importance of algae and bacteria as
food for Daphnia longispina (Cladocera) in a polyhumic lake.
Freshw Biol 19:285–296
Karlsson J, Jonsson A, Jansson M (2001) Bacterioplankton production
in lakes along an altitude gradient in the subarctic north of
Sweden. Microb Ecol 42:372–382
Karlsson J, Jansson M, Johnsson A (2002) Similar relationships
between pelagic primary and bacterial production in clearwater
and humic lakes. Ecol 83:2902–2910
Karlsson J, Bystrom P, Ask J, Ask P, Persson L, Jansson M (2009)
Light limitation of 554 nutrient-poor lake ecosystems. Nature
460:506–510
Kirchman D, K’nees E, Hodson RE (1985) Leucine incorporation and
its potential as a measure of protein synthesis by bacteria in
natural aquatic systems. Appl Environ Microbiol 49:599–607
Kritzberg ES, Cole JJ, Pace ML, Graneli W, Bade DL (2004)
Autochthonous vs. allochthonous carbon sources to bacteria:
results from whole-lake 13C experiments. Limnol Oceanogr
49:588–596
Lane DJ (1991) 16S/23S rRNA sequencing. In: Stackebrandt E,
Goodfellow M (eds) Nucleic acid techniques in bacterial
systematics. John Wiley & Sons, Chichester, pp 115–175
Laurion I, Vincent WF, Lean DRS (1997) Underwater ultraviolet
radiation: development of spectral models for northern latitude
lakes. Photochem Photobiol 65:107–114
Laurion I, Vincent WF, MacIntyre S, Retamal L, Dupont C, Francus
P, Pienitz (2010) Variability in greenhouse emissions from
permafrost thaw ponds. Limnol Oceanogr 55:115-133
Laybourn-Parry J, Marshall WA (2003) Photosynthesis, mixotrophy
and microbial plankton dynamics in two high Arctic lakes during
summer. Polar Biol 26:517–524
Lindell MJ, Graneli HW, Tranvik LJ (1995) Enhanced bacterial
growth in response to photochemical transformation of dissolved
organic matter. Limnol Oceanogr 40:195–199
Lindell MJ, Graneli HW, Tranvik LJ (1996) Effects of sunlight on
bacterial growth in lakes of different humic content. Aquat
Microb Ecol 11:135–141
Mariash HL, Cazzanelli M, Kainz MJ, Rautio M (2011) Zooplankton
nutrient sources and lipid retention in subarctic ponds. Freshwat
Biol (in press)
McGuire AD, Anderson LG, Christensen TR, Dallimore S, Guo L,
Hayes DJ, Heimann M, Lorenson TD, Macdonald RW, Roulet N
(2009) Sensitivity of the carbon cycle in the Arctic to climate
change. Ecol Monogr 79:523–555
McKnight DM, Boyer EW, Westerhoff PK, Doran PT, Kulbe T,
Andersen DT (2001) Spectrofluorometric characterization of
dissolved organic matter for indication of precursor organic
material and aromaticity. Limnol Oceanogr 46:38–48
Menge BA, Sutherland JP (1987) Community regulation: variation in
disturbance, competition and predation in relation to environ-
mental stress and recruitment. Am Nat 130:730–757
Mitchell BG, Kahru M, Wieland J, Stramska M (2003) Determination of
spectral absorption coefficients of particles, dissolved material and
phytoplankton for discrete water samples. In: Mueller JL, Fargion
GS, McClain CR (eds) Ocean optics protocols for satellite ocean
color sensor validation, Revision 4, vol IV, NASA/TM-
2003–211621/R. Goddard Space Flight Center, Greenbelt, pp 39–56
Mobed JJ, Hemmingsen SL, Autry JL, McGown LB (1996) Fluores-
cence characterization of IHSS humic substances: total
luminescence spectra with absorbance correction. Environ Sci
Technol 30:3061–3065
Muyzer G, Dewaal EC, Uitterlinden AG (1993) Profiling of complex
microbial-populations by denaturing gradient gel-electrophoresis
analysis of polymerase chain reaction amplified genes coding for
16S ribosomal-RNA. Appl Environ Microbiol 59:695–700
Nusch EA (1980) Comparison of different methods for chlorophyll
and phaeopigment determination. Arch Hydrobiol Beih 14:14–36
O’Brien WJ, Bahr M, Hershey AE, Hobbie JE, Kipphut GW, Kling
HK, McDonald M, Miller MC, Rublee P, Vestal JR (1997) Thelimnology of Toolik Lake. In: Milner AM, Oswood MW (eds)
Freshwaters of Alaska. Springer-verlag, New York, pp 61–106
Ochs CA, Cole JL, Likens GE (1995) Population dynamics of
bacterioplankton in an oligotrophic lake. J Plankton Res
17:365–391
Pace ML, Cole JJ, Carpenter SR, Kitchell JF, Hodgson JR, Van de
Bogert MC, Bade DL, Kritzberg ES, Bastviken D (2004) Whole-
lake carbon-13 additions reveal terrestrial support of aquatic
food webs. Nature 427:240–243
Panzenbock M, Mobes-Hansen B, Albert R, Herndl GJ (2000)
Dynamics of phyto- and bacterioplankton in a high Arctic lake
on Franz Joseph Land archipelago. Aquat Microb Ecol 21:265–273
Porter KG, Feig YS (1980) The use of DAPI for identifying and
counting aquatic. Limnol Oceanogr 25:943–948
Prentki RT, Miller MC, Barsdate RJ, Alexander V, Kelley J, Coyne P
(1980) Chemistry. In: Hobbie JE (ed) Limnology of tundra
ponds Barrow. Alaska, Hutchinson & Ross, Dowden, pp 76–179
Rae R, Vincent WF (1998) Effects of temperature and ultraviolet
radiation on microbial food web structure: potential responses to
global change. Freshw Biol 40:747–758
Rautio M (1998) Community structure of crustacean zooplankton in
subarctic ponds—effects of altitude and physical heterogeneity.
Ecography 21:327–335
Rautio M (2001) Zooplankton assemblages related to environmental
characteristics in treeline ponds in Finnish Lapland. Arct Antarct
Alp Res 33:289–298
Rautio M, Vincent WF (2007) Isotopic analysis of the sources of
organic carbon for zooplankton in shallow subarctic and arctic
waters. Ecography 30:77–87
Salonen K, Arvola L, Tulonen T, Hammar T, Metsala T-R, Kankaala
P, Munster U (1992) Planktonic food chains of a highly humic
lake. Hydrobiol 229:125–142
Sawstrom C, Laybourn-Parry J, Graneli W, Anesio AM (2007)
Heterotrophic bacterial and viral dynamics in Arctic freshwaters:
results from a field study and nutrient-temperature manipulation
experiment. Polar Biol 30:1407–1415
Selinummi J, Seppala J, Yli-Harja O, Puhakka JA (2005) Software for
quantification of labeled bacteria from digital microscope images
by automated image analysis. Biotechniques 39:859–863
T. Roiha et al.
123

Simon M, Azam F (1989) Protein-content and protein-synthesis rates
of planktonic marinebacteria. Mar Ecol Prog Ser 51:201–213
Simon M, Tilzer MM, Muller H (1998) Bacterioplankton dynamics in
a large mesotrophic lake: I. Abundance, production and growth
control. Arch Hydrobiol 143:385–407
Smith DC, Azam F (1992) A simple, economical method for
measuring bacterial protein synthesis rates in seawater using
3H-leucine. Mar Microb Food Webs 6:107–114
Stedmon CA, Markager S, Kaas H (2000) Optical properties and
signatures of chromophoric dissolved organic matter (CDOM) in
Danish coastal waters. Estuar Coast Shelf Sci 51:267–278
Stewart AJ, Wetzel RG (1980) Fluorescence : absorbance ratios—a
molecular-weight tracer of dissolved organic matter. Limnol
Oceanogr 25:559–564
Suzuki MT, Rappe MS, Giovannoni SJ (1998) Kinetic bias in
estimates of coastal picoplankton community structure obtained
by measurements of small-subunit rRNA gene PCR amplicon
length heterogeneity. Appl Environ Microbiol 64:4522–4529
Taipale S, Jones RI, Tiirola MA (2009) Vertical diversity of bacteria
in an oxygen-stratified humic lake, evaluated using DNA and
phospholipid analyses. Aquat Microb Ecol 55:1–16
Tiirola MA (2002) Phylogenetic analysis of bacterial diversity using
ribosomal RNA gene sequences. Dissertation, University of
Jyvaskyla
Tranvik LJ (1988) Availability of dissolved organic carbon for
planktonic bacteria in oligotrophic lakes of differing humic
content. Microb Ecol 16:311–322
Tranvik LJ (1998) Degradation of dissolved organic matter in humic
water by bacteria. In: Hessen DO, Tranvik LJ (eds) Aquatic
humic substances—ecology and biochemistry, Springer, Berlin,
pp 259–284
Tulonen T (1993) Bacterial production in a mesohumic lake estimated
from [C-14] leucine incorporation rate. Microb Ecol 26:201–217
Vincent WF, Pienitz R (1996) Sensitivity of high latitude freshwater
ecosystems to global change: temperature and solar ultraviolet
radiation. Geosci Can 23:231–236
Vrede K (2005) Nutrient and temperature limitation of bacterio-
plankton growth in temperate lakes. Microb Ecol 49:245–256
Walter KM, Zimov SA, Chanton JP, Verbyla D, Chapin FS III (2006)
Methane bubbling from Siberian thaw lakes as a positive
feedback to climate warming. Nature 443:71–75
Weishaar JL, Aiken GR, Bergamaschi BA, Fram MS, Fujii R,
Mopper K (2003) Evaluation of specific ultraviolet absorbance
as an indicator of the chemical composition and reactivity of
dissolved organic carbon. Environ Sci Technol 37:4702–4708
Wetzel RG, Hatcher PG, Bianchi TS (1995) Natural photolysis by
ultraviolet irradiance of recalcitrant dissolved organic matter to
simple substrates for rapid bacterial metabolism. Limnol Oce-
anogr 40:1369–1380
Wiebe WJ, Sheldon WM Jr, Pomeroy LR (1992) Bacterial growth in
the cold: evidence for an enhanced substrate requirement. Appl
Environ Microbiol 58:359–364
Yentsch CS, Menzel DW (1963) A method for the determination of
phytoplankton chlorophyll and phaeophytin by fluorescence.
Deep-Sea Res 10:221–231
Effect of carbon quantity and quality on bacterioplankton
123