carbon isotope discrimination and photosynthesis · carbon isotope discrimination during...
TRANSCRIPT

Annu. Rev. Plant Physiol. Plant Mol. Bioi. 1989. 40:503-37 Copyright © 1989 by Annual Reviews Inc. All rights reserved
CARBON ISOTOPE DISCRIMINATION AND PHOTOSYNTHESIS
G. D. Farquhar,l 1. R. Ehleringer,2 and K. T. Hubic�
IResearch School of Biological Sciences, Australian National University, Canberra, ACT 2601 Australia
2Department of Biology, University of Utah, Salt Lake City, Utah 84112
CONTENTS
INTRODUCTION . . . . . . . . . . ... . . . . . . . . . . . . . . . ..... . . ..... . . . . . . . . . . . . . . . . . . . . . . . . . . . . . . ............ . . . 504
ISOTOPE EFFECTS. . . . . . . . . . . .. . . . . . . . . . . . . . . .. . . . . . . ....... . . . ..... . . . . . . . . . . . . . . . . . . . . .... . . .... . . 504
ISOTOPIC COMPOSITION AND DISCRIMINATION. ... . . . . .. .. . . ...... . . . . . . . . ... . . . . . . . . 505 Definitions . . . . . . . . . . . . . . . . . . . . . . . . . . . . . . . . . . . . . . . . . . . . . . . . . . . . . . . . . . . . . . . . . . . . . . .. . . . . . . . . . . . . . . . . . . 505 lsotop ic Composition of Source Air . . . . . . . . . . . . .. . . . . . . . . . . . . . . . . . . . . . . . . . . . . . . . . . . . . . . . . . . . . . 507 "On-line" Measurement of Carbon Isotope Discrimination . . . . . . . . . . . . . . . . . . . . . . . . . . . . . . 508
THEORY OF CARBON ISOTOPE DISCRIMINATION DURING PHOTOSyNTHESIS .............. . . . . ........ . . . . . . ......... . . . ....... . . . . . ..... . . .... . . . .. . . . . . . . . . 508
C3 Photosynthesis . . . . . . . . . . . . . . . . . . . . . . . . . . . . . . . . . . .. . . . . . . .. . . . . . . . . . . . . . . . . . . . . . . . . . . . ..... . . . . . 509 C4 Photosynthesis . . . . . . . . . . ... . . . . . . . . . ... . . . ....... .. . . . . ...... . . . ....... . ...... . . . ..... . . ..... . . 5 1 2 Cr�4 Intermediacy . . . . . . . . . . . . . . . . . . . . . . . . . . . . . ..... . . . . . . . . . . . . . . . . . . . . . . . . . . . . . . . . . . . . . . . . . . . . 514 Crassulacean Acid Metabolism. . . . . . . . . . . . . . . . . . . . . . . . . . . . . . . . . . . . . . . . . . . . . . . . . . . . . . . . . . . . . . . . . 5 1 5 Aquatic Plants and Algae . . ...... . . . . . . . . . . . . . . . . . . . . . . . ..... . . . . . ...... . . . . . . . . . . . . . . . . . . . . . . . . 516
ENVIRONMENTAL EFFECTS ON CARBON ISOTOPE DISCRIMINATION . . . . . . . . . 5 1 7 Light . . . . . . . . ... . . . . . . . . . . .. . . . . . . . . . . . . . . . . .. . . . . . . . . .. . . . . . . . . . . . . . . . . . . . . . . . . . . . . . . . ... . . . . . . . . . . . . 5 1 8 Water. . . . . . . . . . . . . . . . . . . . . . . . . . . . . . . . . . . . . . . . . . . . . . . . . .. . . . . . . . . . . . . . . . . . . . . . . . . . . . . . . . . . . . . . . . . . . . . . 5 1 9 Salinity . . . . . . . ... . . . . . . . . ..... . . . . . . . . . . . . . . . . . . . . . . . . . .... . . . . . . . . . . . . . . . . . . . . . . . . . . . . . . . . , . . . . . . . . . 520 Air Pollution . . . . . . . . . . . . . . . . . . . . . . . . . . . . . . . . . . . . . . . . . . . . . . . . . . . . . . . . . . . . . . . . . . . . . . . . . . . . . . . . . . . . . . . 520
WATER-USE EFFICIENCY OF C3 SPECIES . . . ... . . . . . . . . . . . . . . . .... . . . . . . . . . . . . . . . . . . . . . . . . . 520 Transpiration Efficiency and Carbon Isotop e Discrimination . . . . . . . . . . . . . . . . . . . . . . . . . . . . 520 Scaling from the Plant to the Canopy . . . . . . . . . . . . . . . . . . . . . . . . . . . . . . . . . . . . . . . . . . . . . . . . . . . . . . . . 522 Carbon Isotope Discrimination and Plant Growth Characteristics . . . . . . . . . . . . .... . . . . . 523 Genetic Control of D iscrimination . . . . . . . . . . . .. . . . . . . . . . . . . . . . . . . . . . . . . . . . . . . . . . . . . . . . . . . . . . . . 524
CONCLUDING REMARKS ................................ ........................... 525 APPENDIX. . . . . . . . . . . . . . . . . . . . . . . . . .. . . . . . . . . . . . . . . . ..... . . . . . . . . . . . . . . . . . . . . . . . . . . . . . . . . . . . . . . . . . . . . . . 525
503 1040-25 1 9/89/0601 -503$02.00
Ann
u. R
ev. P
lant
. Phy
siol
. Pla
nt. M
ol. B
iol.
1989
.40:
503-
537.
Dow
nloa
ded
from
ww
w.a
nnua
lrev
iew
s.or
gby
Uni
vers
ity o
f A
rizo
na L
ibra
ry o
n 02
/07/
11. F
or p
erso
nal u
se o
nly.

504 FARQUHAR ET AL
INTRODUCTION
There are two naturally occurring stable isotopes of carbon, 12
e and 13e. Most of the carbon is l2e (98.9%), with l . 1% being l3e. The isotopes are unevenly distributed among and within different compounds, and this isotopic distribution can reveal information about the physical, chemical, and metabolic processes involved in carbon transformations. The overall abundance of 13e relative to l2e in plant tissue is commonly less than in the carbon of atmospheric carbon dioxide, indicating that carbon isotope discrimination occurs in the incorporation of CO2 into plant biomass. Because the isotopes are stable, the information inherent in the ratio of abundances of carbon isotopes, presented by convention as i3C1l2e, is invariant as long as carbon is not lost. Numerous contributions have been made to our understanding of carbon isotope discrimination in plants since this area was extensively reviewed by O'Leary (97). Here we discuss the physical and enzymatic bases of carbon isotope discrimination during photosynthesis, noting how knowledge of discrimination can be used to provide additional insight into photosynthetic metabolism and the environmental influences on that process.
ISOTOPE EFFECTS
Variation in the i3e/12e ratio is the consequence of "isotope effects," which are expressed during the formation and destruction of bonds involving a carbon atom, or because of other processes that are affected by mass, such as gaseous diffusion. Isotope effects are often classified as being either kinetic or thermodynamic, the distinction really being between nonequilibrium and equilibrium situations. One example of a kinetic effect is the difference between the binary diffusivity of 13eo2 and that of 12eo2 in air. Another example is the difference between the kinetic constants for the reaction of 12e02 and 13eo2 with ribulose bisphosphate carboxylase-oxygenase (Rubisco). Both these examples are called "normal" kinetic effects in that the process discriminates against the heavier isotope. Thermodynamic effects represent the balance of two kinetic effects at chemical equilibrium and are therefore generally smaller than individual kinetic effects. An example of a thermodynamic effect is the unequal distribution of isotope species among phases in a system (e.g. in CO2 in air versus in CO2 in solution). Thermodynamic effects, like some kinetic ones, are temperature dependent.
Isotope effects, denoted by a, are also called fractionation factors because they result in fractionations of isotopes. They are here defined (as by some, but not all chemists) as the ratio of carbon isotope ratios in reactant and product
Ann
u. R
ev. P
lant
. Phy
siol
. Pla
nt. M
ol. B
iol.
1989
.40:
503-
537.
Dow
nloa
ded
from
ww
w.a
nnua
lrev
iew
s.or
gby
Uni
vers
ity o
f A
rizo
na L
ibra
ry o
n 02
/07/
11. F
or p
erso
nal u
se o
nly.

CARBON ISOTOPE DISCRIMINATION 505
Rr a : R,
p
1.
where Rr is the I3e/12e molar ratio of reactant and Rp is that of the product. Defined in this way, a kinetic isotope effect can be thought of as the ratio of the rate constants for 12e and l3e containing substrates, k12 and k13, respectively. Thus
k12
a kinetic = t;J3. 2.
A simple equilibrium isotope effect would be the ratio of the equilibrium constants for 12e and l3e containing compounds, K12 and K13, respectively:
3.
Diffusional effects belong to the category of kinetic effects, and the isotope effect is the ratio of the diffusivity of the 12e compound to that of the l3e compound. The above effects are discussed more fully in Part I of the Appendix. Isotope effects may occur at every reaction of a sequence, but the overall isotope effect will reflect only the isotope effects at steps where the reaction is partially reversible or where there are alternative possible fates for atoms, until an irreversible step is reached (97). Kinetic isotope effects of successive individual reactions are usually not additive, but the thermodynamic ones are. If all reactants are consumed and converted to product in an irreversible reaction, there is no fractionation. For example, plants grown in a closed system, where all e02 was fixed, showed no isotope effect (6).
ISOTOPIC COMPOSITION AND DISCRIMINATION
Definitions Farquhar & Richards (39) proposed that whole plant processes should be analyzed in the same terms as chemical processes. From Equation 1 it is evident that this requires measurements of isotopic abundance of both source and product. For plants this means measuring Ra (isotopic abundance in the air) and Rp (isotopic abundance in the plant, where the plant can be considered the product referred to in Equation 1). For numerical convenience, instead of using the isotope effect (a : RaIRp), Farquhar & Richards (39) proposed the use of A, the deviation of a from unity, as the measure of the carbon isotope discrimination by the plant:
Ann
u. R
ev. P
lant
. Phy
siol
. Pla
nt. M
ol. B
iol.
1989
.40:
503-
537.
Dow
nloa
ded
from
ww
w.a
nnua
lrev
iew
s.or
gby
Uni
vers
ity o
f A
rizo
na L
ibra
ry o
n 02
/07/
11. F
or p
erso
nal u
se o
nly.
506 FARQUHAR ET AL
Ra 41=a-l=--l . Rp
4.
The absolute isotopic composition of a sample is not easy to measure directly. Rather, the mass spectrometer measures the deviation of the isotopic composition of the material from a standard,
8 = Rp - Rs = !!..e... - 1 p Rs Rs
' 5.
where Rs is the molar abundance ratio, l3C/12C, of the standard. The reference material in determinations of carbon isotopic ratios has not normally been CO2 in air but traditionally has been carbon in carbon dioxide generated from a fossil belemnite from the Pee Dee Formation, denoted PDB [for which R = 0.01124, (17)] . In this review all compositions that are denoted 8 are with respect to PDB .
In contrast to 8, the discrimination, A, is independent of the isotopic composition of the standard used for measurement of Rp and Ra, and is also independent of Ra. Plants show a positive discrimination (A) against 13C. Typically C3 plants have a discrimination of � 20 x 10-3 , which is normally presented in the literature as 20%0 ("per mil"). Consistent with this notation, we will use %0 as equivalent to 10-3. Note that "per mil" is not a unit, and is analogous to per cent; discrimination is therefore dimensionless. Equations involving the 8 notation have been made unnecessarily complex by including the factor 1000 in the definition (Le. 8p = (RpiRs -1)01000). We have opted for simplicity, but the reader should note that factors of 1000 in other treatments (including our own) should be deleted when comparing to the equations presented here. Other possible definitions of discrimination are discussed in Part III of the Appendix.
The value of A as defined above is obtained from {ja and {jp, where a and p refer to air and plant, respectively, using Equation 4, and the definitions of Sa
and 8p (RalRs -1; RpfRs -1, respectively):
6.
On the PDB scale, free atmospheric CO2 (Ra � 0.01115 in 1988) currently has a deviation, 8m of approximately -8%0, and typical C3 material (Rp � 0. 01093) a deviation, 8p, of -27.6%, which yields A =
(-0. 008 + 0. 0276)1 (l - 0. 0276) = 20.1%0. O'Leary (97) pointed out that the simultaneous use of discrimination and 8 is confusing for work with plants , since the discrimination values (A) are usually positive while those of 8 are usually
Ann
u. R
ev. P
lant
. Phy
siol
. Pla
nt. M
ol. B
iol.
1989
.40:
503-
537.
Dow
nloa
ded
from
ww
w.a
nnua
lrev
iew
s.or
gby
Uni
vers
ity o
f A
rizo
na L
ibra
ry o
n 02
/07/
11. F
or p
erso
nal u
se o
nly.
CARBON ISOTOPE DISCRIMINATION 507
negative when PDB is the reference. Where possible, it is preferable to use molar abundance ratios (R) and compositional deviations (5) only as intermediates in the calculation of final isotope effects (97) .
Isotopic Composition of Source Air The advantage of reporting Ii is that it directly expresses the consequences of biological processes, whereas composition, 8p, is the result of both source isotopic composition and carbon isotope discrimination. This distinction is particularly important in the interpretation of some growth cabinet work where the isotopic composition of CO2 can be affected by mixing of CO2 derived from fossil fuel combustion with normal atmospheric CO2, Of course, it is relevant for vegetation grown near vents outgassing the CO2 produced from burning underground coal (for which 80 = -32.5%0) (46). Of wider relevance, the distinction between a and A is important when interpreting results from canopies, if turbulent transfer is poor. In these conditions. there is a gradient. with height, in isotopic composition of CO2 in the air, aa. This gradient occurs because of both canopy photosynthetic activity and soil respiration and litter decomposition. On the one hand, since photosynthetic processes discriminate against I3C, the remaining CO2 in air should be enriched in 13C when CO2 concentration is drawn down (32,35). On the other hand, decomposition processes, which release CO2 with an isotopic composition similar to that of the decaying vegetation, result in a much lower 13C content of the soil CO2 ( 1 , 68, 1 16, 122, 123, 148). Francey et al (42) reported a CO2 concentration of 20 ppm lower, 1 m above the ground, than outside the canopy in the daylight period in a dense ( 14 m) canopy of huon pine in Tasmania. The difference in 8a between the top and bottom of the
canopy was 0.8%0. In warm and dense tropical rainforests, the CO2 concentration, Co, is large near the forest floor, and aa is small [co = 389 ppm, 80 = - 1 1 .4%0 at 0.5 m ( 1 33); see also (88)]. The isotopic composition, aa, and CO2 concentration, Ca, should be negatively related within a canopy (as in the above reports) so that for those field-grown plants where the gradients of Ca are found to be small, the gradient of 8a is also likely to be small.
The isotopic composition of the free atmosphere also changes, slowly becoming depleted in I3e (41, 45, 70, 92, 108). The progressive decrease in 80 is caused by the anthropogenic burning of fossil fuels (8 � -26%0). From 1 956 to 1 982, aa has decreased from -6.7%0 (at 314 ppm) to -7.9%0 (at 342 ppm) (70, 92).
There is also an annual cycle of 10 ppm in Ca, and 0.2%0 in 8a, in the northern hemisphere, associated with seasonal changes in standing biomass; the amplitudes of changes in Ca and Da are much smaller in the southern hemisphere (92). In major metropolitan areas, Da may vary by as much as 2%0 both daily and annually, because of human activities (64, 65). Throughout
Ann
u. R
ev. P
lant
. Phy
siol
. Pla
nt. M
ol. B
iol.
1989
.40:
503-
537.
Dow
nloa
ded
from
ww
w.a
nnua
lrev
iew
s.or
gby
Uni
vers
ity o
f A
rizo
na L
ibra
ry o
n 02
/07/
11. F
or p
erso
nal u
se o
nly.

508 FARQUHAR ET AL
this review when discussing studies where isotopic composition of plant material is presented without corresponding measurements of aa; we also provide an estimate of discrimination (d) using the assumption (for fieldgrown plants) of an atmospheric composition (,sa) of -8%0.
"On-line" Measurement of Carbon Isotope Discrimination In most studies, composition of CO2 from combustion of plant material (,sp) has been compared to that of the atmosphere in which the material was grown (5a) to yield an average discrimination over the period in which the carbon was fixed. A more direct and nondestructive means of measuring short-term carbon isotope discrimination is to measure the changes in the 13e/l2c ratio of the CO2 in air as it passes a leaf within a stirred cuvette, such as those commonly used for whole-leaf gas-exchange measurements (32, 36, 62, 1 25). If the reactions associated with photosynthetic CO2 fixation discriminate against 13C, the remaining CO2 should be enriched in 13e. Discrimination can be calculated from measurements of the concentration (c) and the isotopic composition (D) of the CO2 of the air entering (ce and 5e) and leaving (co and lio) the cuvette according to an equation derived by Evans et al (32),
d = �50 - 5e)
1 + 50 - $50 - 5e) 7.
where g = c.f(ce-co). Note that Evans et al (32) used the constant 1 000 in the denominator rather than 1, because their values of 8 had also been multiplied by 1000.
O'Leary et al ( 1 02) used a different "on-line" technique, where the plant was enclosed in a bell jar and allowed to deplete the CO2• The continuing isotopic enrichment of the remaining CO2 was monitored and discrimination calculated from a set of differential equations.
Estimates from these "on-line" methods are usually comparable to those from tissue combustion analyses (32, 62, 125). The clear advantage over tissue combustion of the "on-line" approaches is that they are nondestructive and rapid ( - 30 min), permitting studies of isotope discrimination as a function of time or of physiological and environmental conditions. The measurement of tissue is of course invaluable for longer-term integration, and for the ease with which small amounts of material can be collected, stored, and subsequently analyzed.
THEORY OF CARBON ISOTOPE DISCRIMINATION DURING PHOTOSYNTHESIS
Carbon isotope composition of plants was first used to indicate photosynthetic pathways in plants (2, 3, 89, 93, 106, 1 20, 1 27, 1 28 , 1 30, 144, 1 45 , 1 50, 1 5 1 , 1 56, 159, 1 60, 1 63). This is because phosphoenolpyruvate (PEP)
Ann
u. R
ev. P
lant
. Phy
siol
. Pla
nt. M
ol. B
iol.
1989
.40:
503-
537.
Dow
nloa
ded
from
ww
w.a
nnua
lrev
iew
s.or
gby
Uni
vers
ity o
f A
rizo
na L
ibra
ry o
n 02
/07/
11. F
or p
erso
nal u
se o
nly.

CARBON ISOTOPE DISCRIMINATION 509
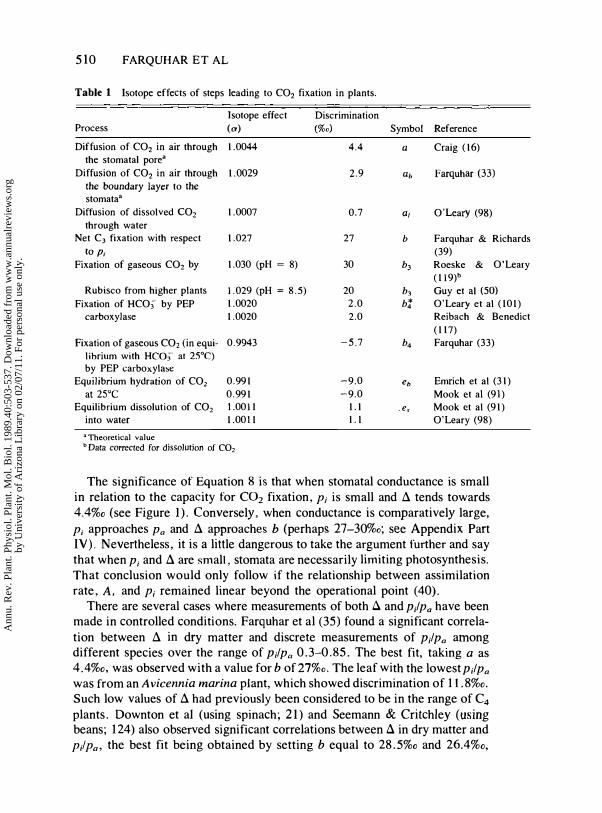
carboxylase, the primary carboxylating enzyme in species having a C4 metabolism, exhibits a different intrinsic kinetic isotope effect and utilizes a different species of inorganic carbon that has an isotopic composition at equilibrium different from that of Rubisco. Isotopic screening was a simple test for determining the photosynthetic pathway when it was unknown for a species. Over the past 15-20 years, the results of such surveys have provided a broad base of the distribution of photosynthetic pathways among different phylogenetic groups and ecological zones (97, 99, 106). Although major photosynthetic groups could clearly be distinguished by their isotopic composition, the results of these early studies also indicated that there was substantial variation in isotopic values at both the interspecific and intraspecific levels, as well as variation associated with different environmental growth conditions and with variation in dry-matter composition. Substantial theoretical and experimental progress has been made over the past ten years in understanding the biochemical, metabolic, and environmental factors contributing to the different isotopic compositions among plants. The major isotope effects of interest are listed in Table 1 and include kinetic discrimination factors associated with diffusion (denoted by a) and enzyme fractionation (denoted by b), as well as equilibrium discrimination factors (denoted bye). We refer to this table as we review the theory and supporting evidence.
C3 Photosynthesis
HIGHER PLANTS Several models have been developed to describe the fractionation of carbon isotopes during C3 photosynthesis (38, 69, 97, 109, 122, 149). The models are similar in structure, each assuming that the major components contributing to the overall fractionation are the differential diffusivities of CO2 containing 12C and 13C across the stomatal pathway and the fractionation by Rubisco. Each of the models suggests additivity of fractionation factors weighted by ,the relative "limitation" or CO2 partial pressure difference imposed by the step involved. Of the models, that of Farquhar et al (38) has been the most extensively developed and tested. Their expression for discrimination in leaves of C3 plants in its simplest form is,
Pa - Pi Pi Pi a + b - == a + (b - a) -, Pa Pa Pa
8.
where a is the fractionation occurring due to diffusion in air (4.4%0, a theoretical value that has not been confirmed experimentally), b is the net fractionation caused by carboxylation (mainly b3, discrimination by Rubisco; see Table I and also Part IV of the Appendix) and Po and Pi are the ambient and intercellular partial pressures of CO2, respectively. Equation 8 is derived in Part II of the Appendix; see also reference 5.
Ann
u. R
ev. P
lant
. Phy
siol
. Pla
nt. M
ol. B
iol.
1989
.40:
503-
537.
Dow
nloa
ded
from
ww
w.a
nnua
lrev
iew
s.or
gby
Uni
vers
ity o
f A
rizo
na L
ibra
ry o
n 02
/07/
11. F
or p
erso
nal u
se o
nly.
510 FARQUHAR E T AL
Table 1 Isotope effects of steps leading to CO2 fixatiun in plants.
J sotope effect Discrimination Process (0') (%0) Symbol Reference
Diffusion of CO2 in air through 1.0044 4.4 a Craig (16)
the stomatal pore" Diffusion of CO2 in air through 1.0029 2.9 ab Farquhar (33)
the boundary layer to the stomata"
Diffusion of dissolved CO2 1.0007 0.7 a, O'Leary (98)
through water Net C3 fixation with respect 1.027 27 b Farquhar & Richards
to Pi Fixation of gaseous CO2 by 1.030 (pH = 8) 30 b3
(39)
Roeske & O'Leary (119)b
Rubisco from higher plants 1.029 (pH = 8.5) 20 b3 Guy et al (SO) Fixation of HCO) by PEP 1.0020 2.0 bt O'Leary et al (101)
carboxylase 1.0020 2.0 Reibach & Benedict (117)
Fixation of gaseous CO2 (in equi- 0.9943 -5.7 b4 Farquhar (33)
librium with HC03' at 25°C) by PEP carboxylase
Equilibrium hydration of CO2 0.991 -9.0 eb Emrich et al (31)
at 25°C 0.991 -9.0 Mook et al (91)
Equilibrium dissolution of CO2 1.0011 l.l . es Mook et al (91)
into water 1.0011 l.l O'Leary (98)
a Theoretical value b Data corrected for dissolution of CO2
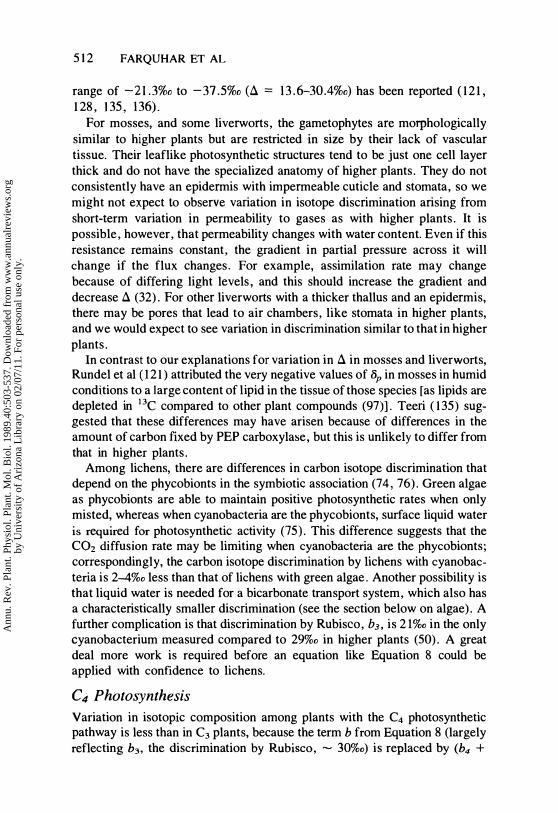
The significance of Equation 8 is that when stomatal conductance is small in relation to the capacity for CO2 fixation, Pi is small and A tends towards 4.4%0 (see Figure 1). Conversely, when conductance is comparatively large,
Pi approaches Pa and A approaches b (perhaps 27-30%0; see Appendix Part IV). Nevertheless, it is a little dangerous to take the argument further and say that when Pi and A are small, stomata are necessarily limiting photosynthesis. That conclusion would only follow if the relationship between assimilation rate, A, and Pi remained linear beyond the operational point (40).
There are several cases where measurements of both .:l and p;lPa have been made in controlled conditions. Farquhar et al (35) found a significant correlation between A in dry matter and discrete measurements of p;lPa among different species over the range of p;lPa 0.3-0.85. The best fit, taking a as 4.4%0, was observed with a value for b of 27%0. The leaf with the lowest p;lPa was from an Avicennia marina plant, which showed discrimination of 11.8%0. Such low values of A had previously been considered to be in the range of C4 plants. Downton et aI (using spinach; 21) and Seemann & Critchley (using beans; 124) also observed significant correlations between A in dry matter and
P;/Pa, the best fit being obtained by setting b equal to 28.5%0 and 26.4%0,
Ann
u. R
ev. P
lant
. Phy
siol
. Pla
nt. M
ol. B
iol.
1989
.40:
503-
537.
Dow
nloa
ded
from
ww
w.a
nnua
lrev
iew
s.or
gby
Uni
vers
ity o
f A
rizo
na L
ibra
ry o
n 02
/07/
11. F
or p
erso
nal u
se o
nly.

c o .� c 'E ·c u (/) (5
30
20
10
4
o
•
o 0.2
CARBON ISOTOPE DISCRIMINATION 51 1
o 000 0
0.4 0.6
Pi / Pa (bar / bar)
o
0.8 1.0
Figure 1 Carbon isotope discrimination, �, versus the ratio of intercellular and ambient partial
pressures of CO2, p/Pao when all are measured simultaneously in a gas exchange system (36). The line drawn is Equation 8 with a = 4.4%0 and b = 27%0.
respectively. However, it should be noted that in none of the above studies
was 6a directly measured. Winter (155) showed that both � and P/Pa ofleaves became smaller as Cicer arietinum plants were water stressed. Conversely, Bradford et al (9) showed that both were greater in a tomato mutant lacking abscisic acid (ABA) than in its isogenic parent. Phenotypic reversion of � and
P/Pa occurred when the mutant was sprayed with ABA during its growth. Measurements of mistletoes and their hosts (25, 30) showed interspecific variation in both � and P/Pa- Guy et al (52) found that increased salinity decreased � in Puccinellia and P/Pa as expected from theory. Over the short term, Brugnoli et al (II) showed that the assimilation-weighted value of P/Pa and � of sugar produced by a leaf in a single day followed the predicted theoretical relationship (Equation 8) with a fitted value for a of 4. 1 %0 and for b of 24-25.5%0. The overall discrimination to starch appeared to be slightly smaller. In all of the above cases, �, inferred from the carbon composition of leaf material, and p;lPa were positively correlated. The values of b that gave the best fit showed variation, which could have many causes (see Part IV of the Appendix for further elaboration).
NONVASCULAR PLANTS Surveys of isotopic composition have been made on species of mosses, liverworts, and lichens. Isotope ratio variation in the
Ann
u. R
ev. P
lant
. Phy
siol
. Pla
nt. M
ol. B
iol.
1989
.40:
503-
537.
Dow
nloa
ded
from
ww
w.a
nnua
lrev
iew
s.or
gby
Uni
vers
ity o
f A
rizo
na L
ibra
ry o
n 02
/07/
11. F
or p
erso
nal u
se o
nly.
512 FARQUHAR ET AL
range of -21 .3%0 to -37.5%0 (A == 13 .6-30 .4%0) has been reported ( 1 2 1 , 1 28, 135, 136).
For mosses, and some liverworts, the gametophytes are morphologically similar to higher plants but are restricted in size by their lack of vascular tissue. Their leaflike photosynthetic structures tend to be just one cell layer thick and do not have the specialized anatomy of higher plants. They do not consistently have an epidermis with impermeable cuticle and stomata, so we might not expect to observe variation in isotope discrimination arising from short-term variation in permeability to gases as with higher plants. It is possible, however, that permeability changes with water content. Even if this resistance remains constant, the gradient in partial pressure across it will change if the flux changes. For example, assimilation rate may change because of differing light levels, and this should increase the gradient and decrease A (32). For other liverworts with a thicker thallus and an epidermis, there may be pores that lead to air chambers, like stomata in higher plants, and we would expect to see variation in discrimination similar to that in higher plants.
In contrast to our explanations for variation in A in mosses and liverworts, Rundel et al ( 1 2 1 ) attributed the very negative values of [jp in mosses in humid conditions to a large content of lipid in the tissue of those species [as lipids are depleted in 13C compared to other plant compounds (97)]. Teeri ( 135) suggested that these differences may have arisen because of differences in the amount of carbon fixed by PEP carboxylase, but this is unlikely to differ from that in higher plants.
Among lichens, there are differences in carbon isotope discrimination that depend on the phycobionts in the symbiotic association (74, 76). Green algae as phycobionts are able to maintain positive photosynthetic rates when only misted, whereas when cyanobacteria are the phycobionts, surface liquid water is required for photosynthetic activity (75). This difference suggests that the CO2 diffusion rate may be limiting when cyanobacteria are the phycobionts; correspondingly, the carbon isotope discrimination by lichens with cyanobacteria is 2-4%0 less than that of lichens with green algae . Another possibility is that liquid water is needed for a bicarbonate transport system, which also has a characteristically smaller discrimination (see the section below on algae). A further complication is that discrimination by Rubisco, b3, is 2 1%0 in the only cyanobacterium measured compared to 29%0 in higher plants (50). A great deal more work is required before an equation like Equation 8 could be applied with confidence to lichens.
Ci Photosynthesis Variation in isotopic composition among plants with the C4 photosynthetic pathway is less than in C3 plants, because the term b from Equation 8 (largely reflecting b3, the discrimination by Rubisco, � 30%0) is replaced by (b4 +
Ann
u. R
ev. P
lant
. Phy
siol
. Pla
nt. M
ol. B
iol.
1989
.40:
503-
537.
Dow
nloa
ded
from
ww
w.a
nnua
lrev
iew
s.or
gby
Uni
vers
ity o
f A
rizo
na L
ibra
ry o
n 02
/07/
11. F
or p
erso
nal u
se o
nly.

CARBON ISOTOPE DISCRIMINATION 513
b3cfJ) which is numerically much smaller than b3. This is because b4 (the effective discrimination by PEP carboxylase) is - -5.7%0 (see Table 1) and cfJ [the proportion of the carbon fixed by PEP carboxylation that subsequently leaks out of the bundle sheath, thereby allowing limited expression of Rubisco discrimination (b3)] is necessarily less than unity (33). The bases for this model of discrimination are as follows: CO2 d�ffuses through stomata to the mesophyll cells, where it dissolves (es) and is converted to HCOi (eb) ' At equilibrium, the heavier isotope concentrates in HCOi compared to gaseous CO2-i . e . the combined terms es + eb are negative (Table 1). In tum, PEP carboxylase discriminates against H13CO; -Le. bJ is positive and normal for a kinetic effect. Thus if the gaseous intercellular CO2 is in equilibrium with HCO;, then the net discrimination from CO2 to OAA is
9.
which is negative because of the magnitude of eb' Various transformations then occur, depending on C4 subtype, but the net result in all cases is that CO2 is released within the bundle sheath cells and refixed by Rubisco. There is little opportunity for discrimination in the release of CO2 in the bundle sheath cells because of the lack of significant biochemical branches. No further discrimination would occur if the bundle sheath were gas tight (153). However, some quantities of CO2 and HCO; are likely to leak out of these cells and into the mesophyll cells, especially through the apoplastic portions of the bundle sheath cells, where they can then mix with other CO2 that has diffused in through the stomata. The leak is a branch from the main path of carbon and allows some discrimination by Rubisco in the bundle sheath cells (b3).
Various models (18,33,56, 110, 1 17) have addressed aspects of the 13C discrimination during C4 photosynthetic metabolism. Intrinsic to all of these models is the notion that variation in isotopic composition in C4 plants is associated with leakage of CO2 and/or HCO;. The "leakiness" (cfJ) may also be regarded as a measure of the "overcycling" by PEP carboxylase that occurs in mesophyU cells, raising the partial pressure of CO2 within the bundle sheath cells (33).
Farquhar (33) developed an expression for the discrimination occurring in C4 photosynthesis, in which
P - P p' P 11 = a a i + (b4 + b3cfJ) -' = a + (b4 + bA> - a) -' . 10. Pa Pa Pa
Depending whether (b4 + b3cfJ - a) is positive, zero, or negative, the dependence of 11 on p;lPa will be positive, zero, or negative. Experimental evidence suggests that the factor is often close to zero, with short-term
Ann
u. R
ev. P
lant
. Phy
siol
. Pla
nt. M
ol. B
iol.
1989
.40:
503-
537.
Dow
nloa
ded
from
ww
w.a
nnua
lrev
iew
s.or
gby
Uni
vers
ity o
f A
rizo
na L
ibra
ry o
n 02
/07/
11. F
or p
erso
nal u
se o
nly.
514 FARQUHAR ET AL
discrimination responding little to variation in p;lPa (32,36, and see Figure 1). From Table 1 it may be seen that the zero value is obtained with cP = 0.34.
Farquhar (33) and Hattersley (56), using the Farquhar model, predicted that bundle sheath "leakiness" above cP = 0.37 (the value differs from 0.34
because a smaller value was assumed for b3) should result in a positive response of .:l to increasing P/Pa' Anatomical variations between C4 types (55) may be associated with variations in cPo For example, Ehleringer & Pearcy (29) observed that quantum yields for CO2 uptake are lower for all C4 dicots and NAD-ME (malic enzyme) C4 type grasses than for NADP-ME or PCK (phosphoenolpyruvate carboxykinase) types, which have bundle sheaths with suberized lamellae (12, 57). Diminished quantum yields are to be expected as a result of increased leakiness-i.e. increased overcycling within the mesophyll cells. The measured differences in carbon isotope discrimination by NAD-ME, NADP-ME, and PCK type C4 grasses as deduced from isotopic composition (10, 56, 150, 163) and from "on-line" measurements (32, 36) are consistent with the expectation that leakage is greatest in the first type. Because cP is a measure of the overcycling as a proportion of the rate of PEP carboxylation , it is likely that � will increase whenever Rubisco activity is diminished more than PEP carboxylase activity by some treatment. Thus cP and .:l depend as much on coordination of mesophyU and bundle sheath activity as on anatomical features.
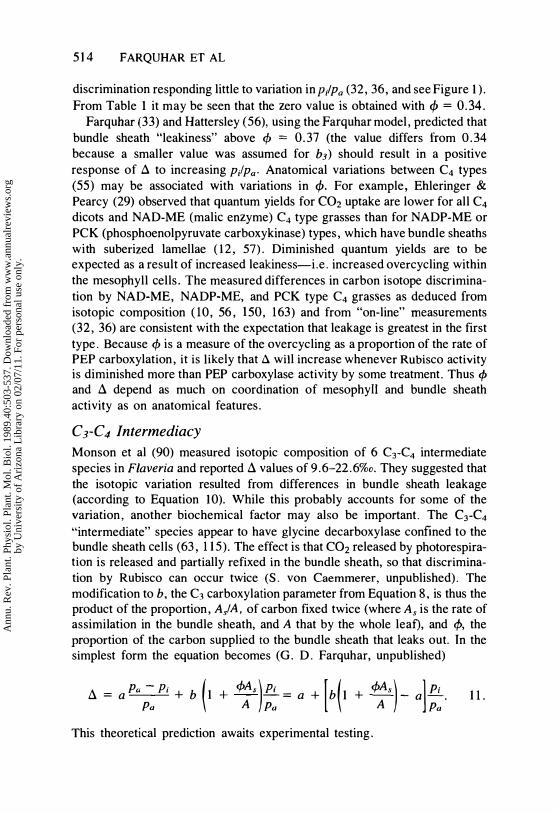
C 3-C4 Intermediacy Monson et al (90) measured isotopic composition of 6 C3-C4 intermediate species in Flaveria and reported .:l values of 9.6-22.6%0. They suggested that the isotopic variation resulted from differences in bundle sheath leakage (according to Equation 10). While this probably accounts for some of the variation, another biochemical factor may also be important. The C3-C4 "intermediate" species appear to have glycine decarboxylase confined to the bundle sheath cells (63, 115). The effect is that CO2 released by photorespiration is released and partially refixed in the bundle sheath, so that discrimination by Rubisco can occur twice (S. von Caemmerer, unpublished). The modification to b, the C3 carboxylation parameter from Equation 8, is thus the product of the proportion , A/A, of carbon fixed twice (where As is the rate of assimilation in the bundle sheath, and A that by the whole leaf), and cp, the proportion of the carbon supplied to the bundle sheath that leaks out. In the simplest form the equation becomes (G. D . Farquhar, unpublished)
.:l = aPu - Pi + b (1 + CPAs ).Ei. = a + [b (1 + CPAs ) _ a].Ei.. 11. � A � A �
This theoretical prediction awaits experimental testing.
Ann
u. R
ev. P
lant
. Phy
siol
. Pla
nt. M
ol. B
iol.
1989
.40:
503-
537.
Dow
nloa
ded
from
ww
w.a
nnua
lrev
iew
s.or
gby
Uni
vers
ity o
f A
rizo
na L
ibra
ry o
n 02
/07/
11. F
or p
erso
nal u
se o
nly.

CARBON ISOTOPE DISCRIMINATION 515
Crassulacean Acid Metabolism
The details of Crassulacean acid metabolism (CAM) that affect a have been recently reviewed by O'Leary (99). In this section, we present equations for a analogous to those discussed earlier for C3 and C4 carbon assimilation pathways. Plants in the full CAM mode take up CO2 and synthesize oxaloacetate using PEP carboxylase, and the oxaloacetate (OAA) is then reduced and stored as malate ( 1 03). At dawn the plants close their stomata and decarboxylate the malate, refixing the released CO2 using Rubisco. The malate that is stored at night will show the same discrimination as for C4 species with zero leakage (33), i.e.
p. a = a + (b4 - a) -' . Pa
12.
Winter (154) reported that nocturnal values of P/Pa in Kalanchoe pinnata started at a C4-like value (� 0.4) and increased with time to a C3-like value (- 0.7) before dawn. On this basis, we could expect instantaneous a of the carbon being fixed to have decreased from � 0 . 4 to -2.7%0 as the night progressed. This is consistent with observations that a of crystalline oxalate and of carbon-4 of malic acid were near to zero (58, 100).
If the stomata closed completely at dawn, the photosynthetic tissue would form a closed system and there would be no fractionation of the carbon between malate and the sugar products. However, consider the case where the stomata were not closed in the light while a CAM plant was enclosed in a cuvette with no external CO2, In this case, there should be a discrimination in going from malate to the new C3 carbon because we no longer have a closed system. The discrimination is given by cp(b3 - a), where cp is the proportion of decarboxylated carbon that leaks out of the leaf. Nalborczyk (94) allowed CAM plants to fix CO2 only at night and found that the overall discrimination was � 3%0. This result implies that cp was about 0.05-0.15. However, when CAM plants are growing in normal air, evolution of CO2 in the light is usually negligible.
Toward the end of the light period, after decarboxylation of all the stored malate, there is sometimes CO2 uptake [denoted phase IV by Osmond ( 1 03)] via Rubisco, and possibly involving PEP carboxylase as well. Nalborczyk et al (95) allowed plants to fix carbon only in the light and observed a discrimination of 21 %0, which is what one would expect with a typical C3 value of p;lPa in Equation 8.
Therefore in the simplest case of C4 fixation in the dark and C3 fixation in the light, the average discrimination over a 24 hr period is
Ann
u. R
ev. P
lant
. Phy
siol
. Pla
nt. M
ol. B
iol.
1989
.40:
503-
537.
Dow
nloa
ded
from
ww
w.a
nnua
lrev
iew
s.or
gby
Uni
vers
ity o
f A
rizo
na L
ibra
ry o
n 02
/07/
11. F
or p
erso
nal u
se o
nly.

516 FARQUHAR ET AL
JD p .
JL p. A(b4 - a) -' dt + A(b - a) -' dt
A = + Po Po I.J. a D L '
J Adt + J Adt 13.
where A is the assimilation rate, fDdt denotes the time integral in the dark, and fLdt that in the light, and b for the light period is the average of b3 and b4 weighted by the rates of RuBP and PEP carboxylation (if the latter occurs), respectively.
Aquatic Plants and Algae Carbon isotope combinations measured in aquatic plants range between - 1 1 %0 and -39%0, potentially leading to the mistaken impression that both C3 and C4 photosynthetic pathways are present in aquatic plants (4 , 22, 105,
1 13, 1 32). However, with limited exceptions (86, 1 47) , C4 plants are not known from aquatic habitats. When CO2 fixation is via the normal C3 pathway, Equation 8 applies, but with the parameter a modified to reflect diffusion in the aqueous phase (es + al) so that
d = (es + aa Pa - Pc + b Pc = e .. + a[ + (b - es - al) Pc, 14. Pa Pa Po
where the equivalent partial pressure of CO2 at the site of carboxylation is denoted as Pc. Note that the discrimination during diffusion of CO2 in water (al) is 0.7%0 (98) and not 11%0 as some authors have written. Much of the diffusion of inorganic carbon in the aqueous environment will be as bicarbonate rather than CO2, but the discrimination here should also be small (38). Note further that the discrimination is with respect to gaseous CO2 in equilibrium with the aqueous environment.
However, there is a widespread mechanism(s) among marine and freshwater organisms for raising the concentration of CO2 at the site of carboxylation above that of the environment (5, 80). Farquhar (33) suggested that the equation for C4 discrimination could be adapted to describe discrimination if the active species transported is bicarbonate as
Pa - Pc Pc tJ. = (es + aD + (es + eb + bm + b3CP)
Pa Pa Pc
= es + at + (eb + bm + b3CP - at) -, Pa
15.
where bm is the fractionation during membrane transport. The value of bm is unknown, but it has been cautiously assumed to be small, making (es + eb +
Ann
u. R
ev. P
lant
. Phy
siol
. Pla
nt. M
ol. B
iol.
1989
.40:
503-
537.
Dow
nloa
ded
from
ww
w.a
nnua
lrev
iew
s.or
gby
Uni
vers
ity o
f A
rizo
na L
ibra
ry o
n 02
/07/
11. F
or p
erso
nal u
se o
nly.

CARBON ISOTOPE DISCRIMINATION 517
bm), which is the analog for b4 from the C4 model, close to -7.9%0 (33). Note that in both Equations 1 4 and 15 the discrimination is again expressed in relation to a gaseous source. As with Equation 14, the discrimination in relation to dissolved CO2 as the source, provided it were in equilibrium with the gas phase, would be found by subtracting es and with reference to bicarbonate (again, if in equilibrium) would be found by subtracting es + eb. However, it is convenient to retain the same convention for source carbon as used for aerial plants (i.e. gaseous CO2), especially when we have chosen gaseous CO2 as our substrate for carboxylation by Rubisco (see definition of b3 in Table 1). The latter choice is also reasonable in a mechanistic sense because the Rubisco site, with RuBP bound, probably reacts with gaseous substrates only.
The effects on a of induction of active carbon accumulation were elegantly demonstrated by Sharkey & Berry (125). The green alga Chlamydomonas reinhardtii was grown at 5% CO2 and then transferred to normal air levels of CO2. Before transfer, a was 27-29%0, and after 4 hr of induction a was 4%0. Sharkey & Berry (125) discussed their results in terms of slightly simplified versions of Equations 14 and 15. Berry (5) noted that measurements of a alone are insufficient to distinguish between a CO2 concentrating mechanism (Equation 15) and a normal C3 mechanism (Equation 14) with a large resistance to diffusion. In both cases, Ll is small because most of the CO2 reaching Rubisco is fixed.
ENVIRONMENTAL EFFECTS ON CARBON ISOTOPE DISCRIMINATION
Goudriaan & van Laar (47), Komer et al (72), and Wong et al (16 1 ) were among the first to note a strong correlation between the photosynthetic rate and leaf conductance. This correlation was maintained over a wide variety of plant species and under a diversity of environmental treatments, implying some level of regulation between CO2 demand by the chloroplasts and CO2 supply by stomatal control. If in fact there were no deviations from the slope of the photosynthesis-versus-conductance relationship and if the intercept were zero (as was the case in the original papers), then the intercellular CO2 pressure (Pi) of all plants would have been constant, dependent only on photosynthetic pathway. This constancy was mistakenly suggested in at least one early review (126). Although a number of studies that followed showed a significant tendency for photosynthesis and conductance to be correlated ( 1 6 1 ), many of these data sets exhibited some deviation from a linear relationship or a nonzero intercept (112, 152). It is unfortunate that in the search for general patterns the variance in Pi was, for a time, ignored. When it was recognized that there was a fundamental relationship between a or lip and Pi'
Ann
u. R
ev. P
lant
. Phy
siol
. Pla
nt. M
ol. B
iol.
1989
.40:
503-
537.
Dow
nloa
ded
from
ww
w.a
nnua
lrev
iew
s.or
gby
Uni
vers
ity o
f A
rizo
na L
ibra
ry o
n 02
/07/
11. F
or p
erso
nal u
se o
nly.

\ 518 FARQUHAR ET AL
more effort was put into documenting and understanding the isotopic variation at both the environmental and genetic (intra- and interspecific) levels. In the next sections, we describe what is known about the relationship between Pi (as measured by isotope discrimination) and environmental parameters.
Light While some of the first experiments reported no consistent pattern between leaf isotopic composition, Sp, and irradiance (129), later studies have indicated that 8p increased with an increase in growth irradiance. Interpretation of carbon isotope composition of leaves experiencing different light levels has been somewhat controversial. The controversy lies in separating the effects of light on discrimination from correlated effects on 8a (source air), both of which affect leaf carbon isotopic composition. In field studies, Vogel (148)
was among the first to describe a consistent pattern of isotopic variation in leaves under canopy conditions where light levels varied substantially. He noted that Sp within a canopy decreased by 3%0 between the top (19 m) and bottom ( 1 m) of the canopy. He further noted that the isotopic composition of soil CO2 was approximately - 19%0, while that of the atmosphere was only -7%0. He attributed all of the decrease in 8p of leaves at lower layers to a recycling of soil CO2 (a lighter source CO2), although the isotopic composition of CO2 within the canopy, 8a, was not measured. He calculated that recycled CO2 accounted for 15% of the carbon incorporated in lower leaf layers-assuming that the physiological discrimination was constant. Medina & Minchin (87) pursued these observations, reporting 8l3C gradients of 4.7 and 5.6%0 between upper and lower canopy leaves for two different tropicalforest types. Again the decrease in S13C of leaves at lower levels was attributed to a lighter source CO2, with the implication that as much as 20% of the carbon fixed in lower leaf layers was derived from soil respiration. A third study by Schleser & layasekera (122) reports a similar pattern for forest beech and isolated lime trees. Again, they attributed this result to recycled soil CO2.
Some recent studies have examined both 8a and 8p. In their study in a huon" pine fores' t, Francey et al (42) observed that 8p decreased with canopy depth, but without 8a decreasing in a corresponding manner, which indicates a physiological effect. They found that leaves from lower in the canopy had greater Pi values than those from the upper canopy, suggesting, according to Equation 8, a greater discrimination in lower leaves. Ehleringer et al (27, 28) observed a similar pattern with ten shrub and tree species from a SUbtropical monsoon forest. Leaf 8p decreased (i.e. became more negative) and Pi increased as observations were made deeper in the canopy. Furthermore, when only outer canopy leaves were measured on plants with differing degrees of canopy closure, 8p was decreased with decreasing irradiance, consistent with the model of increasing Pi at lower light levels. These measurements were
Ann
u. R
ev. P
lant
. Phy
siol
. Pla
nt. M
ol. B
iol.
1989
.40:
503-
537.
Dow
nloa
ded
from
ww
w.a
nnua
lrev
iew
s.or
gby
Uni
vers
ity o
f A
rizo
na L
ibra
ry o
n 02
/07/
11. F
or p
erso
nal u
se o
nly.
CARBON ISOTOPE DISCRIMINATION 519
confirmed with gas exchange observations of the dependence of Pi on irradiance. While it is undoubtedly true that a fraction of the soil CO2 is incorporated within leaves at the lower canopy level, much of the decrease in leaf isotopic composition is likely to be associated with stomatal and photosynthetic effects. Higher Pi values in understory leaves are likely to benefit plant performance when leaves are exposed to higher irradiances during sunflecks and when leaves are allowed to operate at higher quantum yields (71, 107). In the field, effects of irradiance on Pi are difficult to separate from those of leaf-to-air vapor pressure difference (vpd). The smaller vpd at the bottom of the canopy could also cause greater Pi, and greater d (another complication is discussed after Equation A13 in the Appendix). Water
PHYSIOLOGICAL RESPONSE TO DROUGHT When soil moisture levels are decreased, a common response is simultaneous decreases in photosynthesis, transpiration, and leaf conductance (40). If the "supply function" of photosynthesis (leaf conductance) decreases at a faster rate under stress than the "demand function" [photosynthetic dependence on Pi, sensu Farquhar & Sharkey (40)], then Pi will decrease. This effect should be measurable as either an increase in 6p or correspondingly as a decrease in d. Over the short term when new growth has not occurred, the impact of stress can be detected in carbohydrate fractions within leaves (11, 163a, 81). Alternatively, the reduction in P/Pa can be measured using the "on-line" approach (62). In longer-term observations under both growth-chamber and field conditions, plants under water stress induced by low soil moisture availability produced leaves with lower Pi values as estimated by carbon isotopic composition (19, 23, 26, 39, 59-62, 131, 140, 155). Increasing the soil strength (physical resistance to root penetration), such as might occur in drier soils, induces a reduction of d, as observed with reduced soil moisture levels (84).
An increase in the leaf-to-air vapor pressure difference will also cause diminution of Pi and d in the short term (11) and long term (35, 39, 157).
PHOTOSYNTHETIC PATHWAY SWITCHING In response to changes in leaf water status, a number of species show dramatic shifts in carbon isotope composition (up to 10-15%0) associated with changes in photosynthetic metabolism. Thus upon exposure to increased drought, some species can shift from C3 to CAM photosynthesis (8, 54, 67, 78, 137-140, 146, 158). Correspondingly, there is an increase in 8p (decrease in d). This shift in metabolism is reversible, dependent primarily on plant water status, and can occur in both annual and perennial leaf succulents of arid habitats. Other plants, notably "stranglers" of tropical habitats, exhibit CAM metabolism as epiphytic juveniles, but later switch to C3 metabolism when roots reach the soil surface (111, 134, 143).
Ann
u. R
ev. P
lant
. Phy
siol
. Pla
nt. M
ol. B
iol.
1989
.40:
503-
537.
Dow
nloa
ded
from
ww
w.a
nnua
lrev
iew
s.or
gby
Uni
vers
ity o
f A
rizo
na L
ibra
ry o
n 02
/07/
11. F
or p
erso
nal u
se o
nly.

520 FARQUHAR ET AL
PHOTOSYNTHETIC TWIGS AND STEMS In an interesting twist on the photosynthetic-shift theme, at least two stem succulents native to southern Africa exhibit C3 metabolism in the leaves (which are shed early in the drought period) and CAM in the stems (77, 142). In recent studies on green-twig plants from arid lands of North America, high rates of photosynthesis have been observed in twig tissues that are comparable to those observed in leaves ( 1 3 , 24, 104, 1 3 1 ). Unlike the previous example, the twigs of these species all have C3 photosynthesis. In all such species examined to date, Pi values as measured by gas exchange techniques are lower in twig than leaf tissues, leading to a significant difference in carbon isotopic composition of the two tissue types. Thus, in these cases, the decrease in A of the twigs is associated with increased diffusional constraints rather than with a change in metabolic pathway as described in the previous section.
Salinity In nonhalophytic species , increased salinity has numerous metabolic effects (48). Stomatal closure is typically associated with increased salinity (20, 2 1 , 79, 1 24). Thus it should not be surprising to note that in those species A decreased with increasing salinity, indicating a decrease in Pi with increasing stress ( 124). What is perhaps more intriguing is that halophytic species also exhibit a similar pattern whether in field or laboratory conditions (35 , 5 1-53 , 96, 1 63a). Air Pollution A long-term consequence of exposure to air pollutants (e.g . ozone, sulfur dioxide) at the leaf level is normally a decrease in both leaf conductance and photosynthesis ( 1 1 8). It is not clear, however, whether this decrease in gas exchange represents overall decline in metabolic activity or an increased diffusion limitation imposed by stomata. In each of the limited number of studies available that examine carbon isotope discrimination by leaves of plants exposed to pollutants , exposed plants exhibited lower A values, suggesting lower Pi (43, 49, 8 1). Changes in isotopic composition of leaf tissues from these studies of 1 %0 or greater were common even under modest exposures to air pollution. Under long-term, chronic exposure to air pollutants, clear differences exist in the carbon isotope ratios of the wood of annual growth rings that are consistent with short-term,. leaf-level observations (43 , 44, 8 1) .
WATER-USE EFFICIENCY OF C3 SPECIES
Transpiration Efficiency and Carbon Isotope Discrimination
Measurements of A in C3 species may usefully contribute to the selection for transpiration efficiency-i.e. the amount of carbon biomass produced per unit water transpired by the crop.
Ann
u. R
ev. P
lant
. Phy
siol
. Pla
nt. M
ol. B
iol.
1989
.40:
503-
537.
Dow
nloa
ded
from
ww
w.a
nnua
lrev
iew
s.or
gby
Uni
vers
ity o
f A
rizo
na L
ibra
ry o
n 02
/07/
11. F
or p
erso
nal u
se o
nly.

CARBON ISOTOPE DISCRIMINATION 521
The instantaneous ratio of CO2 assimilation rate of a leaf, A, to its transpiration rate, E, is given approximately by
A E
Pa - Pi I .6v '
1 6.
where v is the water vapor pressure difference between the intercellular spaces and the atmosphere. The factor 1 .6 arises because the binary diffusivity of water vapor and air is 1 .6-fold greater than that of CO2 and air. Equation 16 may be rewritten as
A 17. - = E 1 .6v
to emphasize that a smaller value of P/Pa is equivalent to an increase in AlE, for a constant water vapor pressure difference, v. Thus selecting for lower P/Pa should be, to a first approximation, a screen for greater AlE, which, in tum, is a component of transpiration efficiency. From Equation 8 , Ll may be used as a surrogate measure of p/Pu in C3 plants .
In all of the experiments relating gas exchange properties and short- and long-term discrimination (see the section above on C3 photosynthesis) and where vapor pressure difference, v, was maintained constant, the ratio of assimilation and transpiration rates, AlE, was negatively related to Ll, as expected from Equation 1 7 . However, during whole-plant growth, losses of carbon and water occur that are not included in Equation 1 7. A proportion, cPe, of the carbon fixed via the stomata during the day is lost from the shoot at night or from nonphotosynthetic organs such as the roots, during both the day and night. Further, some water is lost from the plant independently of CO2 uptake. The stomata may not be completely closed at night, cuticular water loss occurs, and there is unavoidable evaporative loss from the pots in whole-plant experiments. If this "unproductive" water loss is a proportion, cPw. of "productive" water loss, Equation 1 7 may be modified to describe the molar ratio, W, of carbon gain by a plant to water loss
Pa (1 - ;J( 1 - cPc) W := --------
1 . 61'(1 + o/w) 1 8.
which, when combined with Equation 8, predicts a negative linear dependence of W on Ll (38, 60). By substitution, Equation 1 8 can be rewritten as
Ann
u. R
ev. P
lant
. Phy
siol
. Pla
nt. M
ol. B
iol.
1989
.40:
503-
537.
Dow
nloa
ded
from
ww
w.a
nnua
lrev
iew
s.or
gby
Uni
vers
ity o
f A
rizo
na L
ibra
ry o
n 02
/07/
11. F
or p
erso
nal u
se o
nly.
522
W =
FARQUHAR ET AL
(b - d - d) Pa b _ a ( 1 - �J
1 .6v(1 + �w) 19.
where d is a correction related to assimilation rate (see Part III of the Appendix). The data from pot experiments using a combination of watering treatments and genotypes fit the theory reasonably well for a number of species-wheat (39 , 84) , peanuts (61, 62 , 162) , cotton (59), tomato (83), and barley (60) . We suggest that future studies will provide better understanding of the relationships between W and d when account is taken of environmental and genetic effects on �c and �w· Scaling from the Plant to the Canopy Water-use efficiency is difficult to measure in the field. There have, however, been a few attempts to . relate it to d, or at least to relate yield under water-limited conditions to d. Wright et al ( 162) measured total above-ground biomass yield and water use of eight peanut genotypes receiving adequate water (under a rain-excluding shelter) . They obtained a negative relationship between W and leaf �.
There are several reasons why the negative relationship between W and d, given by Equation 19, might work well for individual plants in pots , or even for small plots in the field, but become inconsistent over larger areas . The uncontrolled loss of water is not an independent, fixed proportion (�w) of transpiration because, for example, soil evaporation tends to be negatively related to leaf area development. If v fluctuates, then those genotypes that might grow more when v is small will obtain a greater W for the same �.
Equation 19 also contains a simplification that becomes more problematic
with increase of scale. The equation is written as if the vapor pressure difference, v, were an independent variable. To some extent, however, it must vary as stomatal conductance , gs, changes (as is the case for a single leaf) . A reduction in 8s, and therefore in E, means more heat has to be lost by sensible heat transfer. The presence of a leaf boundary layer resistance to the transfer of heat translates this into an increase of leaf temperature and of v and so the effect of decreased gs on E is moderated. This moderating effect increases as the ratio of boundary layer resistance to stomatal resistance increases . With a sufficiently high ratio, the proportional reduction in E caused by partial stomatal closure is no greater than the associated proportional reduction in A . Farquhar et al (36) discussed the above problems and defined the conditions that would be necessary for AlE to become independent of stomatal conductance, p;lPa and �.
The problem is exacerbated in the field, where the aerodynamic resistance of the crop has to be taken into account. If the canopy and leaf boundary layer
Ann
u. R
ev. P
lant
. Phy
siol
. Pla
nt. M
ol. B
iol.
1989
.40:
503-
537.
Dow
nloa
ded
from
ww
w.a
nnua
lrev
iew
s.or
gby
Uni
vers
ity o
f A
rizo
na L
ibra
ry o
n 02
/07/
11. F
or p
erso
nal u
se o
nly.

CARBON ISOTOPE DISCRIMINATION 523
resistances to heat are very large, there is the possibility that a genotype with a greater stomatal conductance than another otherwise identical genotype will have a greater value of W ( 15), despite also having a greater 6. (36) . This is more likely to occur at high temperatures. On the other hand, it is less likely to occur when crops have very small leaf area indexes, as would nonnally be the case under conditions where stress occurs early, and in crops sown in areas prone to severe, early water stress , because under these conditions the crop is more closely "coupled" to the atmosphere, like an isolated plant ( 15 ,
66). I f the source o f variation in 6. i s the capacity for photosynthesis, the effects of boundary layers are unimportant (15). This appears to be the case for peanuts (62). Therefore at the crop level, identification of the causes underlying differences in 6. may become important--differences in conductance having different micrometeorological consequences from differences in photosynthetic capacity .
Carbon Isotope Discrimination and Plant Growth Characteristics Hubick et al (62) found a negative relationship between dry matter production and d of peanut cultivars grown in field trials. On the other hand Condon et al ( 14) saw a positive relationship between yield and A for wheat cultivars in two years that included periods of greater than usual rainfall. The sign of the relationship under well-watered conditions is difficult to predict. It is clear that any associations between 6. and patterns of carbon partitioning will be important. The relative growth rate , r (sec- I ) , of a plant depends on the assimilation rate per unit leaf area, A (mol C m -2 sec - I) , and the ratio of total plant carbon to leaf area, p (mol C m-2), according to the following identity (84)
r = 20.
where I is the photoperiod as a proportion of a day. Masle & Passioura (85) observed that wheat seedlings grew more slowly in soil of increased strength than in controls. MasIe & Farquhar (84) showed that p increased with increasing soil strength . They also found that 6. decreased with increasing soil strength. Changing soil strength thus induced a negative relationship between p and d. They noted that a similar, negative, but genetic association between p and .:1 would tend to cause a positive relationship between growth rate and d . A negative association between p and d has been observed among wheat and sunflower genotypes during early growth (J. Virgona, personal communication) . If v is low early in the life of a crop, then a positive association between d and relative growth rate among genotypes will confound the relationship between final W and 6..
Ann
u. R
ev. P
lant
. Phy
siol
. Pla
nt. M
ol. B
iol.
1989
.40:
503-
537.
Dow
nloa
ded
from
ww
w.a
nnua
lrev
iew
s.or
gby
Uni
vers
ity o
f A
rizo
na L
ibra
ry o
n 02
/07/
11. F
or p
erso
nal u
se o
nly.

524 FARQUHAR ET AL
Genetic Control of Discrimination Genetic studies of W, p;lPa , and a are in their infancy. These traits are most likely to be polygenic , since any gene that affects either assimilation rate per unit leaf area or stomatal conductance can have an effect. Despite the considerable genetic and environmental (nutrition, light intensity, etc) effects on the individual components A and g, separately , it is likely that the variation in the ratio A/g, and hence in p;lPa and �, is smaller, because of coordination between A and g (37). The coordination can lead to predictable genotypic differences in p;lPa and � as assessed from gas exchange (62) , as well as in � assessed from op.
The genetic control of � appears to be strong in wheat. Condon et al (14)
showed that genotypic ranking was maintained at different sites and between plants grown in pots and in the field. The broad sense heritabilities [proportion of total variance of � that can be ascribed to genotype, rather than to environment or to interactions between the two (G X E)] ranged between 60
and 90% . From analyses of � in 16 peanut genotypes grown at 1 0 sites in Queensland, Hubick et al (62) calculated an overall broad sense heritability of 8 1 %. With Phaseolus vulgaris in Colombia, it was 71 % (23). Hubick et al (62; and see earlier discussion in reference 36) examined the progeny of a cross between Tifton 8, a peanut genotype having a small value of a, and Chico, which has a large value of �. Statistical analyses of measurements of A and W in the F2 generation gave estimates for the heritability of 53% for � and 34% for W. The phenotypic correlation between W and � was -0.78. As expected, the � values of F2 plants were highly variable and there were several transgressive segregants with values of � lower than those of Tifton 8 .
The � values of the FI generation of the Tifton 8 and Chico cross , while somewhat intermediate between the two parents, were very close to those of Tifton 8 in � and W. Martin & Thorstenson (83) examined the F I plants from a cross between Lycopersicon pennellii, a drought-tolerant species related to tomato, with tomato itself, Lycopersicon esculentum. L . pennellii had a lower � than L. esculentum, and again � of the FI was intermediate, but closer to the low-� parent. Both sets of data suggest some dominance of the low-� attribute.
Genetic analysis of a polygenic trait like � is obviously difficult, yet considerable progress has recently been made using modem techniques. Martin et al (82) reported that 70% of the variance for a in a variable tomato population derived from further generations of the above cross was associated with three restriction fragment length polymorphisms (RFLPs)-i.e . genetic markers identifying discrete DNA sequences within the genome. Additive gene action was observed in the three cases, and in one of them, there was also a significant nonadditive component. This kind of work may enable breeders to follow the results of backcrossing material with desirable a into
Ann
u. R
ev. P
lant
. Phy
siol
. Pla
nt. M
ol. B
iol.
1989
.40:
503-
537.
Dow
nloa
ded
from
ww
w.a
nnua
lrev
iew
s.or
gby
Uni
vers
ity o
f A
rizo
na L
ibra
ry o
n 02
/07/
11. F
or p
erso
nal u
se o
nly.

CARBON ISOTOPE DISCRIMINATION 525
commercial cultivars. However, in parallel with pursuing research on the genetic control of carbon isotope discrimination by the plant, it is important to establish what values of 6. are appropriate in a particular environment and for a particular species . This requires extensive physiological work at different scales, from the organelle to the canopy, and a much better understanding of the interactions among plants , canopies , and their microclimates .
CONCLUDING REMARKS
Carbon isotope discrimination has become a tool to help us understand photosynthesis and its coordination with water use in ecological and physiological studies of C3 species. Future work will relate these more to growth characteristics and will differentiate between effects of photosynthetic capacity and stomatal conductance. The latter may perhaps be studied using observations of isotopic composition of organic oxygen and hydrogen (36). These compositions are affected by the ratio of ambient and intercellular humidities and should therefore reflect changes in the energy budgets of leaves, which are themselves influenced by stomatal conductance.
It is possible that measurements of 6. in C4 species may aid in seeking changes in coordination between mesophyll and bundle sheath tissue during photosynthesis, perhaps revealing differences in quantum requirements .
Technological advances in combining gas chromatography and isotope ratio mass spectrometry should facilitate measurements of carbon isotope discrimination between and within organic compounds , thereby increasing our ability to identify origins of materials and to study the nature of the control of metabolic pathways following photosynthesis.
ACKNOWLEDGMENTS
We thank Drs. Joe Berry and Josette Masle for valuable discussions and comments on this manuscript.
ApPENDIX
Part I. Definitions Isotope effects (a) are here defined as the ratio of carbon isotope ratios in reactant and product (39)
Rr a =
R ' p AI .
where Rr is the !3C/12C molar ratio of reactant and Rp is that of the product. In a first order kinetic reaction, the definition is obvious, i .e.
Ann
u. R
ev. P
lant
. Phy
siol
. Pla
nt. M
ol. B
iol.
1989
.40:
503-
537.
Dow
nloa
ded
from
ww
w.a
nnua
lrev
iew
s.or
gby
Uni
vers
ity o
f A
rizo
na L
ibra
ry o
n 02
/07/
11. F
or p
erso
nal u
se o
nly.
526 FARQUHAR ET AL
k1 2 a = k13 '
A2.
where k12 and k13 are the rate constants for reactions of the respective isotopic substances . Higher-order kinetic reactions including Michaelis-Menten ones (38) can be treated similarly ( 102) , and k12 and k13 become pseudo-first-order rate constants. The isotope effect associated with diffusion is the ratio of the 12C and I 3C diffusivities. The analogy with Equation A l is the diffusion from a source (reactant) to a sink where the "product" is kept at a vanishingly small concentration . In an equilibrium, the "product" is the carbon-containing compound of interest on the right-hand side of an equilibrium reaction. So if the reaction of interest is
kJ A ==:;; B, A3.
L J where A and B might be CO2 and HCO; , for example, then application of this rule yields
A I 3
AI 2 K12 a
B I3 K 1
3 '
B I2
where K '2 is the equilibrium constant,
kl2 K' 2 == -' -
k12 ' - I
A4.
AS .
for the 1 2C compounds and K I 3 is the analogous constant for 13
C compounds. Note that the equilibrium isotope effect, a , is the kinetic isotope effect for the forward reaction (al) divided by that of the reverse reaction (a_ I )-Le.
[�] kI3 - I
A6.
It is pleasing then that the forms of the isotope effect (a) for kinetic effects (kI 2tkI3) and equilibrium effects (KI2/KI
3) are superficially similar. We de
note the discrimination for either effect as a minus one (39) . In most cases
Ann
u. R
ev. P
lant
. Phy
siol
. Pla
nt. M
ol. B
iol.
1989
.40:
503-
537.
Dow
nloa
ded
from
ww
w.a
nnua
lrev
iew
s.or
gby
Uni
vers
ity o
f A
rizo
na L
ibra
ry o
n 02
/07/
11. F
or p
erso
nal u
se o
nly.
CARBON ISOTOPE DISCRIMINATION 527
discrimination associated with a kinetic effect will be positive, but there is no a priori reason why a thermodynamic discrimination should be positive.
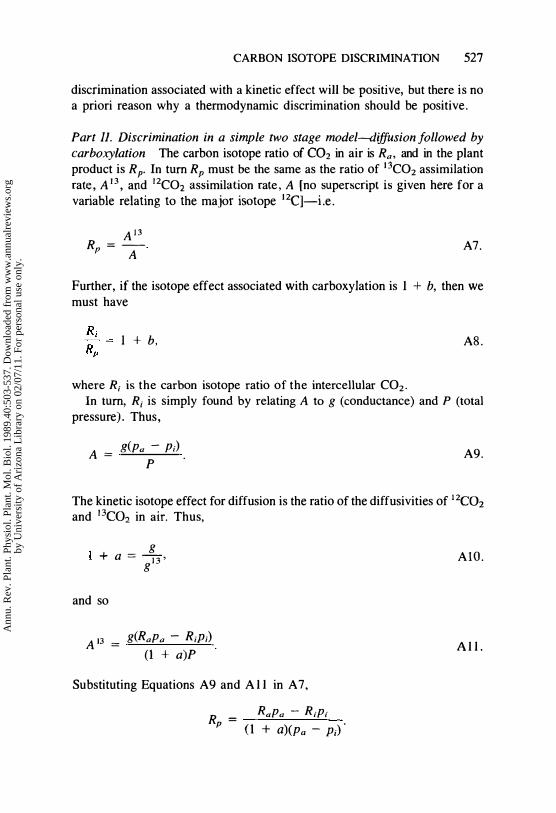
Part II. Discrimination in a simple two stage model-diffusion followed by carboxylation The carbon isotope ratio of e02 in air is Ra. and in the plant product is Rp. In turn Rp must be the same as the ratio of 1 3C02 assimilation rate, A J3, and 12C02 assimilation rate , A [no superscript is given here for a variable relating to the major isotope 12C]-Le.
A I3 R =
p A A7.
Further, if the isotope effect associated with carboxylation is 1 + b, then we must have
I + b, AS.
where Ri is the carbon isotope ratio of the intercellular CO2. In turn, Ri is simply found by relating A to g (conductance) and P (total
pressure) . Thus,
A = g(Pa - p;) . A9.
P
The kinetic isotope effect for diffusion is the ratio of the diffusivities of 12eo2 and l3eo2 in air. Thus,
g + a = -"0'
g
and so
A 13 = g(RaPa - R;Pi) (1 + a)P
Substituting Equations A9 and A l l in A7,
R = RaPa - RiPi p
( 1 + a)(Pa - Pi) '
AlO.
A l l .
Ann
u. R
ev. P
lant
. Phy
siol
. Pla
nt. M
ol. B
iol.
1989
.40:
503-
537.
Dow
nloa
ded
from
ww
w.a
nnua
lrev
iew
s.or
gby
Uni
vers
ity o
f A
rizo
na L
ibra
ry o
n 02
/07/
11. F
or p
erso
nal u
se o
nly.

528 FARQUHAR ET AL
Rearranging,
R P - p . R · p . ---.!!.. = ( 1 + a) a
' + -' -' . Rp Pa Rp Pa
Thus, using the definition of discrimination and Equation A8
a = l + A ( 1 + a) Pa - Pi
+ ( 1 + b) �.
Thus
A = a Pa - Pi + b .!!.i.-Pa Pa
'
Pa Pa
which is Equation 8 from the !llain text. Note that no assumption of linearity is made about the response of A to Pi in the derivation of this equation.
Part III. Alternative definitions of discrimination There are other possible definitions of discrimination. For example one could write
D· . . . * 1 Rp IscnmmatlOn = - -Ra
This would correspond to ( 1 - k13/kI2) for kinetic effects and to ( 1 -K13/K12) for equilibrium effects. The asterisk superscript is added to emphasize that the numerical values obtained differ from those made using Equation 4. On this basis
The numerical differences between this and our chosen definition of discrimination are usually less than 0.5%0. In the case of discrimination by ribulose bisphosphate carboxylase (Rubisco), the two definitions differ by � 0.9%0, which is significant. However, formulation of discrimination as A* rather than as (RalRp - 1), would make derivation of the theory much more complicated . This may be seen by repeating the derivation in Part II using a* = 1 - g13lg and b* = 1 - RpfRi•
/
Although it may seem odd to have the abundance ratio of the source, Ra, in the numerator of our chosen definition (Equation AI), we note that RaiRp may equally be thought of as SpfSa, where S is the molar ratio l2C/l3e.
Ann
u. R
ev. P
lant
. Phy
siol
. Pla
nt. M
ol. B
iol.
1989
.40:
503-
537.
Dow
nloa
ded
from
ww
w.a
nnua
lrev
iew
s.or
gby
Uni
vers
ity o
f A
rizo
na L
ibra
ry o
n 02
/07/
11. F
or p
erso
nal u
se o
nly.
CARBON ISOTOPE DISCRIMINATION 529
Yet another notation is to use RJRa - 1 , k\3/kI2 - 1 , and K13/K12 - I , which leads to negative values of discrimination.
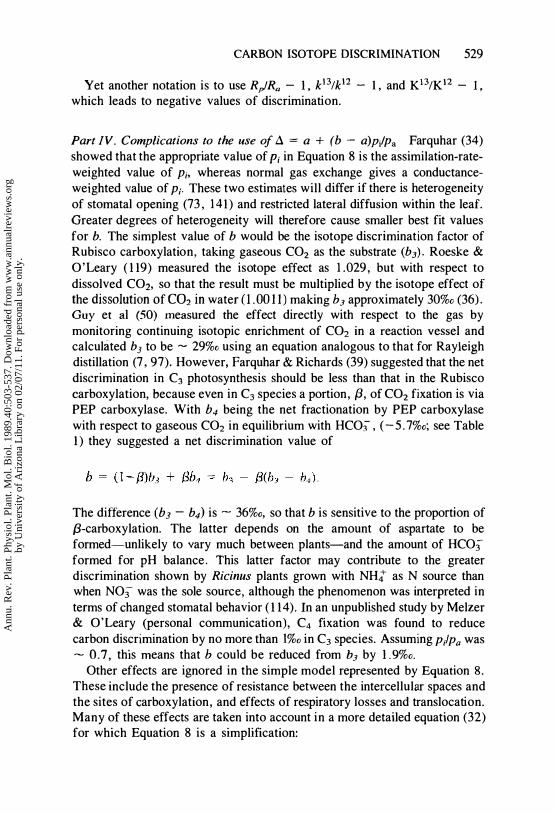
Part IV. Complications to the use of A = a + (b - a)p/Pa Farquhar (34)
showed that the appropriate value of Pi in Equation 8 is the assimilation-rateweighted value of Pi, whereas normal gas exchange gives a conductanceweighted value of Pi- These two estimates will differ if there is heterogeneity of stomatal opening (73 , 141) and restricted lateral diffusion within the leaf. Greater degrees of heterogeneity will therefore cause smaller best fit values for b. The simplest value of b would be the isotope discrimination factor of Rubisco carboxylation, taking gaseous CO2 as the substrate (b3) . Roeske & O'Leary ( 1 19) measured the isotope effect as 1 .029, but with respect to dissolved CO2, so that the result must be multiplied by the isotope effect of the dissolution of e02 in water (1 .00 1 1 ) making h3 approximately 30%0 (36) .
Guy et al (50) measured the effect directly with respect to the gas by monitoring continuing isotopic enrichment of CO2 in a reaction vessel and calculated b3 to be - 29%0 using an equation analogous to that for Rayleigh distillation (7 , 97). However, Farquhar & Richards (39) suggested that the net discrimination in C3 photosynthesis should be less than that in the Rubisco carboxylation, because even in C3 species a portion, {3, of CO2 fixation is via PEP carboxylase. With b4 being the net fractionation by PEP carboxylase with respect to gaseous CO2 in equilibrium with HCO; , ( -5 . 7%0; see Table 1 ) they suggested a net discrimination value of
The difference (b3 - b4) is - 36%0, so that b is sensitive to the proportion of {3-carboxylation. The latter depends on the amount of aspartate to be formed-unlikely to vary much between plants-and the amount of HCO; formed for pH balance . This latter factor may contribute to the greater discrimination shown by Ricinus plants grown with NHt as N source than when NO; was the sole source, although the phenomenon was interpreted in terms of changed stomatal behavior ( 1 14). In an unpublished study by Melzer & O'Leary (personal communication), C4 fixation was found to reduce carbon discrimination by no more than 1%0 in C3 species. Assuming P/Pa was - 0.7, this means that h could be reduced from h3 by 1 .9%0.
Other effects are ignored in the simple model represented by Equation 8.
These include the presence of resistance between the intercellular spaces and the sites of carboxylation, and effects of respiratory losses and translocation. Many of these effects are taken into account in a more detailed equation (32)
for which Equation 8 is a simplification:
Ann
u. R
ev. P
lant
. Phy
siol
. Pla
nt. M
ol. B
iol.
1989
.40:
503-
537.
Dow
nloa
ded
from
ww
w.a
nnua
lrev
iew
s.or
gby
Uni
vers
ity o
f A
rizo
na L
ibra
ry o
n 02
/07/
11. F
or p
erso
nal u
se o
nly.

530 FARQUHAR ET AL
where Ps is the p(C02) at the leaf surface, Pc is the equivalent p(C02) at the sites of carboxylation, ab is the fractionation occurring during diffusion in the boundary layer (2 .9%0) , es is the fractionation occurring as CO2 enters solution [ 1 . 1%0 at 25°C; ( 149)] al is the fractionation due to diffusion in water [0.7%0; (98)] , e and j are fractionations with respect to average carbon composition associated with "dark" respiration (Rd) and photorespiration, respectively, k is the carboxylation efficiency, and r* is the CO2 compensation point in the absence of Rd (32) . Equation 8 overestimates discrimination compared to Equation A12 by
eRd + jr* k
Pa A 1 3 .
The resistances rb and r w (m2 sec mol- 1) are those of the boundary layer, and between the intercellular spaces and the sites of carboxylation, respectively, and P is the atmospheric pressure. Thus Equation 8 should overestimate discrimination at a fixed p/ Pa by an amount (d) that increases with increasing assimilation rate, as may tend to occur naturally with increasing light intensity (32) .
Literature Cited
1 . Amundson, R. G . , Chadwick, O. A. , Sowers, J. M . , Doner, H. E. 1988. Relationship between climate and vegetation and the stable carbon isotope chemistry of soils in the eastern Mohave Desert, Nevada. Quat. Res. In press
2. Bender, M . M. 1968. Mass spectrometric studies of carbon- 1 3 variations in com and other grasses. Radiocarbon 10:468-72
3. Bender, M. M. 197 1 . Variation in the l3C/l2C ratios of plants in relation to the pathway of photosynthetic carbon dioxide fixation. Phytochemistry 10: 1339-44
4. Benedict, C. R. , Wong, W. w. L . , Wong, J . H. H. 1980. Fractionation of the stable isotopes of inorganic carbon by seagrasses. Plant Physiol. 65: 5 1 2-17
5. Berry, J. A. 1 988. Studies of mechanisms affecting the fractionation of carbon isotopes in photosynthesis. In Stable
Isotopes in Ecological Research, ed. P. W. Rundel, J. R. Ehleringer, K . A. Nagy, pp. 82-94. New York: SpringerVerlag
6. Berry, J. A . , Troughton, J. H. 1974. Carbon isotope fractionation by C, and C4 plants in 'closed' and 'open' atmospheres. Carnegie [nst. Wash. Yearb. 73:785-90
7 . Bigeleisen , J . , Wolfsberg, M . 1 958. Theoretical and experimental aspects of isotope effects in chemical kinetics. Adv. Chern. Phys. 1 : 15-76
8. Bloom, A. J . , Troughton, J. H . 1979. High productivity and photosynthetic flexibility in a CAM plant. Oecologia 38:35-43
9 . Bradford, K. J . , Sharkey, T. D . , Farquhar, G. D. 1983. Gas exchange, stomatal behavior, and aI3c values of the flacca tomato mutant in relation to abscisic acid. Plant Physiol. 72:245-50
Ann
u. R
ev. P
lant
. Phy
siol
. Pla
nt. M
ol. B
iol.
1989
.40:
503-
537.
Dow
nloa
ded
from
ww
w.a
nnua
lrev
iew
s.or
gby
Uni
vers
ity o
f A
rizo
na L
ibra
ry o
n 02
/07/
11. F
or p
erso
nal u
se o
nly.

CARBON ISOTOPE DISCRIMINATION 531
1 0 . Brown, W . V . 1977. The Kranz syndrome and its subtypes in grass systematics. Mem. Torr. Bot. Club 23: 1-97
1 1 . Brugnoli, E. , Hubick, K. T. , von Caemmerer, S . , Farquhar, G. D. 1988. Correlation between the carbon isotope discrimination in leaf starch and sugars of C, plants and the ratio of intercellular and atmospheric partial pressures of carbon dioxide. Plant Physiol. 88: 1 4 1 8-24
1 2 . Carolin, R. C . , Jacobs, S. W. L . , Vesk, M. 1973. The structure of the cells of the mesophyU and parenchymatous bundle sheath of the Graminae. Bot. J. Linn. Soc. 66:259-75
1 3 . Comstock, J. P . , Ehleringer, J . R. 1988. Contrasting photosynthetic behavior in leaves and twigs of Hymenoclea salsola, a green-twigged, warm desert shrub. Am. J. Bot. 75: 1 360-70
14. Condon, A. G . , Richards, R. A . , Farquhar, O. D. 1 987. Carbon isotope discrimination is positively correlated with grain yield and dry matter production in field-grown wheat. Crop Sci. 27:996-1001
1 5 . Cowan, I . R. 1988. Stomatal physiology and gas exchange in the field. In Flow and Transport in the Natural Environment, ed. O. T. Denmead. New York: Springer-Verlag. In press
16 . Craig , H. 1954. Carbon-13 in plants and the relationship between carbon- 1 3 and carbon- 14 variations in nature. J. Geol. 62: 1 15-49
17 . Craig, H. 1 957. Isotopic standards for carbon and oxygen and correction factors for mass spectrometric analysis of carbon dioxide. Geochim. Cosmochim. Acta 12: 1 33-49
18 . Deleens, E. , Ferhi, A . , Queiroz, O. 1 983. Carbon isotope fractionation by plants using the C4 pathway. Physiol. Veg. 2 1 :897-905
19. DeLucia, E. H . , Schlesinger, W. H . , Billings, W . D. 1988. Water relations and the maintenance of Sierran conifers on hydrothermally altered rock. Ecology 69:303-1 1
20. Downton, W. J. S. 1977. Photosynthesis in salt-stressed grapevines. Aust. J. Plant Physiol. 4: 1 83-92
2 1 . Downton, W. J. S . , Grant, W. J. R . , Robinson, S. P. 1985. Photosynthetic and stomatal responses of spinach leaves to salt stress. Plant Physiol. 77:85-88
22. Dunton, K. H. , ScheU, D. M. 1987. Dependence of consumers on macroalgal (Laminaria solidungula) carbon in an arctic kelp community: Sl3C evidence. Marine Bioi. 93:615-25
23. Ehleringer, J. R. 1988. Correlations be-
tween carbon isotope ratio, water-use efficiency and yield. In Research on Drought Tolerance in Common Bean, ed. J. W. White, G. Hoogenboom, F. Ibarra, S. P. Singh, pp. 1 65-91 . Cali, Columbia: CIA T
24. Ehleringer, J. R . , Comstock, J. P . , Cooper, T . A. 1987. Leaf-twig carbon isotope ratio differences in photosynthetic-twig desert shrubs. Oecologia 7 1 :3 1 8-20
25. Ehleringer, J . R . , Cook, C. S . , Tieszen, L. L. 1986, Comparative water use and nitrogen relationships in a mistletoe and its host. Oecologia 68:279-84
26. Ehleringer, J. R . , Cooper, T. A. 1988. Correlations between carbon isotope ratio and microhabitat in desert plants. Oecologia 76:562-66
27. Ehleringer, J. R . , Field, C. B . , Lin, Z. F . , Kuo, C. Y. 1986. Leaf carbon isotope ratio and mineral composition in subtropical plants along an irradiance cline. Oecologia 70:520-26
28. Ehleringer, J. R . , Lin, Z. F. , Field, C. B., Kuo, C. Y . 1987. Leaf carbon isotope ratios of plants from a subtropical monsoon forest. Oecologia 72: 1 09-1 4
2 9 . Ehleringer, J. R . , Pearcy, R. W. 1 983. Variation in quantum yield for CO2 uptake among C, and C4 plants. Plant Physiol. 73:555-59
30. Ehleringer, 1. R . , Schulze, E.-D. , Ziegler, H . , Lange, O. L . , Farquhar, G. D . ; Cowan, I . R. 1985. Xylem-tapping mistletoes: water or nutrient parasites? Science 227 : 1 479-81
3 1 . Emrich, K . , EhhaJt, D. H. , Vogel, J. C. 1970. Carbon isotope fractionation during the precipitation of calcium carbonate. Earth Planet. Sci. Lett. 8:363-71
32. Evans, J. R . , Sharkey, T. D . , Berry, J . A., Farquhar, G. D. 1986. Carbon isotope discrimination measured concurrently with gas exchange to investigate CO2 diffusion in leaves of higher plants. Aust. J. Plant Physiol. 1 3:281-92
33. Farquhar, G. D. 1983. On the nature of carbon isotope discrimination in C4 species. Aust. J. Plant Physiol. 10:205-26
34. Farquhar, G. D. 1 988. Models of integrated photosynthesis of cells and leaves. Phi/os. Trans. R. Soc. Ser. B. In press
35. Farquhar, G. D . , Ball, M. C. , von Caemmerer, S . , Roksandic, Z. 1 982. Effects of salinity and humidity on S13C value of halophytes-evidence for diffusional isotope fractionation determined by the ratio of intercellularl
Ann
u. R
ev. P
lant
. Phy
siol
. Pla
nt. M
ol. B
iol.
1989
.40:
503-
537.
Dow
nloa
ded
from
ww
w.a
nnua
lrev
iew
s.or
gby
Uni
vers
ity o
f A
rizo
na L
ibra
ry o
n 02
/07/
11. F
or p
erso
nal u
se o
nly.
532 FARQUHAR ET AL
atmospheric partial pressure of CO2 under different environmental conditions. Decologia 52: 1 21-24
36. Farquhar, G. D . , Hubick, K. T . , Condon, A. G . , Richards, R. A. 1988 . Carbon isotope fractionation and plant water-use efficiency. In Stable Isotopes in Ecological Research. ed. P. W. Rundel , J . R. Ehleringer, K . A . Nagy, pp. 2 1-40. New York: Springer-Verlag
37. Farquhar, G. D . , Hubick, K. T . , Terashima, I . , Condon, A. G . , Richards, R. A . 1 987. Genetic variation in the relationship bctwecn photosynthetic CO2 assimilation and stomatal conductance to water loss. In Progress in Photosynthesis IV, ed. J. Biggins, pp. 209-12. Dordrecht: Martinus Nijhoff
38. Farquhar, G . D . , O'Leary, M . H . , Berry, J. A. 1982. On the relationship between carbon isotope discrimination and intercellular carbon dioxide concentration in leaves. Aust. J. Plant Physiol. 9 : 1 2 1-37
39. Farquhar, G. D . , Richards, R. A. 1984. Isotopic composition of plant carbon correlates with water-use efficiency of wheat genotypes. Aust. J. Plant Physioi. 1 1 :539-52
40. Farquhar, G. D . , Sharkey, T. D. 1982. Stomatal conductance and photosynthesis. Annu. Rev. Plant Physiol. 33 :3 17-45
4 1 . Francey, R. J. 1985 . Cape Grim isotope measurements-a preliminary assessment. J. Atmos. Chem. 3:247-60
42. Francey, R. J . , Gifford, R . M . , Sharkey, T. D . , Weir, B . 1985. Physiological influences on carbon isotope discrimination in huon pine (Lagastrobos franklinii) . Oecologia 44:241-47
43. Freyer, H. D. 1 979. On the ll13C record in tree rings. Part II. Registration of microenvironmental CO2 and anomalous pollution effect. Tel/us 3 1 :308-12
44. Freyer, H. D. , Belacy, N. 1983 . 13C/'2C records in northern hemispheric trees during the past 500 years-anthropogenic impact and climatic superpositions. J. Geophys. Res. 88:6844-52
45. Friedli, H . , Siegenthaler, U . , Rauber, D . , Oeschger, H. 1987. Measurement of concentration, l3C1l2C and '80/'60 ratios of tropospheric carbon dioxide over Switzerland. Tellus 39B:8�88
46. Gleason, 1 . D . , Kyser, T. K. 1984. Stable isotope compositions of gases and vegetation near naturally burning coal. Nature 307:254-57
47. Goudriaan, J . , van Laar, H. H. 1978. Relations between leaf resistance, CO2-concentration and K-assimilation in
maize, beans, lalang grass and sunflower. Photosynthetica 12:241-49
48. Greenway, H . , Munns, R. 1980. Mechanisms of salt tolerance in nonhalophytes. Annu. Rev. Plant Physiol. 3 1 : 149-90
49. Greitner, e. S . , Winner, W . E. 1988. Increases in ll13C values of radish and soybean plants caused by ozone. New Phytol. 108:489-94
50. Guy, R. D . , Fogel , M. F. , Berry, J. A . , Hoering, T . C. 1987. Isotope fractionation during oxygen production and consumption by plants. In Progress in Photosynthetic Research Ill, ed. J. B iggins, pp. 597-600. Dordrecht: Martinus Nijhoff
5 1 . Guy, R. D . , Reid, D . M . , Krouse, H. R . 1980. Shifts in carbon isotope ratios of two C
3 halophytes under natural and
artificial conditions. Oecologia 44:24 1-47
52. Guy, R. D . , Reid, D. M . , Krouse, H. R . 1986. Factors affecting 13c;lle ratios of inland halophytes. I. Controlled studies on growth and isotopic composition of Puccinellia nuttalliana. Can. 1. Bot. 64:2693-99
53. Guy, R. D . , Reid, D . M . , Krouse, H. R . 1986. Factors affecting J3C/12C ratios of inland halophytes. n. Ecophysiological interpretations of patterns in the field. Can. J. Bot. 64:270�7
54. Hartsock, T. L . , Nobel, P. S. 1976. Watering converts a CAM plant to daytime CO2 uptake. Nature 262:574-76
55. Hatch, M. D . , Osmond, C. B . 1976. Compartmentation and transport in C4 photosynthesis. In Transport in Plants Ill: Encyclopedia of Plant Physiology (New Ser.). ed. C. R. Stocking, U. Heber, 3 : 144-84. New York: SpringerVerlag
56. Hattersley, P. W. 1982. ll13C values of C4 types in grasses. Aust. 1. Plant Physial. 9 : 1 39-54
57. Hattersley, P. W . , Browning, A. 1. 198 1 . Occurrence of the suberized lamella in leaves of grasses of different photosynthetic type. I . In the parenchymatous bundle sheath and PCR ('Kranz') sheaths. Protoplasma 109: 371-401
58. Holtum, J. A. M . , O'teary, M. H . , Osmond, C. B . 1983. Effect o f varying CO2 partial pressure on photosynthesis and on carbon isotope composition of carbon-4 of malate from the Crassulacean acid metabolism plant Kalanchoe daigremontiana Hamet et Perro Plant Physiol. 7 1 :602-9
Ann
u. R
ev. P
lant
. Phy
siol
. Pla
nt. M
ol. B
iol.
1989
.40:
503-
537.
Dow
nloa
ded
from
ww
w.a
nnua
lrev
iew
s.or
gby
Uni
vers
ity o
f A
rizo
na L
ibra
ry o
n 02
/07/
11. F
or p
erso
nal u
se o
nly.

CARBON ISOTOPE DISCRIMINATION 533
59. Hubick, K . T., Farquhar, G . D. 1987. Carbon isotope discrimination-selecting for water-use efficiency. Aust. Cotton Grower 8:66-68
60. Hubick, K. T. , Farquhar, G. D. 1989. Genetic variation of transpiration efficiency among barley genotypes is negatively correlated with carbon isotope discrimination. Plant Cell Environ. In press
6 1 . Hubick, K. T . , Farquhar, G. D . , Shorter, R. 1986. Correlation between wateruse efficiency and carbon isotope discrimination in diverse peanut (Arachis) germplasm. Aust. J. Plant Physiol. 13:803-16
62. Hubick, K. T., Shorter, R . , Farquhar, G. D. 1988. Heritability and genotype x environment interactions of carbon isotope discrimination and transpiration efficiency in peanut. Aust. J. Plant Physiol. 15:799-8 1 3
6 3 . Hylton, M. C . , Rawsthorne, S . , Smith, A. M . , Jones, D. A . , Woolhouse, H. W. 1 988. Glycine decarboxylase is confined to the bundle sheath cells of leaves of CrC4 intermediate species. Planta 175:452-59
64. Inoue, H . , Sugimura, Y. 1984. Diurnal change in 813C of atmospheric CO2 at Tsukuba, Japan. Geochem. J. 1 8 : 3 1 5-20
65 . Inoue, H . , Sugimura, Y. 1985 . The carbon isotope ratio of atmospheric carbon dioxide at Tsukuba, Japan. J. Atmos. Chern. 2:33 1-44
66. Jarvis, P. G . , McNaughton, K. G. 1986. Stomatal control of transpiration: scaling up from leaf to region. Adv. Ecol. Res. 1 5 : 1-49
67. Kalisz, S . , Teeri , J. A. 1986. Population-level variation in photosynthetic metabolism and growth in Sedum wrightii. Ecology 67:20-26
68. Keeling, C. D. 1958. The concentration and isotopic abundances of atmospheric carbon dioxide in rural areas. Geochim. Cosmochim. Acta 1 3 :322-34
69. Keeling, C. D. 1 96 1 . A mechanism for cyclic enrichment of carbon- 12 by terrestrial plants. Genchim. Cnsmochim. Acta 24:299-3 1 3
70. Keeling, C. D . , Mook, W. M . , Tans, P. P. 1979. Recent trends in the 13C112C ratio of atmospheric carbon dioxide. Nature 277 : 1 2 1-23
7 1 . Kirschbaum, M. U. F., Pearcy, R. W. 1 988. Gas exchange analysis of the relative importance of stomatal and biochemical factors in photosynthetic induction in Alocasia macrorrhiza. Plant Physiol. 86:782-85
72. Komer, c . , Scheel, J. A. , Bauer, H. 1979. Maximum leaf diffusive conductance in vascular plants. Photosynthetica 13:45-82
73. Laisk, A. 1983. Calculation of photosynthetic parameters considering the statistical distribution of stomatal apertures. J. Exp. Bot . 34: 1 627-35
74. Lange, O. L . , Green, T. G. A . , Ziegler, H. 1988. Water status related photosynthesis and carbon isotope discrimination in species of the lichen genus Pseudocyphellaria with green or bluegreen photobionts and in photosymbiodemes. Oecologia. 75:494-501
75. Lange, O. L., Kilian, E., Ziegler, H. 1986. Water vapor uptake and photosynthesis of lichens: performance differences in species with green and bluegreen algae as phycobionts. Oecologia 7 1 : 1 04--1 0
76. Lange, O. L . , Ziegler, H . 1986. Different limiting processes of photosynthesis in lichens. In Biological Control of Photosynthesis, ed. R. Marcelle, H. Clijsters, M. van Poucke, pp. 147-6\ . Dordrecht: Martinus Nijhoff
77. Lange, O. L . , Zuber, M . 1977. Frerea indica, a stem succulent CAM plant with deciduous C3 leaves. Oecologia 3 1 :67-72
78. Lerman, J . C . , Queiroz, O. 1974. Carbon fixation and isotope discrimination by a Crassulacean plant: dependence on photoperiod. Science 1 83: 1 207-9
79. Longstreth, D. J . , Nobel , P. S. 1977. Salinity effects on leaf anatomy. Consequences for photosynthesis. Plant Physiol. 63:700-3
80. Lucas, W. L . , Berry, J. A. 1985. Inorganic carbon transport in aquatic photosynthetic organisms. Physiol. Plant. 65:539--43
8 1 . Martin, B . , Bytnerowicz, A . , Thorstenson, Y. R. 1 988. Effects of air pollutants on the composition of stable isotopes (813C) of leaves and wood, and on leaf injury. Plant Physiol. 88:218-23
82. Martin, B . , Nienhuis, J . , King, G . , Schaefer, A. 1989. Restriction fragment length polymorphisms associated with water-use efficiency in tomato. Science. In press
83. Martin , B . , Thorstenson, Y. R. 1988. Stable carbon isotope composition (813C), water use efficiency, and biomass productivity of Lycopersicon esculentum, Lycopersicon pennel/ii, and the F, hybrid. Plant Physiol. 88:21 3-17
84. Masle , J . , Farquhar, G . D. 1988. Effects of soil strength on the relation of water-use efficiency and growth to car-
Ann
u. R
ev. P
lant
. Phy
siol
. Pla
nt. M
ol. B
iol.
1989
.40:
503-
537.
Dow
nloa
ded
from
ww
w.a
nnua
lrev
iew
s.or
gby
Uni
vers
ity o
f A
rizo
na L
ibra
ry o
n 02
/07/
11. F
or p
erso
nal u
se o
nly.

534 FARQUHAR ET AL
bon isotope discrimination in wheat seedlings. Plant Physiol. 86:32-38
85. Masle, J . , Passioura, J. B. 1 987. Effects of soil strength on the growth of wheat seedlings. Aust. J. Plant Physiol. 14:643-56
86. Medina, E . , de Bifano, T . , Delgado, M. 1 976. Paspalum repens Berg. , a truly aquatic C4 plant. Acta Cient. Venezolana 27:258--60
87. Medina, E . , Minchin, P. 1980. Stratification of /il3C values of leaves in Amazonian rain forests. Oecologia 45:377-78
88. Medina, E . , Montes, G. , Cuevas, E. , Roksandic, Z. 1 986. Profiles of CO2 concentration and /i13C values in tropical rainforests of the upper Rio Negro Basin, Venezuela. J. Trop. Ecol. 2:207-1 7
8 9 . Medina, E . , Troughton, J. H . 1974. Dark CO2 fixation and the carbon isotope ratio in Bromeliaceae. Plant Sci. Lett. 2:357-62
90. Monson, R. K . , Teeri, J. A . , Ku, M. S . B . , Gurevitch, J . , Mets, L. J . , Dudley, S. 1988. Carbon-isotope discrimination by leaves of Flaveria species eXhibiting different amounts of C3- and C4-cycle co-function. Planta 1 74:145-5 1
9 1 . Mook, W. G . , Bommerson, J. C . , Staverman, W . H . 1974. Carbon isotope fractionations between dissolved bicarbonate and gaseous carbon dioxide. Earth Planet Sci. Lett. 22: 1 69-76
92. Mook, W. G. , Koopmans, M . , Carter, A. F. , Keeling, C. D. 1983 . Seasonal, latitudinal, and secular variations in the abundance of isotopic ratios of atmospheric carbon dioxide. I . Results from land stations. J. Geophys. Res. 88: 1 09 1 5-33
93. Mooney, H. A . , Troughton, J. H . , Berry, J. A. 1977. Carbon isotope ratio measurements of succulent plants in southern Africa. Oecologia 30:295-305
94. Nalborczyk, E. 1978. Dark carboxylation and its possible effect on the value of .s13C in C3 plants. Acta Physiol. Planta 1 :53-58
95. Nalborczyk, E . , LaCroix, L. J . , Hill, R. D. 1975. Environmental influences on light and dark CO2 fixation by Kalanchoe daigremontiana. Can. J. Bot. 53: 1 132-38
96. Neales, T. F. , Fraser, M. S . , Roksandic, Z. 1983. Carbon isotope composition of the halophyte Disphyma clavel/atum (Haw.) Chinnock (Aizoaceae), as affected by salinity. Aust. J. Plant Physiol. 1 0:437-44
97. O'leary, M. H . 1 98 1 . Carbon isotope fractionation in plants. Phytochemistry 20:553--67
98. O'Leary, M. H. 1984. Measurement of the isotopic fractionation associated with diffusion of carbon dioxide in aqueous solution. J. Phys. Chem. 88:823-25
99. O'Leary, M. H. 1988. Carbon isotopes in photosynthesis. BioScience 38:325-36
100. O'leary, M. H . , Osmond, C. B. 1980. Diffusional contribution to carbon isotope fractionation during dark CO2 fixation in CAM plants. Plant Physiol. 66:931-34
101 . O'Leary, M. H . , Reife, J . E . , Slater, J . D. 198 1 . Kinetic and isotope effect studies of maize phosphenolpyruvate carboxylase. Biochemistry 20:7308--1 4 .
102. O'leary, M. H . , Treichel, I . , Rooney, M. 1986. Short-term measurement of carbon isotope fractionation in plants . Plant Physiol. 80:578--82
103 . Osmond, C. B. 1978. Crassulacean acid metabolism: a curiosity in context. Annu. Rev. Plant Physiol. 29:379-4 1 4
104. Osmond, C. B . , Smith, S. D . , Ben, G . Y. , Sharkey, T. D. 1987. Stem photosynthesis in a desert ephemeral, Eriogonum inflatum: characterization of leaf and stem CO2 fixation and H20 vapor exchange under controlled conditions. Oecologia 72:542-49
1 05 . Osmond, C. B . , Valane, N . , Haslam, S . M . , Uotila, P . , Roksandic, Z. 198 1 . Comparisons of .s13C values in leaves of aquatic macrophytes from different habitats in Britain and Finland: some implications for photosynthetic processes in aquatic plants. Oecologia 50: 1 17-24
106. Osmond, C. B . , Winter, K . , Ziegler, H. 1 982. Functional significance of different pathways of CO2 fixation in photosynthesis. In Physiological Plant Ecology II: Encyclopedia of Plant Physiology (New Ser.), ed. O. L. Lange, P. S . Nobel, C. B . Osmond, H . Ziegler, 1 2B:479--547. New York: SpringerVerlag
107. Pearcy, R. W. 1988. Photosynthetic utilization of lightflecks by understory plants. Aust. J. Plant Physiol. 15 :223-38
108 . Pearman, G. I . , Hyson, P. 1986. Global transport and inter-reservoir exchange of carbon dioxide with particular reference to stable isotopic distributions. J. Atmos. Chern. 4:81-124
109. Peisker, M. 1982. The effect of CO2 leakage from bundle sheath cells on car-
Ann
u. R
ev. P
lant
. Phy
siol
. Pla
nt. M
ol. B
iol.
1989
.40:
503-
537.
Dow
nloa
ded
from
ww
w.a
nnua
lrev
iew
s.or
gby
Uni
vers
ity o
f A
rizo
na L
ibra
ry o
n 02
/07/
11. F
or p
erso
nal u
se o
nly.
CARBON ISOTOPE DISCRIMINATION 535
bon isotope discrimination in C4 plants. Photosynthetica 16:533-41
1 10. Peisker, M. 1985. Modelling carbon metabolism in C3-C4 intermediate species. 2. Carbon isotope discrimination. Photosynthetica 19:300-1 1
I l l . Popp, M . , Kramer, D . , Lee, H . , Diaz, M . , Ziegler, H . , Liittge, U. 198R. Crassulacean acid metabolism in tropical dicotyledonous trees of the genus Clusia. Trees. In press
1 12 . Ramos, c. , Hall, A. E. 1982. Relationships between leaf conductance, intercellular CO2 partial pressure and CO2 uptake rate in two C3 and C4 plant species. Photosynthetica 16:343-55
1 13 . Raven, J. A . , Beardall , J . , Griffiths, H. 1 982. Inorganic C-sources for Lemna, Cladophora, and Ranunculus in a fastflowing stream: measurements of gas exchange and of carbon isotope ratio and their ecological implications. Oecologia 53:68-78
1 14. Raven, J. A . , Griffiths, H . , Allen, S. 1 984. N source, transpiration rate and stomatal aperture in Ricinus. In Membrane Transport in Plants, ed. W. J. Cram, K. Janascek, R. Rybova, K . Sigler, pp. 161-62. Praha: Academia Praha
1 15 . Rawsthorne, S . , Hylton, C. M . , Smith, A. M . , Woolhouse, H. W. 1988. Photorespiratory metabolism and immunogold localisation of photorespiratory enzymes of C3 and CrC4 intermediate species of Moricandia. Planta 1 73:298-308
1 16. Reardon, E. J . , Allison, G. B . , Fritz, P. 1 979. Seasonal chemical and isotopic variations of soil CO2 at Trout Creek, Ontario. J. Hydrol. 43:355-71
1 17 . Reibach, P. H . , Benedict, C. R. 1977. Fractionation of stable carbon isotopes by phosphoenolpyruvate carboxylase from C4 plants. Plant Physiol. 59:564-68
1 1 8 . Reich, P. B . , Amundson, R. G. 1 985. Ambient levels of ozone reduce net photosynthesis in tree and crop species. Science 230:566-70
1 19 . Roeske, C. A . , O'leary, M. H . 1984. Carbon isotope effects on the enzymecatalyzed carboxylation of ribulose bisphosphate . Biochemistry 23:6275-84
1 20. Runde!, P. W . , Rundel, J. A . , Ziegler, H . , Stichler, W. 1979. Carbon isotope ratios of Central Mexican Carassulaceae in natural and greenhouse environments. Oecologia 38:45-50
1 2 1 . Rundel, P. W . , Stichler, W . , Zander, R . H . , Ziegler, H. 1979. Carbon and hydrogen isotopes of bryophytes from
arid and humid regions. Oecologia 44: 9 1-4
122. Schleser, G. H . , Jayasekera, R. 1985. al3C-Variations of leaves in forests as an indication of reassimilated CO2 from the soil. Oecologia 65:536-42
123. Schiinwitz, R . , Stichler, W . , Ziegler, H . 1986. /'i13C Values of CO2 from soil respiration on sites with crops of C3 and C4 types of photosynthesis. Oecologia 69:305-8
1 24. Seemann, J. R. , Critchley, C. 1985 . Effects of salt stress on growth, ion content, stomatal behaviour and photosynthetic capacity of a salt-sensitive species, Phaseolus vulgaris L. Planta 164: 15 1-62
1 25 . Sharkey, T. D . , Berry, J. A. 1985. Carbon isotope fractionation of algae as influenced by an inducible CO2 concentrating mechanism. In Inorganic Carbon Uptake by Aquatic Organisms, ed. W. J. Lucas, J. A. Berry, pp. 389-401 . Rockville: Am. Soc. Plant Physio\.
1 26. Sinclair, T. R . , Tanner, C. B . , Bennett, J. M. 1984. Water-use efficiency in crop production. BioScience 34:36-40
1 27. Smith, B . N . , Brown, W. V. 1 973. The Kranz syndrome in the Gramineae as indicated by carbon isotope ratios. Am. J. Bot. 60:505-1 3
1 28 . Smith, B . N . , Epstein, S . 1 97 1 . Two categories of nC!l2C ratios for higher plants. Plant Physiol. 47:380-84
1 29 . Smith, B . N . , Oliver, J . , McMillan, C. 1976. Influence of carbon source, oxygen concentration, I�ht intensity, and temperature on I3C/' C ratios in plant tissues . Bot. Gaz. 1 37:99-104
1 30. Smith, B. N . , Turner, B. L. 1975 . Distribution of Kranz syndrome among Asteraceae. Am. J. Bot. 62:541-45
1 3 1 . Smith, S. D. , Osmond, C. B. 1987. Stem photosynthesis in a desert ephemeral, Eriogonum infiatum. Morphology, stomatal conductance and water-use efficiency in field populations. Oecologia 72:533-41
132. Stephenson, R. L . , Tan, F. c . , Mann, K. H. 1984. Stable carbon isotope variability in marine macrophytes and its implications for food web studies. Marine BioI. 8 1 :223-30
133. Sternberg, L. D. L . , Mulkey, S. S . , Wright, S . J. 1989. Ecological interpretation of leaf carbon isotope ratios: influence of respired carbon dioxide. Ecology. In press
1 34. Sternberg, L. D. L . , Ting, I. P . , Price, D . , Hann, J. 1987. Photosynthesis in epiphytic and rooted Clusia rosea Jacq. Oecologia 72:457-60
Ann
u. R
ev. P
lant
. Phy
siol
. Pla
nt. M
ol. B
iol.
1989
.40:
503-
537.
Dow
nloa
ded
from
ww
w.a
nnua
lrev
iew
s.or
gby
Uni
vers
ity o
f A
rizo
na L
ibra
ry o
n 02
/07/
11. F
or p
erso
nal u
se o
nly.
536 FARQUHAR ET AL
135. Teeri, J. A. 1 98 1 . Stable carbon isotope analysis of mosses and lichens growing in xeric and moist habitats. Bryologist 84:82-84
1 36. Teeri, J . A. 1982. Carbon isotopes and the evolution of C4 photosynthesis and Crassulacean acid metabolism. ]n Biochemical Aspects of Evolutionary Biology, ed. M. H. Nitecki, pp. 93-129. Chicago: Univ. Chicago Press
1 3 7 . Teeri, J . A. 1984. Seasonal variation in Crassulacean acid metabolism in Dudleya blochmanae (Crassulaceae). OecoJogia 64:68-73
1 38. Teeri, J. A . , Gurevitch , J. 1984. Environmental and genetic control of Crassulacean acid metabolism in two Crassulacean species and an F I hybrid with differing biomass fil3
C values. Plant Cell Environ. 7:589-96
1 39. Teeri, J. A. , Tonsor, S. J . , Turner, M. 1 98 1 . Leaf thickness and carbon isotope composition in the Crassulaceae. Oecologia 50:367-69
140. Teeri, J. A . , Turner, M . , Gurevitch , J. 1 986. The response of leaf water potential and Crassulacean acid metabolism to prolonged drought in Sedum rubrotinccum. Plant Physiol. 8 1 :678-80
1 4 1 . Terashima, 1. , Wong, S. c . , Osmond, C . B . , Farquhar, G. D. 1988. Characterisation of non-uniform photosynthesis induced by abscisic acid in leaves having different mesophyll anatomies. Plant Cell Physiol. 29:385-94
142. Ting, 1. P . , Sternberg, L. 0 . , DeNiro, M. J. 1983. Variable photosynthetic metabolism in leaves and stems of Cissus quadrangularis L. Plant Physiol. 7 1 :677-79
143. Ting, 1. P. , Sternberg, L. 0 . , DeNiro, M. J. 1985. Crassulacean acid metabolism in the strangler Clusia rosea Jacq. Science 229:969-7 1
144. Troughton, J. H. 1 979. fil3C as an indicator of carboxylation reactions. In Photosynthesis II: Photosynthetic Carbon Metabolism and Related Processes. Encyclopedia of Plant Physiology (New Ser.), ed. M. Gibbs E. Latzko, 6: 140-49. New York: Springer-Verlag
1 45 . Troughton, J. H . , Card, K . , Bjorkman, O. 1974. Temperature effects on the carbon isotope ratio of C3, C4 and CAM plants. Carnegie Inst. Wash. Yearb. 73:780-84
146. Troughton, J. H . , Mooney, H . A . , Berry, J. A . , Verity, D. 1 977. Variable carbon isotope ratios of Dudleya species growing in natural environments. Oecologia 30:307- 1 1
147. Ueno, 0 . , Samejima, M . , Muto, S . , Miyachi, S . 1 988. Photosynthetic characteristics of an amphibious plant, Eleocharis vivipara: expression of C4 and C3 modes in contrasting environments . Proc. Natl. Acad. Sci. USA 85:6733-37
1 48. Vogel, J. C. 1978. Recycling of carbon in a forest environment. Oecol. Plant. 1 3 :89-94
149. Vogel, J. C. 1980. Fractionation of Carbon Isotopes During Photosynthesis. Heidelberg: Springer-Verlag
150. Vogel, J. C . , Fuls, A . , Ellis, R. P. 1978. The geographical distribution of Kranz grasses in South Africa. S. Afr. J. Sci. 74:209-15
1 5 1 . Webster, G. L. , Brown, W. V., Smith, B. N. 1 975. Systematics of photosynthetic carbon fixation pathways in Euphorbia. Taxon 24:27-33
152. Werk, K. S . , Ehleringer, J . , Forseth, 1 . N . , Cook, C. S . 1983. Photosynthetic characteristics of Sonoran Desert winter annuals . Oecologia 59:101-5
1 5 3 . Whelan, T., Sackett, W. M . , Benedict, C. R. 1973. Enzymatic fractionation of carbon isotopes by phosphenolpyruvate carboxylase from C4 plants. Plant Physi-01. 5 1 : 105 1-54
154. Winter, K. 1980. Carbon dioxide and water vapor exchange in the Crassulacean acid metabolism plant Kalanchoe pinnata during a prolonged light period. Plant Physiol. 66:91 7-21
155. Winter, K. 198 1 . CO2 and water vapor exchange, malate content and fiI3C value in eicer arietinum grown under two water regimes. Z. P[lanzenphysiol. 1 0 1 :421-30
1 56. Winter, K. 198 1 . C4 plants of high biomass in arid regions of Asiaoccurrence of C4 photosynthesis in Chenopodiaceae and Polygonaceae from the Middle East and USSR. Oecologia 48: 100-6
157. Winter, K . , Holtum, J. A. M . , Edwards, G . E . , O'leary, M . H . 1982. Effect of low relative humidity on fil3C value in two C
3 grasses and in Panicum
milioides, a C3-C4 intermediate species. J. Exp. Bot. 33:88-91
1 58. Winter, K., Liittge, U . , Winter, E . , Troughton, J. H . 1978. Seasonal shift from C3 photosynthesis to Crassulacean acid metabolism in Mesembryanthemum crystallinum growing in its natural environment. Oecologia 34:225-37
159. Winter, K . , Troughton, J. H. 1 978. Photosynthetic pathways in plants of coastal and inland habitats of ]srael and the Sinai. Flora 167: 1-34
Ann
u. R
ev. P
lant
. Phy
siol
. Pla
nt. M
ol. B
iol.
1989
.40:
503-
537.
Dow
nloa
ded
from
ww
w.a
nnua
lrev
iew
s.or
gby
Uni
vers
ity o
f A
rizo
na L
ibra
ry o
n 02
/07/
11. F
or p
erso
nal u
se o
nly.

CARBON ISOTOPE DISCRIMINA nON 537
160. Winter, K., Troughton, J . H., Card, K. A . 1976. Cl13C Values of grass species collected in the Northern Sahara Desert. Oecologia 25: 1 15-23
161 . Wong, S. C . , Cowan, 1. R . , Farquhar, G. D. 1979. Stomatal conductance correlates with photosynthetic capacity. Nature 282:424--26
162. Wright, G. C . , Hubick, K. T . , Farquhar, G. D. 1988. Discrimination in carbon isotopes of leaves correlates with water-use efficiency of field grown
peanut cultivars. Aust. J. Plant Physiol. 15 :815-25
163. Ziegler, H . , Batanouny, K. H . , Sankhla, N . , Vyas, O. P . , Stichler, W. 198 1 . The photosynthetic pathway types of some desert plants from India, Saudi Arabia, Egypt, and Iraq. Oecologia 48:93-99
163a. Guy, R. D . , Wample, R. L. 1984. Stable carbon isotope ratios of flooded and nonflooded sunflowers (H elianthus annuus). Can. 1. Bot. 62: 1 770-74
Ann
u. R
ev. P
lant
. Phy
siol
. Pla
nt. M
ol. B
iol.
1989
.40:
503-
537.
Dow
nloa
ded
from
ww
w.a
nnua
lrev
iew
s.or
gby
Uni
vers
ity o
f A
rizo
na L
ibra
ry o
n 02
/07/
11. F
or p
erso
nal u
se o
nly.