carbon-free compressed air energy storage
TRANSCRIPT

December 2009
CARBON-FREE COMPRESSED AIR ENERGY STORAGE
by
Dustin Shively
A thesis
submitted in partial fulfillment
of the requirements for the degree of
Master of Science in Mechanical Engineering
Boise State University

ALL RIGHTS RESERVED
2009
Dustin Shively

BOISE STATE UNIVERSITY GRADUATE COLLEGE
DEFENSE COMMITTEE AND FINAL READING APPROVALS
of the thesis submitted by
Dustin Shively
Thesis Title: Carbon-Free Compressed Air Energy Storage
Date of Final Oral Examination: 23 October 2009
The following individuals read and discussed the thesis submitted by student Dustin
Shively, and they evaluated his presentation and response to questions during the final
oral examination. They found that the student passed the final oral examination.
John Gardner, Ph.D. Chair, Supervisory Committee
James Ferguson, Ph.D. Member, Supervisory Committee
Don Plumlee, Ph.D. Member, Supervisory Committee
David Solan, Ph.D. Member, Supervisory Committee
Todd Haynes Member, Supervisory Committee
The final reading approval of the thesis was granted by John Gardner, Ph.D., Chair of the
Supervisory Committee. The thesis was approved for the Graduate College by John R.
Pelton, Ph.D., Dean of the Graduate College.

vi
ABSTRACT
The inherent intermittency of the two fastest growing renewable energy sources, wind and solar, presents a significant barrier to widespread penetration and replacement of fossil-fuel sourced baseload generation. These intermittencies range from short term ramp events experienced by wind farms to the diurnal fluctuation of solar installations. Traditionally, grid operators have had very little control over demand and full control over supply. With the increase in wind and solar based generation onto an electric grid comes a decrease in control of supply. Grid operators are required to have a certain amount of spinning reserve ready to respond when wind or solar resources suddenly decrease. One solution to this problem of grid integration is the use of energy storage. While traditionally used as merchant facilities to buy and sell energy on the spot market, storage is actively being investigated as a means of enabling renewable energy sources to achieve widespread penetration onto national grids. Pumped hydro storage has been used extensively as a means of large scale energy storage. Standard compressed air energy storage (CAES), while only two installations currently exist, shows potential to store large amounts of energy. Both traditional technologies have drawbacks; they are site specific, and in CAES, require natural gas combustion. In this thesis, a short-to-medium term energy storage system is presented. While similar to the CAES technique in that compressed air is still used for energy storage, it differs as an incompressible liquid is the working fluid in the turbine, thus eliminating the need for supplementary combustion when the energy is recovered. Energy is stored above ground in pressure tanks until power is needed; at this time, it exerts a force on the incompressible fluid, pushing it through a hydroturbine. This family of approaches combines the best concepts attributed with pumped hydro storage and CAES in a system that is not site-specific, does not require natural gas and has the potential for being very efficient. Thermodynamic analyses were performed to determine energy flows into and out of the system. The results from that analysis were used to verify a system model created from individual component models. This system model was then used to simulate the application of this energy storage technology in various applications and accurately assess its performance. This research found that this approach to energy storage is feasible with existing technology. The upper bound on the round-trip efficiency of energy stored in this manner is 65%.

vii
TABLE OF CONTENTS
ABSTRACT ...................................................................................................................... IV
LIST OF TABLES ............................................................................................................ IX
LIST OF FIGURES ........................................................................................................... X
INTRODUCTION .............................................................................................................. 1
EXISTING ENERGY STORAGE SYSTEMS .................................................................. 4
TRADITIONAL COMPRESSED AIR ENERGY STORAGE ................................................ 4
PUMPED HYDRO ....................................................................................................... 7
BATTERIES, FUEL CELLS & FLYWHEELS .................................................................. 8
PROPOSED ENERGY STORAGE SYSTEMS .............................................................. 10
CARBON-FREE COMPRESSED AIR ENERGY STORAGE ............................................ 11
THERMODYNAMIC ANALYSIS .................................................................................. 14
MODELING ..................................................................................................................... 20
COMPRESSOR ......................................................................................................... 20
TANK ..................................................................................................................... 22
TURBINE ................................................................................................................ 24
LOGIC .................................................................................................................... 25
SYSTEM .................................................................................................................. 26

viii
OPERATIONAL CYCLE ................................................................................................ 28
PRESSURIZE ........................................................................................................... 29
EXTRACT ............................................................................................................... 29
LOOP ...................................................................................................................... 29
FILL ....................................................................................................................... 36
PARAMETERS ................................................................................................................ 37
OPERATION .................................................................................................................... 38
BATCH OPERATION ................................................................................................ 38
APPLICATION STUDIES ............................................................................................... 40
GRID OPERATORS .................................................................................................. 41
RENEWABLE ENERGY ELECTRICITY GENERATION OPERATOR ............................... 44
MERCHANT STORAGE FACILITY ............................................................................ 47
CONCLUSIONS AND FURTHER RESEARCH ............................................................ 49
TECHNOLOGICAL BARRIERS .................................................................................. 49
Pelton Turbine ........................................................................................... 50
Tank Size .................................................................................................. 50
Roundtrip Efficiency ................................................................................. 51
ECONOMIC BARRIERS ............................................................................................ 51
REFERENCES ................................................................................................................. 53
APPENDIX ....................................................................................................................... 55
MATLAB/SIMULINK MODELS ................................................................................. 55

ix
LIST OF TABLES
Table 1. Truth table for determining which phase of the cycle to perform.
Table 2. Different parameters effect energy and power capacities, as well as cost
Table 3. Parameters used in Grid Operator and Renewable Energy Generation

x
LIST OF FIGURES
Figure 1. Energy storage can play a vital role in balancing intermittent renewable energy
sources................................................................................................................................. 2
Figure 2. Traditional CAES configuration uses underground caverns to store compressed
air. Natural gas combustion is used during expansion. (CAES Development Company) .. 5
Figure 3. Standard pumped hydro storage facility. (TVA) ................................................. 7
Figure 4. CF-CAES conceptual schematic ....................................................................... 11
Figure 5. Artistic rendition of a complete CF-CAES system ........................................... 13
Figure 6. Each phase of the cycle has an energy input or output, in the form of either
work or heat. ..................................................................................................................... 14
Figure 7. The ratio of initial volume of air to the final volume is defined as α, a very
important parameter in the performance of the system. ................................................... 15
Figure 8. The unavoidable destruction of useful energy to heat occurs after the work input
to compress the air causes an increase in temperature. ..................................................... 17
Figure 9. A percent of energy input will always be lost in the form of heat. It can be seen
that γ can be known, and therefore controlled, by varying α. ........................................... 19
Figure 10. Each component of the system was modeled independently then connected
into a system-wide model. ................................................................................................ 20
Figure 11. Diagram of compressor model ........................................................................ 21
Figure 12. Tank model derived from conservation of mass and ideal gas law. ................ 23

xi
Figure 13. The state of the tank can be determined through the integration of all variables
that are changing in time: mass, volume, pressure, and temperature. .............................. 24
Figure 14. Complete system with embedded logic and controller to cycle through the
process............................................................................................................................... 27
Figure 15. CF-CAES cycle. .............................................................................................. 28
Figure 16. Energy extraction causes the expansion of air and thus a drop in temperature.
........................................................................................................................................... 30
Figure 17. After expansion, a fraction of the energy input still remains in the tank. ....... 31
Figure 18. A venting algorithm must be used in order to avoid the venting of all residual
pressure remaining in the tank after expansion................................................................. 32
Figure 19. In utilizing the venting algorithm, the initial pressure in the tank is the residual
pressure. ............................................................................................................................ 33
Figure 20 The quantity of both energy input and output is a function of the amount of
water initially stored in the tank, or specifically, α. .......................................................... 35
Figure 21. Upper-bound efficiency of the system as a function of α. ............................... 36
Figure 22. Typical demand curve for a single day. California, July 15, 2007 (Lawrence
Berkeley National Lab) ..................................................................................................... 42
Figure 23. One week simulation. Power input from wind energy, power output controlled
to follow the trend of a daily load curve. .......................................................................... 43
Figure 24. Multiple tank batch operation used to provide uninterrupted power output. .. 44
Figure 25. Volume of water (as a percent of tank volume) in each of the four tanks. Out
of phase relationship allows continual power output. ....................................................... 45

xii
Figure 26. Pressure status in each of the four tanks. As one tank is discharging and
dropping pressure, the others are receiving power input and their pressure is increasing.45
Figure 27. Merchant storage facilities store low-cost, off peak energy and sell it back in
times of high demand. ....................................................................................................... 47
Figure A. 1 Simulink Model of a Four System Batch Operation………………………..57
Figure A. 2 Single System Model………………………………………………………..58
Figure A. 3 Tank Model………………………………………………………………….59

1
INTRODUCTION
Throughout the world the power generation industry is actively changing in
response to several issues including legislation resulting from increased levels of carbon
dioxide in the atmosphere, ever-increasing demand and distribution, and re-assessment of
the business-as-usual practices set in place decades ago. This industry, while impacting
all aspects of the economy, is being forced to adapt to these challenges and innovation is
being spurred. It is unlikely that these issues possess one solution, but rather a
combination of approaches will be the optimal method. Installed wind power capacity in
the United States is currently at 8,500 MW and is seeing continued growth; likewise,
solar power installations are outpacing expectations. The renewable energy industry is
currently one of the fastest growing industries in the world.
As wind and solar-based electrical generation continues to increase, the problems
inherent with integrating these intermittent sources to the grid increase as well. Some
utilities (both domestic and international) are already seeing the impact that intermittent
and uncontrollable supply can have on grid control. Traditionally, the utility has had full
control of the supply and little control of the demand. After decades of this model, grid
operators can accurately forecast load predictions and allow their supply to respond
accordingly. When renewable penetration reaches high levels, more and more issues
concerning their variability are noticed:

• sudden wind ramps (up or down)
• gust-induced turbine shutdown
• out-of-phase relation between peak demand and peak supply
These characteristics of renewable power
when combined with their intermittency
solution of the energy balancing problem, as shown in Figure 1.
Figure 1. Energy storage can play
The US Department of Energy described its goal of supplying 20% of the nation’s
electricity with wind by the year 2030 in a report issued
concludes that this level of penetration will be made possible by expanding load
balancing areas, creating more flexible electric transmission and using natural gas
generators to balance the remaining variability. However, significant barri
these approaches: there are regulatory hurdles involved with expanding load balancing
areas; grid expansion faces financial and permitting obstacles, as well as significant
sudden wind ramps (up or down)
induced turbine shutdown
phase relation between peak demand and peak supply
These characteristics of renewable power production increase the difficulty of integration
when combined with their intermittency, and energy storage can contribute to the
solution of the energy balancing problem, as shown in Figure 1.
. Energy storage can play a vital role in balancing intermittent renewable
energy sources.
The US Department of Energy described its goal of supplying 20% of the nation’s
electricity with wind by the year 2030 in a report issued in 2008 [1]. That report
concludes that this level of penetration will be made possible by expanding load
balancing areas, creating more flexible electric transmission and using natural gas
generators to balance the remaining variability. However, significant barri
these approaches: there are regulatory hurdles involved with expanding load balancing
areas; grid expansion faces financial and permitting obstacles, as well as significant
Supply Balance Intermittent Source
Wind
SolarEnergy Storage
Natural Gas
Hydro
2
production increase the difficulty of integration
, and energy storage can contribute to the
a vital role in balancing intermittent renewable
The US Department of Energy described its goal of supplying 20% of the nation’s
. That report
concludes that this level of penetration will be made possible by expanding load
balancing areas, creating more flexible electric transmission and using natural gas
generators to balance the remaining variability. However, significant barriers exist to
these approaches: there are regulatory hurdles involved with expanding load balancing
areas; grid expansion faces financial and permitting obstacles, as well as significant

3
public opposition; and there are definite, long term environmental and financial risks
associated with fossil fuels such as natural gas. These methods to counterbalance the high
wind power penetration into the national electric grid are viable and will be implemented,
but there is an additional technology that can be investigated to counteract the
problematic interaction of wind power and other renewables: energy storage.

4
EXISTING ENERGY STORAGE SYSTEMS
Energy storage has been used for years to decouple the time of electricity
generation from the time of its use. Short term energy storage has traditionally been used
for system regulation and spinning reserve; it has also been used as transmission
curtailment in allowing grid operators to overcome transmission bottlenecks [2]. Recently
there has been renewed research and interest into various energy storage technologies as
a means to make intermittent renewable energy sources dispatchable and controllable.
Investigations into the applicability and benefits of response systems (seconds or
milliseconds) and bulk systems (minutes and hours) integrated with renewable energy
sources has shown the potential for various energy storage technologies [3]. The state of
energy storage in the US in 2006 was shown by S. van der Linden to be at a critical time
for advancement and integration: “The current storage concepts are ready for
deployment… storage needs to be implemented.” [3]
Traditional Compressed Air Energy Storage
Compressed Air Energy Storage (CAES) is a proven technology with two
successfully facilities operating in the world (Huntorf, Germany and McIntosh,
Alabama). Cavallo notes that “…with an installed capital cost of about $890/kW, CAES
is the least cost utility scale bulk storage system available” [4]. However, the means of
extracting energy from the compressed air storage still requires the use of natural gas.

5
The sudden expansion of air through a turbine in the CAES scheme causes a dramatic
temperature drop, thus necessitating the addition of heat, often in the form of natural gas
combustion. While using roughly 2/3 to 1/2 less fuel less than a conventional natural
gas/combined cycle power plant, traditional CAES systems still require combustion to
bring the compressed air to an appropriate temperature.
The standard configuration for a traditional CAES system can be seen in Figure 2.
It is a competitive means of storing energy as it has nearly the lowest capital cost per unit
energy of any modern energy storage technologies [14].
Figure 2. Traditional CAES configuration uses underground caverns to store
compressed air. Natural gas combustion is used during expansion. (CAES
Development Company)
There have been advances in traditional CAES cycle design, attempting to
decrease or eliminate the use of natural gas. The possibility of using thermal energy
storage in a CAES cycle was investigated by Bullough, et al. [5]. In this configuration,

6
the heat generated during the compression phase is transferred to a thermal storage
medium. The heat is stored, and then exchanged with the air prior to the expansion phase
reheating it to an acceptable temperature for expansion.
Traditional CAES systems use low-cost off peak energy to operate air
compressors, storing energy as compressed air. In 1982 Ramakumar [6] proposed the
idea of using wind energy to compress air for energy storage. The idea to use wind to
operate an air compressor has been continually investigated since. Lieberman, Enis and
Rubin discussed the operation and grid-connection of a hybrid wind energy/compressed
air facility [7]. They looked at operating the compressor both electrically and
mechanically either in the nacelle or on the ground. In addition, they investigated a novel
approach to integrate storage with transmission: mile long sections of 2.5 feet diameter
pipes where both the compressed air is stored and the energy is transmitted. A similar
concept is being commercially developed by Massachusetts-based General Compression,
Inc.
In their Energy Storage Handbook, the Electric Power Research Institute (EPRI)
reviews CAES plants and looks at the services such facilities can offer to the grid [9]. In
their report, they conclude that ‘small CAES’ systems (10 MW or less) would be
particularly well suited for load shifting up to 3 hours. In the EPRI supplement for Wind
Energy, they conclude that 10 MW CAES is well suited for transmission curtailment,
time shifting and forecast hedging [10].

7
Pumped Hydro
Pumped hydro storage facilities exist all over the world. The typical operation is
to use low cost electricity during off peak hours to pump water into an elevated reservoir.
When demand requires electricity, the flow is reversed and discharged through a turbine.
This allows energy to be stored in the form of potential energy in the elevated water, then
recovered through a traditional hydroturbine. Figure 3 is an illustration of such a system
in Tennessee.
Figure 3. Standard pumped hydro storage facility. (TVA)
While these systems can effectively store large quantities of energy, they are inherently
site specific. For this type of energy storage, a significant elevation gain is required. The
typical locations are on top of hills near acceptable waterways. Ideally they are near
existing dams and hydroturbines.

8
As well as using wind energy to compress air and store energy, it has been
investigated how wind energy might be used to pump water and store energy in the form
of potential energy in the water. In 2004 Castronuovo and Lopes showed the use of a low
and high water reservoir for wind to pumped-hydro storage [8]. The wind energy is used
to pump water to the high reservoir in times of low demand; then when needed, the water
is run through a hydroelectric turbine into the low reservoir.
Batteries, Fuel Cells & Flywheels
There has been an extensive amount of research and commercialization performed
on various other energy storage systems. These other systems consist of various batteries,
fuel cells, flywheels, etc. and are characterized as response systems (providing power for
seconds or milliseconds).
- Sodium Sulfur (NaS) Batteries: uses a liquid sulfur and salt battery reaction to
store excess energy. Batteries using this technology have been used to supply
energy to the grid, notably in Japan
- Flow Batteries: generate energy as chemicals stored in tanks are allowed to mix.
They can be easily recharged but are relatively expensive to operate.
- Lithium-ion Batteries: one of the highest energy density battery formulations and
also one of the lightest has found application in portable and automotive
applications. Cost would be a big issue for non-portable storage applications
associated with the grid where the other advantages like low weight are not as
compelling.

9
- Lead Acid Batteries: are the oldest battery storage technology and also widest
spread. In comparison, they suffer from low energy density and high
environmental impact.
- Fuel Cells: have the advantage of being rechargeable by just adding new chemical
fuel. They have the disadvantage of being expensive to build (in comparison).
- Flywheels: store energy in the kinetic energy of massive spinning wheels. The
energy is extracted directly to drive generators and produce electricity.
Applications have been found on smaller scales like uninterruptible power
supplies for individual buildings; efforts are being made to scale flywheel
technology to sizes required by grid operators.

10
PROPOSED ENERGY STORAGE SYSTEMS
The goal of this research is to develop a feasible system that is capable of meeting
the challenges of grid-integration posed by renewable energy sources. From daily to
within-the-hour storage, this system will be able to mitigate ancillary service demands
and provide peak-load shifting capabilities to the grid operators. This technology takes
the most attractive attributes from CAES and pumped hydro storage and eliminates some
of their shortcomings. Its similarity to CAES comes with a significant difference: The
working fluid used to recover the energy is incompressible. The proposed approach
avoids the requirement of additional energy, thus greatly improving the overall
performance of the energy storage system.
This study indicates that this system has several potential advantages over current
energy storage systems:
• does not require the use of natural gas
• not site-specific
• scalable/adaptable to many different applications
• low capital cost
• simpler system optimization and control based on nozzle velocity (in an impulse
turbine);
• better thermal management since the working fluid acts as a heat sink

11
Carbon-Free Compressed Air Energy Storage
In its most basic manifestation, the Carbon-Free Compressed Air Energy Storage,
CF-CAES, System uses two fluids, a compressible and an incompressible fluid. Air and
water are the most common examples of each. Energy is stored by pumping the
compressible fluid in an enclosed tank or chamber. Unlike the current standard of
Compressed Air Energy Storage (CAES), the compressible fluid is not expanded through
a turbine; rather it is used to push an incompressible fluid through an impulse or hydro-
turbine. As a result, the expansion takes place over the entire volume of compressed gas,
not just the small amount passing through a nozzle. The storage tank then has time to
equilibrate with the surrounding environment and no additional heat is needed to
counteract the problematic temperature drop that accompanies sudden air expansion in a
turbine.
Figure 4. CF-CAES conceptual schematic

12
A conceptual sketch of the CF-CAES system is shown in Figure 4. In this
scenario, wind or solar energy is used to compress air in a ground level tank, either
through an in-nacelle compressor or by electrically powering a ground-level compressor.
The compressed air is used to charge water stored in a pressure vessel. Once charged, the
compressed air exerts a force on the water. The water drives a hydro-turbine which turns
a generator producing electricity. Finally, consumptive use of water can be avoided by
capturing the water after it has moved through the turbine and reusing it.
The fundamental principle behind this research is the use of two fluids in which a
compressible fluid is used as energy storage and an incompressible fluid is used for
energy recovery. The configuration shown in Figure 5 utilizes wind energy to compress
the air in large tube trailers.

Figure 5. Artistic rendition of a complete CF
Finally, it should be pointed out that others have recognized the advantage of a
storage approach utilizing multiple fluids and a number of patents have been granted for
variations on this theme [10
sections, the barriers that have limited this concept will be discussed in detail.
. Artistic rendition of a complete CF-CAES system
Finally, it should be pointed out that others have recognized the advantage of a
oach utilizing multiple fluids and a number of patents have been granted for
variations on this theme [10-12] but none have been reduced to practice.
sections, the barriers that have limited this concept will be discussed in detail.
13
CAES system
Finally, it should be pointed out that others have recognized the advantage of a
oach utilizing multiple fluids and a number of patents have been granted for
In the following
sections, the barriers that have limited this concept will be discussed in detail.

14
THERMODYNAMIC ANALYSIS
Before detailed models of the system’s components were developed, a thorough
analysis of the energy flows within the cycle was performed. This not only provides
information crucial to operation of the system, but certain insight into economic viability
as well. A single tank that contains both the compressible and incompressible fluid was
used as the system to investigate energy inputs, outputs, and heat transfer. The process of
interest is shown below:
Figure 6. Each phase of the cycle has an energy input or output, in the form of
either work or heat.
When mass is added to a fixed volume of air, both pressure and temperature
increase. The increase in pressure stores energy in mechanical potential, while the
increase in temperature stores energy in the form of heat. How these two factors relate
can be determined through first law analyses. In the above process, from (a) to (b), air is
being added to the tank, increasing the temperature and pressure of the air. Energy is now

15
stored in the tank (in mechanical potential as well as heat) and inevitably equilibrates
with its surroundings: (b) to (c). The reduction in temperature due to heat transfer also
reduces the pressure. Energy can be removed from the system by allowing the
pressurized air to push the water out of the tank. During this expansion, the volume of air
is increasing which causes both temperature and pressure to go down: (c) to (d). The cold
air in the tank will now draw heat from the surroundings, increasing the temperature and
pressure. At this state the tank can then be re-filled with water and the system and cycle
from energy input, through storage, to output, with respective heat transfer along the way.
One important parameter of the system is the ratio of air to water in the uncharged
tank; to capture this characteristic, the parameter α is defined as the ratio of the initial
volume of air to the final volume of air. Low α values correspond to relatively large
quantities of water initially in the system. Conversely, high α values describe a system
with very little water cycling through it, Figure 7.
Figure 7. The ratio of initial volume of air to the final volume is defined as α, a very
important parameter in the performance of the system.

16
Regardless of what alpha value is used, once all the water has been removed from
the tank, the pressure inside is most likely not at atmospheric pressure. For each α, a
particular target pressure does exist to produce this result; however, these cases yield very
low energy output and are thus unlikely in any application. Thus, the residual pressure
remaining in the tank after the water has been removed and the air has expanded can be
calculated from the assumed isentropic expansion of the compressed air: ��� � �����
for a constant mass of air, isentropic expansion:
��� � �����
� � � � �����
Where subscript (1) and (2) refer to the states surrounding the expansion of air and
removal of stored energy and k is the ratio of specific heats for air ( approx. 1.4). From
the definition of α:
� � � �� � ������ �� ��� ����� � �������������� �� ��� ���� ��������
�� � � ��
for the first state being the high pressure air and the second being the residual:
�������� � �!�"!��
Because of this fact that there is a residual pressure in the tank after expansion, an
algorithm was developed to allow water to be pumped back into the tank without
compressing the air in the process (Operational Cycle). Once the tank is filled with water

17
to the desired alpha ratio, the compressor starts at this pressure and operates until the high
pressure is achieved. This initial condition of initial pressure being equal to the residual
pressure in the tank after expansion must be taken into consideration during the
thermodynamic analysis in order to accurately represent the energy flows in the system.
The amount of heat created (and therefore mechanical potential lost) is directly
proportional to the pressure difference; hence designing a system to minimize this loss is
beneficial. The following derivation develops the relationship between this quantity of
heat and total energy input.
Figure 8. The unavoidable destruction of useful energy to heat occurs after the work
input to compress the air causes an increase in temperature.
The work input to the system equals the difference in total internal energy
between states a and b in Figure 8. Once again, assuming an insentropic compression
process of the air in the tank:
����� � �#�#�

18
�� ������ � �# �#��#�
$��� %� � $#�# %� &�' �� � �# ��( � � �)$�
Substituting in the definition for total internal energy,
* � �+,$
The total internal energy at state b can be shown to be,
*# � *� -�#��.� � *��%�
And the change in total internal energy during the constant volume compression,
∆*�%# � *�0�%� 1 13 During the next two states in Figure 8, b to c, the mass of air equilibrates with the
environment in a constant mass, constant volume heat addition.
The internal energy at state c,
*4 � �4+,$4
with, �4 � �# ��( $4 � $�
*4 � �#+,$� � *� �#�� � *��%
And the change in total internal energy during the constant mass and volume heat
addition,
∆*#%4 � *�0�%� 1 �% 3 Therefore, the percent of energy input that becomes heat, γ, is the ratio of these two
differences:

19
5 � ∆*#%4∆*�%# � *�0�%� 1 �% 3*�0�%� 1 13
5 � 1 1 ��% 1 1 ��
The following figure shows γ, the percent of energy input that is lost to heat, as function
of α. At low values the pressure difference between the residual pressure at the end of the
cycle and the target pressure is very high, and therefore a larger percentage of input is
transformed into heat. This quantity can be shown to converge to k-1/k as alpha
approaches 1. For air, at best, 28.6% of energy input will be lost in the form of heat.
Figure 9. A percent of energy input will always be lost in the form of heat. It can be
seen that γ can be known, and therefore controlled, by varying α.
The thermodynamic analysis aids in determining feasibility of the system as well
as producing directions for design.
0
0.1
0.2
0.3
0.4
0.5
0.6
0.7
0.8
0.9
1
0 0.1 0.2 0.3 0.4 0.5 0.6 0.7 0.8 0.9 1
γ
α

20
MODELING
Detailed dynamic models were created in order to determine system-wide
operation and performance characteristics. Each component of the system was modeled
then assembled with their interactions represented within the model. Acting over the
entire system is the control system with embedded logic triggers particular to a desired
application.
Figure 10. Each component of the system was modeled independently then
connected into a system-wide model.
Compressor
There are many different compressor designs, from centrifugal to positive-
displacement, most receiving their power input through an electric motor. For this energy
storage system, it is possible to have wind power as an input, in which case a
mechanically driven, in-nacelle compressor could be investigated. However, for this
research, a compressor receiving electrical power input was assumed.

21
Figure 11. Diagram of compressor model
The compressor in this system is used to add mass to a rigid tank, increasing the
pressure in the tank. Additionally, since the compressor will be receiving input from an
external source (solar array, wind farm, etc.), the power input was considered a known
quantity. It was therefore desired to determine the mass flow rate through the compressor,
given the work input and states (pressure and volume) of the tank. The work input (per
unit mass) is equal to the integration of specific volume over the pressure change.
6� � 7 � (�898:
, 6 � � 7 � (�898:
As the goal of this model is to determine mass flow rate through the compressor given
pressure in the tank and work input, an assumption is made concerning the process of
compression. Assuming a polytropic compression process with polytropic coefficient
equal to the ratio of specific heats, k (Cp/Cv), the process is thus isentropic; substituting
into the above equation gives:
��� � �����, +, � � -+�.:<

22
6 � � 7 -+�.:< (�89
8:
The above equation describes the work required to compress a mass, m, from pressure P1
to P2.
Differentiating both sides with respect to time:
(6( � (( =� 7 -+�.:< (�89
8:> � (�( 7 -+�.
:< (�898:
? � (( =7 -+�.:< (�89
8:>
(note: the pressure in the tank, P2, and the mass of air in the tank, m, are both functions of
time). Evaluating the integrals then taking derivatives and rearranging:
(6( � (�( + � @ AA 1 1 -��<B:< 1 �
<B:< . ? ���B:< (��(�C
(�( � (6( +% � @��<B:< D ��% ? 1E 1 �
<B:< ��% C%
This equation was used to model the ideal thermodynamic relationship of the compressor;
the mass flow rate through the compressor can now be determined for a given volume,
tank pressure and power input.
Tank
Throughout the cycle of the system, the pressure, temperature, and mass (both air
and water) within the tank are constantly changing. It was assumed that even under the
expected pressure in the tank, water would be modeled as completely incompressible.
Therefore, any incremental change in volume of water leads to the same change in
volume of the air. While it is acknowledged that some of the air will be forced into

23
solution with the water, this phenomenon is assumed to have negligible impact and is
outside the scope of this effort.
Figure 12. Tank model derived from conservation of mass and ideal gas law.
In a control volume analysis with the control volume being the volume of air in the tank,
the ideal gas law states:
�� � �)$, � � �)$�%
(�( � (( F�)$�% G � (�( )$� ? ($( �)� 1 (�( �)$��
The rate of the change of the pressure within the tank is a function of the mass,
temperature and volume of the air on the tank, which are all changing in time. The mass
and volume are functions of the cycle – whether the system is charging or discharging.
The temperature is determined from the assumed polytropic compression and expansion.
��� � �����
� -��.� � � -)$� .� � �����
differentiating both sides with respect to time:

24
(( H� -)$� .� � �����I � (( 0� %�$� � �����3
F1 1 AG�%� (�( $� ? A� %� ($( $�% � 0
simplifying,
($( � $� (�( -A 1 1A .
As air or water is added or removed from the tank, the subsequent changes in
temperature and pressure can now be determined. This relationship is implemented inside
the above tank subsystem as shown below.
Figure 13. The state of the tank can be determined through the integration of all
variables that are changing in time: mass, volume, pressure, and temperature.
Turbine
When power is desired from the system, water can be removed through an
adjustable diameter nozzle and delivered through a hydro turbine. Accurately modeling
the interaction of the fluid with the turbine requires extensive computational abilities. The
performance of particular hydro turbines, such as a pelton wheel, has been documented

25
through detailed experimentation and can effectively approximate the performance of the
turbine by scaling the quantifiable power of the stream passing through the nozzle:
6K �L���M � N∆�
6K O� LPQ � RO� LPQ6K �L���M � RO� LPQN∆�
Hence, for this analysis, all dynamic and hydrodynamic effects of the turbine were
assumed to be captured in the above efficiency term.
Neglecting the minor losses and hydrostatic pressure term and assuming that the turbine
discharges to atmospheric pressure, the flowrate can be determined by:
N � 6K O� LPQRO� LPQF�� 1 ��LMG
In the above expression, W pelton is the power output desired from the turbine; the nozzle
diameter can then be adjusted such that the calculated flowrate will be achieved and the
desired power will be output.
Logic
The control system that governs the performance of the system was created using
decision matrix (truth table) criteria. To accurately model the behavior of the system
through time, the logic controller must step the system through the actual actions of the
cycle. This is analogous to actual circuitry that would be controlling valves, pumps,
switches, etc. Preliminary values were decided for compression pressure, tank volume,
and alpha; the logic then needs to compare actual pressure and volume of water in the
tank with these cutoff values and determine the decision to be performed. The sequence

26
of events that the system cycles through is described in detail Operational Cycle. The
Truth and Action Tables can be seen below. The action is determined from the Condition
Table on the left and read down the column as follows: if P is not greater than Pi and P
does not equal Phigh and P is greater than Phigh and V is greater than the product of alpha
and Vtank, etc. then perform the action at row 1 of the Action Table (Fill).
Table 1. Truth table for determining which phase of the cycle to perform. Condition D1 D2 D3 D4 Row Description Action
P > Pi F - T - Fill Fill = 1;
P ≥ Pi - T T - 1 Press = 0;
P = Phigh F - - - Extract = 0;
P < Phigh T T - - Pressurize Fill = 0;
P ≤ Phigh - - T - 2 Press = 1;
V > αVtank T F - - Extract = 0;
V ≥ αVtank T T T - Extract Fill = 0;
V = αVtank F T - - 3 Press = 0;
V < Vtank - T - - Extract = 1;
V = Vtank - F - - Nothing Fill = 0;
V ≤ Vtank T - T - 4 Press = 0;
Action: Specify a row from Action Table
1 2 3 4 Extract = 0;
System
All of the components and control logic were then assembled into a complete
system. This model, shown below, will now cycle through the operation of the system
with accurate mechanical, thermodynamic, and conservation principals. The operation of
each component (pump, compressor, turbine, valves) produces a subsequent change in
the state of the tank. These states are determined through the integration of the
differential equation governing the tank. This state is monitored by the logic criteria and a
decision is sent to the controller.

27
Figure 14. Complete system with embedded logic and controller to cycle through the
process.

28
OPERATIONAL CYCLE
There are a variety of ways in which this energy storage system can behave. Due
to the nature of the proposed system, continuous operation is not possible, therefore, a
cyclic batch process is proposed. A possible sequence is shown below: fill the tank with
water to the level dictated by the desired alpha, compress the air above the water, extract
energy by releasing the water through the turbine, vent the residual pressure to another
tank or the atmosphere then re-fill the tank. There are many different possibilities of not
only performing events in parallel and series (compressing air while extracting water) but
modified thermodynamic cycles as well (different venting algorithms).
Figure 15. CF-CAES cycle.
Pressurize
Extract
Vent
Fill

29
Pressurize
Beginning with the state where the tank contains a particular amount of water, the
compressor is allowed to operate and increase the pressure of the air above the water. The
volume of air can be ducted to another storage vessel or a series of tube trailers.
Whatever the configuration, the chosen value of alpha can still be obtained, even though
multiple tanks might exist.
Extract
Once the air pressure meets the target value, energy can be stored until needed.
The time that the system will store the energy before dispatching it to the grid is
dependent on the application. When power is demanded, water is released through the
hydro turbine (impulse, Pelton style) which drives a generator, creating electric energy.
The power output of the hydro turbine can be controlled through use a variable diameter
nozzle; this provides a range of power outputs. For example, as the water is released and
the air pressure in the tank decreases, the nozzle can respond in such a way as to provide
a constant power output throughout the extraction.
Loop
As was discussed earlier, once the tank is empty of water, it is most likely not at
atmospheric pressure, and therefore a significant amount of stored energy still remains. In
order for the cycle to loop, water needs to be added back into the tank. Water cannot be
pumped back into the tank when the air is under such high pressure without further
design considerations. Likewise, it is not desirable to vent the residual pressure to

30
atmospheric, as there is still a substantial amount of energy stored in the system. Using
the state analysis for internal energy that was previously used in Thermodynamic
Analysis, the percent of stored energy that is remaining in the tank after expansion (c to d
below) can be derived:
Figure 16. Energy extraction causes the expansion of air and thus a drop in
temperature.
The internal energy at state c as a function of the initial internal energy,
*4 � *��%
And at state d,
*� � *���%�
The percent of stored energy remaining in tank after expansion, ε, is the ratio of these two
energies,
S � *�*4 � *���%�*��% � ��%�
�% � ��%�

31
This relationship can be seen in the following figure.
Figure 17. After expansion, a fraction of the energy input still remains in the tank.
A venting algorithm was developed to address this issue of residual pressure and
stored energy remaining in the tank after extraction, Figure 18. In this procedure, a
second tank nearly equal in size to the volume of water is used to collect the water during
discharge. Once extraction is complete, the two tank pressures are equilibrated. Given
that the second tank contains very little air, the residual pressure remains essentially
unaffected. An unbiased pressure difference now exists between the tanks and water can
be pumped from one to the other. The end result of this algorithm is the original tank
filled with water and containing the residual air pressure; the second tank contains just
air, also at the residual pressure. The second tank is then either vented or used in a
secondary process. If vented, stored energy is still being lost, but just a fraction of the
amount remaining in the tank. During the next cycle, the original tank is no longer being
00.10.20.30.40.50.60.70.80.9
1
0 0.1 0.2 0.3 0.4 0.5 0.6 0.7 0.8 0.9 1
ε
α

32
pressurized from atmospheric to a particular target pressure, but beginning at the residual
pressure.
High
Pressure
Residual
Pressure
Residual
Pressure
Residual
Pressure
Residual
Pressure
1 atm
(a) (b)
(c) (d)
Turbine
Open valve
Pump
Open valve
Secondary Process
Figure 18. A venting algorithm must be used in order to avoid the venting of all
residual pressure remaining in the tank after expansion.
An advantage of this venting algorithm is that the tank begins the next cycle with
the air compressed to the residual pressure. In this case the system is cycling between the
high and residual pressure, never requiring atmospheric venting. As was previously
discussed, α determines both the energy input and how much useful energy can be
extracted.

33
Figure 19. In utilizing the venting algorithm, the initial pressure in the tank is the
residual pressure.
The energy output from the system can be determined from the change in internal energy
during expansion (b) to (c) in Figure 19:
6P�L � *4 1 *# � �4+,$4 1 �#+,$#
6P�L � +,) F�4�4 1 �#�#G � +,) F��4�# 1 �#�#G � +,) F��4�# 1 �����#G
6P�L � +,) �4�#F� 1 ��G
Similarly, the energy input to the system utilizing the venting algorithm to keep the initial
pressure in the tank at residual pressure is derived by integrating the specific volume over
the change in pressure:
6� � 7 � (�8T
8U, 6 � � 7 � (�
8T
8U
once again assuming a polytropic compression:
��� � �����

34
and that the initial pressure in the tank is equal to the residual pressure:
�������� � �!�"!��
�� � �# � �4��
substituting these relationships and integrating, the work input to the system assuming the
described venting algorithm, as a function of α is:
6�Q � +,) �#�� D� 1 � <
<B:E
For an α value close to 0 (little air initially in system), the pressure drops too quickly
while the air expands over the large distance to extract any significant amount of energy.
Similarly, for high α (little water initially in system) there is too little distance for the
compressed air to expand over and all the water is expelled before the air fully expands;
also extracting very little energy. Similarly, since the system starts the cycle with residual
pressure in the tank, at α values close to 1 and 0, the amount of energy input to the system
goes to zero. Figure 20 shows this relationship.

35
Figure 20 The quantity of both energy input and output is a function of the amount
of water initially stored in the tank, or specifically, α.
As the energy input and output are functions of α, the efficiency of a system
acting under this venting algorithm is as well. Assuming adiabatic heat recuperation
during compression/expansion, and ideal component performance, the inefficiencies of
the system are a result of venting losses only. This efficiency, η, of the venting algorithm
can be determined from the ratio of energy output and input terms.
R � 6P�L6�Q
�+,) �4�#F� 1 ��G
+,) �#�� D� 1 � <<B:E
R � � 1 ��
� 1 � <<B:
Under these assumptions, an upper-bound efficiency can be calculated, Figure 21.
0
0.05
0.1
0.15
0.2
0.25
0.3
0.35
0.4
0.45
0.5
0 0.1 0.2 0.3 0.4 0.5 0.6 0.7 0.8 0.9 1
Ener
gy
α
Energy In
Energy Out

36
Figure 21. Upper-bound efficiency of the system as a function of α.
Fill
For the cycle to begin again, the tank must be filled with water to a particular
height. As was previously shown, this ratio of water to air is a very important parameter
in the performance of the system. The amount of water that the tank should initially hold
is not necessarily an optimization problem, but a design consideration pertaining to the
particular application. In this step, water is pumped into a vented tank such that air is not
being compressed in the process.
0
0.1
0.2
0.3
0.4
0.5
0.6
0.7
0.8
0.9
1
0 0.1 0.2 0.3 0.4 0.5 0.6 0.7 0.8 0.9 1
Eff
icie
ncy
α

37
PARAMETERS
The thermodynamic analysis and dynamic modeling of the system and its
components has provided a means to investigate the performance of the system under
various conditions. The quantities that govern the effectiveness of this energy storage
system are: energy capacity, power capacity, and duration of storage. There are
parameters that affect these characteristics, as well as the cost of the system. Energy
capacity is a function of both compression pressure and tank volume; these are referred to
as cost variables. For a given compressor and turbine, the cost of the system (the tank)
scales directly with the size and wall thickness of the pressure vessel. Power capacity is
also a function of the cost variable pressure, but not volume. The parameter ‘alpha’ is
designated as a performance variable because its value directly influences energy
capacity but does not contribute to cost.
Table 2. Different parameters effect energy and power capacities, as well as cost
Influencing Factors Variable
Parameters Cost Energy Power Type
Target Pressure x x x Cost
Tank Volume x x - Cost
Alpha - x - Performance

38
OPERATION
Through use of the dynamic model, a simulation of the system can operate under
various inputs and desired outputs. Tank size and operating pressures can be adjusted and
their effect on the performance investigated. For the standard configuration, each step of
the cycle that was previously discussed is necessary during operation.
One desired performance metric for this system is adequate lead time notification
to the grid operator. With different parts of the country operating under different power
scheduling times (15 minutes up to 1 hour), it was desirable for this system to provide
such predictability. By monitoring the level of compression in the CF-CAES System, the
operator can accurately predict how long it will take for the system to go online at a
certain power level. Additionally, if that power level is maintained, appropriate
notification could be made to the grid operator concerning when the system will be going
offline.
Batch Operation
With a single tank system there will always be a discontinuity in power output as
a result of the system cycling through its loop: eventually the tank will run out of water.
Some applications may desire an uninterrupted power output from the system; this can be
accomplished through a multiple tank system. As one tank is charging (drawing power)
the other is discharging (providing power); the two can be sized appropriately to provide
a necessary out-of-phase relationship and have a continual power output achieved.

39
However, because of the expected flowrates both into the tank (pumping phase) and out
of the tank (power output phase), the time scales for drawing power and providing power
are not necessarily evenly matched. This irregularity would lead to times when both tanks
are pumping and not providing power. A third (or more) tanks could be added to the
system to balance this timing issue. Examples of multiple tank batch operation can be
seen in the following section.

40
APPLICATION STUDIES
This energy storage system is design to be adaptable to many different scenarios
and applications. Potential customers include grid operators, renewable energy electric
generation operators and merchant storage facilities.
Grid operators are tasked with balancing generation and load. They generally
have no control over the load (demand side), but have been able to control the generation
side by increasing or decreasing fuel consumption. With the addition of intermittent
generators, the act of balancing becomes more difficult. Energy storage systems, such as
CF-CAES, can assist in balancing load and generation.
Owners/operators of wind and solar electric generation facilities are potential
customers in that energy storage could allow them to sell electricity to the grid when
demand is high, rather than only when the wind is blowing or sun is shining. Policies
governing electric utilities vary state to state in the US. Many regulatory agencies are
considering time-of-use pricing for retail customers. In these markets, it is possible that
regulators would allow utilities to pay a higher rate ($/MWh) for energy that is
dispatchable according to demand schedules. This would provide economic incentives
for owners/operators of wind and solar generators to purchase energy storage systems,
such as CF-CAES.
Finally, merchant storage facilities are potential CF-CAES customers. Merchant
storage facilities take advantage of fluctuations in the energy markets, purchasing energy
when demand is low, storing it, and selling it when demand is high. Merchant facilities

41
currently use a mix of storage technologies, with pumped-hydro being predominant in the
western US. The McIntosh CAES plant in Alabama is a merchant facility. Pumped-
hydro and CAES both provide low-cost bulk storage technology, but are site specific;
CAES also requires burning of natural gas. The proposed CF-CAES is site independent
and does not require burning natural gas, making it an attractive option for merchant
facilities.
For the following simulations, various power output routines can be maintained to
meet the above described application:
• output to follow a daily load curve (grid operators)
• constant power output (renewable energy electricity generation operators)
• daily scheduled power output, such as to meet peak demand (merchant storage
facilities).
Grid Operators
For the first two simulations, wind data from a site in southern Idaho was used to
develop the input profile for the compressor. The number of tanks and sizes were chosen
from OEM information. The parameters of the simulation can be seen below. The value
of α was chosen from the modeling information to balance the increased efficiency at
lower alphas with the decreased energy output.

Table 3. Parameters used in Grid Operator and Renewable Energy Generation
CF-CAES Parameters
No. tube trailersTank pressureTotal volume
α Wind Turbine Parameters
No. TurbinesType
The goal of utilizing energy storage for a grid operator is to take an intermittent source
and provide a predictable, dispatchable output.
Figure 22. Typical demand curve for a single day.
. Parameters used in Grid Operator and Renewable Energy Generation
simulations.
CAES Parameters
No. tube trailers 10 Tank pressure 2850 psi Total volume 4,379 m3 – NTP
(26.3 m3 – water volume) 0.25
Wind Turbine Parameters
No. Turbines 13 GE 1.5MW
The goal of utilizing energy storage for a grid operator is to take an intermittent source
and provide a predictable, dispatchable output.
Typical demand curve for a single day. California, July 15, 2007
(Lawrence Berkeley National Lab)
42
. Parameters used in Grid Operator and Renewable Energy Generation
The goal of utilizing energy storage for a grid operator is to take an intermittent source
California, July 15, 2007

43
A typical demand curve can be seen above in Figure 22; the line at the top of the
figure is power capacity of the system, the bottom line is imported power, the stepped
line is the forecast of the smooth actual load curve in blue. Grid operators are tasked with
balancing the load with the supply from the utility. Thus, the objective of this simulation
was to provide a power output from the CF-CAES system to follow this daily trend,
which is modeled as a sine function with a period of one day, the maximum occurring at
3:00pm. The results from this simulation can be seen in the following figure.
Figure 23. One week simulation. Power input from wind energy, power output
controlled to follow the trend of a daily load curve.
Throughout this one-week simulation, the maximum amount of stored energy at a
single time was 2.2 MW-h. Throughout the course of the week, 134 MW-h were input,
and 88.1 MW-h were output; this results in a roundtrip efficiency of 65.7%.
0 1 2 3 4 5 6 70
2
4
6
8
10
12
14
16
18
20
Time (days)
Pow
er (M
W)
Wind Power
Energy Storage Power Output

44
Renewable Energy Electricity Generation Operator
The desired outcome of this application is to shape the power output from an
intermittent wind energy source to the grid. When the wind is blowing, power is being
provided to the compressor and energy is being stored in the compressed air. The control
system for this simulation mandates that a constant power output be continually provided.
This was accomplished through the previously mentioned multiple tank batch operation,
each of the four tanks functioning out of phase of one another. The following figures are
the results of the simulation. Below, the power output is continually maintained at a
constant level.
Figure 24. Multiple tank batch operation used to provide uninterrupted power
output.
The following two figures show the how the pressure and water volume of the
tanks change throughout the course of a day of the one-week simulation.
0 1 2 3 4 5 6 70
2
4
6
8
10
12
14
16
18
20
Time (days)
Pow
er (M
W)
Wind Power
Energy Storage Power Output
45
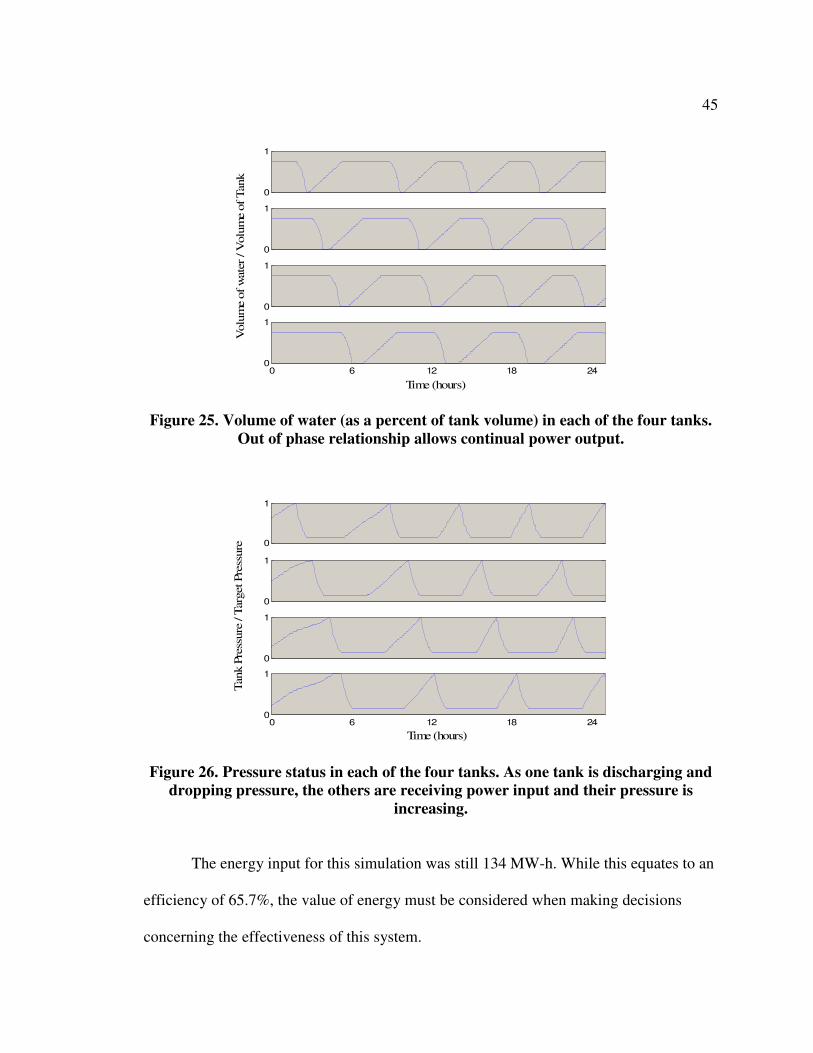
Figure 25. Volume of water (as a percent of tank volume) in each of the four tanks.
Out of phase relationship allows continual power output.
Figure 26. Pressure status in each of the four tanks. As one tank is discharging and
dropping pressure, the others are receiving power input and their pressure is
increasing.
The energy input for this simulation was still 134 MW-h. While this equates to an
efficiency of 65.7%, the value of energy must be considered when making decisions
concerning the effectiveness of this system.
0
1
0
1
0
1
Volu
me o
f w
ate
r / V
olu
me
of Tank
0 6 12 18 240
1
Time (hours)
0
1
0
1
0 6 12 18 240
1
Time (hours)
Tank P
ress
ure
/ T
arg
et Pre
ssure 0
1

46
It should be noted that any energy storage system comes at a price of reduced
delivered energy. Energy losses in the compressor due to mechanical inefficiencies and
heat transfer, as well as inefficiency in the turbine and generator add up to a reduced
overall capacity factor for the system. The efficiency of these simulations only considers
the losses associated with the venting algorithm; all heat transfer was assumed to be
adiabatically recaptured in the cycle. This issue is the subject of continuing research and
is recognized as an important performance factor in assessing storage methods and
specific designs. However, it should be noted that capacity factor is not the only means to
gage performance. Dispatchable energy is more valuable to grid operators than non-
dispatchable. By having the knowledge of when this system will go online, and with
exactly what power capacity and duration, makes its energy more valuable.
With increased renewable energy penetration onto the grid, it’s not just the
unpredictability of wind or solar energy that is a concern for the utility. Certain events
can occur during normal operation of a wind farm that greatly strain the utility. For
example, if a wind farm is experiencing high winds, the turbines are producing a
considerable amount of power. If a wind gust, even a very short one, sends the turbines
past their cutoff speed, they enter a shut-down scenario. This is problematic to the utility
because very rapidly they lose a significant amount of power being put on the grid. It can
take up to 30 minutes for the turbines to come back online and begin producing power
again. Through use of the proposed CF-CAES system, situations such as this could be
drastically less problematic for the grid operator.

47
Merchant Storage Facility
Another application for the CF-CAES system is through use as a merchant storage
facility. In this scenario energy is drawn from the grid during low cost, off peak hours
and supplied during peak, high cost times. The two current compressed air energy storage
systems in Germany and Alabama are both examples of this application.
Although power will still be drawn from the grid, the energy storage system can
still be characterized as ‘carbon-free’ because during the energy recovery stage no natural
gas combustion is required. In the simulation results shown below, 10.65 MW-h were
input to the system during the evening and night. During peak demand, 7 MW-h were
output, resulting in the same efficiency as in the previous two simulations: 65.7%. This
consistent efficiency, independent of application and power output, is a function of alpha
only.
Figure 27. Merchant storage facilities store low-cost, off peak energy and sell it back
in times of high demand.
0 4 8 12 16 20 240
0.5
1
1.5
2
2.5
3
3.5
4
4.5
5
Time (hours)
Po
we
r (M
W)
Power Input
Power Output

48
A merchant storage facility operating in response to certain energy markets can
not only effectively supply power when demand is high, but dynamically receive power
as well. Throughout the course of the year, certain situations arise where wind farm/grid
operators are forced to pay other utilities to take surplus power. These events correspond
to times when many wind farms suddenly begin operating and demand is not high enough
balance the supply. As wind farms already operate under very small financial margins,
paying another utility to take their sole commodity is very unfavorable. Contractual
arrangements can be established with a merchant storage facility to provide a means of
unloading power during these times at pre-established rates, thus greatly mitigating the
loss associated with spot market rates.

49
CONCLUSIONS AND FURTHER RESEARCH
It is becoming widely recognized that a variety of solutions are present to the
global energy issues that the world is facing. The need for investment in energy storage
infrastructure is rapidly becoming evident.
The proposed energy storage system, Carbon-Free Compressed Air Energy
Storage, presents a new technology that could be capable of meeting the integration
burdens posed by renewable energy. For an energy storage system to feasibly mitigate
these problematic issues, it must be able to do so without incurring too great a reduction
in delivered energy. It must be efficient enough in order to be both technologically and
economically feasible. Barriers exist which challenge the feasibility in both regards.
Technological Barriers
Application specific performance was simulated by implementing the results of
the thermodynamic analysis into a fully functioning dynamic model. The required input
of certain physical parameters into the model allowed the calculation of all other physical
variables. Specifically, nozzle flow rate, compressor mass flow rate, and pumped water
flow rate, which are initially dependent variables, were determined. No constraints were
established to limit the bounds of these variables. As such, under certain conditions their
values may be unrealistic.

50
Pelton Turbine
For an energy storage technology to be viable, the power level that it can deliver
the stored energy is a very important parameter. In the case of CF-CAES, power is
delivered by means of a Pelton style hydroturbine, which are sized according to flow rate
and pressure. Considering the high-head, low flow applications suitable for CF-CAES,
this would result in a very unconventional turbine design: very large diameter, small cup
geometry. Several immediate options exist in approaching this barrier: custom turbine
design, parallel/series operation, or re-evaluation of energy removal technique. Further
research is necessary to undergo complete mechanical design of the system and establish
appropriate constraint on flow rate.
Tank Size
The two competing factors governing tank size are internal pressure and volume.
For large scale energy storage, it is desirable for both parameters to be as great as
possible. It is no surprise that they are not only proportional to cost, but quickly reach
bounds that limit design adjustments for both. Because of this limitation on a single tank
design, further research needs to confront the issues associated with multiple tanks used
for a single CF-CAES system. Tube trailers were investigated as a scalable means to
store large quantities of compressed air, with a separate large tank containing water.
However, as an air/water interface would still need to exist, the tank containing water
would still be under the high pressure of the air and thus, must be sized accordingly.

51
Roundtrip Efficiency
An upper bound in roundtrip efficiency is dictated by the venting algorithm: the
mass of compressed air that is transferred to a second tank allowing water to be pumped
back into the initial tank is either vented or used in another process. The actual efficiency
of the system would be a function of the thermodynamic process and the unavoidable
destruction of useful to energy to heat. Additionally, each component in the system
operates under its own efficiency, which must all be considered when establishing a
roundtrip efficiency for the system. This study aimed to determine the maximum
operating efficiency of the system under ideal conditions.
Economic Barriers
To assess the economic feasibility of CF-CAES, it must be viewed in the
appropriate economic environment. A system such as this is designed proactively to be
employed when conditions exist that require its application. There are unavoidable capital
costs that pose considerable barriers; namely, those costs associated with the solutions to
the aforementioned technological barriers. A newly designed Pelton turbine is a
considerable cost, particularly when noted that its only likely application is in an
emerging technological market. Likewise, great expense can be accrued in the design and
fabrication of specialized tanks, piping, and manifolds to enable a sophisticated air/water
interface.
In addition to the economic barriers associated with capital costs, there are
barriers to the acceptance and integration of energy storage into various utilities energy

52
portfolios. Pricing schedules, required performance metrics, and development costs are
all hurdles that the energy storage industry is overcoming.
It is evident that barriers exist to the development of this technology, but they can
be confronted with increased research and design. Additionally, the heightened necessity
of energy storage as a facilitator to renewable energy integration will aid to increase its
potential. Large scale energy storage technology has the opportunity to enable levels of
renewable integration into the national grids necessary for their objectives to be met.

53
REFERENCES
1. 20% Wind Energy by 2030: Increasing Wind Energy’s Contribution to U.S.
Electricity Supply. July 2008. U.S. Department of Energy, Office of Energy Efficiency and Renewable Energy.
2. The VRB Energy Storage System (VRB-ESS). 2007, VRB Power Systems, Inc.:
Richmond, BC. p. 12. 3. van der Linden, S., Bulk energy storage potential in the USA: current
developments and future prospects. Energy, 2006. 31: p. 3446-3457. 4. Cavallo, A., Controllable and affordable utility-scale electricity from intermitent
wind resources and compressed air energy storage (CAES). Energy, 2007. 32: p. 120-127.
5. Bullough, C., C. Gatzen, and C. Jaikiel. Advanced adiabatic compressed air
energy storage for the integration of wind energy. European Wind Energy
Conference & Exhibition. 2004. London, UK. 6. Ramakumar, R. Energy storage options of harnessing wind energy. in 5th Annual
Energy Sources Technology Conference and Exhibition. 1982. New Orleans, LA: American Society of Mechanical Engineers.
7. Enis, B., P. Lieberman, and I. Rubin, Operation of hybrid wind-turbine
compressed-air systems for connection to electric grid networks and
cogeneration. Wind Engineering, 2003. 27(6): p. 449-459. 8. Castronuovo, E. and J. Lopes, Optimal operation and hydro storage sizing of
wind-hydro power plant. Electrical Power and Energy Systems, 2004. 26: p. 771-778.
9. Mears, L., H. Gotschall, and H. Kamath, EPRI-DOE Handbook of Energy Storage
for Transmission and Distribution Applications. 2003, Electric Power Research Institute: Concord, ,CA.
10. Mears, L., et al., Energy Storage for Grid Connected Wind Generation
Applications. 2004, Electric Power Research Institute: Concord, CA.

54
11. Bell, T., Natural energy conversion, storage and electricity generation system, U.P. Office, Editor. 1980: USA. Patent #4206608.
12. Gardner, J., Underground pumped liquid energy storage system and method, U.P.
Office, Editor. 1980, Oros Company: USA. Patent #4182128. 13. Heidenreich, D., Compressed air pumped hydro energy storage and distribution
system, U.P. Office, Editor. 2007, EB Group, Inc. Patent #7281371. 14. Energy Storage Association website. Visited 10/17/08.
http://www.electricitystorage.org

55
APPENDIX
Matlab/Simulink Models

56
Initialization.m
%% Initialization File % This File creates variables for the CF-CAES model % simulations.
alpha=0.25; %Percent of initial water height to tank height V_tank=1000; %Volume of tank [m^3] P_high=204*101000; %Target Compression Pressure [Pa]204
%% Load Wind Data load WindSpeed load PowerCurve WindPower=interp1(pcwind,pcpower,WindSpeed); WindPower=WindPower*13; %Use 13 turbines
%% Generic Tank (Volume) Vi_a=V_tank*alpha; %Initial Volume of Air in tank [m^3] Vi_w=V_tank-Vi_a; %Initial Volume of water in tank [m^3] alphaV=alpha*V_tank; %% Compressor Initialization Comp_EFF = 1; % Compressor efficiency for 1st stage n = 1.4; % polytropic constant for compression process
T_i=300; %K %% Pelton Initialization Pelton_Eff=1; %Efficiency of Pelton wheel, 0.6 %% Physical Parameters rho_w=1000; %Density of water [kg/m^3] g=9.81; %Acceleration due to gravity [m/s^2]
%Properties of Air Cv_a=0.7179; %[kJ/kg-K] Cp_a=1.005; %[kJ/kg-K] k_a=Cp_a/Cv_a; R_a=Cp_a-Cv_a; k=k_a; %% Pressures Patm=101000; %[Pa] Atmospheric Air Pressure P_res=P_high*alpha^1.4; %Residual Pressure in the Tank after Expansion
[Pa] P_i=P_res; %Initial pressure in tank P_inlet=Patm; %Compressor Inlet pressure
m_i=(P_i*V_tank)/(RGAS*T_i); C=P_i*(V_tank/m_i)^k_a; %% save Logic_Init alpha P_i P_high P_res V_tank global alpha P_i P_high P_res V_tank alphaV

Figure A. 1 Simulink model of a four system batch operation
kW to W
1000
W-s to kW-h
-K-
Saturation
Maintain
Continual
Power Output
A
B
C
D
In4
Out3
Out5
Out6
Out7
MW to W
-K-
[Time 3 WindPower ]
1
s
[D_Out]
[B_Out]
[A_Out]
[C_Out]
[B_Out]
[A_Out]
[D_Out]
[C_Out]
Efficiency
-K-
DFES 4
Power Input
Desired Power
Energy In A
Output Power Switch
Power Out
Power In
DFES 3
Power Input
Desired Power
Energy In A
Output Power Switch
Power Out
Power In
DFES 2
Power Input
Desired Power
Energy In A
Output Power Switch
Power Out
Power In
DFES 1
Power Input
Desired Power
Energy In A
Output Power Switch
Power Out
Power In
Power_Output
1/4 to each
1/4
Total_E_In
Power_Wind
Total_Power_Out
Energy_Stored
Energy_Out
Total_Power_In
Power_Unused

Figure A. 2 Single System Model
Power In
4
Power Out
3
Output Power Switch
2
Energy In A
1
gain
-K-
V_tank
-C-
-C-
alphaV
Water Pump
f(u)
W-s to kW-h
-K-
Truth Table 1
P
V
alphaV
P_i
P_high
V_tank
Fill
Press
ExtractTank
Vdot_water_In
mdot_air_Out
mdot_air_In
Vdot_water_out
V_air
Pressure
m_air
Power_OutA
dPdt
Switch
Pelton
f(u)
P_inlet
Integrator
1
s
0
Compressor
Efficiency
-K-
Compressor
f(u)
Desired Power
2
Power Input
1
V_air
Pressure
Vdot_water_In
Vdot_water_out
mdot_air_Out
mdot_air_In
Power_In Energy_InA

Figure A. 3 Tank Model
dPdt
5
Power_OutA
4
m_air
3
Pressure
2
V_air
1
m,V,T -> Pdot
MATLAB
Function
-1
V_tank
Transfer Fcn 1
1
.01s+1
Scope
Product 2
Product 1 Pelton
Efficiency
-K-
Patm
Patm
Integrator 4
1
s
1
s
1
s
1
s
(k-1)/k
-C-
Vdot_water_out
4
mdot _air_In
3
mdot _air_Out
2
Vdot_water_In
1
mdot_air
Vdot_water
m_air
PPdot
Power_OutA
Vdot_air
V_waterV_air
Tdot_air
T_air
