carbon footprinting of crop production - scri · fungicide/nematicide 3.16 2 6.32 insecticide 0.36...
TRANSCRIPT

Carbon footprinting of crop production
Jonathan Hillier1, Alex Hilton2, Stuart Wale2, Cathy Hawes3, Geoff Squire3, Pete Smith1
1. School of Biological Sciences, Cruickshank Building, St Machar Drive, University of Aberdeen, AB24 3UU, UK
2. Scottish Agricultural College, Ferguson Building, Craibstone Estate, Aberdeen. AB21 9YA.
3. Scottish Crop Research Institute, Invergowrie, Dundee. DD2 5DA

Plan• Atmospheric CO2 and global warming• Bioenergy crops potato• Bioenergy crops (for methodology)• Comparison of farm-gate C footprint of potato
with other crops– 3 examples– are potatoes good or bad?
• Uncertainties• Transport• Scope for mitigation

Atmospheric CO2 and global warming
http://en.wikipedia.org/wiki/Global_warminghttp://en.wikipedia.org/wiki/Carbon_dioxide
http://www.guardian.co.uk/environment/2008/jun/22/climatechange.carbonemissions“The majority of the British public is still not convinced that climate change is caused by
humans - and many others believe scientists are exaggerating the problem…”
humans CO2 (IPCC – very likely)CO2 global warming (IPCC – unequivocal)

Annual GHG emissions – sector and compound (Mt CO2 eq)
Emissions, UK
567.3
26.8
45.8 11.1
Energy
Industrial Processes
Agriculture
Waste
Emissions by Gas
572
40.6
40.4
CO2
CH4
N2O
http://www.ghgi.org.uk/sector.html

How I ended up working on potatoes
Aberdeen University
Soil C&N modelling & Climate change
Jon Hillier (emissions/carbon footprint of bioenergy crops)
Pete Smith
SAC
Alex Hilton (Crop Services)
Stuart Wale (Crop Services)
SCRI
Cathy Hawes (Environment Plant Interactions, Farm surveys)
Geoff Squire (Environment Plant Interactions)
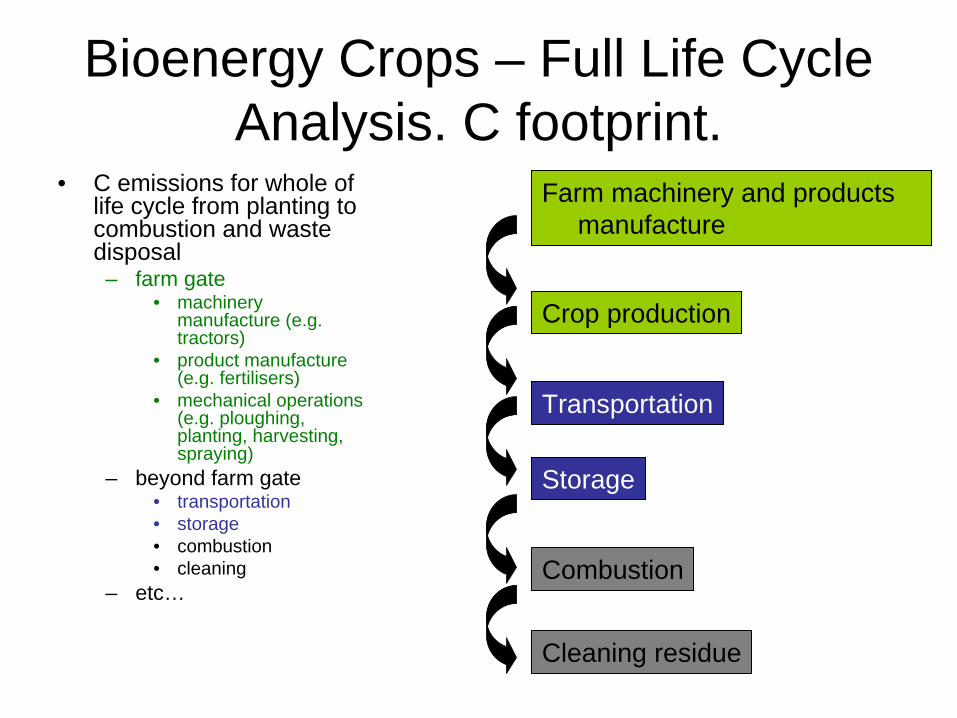
Bioenergy Crops – Full Life Cycle Analysis. C footprint.
• C emissions for whole of life cycle from planting to combustion and waste disposal
– farm gate• machinery
manufacture (e.g. tractors)
• product manufacture (e.g. fertilisers)
• mechanical operations (e.g. ploughing, planting, harvesting, spraying)
– beyond farm gate• transportation• storage• combustion• cleaning
– etc…
Crop production
Farm machinery and products manufacture
Transportation
Storage
Combustion
Cleaning residue

Farm gate emissions - method
• Need to know – what is done to the field (management)– emissions for each operation/unit of product applied
• Growers guides• Data for emissions mostly obtained from Lal
2004, Carbon emissions from farm operations. Environment International 30: 981-990.– product (fertiliser, herbicides, insecticides, fungicides)
manufacture & storage)– emissions from diesel used in mechanical operations

Miscanthus SRC Winter Wheat OSR
Soil preparation (e.g.ploughing, drilling, discing, etc) 21.674 19.094 28.2 16.3
Fertiliser (N,P,K) 0 0.72 487.16 500.584
Crop protection (pesticide, herbicide, etc) 6.08 10.9 49.45 26.85
Harvesting 13.3 3.3333 17.95 10
Total 41.054 34.0473 582.76 553.734
Management C emissions (kg CE/ha/yr)
0
100
200
300
400
500
600
700
Miscanthus SRC Winter Wheat OSR
Soil preparation
N Fertiliser
Crop protection
Harvesting
Total

N is BAD!
• For every 100kg N applied 1.25 kg N is emitted as N2 O (IPCC – Bouwman et al*).
• N2 O is a BAD greenhouse-gas! – global warming potential (GWP) of 310– 1 kg of N2 O is equivalent to 310 kg of CO2 .
• (from molecular weights) every 1 kg N applied gives emissions equivalent of 6.08 kg CO2.
• Or 1.66 kg C
• Add production cost (Lal 2004), of 1.3 kg C/kg to get 2.96 kg C/kg N produced
• e.g. 200 kg of N fertiliser adds 0.6 tonnes C to the C footprint
Bouwman et al 2002, Emissions of N2 O and NO from fertilised fields: Summary of available data, Global Biogeochemical Cycles, 16(4): 1058.

Potato, Winter Wheat, Oilseed Rape
Winter Wheat Oilseed Rape Potato
Soil preparation/planting (mechanical) 3 4 6
Fertiliser N 197 190 200
Crop protection 7 6 10
Harvest 2 2 3
Other irrigation
Koga et al (Eco & Env 2003, 99:213-9)
HGCA growers guide, DEFRA fertiliser recommendations SAC, Alex Hilton

Potato footprint - approximately 924 kg CE/ha/year
(SAC potato newsletter)
Flailing
FungicideHarvest
Herbicide
Insecticide
Irrigation
K-FertiliserN-Fertiliser (production)
P-Fertiliser
Planting
Soil Preparation
sprayDirect N2O emissions

0.0
100.0
200.0
300.0
400.0
500.0
600.0
700.0
800.0
900.0
1000.0
Soil p
repa
ratio
n
Ferti
liser
(N,P
,K)
Cro
p pr
otec
tion
Har
vest
ing
Oth
er
Tota
l
emis
sion
s, (k
g C
E/ha
/yea
r)
Winter WheatOSRPotato
Winter Wheat OSR Potato
Soil preparation 28 16 75
Fertiliser (N,P,K) 583 562 644
Crop protection 49 26 153
Harvesting 18 10.0 29
Other 0.0 0.0 23
Total (kg CE/ha/year) 679 616 925
• Conducted by SCRI and SAC (part of the Scottish Government funded work programme)
• actually conducted for studying biodiversity and soil resilience but the farm management component is useful to us
• 57 farms in Scotland• range of crops• organic, LEAF, and “conventional” farming• only “conventional” is considered here (sadly only 1
potato crop in this group)
Farm surveys

642.23Total footprint kg CE/ha
6.3223.16Fungicide/nematicide
0.3610.36Insecticide
6.316.3HerbicideCrop protection
00.16Amendments
00.16Lime
00.071FYM
29.11940.15K
28.41420.2P
513.852152.39NFertiliser
Quantity
C cost per kg applied (kg CE/kg AI)Additions
5.790.319.3Baling
0.720.51.44Carting
9.990.333.3CombiningHarvesting
C cost (kg CE/hour)Removal
5.641.4Herbicide spraying
2.730.9Fertiliser sprayingProduct Application
06.9Potato planter
11.3111.3Subsoiling
1.711.7Rolling
06.4Other sowing/planting
3.213.2Combo Drilling
03.2Direct drill
05.8Discing
1.711.7Harrowing
15.2115.2PloughingSoil preparation
TotalsWinter wheatC cost (kg CE/ha)Mechanical operations

Farm surveys
Quality v consistency
• Two different estimates – from using:
1. “typical” management or growers guides – different levels of detail
2. farm surveys - consistent methodology but less detailed model

A simpler model to compare crops
-1 sd mean +1 sd
Soil preparation/planting (mechanical) 1.60 6.16 10.71
Fertiliser N 2.66 2.96 3.26
Fertiliser P 0.14 0.20 0.26
Fertiliser K 0.09 0.15 0.21
Crop protection 1.96 4.83 7.70
Harvest 2.96 7.13 11.29
Irrigation 1.35 39.31 77.27
Winter Wheat Oilseed Rape Potato
Soil preparation/planting (mechanical) 3 4 6
Fertiliser N 197 190 200
Fertiliser P 66* 42* 150
Fertiliser K 98* 76* 150
Crop protection 7 5 10
Harvest 1 1 3
Irrigation 0 0 1
From Lal 2003 Combining growers guides and farm survey*
• “Best” estimates for management• Equivalent level of detail• Variation in management from emissions included
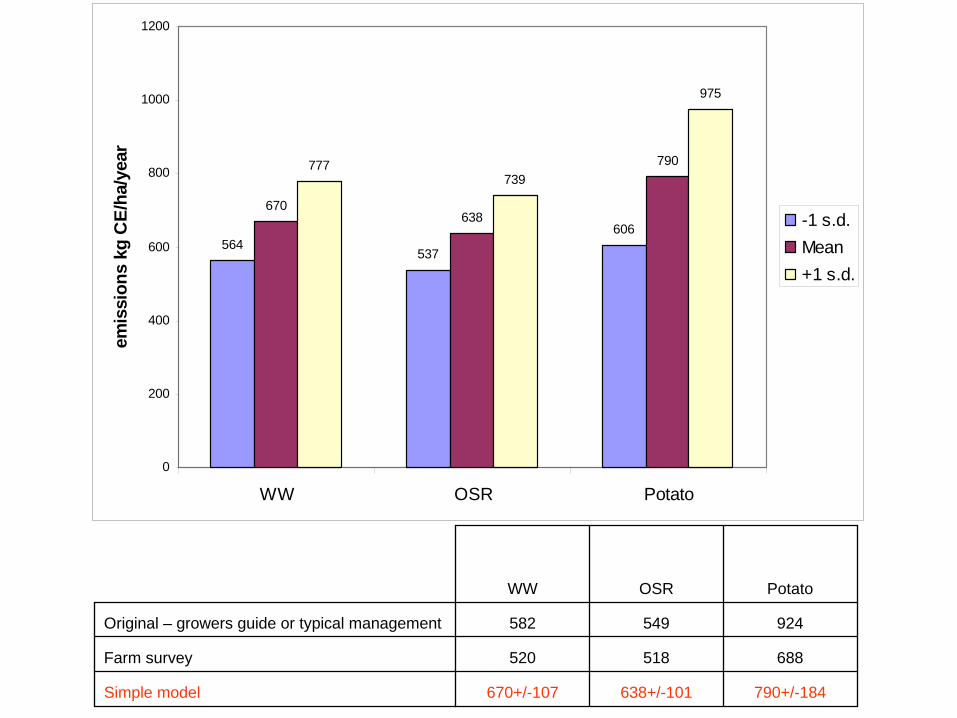
WW OSR Potato
Original – growers guide or typical management 582 549 924
Farm survey 520 518 688
Simple model 670+/-107 638+/-101 790+/-184
564537
606
670638
790777739
975
0
200
400
600
800
1000
1200
WW OSR Potato
emis
sion
s kg
CE/
ha/y
ear
-1 s.d.Mean+1 s.d.

Per ha, potatoes are bad Per tonne yield, potatoes are good!
Per tonne DM yield (Pot 20%, WW 85%, OSR 91%)
Per GJ (food)
CF/hectare
0100200300400500600700800900
WW OSR Potato
CF/tonne yield
0
50
100
150
200
WW OSR Potato
CF/GJ
0.00
1.00
2.00
3.00
4.00
5.00
6.00
WW OSR Potato
CF/tonne DM yield
0
50
100
150
200
250
WW OSR Potato

Uncertainties? (almost everywhere!)
• Fuel usage – Lal’s data goes back to the 70s - improved efficiency
over last 30 years– soil properties
• N emissions– production emissions – soil properties– simulation models – validation via experiment
• Crop protection – huge range of products– some information may be commercially sensitive

Beyond the farm gate Transport costs
• 44 tonne truck– Smith & Smith et al*
• ~ 0.013 kg C per km-tonne
– Carly Whittaker, Plant Science, ICL• ~ 0.019 – 0.038 kg C per km-tonne
• Average is 0.022 kg C per km-tonne
Smith & Smith (2000), Transport carbon costs do not negate the benefits of agricultural carbon mitigation options. Ecology Letters 3:379-381.

Approximate potato C footprint model (kg CE/ha)
CF = 103
+ 6.16 * SP + 2.96 * N (kg) + 4.83 * CP (kg a.i.) + 0.022 * distance (km) * yield (t)
SP: soil preparation and plantingCP: crop protection
Following slide - sensitivity around assumed baseline• 48 tonnes transported 50 km

• N is the most important factor• Distance transported is quite significant
CF
0
200
400
600
800
1000
1200
1400
0 100 200 300 400 500 600
Distance, km
CF
0
200
400
600
800
1000
1200
1400
0 2 4 6 8 10 12
Crop protection
CF
0
200
400
600
800
1000
1200
1400
0 2 4 6 8 10 12
Soil prep and planting operations
CF
0
200
400
600
800
1000
1200
1400
0 50 100 150 200 250 300 350
N applied, kg

Can we reduce the footprint? Mitigation options – farm gate
• N – It’s expensive! Due to fossil fuel
use in production– So probably already optimised
(in UK) and can’t be reduced whilst maintaining yield
• Tillage – reduces CO2 emissions from soil
• Grow more legumes!
• SCRI-SAC (long term sustainability expts) to come
Look elsewhere?
Winter wheat (approximated from Zhen-Ling et al 2006, Pedosphere 16(6):800-
812)
0
20
40
60
80
100
120
0 50 100 150 200 250 300
N applied kg/ha%
of m
axim
um y
ield

Transport• 50 tonnes (1 ha), 500 km adds 50% to the C
footprint
• Can be reduced by – transporting less – by using greener transport
• Whose problem is transport ?– transport sector– agriculture sector– potato industry

Conclusions
• Potato footprint per hectare around 20-30% higher than WW or OSR
• Potato footprint per tonne yield much lower than WW or OSR
• N application is by far the most important arable farming emission source (for these crops)
• Transport emissions can be very significant beyond the farm gate adding ~50% per 500 km for potato
• Storage/packaging/processing emissions?
This could be refined - can you help?
• Contact [email protected]
• Farmers or growers: – Tell us how YOU grow potatoes (or other
crops)
• Beyond the farm gate– let’s talk

Thank you to my funders – NERC (NE/C516279/1)
The organisers for the invite…
…and to everyone else for listening