carbon and nitrogen footprint optimisation of ammonia … · carbon and nitrogen footprint...
TRANSCRIPT
CHEMICAL ENGINEERING TRANSACTIONS
VOL. 61, 2017
A publication of
The Italian Association of Chemical Engineering Online at www.aidic.it/cet
Guest Editors: Petar S Varbanov, Rongxin Su, Hon Loong Lam, Xia Liu, Jiří J Klemeš Copyright © 2017, AIDIC Servizi S.r.l.
ISBN 978-88-95608-51-8; ISSN 2283-9216
Carbon and Nitrogen Footprint Optimisation of Ammonia as
an Automotive Fuel
Donna A. Angeles, Kristian Ray Angelo G. Are, Luis F. Razon, Raymond R. Tan*
Chemical Engineering Department, De La Salle University, 2401 Taft Avenue, 0922 Manila, Philippines
The transportation sector is one of the primary contributors to the global CO₂ emissions. Recent research
suggests that ammonia is a potential alternative automotive fuel due to its favorable storage properties and the
mature infrastructure for its production and distribution. However, there remains the question of whether
ammonia can be a sustainable alternative automotive fuel on a life-cycle basis. The energy-intensive production
process and the need for a secondary fuel are two major issues with the use of ammonia. A comparative well-
to-wheel life cycle assessment of selected ammonia-based fuel cycles is done. Two conventional fossil fuel-
based ammonia production processes and two proposed biomass-based processes are considered, namely:
steam reforming, partial oxidation, a cyanobacterial (Anabaena) process, and a willow-based (Salix) process.
The end-use is propulsion of a light-duty internal combustion engine vehicle, and the functional unit is 1 km of
distance driven by a such a vehicle. Three types of secondary fuels are considered: gasoline, diesel, and
dimethyl ether. Using the carbon and nitrogen footprint as the primary environmental performance indicators,
fuzzy life cycle optimization is applied to determine the optimal system configuration. Results show that ammonia
produced from the biomass-based process with dimethyl ether as the secondary fuel results in the best well-to-
wheel fuel pathway. Sensitivity analysis shows that the end-user vehicle fuel economy has the most significant
influence on the optimal solution, which means that concerted efforts to improve ammonia-based fuel cycles
must be focused on the end-use phase.
1. Introduction
Ammonia is one of the world’s most important commodity chemicals. It is produced primarily via the energy-
intensive Haber-Bosch process, although biomass-based processes such as the use cyanobacteria (Razon,
2014a) and willow (Ahlgren et al., 2008) have been proposed. Razon (2014b) discussed the sustainability issues
arising from the nitrogen footprint of large-scale ammonia production, which is essential for fertilizer production.
Ammonia has also been speculatively identified as a potential automotive fuel, due to its favorable
thermodynamic properties and the mature infrastructure for its handling and storage (Zamfirescu and Dincer,
2008). Engine tests have been performed to determine the emission characteristics of ammonia paired with
gasoline (Ryu et al., 2014), dimethyl ether (DME) (Gross and Kong, 2013), and diesel (Reiter and Kong, 2011)
when used as a fuel in vehicles propelled by internal combustion engines (ICEV). Common issues have been
identified in these tests, namely, reduced combustion efficiency (due to the narrow flammability limit, low flame
speed, and high combustion temperature of ammonia) and a notable increase in NOx and NH₃ emissions in the
exhaust gas.
Assessment of the sustainability of ammonia-based transportation systems has to be done based on a life cycle
perspective. For example, a comparative life cycle assessment (LCA) of selected ammonia production methods
has been done previously (Bicer, 2016), using a “cradle to gate” scope (i.e., without consideration of end use).
Different environmental issues in LCA are now also known as “footprints” which address specific types of
impacts; for example, carbon footprint is used as a metric to quantify climatic impact of a system (Čuček et al.,
2012). Despite its broad applicability, LCA has the inherent limitation that it can only be used to analyze a system
of predefined configuration. Life cycle optimization (LCO) has been proposed as an extension to identify the
environmentally optimal configuration of a process system. The earliest form of LCO made use of a linear
programming (LP) formulation (Azapagic and Clift, 1998), which was soon followed by a multi-objective LP
DOI: 10.3303/CET1761043
Please cite this article as: Angeles D.A., Are K.R.A.G., Razon L.F., Tan R.R., 2017, Carbon and nitrogen footprint optimisation of ammonia as an automotive fuel, Chemical Engineering Transactions, 61, 271-276 DOI:10.3303/CET1761043
271
(MOLP) extension (Azapagic and Clift, 1999). A fuzzy LP (FLP) formulation was proposed by Tan et al. (2008)
based on a linear algebra computational framework for LCA (Heijungs and Suh, 2002); this approach was later
applied to biofuel supply chains (Tan et al., 2009). More recently, LCO has been used for optimizing bioenergy
systems (Čuček et al., 2011), shale gas supply chains (Gao and You, 2015) and petrochemical complexes
(González Castaño et al., 2015). The combined framework may be extended to include sensitivity analysis as
a tool to further support the decision-making.
In this work, the LCO model proposed by Tan et al. (2008) is applied to the case of ammonia automotive fuel,
using carbon footprint and nitrogen footprint as environmental indicators to evaluate selected well-to-wheel fuel
cycles. The succeeding sections are as follows. Section 2 covers the system description and problem statement,
followed by discussion of the model formulation in Section 3, the results in Section 4, and lastly, conclusions in
Section 5.
2. System description and problem statement
In this study, two commercial, fossil fuel-based processes are considered, namely, steam reforming (SMRF)
and partial oxidation (PROX). The steam reforming process uses natural gas as feedstock and consists of the
following steps: desulfurization, primary and secondary reforming, CO shift, CO2 removal, and methanation. The
partial oxidation uses heavy oil as feedstock, and includes the following steps: oxidation, sulfur removal, CO-
shift, CO2 removal, and nitrogen wash. Both of these processes are highly energy-intensive due to the need for
fossil fuel inputs. In addition, two biomass-based processes are included as options, namely, the cyanobacterial
process (ANAB) and the willow-based process (SALI). The cyanobacterial process was based from the work of
Razon (2014) and involves the cultivation of Anabaena in raceway ponds, biogas production, separation into
biogas and digestate, and conversion from digestate to ammonia. The data for willow-based process was
derived from the works of Ahlgren et al. (2008). In their work, ammonium nitrate is produced from Salix (short
rotation willow coppice) and cereal straw. The data from Salix was chosen as representative as it has the lower
impacts. The process diagram by Ahlgren et al. (2008) was modified so that the final product is liquid ammonia
instead of ammonium nitrate. The ammonium nitrate production and nitric acid production processes were
removed, and replaced with compression or liquefaction of gaseous ammonia. The whole process may be
summarized into two major processes: biomass production (consisting of planting, managing, and harvesting)
and ammonia production (consisting of gasification, gas cleaning, H2 separation, and ammonia production).
Both biomass-based systems are significantly less fossil energy-intensive than the conventional processes,
since much of the energy input comes in the form of solar energy absorbed during biomass growth. Regardless
of the type of production process, the ammonia produced is delivered and distributed via conventional freight
transport (APMT); this is an important assumption since the mode of transport in the ammonia supply chain
determines part of its carbon footprint.
Since pure ammonia is not suitable as fuel for current ICEVs, three types of conventional fuels are paired with
ammonia in this study: gasoline, diesel, and DME. The production of gasoline (GAPR) and diesel (DIPR) include
the following processes: extraction of feedstock (crude oil), feedstock transport, and refining. The DME
production chain includes feedstock extraction (natural gas), steam production, and DME synthesis from CO
and H2O. Similarly, the fuels are delivered and distributed via freight transport that relies on diesel fuel. Diesel
transport is labeled as DITR, dimethyl ether transport is labeled as DMTR and gasoline transport is labeled as
GATR. The fuels are used in conjunction with ammonia for light-duty ICEVs, whose emission characteristics are
based on the experimental results of Reiter and Kong (2011) for ammonia-diesel (DIVO), Gross and Kong (2013)
for ammonia-DME (DMVO), and Ryu et al. (2014) for ammonia-gasoline (GAVO). The proportions of fuels are
based on the conditions of highest engine performance reported in these works. The emissions that were
considered in the analysis were CO2, CH4, N2O, NOx, and NH3, and all the fossil energy inputs are expressed
in terms of primary energy (PE). Note that the latter excludes solar energy inputs for biomass growth.
Given these system components, the problem is to determine the optimal system configuration that minimizes
the carbon and nitrogen footprints per functional unit (i.e., per unit distance travelled by a representative end-
user ICEV).
3. Model formulation
The LCO model is formulated as follows:
max (1)
subject to:
272
As = f (2)
Bs = g (3)
Qg = h (4)
(h – hU) ≤ (hL – hU) (5)
where is the fuzzy dimensionless degree of goal satisfaction, A is the technology matrix, f is the functional unit
vector, s is the scaling vector, B is the intervention matrix, g is the inventory vector, h is the impact vector, and
Q is the characterization matrix. The vectors hL and hU signify the lower and upper limits of h. The lower limit
may be set at zero for an idealized system with no footprint. The objective function seeks to maximize as given
by Eq(1); thus, the model optimizes the degree to which fuzzy environmental impact limits are met on a
dimensionless scale ranging from 0 to 1. Energy and material balances in the supply chain within the system
are defined by Eq(2), while mass balances for emissions are given by Eq(3). The flows of emissions are
translated to corresponding footprints using Eq(4). Finally, the fuzzy limits for the footprints are defined by Eq(5).
Note that the value of approaches 1 as the values in h approach those of corresponding elements in hL. A
more detailed description of this formulation can be found in Tan et al. (2008). Note that the model is linear, so
that no computational issues arise in seeking a global optimum. In this work, the model is implemented using
the optimization software LINGO 14.0.
4. Case study and results
As described in Section 2, the system is comprised on four ammonia production options and three vehicle end-
use options. The functional unit is 1 km distance driven by a representative light-duty ICEV, which is a common
reference value used in the LCA of automotive fuel pathways. The input-output data (matrices A and B) of
commodities (i.e., intermediate and products) and emissions are given in Table 1.
Table 1: Input and output flows of commodities and emissions.
Process Outflows Inflows Emissions Reference
ANAB 1 kg Ammonia 5.1 MJ PE 0.06 kg CO2 Razon (2014)
SALI 1 kg Ammonia 1.1 MJ PE 0.08 kg CO2; 0.003 kg CH4;0.001 kg
N2O; 0.0009 kg NOx; 0.0006 kg NH3
Ahlgren et al. (2008)
SMRF 1 kg Ammonia 11.09 MJ PE 1.59 kg CO2; 0.00004 kg CH4; 0.002
kg N2O; 0.0007 kg NOx
Ahlgren et al. (2008)
PROX 1 kg Ammonia 48.8 MJ PE 2.9 kg CO2 Ecoinvent (2016)
APMT 1 kg Ammonia 0.185 MJ PE 0.0025 kg CO2 Ecoinvent (2016)
DIPR 25.2 kg Diesel 188.5 MJ PE 9.1 kg CO2; 0.01 kg CH4; 0.0001 kg
N2O; 0.01 kg NOx
Wang (2001)
DMPR 36.7 kg DME 1937.8 MJ PE 98.6 kg CO2; 0.01 kg CH4; 0.001 kg
N2O; 0.09 kg NOx
Wang (2001)
GAPR 24.2 kg Gasoline 252.3 MJ PE 13.0 kg CO2; 0.02 kg CH4; 0.0002 kg
N2O; 0.02 kg NOx
Wang (2001)
DITR 25.2 kg Diesel 25.2 kg Diesel 1.37 kg CO2; 0.002 kg CH4; 0.00002
kg N2O; 0.006 kg NOx
Wang (2001)
DMTR 36.7 kg DME 36.7 kg DME 2.54 kg CO2; 0.003 kg CH4; 0.00002
kg N2O; 0.006 kg NOx
Wang (2001)
GATR 24.2 kg Gasoline 24.2 kg Gasoline 1.5 kg CO2; 0.002 kg CH4; 0.00002 kg
N2O; 0.006 kg NOx
Wang (2001)
DIVO 1.6 km 0.05 kg NH₃
0.01 kg Diesel
0.1 kg CO2; 0.001 kg NOx; 0.000007
kg NH3
Reiter and Kong
(2011)
DMVO 1.6 km 0.03 kg NH₃
0.02 kg DME
0.003 kg CO2; 0.0005 kg NOx; 0.0005
kg NH3
Gross and Kong
(2013)
GAVO
1.6 km 0.06 kg NH₃
0.02 kg Gasoline
0.2 kg CO2; 0.0002 kg CH4; 0.00001;
kg N₂O; 0.0005 kg NOx; 0.005 kg NH3
Ryu et al. (2014)
The life cycle system has excess degrees of freedom in the technology matrix A due to the presence of
alternative technological options. It is necessary for the model to balance the carbon footprint and nitrogen
273
footprints as potentially conflicting environmental objectives. The mass ratios of fuels in the vehicle operation
phase is based on the most favorable operating condition of the vehicle i.e. conditions with highest engine
performance and/or highest energy production per mass of fuel based from the experimental result of Reiter
and Kong (2011), later extended by Gross and Kong (2013), and recently by Ryu et al. (2014). The scope of
this work excludes the infrastructure and ammonia fugitive emissions (Bicer et al., 2016) in the ammonia
production phase. Such considerations may result in similar nitrogen footprints for all options regardless of the
ammonia production process. Table 2 shows the values in the characterization matrix Q.
Table 2: LCO model characterization factors.
Footprint Environmental Emissions
CO2 CH4 N2O NOx NH3
Carbon 1 25 298 0 0
Nitrogen 0 0 0.64 0.37 0.82
Solving the model gives a global index of satisfaction of 𝜆 = 0.79. This result indicates that Salix-based ammonia
paired with DME offers the best compromise in terms of carbon and nitrogen footprint reduction. The total flows
of primary energy and emissions per functional unit are summarized in Table 3. For this optimal pathway, the
carbon footprint is determined to be 27.13 g CO2 equivalent per km while the nitrogen footprint is 0.49 g reactive
nitrogen per km. Sensitivity analysis suggests that vehicle fuel economy is a more significant factor than the
efficiency of upstream processes that comprise the ammonia production system. This result means that it is
essential for more data on engine tests to be collected, especially under varying load conditions. Acquisition of
such data can improve the precision of the results of the LCO in the future. In addition, improvements in the
efficiency of upstream production chain (e.g., through the application of Process Integration methodology), will
also help reduce the carbon and nitrogen footprints of ammonia-based systems, which has been documented
for the case of fossil fuel-based processes (Ruddock et al., 2003), while similar opportunities exist to apply
Process Integration methodology to optimize biomass-based ammonia production.
Table 3: Optimal emission and resource flows per functional unit.
Resource or pollutant Total flowrate per functional unit
Primary Energy 0.4 MJ/km
CO2 14.72 g/km
CH4 0.07 g/km
N2O 0.04 g/km
NOx 0.40 g/km
NH3 0.38 g/km
Figure 1 shows the carbon footprint of selected fuel cycles, where BASE represents the option when only pure
diesel, DME, or gasoline is used during the vehicle operation phase. The use of ammonia-DME in the vehicle
operation stage results in the lowest carbon footprint, followed by ammonia-diesel and ammonia-gasoline fuel,
regardless of the choice of ammonia production. The addition of ammonia reduces the amount of hydrocarbon
fuel needed to achieve the same mechanical power output; CO2 emissions are reduced in the exhaust gas. It
also offers the most notable reduction in carbon footprint when combined with DME. Figure 1 also shows that
Salix process for ammonia production offers the lowest carbon footprint, followed in ascending order by the
Anabaena process, steam reforming and partial oxidation. The results show that, in terms of carbon footprint
reduction, a shift to biomass-based ammonia production is preferable, while fossil fuel-based ammonia gives
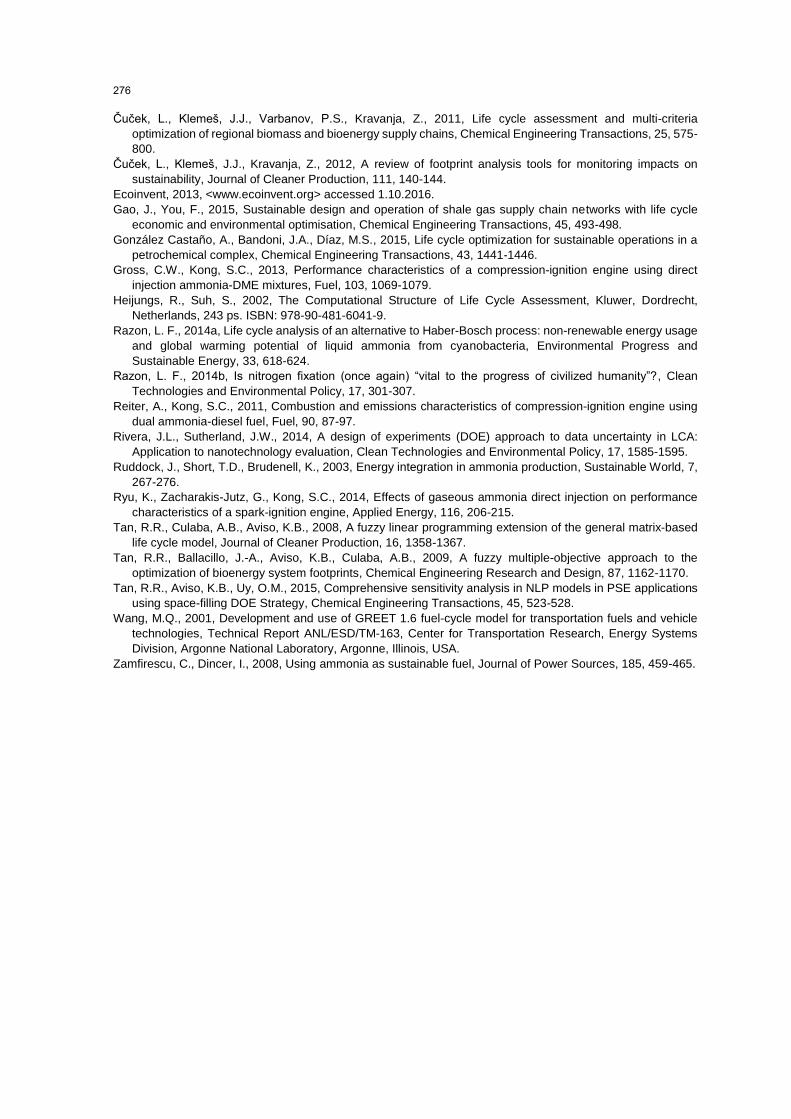
little benefit. However, the use of ammonia also results in an increase in nitrogen footprint for all fuel mixtures
relative to the BASE case, as shown in Figure 2. In particular, the use of ammonia-gasoline mixture had the
highest nitrogen footprint, which may be attributed to high levels of NOx produced in engine combustion
chambers, as well as the unburned ammonia, or ammonia slip, detected in the exhaust gases after combustion
(Ryu et al., 2014). The synergistic effect of low peak combustion temperature achieved in a spark-ignition engine
and unfavorable properties of ammonia lead to considerably higher nitrogen footprint in ammonia-gasoline
mixtures compared to the other blends. These results indicate that there are significant unfavorable effects in
the use of ammonia blends in engines optimized to run on conventional fuels. Thus, it will also be necessary to
determine how engines can be customized or retrofitted to achieve more favorable combustion conditions for
ammonia blends.
274
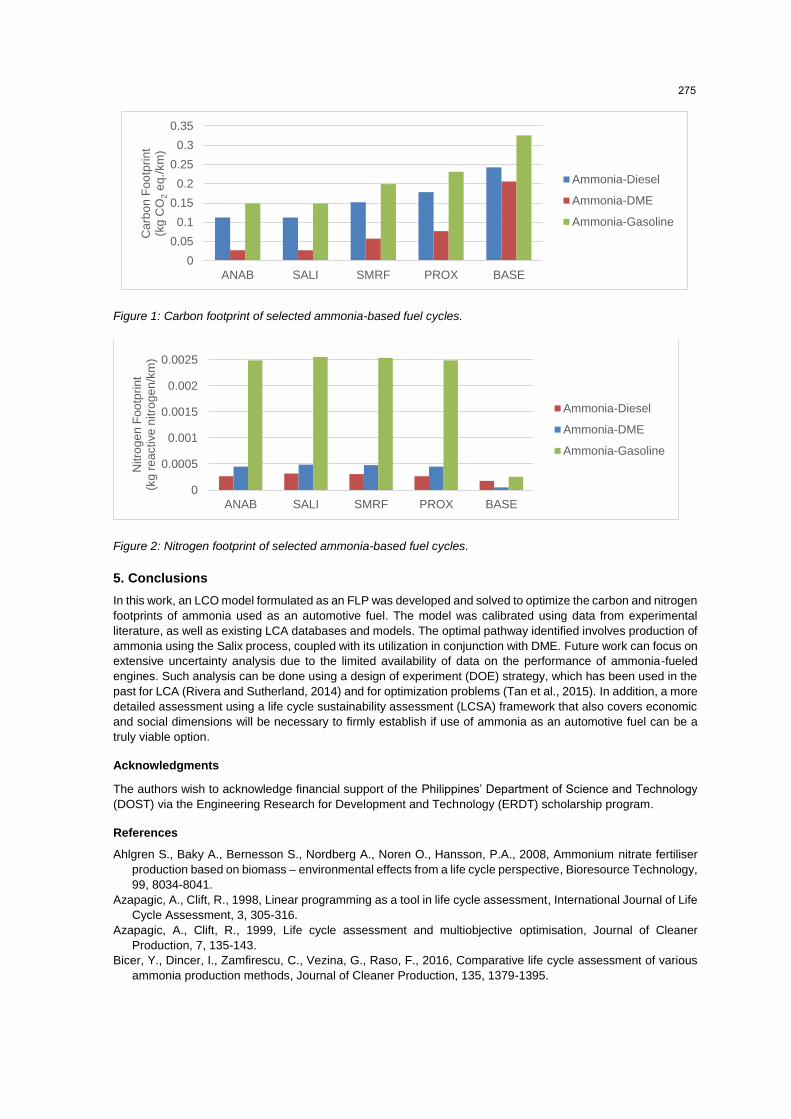
Figure 1: Carbon footprint of selected ammonia-based fuel cycles.
Figure 2: Nitrogen footprint of selected ammonia-based fuel cycles.
5. Conclusions
In this work, an LCO model formulated as an FLP was developed and solved to optimize the carbon and nitrogen
footprints of ammonia used as an automotive fuel. The model was calibrated using data from experimental
literature, as well as existing LCA databases and models. The optimal pathway identified involves production of
ammonia using the Salix process, coupled with its utilization in conjunction with DME. Future work can focus on
extensive uncertainty analysis due to the limited availability of data on the performance of ammonia-fueled
engines. Such analysis can be done using a design of experiment (DOE) strategy, which has been used in the
past for LCA (Rivera and Sutherland, 2014) and for optimization problems (Tan et al., 2015). In addition, a more
detailed assessment using a life cycle sustainability assessment (LCSA) framework that also covers economic
and social dimensions will be necessary to firmly establish if use of ammonia as an automotive fuel can be a
truly viable option.
Acknowledgments
The authors wish to acknowledge financial support of the Philippines’ Department of Science and Technology
(DOST) via the Engineering Research for Development and Technology (ERDT) scholarship program.
References
Ahlgren S., Baky A., Bernesson S., Nordberg A., Noren O., Hansson, P.A., 2008, Ammonium nitrate fertiliser
production based on biomass – environmental effects from a life cycle perspective, Bioresource Technology,
99, 8034-8041.
Azapagic, A., Clift, R., 1998, Linear programming as a tool in life cycle assessment, International Journal of Life
Cycle Assessment, 3, 305-316.
Azapagic, A., Clift, R., 1999, Life cycle assessment and multiobjective optimisation, Journal of Cleaner
Production, 7, 135-143.
Bicer, Y., Dincer, I., Zamfirescu, C., Vezina, G., Raso, F., 2016, Comparative life cycle assessment of various
ammonia production methods, Journal of Cleaner Production, 135, 1379-1395.
0
0.05
0.1
0.15
0.2
0.25
0.3
0.35
ANAB SALI SMRF PROX BASE
Ca
rbo
n F
oo
tpri
nt
(kg
CO
2e
q./
km
)
Ammonia-Diesel
Ammonia-DME
Ammonia-Gasoline
0
0.0005
0.001
0.0015
0.002
0.0025
ANAB SALI SMRF PROX BASE
Nitro
ge
n F
oo
tpri
nt
(kg
re
active
nitro
ge
n/k
m)
Ammonia-Diesel
Ammonia-DME
Ammonia-Gasoline
275
Čuček, L., Klemeš, J.J., Varbanov, P.S., Kravanja, Z., 2011, Life cycle assessment and multi-criteria
optimization of regional biomass and bioenergy supply chains, Chemical Engineering Transactions, 25, 575-
800.
Čuček, L., Klemeš, J.J., Kravanja, Z., 2012, A review of footprint analysis tools for monitoring impacts on
sustainability, Journal of Cleaner Production, 111, 140-144.
Ecoinvent, 2013, <www.ecoinvent.org> accessed 1.10.2016.
Gao, J., You, F., 2015, Sustainable design and operation of shale gas supply chain networks with life cycle
economic and environmental optimisation, Chemical Engineering Transactions, 45, 493-498.
González Castaño, A., Bandoni, J.A., Díaz, M.S., 2015, Life cycle optimization for sustainable operations in a
petrochemical complex, Chemical Engineering Transactions, 43, 1441-1446.
Gross, C.W., Kong, S.C., 2013, Performance characteristics of a compression-ignition engine using direct
injection ammonia-DME mixtures, Fuel, 103, 1069-1079.
Heijungs, R., Suh, S., 2002, The Computational Structure of Life Cycle Assessment, Kluwer, Dordrecht,
Netherlands, 243 ps. ISBN: 978-90-481-6041-9.
Razon, L. F., 2014a, Life cycle analysis of an alternative to Haber-Bosch process: non-renewable energy usage
and global warming potential of liquid ammonia from cyanobacteria, Environmental Progress and
Sustainable Energy, 33, 618-624.
Razon, L. F., 2014b, Is nitrogen fixation (once again) “vital to the progress of civilized humanity”?, Clean
Technologies and Environmental Policy, 17, 301-307.
Reiter, A., Kong, S.C., 2011, Combustion and emissions characteristics of compression-ignition engine using
dual ammonia-diesel fuel, Fuel, 90, 87-97.
Rivera, J.L., Sutherland, J.W., 2014, A design of experiments (DOE) approach to data uncertainty in LCA:
Application to nanotechnology evaluation, Clean Technologies and Environmental Policy, 17, 1585-1595.
Ruddock, J., Short, T.D., Brudenell, K., 2003, Energy integration in ammonia production, Sustainable World, 7,
267-276.
Ryu, K., Zacharakis-Jutz, G., Kong, S.C., 2014, Effects of gaseous ammonia direct injection on performance
characteristics of a spark-ignition engine, Applied Energy, 116, 206-215.
Tan, R.R., Culaba, A.B., Aviso, K.B., 2008, A fuzzy linear programming extension of the general matrix-based
life cycle model, Journal of Cleaner Production, 16, 1358-1367.
Tan, R.R., Ballacillo, J.-A., Aviso, K.B., Culaba, A.B., 2009, A fuzzy multiple-objective approach to the
optimization of bioenergy system footprints, Chemical Engineering Research and Design, 87, 1162-1170.
Tan, R.R., Aviso, K.B., Uy, O.M., 2015, Comprehensive sensitivity analysis in NLP models in PSE applications
using space-filling DOE Strategy, Chemical Engineering Transactions, 45, 523-528.
Wang, M.Q., 2001, Development and use of GREET 1.6 fuel-cycle model for transportation fuels and vehicle
technologies, Technical Report ANL/ESD/TM-163, Center for Transportation Research, Energy Systems
Division, Argonne National Laboratory, Argonne, Illinois, USA.
Zamfirescu, C., Dincer, I., 2008, Using ammonia as sustainable fuel, Journal of Power Sources, 185, 459-465.
276