caratula working paper - barcelona gse
TRANSCRIPT
Centre de Referència en Economia Analítica
Barcelona Economics Working Paper Series
Working Paper nº 127
Cost Uncertainty and Taxpayer Compliance
Jordi Caballé and Judith Panadés
May 25, 2004

Cost Uncertainty and Taxpayer Compliance∗
Jordi CaballeUnitat de Fonaments de l’Analisi Economica and CODE
Universitat Autonoma de Barcelona
Judith PanadesUnitat de Fonaments de l’Analisi Economica
Universitat Autonoma de Barcelona
May 25, 2004
Abstract
The existence of a private cost borne by audited taxpayers affects the tax en-forcement policy. This is so because tax auditors will face now two sources ofuncertainty, namely, the typical one associated with taxpayers’ income and thatassociated with the taxpayers’ idiosyncratic attitude towards tax compliance.Moreover, the inspection policy can be exposed to some randomness from thetaxpayers’ viewpoint due to the uncertainty about the audit cost borne by thetax authority. In this paper we provide an unified framework to analyze theeffects of all these sources of uncertainty in a model of tax compliance withstrategic interaction between auditors and taxpayers. We show that more vari-ance in the distribution of the taxpayers’ private cost of evading raises both taxcompliance and the ex-ante welfare of taxpayers. The effects of the uncertaintyabout the audit cost faced by the tax authority are generally ambiguous. Wealso discuss the implications of our model for the regressive (or progressive) biasof the effective tax system.
∗ This paper has benefited from comments made by participants in the Encuentro de EconomiaPublica (Santa Cruz de Tenerife) and by two anonymous referees of this Journal. Of course, theyshould not bear any responsibility for the remaining errors. Financial support from the Institute ofFiscal Studies (Spanish Ministry of Finance), Spanish Ministry of Science and Technology throughgrants SEC2003-306 and HI2001-0039, and from the Generalitat of Catalonia through the BarcelonaEconomics program of CREA and grant SGR2001-00162 is gratefully acknowledged.
Correspondence address: Jordi Caballe. Universitat Autonoma de Barcelona. Departamentd’Economia i d’Historia Economica. Edifici B. 08193 Bellaterra (Barcelona). Spain.Phone: (34)-935.812.367. Fax: (34)-935.812.012. E-mail: [email protected]
Barcelona Economics WP nº 127

1. Introduction
The existence of a private cost borne by audited taxpayers affects the tax enforcementpolicy. This is so because tax auditors will face now two sources of uncertainty,namely, the typical one associated with taxpayers’ income and that associatedwith the taxpayers idiosyncratic attitude towards tax compliance. Moreover, theinspection policy can be exposed to some randomness from the taxpayers’ viewpointdue to the uncertainty concerning the audit cost faced by the tax enforcement agency.The aim of this paper is to provide an unified framework to analyze the effects ofall these sources of uncertainty in a model of tax compliance where there is strategicinteraction between auditors and taxpayers and, moreover, the tax enforcementagency does not commit to follow a given audit policy.
The first models that analyzed the phenomenon of tax evasion through a portfolioselection approach (like those of Allingham and Sandmo, 1972; and Yitzhaki, 1974)assumed that all taxpayers were facing a constant and identical probability of beingaudited by the tax enforcement agency. However, consider a tax auditor who observesthe amount of income reported by a taxpayer before conducting the correspondingaudit. If this auditor wants to maximize the expected revenue from each taxpayer,there is no apparent reason why he should commit to an audit policy independentof the report he observes. An auditor using optimally all the relevant informationat his disposal should make both the probability of inspection and the effort appliedto a taxpayer contingent on the corresponding amount of reported income. One ofthe first attempts to analyze those contingent policies was made by Reinganum andWilde (1985), who considered a principal-agent model where the tax enforcementagency commits to follow a cut-off audit policy. According to this policy, taxpayersreporting less income than a given level are inspected, whereas the other taxpayersare not inspected. In a very influential paper the same authors (Reinganum andWilde, 1986) considered an alternative scenario where a revenue-maximizing taxauthority does not even commit to an audit rule but selects an optimal policygiven the realization of the taxpayers’ reports. Moreover, in this new frameworkthe probability of inspection is allowed to take all the possible values in the interval[0, 1]. After the taxpayer has submitted his tax report, the tax agency will choosethe optimal probability which that taxpayer is audited with. This probability endsup being a decreasing function of the reported amount of individual income. Takingas given the optimal audit probability function of the tax agency, taxpayers choosetheir optimal reports in order to maximize their disposable income. Optimal reportsturn out to be increasing functions of the true income.1
The interaction between taxpayers and tax auditors is usually exposed to severalsources of randomness. For instance, each taxpayer faces an idiosyncratic cost whenhe suffers a tax inspection. Since this cost is private information of taxpayers, tax
1The previous basic models have been enriched in several directions. For instance, Border andSobel (1994) allow for general objective functions for the tax agency; Mookherjee and P’ng (1989)study the implications of having risk averse agents; Sanchez and Sobel (1983) analyze the conditionsunder which cut-off policies are optimal from the expected revenue viewpoint; and Erard andFeinstein (1994a) introduce a fraction of honest taxpayers that always produce truthful reports.Alm, Bahl, and Murray (1993) provide strong empirical support for the game-theoretical approachof the tax evasion phenomenon versus the alternative models based on just random audit policies.
2
reports are not just a function of the taxpayers’ income but also of the realizationof this private cost. Therefore, other things equal, taxpayers facing a high (low)private cost will tend to conceal less (more) income from the tax authority in order tominimize the intensity of the audit conducted by the tax authority. The heterogeneityof that cost among taxpayers could arise from the different amount of time thattaxpayers should devote to undergo a tax audit process. Thus, depending on thespecific characteristics of each taxpayer’s job (or even on the particular skill forefficiently filing tax documents), the opportunity cost in terms of foregone wagecould vary across taxpayers. Furthermore, a tax inspection could trigger somepsychological cost arising from the potential public exposure of the inspection processand from the typical distress associated with this kind of investigation. The exactvalue of the cost faced by an audited taxpayer is assumed to be unknown by the taxenforcement agency.
Another reason why tax reports could differ among individuals enjoying the sameincome stems from tax morale considerations. Thus, if a taxpayer dislikes cheating tothe tax authority or views tax evasion as immoral, then he will tend to declare moreincome than another taxpayer with lower tax morale. Note that both the privatecost of an inspection faced by the taxpayer and the private level of tax morale canbe viewed as equivalent factors from the point of view of introducing noise in the taxreport. Therefore, the report will not be the result of minimizing only the expectedtax and penalty payment, since the aforementioned factors will be also crucial todetermine the exact level of tax compliance of an individual.
Reinganum and Wilde (1988) considered instead a source of uncertainty faced bytaxpayers, namely, that associated with the cost of conducting an audit by the taxagency. The exact realization of this cost is private information of the tax agencyand it is unobservable by taxpayers. In the principal-agent model of Reinganum andWilde the cut-off level of income triggering an inspection is a function of the auditcost faced by the agency. Therefore, taxpayers form non-degenerate beliefs about thiscut-off income level from the distribution of the audit cost. These authors concludethat some degree of induced uncertainty about the audit cost of the agency improvescompliance and, thus, increases the revenue collected by the agency. However,excessive uncertainty could decrease compliance.
The model we present in this paper considers sources of uncertainty similar tothose appearing in the previous models. We will model the interaction between thetax enforcement agency and taxpayers using a game-theoretical approach where theagency does not commit to follow an inspection rule. Therefore, tax auditors willmaximize the expected tax revenue and, to this end, they will devote an amount ofeffort to investigate taxpayers. This effort will be chosen after observing the amountof income reported by each taxpayer. This means that the equilibrium conceptwe use is that of sequential equilibrium, where the taxpayers move first and theauditors are the followers. The revenue accruing from the inspection is assumedto be proportional to the effort made by the auditor and to the amount of evadedtaxes. As in Reinganum and Wilde (1988), the audit cost is private information ofeach auditor and, thus, taxpayers do not know the exact response of auditors afterreading their income reports. However, we depart from Reinganum and Wilde (1988)by considering general audit strategies instead of cut-off ones and by not allowing
3
commitment by the tax enforcement agency. Another even more important departureis that we consider a rational expectations model. This means that taxpayers’ beliefsabout the audit cost coincide with its true distribution, whereas in the paper ofReinganum and Wilde the true distribution was degenerate and thus the confusionsuffered by taxpayers about the audit cost was incompatible with agents entertainingrational expectations. In our model, the distribution of the cost arises from theheterogenous quality of tax auditors, which is due to different natural auditing skillsor non-homogeneous formal training. Moreover, in our model we assume a quadraticcost structure parametrized by the value of a coefficient parameter, which is privateinformation of each auditor. We will show with the help of a couple of examples thatthe effects of increasing the variance of that parameter value are very sensitive tothe specific distribution under consideration.
As we have said, we also allow for uncertainty concerning the private cost ofsuffering an inspection faced by taxpayers. This cost is known by each taxpayer butis unknown by the tax auditor. We will show that an increase in the variance ofthis idiosyncratic cost generates more revenue for the government. This result is aconsequence of the fact that the inspection effort selected by auditors turns out tobe more sensitive to the submitted report when the variance of the taxpayers’ costincreases. In this case, auditors know that there will be a larger fraction of taxpayersdisplaying a very low cost and, thus, reporting a small amount of income. Therefore,auditors will put proportionally more effort on auditing taxpayers who submit low-income reports. This induces a bias in the reporting strategies, which results in turnin a larger amount of reported income.
Our paper analyzes also other three questions. First, we show that a larger vari-ance of the income distribution reduces (not surprisingly) individual tax compliance,since auditors face more uncertainty about the relevant variable in the audit process.Second, we evaluate the effects of the different sources of uncertainty on taxpayerswelfare. Our analysis shows that expected utility responds negatively to an increasein the variance of income and positively to an increase in the variance of the tax-payers’ cost. The latter result is a consequence of the reduction in the expected costof suffering an audit, since the audit intensity decreases when the variance of thetaxpayers’ cost rises. Finally, we analyze the progressive (or regressive) bias of theaudit strategies followed by the tax auditors of our model. We show that the sign ofthis bias could be ambiguous since a tax inspection could now serve as an instrumentto correct for the excessive tax contribution made by taxpayers facing a high costof suffering an inspection. This ambiguity concerning the effective progressivenessof the tax system is in stark contrast to what is obtained in the standard model oftax compliance with strategic interaction between auditors and taxpayers, where theresulting effective tax system is always more regressive than the statutory one (seeReinganum and Wilde, 1986; and Scotchmer, 1992).
The paper is organized as follows. Section 2 presents the model and derivesthe sequential equilibrium. Section 3 discusses some properties of the equilibrium.Section 4 contains the analysis of the potential progressive bias of the effective taxsystem. Section 5 discusses the implications of changes in the variance of the auditcost borne by the tax agency. Section 6 concludes the paper. All the proofs appearin the appendix.
4
2. The model
Let us consider an economy with a continuum of taxpayers distributed on theinterval [0, 1]. Assume that the income y of each taxpayer is a normally distributedrandom variable with mean y and variance Vy ≥ 0 . The income of each taxpayeris independent of the others’ income. Therefore, from the strong law of largenumbers, the empirical average income is y. The tax law establishes a statutorytax rate τ ∈ (0, 1) on income. Taxpayers also face a cost when they are inspectedby the tax authority. We will assume that the total cost borne by a taxpayer isproportional to the audit effort e∗ chosen by the tax authority. If ε∗ is the cost ofsuffering an inspection per unit of effort exerted by inspectors, the total cost is ε∗e∗.Each taxpayer observes the realization ε∗ of his cost parameter whereas this cost isunobservable by the tax authority. The value of the cost parameter of each taxpayeris assumed to be normally distributed and the cost of each taxpayer is independentof the others’ cost. After observing the realizations of his income y and of his costparameter ε∗, a taxpayer optimally decides the amount x of declared income.2
The tax enforcement agency has a pool of tax auditors and each income reportis assigned randomly to one auditor. The auditor chooses the audit effort e∗ appliedto each taxpayer in order to maximize the expected net revenue (tax and penaltyrevenue, less audit cost) per taxpayer. Note that, due to the strong law of largenumbers, this objective implies the maximization of the aggregate net revenuecollected by the tax agency. The audit effort is contingent upon the report x observedby the tax auditor. We define the variable e as the product of the effort e∗ and thepenalty rate f on the amount of evaded taxes, e = e∗f. Moreover, the resources thatcan be exacted by an audit are assumed to be proportional to the audit effort andto the amount of evaded taxes. Thus, the penalty revenue is
e∗fτ(y − x) = eτ(y − x). (2.1)
Therefore, if the reported income x coincides with the true taxable income y of ataxpayer, then no new revenues will arise from an inspection. Moreover, no additionalrevenues are obtained by a tax auditor when either no effort is devoted to theinspection of potential tax evaders (e∗ = 0) or no penalties are imposed on theamount of evaded taxes (f = 0).
For the rest of the paper we will take as given both the tax rate τ and the penaltyrate f. Therefore, without loss of generality, we will use the variable e as the choicevariable of tax auditors, since this variable is entirely determined by the endogenousaudit effort e∗ applied to a given taxpayer. Moreover, for the same reason, we can
define the variable ε =ε∗
τf, which is proportional to the inspection cost ε∗ faced by
taxpayers. Thus, the total cost faced by a taxpayer suffering an inspection when theaudit effort is e∗ turns out to be
ε∗e∗ = ετfe∗ = ετe, (2.2)
where the last inequality follows from the definition of the variable e. The randomvariable ε is thus normally distributed and we assume that its mean is zero, while
2We suppress the tilde to denote the realization of a random variable.
5

its variance is Vε. The zero mean assumption is made without loss of generality inorder to reduce the number of parameters of the model. As we will see, the randomvariable ε can also be interpreted as the individual tax morale of taxpayers so thatpositive (negative) values of ε correspond to individuals who are willing to declaremore (less) income due to considerations, like ethical values, social norms, or degreeof satisfaction with the government. All these considerations are independent of theobjective of tax payment minimization (see Alm, McClelland, and Schulze, 1992;Erard and Feinstein, 1994b; and Torgler, 2002, for this strand of the tax evasionliterature). Note finally that the realizations of the income y and of the cost ε areprivate information of each taxpayer.
We assume that the total audit cost faced by the tax agency is quadraticin the effort devoted to auditing, 1
2c∗e∗ with c∗ > 0 . This cost includes all the
resources spent by the tax auditor in the process of inspection. Note that, bymaking c = c∗
f2τ> 0 , the previous cost function becomes 1
2cτe2. The value of the
cost parameter c∗, and thus of c, varies across auditors according to an exogenouslygiven distribution. The value of that parameter could depend, for instance, on thenatural skills and on the previous training of each tax auditor. The exact value of hiscost parameter c is observable by each auditor but is not observable by taxpayers.Thus, from the taxpayers’ viewpoint, the cost parameter is a random variable c witha known distribution. The relevant realization of the random variable c for a giventaxpayer corresponds to the value c of the auditor assigned to him.
Finally, we assume that the random variables y, ε and c are mutually independent.The joint distribution of these random variables is common knowledge.
Let e(x, c) be the audit effort of an auditor with a value c of his cost parameterwho observes the amount x of reported income of a taxpayer. Tax auditors wantto maximize the net revenue from each taxpayer they audit. Therefore, an auditorwith an audit cost parameter equal to c chooses the audit effort e to be applied to ataxpayer declaring the income level x according to the following audit strategy:
e(x, c) =argmaxe
E
∙τx+ eτ (y − x)− 1
2cτe2
¯x
¸, (2.3)
where τx is the amount of taxes paid before the inspection has taken place, eτ(y−x)is the additional revenue that the auditor collects through the inspection (see (2.1)),and 1
2cτe2 is the cost borne by the agency. The first order condition of the auditor’s
problem isE [ y − x− ce|x] = 0.
The sufficient second order condition is simply c > 0, which is satisfied by assumption.Therefore, the audit effort is given by
e =1
c[E ( y|x)− x] . (2.4)
Since taxpayers do not observe the realization of the random variable c,they are uncertain about the effort that auditors will apply in their respectivecases. Taxpayers are risk neutral and want to maximize the expected amountof their disposable income after the inspection has taken place. Note thaty − τx− e(x, c)τ(y − x) is the income net of taxes and penalties. Moreover, recall
6

that the cost of facing an inspection in terms of foregone income is given by expression(2.2). Therefore, the expected disposable income of a taxpayer with initial income yand individual cost ε will be
E [y − τ x− e (x, c) τ(y − x)− ετe (x, c)] . (2.5)
Taxpayers form rational expectations about the strategies followed by tax auditors.Since they observe their true income and their private cost of suffering an inspection,taxpayers follow the following report strategy:
x(y, ε) =argmaxx
E [y − τx− e (x, c) τ (y − x)− ετe (x, c)] . (2.6)
The first order condition of this problem is
−1−E∙∂e (x, c)
∂x(y − x)− e (x, c) + ε
µ∂e (x, c)
∂x
¶¸= 0. (2.7)
The second order condition is
−E∙∂2e (x, c)
∂2x(y − x)− 2
µ∂e (x, c)
∂x
¶+ ε
µ∂2e (x, c)
∂2x
¶¸< 0. (2.8)
We see that, unlike the seminal papers of Allingham and Sandmo (1972) and Yitzhaki(1974), the taxpayer does not take as given the audit effort but takes into accountthe effect of his report on the effort that the tax auditor will devote to enforce thetax law. Note also that we consider the audit effort as the variable selected byauditors, whereas in previous models the choice variable used to be the probabilityof inspection.
An equilibrium of our model is thus a report strategy x(y, ε) and an audit strategye(x, c) satisfying simultaneously (2.6) and (2.3) . We will restrict our attention tolinear report strategies, x(y, ε) = α+ βy + λε , and to audit strategies that arelinear in the reported income, e(x, c) = δ(c) + γ(c)x . Note that for these linearaudit strategies the sufficient second order condition (2.8) of the taxpayer’s problembecomes simply E [γ(c)] < 0. The next proposition provides the unique equilibriumbelonging to this class:
Proposition 2.1. Assume that Vε > Vy. Then, there exists a unique equilibriumwhere both x(·, ·) and e(·, c) are linear. This equilibrium is given by
x(y, ε) = α+ βy + λε,
where
α =1
2
½y − 1
E (1 /c)
∙1 +
VyVε
¸¾, (2.9)
β =1
2, (2.10)
λ =1
2; (2.11)
7

ande(x, c) = δ(c) + γ(c)x,
where
δ(c) =1
c
½1
E (1 /c)
µVyVε
¶− y
µVy − VεVy + Vε
¶¾, (2.12)
γ(c) =1
c
µVy − VεVy + Vε
¶. (2.13)
It should also be pointed out that the linear equilibrium under consideration is infact a sequential equilibrium with no additional restrictions, since the best responseto the linear report strategy followed by a taxpayer consists on a linear audit strategy,and vice versa. It can be easily seen from our previous analysis and from the proof ofProposition (2.1) that the assumption of a quadratic cost function for the auditors,together with the linearity of the report strategies and the normality of the randomvariables y and ε, yields linear optimal audit strategies.3 Conversely, given the linearaudit strategy followed by auditors, the assumption of risk neutrality for taxpayersyields optimal linear strategies for the tax reports.
For the rest of the paper we will maintain the assumption Vε > Vy, which isnecessary and sufficient for the second order condition (2.8) of the taxpayer problem.This condition requires in fact that the audit effort be decreasing in the amountof reported income. If the previous assumption were not imposed, the audit effortcould be increasing in reported income and taxpayers would find optimal to reportan infinite negative income level. In this respect, note that when Vε ≤ Vy taxpayersintroduce a quite small of noise in their reports and, thus, the reports they submitare very informative about their true income. In this case, since β = 1/2, theamount of evaded income y − x(y, ε) rises with the true income y and, hence, taxauditors maximize the penalty revenue by inspecting more intensively the taxpayerswho submit high-income reports. On the contrary, if the variance of ε is sufficientlyhigh relative to that of income, as assumed in Proposition 2.1, the reports are not soinformative and, hence, auditors attribute high-income reports to a high cost facedby the taxpayer. Moreover, since in this case the dispersion of income is small,the optimal audit strategy consists on inspecting more intensively the low-incomereports, which are those having a higher probability of being submitted by taxpayerswho underreport their true income because they face low cost when they are audited.4
It is important to remark that the particular definitions of the variables e, ε,and c have been made in order to obtain relatively simple equilibrium strategiesfor taxpayers and auditors. In particular, note that neither the tax rate τ nor the
3Note that the assumption of normality of y and ε gives rise to the linearity of the conditionalexpectation E(y |x) with respect to the report x (see (A.1)). The linearity of this conditionalexpectation is crucial for obtaining linear strategies in equilibrium.
4Note that, if we assume empirically plausible parameter values for the tax and the penalty rates,
like τ = 0.2 and f = 2 , we obtain that Vε = V ar(ε∗)/0.16 as ε =
ε∗
τf. Recalling that the variable
ε∗ is the primitive cost faced by taxpayers per unit of audit effort, our assumption Vε > Vy becomesV ar(ε∗) > 0.16Vy .
8

penalty rate f explicitly appear in the equilibrium reporting and auditing strategiesgiven in Proposition (2.1), since both τ and f are embedded on those transformedvariables.
The functional form of the reporting strategy x(y, ε) allows us to provide analternative interpretation of the random variable ε. The realization of ε can be viewedas the individual tax morale of the taxpayer under consideration. Thus, taxpayers forwhich ε = 0 are those for which the amount of income reported is exclusively drivenby the objective of minimization of the expected amount of taxes and penalties tobe paid (see (2.5)). A positive (negative) value of ε corresponds to taxpayers whoare willing to pay more (less) taxes as a consequence of their attitude towards taxcompliance based on tax morale considerations.
3. Properties of the equilibrium
In this section we study some indicators of tax compliance in equilibrium. Notefirst that, using the equilibrium values of the coefficients α, β, λ, δ(c) and γ(c), theequilibrium pair of strategies can be written as
x(y, ε) =1
2
½y + y + ε− 1
E (1 /c)
∙1 +
VyVε
¸¾(3.1)
and
e(x, c) =1
c
∙µVy − VεVy + Vε
¶(x− y) + 1
E (1 /c)
µVyVε
¶¸. (3.2)
We see that, on the one hand, the intended report x(y, ε) is increasing in the trueindividual income y and, obviously, in the cost ε of being audited. Moreover, for ataxpayer with a given income level y, his report x increases with the variance Vε ofthe taxpayers’ cost, whereas it is decreasing in the variance Vy of income. Finally,the intended report is increasing in the expectation E (1 /c) . On the other hand, theinspection effort e(x, c) applied to a taxpayer is decreasing in his income report x,as required by the second order condition (2.8), and decreasing in the auditors’ costparameter c. Moreover, for a given report x and a given realization of the value cof the auditors’ cost parameter, the inspection effort e is increasing in the varianceVy of income, decreasing in the variance Vε of taxpayers’ cost, and decreasing in theexpectation E (1 /c) .
Let us discuss the previous properties of the equilibrium strategies. Consider ataxpayer with a given income level y. Clearly, as Vε increases auditors know that thevariance of the report will also increase. Therefore, the negative coefficient γ(c) ofthe equilibrium audit strategy increases in absolute value when Vε increases. This isso because the auditors would like to inspect more intensively low income reports inorder to impose fines on taxpayers having low values of ε and, thus, evading moreincome. Since the audit effort becomes more decreasing in reported income, taxpayersknow that low reports will be more intensively inspected, while high reports will notbe exposed to so severe inspections. This new bias in the audit strategy induces inturn a change in the reporting strategies so that more income is declared in order tominimize the intensity of the audit.
9

The report x decreases with the income variance Vy, which is consistent withthe fact that tax auditors are facing more uncertainty about the true income oftaxpayers. Finally, if taxpayers believe that the expected audit cost is high (thatamounts “ceteris paribus” to a low value of E (1 /c)), then they will expect a lowaudit effort by the tax auditors. Therefore, optimal reports must be increasing inE (1 /c).
Concerning the audit effort for given values of x and c, we see that, as thevariance Vy of income increases, tax auditors face more uncertainty about a variablethat is private information of taxpayers. Since income is the relevant variable in theinspection process, more resources must be devoted to audit activities. The varianceVε of the taxpayers’ cost affects negatively the inspection effort. This is consistentwith the fact that taxpayers raise the amount of income they report when Vε increasesand, hence, less effort should be devoted to audit taxpayers who underreport lessincome on average. Moreover, the audit effort is obviously decreasing in the costparameter c and is also decreasing in E (1 /c) . Note that, if taxpayers expect a highvalue of the random variable c, then E (1 /c) will tend to be low. In this case theywill underreport more income, since they think that the auditors will not be veryaggressive in their inspection strategy. The best response to this report strategy isto conduct an audit more aggressive than the one expected by taxpayers.
From (3.1) we can compute the expected reported income per capita in theeconomy,
E(x) = E [x (y, ε)] = y − 1
2E (1 /c)
∙1 +
VyVε
¸.
Note that, as occurs with the report x, the expected reported income is increasingin both E (1 /c) and Vε, whereas is decreasing in Vy. Moreover,
∂E(x)∂y = 1, that is,
an increase in the average income results in an equivalent increase in the averagereported income.
We can compute now the expected audit effort to see how the different sourcesof uncertainty affect the audit strategy of the tax enforcement agency on average.To this end we compute the unconditional expectation of (3.2) , which will give usthe expected effort before observing the realization of the cost parameter c of eachauditor,
E (e) = E [e (x (y, ε) , c)] =1
2
µ1 +
VyVε
¶.
It is obvious that the expected audit effort E (e) is increasing in Vy, decreasing in Vεand independent of both c and E (1 /c) . Clearly, as Vε increases the reports becomeless reliable signals of the true income. Recall that high values of the variance oftaxpayers’ cost induce larger amounts of reported income. In this case tax auditorsshould reduce the average effort in order to lower the probability of applying to mucheffort in inspecting honest taxpayers. Again, more income uncertainty, parametrizedby the variance Vy, requires more effort by the auditors. Finally, observe that, whencomputing the unconditional expectation, we are eliminating the asymmetry referredto the audit cost c between the agency and the taxpayer. When both the agency andthe taxpayer face the same priors about the cost parameter c, the opposite effects ofthe distribution of c on the reporting and inspection strategies cancel out on average.
10

We can now look at the expected revenue net of the audit cost raised by the taxenforcement agency and see also how this revenue is affected by the different sourcesof uncertainty. The random net revenue per taxpayer is
R = τx (y, ε) + τe (x (y, ε) ; c) (y − x (y, ε))− 12τ c [e (x (y, ε) , c)]2 . (3.3)
As we have already said, since there is a continuum of ex-ante identical taxpayersdistributed uniformly on the interval [0, 1] , the expected net resources extracted froma taxpayer coincide with the aggregate net revenue raised by the agency.
Corollary 3.1. The expected net revenue E³R´is increasing in Vε and decreasing
in Vy. Moreover, E³R´is increasing in E (1 /c) .
A larger value of the variance Vy of income means a larger disadvantage of taxauditors with respect to taxpayers and, hence, tax auditors end up putting to mucheffort on low income taxpayers, who are those paying less fines. When Vε increases,tax report depart more from the true income and, as we argued before, low incomereports will be more intensively audited. Moreover, the amount of reported incomeincreases on average. Therefore, the agency will raise more revenues both fromthe penalties imposed on evaded taxes and from the taxes on the larger amount ofvoluntarily reported income. Finally, a low value of E (1 /c) is typically associatedwith a large expected cost. Hence, the expected net revenue will be low sincetaxpayers anticipate that it is very costly for the auditors to conduct an audit.
Note that we have just looked at the unconditional expected net revenue raisedby the tax agency. We could look now at the expected net revenue conditional to
a given realization of the cost parameter, E³R |c = c
´. The previous conditional
expectation is the expected revenue raised by a tax auditor with a value of thecost parameter equal to c. In this case, the effects of changes in Vε and Vy are thesame as in the unconditional case. However, the effects of E (1 /c) are generallyambiguous. To see this, consider the case where there is no income uncertainty, thatis, Vy = 0 or, equivalently, y = y. This is in fact a situation very similar to thatconsidered by Reinganum and Wilde (1988), where the agency knows the realizationof its (homogeneous) audit cost parameter and taxpayers view this cost parameteras a random variable c with a given distribution. More precisely, these authorsconsider a cut-off strategy where a taxpayer with a given income y is only inspectedif his level of underreporting is so large that the penalty revenue outweighs the auditcost faced by the tax enforcement agency. Finally, they assume a constant cost perinspection that each taxpayer views as if it were drawn from a uniform distribution.Coming back to our scenario, we can compute from (3.3) the following conditionalexpectation:
E³R |c = c, y = y
´= τ
µy − 1
2E (1 /c)+
1
8c [E (1 /c)]2+1
8cVε
¶,
which is obviously decreasing in the value of the cost parameter c and increasing in
11

the taxpayers’ cost variance Vε. However, it is immediate to obtain that
∂E³R |c = c, y = y
´∂E (1 /c)
≷ 0 if and only if E (1 /c) ≶ 1
2cτ. (3.4)
Therefore, if the tax authority can affect the distribution of its audit cost, then
the expected revenue is maximized when E (1 /c) =1
2cτ. In the next section we
will assume that the tax enforcement agency can affect the variance of the truedistribution of c and, then, we will make explicit the relation between V ar(c) andE (1 /c) through a couple of examples.
We discuss next the comparative statics concerning taxpayers’ total welfare underthe assumption that the government revenue is not used to provide goods or servicesentering in the taxpayers’ utility function. To introduce government spending inthe taxpayers’ utility function will give raise to an extra degree of freedom in ourmodel. Since tax contributions decrease disposable income but they could increasethe amount of government spending, the following results concerning welfare could bereversed depending on the importance of government spending in the preferences oftaxpayers. Given the assumed linearity of preferences the ex-ante welfare is measuredby the expected income E (n) of a taxpayer net of taxes, fines, and inspection costsbefore observing the realizations of his income y and of his private audit cost ε. Notethat, because of the law of large numbers, the expected welfare of a given taxpayeris equal to the average welfare of the taxpayers of this economy. Recall that therandom net income of a taxpayer is
n = y − τx(y, ε)− τe (x(y, ε), c) (y − x(y, ε))− ετe (x(y, ε), c) . (3.5)
The next proposition provides the comparative statics results concerning thetaxpayers’ expected welfare:
Corollary 3.2. (a) The expected welfare E (n) of a taxpayer is increasing in Vε anddecreasing in Vy.
(b) The effects of changes in E (1 /c) on E (n) are ambiguous.
To understand part (a) of the previous corollary, we just have to remind that theexpected audit effort is decreasing in the variance Vε of taxpayers’ cost and increasingin the variance Vy. The implications for the cost of suffering an inspection are thusimmediate. In fact, in our model the effects on that cost dominate over the effects onthe expected amount of reported income. In particular, we have already seen that, ifthe variance Vε of taxpayers’ cost increases, the expected amount of reported incomeincreases. This first effect tends to reduce the expected net income of taxpayers.However, the increase in Vε directly reduces the expected value of the last term in(3.5), which collects the total expected cost borne by taxpayers. This last effect turnsout to be the dominating one in our model and, thus, an increase in Vε results inmore expected welfare. Finally, the converse argument applies to explain the welfareeffects of changes in the variance Vy of taxpayers’ income.
Concerning part (b) of Corollary 3.2 note that a low expected value of theparameter c (i.e., a large value of E (1 /c)) increases the expected effort of the
12

audits and this has a direct negative effect on the expected income net of taxesand fines. However, a large value of E (1 /c) increases the expected absolute valueof the negative coefficient γ (see 2.13). This means that the audit strategy is moresensitive to the reports. Therefore, taxpayers facing high (low) values of the cost εwill be less (more) intensively inspected and this results in a smaller expected totalcost of suffering an inspection, as can be seen from the last term of (3.5). Therefore,the previous two effects on taxpayers’ net income go in opposite direction and thedominating effect will thus depend on the particular parameter values of the model.
4. The bias of the effective tax system
Another question that can be analyzed in the present context is the degree of effectiveprogressiveness exhibited by the tax system in equilibrium. It is a well establishedresult in the literature that the effective tax rate displays less progressiveness thanthe statutory one when the relationship between auditors and taxpayers is strategic(see Reinganum and Wilde, 1986; and Scotchmer, 1992). This is so because theagency will audit individuals reporting low income more intensively than individualsproducing high income reports. Therefore, even if the optimal amount of reportedincome is increasing in true income, high-income individuals find more attractive tounderreport a larger proportion of their income. This generates a regressive bias inthe effective tax structure once we take into account the penalty payments.5
In order to analyze whether the effective tax structure of our model is progressiveor regressive, we should compute the average expected tax rate faced by a taxpayerand see how this rate changes with the true income y. The expected payment to thegovernment (including taxes and penalties) of a taxpayer having a level y of incomeis
g(y) = E [τx(y, ε) + e (x(y, ε), c) τ (y − x(y, ε))] .Note that in the previous expression we have to compute the expectation just withrespect to the random variables ε and c. The average expected tax rate is thus
τ(y) =g(y)
y.
Under effective proportionality τ(y) should be independent of y, while under effectiveprogressiveness (regressiveness) τ(y) should be increasing (decreasing). The followingcorollary tells us that, unlike the previous literature, the function τ(y) could be non-monotonic:
Corollary 4.1. There exists an income level y such that the derivative of the averageexpected tax rate satisfies
τ 0(y) < 0 for all y > y.
Moreover, the function τ(y) could be either
5Scochmer (1987) and Galmarini (1997) analyze the size of the regressive bias under cut-off auditpolicies when taxpayers are sorted into income classes and when taxpayers differ in terms of theirrisk aversion, respectively. These two modifications imply a reduction in the size of the regressivebias.
13

(a) decreasing both on the interval (−∞, 0) and on the interval (0,∞).or(b) U-shaped on the interval (−∞, 0) and inverted U-shaped on the interval
(0,∞).
According to the first part of the corollary, the effective tax system is alwayslocally regressive for sufficiently high income levels. Concerning the second part, thepotential inverted U-shape of the average expected tax rate for positive income levelsmeans that the effective tax system could display local regressiveness for sufficientlyhigh levels of income, whereas it could display local progressiveness on a lower intervalof positive income levels. In order to illustrate Corollary 4.1, Figure 1 displays thefunction τ(y) for the following configuration of parameter values: E (1 /c) = 20/3 ,Vy = 1 , Vε = 10 , y = 3 and τ = 0.2. Figure 2 uses the same parameter valuesexcept that Vε = 4. We see that the average expected tax rate can be monotonicallydecreasing (i.e., the tax system can be uniformly regressive), as in Figure 1, orinverted U-shaped on the interval (0,∞), as in Figure 2.
[Insert Figures 1 and 2]
To understand the potential non-monotonic behavior of the average expected taxrate, we should bear in mind that individuals suffering an inspection might end upreceiving a tax refund. This is so because they could have declared an amount ofincome larger than the true one due to the large cost they face in case of inspection.Note also that the existence of this cost makes taxpayers to declare a larger amountof income. Therefore, audits could detect this kind of excessive tax contribution.Since the audit effort is decreasing in the amount of reported income and reportsare decreasing in true income, low-income individuals are more intensively inspectedand, thus, they are more likely to get tax refunds. Note that this feature of theaudit strategy induces a progressive bias in the tax system that could outweigh theaforementioned regressive bias present in strategic models of tax compliance. Thepotential non-monotonic behavior of τ(y) just captures the trade-off between thesetwo biases.
5. The effects of the variance of the auditors’ cost
The comparative statics exercises of the previous section have been performed interms of the expectation E (1 /c) . In this section we analyze how this expectationcould be affected by the moments of the primitive distribution of c. In order tomotivate this exercise, assume that the tax enforcement agency has a given budgetto provide some training to its inspectors. Let us assume that the amount of resourcesavailable per auditor is equal to b. There is a stochastic training technology relatingthe value of the cost parameter c of a tax auditor with the amount b invested in histraining,
c = h(b, ξ),
where h is strictly decreasing in b and ξ is a random variable independent of theamount b. As we already know, if the tax authority wants to maximize its aggregaterevenue, then it has to maximize the expected revenue per taxpayer. According to
14
Corollary 3.1, it is obvious that the agency should try to reach the largest possiblevalue for E (1 /c) .
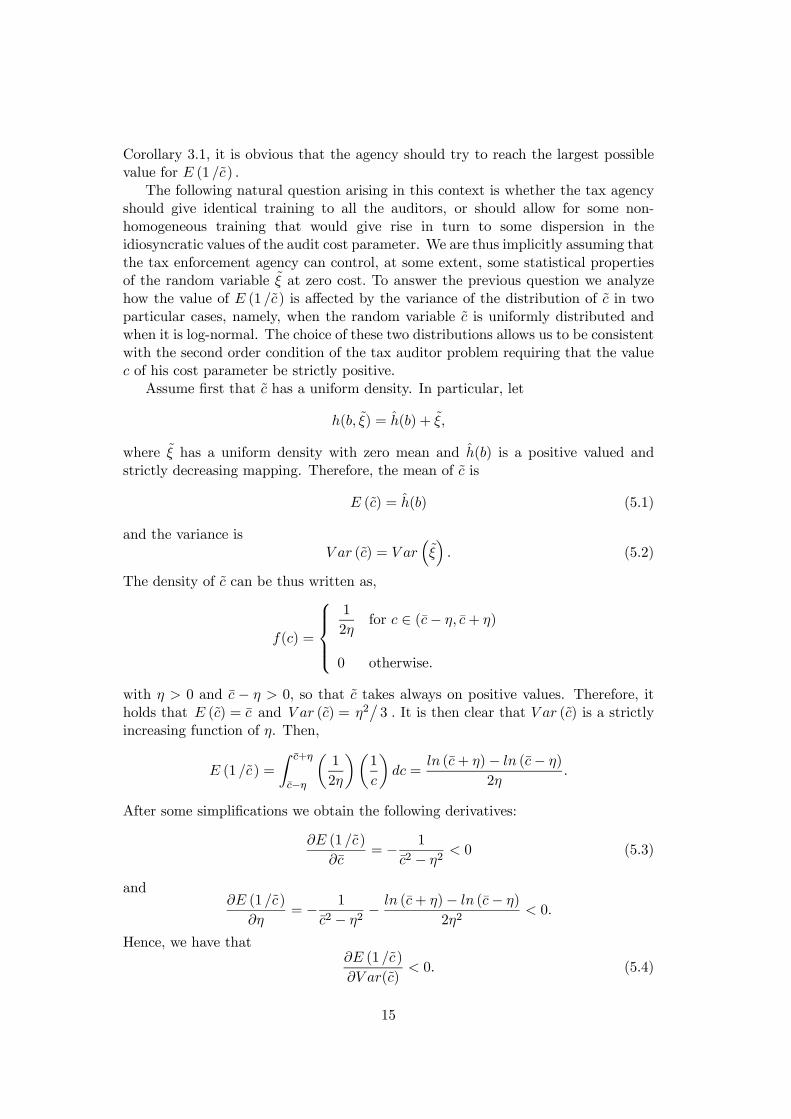
The following natural question arising in this context is whether the tax agencyshould give identical training to all the auditors, or should allow for some non-homogeneous training that would give rise in turn to some dispersion in theidiosyncratic values of the audit cost parameter. We are thus implicitly assuming thatthe tax enforcement agency can control, at some extent, some statistical propertiesof the random variable ξ at zero cost. To answer the previous question we analyzehow the value of E (1 /c) is affected by the variance of the distribution of c in twoparticular cases, namely, when the random variable c is uniformly distributed andwhen it is log-normal. The choice of these two distributions allows us to be consistentwith the second order condition of the tax auditor problem requiring that the valuec of his cost parameter be strictly positive.
Assume first that c has a uniform density. In particular, let
h(b, ξ) = h(b) + ξ,
where ξ has a uniform density with zero mean and h(b) is a positive valued andstrictly decreasing mapping. Therefore, the mean of c is
E (c) = h(b) (5.1)
and the variance isV ar (c) = V ar
³ξ´. (5.2)
The density of c can be thus written as,
f(c) =
⎧⎪⎪⎨⎪⎪⎩1
2ηfor c ∈ (c− η, c+ η)
0 otherwise.
with η > 0 and c − η > 0, so that c takes always on positive values. Therefore, itholds that E (c) = c and V ar (c) = η2
±3 . It is then clear that V ar (c) is a strictly
increasing function of η. Then,
E (1 /c) =
Z c+η
c−η
µ1
2η
¶µ1
c
¶dc =
ln (c+ η)− ln (c− η)
2η.
After some simplifications we obtain the following derivatives:
∂E (1 /c)
∂c= − 1
c2 − η2< 0 (5.3)
and∂E (1 /c)
∂η= − 1
c2 − η2− ln (c+ η)− ln (c− η)
2η2< 0.
Hence, we have that∂E (1 /c)
∂V ar(c)< 0. (5.4)
15

Since the audit cost of an auditor is strictly decreasing in the amount of resourcesdevoted to his training, the derivative (5.3) implies that the expected value of cshould be minimized and, thus, the agency should select b = b , which implies thatE (c) = h(b) , as follows from (5.1) . This means that the agency should exhaust allthe resources for training. Moreover, according to (5.4) , if the randomization deviceof the training technology generates a uniform distribution of the cost parameter c,a tax enforcement agency aiming at the maximization of its net revenue should tryto minimize the variance of c. Obviously, this is achieved by minimizing the varianceof the random variable ξ (see (5.2)).
Assume now that the cost parameter c is log-normally distributed. More precisely,assume that
h(b, ξ) = h(b)ξ, (5.5)
where ξ is log-normal with E(ξ) = 1 and h(b) has the same properties as before.Therefore, the mean of the random variable c is
E(c) = h(b), (5.6)
and its variance is
V ar (c) =hh(b)
i2V ar(ξ). (5.7)
Let Ehln³ξ´i= µ and V ar
hln³ξ´i= σ2 . Therefore, the mean of ξ is
E(ξ) = exp
µµ+
σ2
2
¶= 1,
and, hence, µ = −σ2± 2. Moreover,V ar(ξ) =
hE(ξ)
i2 £exp
¡σ2¢− 1¤ = exp ¡σ2¢− 1. (5.8)
Since c is log-normal, the random variable ln (c) is normally distributed. Therefore,from (5.5) , we have that
E [ln (c)] = ln³h(b)
´+ µ = ln
³h(b)
´− σ2
2
and
V ar [ln (c)] = σ2.
Similarly, the random variable 1 /c is log-normal as ln (1 /c) is normal. Sinceln (1 /c) = −ln (c) , we get
E [ln (1 /c)] = −ln³h(b)
´+
σ2
2(5.9)
andV ar [ln (1 /c)] = σ2. (5.10)
16

Therefore, using (5.9) and (5.10) , we can obtain the mean of the random variable1 /c ,
E (1 /c) = exp
∙E [ln (1 /c)] +
V ar [ln (1 /c)]
2
¸= exp
h−ln
³h(b)
´+ σ2
i. (5.11)
A revenue-maximizing tax enforcement agency should select the largest feasible valueof E (1 /c) (see Corollary 3.1), and it is obvious from (5.11) that this is achieved by
choosing simultaneously the lowest feasible value for ln³h(b)
´and the largest feasible
value for σ2. The minimization of ln³h(b)
´is accomplished again by selecting b = b
and, hence, E (c) = h(b) , as follows from (5.6) . Having picked optimally the valueof E (c), note from (5.8) that the maximization of the variance σ2 means that thevariance of ξ has to reach its largest feasible value. Moreover, the previous policyimplies that, for a given value of resources per auditor b, the variance of c must beset as large as possible by the tax enforcement agency (see (5.7)).
We see that the effect of the variance of the cost parameter c on the expectationE (1 /c) under a log-normal distribution is the opposite to that obtained undera uniform distribution. Thus, if the results contained in Corollaries 3.1 and3.2, and in expression (3.4) were written in terms of the variance of c, thecorresponding comparative statics exercises would be extremely dependent on thespecific distribution of c under consideration.
6. Conclusion
In the context of a model of strategic interaction between tax auditors and taxpayers,we have analyzed the effects of different sources of uncertainty on tax compliance.Besides the typical uncertainty faced by tax auditors associated with the incomeof taxpayers, we add two additional sources of uncertainty. The first one refersto individual cost borne by taxpayers suffering a tax inspection. This cost isunobservable by tax auditors and results in tax reports not fully informative aboutthe true income of taxpayers. The noise introduced in the reports could also arisefrom the idiosyncratic tax morale of each taxpayer. The second source of uncertaintyrefers to the fact that the cost of conducting an audit is private information of thetax auditors and the inspection strategy is thus viewed as random by the taxpayers.Our main results can be summarized as follows:
• Larger variance of the distribution of taxpayers’ cost results in more averageincome reported, less average audit effort, more net revenue for the government, andmore expected welfare for the taxpayers.
• Larger variance of the income distribution results in less average incomereported, more average audit effort, less net revenue for the government, and lessexpected welfare for the taxpayers.
• Larger average audit cost borne by the tax agency typically results in lessaverage income reported and less net revenue for the government.
• The relation between the average expected tax rate and the true income couldbe non-monotonic. Therefore, the tax system could be locally progressive on somerange of income levels and locally regressive on another range.
17
We should mention that the tax evasion literature has considered additionalsources of randomness in the relation between taxpayers and auditors. The factthat tax codes are complex, vague, and ambiguous has been recognized by severalstudies (see the abundant references in Section 9.1 of Andreoni, Erard and Feinstein,1998). This aspect of tax codes makes difficult for the taxpayers to apply the laweven if they want to do so (see Rubinstein, 1979). Scotchmer and Slemrod (1989)consider a model were the ambiguity of tax laws gives raise to an audit policy yieldingrandom outcomes depending on the interpretation of the law made by the auditors.Scotchmer (1989) and Jung (1991) consider instead models where tax complexitymakes taxpayers uncertain about their true taxable income. Pestieau, Possen andSlutsky (1998) analyze the welfare implications of explicit randomization in tax laws.An even more direct source of mistakes committed by taxpayers arises from thedesign of the income report form that, in many circumstances, induces taxpayerconfusion. For instance, if the sources of income are diverse and, thus, the reporthas to contain multiple components (as in Rhoades, 1999), then the final reportcould easily contain some imprecisions. Finally, Broadway and Sato (2000) consideralso the possibility of unintentional administrative errors committed by tax auditors.The previous theoretical papers and the experiments conducted by Alm, Jackson andMcKee (1992) tend to conclude that randomness in reports or in audits induces moretax compliance.
In our paper we obtain a similar result concerning the positive association betweenthe expected amount of reported income and the variance of the distribution ofthe cost faced by audited taxpayers. However, in our paper no ambiguity in thelaw is present and no errors are committed by taxpayers. The noise appearingin an individual tax report is observable by each taxpayer but is unknown bythe tax enforcement agency. This is so because this noise arises either from theprivate cost of suffering an inspection or from idiosyncratic moral sentiments towardstax compliance. A somewhat surprising implication of our model is that, even iftaxpayers declare more income when the variance of the taxpayers’ cost rises, theirexpected welfare increases thanks to the induced reduction in the total cost they facewhen they are audited.
18

A. Appendix
Proof of Proposition 2.1. The tax auditor observes the reported income x andthe value c of the cost parameter and chooses the audit effort e in order to solve(2.3). Therefore, the optimal audit effort is given by (2.4). The auditor conjecturesthat taxpayers follow linear report strategies, i.e.,
x(y, ε) = α+ βy + λε.
Note that observing a realization of the random variable x is informationallyequivalent to observing a realization of the random variable
x− α
β= y +
λε
β,
which has mean equal to y and variance equal to Vy +¡λ2Vε
±β2¢. Therefore,
E (y |x) = Eµy
¯x− α
β
¶= E
µy
¯y +
λε
β
¶.
Since y and ε are mutually independent, we can apply the projection theorem fornormally distributed random variables to get
E (y |x) = y + VyVy + (λ2Vε /β2 )
µx− α
β− y
¶. (A.1)
Plugging (A.1) in (2.4) and collecting terms we obtain
e =1
c
½∙1− Vy
Vy + (λ2Vε /β2 )
¸y −
∙Vy
Vy + (λ2Vε /β2 )
¸α
β
¾+τ
c
½Vy
[Vy + (λ2Vε /β2 )]β− 1¾x.
The previous expression confirms that the audit strategy is linear in the observedreport x. Therefore, letting
e(x, c) = δ(c) + γ(c)x
and equating coefficients, we get
δ(c) =1
c
½∙1− Vy
Vy + (λ2Vε /β2 )
¸y −
∙Vy
Vy + (λ2Vε /β2 )
¸α
β
¾, (A.2)
and
γ(c) =1
c
½Vy
[Vy + (λ2Vε /β2 )]β− 1¾. (A.3)
A taxpayer observes his true income y and conjectures that the tax auditor willfollow an audit strategy that is linear in x, e(x, c) = δ(c) + γ(c)x. Therefore, theobjective of the taxpayer is to maximize
E {y − τx− [δ(c) + γ(c)x)] τ (y − x)− ετ [δ(c) + γ(c)x)]} .
19

The optimal intended report x must satisfy the following first order condition (see(2.7)):
−1−E [γ(c) (y − x)− δ(c)− γ(c)x+ γ(c)ε] = 0.
We can solve for x in the previous equation,
x =1
2
∙y + ε+
(1−E [δ(c)])E [γ(c)]
¸. (A.4)
The second order condition (2.8) becomes simply E [γ(c)] < 0. Note that (A.4) con-firms that the report strategies used by taxpayers are linear, i. e., x(y) = α+ βy + λε .Therefore, equating coefficients we obtain,
α =1
2
µ1−E [δ(c)]E [γ(c)]
¶, (A.5)
β =1
2, (A.6)
and
λ =1
2. (A.7)
Thus, we obtain the equilibrium values of β and λ given in (2.10) and (2.11) . Wemust compute now the expected values of the coefficients δ(c) and γ(c). To this end,we compute the expectation of (A.2) and (A.3) to obtain
E [δ(c)] = E (1 /c)
½∙1− Vy
Vy + (λ2Vε /β2 )
¸y −
∙Vy
Vy + (λ2Vε /β2 )
¸α
β
¾(A.8)
and
E [γ(c)] = E (1 /c)
½Vy
[Vy + (λVε /β2 )]β− 1¾. (A.9)
Using (A.6) and (A.7) , we can find the values of α, E [δ(c)] , and E [γ(c)] solving thesystem of equations (A.5), (A.8) and (A.9). After some tedious algebra we obtainthe values of α given in (2.9) and
E [δ(c)] =VyVε−E (1 /c) y
µVy − VεVy + Vε
¶,
E [γ(c)] = E (1 /c)
µVy − VεVy + Vε
¶.
Note that the second order condition E [γ(c)] < 0 is satisfied since both c > 0 andVε > Vy hold by assumption.We can now find the coefficients δ and γ defining the audit strategy. To this end
we only have to plug the values of α, β and λ we have just obtained into (A.2) and(A.3). Some additional algebra yields the values of δ(c) and γ(c) given in (2.12) and(2.13).
20
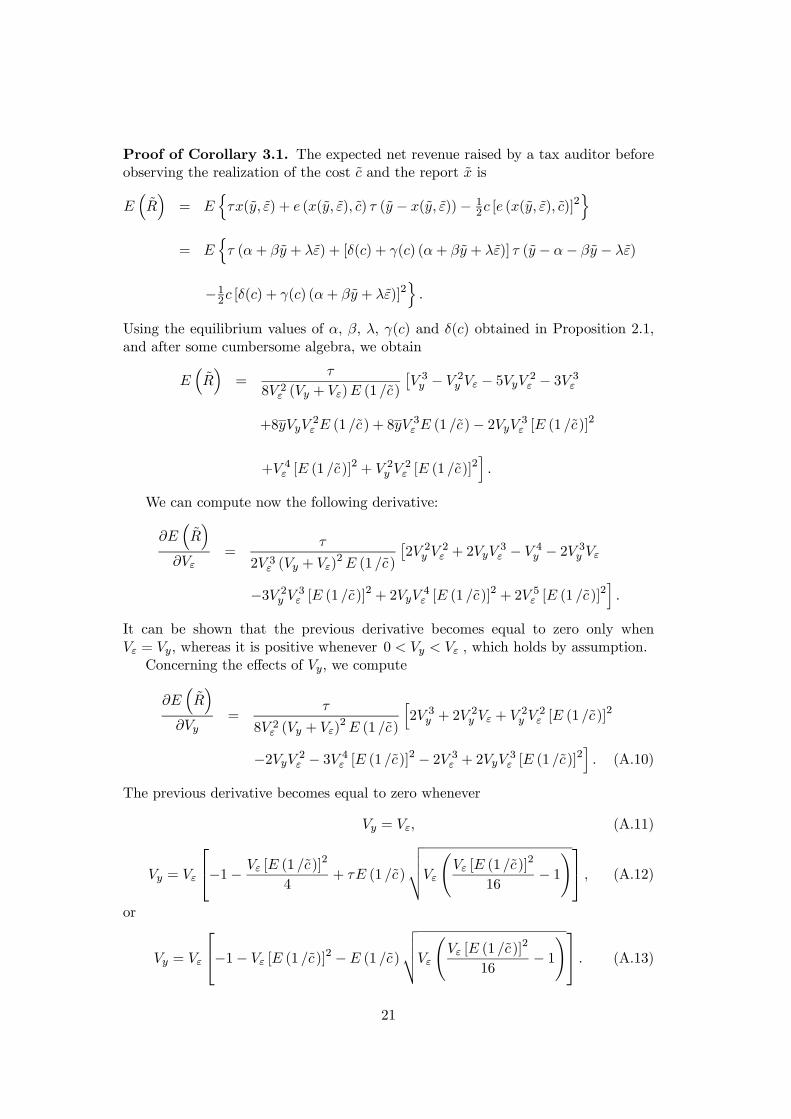
Proof of Corollary 3.1. The expected net revenue raised by a tax auditor beforeobserving the realization of the cost c and the report x is
E³R´
= Enτx(y, ε) + e (x(y, ε), c) τ (y − x(y, ε))− 1
2c [e (x(y, ε), c)]2o
= Enτ (α+ βy + λε) + [δ(c) + γ(c) (α+ βy + λε)] τ (y − α− βy − λε)
−12c [δ(c) + γ(c) (α+ βy + λε)]2o.
Using the equilibrium values of α, β, λ, γ(c) and δ(c) obtained in Proposition 2.1,and after some cumbersome algebra, we obtain
E³R´
=τ
8V 2ε (Vy + Vε)E (1 /c)
£V 3y − V 2y Vε − 5VyV 2ε − 3V 3ε
+8yVyV2ε E (1 /c) + 8yV
3ε E (1 /c)− 2VyV 3ε [E (1 /c)]2
+V 4ε [E (1 /c)]2 + V 2y V
2ε [E (1 /c)]
2i.
We can compute now the following derivative:
∂E³R´
∂Vε=
τ
2V 3ε (Vy + Vε)2E (1 /c)
£2V 2y V
2ε + 2VyV
3ε − V 4y − 2V 3y Vε
−3V 2y V 3ε [E (1 /c)]2 + 2VyV 4ε [E (1 /c)]2 + 2V 5ε [E (1 /c)]2i.
It can be shown that the previous derivative becomes equal to zero only whenVε = Vy, whereas it is positive whenever 0 < Vy < Vε , which holds by assumption.
Concerning the effects of Vy, we compute
∂E³R´
∂Vy=
τ
8V 2ε (Vy + Vε)2E (1 /c)
h2V 3y + 2V
2y Vε + V
2y V
2ε [E (1 /c)]
2
−2VyV 2ε − 3V 4ε [E (1 /c)]2 − 2V 3ε + 2VyV 3ε [E (1 /c)]2i. (A.10)
The previous derivative becomes equal to zero whenever
Vy = Vε, (A.11)
Vy = Vε
⎡⎣−1− Vε [E (1 /c)]24
+ τE (1 /c)
vuutVεÃVε [E (1 /c)]216
− 1!⎤⎦ , (A.12)
or
Vy = Vε
⎡⎣−1− Vε [E (1 /c)]2 −E (1 /c)vuutVεÃVε [E (1 /c)]2
16− 1!⎤⎦ . (A.13)
21

The roots (A.12) and (A.13) are imaginary when Vε ∈ (0, 16 /E (1 /c)) . In this case,the single real root is the one given by (A.11) . If Vε ≥ 16 /E (1 /c) , then the roots(A.12) and (A.13) are real. The root (A.13) is obviously negative. Concerning theroot (A.12) , it can be easily checked that it is also negative when Vε ≥ 16 /E (1 /c) .Therefore, (A.10) does not change its sign in all the parameter region satisfying0 < Vy < Vε . Since the last chain of inequalities holds by assumption, we only haveto check numerically that (A.10) is negative in that region.
Finally, we can compute the following derivative with respect to E (1 /c):
∂E³R´
∂E (1 /c)=
τ2
8V 2ε (Vy + Vε) [E (1 /c)]2
h−V 3y + V 2y V 2ε [E (1 /c)]2 + V 2y Vε
−2τ2VyV 3ε [E (1 /c)]2 + 5VyV 2ε + V 4ε [E (1 /c)]2 + 192V 3yi.
The previous derivative is always positive, as it can be shown by checking that it hasonly two imaginary roots for E (1 /c) and, hence, it never changes its sign for allpositive real values of E (1 /c) .
Proof of Corollary 3.2. (a) The expected disposable income net of audit costs ofa taxpayer is
E (n) = E [y − τx (y, ε)− e (x (y, ε) , c) τ (y − x (y, ε))− ετe (x (y, ε) , c)] =
E {y − τ (α+ βy + λε)− [δ(c) + γ(c) (α+ βy + λε)] τ (y − α− βy − λε)
−ετ [δ(c) + γ(c) (α+ βy + λε)]} .Using the equilibrium values of α, β, λ, δ(c) and γ(c) given in (2.9)-(2.13) andsimplifying, we obtain
E (n) =1
4E (1 /c)V 2ε (Vy + Vε)
£4yVyV
2ε [E (1 /c)] + 4yV
3ε [E (1 /c)]
−4τyVyV 2ε [E (1 /c)]− 4τyV 3ε [E (1 /c)]− τV 2y Vε + τVyV2ε
+ τV 3ε − τV 3y + τVyV3ε [E (1 /c)]
2 + τV 4ε [E (1 /c)]2i.
We can compute then the derivative of E (n) with respect to Vε,
∂E (n)
∂Vε=
τ
4V 3ε (Vy + Vε)2E (1 /c)
h4V 3y Vε + V
5ε [E (1 /c)]
2 + 2V 2y V2ε
+2V 4y + 2VyV4ε [E (1 /c)]
2 − V 2y V 3ε [E (1 /c)]2i.
It can be shown that the previous derivative is strictly positive whenever Vε >¡√2− 1¢Vy,
which holds by assumption.
22

Similarly, for the effects of Vy on E (n) we can compute
∂E (n)
∂Vy= − τ
2V 2ε (Vy + Vε)2E (1 /c)
h2V 2y Vε + VyV
2ε + V
3y + V
4ε [E (1 /c)]
2i< 0.
(b) We can compute the following derivative:
∂E (n)
∂E (1 /c)=
τ
4V 2ε (Vy + Vε) [E (1 /c)]2
£V 2y Vε − VyV 2ε + V 3y − V 3ε
−VyV 3ε [E (1 /c)]2 + V 4ε [E (1 /c)]2i.
Let
θ =Vy + Vε
(Vε)3/2,
Then, it can be easily verified that
∂E (n)
∂E (1 /c)≶ 0 for all E (1 /c) ≶ θ.
Proof of Corollary 4.1. The average expected tax rate is
τ(y) =g(y)
y=E [τx(y, ε) + e (x(y, ε), c) τ (y − x(y, ε))]
y=
E {τ (α+ βy + λε) + [δ(c) + γ(c) (α+ βy + λε)] τ (y − α− βy − λε)}y
.
Using the equilibrium values of the parameters characterizing the audit and reportstrategies given in (2.9)-(2.13) and computing the expectation with respect to c andε, we get an expression of the following type:
τ(y) =my2 + ny + q
sy,
where the coefficients m, n, q and s depend on the parameters of the model. Inparticular,
m = V 2ε (Vy − Vε) [E (1 /c)]2
ands = 4yV 2ε (Vy + Vε)E (1 /c) .
Note that m < 0 as Vy < Vε, whereas s > 0. Therefore,
limy→∞ τ(y) = −∞,
limy→−∞ τ(y) =∞,
23

and the function τ(y) is discontinuous at y = 0. Moreover, the equation τ 0(y) = 0has two conjugate solutions,
±√∆VεE (1 /c)
,
with
∆ = V 2y − 2yVyVεE (1 /c) + 2VyVε − 2yV 2ε E (1 /c)− V 3ε [E (1 /c)]2
+V 2ε + y2V 2ε [E (1 /c)]
2 .
These two solutions are both real with opposite sign when the term ∆ is positive.Otherwise, the two solutions are imaginary. Therefore, on the one hand, when ∆ isnegative, the function τ(y) is decreasing on the interval (−∞, 0) and is also decreasingon the interval (0,∞). On the other hand, if ∆ is positive then the function τ(y)is U-shaped on the interval (−∞, 0) and inverted U-shaped on the interval (0,∞).Note that in both cases there exists an income level y such that τ 0(y) < 0, for ally > y. Finally, note that ∆ can be positive or negative depending on the parametervalues. For instance, let E (1 /c) = 20/3, Vy = 1, y = 3 and τ = 0.2. In this case, ifVε = 4, then ∆ = 2780.6. However, if Vε = 10, then ∆ = −8723.4.
24
References
[1] Allingham, M.G. and A. Sandmo (1972). “Income Tax Evasion: A TheoreticalAnalysis.” Journal of Public Economics 1, 323-38.
[2] Alm, J., B. Jackson, and M. McKee (1992). “Institutional Uncertainty andTaxpayer Compliance.” American Economic Review 82, 1018-1026.
[3] Alm, J., G.H. McClelland, and W.D. Schulze (1992). “Why Do People PayTaxes.” Journal of Public Economics 48, 21-38.
[4] Alm, J., R. Bahl, and M. N. Murray (1993). “Audit Selection and IncomeTax Underreporting in the Tax Compliance Game.” Journal of DevelopmentEconomics 42, 1-33.
[5] Andreoni, J., B. Erard, and J. Feinstein (1998). “Tax Compliance.” Journal ofEconomic Literature 36, 818-860.
[6] Border, K. and J. Sobel (1987). “Samurai Accountant: A Theory of Auditingand Plunder.” Review of Economic Studies 54, 525-540.
[7] Broadway, R. and M. Sato (2000). “The Optimality of Punishing Only theInnocent: the Case of Tax Evasion.” International Tax and Public Finance 7,641-664.
[8] Erard, B. and J. Feinstein (1994). “Honesty and Evasion in the Tax ComplianceGame.” RAND Journal of Economics 25, 1-19.
[9] Erard, B. and J. Feinstein (1994). “The Role of Moral Sentiments and AuditPerceptions in Tax Compliance.” Public Finance / Finances Publiques 48, 21-48.
[10] Galmarini, U. (1997). “On the Size of the Regressive Bias in Tax Enforcement.”Economic Notes by Banca Monte dei Paschi di Siena SpA 26, 75-102.
[11] Jung, W. (1991). “Tax Reporting Game under Uncertain Tax Laws andAsymmetric Information.” Economics Letters 37, 323-329.
[12] Mookherjee, D. and I. P’ng (1989). “Optimal Auditing, Insurance, and Redis-tribution.” Quartely Journal of Economics 104, 399-415.
[13] Pestieau, P., U. M. Possen, and S. M. Slutsky (1998). “The Value of ExplicitRandomization in the Tax Code.” Journal of Public Economics 67, 87-103.
[14] Reinganum, J. and L. Wilde (1985). “Income Tax Compliance in a Principal-Agent Framework.” Journal of Public Economics 26, 1-18.
[15] Reinganum, J. and L. Wilde (1986). “Equilibrium Verification and ReportingPolicies in a Model of Tax Compliance.” International Economic Review 27,739-760.
[16] Reinganum, J. and L. Wilde (1988). “A Note on Enforcement Uncertainty andTaxpayer Compliance.” Quarterly Journal of Economics 103, 793-798.
25

[17] Rhoades, S. C. (1999). “The Impact of Multiple Component Reporting on TaxCompliance and Audit Strategies.” The Accounting Review 74, 63-85.
[18] Rubinstein, A. (1979). “An Optimal Conviction Policy for Offenses that MayHave Been Committed by Accident ” Applied Game Theory, 406-413.
[19] Sanchez, I. and J. Sobel (1993). “Hierarchical Design and Enforcement of IncomeTax Policies.” Journal of Public Economics 50, 345-369.
[20] Scotchmer, S. (1987). “Audit Classes and Tax Enforcement Policy.” AmericanEconomic Review 77, 229-233.
[21] Scotchmer, S. (1989). “Who Profits from Taxpayer Confusion.” EconomicsLetters 29, 49-55.
[22] Scotchmer, S. (1992). “The Regressive Bias in Tax Enforcement.” in P. Pestieau(ed.), Public Finance in a World of Transition, Proceedings of the 47th Congressof the IIPF, St. Petersburg, 1991, Supplement to Public Finance / FinancesPubliques 47, 366-371.
[23] Scotchmer, S. and J. Slemrod (1989). “Randomness in Tax Enforcement.”Journal of Public Economics 38, 17-32.
[24] Torgler, B. (2002). “Speaking to Theorists and Searching for Facts: Tax Moraleand Tax Compliance in Experiments.” Journal of Economic Surveys 5, 658-683.
[25] Yitzhaki, S. (1974). “A Note on Income Tax Evasion: A Theoretical Analysis.”Journal of Public Economics 3, 201-202.
26

0
2
4
tau
2 4 6 8 y
Figure 1. Average expected tax rate when E (1 /c) = 20/3, Vy = 1, Vε = 10, y = 3and τ = 0.2
-0.5
0
0.5
tau
2 4 6 8 y
Figure 2. Average expected tax rate when E (1 /c) = 20/3, Vy = 1, Vε = 4, y = 3and τ = 0.2
27