capturing value from natural gas: mitigating the flaring ... · taxes to the state” (earthworks,...
TRANSCRIPT

Capturing Value From Natural Gas: Mitigating the Flaring of Natural Gas in North Dakota A comprehensive report on pathways for mitigation of natural gas flaring
Energy and the Environment Certificate
Duke University Design Capstone Report
Dylan Brown
Ryder Quigley Isaac Fraynd
Ilhan Savut Max Orenstein
Paul Burgess Rui Wang
Jacob Goyne Victor Stolt-Nielsen Holten

Table of Contents
1- Abstract
2- Introduction
a. Problem
b. Composition Analysis
c. Regulations
d. Environmental & Health Impacts
3- On-Site Flare Gas Utilization
4- Using Flare Gas to Power FedEx
5- Utilizing Methane-Oxidizing Bacteria to
Produce Animal Feed
6- Report Summary
7- References

Abstract:
Gas flaring, which has increased dramatically in the United States due to the shale gas and oil
boom, poses a large environmental danger as well as economic waste. Due to the lack of
infrastructure in certain areas and un-feasibility of transporting natural gas in other areas, much
of the gas found in oil focused plays is flared. To address this issue in the most time effective and
broad scope manner possible, three different approaches were taken to solve this issue. The
approaches taken involve utilizing the flare gas to produce feedstock, producing electricity and
flue gas to do on sight enhanced oil recovery, and transporting the gas to act as fuel for logistics
and distribution companies. These methods were chosen due to their potential economic and
technological feasibility, factors crucial in solving such an issue. The actual applicability and
feasibility of each method varied, yet overall could be met with success given certain
circumstances.
Introduction:
Everyday natural gas is being flared into the atmosphere at oil recovery sites around the world.
This flare gas is not only an air pollutant, but is also a valuable potential source of energy that is
being lost. The purpose of this report is to provide oil production groups with alternative uses for
these natural gases that are currently being flared. Such alternatives will help these productions
groups comply with increasingly stringent regulations by eliminating flaring and providing both
environmentally beneficial and economically profitable returns for the production groups.

The bulk of this study is focused on the Bakken Shale formation in North Dakota; an area known
for its oil production. North Dakota as a state is responsible for approximately 40% of all natural
gas flaring in the United States.
Flare Gas Problem:
Flammable natural gas is flared at oil and gas wellheads during the extraction process in an effort
to reduce the negative impacts of venting excess gas into our atmosphere. On a worldwide scale,
annually over 140 billion cubic meters of natural gas is flared resulting in more than 350 million
tons of CO2 emissions (World Bank, 2015). The following countries represent the five largest
producers of flare gas: Russia, Nigeria, Iran, Iraq & the United States (World Bank,
2012). Within the United States, (1) North Dakota and (2) Texas are by far the biggest producers
of flare gas. Flaring in North Dakota’s Bakken and in Texas’s Eagle Ford in 2013 combined to
produce the equivalent CO2 production of 1.5 million cars (Earthworks, 2014).
Though the environmental problems created as a direct result of flaring are significant, even
more staggering are the amount of economic opportunities lost from flaring the wasted gas.
Annually, the amount of lost flare gas worldwide is equivalent to over 20% of the United States’
total natural gas energy consumption (World Bank, 2015). Solving this hurdle requires an
economically feasible and profitable solution that is attractive to established oil & gas
companies. According to publicly accessible company data, North Dakota oil companies have
flared more than $854 million (96 billion cubic feet) of natural gas since 2010 (Earthworks,
2014). In 2013 alone, 12 companies in the Bakken region flared more than 3 billion cubic feet of

gas, with 8 of the top 10 flaring more than 35% of their total volume production (Earthworks,
2014).
Bakken Natural Gas Composition Analysis:
As one of the most important energy source in the U.S., natural gas has very high heat content.
However, the actual amount of heat to be harvest depends on the composition of the gas mixture.
Understanding the gas composition would enhance the estimation of the energy that is wasted
from flare gas as well as estimating the environmental impact of the greenhouse gases and other
pollutants. This section is devoted in provide an overlook of the flare gas content of the Bakken
formation of North Dakota.
Oil field associated gas, particularly that in the Bakken formation, is very rich in higher alkanes.
According to North Dakota Pipeline Authority, one thousand cubic feet of raw natural gas from a
Bakken/Three Forks contain around eight to twelve gallons of higher alkane (NDPA, 2012). As a
result, natural gas collected at the well heads of Bakken formation, contains only approximately
68% natural gas, far lower than the volume concentration found in a typical natural gas well
(90%-95%) as well as certain literature values of oil wells(81% and 86%) (Manbw, 2011)(Shell,
2004). The specific alkane components of Bakken formation natural gas are listed as the
following:
Due to the higher heat content and heavier mass per molecule of higher alkanes, the lower
methane concentration in the Bakken natural gas leads to slightly higher energy content per

volume. yet, this is almost fully offset by the increase in mass. Based on the combustion heat and
heat capacity of each chemicals, a model was constructed to calculate the composition impact of
the energy content. The result found the Bakken oil associated gas contains 1.352 million Btu per
MCF, or 45.8 million Btu per ton. This is approximately 35% more energy per MCF, but 3.2%
less energy per ton when compared to natural gas produced from a typical natural gas wells.
Other typical impurities found in flare gas includes carbon dioxide (CO2), water (H2O), nitrogen
(N2) and hydrogen sulfide (H2S). As natural product of natural gas combustion, CO2 and H2O are
excluded from the calculation. N2 is a stable gas content and found abundant in the atmosphere,
thus involved neither in the combustion processes nor the bacteria fixation. H2S is the major
source of sulfur in oil and gas and would be oxidized to sulfur dioxide (SO2). Both component
would lead to decrease in the energy content of the natural gas, but the impact is marginal due to
the low concentration found in natural gas (1% N2 and H2S would decrease the natural gas heat
value by 0.81% and 0.54% respectively). In addition, an extra cost could be associated with
desulfurization of the natural gas or the waste gas. High sulfur content is gas is also found
corrosive to equipment. Study found relatively low sulfur content in the Bakken crude oil (~
0.14% sulfur weight) as well as the associated gas (~ 10 ppm). (NDPC, 2014) (AFPM, 2014)

However, exceptions of high sulfur content have been reported. Current technologies, such as
wet scrubbers have effectively lower the cost of both desulfurization and the emission allowance.
Regulations:
Regulatory policy is now in place at both the federal and state level to help combat the negative
environmental impacts of natural gas flaring. At the federal level, the United States
Environmental Protection Agency passed laws requiring control measures to be phased in for
Reduced Emission Completions (RECs) by January 2015 (EPA, 2012). The Bureau of Land
Management also requires a 12.5% royalty (waived with pre-approved permits) for flaring on
federal land (GAO, 2010). Despite restrictions, at the state level North Dakota allows for gas to
be flared for “up to a year without payment of royalties to private owners of the mineral rights or
taxes to the state” (Earthworks, 2014). These specific policies are outlined in the imposition of
tax and payment of royalties section in N.D. Cent. Code § 38-08-06.4 on the control of gas and
oil resources (North Dakota Legislative Branch).
The North Dakota Industrial Commission has put in place a set of regulations, restrictions and
resulting penalties for those who decide to continue to flare at high levels. The following are case
specific examples of currently enacted policy efforts.
North Dakota Industrial Commission Goals:
1) Cut flaring to 5-10% of production volume by Q4 2020 from current ~22%
2) Improve communication between producers & midstream companies
3) Require detailed gas capture plans to obtain drilling permits

Regulation Noncompliance Violations:
1) Well production volume restrictions
1) 200 barrels a day if below current threshold but above 60% captured
2) 100 barrels a day if below 60% captured
Harsh Penalties & Fines:
1) Initial penalties start at $1000 a month
2) Failure to adhere to notices can increase penalties up to $12,500 per well per day
Exemptions from these rules and regulations can come at special request from members of
industry to state officials. The following is guidance policy outlined in a recent North Dakota
Industrial Commission order that states the most common reasons for exemption.
Exemptions:
1) surface landowner, tribal, or federal government right-of-way delays
2) temporary midstream down-time for system upgrades and/or maintenance
3) federal regulatory restrictions or delays
4) safety issues
5) delayed access to electrical power
6) possible reservoir damage

Environmental Risks & Health Impacts:
Although flaring is far less than an ideal option, the process is an effective short-term solution to
avoid simply venting natural gas into the atmosphere. The flaring process avoids releasing
massive amounts of this methane and other dangerous chemical compounds, but that is not to say
it is without its flaws. It creates significant byproducts of atmospheric contaminants that are
damaging to our earth and overall well-being as well. Among the atmospheric contaminants
produced are: oxides of nitrogen, carbon and sulphur (NO2, CO2, CO, SO2), particulate matter,
hydrocarbons, ash, photochemical oxidants and hydrogen sulphide (Obioh, 1999). While carbon
based pollution certainly contributes to rising global temperatures, methane is responsible for
trapping as much as 25 times more heat within our atmosphere (Podesta, 2015).
Excess heat from flaring sites is known to also destroy the growth of surrounding vegetation, as
well as do harm to other forms of life in the immediate area (e.g. birds). The atmospheric
contaminants produced also exacerbate the growing problem of acid rain, which damages crop
yields, depletes surrounding soil nutrients and erodes infrastructure.
This process can also have direct detrimental human health effects, as these air pollutants and
atmospheric contaminants can cause cancer, neurological, reproductive / developmental effects,
deformities in children, lung damage, skin problems, as well as negative effects on blood and
blood-forming cells that can cause anemia, pancytopenia or leukemia (Kindzierski, 2000).

Project Design Introductions:
Given the vast scope of the problem, three separate approaches were taken to solve this issue.
Each approach looked at the issue a different way, leveraging different technologies to utilize
flare gas in the most effective way.

Project #1
On-Site Flare Gas Utilization Generating Electricity and Flue Gas for EOR
1.0 Introduction:
The purpose of this project design is to provide oil production groups with an on site system that
will utilize flare gas in an enhanced oil recovery process. Ideally, this system will effectively
eliminate flaring and provide an environmentally beneficial and economically profitable use for
the natural gas that is currently being flared. The design we have come up with is intentioned to
capture almost all flare gas at the wellhead, compress it, store it, then burn it to both generate
electricity and flue gas. The flue gas we produce will then be used as a reinjection agent which
will allow oil companies to better increase the yield of their oil field. We believe that leveraging
existing and proven technologies in the process we have designed will both be technologically
feasible and economically beneficial.
Mission Statement: Our goal is to provide oil production groups with an on site system that will
utilize flare gas in an enhanced oil recovery process. This system will effectively eliminate
flaring and provide an environmentally beneficial and economically profitable use for the
natural gas that is currently being flared.

2.0 Project Background and Analysis
2.1 Enhanced oil recovery (EOR):
The avenue our technology will create a niche in the market is through addressing the growing
demand by the oil industry to increase the yield of producing oil fields. Traditionally, oil
production follows three stages; primary, secondary, and tertiary. Primary recovery is the first
stage where oil production is simply a by product of drilling into the well formation and allowing
the natural porosity of the rock create the flow of oil into the well pipe. In the case of North
American onshore production this stage has very frequently entailed hydraulic fracturing, where
the tight shale rock is made more porous by creating subsurface perforations and expanding them
by injecting high pressure hydraulic fluid. This first stage typically recovers 10-25% of the total
recoverable oil in a formation. Secondary recovery is the process of injecting some fluid,
typically water, nitrogen gas or methane into the well to increase subsurface pressure which in
turn increases porosity and flow rate. In the case of many onshore and offshore wells,
particularly in North America, natural gas is re-injected into wells which are focused on oil to
increase their yield. Secondary recovery typically increases yield by 10-20%. Finally, Tertiary
recovery is the process of injecting high purity, temperature and pressure CO2 into the well. This
gas then becomes miscible with the oil below the surface and greatly increases recoverable
amount of the well by almost 25%. Our project is a combination of secondary and tertiary
recovery. Because flue gas is not >95% CO2, this cannot be considered tertiary as flue gas will

not be fully miscible with oil. However, given the relatively high concentration of CO2 that we
will be producing, our process could have some of the similar effects as tertiary recovery. And
given the very high concentration of N2 and increased sub-surface pressure, our project has many
of the similar characteristics of secondary recovery.
2.2 Flue Gas Injection Analysis:
Flue gas is the purified exhaust of fuel combustion, with ~ 85% of N2 and ~15% CO2. Flue gas
is selected considering the limited CO2 availability in the area and the energy and cost advantage
of avoiding large scale gas separation. Compared to pure CO2 injection, which has a typical yield
of 2 barrels of oil recovered per ton of carbon dioxide injected, flue gas injection is about half
efficient in oil return by volume injection. However, considering the low concentration of CO2
content in the flue gas, flue gas is much more efficient in terms of the amount of of CO2
consumed. In addition, flue gas is a lower cost option compared to pure CO2 injection. The high
cost and inaccessibility of high quality of CO2 has been a limiting factor of tertiary oil recovery.
Using the readily available flue gas from onsite combustion would vastly decrease the cost of
purification and separation of CO2 from Nitrogen. Thus although the injection of larger amount
of flue gas is more energy intensive, less energy will be required for the gas preparation
compared to pure carbon dioxide injection. A study in United Kingdom shows that flue gas has a
oil return efficiency between pure carbon dioxide and nitrogen injection, with approximately
50% recovery rate compared to CO2 injection (Srivastave et al., 1999). This result is illustrated in
the graphs below:
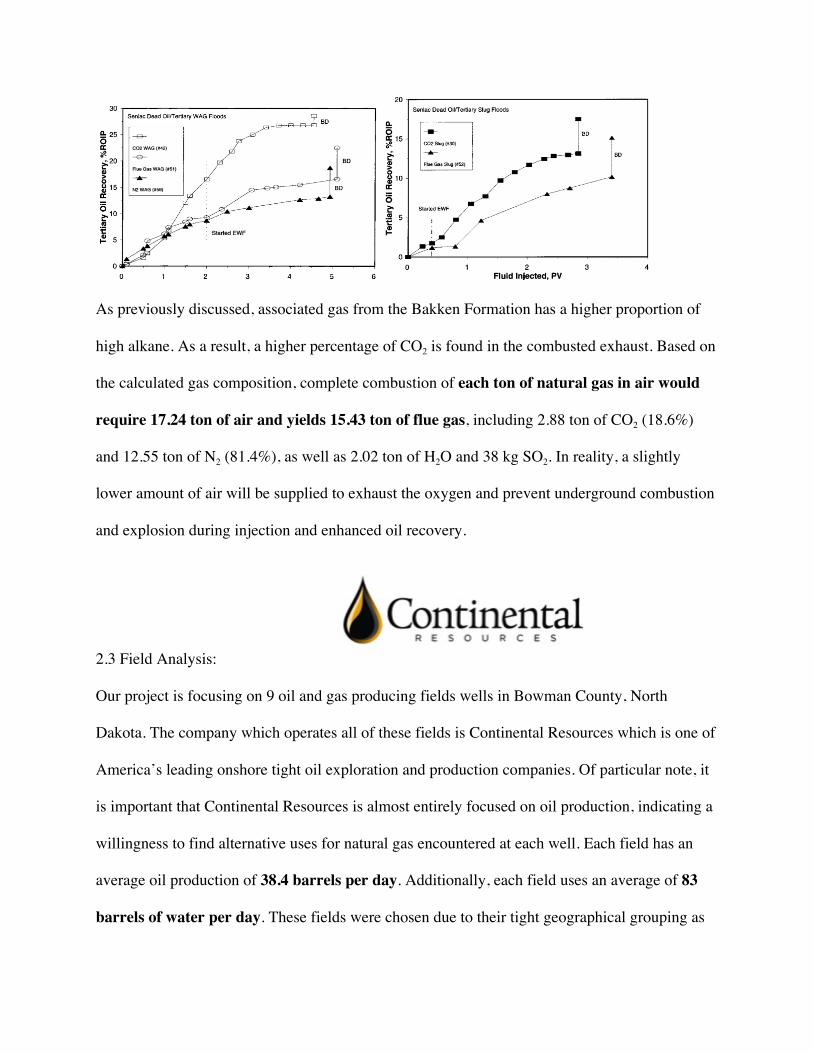
As previously discussed, associated gas from the Bakken Formation has a higher proportion of
high alkane. As a result, a higher percentage of CO2 is found in the combusted exhaust. Based on
the calculated gas composition, complete combustion of each ton of natural gas in air would
require 17.24 ton of air and yields 15.43 ton of flue gas, including 2.88 ton of CO2 (18.6%)
and 12.55 ton of N2 (81.4%), as well as 2.02 ton of H2O and 38 kg SO2. In reality, a slightly
lower amount of air will be supplied to exhaust the oxygen and prevent underground combustion
and explosion during injection and enhanced oil recovery.
2.3 Field Analysis:
Our project is focusing on 9 oil and gas producing fields wells in Bowman County, North
Dakota. The company which operates all of these fields is Continental Resources which is one of
America’s leading onshore tight oil exploration and production companies. Of particular note, it
is important that Continental Resources is almost entirely focused on oil production, indicating a
willingness to find alternative uses for natural gas encountered at each well. Each field has an
average oil production of 38.4 barrels per day. Additionally, each field uses an average of 83
barrels of water per day. These fields were chosen due to their tight geographical grouping as

well as their consistent and large volumes of gas flared, 209 thousand standard cubic feet per
day. Because these fields are mainly focused on oil production, most gas that is found during the
production process is flared. Furthermore, their production of gas consistently exceeds their
amount flared per day, indicating the potential to replace old technologies in exchange for our,
potentially more efficient ones. It is important to note that many of these fields produce natural
gas and sell it to existing pipeline infrastructure. But because pipeline infrastructure is limited in
this region, the only practical means of dealing with the gas is to flare it. Data on our field is in
our attached spreadsheet, Onsite Flare Utilization.
3.0 Technological process analysis:
3.1 Process Overview:
This project will be operated fully on site to avoid transportation cost. Gas collectors will be used
to replace the flaring towers. The technical process is illustrated in the graph above. The

originally flared gas will be capped, compressed and contained on the sizable scale. On site
storage will be used to overcome the intermittency of flaring. Once sizable amount of flare gas is
stored, it will be delivered to the turbine unit for combustion and electricity generation. Here the
chemical energy will be convert to electricity and the flue gas exhaust will be harvested and
cooled to separate water. Finally, the waste gas is recompressed on site and injected underground
to enhance oil field pressure and viscosity, thus increase the oil recovery. The following sections
will provide a detailed look at the parameters and the techniques we will be using through the
EOR processes.
3.2 Gas Capture and Compression:
Based on the daily production index provided by North Dakota Oil and Gas Division, the nine
sites selected for the case flares approximately 209 MCF on average per day. However, flaring
events are highly intermittent and the emission is concentrated on a few hour window. Study in
2004 conducted by Shell Inc. found out that flow rate of the gas coming out of the system varies
between 1500 and 7000 pounds per hour (Shell, 2004). The majority of time the flow rate ranges
between 1500 - 2500 pounds per hour with spontaneous minute-long spikes peaking at 7000
pounds per hour. Based on average flow rate of 3000 pounds per hour, each well flares
approximately 4 hours per day.

To capture the majority of flare gas and compress it to a sizable volume, the Ariel Corp 6 Throw
JGA/6 Compressor has rated power will be used for the project. The compressor had a rated
power of 840 boiler horsepower (BHP), which sufficiently accommodates the maximum flow
rate of 7000 pounds (660 BHP). The natural gas will be compressed to 2.5MPa and delivered to
storage. An industrial standard flowmeter will be installed to monitor the gas flow prior to
compression. In events or emergence, or extreme large flow, the excessive amount natural gas
will be released to reduce pressure to diverted to the compressor for re-compressing the exhaust
gas if not combustion and injection take places.
3.3 Gas Storage:
Compressed flare gas will now come to the storage tanks at a pressure of 25 MPa. The gas will
be stored in a 12 tube container set manufactured by Yukun Machinery Equipment Co., Ltd. in
China. The tube sets are 40 feet in length and weighs 3.8 ton without loading. The container set
will be capable of storing 294,000 standard cubic feet (scf) of flare gas at a pressure of 25 MPa.
This helps to solve the intermittency problem of flare gas. Using the accompanied semi-trailer,
the tank can be delivered to the turbine for combustion and electricity generation.

3.4 Gas Combustion:
For the combustion process we have chosen to use the FlexTurbine M250. The advantages of
using this turbine system are two fold. First, the technology can operate at a high level of
efficiency even using a dirty fuel source, such as flare gas. At a rate of 2,483 scf/hour, the
FlexTurbine will generate 250 kw/hour and will produce 40,000 scf/hour of flue gas and 4,000
scf of hot water steam. Operating at an efficiency of 30% (13,341 kj/kwh nominal heating value),
provides efficient reaction given cost. The second great advantage of this technology is the
company is very willing to lease us the technology at a reasonable rate. While we have not been
able to get the exact costs, the estimated annual cost of leasing such a turbine is $25,000 per
year. We are very confident that this technology will provide our customers with a significant
amount of electricity each year as well as the flue gas which we can use as a reinjection agent.
3.5 Flue Gas Reinjection:

Once the flare gas has been used to generate electricity, the product of this process will be flue
gas. Collecting that flue gas at the exhaust end of the combustion process will allow us to then
recompress the gas and inject it directly back into the well via reinjection manifolds. this high
pressure flue gas will hopefully increase the yield of the oil field significantly. Gas desulfurized
will be compressed and pressurized to 8.17 MPa to meet the flue gas enhanced oil recovery
standard. This can be done using ArielCorp 4 Throw JGA/4 with rated power of 540 horsepower
(the same JFA/6 for flare gas compression will suffice as well).
4.0 Environmental Impact Analysis
For each of the nine Continental Resources wells used in this analysis, there are 209,000 cubic
feet of gas flared per day. This translates into 76,285,000 cubic feet of natural gas per year, or
approximately 2268 tons of natural gas per year. Currently these gases are being combusted
which emits a number of greenhouse gas emissions. As stated in the chemistry analysis, for each
ton of this gas that is combusted in the presence of air, 2.876 tons of CO2, 12.55 tons of N2,
2.202 tons of H2O, and 38kg of SO2 are produced. Of particular interest to environmental
impact analysis are the emissions of CO2 and SO2. By capturing and recycling the natural gas

for use in flue gas, approximately 6,490 tons of CO2 and 86.18 tons of SO2 would be no longer
be emitted into the atmosphere each year.
An equivalent amount of greenhouse gas emissions highlighted above would likely be saved in
addition to the emissions saved by flare gas capture. This is based on the assumption that the
flare gas used in on site power generation is replacing another source of power generation that
uses natural gas and produces comparable emissions.
In addition to gaseous emissions, this system also has the potential to save water resources
surrounding the area of well sites. The process of flue gas enhanced oil recovery would be
replacing secondary and tertiary enhanced oil recovery techniques which utilize water and
carbon dioxide, respectively. On average 945,000 gallons of water are used per well site per
year. With the elimination of this demand for water there would also be a complete reduction in
all emissions related to processing and transportation of that water.
Data used from North Dakota Industrial Commission
5.0 Business Model and Plan:
Business Structure:
To deploy our technology in a manner which will meet commercial success and bring value to
our founders, we have found that a lease and release model would be best suited. Thus, the broad
terms of any contract reached with an oil firm would be an Owner’s Engineering Agreement,
which would guarantee total control of our intellectual property. Furthermore, to maintain tax
efficiency and lure investors the company’s structure would be that of an Master Limited
Partnership. The benefits of a Master Limited Partnership is that it practically makes any
shareholder in the company a Partner in the business who is entitled to any cash distributions the

company makes. In addition to that, Shareholders do not need to pay capital gains tax on
distributions until the total distributions collected reaches the par value of equity, allowing for
the shareholder to defer tax liabilities. This structure, in addition to the lease and release model
would enable our business to start-up with little paid-in capital as well as grow significantly
quickly without much more capital. However, given that we are forgoing equity in the majority
of our Property Plant and Equipment, we lose a significant amount of the upside. But given the
initial high-capital requirements and our shareholders risk profile, we believe the lease and
release model to be the best suited.
Deployment Plan:
Our business plan moving forward is comprised of 3 stages and will take an estimated 2 years.
Stage 1 (6 months): From inception, we will need 6 months to do further research and
development on our technology. Specifically, we will need to secure our procurement
efforts with specific vendors who offer the most attractive terms and technology. While
we have done a fair deal of analysis, more will need to be done. Additionally, in this first
stage we will involve field testing, where we will conduct small scale tests on the
technologies we choose to ensure they could withstand the parameters of our process
design.
Stage 2 (1 Year): This stage will largely comprise of ensuring that our company has the
necessary federal and state licenses to operate safely and freely. This will require a deal
of litigation to ensure we meet all the requirements we must as well as have done so in
the most cost efficient manner. Additionally, at this stage we plan on approaching either a
large domestic oilfield services or parts manufacturing company to partner with. We
believe partnering with a large well established organization will add legitimacy to our

efforts as well as ensure that we have the ability to approach larger companies with our
technology. Some of these companies include National Oilwell Varco, Schlumberger,
Halliburton or Weatherford.
Stage 3 (6 Months): In this final stage we plan to do our first commercial demonstration
and then fully go to market with our technology. To do the demonstration application,
this may require approaching an independent exploration and production company and
offering them exclusive terms for a given number of the first units we produce.
Using this business structure and roll out plan, we believe that our technology has the best
chances of being commercially successful and will bring significant value to our founders.
5.1 Economic Analysis
An analysis of the financials of our technology reveals an attractive and economically viable
venture. Below is a table with the investment and cost details.
Building/Installation Costs $20,000.00
Compressor Cost $85,000.00
Storage Tank $80,000.00
Total Investment $185,000.00
Annual Turbine Lease Cost $75,000.00
Yearly Operating and maintenance $35,000.00
% of Equity 20%

Cost of Capital $58,403.89
Yearly Costs $168,403.89
Generator Capacity (kW) 250
Efficiency 30%
Uptime (Hours) 24
Total Electricity Production per Generator (kWh) 2,190,000.00
Total Gas Usage(mscf) 24,908.72
# of Generators needed/site 3
% of Electricity Used by Our Equipment 5%
Total Electricity Equipt. Consumes (kWh) 328,500.00
Total Electricity Sold to user (kWh) 6,241,500.00
Price of Electricity (kWh) $0.034
Total Electricity Revenue $212,211.00
Total Flue Gas Reinjected (mscf) 385,088.89
Increased Yield of Field (bbls/year) 19,607.38
Marginal Cost of Service per barrel $10.82

EBITDA $102,211.00
IRR 57%
For number verifications see Attached Onsite Flare Spreadsheet
Because we are only buying few assets, the initial capital we need is relatively low. As displayed
in the figures above, the equity portion we plan on committing is 20%, thus leaving the rest of
our financing to traditional bank means. Assuming a 4% rate and a 4 year term, this gives us an
attractive cost of capital for the short term following our deployment. If contracts are unable to
be extended past 4 years, or duration of the loan, our IRR is still above 20%. However, it is
important to note that the effective marginal cost per barrel of our system is above $10. In
calculating that we assumed that each tones of flue gas injected will produce 1 barrel of oil. For
further explanation see the Flue Gas section above.
6.0 Conclusion:
Our project provides a unique way for domestic oil and gas producing companies to utilize flare
gas in an economically and environmentally beneficial manner. Using existing technologies, our
project has the high potential to be technically feasible and economically viable. Given the
higher costs producers are already paying for electricity on site using diesel, our project
definitely would provide value to the oil companies. Additionally, the flue gas we can re-inject
for the oil producer will likely increase the total yield of the oil field, which obviously would
provide value.
However, given the relatively high cost of our system and the potential for little yield increase,
our technology would not be very practical. While it would be a means to generate electricity on
site and use flare gas, the reinjection component adds significant risk of gas fouling which would
yield the project worthless. Thus, at current oil prices below $60 a barrel, our project would not

make much sense as it adds a $10 marginal cost per barrel. However, if oil prices begin to rise
above their historical low, to say $75, then our technology would be practical and would add
value.

Project #2
Using Flare Gas to Power FedEx Dylan Brown| Isaac Fraynd | Ryder Quigley
1.0 Introduction
In this section of the report, we explore the last pathway to mitigate the flaring of natural gas. By
creating a company focused on utilizing the natural gas for the transport of FedEx vehicles, an
economically viable investment opportunity became apparent. The sections below will explore
the following aspects in detail: (1) Company Structure and Partners, (2) Location and Sites, (3)
Equipment Required, (4) Real Estate, (5) Environmental Analysis, (6) Financials.
2.0 Our Team
From the beginning, our Team’s mission was to mitigate the harmful effects of natural gas
flaring. With that in mind, we sought to combine the most efficient technologies in order to
combat this problem head on. Settling on the unique solution to power FedEx’s fleet vehicles
with natural gas came through partnerships with other companies, FedEx’s demand for fuel, their
national presence (and proximity to North Dakota), and need for physical locations. By
connecting natural gas capture, compression, transport, and a distribution center, our Team has
created a way to mitigate the flaring of natural gas, reduce dependence on gasoline for transport,
improved FedEx’s green image, all while turning an investment profit. In the same way as the
Enhanced Oil Recovery team (EOR), our structure is best served by a Master Limited
Partnership (MLP). The details and benefits of the MLP structure are outlined in EOR Section
5.0.

2.1 Partnerships
Our Team is pleased to be working with some of the top companies in the world. FedEx, an
international delivery service, has a unique need for fuel and a desire to be green. Their reliance
on physical distribution centers across the country makes them a prime candidate for this
opportunity. Wrightspeed, an electric powertrain manufacturer, allows the natural gas to be used
for transport. It is important to note that although FedEx is the company of choice for this report,
there are many other companies that could be potential users of this structure.
2.1.1 FedEx
FedEx, an American global courier delivery service, is considered a world leader. Covering over
220 countries and connecting more than 99% of the world’s GDP, FedEx combines technology,
transportation, information, and ideas in order to deliver the world’s packages. They operate a
fleet of approximately 47,500 motorized vehicles (FedEx).
From a sustainability point of view, FedEx is considered an innovator. From their mission
statement, “We constantly strive to do more with less, reducing our environmental footprint even
as we deepen the ways we connect the global economy.” In addition to initiatives such as
EarthSmart, FedEx has been searching for alternatives fuels such as CNG, LNG, and electric
vehicles. In 2013, Chairman and CEO Federick Smith noted that over the next 10 years, he
expects between 5%-30% of US trucking to be fueled by CNG or LNG (Wall Street Journal).
With FedEx already testing multiple CNG and alternative fuel trucks in the field, they are
perfectly positioned to take advantage of our unique opportunity. They have partnered with

WrightSpeed, an electric drive train based on CNG, and deployed many pure CNG trucks. On
average, CNG trucks cost $50 to fill up each day compared to the $100 required for diesel
(BBC).
FedEx Ground is the core of the corporations’ business model. Over the most recent fiscal year,
FedEx Ground and its subsidiary, Fedex SmartPost, delivered a rough average of 6.7 million
packages on a daily basis (FedEx). Consequently, the company accounts for an elaborate
distribution supply chain, which ensures effective service for every client across the country.
2.1.2 Wrightspeed
Wrightspeed, an electric vehicle powertrain company, was founded by Tesla co-founder Ian
Wright and is headquartered in San Jose, California. Their main product, the Wrightspeed Route,
is a plug and play repower kit for commercial vehicles (Wrightspeed). It uses an electric drive
powertrain in combination with a power station for efficiency and range. The kit includes a
200kW inverter, electric motors, gear box with clutch-less shifting, battery pack, battery

management system, and LCD operation interface (Wrightspeed). Their primary client is FedEx,
with the company recently purchasing 25 electric powertrains after testing two initially (BBC).
Their drivetrain is primarily composed of a small gas turbine. This micro turbine can burn diesel,
biofuel, or compressed natural gas in order to spin a generator. This generator creates electricity,
which is used to charge the batteries. These batteries run the electric motors, which are mounted
to four drive wheels. The Route system employs geared-traction drive, comprising a two-speed
gearbox with clutch-less shifting that delivers 125 to 250 continuous horsepower and 18,000
pound-feet of total axle torque (Wrightspeed).
3.0 North Dakota
North Dakota, as previously noted, is a state where a majority of the US natural gas flaring takes
place. It is important to note that flaring does not occur purely out of necessity (although it does
occasionally to maintain flow rates). Natural gas flaring occurs primarily due to lack of
infrastructure. That is to say, the transportation pipelines and gas treatment facilities are not
available all over the state. The map below shows the network of wells and gas treatment
facilities across the state (NDIC).
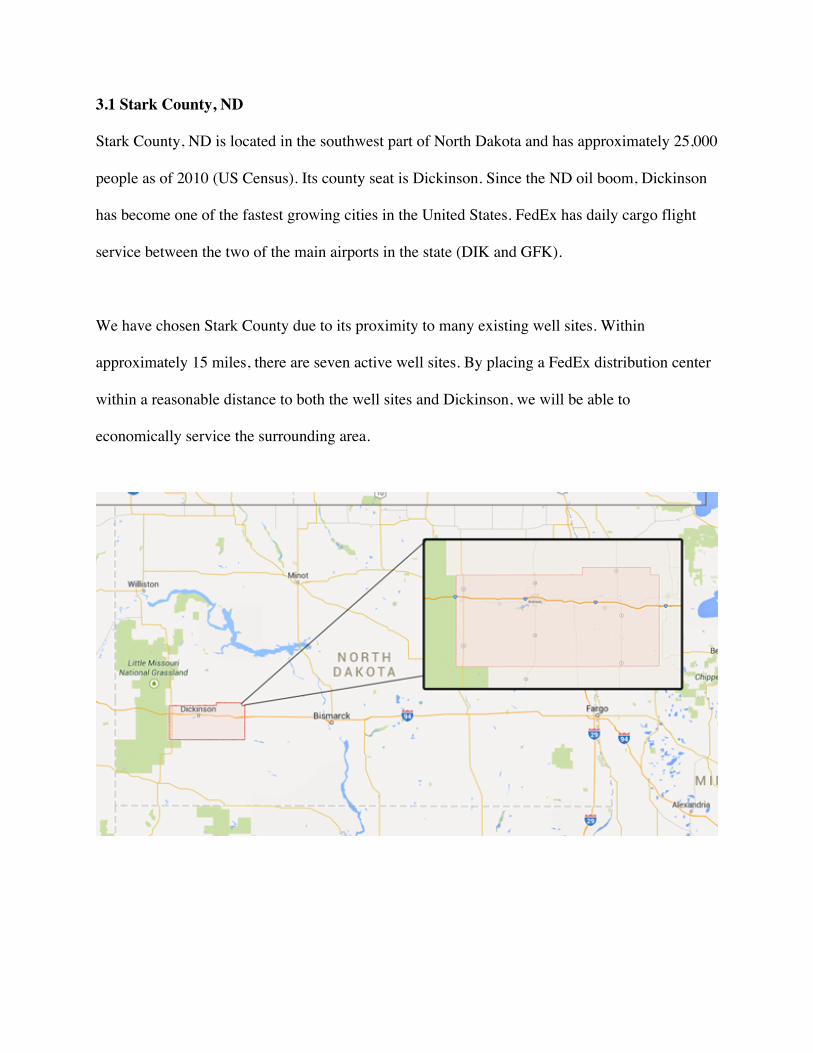
3.1 Stark County, ND
Stark County, ND is located in the southwest part of North Dakota and has approximately 25,000
people as of 2010 (US Census). Its county seat is Dickinson. Since the ND oil boom, Dickinson
has become one of the fastest growing cities in the United States. FedEx has daily cargo flight
service between the two of the main airports in the state (DIK and GFK).
We have chosen Stark County due to its proximity to many existing well sites. Within
approximately 15 miles, there are seven active well sites. By placing a FedEx distribution center
within a reasonable distance to both the well sites and Dickinson, we will be able to
economically service the surrounding area.

3.2 Oil Well Locations
All of the wells utilized for this analysis are located in Stark County, North Dakota. According to
the North Dakota Industrial Commission, Oil and Gas Division, there are 11 active well sites, 7
of which are currently producing and flaring (NDIC).
NDIC File No: 9830 API No: 33-089-00285-00-00 County: STARK CTB No: 109830 Well Type: OG Well Status: A Status Date: 2/23/2006 Wellbore type: VERTICAL Location: SWNE 33-139-96 Footages: 2630 FNL 1500 FEL Latitude: 46.810883 Longitude: -102.795247
NDIC File No: 14141 API No: 33-089-00474-00-00 County: STARK CTB No: 414141 Well Type: OG Well Status: A Status Date: 11/11/2003 Wellbore type: DIRECTIONAL Location: NESE 18-139-96 Footages: 1425 FSL 1050 FEL Latitude: 46.850925 Longitude: -102.835700
NDIC File No: 15043 API No: 33-089-00556-00-00 County: STARK CTB No: 115043 Well Type: OG Well Status: A Status Date: 1/31/2002 Wellbore type: HORIZONTAL Location: SWSW 19-138-99 Footages: 500 FSL 500 FWL Latitude: 46.746994 Longitude: -103.228792
NDIC File No: 15116 API No: 33-089-00558-00-00 County: STARK CTB No: 115116 Well Type: OG Well Status: A Status Date: 6/13/2001 Wellbore type: HORIZONTAL Location: SWSW 7-138-99 Footages: 450 FSL 145 FWL Latitude: 46.776049 Longitude: -103.230204

NDIC File No: 15283 API No: 33-089-00561-00-00 County: STARK CTB No: 115283 Well Type: OG Well Status: A Status Date: 7/4/2002 Wellbore type: HORIZONTAL Location: SESW 6-138-99 Footages: 180 FSL 1440 FWL Latitude: 46.789722 Longitude: -103.224845
NDIC File No: 15305 API No: 33-089-00562-00-00 County: STARK CTB No: 115305 Well Type: OG Well Status: IA Status Date: 7/20/2002 Wellbore type: HORIZONTAL Location: NWSW 18-138-99 Footages: 1890 FSL 145 FWL Latitude: 46.765471 Longitude: -103.230348
NDIC File No: 15609 API No: 33-089-00569-00-00 County: STARK CTB No: 115609 Well Type: OG Well Status: A Status Date: 10/28/2004 Wellbore type: HORIZONTAL Location: SWSW 5-140-97 Footages: 415 FSL 160 FWL Latitude: 46.964406 Longitude: -102.956574
3.2.1 Oil Well Data
The data for the flaring amounts over the last five years of each well site were averaged in order
to come up with approximately 10 MCF per site per day (NDIC). Although there are currently
only seven sites actively flaring, we have extrapolated the data to allow for 10 sites. This will
produce approximately 100 MCF per day, enough to power approximately 35 FedEx vehicles.
See gas demand per vehicle and calculations in section 7.0 Economics.
4.0 Site Equipment
In order to be able to properly utilize the flare gas, a certain amount of infrastructure must be
established. The gas must first be captured, then compressed, stored, and transported. It must
then be stored again before being used to power the fleet vehicles. A compressor and storage
tank is required for every well site, trucks are needed for transport, and a final storage tank at the
distribution center is necessary.

4.1 Compressor
Similar to the EOR team, we will utilize the ArielCorp Throw JGA/6 at each of our ten sites.
Although we do not have the same flow rate and capacity requirements as the EOR team (our
flow rates and gas capture amounts are significantly less), we plan to utilize this larger
compressor in order to account for varying flow rates. The natural gas will be compressed to
2.5MPa and stored in onsite storage tanks.
4.2 Storage Tanks
Industrial sized storage tanks (~10 MCF) will be utilized to store the newly compressed gas. The
project requires a total of 13 storage tanks. This includes a storage tank for every site (10), one
for every delivery truck (2), as well as a larger (~200 MCF) at the distribution center (1).
4.3 Transport
After purchasing the trucks, we will need to hire drivers in order to transport the gas. Each driver
will make one trip per day to five sites. This means that we will need to hire two (2) drivers in
order to accommodate the ten well sites. On average, each site is approximately 15 miles from
the distribution center, with clusters of sites. The daily trip for each driver will be ~90 miles.
5.0 Distribution Center
FedEx Ground accounts for network of more than 500 distribution hubs and local pickup-and-
delivery terminals located throughout the United States and Canada (FedEx). Accordingly, real
estate is a large consideration for FedEx, with substantial exposure to rental expenses in addition
to the firm’s sensitivity to fuel expense. Thus, our investment thesis for the distribution center is
advantageous to FedEx by limiting both their risk to rental and fuel expenses.
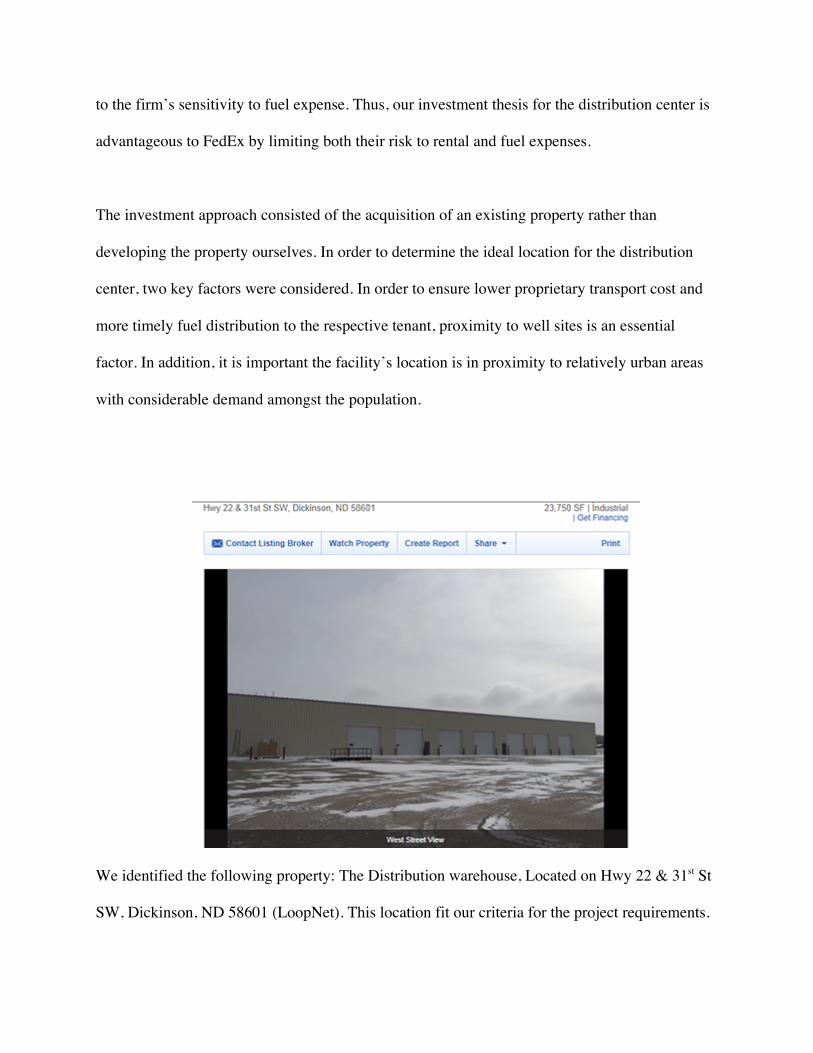
The investment approach consisted of the acquisition of an existing property rather than
developing the property ourselves. In order to determine the ideal location for the distribution
center, two key factors were considered. In order to ensure lower proprietary transport cost and
more timely fuel distribution to the respective tenant, proximity to well sites is an essential
factor. In addition, it is important the facility’s location is in proximity to relatively urban areas
with considerable demand amongst the population.
We identified the following property: The Distribution warehouse, Located on Hwy 22 & 31st St
SW, Dickinson, ND 58601 (LoopNet). This location fit our criteria for the project requirements.

Located at an average distance of 15 miles away from our well sites, travel costs can be
minimized in addition to providing efficient delivery service to FedEx. The property accounts for
6 acres of land, and a warehouse size of 23,750 square feet. Price at $20 dollars on a square foot
basis, the property was valued at a substantial discount relative to its respective market
(LoopNet). In addition to the investing in acquisition of the current property, 25% of the
property value in renovation expenses was factored into the initial investment, in order to satisfy
FedEx’s needs. Overall, the projected upfront investment for the property came out to be
$593,750.
After discussing potential rental rates with knowledgeable commercial and industrial property
brokers in the surrounding area (Everett Real Estate Inc.) we concluded that the optimal range
for annualized rents ranged from $15-$25 per square foot. After factoring in a rent premium,
consequent of the free fuel that will be provided, we projected an efficient rental rate of $17
dollar a square foot for a 15 year contract.
6.0 Environmental Analysis
Across the 10 well sites used for this model, approximately 36.5 MMCF would be captured over
a year. This equates to 1,080 metric tons of natural gas repurposed instead of flared. From the
chemistry analysis done for the EOR team, each ton of gas combusted in the presence of air
produces 2.876 tons of CO2, 12.55 tons of N2, 2.202 tons of H2O, and 38kg of SO2. This means
that over 3,105 tons of CO2 would be avoided. CO2 equivalents are below (EPA):

7.0 Economics
Property Acquisition & Renovation Costs $593,750.00
Compressor Costs (10 units) $850,000.00
Storage Tank Cost (13 units) $140,000.00
Total Truck Cost (2 units) $160,000.00
Total Investment Costs $1,743,750.00
Yearly Operating and Maintenance Costs $74,727.27
Yearly Fuel Costs $30,660.00
Equity Share 35%

Loan Rate 8%
Loan Term 10 years
Yearly Minimum Debt Payment $216,183.00
Yearly Variable Costs $301,343.00
Contract Period 15 Years
Daily Gas Demand per Vehicle (MSCF) 2,533.40
# of Vehicles at Facility 35
Average Gas Flared per well site (MSCF) 9
Well Sites Utilized 10
Size of Distribution Center (Sq. Ft.) 23,750
Annual Rent (Sq. Ft.) $17.00
Annual Rent Revenue $403,750.00
Depreciation Period 20 Years
Effective Tax Rate 28%
EBITDA $298,362.73
IRR 13.27%

8.0 Conclusion
By combining capture, compression, transport, and rent, we were able to create a midstream gas
company infrastructure. This allowed for an economically feasible business plan to combat
natural gas flaring in Stark County, North Dakota. Roughly $2.02MM of investment is required
to fund this project. These funds will be obtained in the private markets. On a 15-year investment
horizon projections show the potential of ~13% return for investors. In addition, the project is
expected to breakeven after 7 years.
There are also abundant benefits for the surrounding area that will result from the project. If the
gas is utilized rather than flaring, the environmental and health effects are mitigated. In addition,
the use of flare gas reduces our dependence on gasoline for transport. The project can also
contribute to the long-term job creation in the community, potentially contributing to the
urbanization of the area as well. An added benefit may come in the form of tax credits, due to
increased regulation on flaring. Overall, the environmental and economic benefits of this
project make it an attractive investment opportunity.

Project #3
Utilizing Methane-Oxidizing Bacteria to Produce Animal Feed
Paul Burgess | Max Orenstein | Ilhan Savut
1.0 Introduction
This section of the report explores the economic feasibility and environmental impact of
industrially cultivating aerobic methanotrophic bacteria on natural gas to create an animal feed
supplement. The environmental impact of both mitigating carbon dioxide emissions by growing
the bacteria and the benefits of replacing conventional animal feeds with a bacterial meal are
discussed in length. Finally, we present an in-depth economic analysis of a centralized bioreactor
and processing factory in the Bakken oil fields in North Dakota that uses trucks to transport
compressed natural gas from well heads.
2.0 A Biological Solution
Methane (CH4) is the simplest alkane and its most oxidized form in the presence of oxygen is
carbon dioxide (CO2). Combustion of methane gas during flaring produces carbon dioxide, but
the energy stored in the organic bonds of this hydrocarbon is lost in the form of heat (Energy-

Harvesting Pathways). However, there are certain prokaryotic microorganisms, known as
methylotrophs, which are capable of growing on carbon compounds that lack carbon-carbon
bonds (Madigan). Methanotrophs are a specific subgroup of methylotrophs that can strictly
oxidize methane and use it as their energy source in catabolic1 processes or as their carbon source
in anabolic2 processes.
This section explores the basic pathways for methane oxidation and the type of aerobic bacteria
that is best for methane consumption. Additionally, this section looks at four different products
that can be made using methanotrophic bacteria and outlines the benefits and limitations of each.
2.1 Types of Methane Oxidation
In terms of the carbon cycle, there are two main sinks of methane: aerobic oxidation by
methanotrophs, as introduced above, and anaerobic oxidation by Archaea. Nonetheless, growing
the latter group poses the inherent problem of maintaining an anoxic environment under
atmospheric conditions, which is both costly and difficult. In addition, unlike aerobic forms, the
metabolism of anaerobic methane oxidation has not been extensively researched and is not well
understood (Chistoserdova). For example, a pure culture of an anaerobic methane-oxidizer had
not been isolated by 2013 and extensive research of literature did not yield any evidence that
such undertaking has been successful since then (Vigneron). Therefore, the focus of this report is
aerobic methanotrophs.
Aerobic methanotrophs are further classified into numerous subgroups based on structural and
biochemical properties but tend to have the enzyme methane monooxygenase (MMO) in
common, albeit in different forms. For the purposes of this report, Methylococcus capsulatus
1 Catabolism: breakdown of organic compounds to release energy 2 Anabolism: synthesis of complex molecules for cellular use (for example, ATP)

was determined to be the most appropriate species for three reasons (Bothe). First, it is a species
that is genetically and biochemically understood. Second, it belongs to the gamma-proteobacteria
class of bacteria, which show robust and efficient growth in the presence of high methane
concentration. Third, it is a Type X gamma-proteobacteria, which have both types of the
methane monooxygenase enzyme (pMMO and sMMO), making them versatile and capable of
growing in a variety of conditions.
Figure 2.1.1: Types of Methane Oxidation
Despite methanotrophic versatility, it is unrealistic to expect a completely sterile growth
environment at an industrial scale. Thus, further research on the topic suggested that the growth
media would have to consist of a “bacterial consortium” (Bothe). M. capsulatus exhibited higher
growth rates in the presence of non-toxic species from two other genera of bacteria, namely
Bacilli and Ralstonia. The impact of these symbionts was twofold. To begin with, they removed
longer hydrocarbons found in flare gas (i.e. ethane, propane, and butane) and protein waste,
which are toxic to M. capsulatus at high concentrations (Bothe). Moreover, the removal of these
hydrocarbons prevented invading bacteria from contaminating the culture, since the medium was

free of organic carbon that is essential for their growth. The specific growth and treatment
conditions are outlined in Section 3.
2.2 Alternative Products: Why Animal Feed?
Three other alternatives were examined before being deemed impractical and abandoned in favor
of animal feed. These are discussed below.
2.2.1 Formaldehyde production
Formaldehyde is an intermediary of the RuMP and serine cycles employed by methane oxidizing
gamma and alpha-proteobacteria (Madigan). Formaldehyde is a chemical product of
considerable value and has a large market due to its numerous uses. Nonetheless, it would be
hard to isolate because it is an intermediary and because of its location (formaldehyde is not
excreted but instead remains in the cell). This would greatly limit its production.
2.2.2 Biofuel
The dried biomass of the bacteria could be made into pellets and used as a fuel source. Yet, this
would require the active dehydration of the bacteria cultures (passive dehydration is insufficient
for the pellets to be combusted). This process is theoretically limited since the energy stored in
the biomass cannot offset the energy required for dehydration.
2.2.3 Bioplastic production
Alpha-proteobacteria can produce polyhydroxybutyrate (PHB), a high quality polymer that can
be made into plastic products. However, currently PHB cannot be produced at appreciable levels
and has a very narrow range of conditions under which it can be properly isolated. This option
should be pursued in the future, when appropriate catalysts become available, since theoretically
it can be cheaper than oil-based plastics and is also biodegradable.

3.0 Methods
The conditions, infrastructure, and processes necessary for growing Methylococcus Capsulatus
and the heterotrophic strains are discussed below as well as the processes of turning the biomass
into a bacterial meal.
3.1 Growth Conditions
Despite Methylococcus Capsulatus’ robust consumption of methane, it cannot survive alone in a
pure natural gas environment due to a number of toxic contaminants (Overland). Thus three
additional non-toxic species from the bacteria genera Bacilli and Ralstonia are employed to
consume the longer hydrocarbon contaminants (Bothe). The four strains of bacteria are grown in
a fermenter with different percentages: Methylococcus Capsulatus makes up the majority of the
culture at 80%, while the other three are DB3 19%, DB4 0.3%, DB5 0.5%, respectively (Bothe).
The heterotrophic bacteria are not only important for eliminating natural gas contaminants and
reducing the solution’s toxicity, but their presence is also quite significant at 20%. These strains
will ultimately be filtered out during the production of animal feed.
The bacteria are first grown in a loop fermenter where natural gas is added in addition to
ammonia, oxygen, and a mineral solution (Overland). By nature of the fermenter, the methane
from the natural gas has a long residence time in order to achieve maximum consumption.
Equation 3.1 shows the chemical equation with inputs and outputs for the production of biomass
(UniBio):
CH4 + 1.454 O2 + 0.105 NH3 →
0.520 (biomass) + 0.480 CO2 + 1.69 H2O (Eq. 3.1.1)

Because the loop fermenter allows for high methane consumption, the biomass yield is
impressive: 2 cubic meters of methane produces 1 kilogram of dry biomass (Overland). This
yield was a critical assumption in our economic analysis and a sensitivity test was explored to
observe the change in the internal rate of return due to potential uncertainty in the yield.
A significant amount of water is actually produced during this process - an important
environmental benefit when compared to the water intensive production methods of conventional
animal feed. CO2 is also produced, but in lower quantities when compared to flare gas. These
benefits are discussed in length in Section 4.
Figure 3.1.1: UniProtein® Growth and Treatment Diagram
3.2 Treatment Process
Bacteria are continuously harvested from the loop fermenter and go through a number of
treatments before it is sold as animal feed. It is first transported from the loop fermenter to a
separator where water is removed and recycled. Bacteria are then centrifuged and ultra filtered to

remove the heterotrophic stains. The bacteria are then finely blended, heat inactivated, and dried
to produce the final product (Overland).
3.3 Animal Feed Characteristics
The particles are about 200 micrometers in diameter, dust free, and can be added directly into an
animal feed mix as a dietary supplement. The bacterial meal is 71% protein, and has comparable
protein per unit weight to soybean meal and fishmeal (UniBio). Similar protein content was an
important factor for our economic analysis because by setting the price of the bacterial meal
equal to its competitors, we are assuming that the customer is getting the same quantity of
protein per dollar regardless of the type of animal meal they purchase.
Figure 3.3.1: Example UniProtein® Bacterial Feed
4.0 Environmental Analysis
This section outlines the various environmental benefits of creating animal feed from
methanotrophic bacteria. On the one hand the growth of bacteria on methane in lieu of flaring

results in a significant reduction in carbon dioxide emissions. On the other, using this green
technology to produce a comparable animal feed supplement is important not only for future
food scarcity issues, but water and land security as well. Finally, this section discusses the impact
of feeding varying quantities of the bacterial meal to different animals - the results are quite
favorable.
4.1 Emissions Comparison
Natural gas is flared because the global warming potential of methane is much higher than that of
carbon dioxide. By growing methanotrophic bacteria on surplus natural gas rather than flaring it,
the carbon dioxide emissions are greatly reduced. The following equation shows the basic
balanced chemical equation for flare gas (UniBio):
CH4 + 2 O2 → CO2 + 2H2O (Eq. 4.1.1)
one mole of methane produces one mole of carbon dioxide. In comparison, growing methane-
oxidizing bacteria on natural gas results in a 52% reduction in CO2 emissions (UniBio). The
balanced chemical equation for the growth of biomass is presented in Eq. 3.1.1. Yet the
equivalent CO2 emissions due to the transport of CNG to a centralized facility as well as the
construction and operation of the plant must be considered in a carbon offset analysis.
Nonetheless, growing the bacteria in order to create a value-added good in the form of animal
feed has important environmental consequences that are discussed in the following section.
4.2 Benefits of Feed Replacement
The environmental benefits of bacteria-based animal feed production are multiplied through the
replacement of existing feed options: soybean meal (SBM) and fishmeal (FM).
Soybean meal has been an attractive source of animal feed due to its high protein content and
digestibility. Price controls and the use of soybean as a source of biofuel has led experts to

estimate that demand for soybean will increase by 66 percent in the next five years (Clay).
However, there are numerous environmental concerns associated with soybean cultivation. To
begin with, runoff from soybean meals can potentially lead to groundwater contamination due to
high levels of agrochemical and pesticide use (Francois). The extensive land area required for
planting soybean has led to deforestation and soil erosion. Similarly, despite advances in
irrigation methods, industrial scale farming of soybean remains a water-intensive activity. Lastly,
using soybean meal as animal feed poses a threat to food security (Clay). High demand from
cattle farmers endangers the food supply in regions where it constitutes part of the human diet –
primarily Asia where it is consumed as tofu.
Fishmeal refers to fish-based products that are often fed to poultry and pigs; the rise in aqua
farming has made this an affordable and convenient option (UK Department for Environment).
Nonetheless, fishmeal has detrimental effects on the environment, similar to those of soybean
meal. Aqua farms are a source of seawater contamination due to discharge of chemicals and fish
waste of high organic content (Food and Agriculture Organization). Moreover, the building of
these aqua farms can lead to partial or complete destruction of coastal regions and the seabed. It
also disturbs aquatic ecosystems by introducing new diseases and by causing overfishing of
small ocean fish, which are fed to the farmed fish. The processing of fish into fishmeal is energy
intensive due to need for drying and grinding (Food and Agriculture Organization). Lastly, fish
cannot be stored for extensive periods of time since fish stocks are vulnerable to contamination
by food-borne bacteria like Salmonella (Food and Agriculture Organization). This makes the
supply of raw fish volatile, since populations can vary from one year to the next. Therefore,
using fishmeal to feed poultry and cattle also indirectly threatens food security since its stable
supply cannot be ensured.

Bacteria-based animal feed does not suffer from these issues, or at least not to the same extent as
fishmeal and soybean meal do. Overall, replacing these options with bacteria meal would not
only decrease flare gas emissions but also would have secondary environmental benefits.
4.2 Dietary Impacts
A number of studies have been conducted where animal feed produced from methanotrophic
bacteria has been feed to a variety of animals to observe the consequences. In particular,
percentages of conventional feed for broiler chickens, pigs, blue foxes, carnivorous minks,
Atlantic salmon, rainbow trout, and Atlantic halibut were replaced with bacterial meal. Each type
of animal had different responses to the new type of feed, some benefiting more than others. For
example, broiler chickens experienced improved amino-acid digestibility, increased lean-fat
ratio, and increased weight gain, while other animals saw reduced feed intake as they adjusted to
the new type of the feed (Overland). Other benefits include bacterial meal’s long shelf life and
the improved storage quality (odor) of the meat of animals whose diet was supplemented with
bacterial meal (Overland).
In all cases, however, the bacterial meal could not replace 100% of the conventional animal feed.
Certain percentages of each animals’ respective feed could be replaced with bacterial meal
before negative consequences such as reduced weight gain, feed intake, etc. began to occur.
Table 4.1.1 summarizes the percentages of dietary protein (soybean meal and fishmeal) that can
be replaced by bacterial meal without impairing animal growth performance (Overland):
Table 4.1.1: % Feed Replacement
Chickens (15%) Pig (41%)
Rainbow Trout (38%)* Mink (20%)*

Atlantic Halibut (13%)* Blue Fox (30%)*
Atlantic Salmon (52%)* *=Carnivorous
Nevertheless, these percentages are quite impressive, considering the low water and land
requirements of methanotrophic bacteria and the use of an otherwise wasted natural resource. It
is important to note that many of the tested animals are carnivorous, yet species such as the
Atlantic salmon could receive up to 52% of their dietary protein from a non-meat product. The
use of small quantities of bacterial meal was approved for use in animal feed in the European
Union in 1995, while no parallel regulations currently exist in the United States (UniBio).
5.0 Case Study for Economic Analysis
In order to test the economic feasibility of producing animal feed from methanotrophic bacteria,
we generated a hypothetical situation where trucks are used to transport compressed natural gas
from well heads in the Bakken oil fields in North Dakota to a centralized bioreactor and
processing plant. A number of assumptions were made to determine the internal rate of return for
the operations of such a plant, and a sensitivity analysis for a number of variables was performed
to observe the change in IRR.
Figure 5.0.1: UniProtein® Facility Diagram

5.1 Assumptions
The assumptions for the economic model are outlined in Tables 5.1.1-5.1.3:
Table 5.1.1: Field Assumptions
Average Cubic Feet of Methane Flared /year /well 3.65 million
Average Distance of Well Head from Centralized Plant (miles) 40
Number of Gas Sites 100
Percent of Methane in Natural Gas 95%
The average volume of methane flared per well per year was calculated using data from the
North Dakota Industrial Commission (NDIC Oil and Gas Server). The average distance of the
well heads from a hypothetical centralized plant was approximated using maps on the NDIC
server. The number of gas sites was set at 100 to account for the majority of well sites in the
region.
Table 5.1.2: Trucking Assumptions
Cost of One Truck (USD) 80,000
CNG Truck Capacity (cubic feet) 100,120
Cost of Diesel (USD/gallon) 2.68

Labor Cost (USD/hour) 25
MPG 15
Average Speed (MPH) 55
The price of a CNG truck was approximated based on prices of trucks with similar purpose,
while the cost of diesel comes from average price of diesel in North Dakota.
Table 5.1.3: Plant Assumptions
Cubic Feet of Methane / Kilogram Bacterial Feed 70.62
Contract period (years) 15
Annual Operation Costs (USD) 1 million
Annual O&M 100,000
Plant Cost (USD) 30 million
One very important assumption is the ratio of cubic feet of methane to 1 kilogram of bacterial
feed. This is based on the assumption presented in Section 3.1 that 2 cubic meters of the methane
produced 1 kilogram of dry biomass (Overland). The plant cost was approximated based on the
following assumption: that an 88 million dollar plant can produce a minimum of 25,000 metric
tons of feed per year (UniBio). Using our economic model, 25,000 metric tons of feed would
require about 500 well sites. Thus assuming a non-linear relationship between well sites and
plant cost (economies of scale), we predict that 100 well sites would require a 30 million dollar
plant.

Lastly the price of fishmeal and soybean meal are take to be 1689$ and 459$ per metric ton,
respectively (World Bank). Our economic model assumes that the bacterial meal is sold to
customers at the price as either fishmeal or soybean meal (two separate analyses). Since the
protein content for bacterial meal is comparable to that of fishmeal and soybean meal, we can
ensure that the customer is getting the same quantity of protein per dollar regardless of the type
of animal meal they purchase.
5.2 Sensitivity Analysis
In order to account for uncertainty in different variables and to explore variable options that
produce positive IRRs, we performed a sensitivity analysis on the internal rate of return by
altering one variable at a time. Similar procedures were performed for both soybean meal and
fishmeal prices. The same “base case” variable values were used for both types of analysis.
These values remain constant as each of the low, base, and high input values are altered for each
variable for each iteration of the sensitivity analysis, resulting in three different IRR values for
each variable. Positive IRR’s signify positive return equity over the course of the contract period.
5.2.1 Fishmeal Sensitivity Analysis
Table 5.2.1: Equity Internal Rate of Return for the Replacement of Fishmeal
Input Value Output Value
Input Variable Low Base Case High Low Base High
Number of Sites Gas Collected 20 100 500 -8.78% 10.29% 29.78%
Plant 88000000 30000000 5000000 -2.73% 10.29% 30.16%

Contract Period 11 15 27 6.05% 10.29% 13.42%
Cubic feet per kilogram 80 71 60 7.62% 10.29% 14.64%
Cost of gallon of diesel $4.50 $2.68 $2.00 10.20% 10.29% 10.33%
Figure 5.2.1: Fishmeal Sensitivity Analysis
Notable results for the fishmeal sensitivity analysis observed in Table and Figure 5.2.1 are as
follows. Changing the number gas sites from 20 to 500 results in an increase in the IRR from -
9% to 30%. Similarly, changing the construction cost of the plant from 88 million dollars to 5
million dollars increases the IRR from -3% to 31%. The contract period shifted the IRR by 7%.
Depending on the accuracy of the ratio of cubic meters of methane per kilogram of biomass,
small uncertainty (+ - 10 cubic meters per kilogram biomass) the IRR can change by 7%.
Finally, the price of diesel surprisingly had little effect on the IRR. Thus, it is quite possible to
achieve positive IRR depending on the accuracy of our assumptions and the economic model.
5.2.2 Soybean Meal Sensitivity Analysis

Table 5.2.2: Equity Internal Rate of Return for the Replacement of Soybean Meal
Input Value Output Value
Input Variable Low Output Base Case High Output Low Base High
Number of Sites Gas Collected 20 100 500 -21.79% -10.96% -3.59%
Contract Period 11 15 27 -19.54% -10.96% -1.84%
Plant 88000000 30000000 1000000 -17.99% -10.96% -1.34%
Cost of gallon of diesel $4.50 $2.68 $2.00 -11.10% -10.96% -10.9%
Figure 5.2.2: Soybean Meal Sensitivity Analysis
Notable results for the soybean meal sensitivity analysis observed in Table and Figure 5.2.2 are
as follows. Changing the number gas sites from 20 to 500 results in an increase in the IRR from -
22% to -4%. Similarly, changing the construction cost of the plant from 88 million dollars to 5

million dollars increases the IRR from -18% to -2%. The contract period shifted the IRR by -
18%. Finally, the price of diesel once again had little effect on the IRR. Setting the price of our
bacterial meal equal to that of the current soybean meal price always results in a negative IRR.
Thus, our animal feed is not currently competitive with soybean meal without help from
regulatory policies.
6.0 Conclusion
When examining the biological methods that can be used to mitigate the flaring of natural gas,
utilizing aerobic methanotrophs to produce animal feed is not only the most effective
technological alternative, but it is also economically viable. The bacterial meal is nutritionally
adequate to replace significant percentages of specific animals’ dietary protein and provides
important environmental benefits with regards to carbon emission and feed replacement.
Growing methanotrophs on natural gas reduces carbon dioxide emissions by 52% and using
bacterial meal in lieu of soybean meal and fishmeal reduces groundwater contaminants and
pollutants and saves water, land, and food that could otherwise be fed directly to humans. Future
research in production efficiency, improved nutritional quality, and alterations for specific
animal preferences can decrease the price of bacterial meal and make it a more desirable product
for farm animals, humans, and the environment alike (Bothe).

Report Summary:
The flaring of natural gas is a worldwide problem that not only is harming the environment, but
also wasting a valuable resource. Over the last year, our team has been searching for ways to
capture part of that value while reducing the harmful effects of flaring. Ultimately, we presented
three alternate pathways, each with different capital requirements, equipment needs, process
flows, and mitigation effects. The Enhanced Oil Recovery pathway allows gas to avoid flaring
while providing increased oil extraction. Although the costs associated with these technologies
make this option uneconomic, if oil prices were to rise above $75 that could change. Similarly,
by allowing FedEx to use the natural gas for transport instead of flaring it, significant value is
captured. Creating a midstream company to locally transport compressed natural gas in order to
fuel FedEx fleet vehicles at a distribution center, proved to be both economic and
environmentally friendly. Lastly, having bacteria consume the natural gas and produce animal
feed curbs flaring while economically helping the food chain. Overall, the three distinct
pathways provide an in-depth look into potential solutions to this worldwide problem. While
there are several assumptions that were made in the process of making this report, we believe
that our report provides an accurate insight into viable solutions. Further research and increased
conversations with commercial partners would be required before implementing these pathways.

References Section:
References for Flare Gas Problem, Regulations & Environmental Risks and Health Impacts:
Estimated Flared Volumes from Satellite Data, 2007-2011. World Bank. 2012.
http://web.worldbank.org/WBSITE/EXTERNAL/TOPICS/EXTOGMC/EXTGGFR/0,,contentM
DK:22137498~menuPK:3077311~pagePK:64168445~piPK:64168309~theSitePK:578069,00.ht
ml.
Federal Oil and Gas Leases: Opportunities Exist to Capture Vented and Flared Natural Gas,
Which Would Increase Royalty Payments and Reduce Greenhouse Gases. United States
Government Accountability Office (GAO). 2010. http://www.gao.gov/new.items/d1134.pdf.
Flare Gas—24665 Policy/Guidance. North Dakota Industrial Commission.
https://www.dmr.nd.gov/oilgas/GuidancePolicyNorthDakotaIndustrialCommissionorder24665.p
df.
Horwitt, Dusty and Lisa Sumi. Up in Flame. Earthworks. 2014.
http://www.earthworksaction.org/files/publications/Up-In-Flames_FINAL.pdf.
Kindzierski, W D. Importance of human environmental exposure to hazardous air pollutants
from gas flares. Environmental Reviews. 2000.
http://www.nrcresearchpress.com/doi/pdfplus/10.1139/a00-005.

Mining and Gas and Oil Production: Control of Gas and Oil Resources. North Dakota
Legislative Branch. http://www.legis.nd.gov/cencode/t38c08.pdf?20150426130046.
Obioh, I. B,. Environmental Impact Assessment of Emissions from Major Facilities at QIT.
Atmospheric Emissions and Dispersion Modeling. Faithlink Consults Nigeria Ltd. 1999.
Oil and Natural Gas Sector: New Source Performance Standards and National Emission
Standards for Hazardous Air Pollutants Reviews—Final Rule. Environmental Protection Agency.
2012. http://www.epa.gov/airquality/oilandgas/pdfs/20120417finalrule.pdf.
Podesta, John. New Actions to Reduce Methane Emissions Will Curb Climate Change, Cut
Down on Wasted Energy. The White House Blog. 2015.
https://www.whitehouse.gov/blog/2015/01/14/new-actions-reduce-methane-emissions-will-curb-
climate-change-cut-down-wasted-energy.
Zero Routine Flaring By 2030—Quick Facts. World Bank. 2015.
http://www.worldbank.org/en/programs/zero-routine-flaring-by-2030#2.
References for gas component analysis
Lee K. Gilmer, Christopher A. Caico, Jacob J. Sherrick,Gary R. Mueller, Karl R. Loos. Texas
Commission on Environmental Quality Work Assignment 5: Draft Flare Waste Gas Flow Rate

and Composition Measurement Methodologies Evaluation Document. Shell Global Solutions.
2004.
North Dakota Pipeline Authority. Facts on Natural Gas and Flaring in North Dakota. October
2012. http://northdakotapipelines.com/natgasfacts/
Manbw Inc.Associated Petroleum Gas (APG): Basic Methods of Processing and Utilization.
Manbw Inc. New Generation.
North Dakota Petroleum Council. Bakken Crude Quality Assurance Study. August, 2014.
https://www.ndoil.org/image/cache/Summary_2.pdf
American Fuel & Petrochemical Manufacturers. A Survey of Bakken Crude Oil Characteristics
Assembled For the U.S. Department of Transportation. May, 2014.
References for Onsite Utilization
Raj K. Srivastava, Sam S. Huang, Mingzhe Dong. Comparative Effectiveness of CO2, Produced
Gas, and Flue Gas for Enhanced Heavy-Oil Recovery. Saskatchewan Research Council. SPE
Reservoir Eval. & Eng. 2(3) June 1999
Up in Flames: US Oil Boom Comes at Expense of Wasted Natural Gas, Increase CO2. Page 13.
Earthworks. August 2014.
Lee K. Gilmer, Christopher A. Caico, Jacob J. Sherrick,Gary R. Mueller, Karl R. Loos. Texas
Commission on Environmental Quality Work Assignment 5: Draft Flare Waste Gas Flow Rate
and Composition Measurement Methodologies Evaluation Document. Shell Global Solutions.

Ryan Salmon, Andrew Logan. Flaring up: North Dakota Natural Gas Flaring More Than
Doubles in Two Years. Page 4. Ceres. July 2013.
Ariel Corp Compressor JG/JGA 504 - 840 BHP: http://arielcorp.com/JG-JGA/
FLEX TURBINE™ MT250 AND MT333 RELIABLE GAS TURBINES:
http://www.flexenergy.com/flexenergy_flex_turbine.html
seamless steel cng storage tanks: http://www.alibaba.com/product-detail/seamless-steel-cng-
storage-tanks-for_60112599611.html
References for Using Flare Gas to Power FedEx
BBC. "From Wrightspeed, the Jet-powered Delivery Truck." BBC Autos. N.p., 06 Oct. 2014.
Web. 26 Apr. 2015. <http://www.bbc.com/autos/story/20141006-the-jet-powered-fedex-truck>.
EPA. "Greenhouse Gas Equivalencies Calculator." EPA. Environmental Protection Agency.
Web. 26 Apr. 2015. < http://www.epa.gov/cleanenergy/energy-
resources/calculator.html#results>
FedEx. "FedEx Annual Report 2014." FedEx Annual Report 2014. N.p., n.d. Web. 26 Apr. 2015.
< http://annualreport.van.fedex.com/2014/>

FedEx. "Home - About FedEx." About FedEx Home Comments. N.p., n.d. Web. 26 Apr. 2015. <
http://about.van.fedex.com>
LoopNet. "Real Estate Listing for Dickinson ND." Web. < http://www.loopnet.com>
NDIC. "North Dakota Industrial Commission, Oil and Gas Division." N.p., n.d. Web.<
https://www.dmr.nd.gov/oilgas/basic/getwellfile.asp>
US Government. "2010 Census." 2010 Census. Web. 26 Apr. 2015.<
http://www.census.gov/2010census/>
Wrightspeed. "Products." Wrightspeed. N.p., n.d. Web. 26 Apr. 2015.
<http://wrightspeed.com/products/the-route/>.
WSJ. "FedEx CEO: Truck Fleets to Shift to Natural Gas From Diesel." WSJ. N.p., n.d. Web. 26
Apr. 2015.
<http://www.wsj.com/articles/SB10001424127887323628804578348631137173040>.
References for Utilizing Methane-Oxidizing Bacteria to Produce Animal Feed
Bothe H, Jensen KM, Mergel A, Larsen J, Jørgensen C, Bothe H, Jørgensen L. 2002.
Heterotrophic bacteria growing in association with Methylococcus capsulatus (Bath) in a single
cell protein production process. Appl Microbiol Biotechnol. 59:33–39.

Chistoserdova L, Vorholt JA, Lidstrom ME. 2005. A genomic view of methane oxidation by
aerobic bacteria and anaerobic archaea.
Clay, Jason, and World Wildlife Fund Staff. World Agriculture and the Environment: A
Commodity-by-Commodity Guide to Impacts and Practices. Washington DC, USA: Island Press,
2003. ProQuest Library. Web. 8 April 2015.
"Energy-Harvesting Pathways." Introduction to Biology: Respiration. January 1, 2011. Accessed
March 10, 2015. https://gln.dcccd.edu/Biology_Demo/Bio_Lesson08/index.html.
Food and Agricultural Organization, Torry Research Station (2001). Fish Meal. Torry Advisory
Note No 40. Retrieved from http://www.fao.org/wairdocs/tan/x5926e/x5926e01.htm#TopOfPage
Francois, B. et al., (n.d.). Soya Bean Meal and Its Extensive Use in Livestock Feeding and
Nutrition.
Madigan, Michael T. Brock Biology of Microorganisms. 13. Ed., Global ed. Boston ; Munich
[u.a.: Pearson, 2012.
NDIC Oil and Gas Server

Overland M, Tauson AH, Shearer K, Skrede A. 2010. Evaluation of methane-utilising bacteria
products as feed ingredients for monogastric animals.
UK Department for Environment, Food & Rural Affairs (2006). SCP Evidence Base: Sustainable
Commodities Case Studies: FISHMEAL.
Vigneron, A et al. "Archaeal and Anaerobic Methane Oxidizer Communities in the Sonora
Margin Cold Seeps, Guaymas Basin (Gulf of California)." The ISME Journal, 2013, 1595-608.
World Bank: Feedstock prices per metric ton.
http://databank.worldbank.org/data/views/reports/tableview.aspx
"52% CUT IN CO2 EMISSIONS." UniBio RSS. Accessed March 16, 2015.
http://www.unibio.dk/52-cut-in-co2-emisions/.