capturing small ecg signals in medical applications · and the repetition rate of the heartbeat...
TRANSCRIPT

5 mm0.2 s
5 mm0.5 mV
T
U
P
S
Q
R
P-Rsegment
S-Tsegment
S-TintervalP-R
interval
QRSinterval
Q-Tinterval
Test
& M
easu
rem
ent
Appl
icat
ion
Card
| 01
.00
Capt
urin
g sm
all E
CG s
igna
ls
in m
edic
al a
pplic
atio
ns
Your taskAn electrocardiogram (ECG) is widely used in medicine to monitor small electrical changes on the skin of a patient’s body arising from the activities of the human heart. This simple and noninvasive measurement easily indicates a variety of heart diseases. The medical industry builds dedi-cated equipment that aids in diagnosis. This equipment re-quires precise oscilloscopes for its design and verification.
T & M solutionECG equipment typically has 12 leads that are connected to the human chest, arms and legs. The voltage is mea-sured between different connection points. This article de-scribes the example of signal lead 1, which is the voltage between the left and right arms.
The figure on the left shows this signal (lead 1), which repeats with the pace of the heartbeat. It starts with a P wave, which initiates the cycle, continues with the QRS interval and completes with the T wave. For a test engineer, the noisy environment, the single-ended con-nection of the leads and the low magnitude of the signal create quite a challenge. Typical levels are less than 1 mV, and the repetition rate of the heartbeat signal is between 40 beats/minute and 220 beats/minute (bpm).
In a typical setup, an amplifier is required to amplify the signal, with the drawback of additional noise, channel- specific delay and offset error. However, waveform averag-ing is not a choice for noise reduction, because the signal is not repetitive and important information would be lost. The diagram shows an example of a sequence of pulses with nonperiodic disturbances, providing medical personal with valuable indications to specific diseases.
Capturing small ECG signals in medical applicationsECG signal from lead 1
The typical ECG signal magnitude is 1 mV or less de-pending on the measurement point, with a bandwidth < 10 kHz. Capturing and analyzing these signals directly with oscilloscopes is difficult due to the small amplitude. However, the R&S®RTE digital oscilloscope offers key fea-tures for direct, in-depth signal analysis.
ApplicationThe upper screenshot on the next page shows an ECG signal captured with the R&S®RTE in a standard setup. The signal has a high noise level, the P and T waves being barely visible.
To improve the acquired signal, the vertical scale is set to 500 µV/div without zoom or bandwidth limits. This is a unique feature for this class of oscilloscopes. The HD mode is used with a 10 kHz bandwidth limit 1).
1) For detailed information, see Dr. Mathias Hellwig. High-Resolution Measure-ments with R&S Oscilloscopes. [Online] 2015. http://cdn.rohde-schwarz.com/pws/dl_downloads/dl_application/application_notes/1td06/1TD06_0e_RTO_HiDef.pdf
Nonperiodic disturbances in a periodic ECG signal
RTE_Capturing_ac_en_3607-3180-92_v0100.indd 1 17.11.2015 11:02:02
Rohde & Schwarz GmbH & Co. KG
Europe, Africa, Middle East | +49 89 4129 12345
North America | 1 888 TEST RSA (1 888 837 87 72)
Latin America | +1 410 910 79 88
Asia Pacific | +65 65 13 04 88
China | +86 800 810 82 28 | +86 400 650 58 96
www.rohde-schwarz.com
R&S® is a registered trademark of Rohde & Schwarz GmbH & Co. KG
Trade names are trademarks of the owners
PD 3607.3180.92 | Version 01.00 | November 2015 (sk)
R&S®RTE; Capturing small ECG signals in medical applications
Data without tolerance limits is not binding | Subject to change
© 2015 Rohde & Schwarz GmbH & Co. KG | 81671 Munich, Germany
3607
.318
0.92
01.
00 P
DP
1 e
n
3607318092
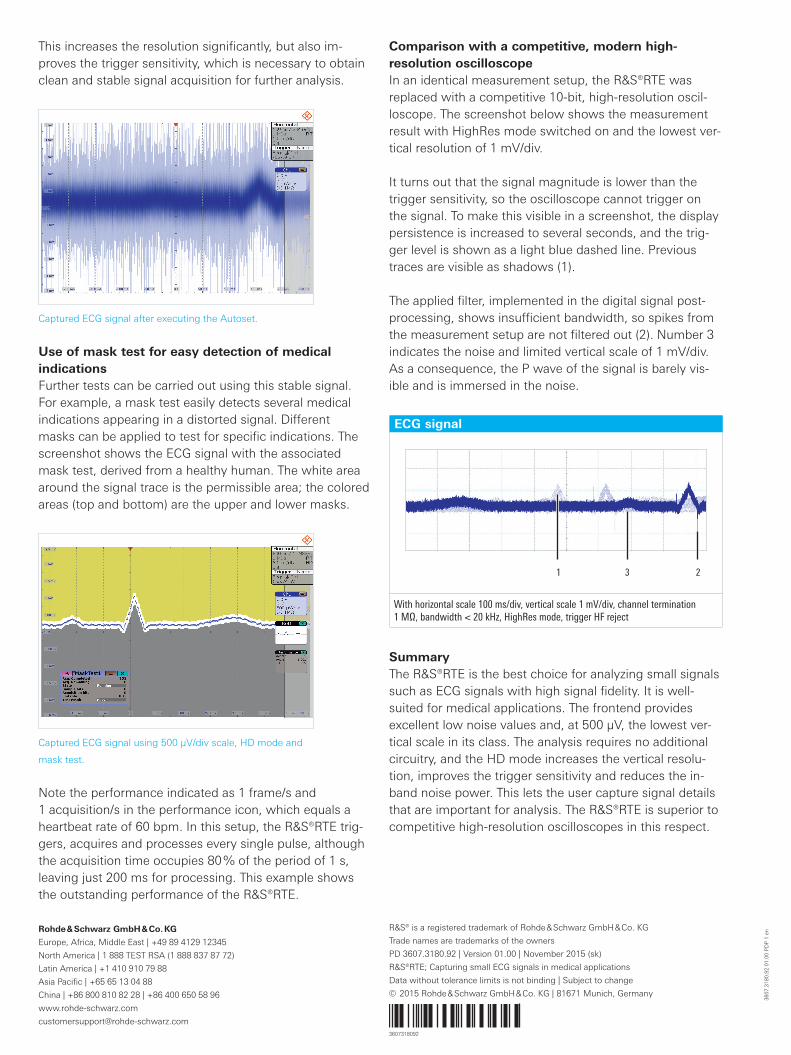
Comparison with a competitive, modern high-resolution oscilloscopeIn an identical measurement setup, the R&S®RTE was replaced with a competitive 10-bit, high-resolution oscil-loscope. The screenshot below shows the measurement result with HighRes mode switched on and the lowest ver-tical resolution of 1 mV/div.
It turns out that the signal magnitude is lower than the trigger sensitivity, so the oscilloscope cannot trigger on the signal. To make this visible in a screenshot, the display persistence is increased to several seconds, and the trig-ger level is shown as a light blue dashed line. Previous traces are visible as shadows (1).
The applied filter, implemented in the digital signal post-processing, shows insufficient bandwidth, so spikes from the measurement setup are not filtered out (2). Number 3 indicates the noise and limited vertical scale of 1 mV/div. As a consequence, the P wave of the signal is barely vis-ible and is immersed in the noise.
This increases the resolution significantly, but also im-proves the trigger sensitivity, which is necessary to obtain clean and stable signal acquisition for further analysis.
Captured ECG signal after executing the Autoset.
Captured ECG signal using 500 µV/div scale, HD mode and
mask test.
Use of mask test for easy detection of medical indications Further tests can be carried out using this stable signal. For example, a mask test easily detects several medical indications appearing in a distorted signal. Different masks can be applied to test for specific indications. The screenshot shows the ECG signal with the associated mask test, derived from a healthy human. The white area around the signal trace is the permissible area; the colored areas (top and bottom) are the upper and lower masks.
Note the performance indicated as 1 frame/s and 1 acquisition/s in the performance icon, which equals a heartbeat rate of 60 bpm. In this setup, the R&S®RTE trig-gers, acquires and processes every single pulse, although the acquisition time occupies 80 % of the period of 1 s, leaving just 200 ms for processing. This example shows the outstanding performance of the R&S®RTE.
SummaryThe R&S®RTE is the best choice for analyzing small signals such as ECG signals with high signal fidelity. It is well-suited for medical applications. The frontend provides excellent low noise values and, at 500 µV, the lowest ver-tical scale in its class. The analysis requires no additional circuitry, and the HD mode increases the vertical resolu-tion, improves the trigger sensitivity and reduces the in-band noise power. This lets the user capture signal details that are important for analysis. The R&S®RTE is superior to competitive high-resolution oscilloscopes in this respect.
ECG signal
With horizontal scale 100 ms/div, vertical scale 1 mV/div, channel termination 1 MΩ, bandwidth < 20 kHz, HighRes mode, trigger HF reject
1 3 2
RTE_Capturing_ac_en_3607-3180-92_v0100.indd 2 17.11.2015 11:02:03