capt science 2012 administration - hartford magnet …hmtca.hartfordschools.org/pdf/science capt...
TRANSCRIPT

2012 Science 119
CAPT Science
2012 Administration
Released Items and
Scored Student Responses

2012 Science 120
Table of Contents CAPT Science Framework ........................................................................... 121
Items Found in This Packet .......................................................................... 129
Scoring Rubric for Science Open-Ended Items ............................................ 130
CAPT Science Open-Ended Items and Scored Student Responses
GM Rice Safety...................................................................................... 131
Population Graphs ................................................................................. 142
CAPT Science Multiple-Choice Items........................................................... 153

2012 Science 121
CAPT Science Framework The CAPT Science test was developed with the input of Connecticut educators and reflects a growing national consensus that science is not only a body of knowledge, but also a way of thinking about the world around us and a concern for how that knowledge is used. The CAPT Science test assesses students’ understanding of important scientific concepts, as well as their application of those concepts to realistic problems. In addition, experimentation and the ability to use scientific reasoning to solve problems are a major focus of the test. To align with the Science Curriculum Framework, the following content strands are reported:
• Energy Transformations • Chemical Structures and Properties • Global Interdependence • Cell Chemistry and Biotechnology • Genetics, Evolution, and Biodiversity
In addition, scores are reported for the following:
• Conceptual Understanding • Scientific Inquiry, Literacy, and Numeracy
Students respond to 60 multiple-choice (MC) and 5 open-ended (OE) items. The test is divided into two 50-minute sessions.

2012 Science 122
Students respond to two different types of items: multiple-choice and open-ended. On the open-ended items, students are asked to respond in writing to the question, or they may be asked to sketch a graph. Multiple-choice items are scored electronically as correct or incorrect. Open-ended items are hand-scored using a 4-point holistic rubric (0–3). Scientific Inquiry, Literacy, and Numeracy expected performances are tested using both multiple-choice and open-ended items. A state Goal standard has been set for the CAPT Science test. Students who reach the state Goal receive a Certificate of Mastery in Science. A curriculum-embedded science performance task has been developed for each of the five content strands. These tasks will be utilized for the entire third generation of the test. Schools are encouraged to embed these tasks into their regular grade 9 and 10 science curricula at the appropriate time. All of the open-ended items on the written test are related to the five tasks.

2012 Science 123
Core Science Curriculum Framework for Grades 9 and 10 THE STANDARDS FOR SCIENTIFIC INQUIRY, LITERACY, AND NUMERACY ARE INTEGRAL PARTS OF THE CONTENT STANDARDS FOR EACH GRADE LEVEL IN THIS CLUSTER.
Grades 9–10 Core Scientific Inquiry, Literacy, and Numeracy How is scientific knowledge created and communicated?
Content Standards Expected Performances
SCIENTIFIC INQUIRY
Scientific inquiry is a thoughtful and coordinated attempt to search out, describe, explain, and predict natural phenomena.
Scientific inquiry progresses through a continuous process of questioning, data collection, analysis, and interpretation.
Scientific inquiry requires the sharing of findings and ideas for critical review by colleagues and other scientists.
SCIENTIFIC LITERACY
Scientific literacy includes the ability to read, write, discuss, and present coherent ideas about science.
Scientific literacy also includes the ability to search for and assess the relevance and credibility of scientific information found in various print and electronic media.
SCIENTIFIC NUMERACY
Scientific numeracy includes the ability to use mathematical operations and procedures to calculate, analyze, and present scientific data and ideas.
D INQ.1 Identify questions that can be answered through scientific investigation.
D INQ.2 Read, interpret, and examine the credibility and validity of scientific claims in different sources of information.
D INQ.3 Formulate a testable hypothesis and demonstrate logical connections between the scientific concepts guiding the hypothesis and the design of the experiment.
D INQ.4 Design and conduct appropriate types of scientific investigations to answer different questions.
D INQ.5 Identify independent and dependent variables, including those that are kept constant and those used as controls.
D INQ.6 Use appropriate tools and techniques to make observations and gather data.
D INQ.7 Assess the reliability of the data that was generated in the investigation.
D INQ.8 Use mathematical operations to analyze and interpret data, and present relationships between variables in appropriate forms.
D INQ.9 Articulate conclusions and explanations based on research data, and assess results based on the design of the investigation.
D INQ.10 Communicate about science in different formats, using relevant science vocabulary, supporting evidence, and clear logic.
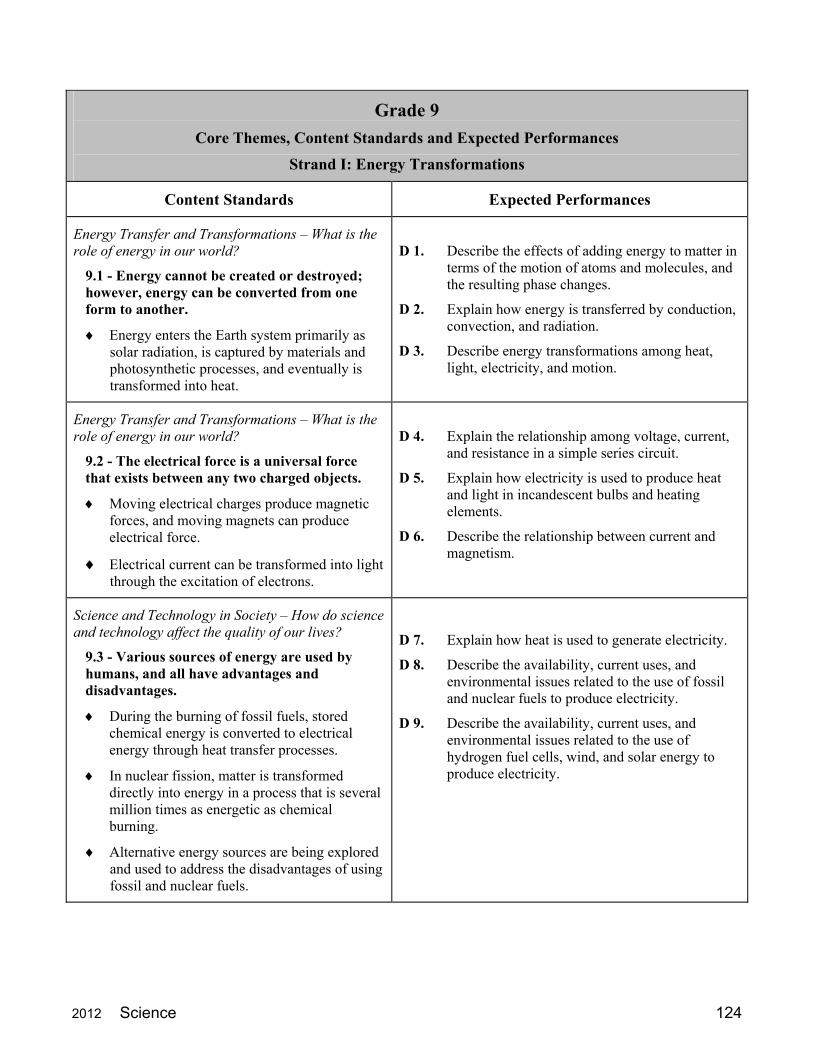
2012 Science 124
Grade 9
Core Themes, Content Standards and Expected Performances
Strand I: Energy Transformations
Content Standards Expected Performances
Energy Transfer and Transformations – What is the role of energy in our world?
9.1 - Energy cannot be created or destroyed; however, energy can be converted from one form to another.
Energy enters the Earth system primarily as solar radiation, is captured by materials and photosynthetic processes, and eventually is transformed into heat.
D 1. Describe the effects of adding energy to matter in terms of the motion of atoms and molecules, and the resulting phase changes.
D 2. Explain how energy is transferred by conduction, convection, and radiation.
D 3. Describe energy transformations among heat, light, electricity, and motion.
Energy Transfer and Transformations – What is the role of energy in our world?
9.2 - The electrical force is a universal force that exists between any two charged objects.
Moving electrical charges produce magnetic forces, and moving magnets can produce electrical force.
Electrical current can be transformed into light through the excitation of electrons.
D 4. Explain the relationship among voltage, current, and resistance in a simple series circuit.
D 5. Explain how electricity is used to produce heat and light in incandescent bulbs and heating elements.
D 6. Describe the relationship between current and magnetism.
Science and Technology in Society – How do science and technology affect the quality of our lives?
9.3 - Various sources of energy are used by humans, and all have advantages and disadvantages.
During the burning of fossil fuels, stored chemical energy is converted to electrical energy through heat transfer processes.
In nuclear fission, matter is transformed directly into energy in a process that is several million times as energetic as chemical burning.
Alternative energy sources are being explored and used to address the disadvantages of using fossil and nuclear fuels.
D 7. Explain how heat is used to generate electricity.
D 8. Describe the availability, current uses, and environmental issues related to the use of fossil and nuclear fuels to produce electricity.
D 9. Describe the availability, current uses, and environmental issues related to the use of hydrogen fuel cells, wind, and solar energy to produce electricity.

2012 Science 125
Grade 9
Core Themes, Content Standards and Expected Performances
Strand II: Chemical Structures and Properties
Content Standards Expected Performances
Properties of Matter – How does the structure of matter affect the properties and uses of materials?
9.4 - Atoms react with one another to form new molecules.
Atoms have a positively charged nucleus surrounded by negatively charged electrons.
The configuration of atoms and molecules determines the properties of the materials.
D 10. Describe the general structure of the atom, and explain how the properties of the first 20 elements in the Periodic Table are related to their atomic structures.
D 11. Describe how atoms combine to form new substances by transferring electrons (ionic bonding) or sharing electrons (covalent bonding).
D 12. Explain the chemical composition of acids and bases, and explain the change of pH in neutralization reactions.
Properties of Matter – How does the structure of matter affect the properties and uses of materials?
9.5 - Due to its unique chemical structure, carbon forms many organic and inorganic compounds.
Carbon atoms can bond to one another in chains, rings, and branching networks to form a variety of structures, including fossil fuels, synthetic polymers, and the large molecules of life.
D 13. Explain how the structure of the carbon atom affects the type of bonds it forms in organic and inorganic molecules.
D 14. Describe combustion reactions of hydrocarbons and their resulting by-products.
D 15. Explain the general formation and structure of carbon-based polymers, including synthetic polymers, such as polyethylene, and biopolymers, such as carbohydrate.
Science and Technology in Society – How do science and technology affect the quality of our lives?
9.6 - Chemical technologies present both risks and benefits to the health and well-being of humans, plants, and animals.
Materials produced from the cracking of petroleum are the starting points for the production of many synthetic compounds.
The products of chemical technologies include synthetic fibers, pharmaceuticals, plastics, and fuels.
D 16. Explain how simple chemical monomers can be combined to create linear, branched, and/or cross-linked polymers.
D 17. Explain how the chemical structure of polymers affects their physical properties.
D 18. Explain the short- and long-term impacts of landfills and incineration of waste materials on the quality of the environment.

2012 Science 126
Grade 9
Core Themes, Content Standards and Expected Performances
Strand III: Global Interdependence
Content Standards Expected Performances
The Changing Earth – How do materials cycle through the Earth’s systems?
9.7 - Elements on Earth move among reservoirs in the solid earth, oceans, atmosphere, and organisms as part of biogeochemical cycles.
Elements on Earth exist in essentially fixed amounts and are located in various chemical reservoirs.
The cyclical movement of matter between reservoirs is driven by Earth’s internal and external sources of energy.
D 19. Explain how chemical and physical processes cause carbon to cycle through the major earth reservoirs.
D 20. Explain how solar energy causes water to cycle through the major earth reservoirs.
D 21. Explain how internal energy of Earth causes matter to cycle through the magma and the solid earth.
Science and Technology in Society – How do science and technology affect the quality of our lives?
9.8 - The use of resources by human populations may affect the quality of the environment.
Emission of combustion by-products, such as SO2, CO2, and NOx, by industries and vehicles is a major source of air pollution.
Accumulation of metal and non-metal ions used to increase agricultural productivity is a major source of water pollution.
D 22. Explain how the release of sulfur dioxide (SO2) into the atmosphere can form acid rain, and how acid rain affects water sources, organisms, and human-made structures.
D 23. Explain how the accumulation of carbon dioxide (CO2) in the atmosphere increases Earth’s “greenhouse” effect and may cause climate changes.
D 24. Explain how the accumulation of mercury, phosphates, and nitrates affects the quality of water and the organisms that live in rivers, lakes, and oceans.
Science and Technology in Society – How do science and technology affect the quality of our lives?
9.9 - Some materials can be recycled, but others accumulate in the environment and may affect the balance of Earth’s systems.
New technologies and changes in lifestyle can have positive and/or negative effects on the environment.
D 25. Explain how land development, transportation options, and consumption of resources may affect the environment.
D 26. Describe human efforts to reduce the consumption of raw materials and improve air and water quality.
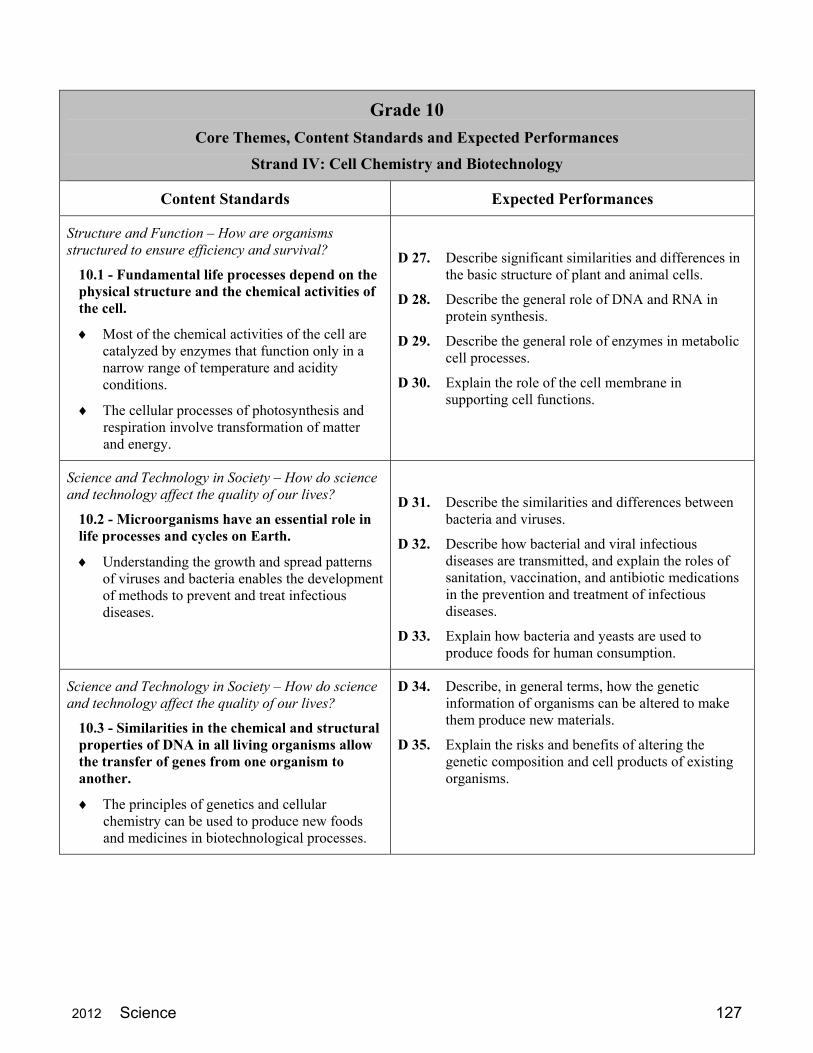
2012 Science 127
Grade 10
Core Themes, Content Standards and Expected Performances
Strand IV: Cell Chemistry and Biotechnology
Content Standards Expected Performances
Structure and Function – How are organisms structured to ensure efficiency and survival?
10.1 - Fundamental life processes depend on the physical structure and the chemical activities of the cell.
Most of the chemical activities of the cell are catalyzed by enzymes that function only in a narrow range of temperature and acidity conditions.
The cellular processes of photosynthesis and respiration involve transformation of matter and energy.
D 27. Describe significant similarities and differences in the basic structure of plant and animal cells.
D 28. Describe the general role of DNA and RNA in protein synthesis.
D 29. Describe the general role of enzymes in metabolic cell processes.
D 30. Explain the role of the cell membrane in supporting cell functions.
Science and Technology in Society – How do science and technology affect the quality of our lives?
10.2 - Microorganisms have an essential role in life processes and cycles on Earth.
Understanding the growth and spread patterns of viruses and bacteria enables the development of methods to prevent and treat infectious diseases.
D 31. Describe the similarities and differences between bacteria and viruses.
D 32. Describe how bacterial and viral infectious diseases are transmitted, and explain the roles of sanitation, vaccination, and antibiotic medications in the prevention and treatment of infectious diseases.
D 33. Explain how bacteria and yeasts are used to produce foods for human consumption.
Science and Technology in Society – How do science and technology affect the quality of our lives?
10.3 - Similarities in the chemical and structural properties of DNA in all living organisms allow the transfer of genes from one organism to another.
The principles of genetics and cellular chemistry can be used to produce new foods and medicines in biotechnological processes.
D 34. Describe, in general terms, how the genetic information of organisms can be altered to make them produce new materials.
D 35. Explain the risks and benefits of altering the genetic composition and cell products of existing organisms.

2012 Science 128
Grade 10
Core Themes, Content Standards and Expected Performances
Strand V: Genetics, Evolution and Biodiversity
Content Standards Expected Performances
Heredity and Evolution – What processes are responsible for life’s unity and diversity?
10.4 - In sexually reproducing organisms, each offspring contains a mix of characteristics inherited from both parents.
Genetic information is stored in genes that are located on chromosomes inside the cell nucleus.
Most organisms have two genes for each trait, one on each of the homologous chromosomes in the cell nucleus.
D 36. Explain how meiosis contributes to the genetic variability of organisms.
D 37. Use the Punnet Square technique to predict the distribution of traits in mono- and di-hybrid crossings.
D 38. Deduce the probable mode of inheritance of traits (e.g., recessive/dominant, sex-linked) from pedigree diagrams showing phenotypes.
D 39. Describe the difference between genetic disorders and infectious diseases.
Heredity and Evolution – What processes are responsible for life’s unity and diversity?
10.5 - Evolution and biodiversity are the result of genetic changes that occur over time in constantly changing environments.
Mutations and recombination of genes create genetic variability in populations.
Changes in the environment may result in the selection of organisms that are better able to survive and reproduce.
D 40. Explain how the processes of genetic mutation and natural selection are related to the evolution of species.
D 41. Explain how the current theory of evolution provides a scientific explanation for fossil records of ancient life forms.
D 42. Describe how structural and behavioral adaptations increase the chances for organisms to survive in their environments.
Science and Technology in Society – How do science and technology affect the quality of our lives?
10.6 - Living organisms have the capability of producing populations of unlimited size, but the environment can support only a limited number of individuals from each species.
Human populations grow due to advances in agriculture, medicine, construction, and the use of energy.
Humans modify ecosystems as a result of rapid population growth, use of technology, and consumption of resources.
D 43. Describe the factors that affect the carrying capacity of the environment.
D 44. Explain how change in population density is affected by emigration, immigration, birth rate, and death rate, and relate these factors to the exponential growth of human populations.
D 45. Explain how technological advances have affected the size and growth rate of human populations throughout history.
2012 Science 129
Items Found in This Packet Open-Ended Items Open-ended items are those for which a student must write a short response to a question. Included in this packet are two open-ended items corresponding to curriculum-embedded performance tasks. CSDE has developed a suggested performance task for each of the five content strands in the science framework for grades 9 and 10. Teachers are encouraged to use these tasks in the normal course of instruction when teaching the related content strand. The five constructed-response items on the CAPT will assess scientific inquiry, literacy, and numeracy, using the context of the curriculum embedded tasks. These constructed-response items total 15 points or 20 percent of the total test. CAPT open-ended items are scored on a four-point scale (0–3) using a holistic scoring method. This method involves judging the overall quality of the student response. The general scoring rubric for the science open-ended items (see following page) describes the characteristics of a response at each score point. Included with each item is the content guide (description of a good response to the question), the specific scoring rubric for the item (description of each score point), and the classification of the item based on the CAPT Science Framework. This is followed by two scored student responses at each score point along with a brief discussion of why the response received a particular score. Keep in mind that the scoring criteria are based on reasonable expectations of grade 10 students responding under testing conditions. Students are given approximately five minutes to respond to each open-ended item. The responses are therefore less polished than they might be if students were given more time to revise their answers. In addition, students are asked to respond to a wide variety of scientific topics, many of which they may not have studied for some time. All of this is taken into consideration when scoring the responses. Multiple-Choice Items For each of the five content strands, eight multiple-choice items assess content knowledge, and four multiple-choice items assess scientific inquiry, literacy, and numeracy skills. The entire Science test includes 60 multiple-choice items. To foster depth of understanding, most CAPT multiple-choice items are organized in clusters related to particular scenarios. In addition, some clusters include specific information at the beginning that students can use in answering the questions. To stress the interdisciplinary nature of science, some clusters make connections between concepts of the major content areas.
2012 Science 130
Scoring Rubric for Science Open-Ended Items Each score category contains a range of student responses which reflect the descriptions given below. Score 3 The response is an excellent answer to the question. It is correct, complete, and appropriate and contains elaboration, extension, and/or evidence of higher-order thinking and relevant prior knowledge. There is no evidence of misconceptions. Minor errors will not necessarily lower the score. Score 2 The response is a proficient answer to the question. It is generally correct, complete, and appropriate, although minor inaccuracies may appear. There may be limited evidence of elaboration, extension, higher-order thinking, and relevant prior knowledge, or there may be significant evidence of these traits but other flaws (e.g., inaccuracies, omissions, inappropriateness) may be more than minor. Score 1 The response is a marginal answer to the question. While it may contain some elements of a proficient response, it is inaccurate, incomplete, and/or inappropriate. There is little evidence, if any, of elaboration, extension, higher-order thinking, or relevant prior knowledge. There may be evidence of significant misconceptions. Score 0 The response, though possibly on topic, is an unsatisfactory answer to the question. It may fail to address the question, or it may address the question in a very limited way. There may be no evidence of elaboration, extension, higher-order thinking, or relevant prior knowledge. There may be evidence of serious misconceptions.

2012 Science 131
—RELEASED ITEM—
CAPT Science Open-Ended Item: GM Rice Safety
A biotech company produces a new genetically modified (GM) variety of rice. It claims the rice is as safe for humans to eat as non-GM rice. Due to public concern, the company agrees to have its researchers perform a study using rats to test the safety of its product. Researchers planned the following study.
Rats in study group 1 will receive GM rice. Rats in study group 2 will receive non-GM rice. Both groups of rats will be of the same species. The trials will last for 6 months. Data on final weight, overall health, and/or death rate will be collected for each group.
SC10STSXCC35Q5102209O
1. a) Identify two additional factors that the researchers need to hold constant in order to ensure that their results are valid.
b) Explain why these factors need to be held constant.

2012 Science 132
—RELEASED ITEM—
Rubric for GM Rice Safety Sample Response:
Factors Held Constant: The number of rats in each study group The age of the individual rats in each study group The initial weight of the individual rats in each study group The initial health conditions of the individual rats in each study group The gender distribution of the rats in each study group The additional food sources provided to each study group The amount of water provided to each study group The amount of rice each study group received The living/environmental conditions for each study group The feeding time of each study group Other acceptable responses Explanation (may be general or specific to the factors selected): If some of the rats are older than others, they may die of natural causes before the trials are over, and
that would skew the results. If some rats start out heavier than others, then comparing the final weights between the two study
groups may not provide valid data. Male rats may respond differently to the diet than female rats, so the gender distributions amongst
the groups must be the same. Environmental conditions can affect the health of the rats (including habitat size, temperature
variations, etc.). The amount of food and/or water each group receives must be the same or variations in final
weight/health could result. Additional food sources must be the same, because different types of food provide different
nutrients. Other acceptable responses

2012 Science 133
—RELEASED ITEM—
3-Point Rubric: Score 3 The response identifies two factors that researchers need to hold constant in order to ensure the validity of their results and explains why one of these factors needs to be held constant. Score 2 The response identifies two factors that researchers need to hold constant in order to ensure the validity of their results, but fails to or incorrectly explains why one of these factors needs to be held constant.
-or- The response identifies one factor that researchers need to hold constant in order to ensure the validity of their results and explains why this factor needs to be held constant. Score 1 The response identifies one factor that researchers need to hold constant in order to ensure the validity of their results, but fails to or incorrectly explains why this factor needs to be held constant.
-or- The response identifies a correct explanation for why factors need to be held constant but fails to provide a valid additional factor that researchers need to hold constant to ensure the validity of their results. Score 0 The response describes little or no accurate or relevant information. Strand IV: Cell Chemistry and Biotechnology Expected Performance: D INQ.5 Identify independent and dependent variables, including those that are kept constant and those used as controls.

2012 Science 134
Scored Student Responses for GM Rice Safety
Score 3
The response identifies three additional factors that researchers need to hold constant in order to ensure the validity of their results (“…the amount of food each rat is fed…”; “…the amount of physical activity they do…”; “…the light levels and temperature of their environment…”). The response provides explanations for why these factors need to be constant (“…because giving one group more or less food could affect the results, such as their final weight”; “…could affect their overall health, making the results invalid. The researchers need to keep everything constant except for the independent variable…”). Only two correct factors and one acceptable explanation are needed to achieve the highest score.

2012 Science 135
Scored Student Responses for GM Rice Safety
Score 3
The response identifies two additional factors that researchers need to hold constant in order to ensure the validity of their results (“…the age of the rats…”; “…the weight of the rats”). The response provides two explanations for why these factors need to be held constant (“…because depending on how old the animal is, it could be healthier than another rat, which would affect the results of the study”; “The final weight will be taken at the end of the study…but if the original weight of the rats were not equal, than [sic] those results will not be valid.”). Only one acceptable explanation is needed to achieve the highest score.
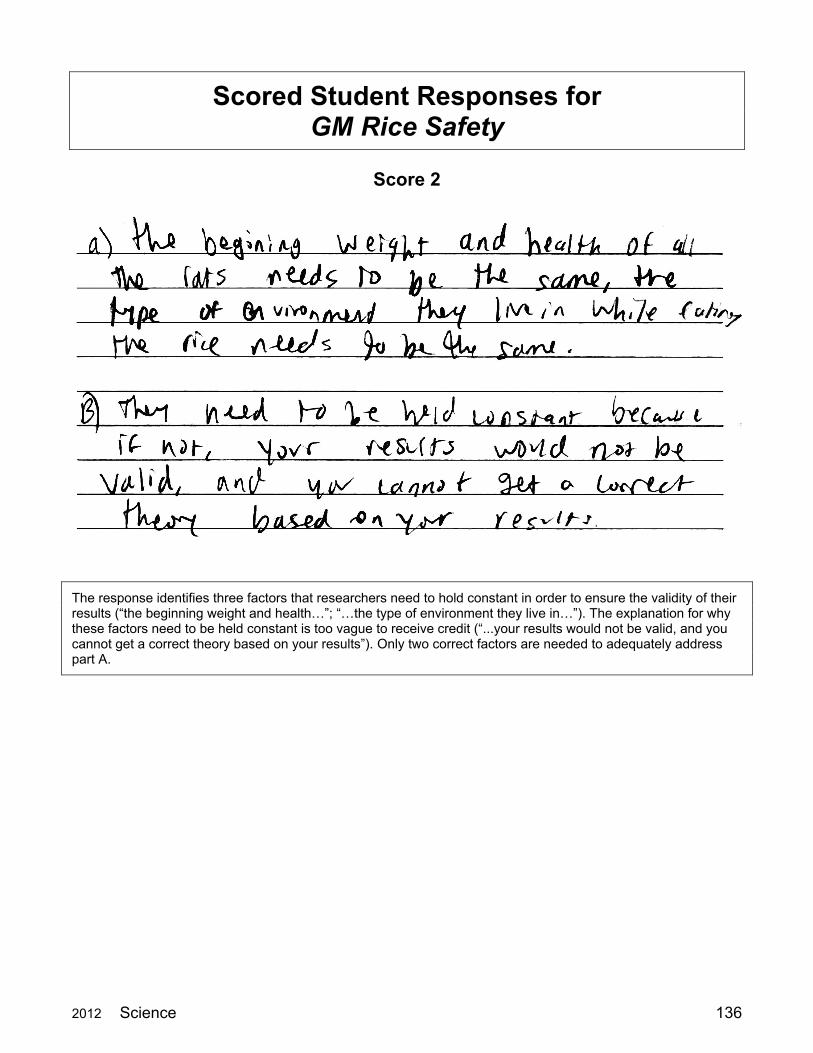
2012 Science 136
Scored Student Responses for GM Rice Safety
Score 2
The response identifies three factors that researchers need to hold constant in order to ensure the validity of their results (“the beginning weight and health…”; “…the type of environment they live in…”). The explanation for why these factors need to be held constant is too vague to receive credit (“...your results would not be valid, and you cannot get a correct theory based on your results”). Only two correct factors are needed to adequately address part A.

2012 Science 137
Scored Student Responses for GM Rice Safety
Score 2
The response identifies two additional factors that researchers need to hold constant in order to ensure the validity of their results (“...make sure they are both the same gender and they have to be the same age”). However, the response fails to provide an explanation for why one of these factors should be held constant.

2012 Science 138
Scored Student Responses for GM Rice Safety
Score 1
The response identifies one appropriate additional factor that researchers need to hold constant in order to ensure the validity of their results (“make sure both rats are givin [sic] the exact same amount of rice dayly [sic]”). Monitoring both rats daily to record their health is too general to receive credit as a factor. The explanation for why these factors need to be held constant (“…the data overal [sic] could be rong [sic]”) is too vague to receive credit.

2012 Science 139
Scored Student Responses for GM Rice Safety
Score 1
The response identifies factors that are given in the prompt and thus do not receive credit (“…the type of rat and the amount of time for the trials”). However, the explanation for why the type of rat needs to be held constant (“…maybe different types of rat have a different metabolism rate, or different diet”) is acceptable. The explanation for why the amount of time needs to be held constant is too vague to receive credit (“…you’ll get different results”).

2012 Science 140
Scored Student Responses for GM Rice Safety
Score 0
This response describes little accurate information. The factor identified to be held constant to ensure the validity of the results (“Data on the rats before expirament [sic]…”) and its corresponding explanation (“to make sure the rice is safe”) are too vague to receive credit.

2012 Science 141
Scored Student Responses for GM Rice Safety
Score 0
This response describes no accurate information. The factors identified (“…whether [rice is] able to be grown locally”; “…testing it on rats for humans…”) and the corresponding explanations for why they need to be held constant (“…so they don’t get a recall on it”; “…if developing nations are going to get this crop…they should know if it can be grown locally…”) are not relevant to this GM Rice Safety study.

2012 Science 142
—RELEASED ITEM—
CAPT Science Open-Ended Item: Population Graphs
The population graphs below show the age structure of populations in France and India for a select year.
SC10STSGGE44Q8081751O
2. Compare the two graphs and:
a) Describe a difference in individuals of reproductive age (15– 45).
b) Describe a difference in birthrate.
c) Identify one factor that may contribute to the difference in longevity (life span).
2012 Science 143
—RELEASED ITEM—
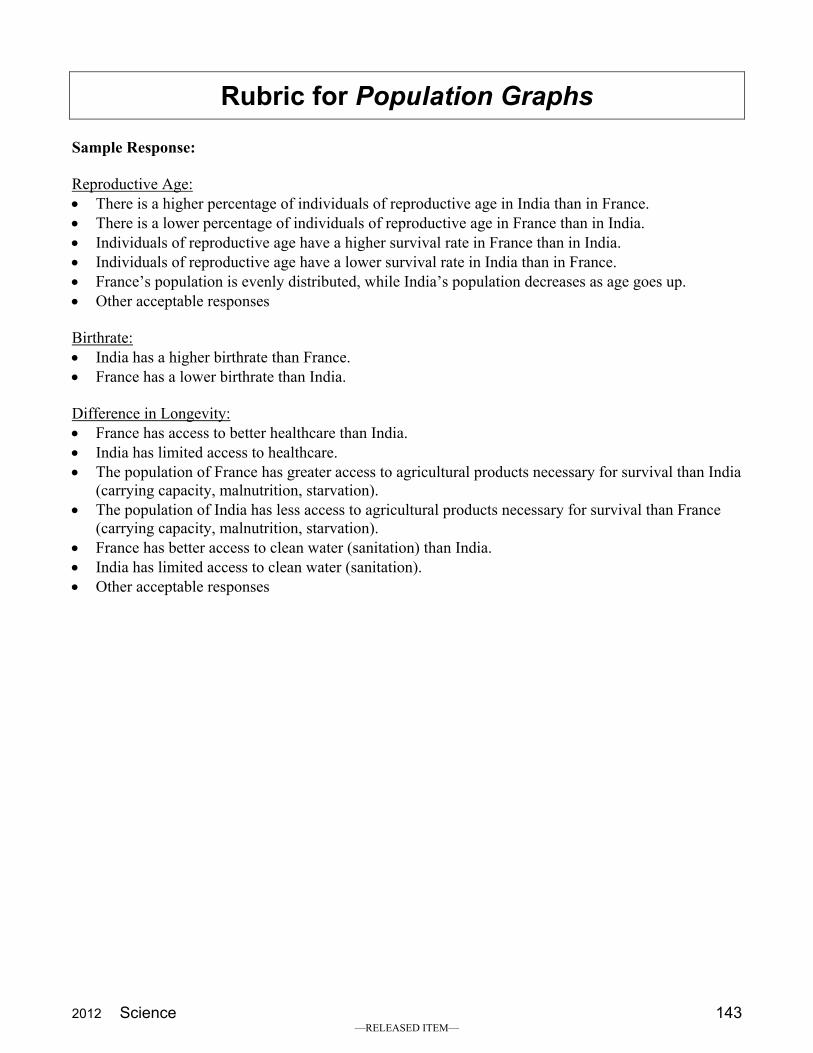
Rubric for Population Graphs Sample Response: Reproductive Age: There is a higher percentage of individuals of reproductive age in India than in France. There is a lower percentage of individuals of reproductive age in France than in India. Individuals of reproductive age have a higher survival rate in France than in India. Individuals of reproductive age have a lower survival rate in India than in France. France’s population is evenly distributed, while India’s population decreases as age goes up. Other acceptable responses Birthrate: India has a higher birthrate than France. France has a lower birthrate than India. Difference in Longevity: France has access to better healthcare than India. India has limited access to healthcare. The population of France has greater access to agricultural products necessary for survival than India
(carrying capacity, malnutrition, starvation). The population of India has less access to agricultural products necessary for survival than France
(carrying capacity, malnutrition, starvation). France has better access to clean water (sanitation) than India. India has limited access to clean water (sanitation). Other acceptable responses

2012 Science 144
—RELEASED ITEM—
3-Point Rubric: Score 3 The response describes a difference in individuals of reproductive age, a difference in the birthrate, and identifies a factor that may contribute to differences in longevity. Score 2 The response describes a difference in individuals of reproductive age and a difference in the birthrate, but fails to or misidentifies a factor that may contribute to differences in longevity.
-or- The response describes a difference in individuals of reproductive age and identifies a factor that may contribute to differences in longevity, but fails to or incorrectly describes a difference in the birthrate.
-or- The response describes a difference in the birthrate and identifies a factor that may contribute to differences in longevity, but fails to or incorrectly describes a difference in individuals of reproductive age. Score 1 The response describes a difference in individuals of reproductive age, but fails to or incorrectly describes a difference in the birthrate and fails to or misidentifies a factor that may contribute to differences in longevity.
-or- The response describes a difference in the birthrate, but fails to or incorrectly describes a difference in individuals of reproductive age and misidentifies a factor that may contribute to differences in longevity.
-or- The response identifies a factor that may contribute to differences in longevity, but fails to or incorrectly describes a difference in the individuals of reproductive age and in the birthrate. Score 0 The response provides little or no correct information. Strand V: Genetics, Evolution and Biodiversity Expected Performance: D INQ.8 Use mathematical operations to analyze and interpret data, and present relationships between variables in appropriate forms.
2012 Science 145
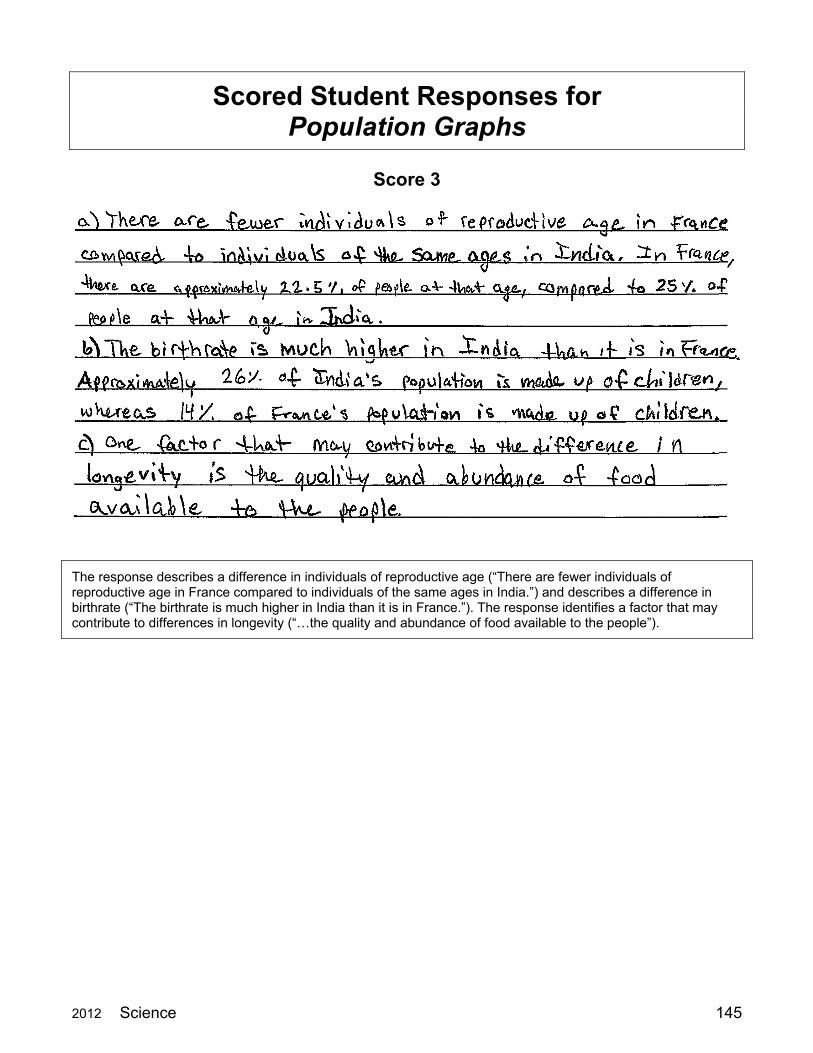
Scored Student Responses for Population Graphs
Score 3
The response describes a difference in individuals of reproductive age (“There are fewer individuals of reproductive age in France compared to individuals of the same ages in India.”) and describes a difference in birthrate (“The birthrate is much higher in India than it is in France.”). The response identifies a factor that may contribute to differences in longevity (“…the quality and abundance of food available to the people”).

2012 Science 146
Scored Student Responses for Population Graphs
Score 3
The response describes a difference in individuals of reproductive age (“In France the amount of people in the reproductive stage is very stable and even while in India as the people get older in the reproductive stage there are less and less of them.”) and describes a difference in birthrate (“…India’s birthrate is much higher than France’s…”). The response identifies a factor that may contribute to differences in longevity (“France…[has] a clean water system as well as many new technologies in medicine that India does not have.”).
2012 Science 147
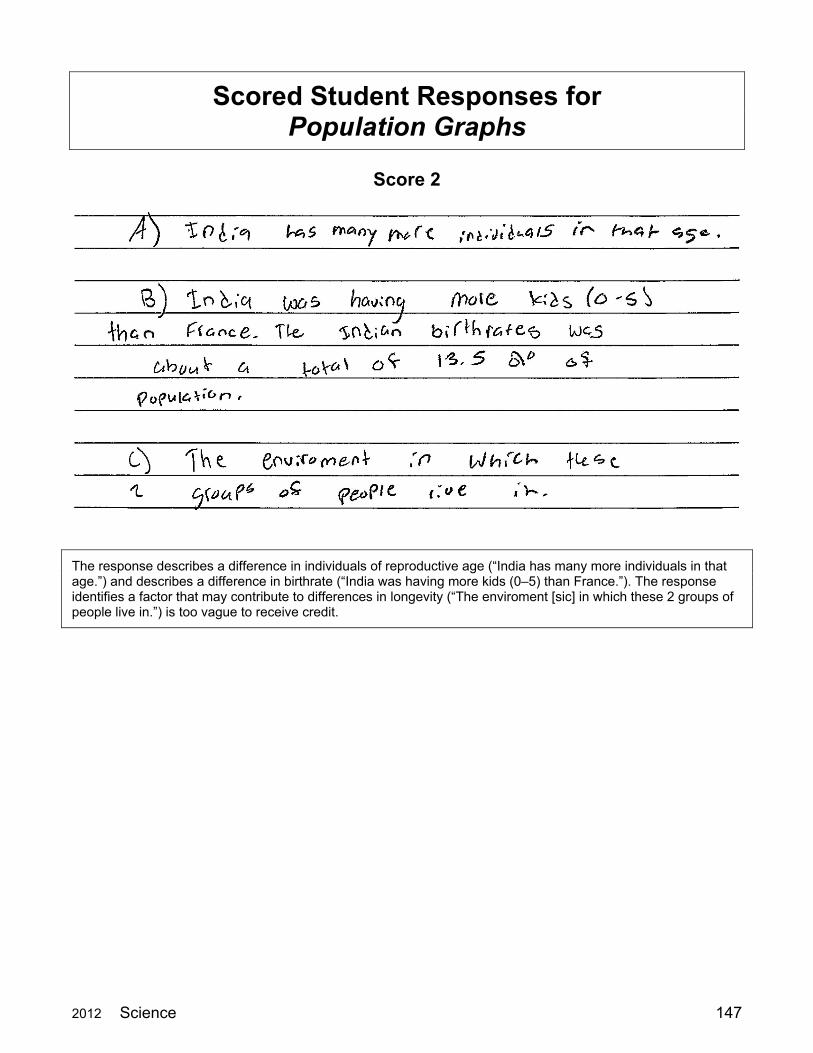
Scored Student Responses for Population Graphs
Score 2
The response describes a difference in individuals of reproductive age (“India has many more individuals in that age.”) and describes a difference in birthrate (“India was having more kids (0–5) than France.”). The response identifies a factor that may contribute to differences in longevity (“The enviroment [sic] in which these 2 groups of people live in.”) is too vague to receive credit.

2012 Science 148
Scored Student Responses for Population Graphs
Score 2
The response describes a difference in individuals of reproductive age (“…that India’s numbers got gradually smaller as the people got older. Frances [sic] numbers were more random.”) and describes a difference in birthrate (“Also, the birthrate of India is much higher than of France.”). The response fails to identify a factor that may contribute to differences in longevity.

2012 Science 149
Scored Student Responses for Population Graphs
Score 1
The response describes a difference in individuals of reproductive age (“In France there were the same amount of males and females from 15–45. In India there were more males and females that were younger than older.”). However, the description of the difference in birthrate merely repeats numbers from the chart. The response misidentifies a factor that may contribute to differences in longevity (“In India more people are born and start to leave as they get older whereas in France the population stays constant and people stay.”).

2012 Science 150
Scored Student Responses for Population Graphs
Score 1
The response describes a difference in individuals of reproductive age (“There seem to be many more 15–45 year olds in India than in France.”) but incorrectly describes a difference in the birthrate (“The birthrate in India is much less steady in India whereas in France it is more constant.”). The response identifies a factor that contributes to differences in longevity but is too general. A brief description of carrying capacity should be included to receive credit.

2012 Science 151
Scored Student Responses for Population Graphs
Score 0
This response provides no correct information. The response provides an insufficient description of a difference in individuals of reproductive age (“both decrease”) and incorrectly describes that there is an increase in birthrate for both countries. In addition, the response incorrectly identifies a factor that may contribute to differences in longevity (“The percentages”).
2012 Science 152
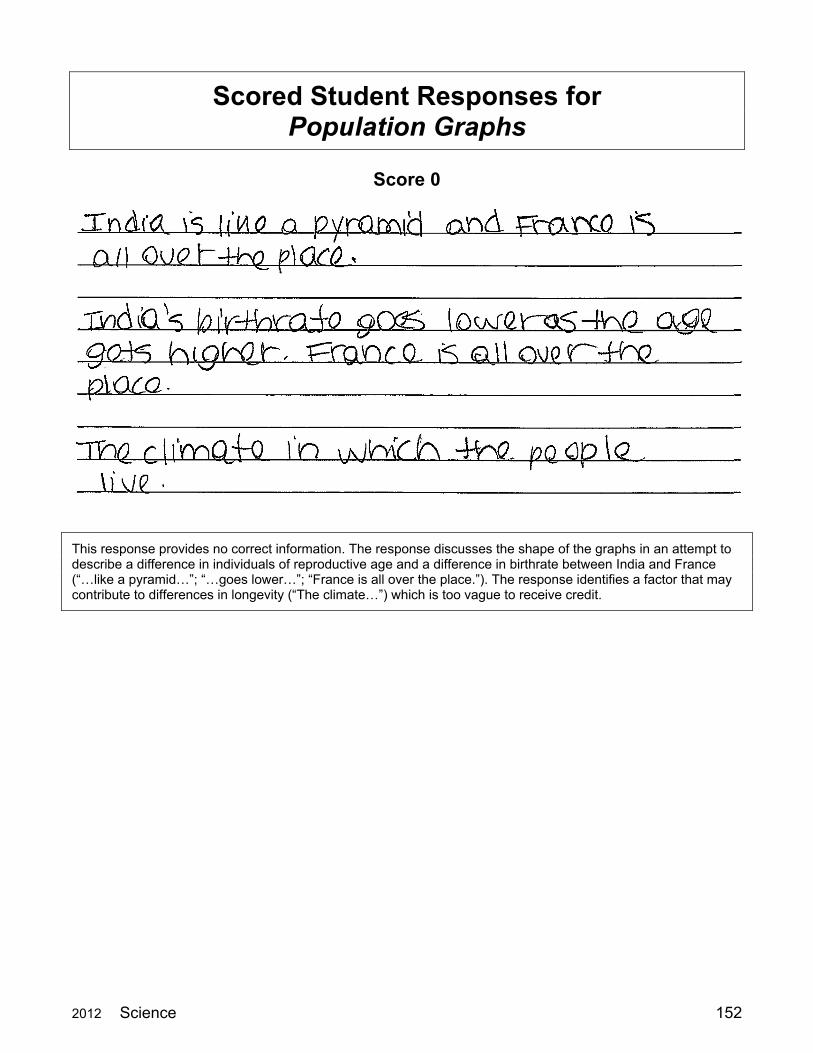
Scored Student Responses for Population Graphs
Score 0
This response provides no correct information. The response discusses the shape of the graphs in an attempt to describe a difference in individuals of reproductive age and a difference in birthrate between India and France (“…like a pyramid…”; “…goes lower…”; “France is all over the place.”). The response identifies a factor that may contribute to differences in longevity (“The climate…”) which is too vague to receive credit.

2012 Science 153
—RELEASED ITEM—
CAPT Science Multiple-Choice Items
Red Cabbage pH Indicator Investigation
SC10P19XCSXXQX09XXXXX
Red cabbage contains a water-soluble pigment. In a highly acidic solution, the pigment turns bright red, and in a moderately acidic solution, it turns pinkish. In a highly basic solution, the pigment turns yellow, and in a moderately basic solution, it turns bluish. A student makes a pH indicator from red cabbage that has a reddish-purple color with a pH of approximately 7. The student pours the same amount of the cabbage solution into each of four different beakers. He then adds a different household solution to each of the four beakers until a color change is obtained. His results are shown in the table below.
Household Solution Color of Mixture lemon juice bright pink club soda light pink
window cleaner light blue drain cleaner greenish-yellow
The student finds the following chart online from someone else’s cabbage pH indicator investigation.
pH 2 4 6 8 10 12 Color red pink purple blue green yellow
SC10P19XCS12QX0919942
1. Based on the information in the passage, which household solution has the lowest pH?
a. club soda
b. lemon juice
c. drain cleaner
d. window cleaner
Strand II: Chemical Structures and Properties
Expected Performance: D 12. Explain the chemical composition of acids and bases, and explain the change of pH in neutralization reactions.

2012 Science 154
—RELEASED ITEM—
SC10P19XCS12Q90919972
2. Comparing his results to the chart above, what logical conclusion can the student make regarding the substances he tested?
f. Lemon juice has a pH between 0 and 2.
g. Drain cleaner has a pH between 10 and 12.
h. Window cleaner and club soda are both neutral solutions.
j. Window cleaner can be used to completely neutralize drain cleaner.
Strand II: Chemical Structures and Properties
Expected Performance: D INQ.9 Articulate conclusions and explanations based on research data, and assess results based on the design of the investigation. SC10P19XCS12Q40919952
3. What should be held constant in the student’s investigation to make sure he obtains valid results?
a. the pH of the household solutions that are tested
b. the amount of household solution placed in each container
c. the brand of the household solutions added to the cabbage pH indicator
d. the final color of the cabbage pH indicator after the household solutions are added
Strand II: Chemical Structures and Properties
Expected Performance: D INQ.4 Design and conduct appropriate types of scientific investigations to answer different questions.

2012 Science 155
—RELEASED ITEM—
CAPT Science Multiple-Choice Items
Electromagnets
SC10P72XETXXQX08XXXXX
A simple electromagnet can be constructed using a battery, a piece of insulated wire, and some kind of iron core, such as a nail. SC10P72XET06QX0810502
4. When the current is turned off in an electromagnet, the _____________.
f. battery short-circuits
g. magnetic field is weakened
h. wire gains a positive charge
j. core becomes more magnetic
Strand I: Energy Transformations
Expected Performance: D 6. Describe the relationship between current and magnetism. SC10P72XET04Q40810513
5. When an electrical current is flowing through an electromagnet, it encounters resistance. The resistance in the electromagnet can be reduced by _____________.
a. using a battery with lower voltage
b. removing the core from the looped wire
c. using a thicker wire of the same material
d. connecting both ends of the wire to the negative terminal
Strand I: Energy Transformations
Expected Performance: D INQ.4 Design and conduct appropriate types of scientific investigations to answer different questions.

2012 Science 156
—RELEASED ITEM—
CAPT Science Multiple-Choice Items SC10P72XET04QX0810543
6. Adding a second battery to an electromagnet will _____________.
f. decrease the resistance in the wire
g. decrease the magnetism in the wire
h. increase the current flowing through the wire
j. increase the amount of current needed to magnetize the wire
Strand I: Energy Transformations
Expected Performance: D 4. Explain the relationship among voltage, current, and resistance in a simple series circuit.