capsa - · pdf file · 2016-01-25small-scale farming has several advantages in...
TRANSCRIPT

Working Paper No. 108
CAPSACentre for Alleviation of Poverty through Sustainable Agriculture
Market Participation of Smallholder Agricultural Households in
Papua New Guinea
By Upali Wickramasinghe, Norah Omot, Arnold D. Patiken, and Joshua Ryan

ESCAP is the regional development arm of the United Nations and serves as the main economic and social development centre for the United Nations in Asia and the Pacific. Its mandate is to foster cooperation between its 53 members and 9 associate members. ESCAP provides the strategic link between global and country-level programmes and issues. It supports Governments of countries in the region in consolidating regional positions and advocates regional approaches to meeting the region’s unique socioeconomic challenges in a globalizing world. The ESCAP office is located in Bangkok, Thailand. Please visit the ESCAP website at www.unescap.org for further information.
CAPSA-ESCAPThe Centre for Alleviation of Poverty through Sustainable Agriculture (CAPSA) is a subsidiary body of UNESCAP. It was established as the Regional Coordination Centre for Research and Development of Coarse Grains, Pulses, Roots and Tuber Crops in the Humid Tropics of Asia and the Pacific (CGPRT Centre) in 1981 and was renamed CAPSA in 2004.
Objectives• Enhanced national capacity for socioeconomic and policy research on
sustainable agriculture for poverty reduction and food security
• Enhanced regional coordination and networking to successfully scale up and scale out research findings that have implications for policy design and implementation related to sustainable agriculture and rural development
• Enhanced capacity of policymakers and senior government officials to design and implement policies to achieve rural development, poverty reduction and food security through sustainable agriculture in Asia and the Pacific
The shaded areas of the map indicate ESCAP members and associate members.

Working Paper No. 108
CAPSACentre for Alleviation of Poverty through Sustainable Agriculture
Market Participation of Smallholder Agricultural Households in
Papua New Guinea
Upali Wickramasinghe
Regional Adviser, CAPSA-ESCAP
Norah Omot Director
Enabling Environment Programme, NARI
Arnold D. Patiken Junior Economist
Enabling Environment Programme, NARI
Joshua Ryan Senior Economist
Enabling Environment Programme, NARI

Market Participation of Smallholder Agricultural Households in Papua New Guinea
CAPSA Working Paper No. 108
CAPSA-ESCAPJalan Merdeka 145, Bogor 16111Indonesia
Copyright © CAPSA-ESCAP 2014All rights reservedPrinted in IndonesiaISBN 978-979-9317-78-0
Cover photo by: Upali Wickramasinghe
Cover design by: Fransisca A. Wijaya
The designations employed and the presentation of material in this publication do not imply the expression of any opinion whatsoever on the part of the Secretariat of the United Nations concerning the legal status of any country, territory, city or area of its authorities, or concerning the delimitation of its frontiers or boundaries. The content and views expressed in this publication are those of the authors and not necessarily reflects the views or policies, or carry the endorsement of the United

iii
Table of Contents
Page List of Tables ......................................................................................................... v
List of Figures ......................................................................................................... vii
List of Appendices ........................................................................................................ ix
List of Abbreviations ..................................................................................................... xi
Foreword ......................................................................................................... xiii
Executive Summary ..................................................................................................... xv
1. Introduction ......................................................................................................... 1
2. Agriculture in the Economy and Smallholder Agriculture ....................................... 5
2.1 Country and the economy ......................................................................... 5
2.2 Current state of agriculture ....................................................................... 6
2.2.1 Agriculture in the national economy ........................................ 6
2.2.2 Agricultural trade ..................................................................... 8
2.2.3 Land allocation ........................................................................ 9
2.2.4 Agricultural production ............................................................. 9
2.2.5 Farming practices and livelihoods ........................................... 12
2.2.6 Smallholder market participation ............................................. 13
2.3 Agricultural policy environment ................................................................. 14
2.4 Agriculture’s potential ............................................................................... 14
3. Explaining Market Participation of Smallholder Farm Households ........................ 17
3.1 Exchange economy and production specialization ................................... 17
3.2 Other explanations .................................................................................... 19
3.3 Analytical framework ................................................................................. 20
4. Data and Description of Production and Marketing Environments ........................ 23
4.1 Introduction ............................................................................................... 23
4.2 Data collection .......................................................................................... 23
4.3 Limitation and scope ................................................................................. 25
4.4 Description of the production environment ............................................... 26

iv
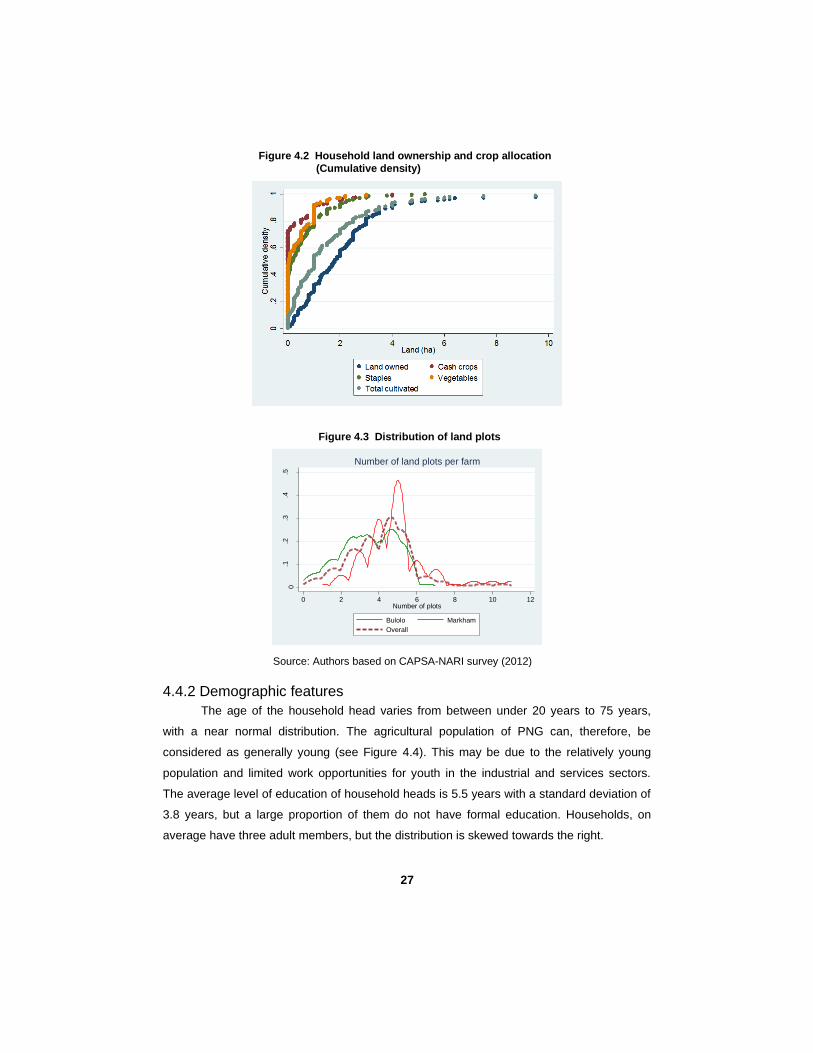
4.4.1 Land ownership, usage and within-farm land fragmentation ... 26
4.4.2 Demographic features ............................................................. 27
4.4.3 Agricultural inputs and services ............................................... 28
4.4.4 Agricultural capital, access to irrigation and improved land .... 29
4.4.5 Crop choice ............................................................................. 30
4.5 Marketing arrangements ........................................................................... 32
4.6 Nature of crop sales .................................................................................. 33
5. Determinants of Farm Sales .................................................................................. 35
5.1 Estimating the model with censored data ................................................. 35
5.2 Empirical model variables ......................................................................... 36
5.3 Regression results of farm household sales ............................................. 38
5.3.1 Land ownership and land fragmentation ................................. 39
5.3.2 Demographic characteristics ................................................... 41
5.3.3 Agricultural inputs and services ............................................... 41
5.3.4 Agricultural capital and equipment .......................................... 42
5.3.5 Distance to markets and market participation costs ................ 42
5.3.6 Crop diversification and market participation .......................... 44
5.3.7 Household consumption and market participation .................. 45
6. Summary, Conclusions and Recommendations .................................................... 47
7. References ......................................................................................................... 53

v
List of Tables
Page
Table 2.1 Area harvested and production ............................................................. 10
Table 4.1 Agricultural capital and equipment .......................................................... 30
Table 5.1 Summary regression results of farm sales of cash crops, staples,
vegetables, and total sales ..................................................................... 38

vii
List of Figures
Page
Figure 2.1 Agriculture in Papua New Guinea in the world context ............................ 7
Figure 2.2 Composition of agricultural exports - 2010 (value in 1000$) .................... 8
Figure 2.3 Composition of agricultural imports - 2010 (value in 1000$) .................. 8
Figure 2.4 Land use pattern - 2010 .......................................................................... 9
Figure 2.5 Agriculture production indices 1962-2010 (2004-2006=100) .................. 10
Figure 2.6 Composition of agricultural production and value (2010) ....................... 11
Figure 4.1 Conceptual framework for data analysis .................................................. 25
Figure 4.2 Household land ownership and crop allocation (Cumulative density) ...... 27
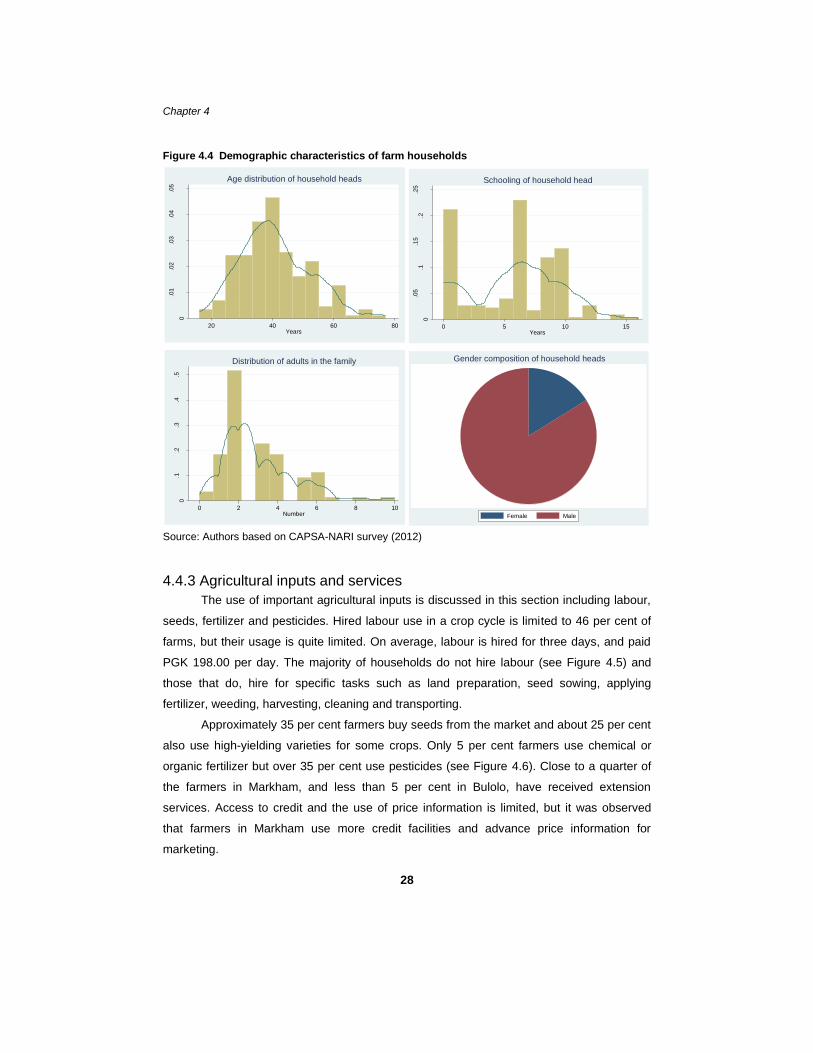
Figure 4.3 Distribution of land plots ......................................................................... 27
Figure 4.4 Demographic characteristics of farm households ................................... 28
Figure 4.5 Labour use in agriculture ........................................................................ 29
Figure 4.6 Inputs used and access to credit and information .................................. 29
Figure 4.7 Land ownership and crop diversification .................................................. 31
Figure 4.8 Household crop choice ............................................................................. 31
Figure 4.9 Crop marketing by main markets ............................................................ 32
Figure 4.10 Crop marketing by main buyers ............................................................. 33
Figure 4.11 Household sales income by crop type .................................................... 34
Figure 4.12 Household crop sales by type and district .............................................. 34
Figure 5.1 Land ownership and farm sales among smallholders .............................. 40
Figure 5.2 Within-farm land fragmentation ................................................................ 40
Figure 5.3 Farm-to-market distances and farm sales .............................................. 43
Figure 5.4 Farm-to-market distance, land and crop diversification and farm sales ... 45
Figure 5.5 Family consumption and sales ............................................................... 46

ix
List of Appendices
Page
Appendix 1 Map of the study areas ............................................................................. 57
Appendix 2 Summary statistics: all farms .................................................................... 58
Appendix 3 Summary statistics: Farms that own less than 2 hectares of land ............ 59
Appendix 4 Summary statistics: Farms that own more than 2 hectares of land .......... 60
Appendix 5 Regression results of farm sales of cash crops, staples, vegetables,
and total sales .......................................................................................... 61

xi
List of Abbreviations
ADB Asian Development Bank
CDF Cumulative Density Function
FPDA Fresh Produce Development Authority
GDP Gross Domestic Product
GNI Gross National Income
IFAD International Fund for Agricultural Development
LLG Local Level Government
MLE Maximum Likelihood Estimate
NARI National Agricultural Research Institute
OLS Ordinary Least Squares
PHR Poverty Headcount Ratio
PNG Papua New Guinea
WB World Bank

xiii
Foreword
Ernst F. Schumacher, in his much celebrated book “Small Is Beautiful: Economics
as if People Mattered”, first published in 1973, convincingly argued that there is virtue in
smallness, and that the appropriate scale of an activity must be the cornerstone of
economics. His viewpoint is more relevant than ever. Today, small-scale farming is both
vilified and praised, but it will certainly continue for a while. There are at least 500 million
small farmers in the world, who cultivate a large share of global agricultural land and
produce about 80 per cent of the world’s food. Paradoxically, they are also the poorest and
most food-insecure.
Small-scale farming has several advantages in land-scarce and labour-abundant
countries in Asia and the Pacific. Enhanced agricultural productivity triggers growth and
facilitates a broad-based structural transformation, reducing poverty among the rural poor
who depend on agriculture as their main livelihood. Food production by the rural poor can
be a powerful tool to address food insecurity and malnutrition among communities living
further away from markets. Incomes generated by smallholder farmers have a high
likelihood of being spent on locally produced goods and services, stimulating employment-
intensive growth in the local non-farm economy. Productivity growth in smallholder
agriculture encourages farmers to move into productive agriculture and slows migration out
of the sector, reducing the unsustainable growth of urban centres without commensurate
growth in productive employment.
But, how do we enhance market participation and growth in agricultural productivity
to break ‘poverty traps’? Building physical infrastructure such as roads and ports,
information and communications channels connecting small farms to markets, and
institutions to reduce transaction costs and minimize risks, are essential to enhance the
farmer’s access to the market. However, the precise nature of the infrastructure and
institutions enabling smallholders to participate effectively in local, regional and national
markets varies significantly across countries and even within the same country. Country-
specific studies are necessary to identify precise mechanisms and channels, design public
policy interventions and deepen our understanding of the economic, social and political
contexts of market participation by small farmers.
This working paper fills a lacuna with its study of Papua New Guinea. It is hoped this
will provide useful insights and guidance on fundamental public policy instruments to break

xiv
the ‘cycle of poverty, hunger and low agricultural productivity’ that traps smallholder farm
households in developing countries. Last, but not least, I hope this study will help identify
and implement policies targeting smallholder agriculture in Papua New Guinea, enabling
the country to move towards sustainable development and realizing national development
goals set out in its Vision 2050.
December 2014 Katinka Weinberger Director CAPSA-ESCAP

xv
Executive Summary
Recent international and national development dialogues on poverty, food insecurity
and sustainable development including the Rio+20 summit have emphasized the need to
integrate smallholder farmers, marginalized and vulnerable communities dependent on
agriculture, with local, national and regional markets as a welfare enhancing strategy. This
emphasis stems from the understanding that market participation allows farm households
to: enhance resource-use efficiency through the higher division of labour, comparative
advantage and larger markets; benefit from increasing returns to scale and increased
functional operations of agribusiness ventures; reduce unit costs of production, processing
and sale of new and value added products; benefit from dynamic technical change in
agricultural production and processing; and move into productive agriculture rather than
moving out of agriculture that limits capacity for realizing broad-based structural
transformation. Recent research has shown that farmers increase market participation
when the net benefits of participating in markets outweigh the costs.
This working paper presents the results of an analysis of lowland smallholder
agriculture in Papua New Guinea. The Vision 2050 document of the Government of Papua
New Guinea aims to reduce the current heavy dependency of the economy on the mining
industry and expand the contribution of the agriculture, forestry and fisheries sectors. The
Papua New Guinea Development Strategic Plan 2011-2030 calls for converting 70 per cent
of subsistence farmers into small- and medium-scale agricultural enterprises (DNPM, 2010).
The government policy emphasizes the introduction of efficient land administration by
allowing land owners to profit from their land along with the development of roads and
supply chains linking producers with markets and expanding extension services as key
strategic thrusts. This paper presents the results of a study based on a small household
survey conducted in the Morobe province of Papua New Guinea in 2012, which the authors
believe, offers useful insights into the nature of smallholder agriculture in the lowland
districts of the country. It identifies some channels that could contribute to integrating
smallholder agricultural households with local, national and regional markets.
The paper calls for public policies to enable farmers to absorb production and
marketing risks and reduce farm-to-market transaction costs which, in turn, will give farmers
incentives to invest in agriculture, enhancing agricultural productivity to produce marketable

xvi
surpluses and participate effectively in markets to enhance their welfare. The specific
results and recommendations of the study are summarized under the following four areas.
First, the study finds that there is high prevalence of within-farm land fragmentation
among smallholders and others alike and it is positively correlated with farm sales. This
deprives them of the opportunity of employing economies of scale in production. But the
arrangement is optimal within the given agroecological and socioeconomic conditions, and,
hence, merely increasing land rights through land alienation and other methods, is unlikely
to change agricultural practices and market participation. Establishing land rights should go
hand in hand with creating conducive conditions for farmers to invest in enhancing
agricultural productivity.
Second, farms were found engaged in extensive crop diversification, a practice that
does not allow farmers to produce a sufficient marketable surplus in any given commodity.
While crop diversification allows farmers to spread risks, they forgo considerable potential
profit from more specialized farming operations. The practice indicates the inability of
farmers to absorb risks and the high transaction costs of market participation. Thus,
addressing the fundamental issue of risk management and creating a system where
farmers can absorb more risks, will enable smallholders to move towards more
commercialized operations and enhance productivity to produce a marketable surplus.
Third, smallholder agricultural marketing arrangements are still informal and in a
rudimentary state of development. Because of high transportation costs, farmers tend not to
engage in markets and when they do, sell small quantities, mostly directly to consumers in
temporary roadside markets, earning meagre incomes. Nevertheless, this is an optimal
arrangement given their situation and farmers are unlikely to change their production and
marketing behaviour until the underlying environment is improved. Attempts to encourage
better market participation must be coordinated with improvements in their production and
risk environments so that farmers not only produce more but use their meagre resources
more efficiently, producing fewer but high-value crops and engage in markets.
Fourth, although not conclusive, the study finds a highly significant association
between the level of food and non-food consumption and farm sales. A key motivation for
farmer participation in markets is the need to enhance their consumption and access to
services, especially of commodities that cannot be produced at home and other essential
services, suggesting that farm households are trying their best to improve their living
standards. Improving the agricultural production and marketing environments is more likely
to enhance food security and farmer welfare than anything else.

1
1. Introduction
The outcome document titled “The Future we want” of the United Nations
Conference on Sustainable Development held in 2012, also known as Rio+20 (United
Nations, 2012) urged nations to enhance the welfare of smallholders1, subsistence farmers
and marginalized groups such as women and vulnerable communities dependent on
agriculture, by developing appropriate policies and strategies to integrate them with local,
regional and national markets. Several international conferences have issued declarations
and calls for urgent action (G8, 2009). The renewed interest in smallholder agriculture stems
from a realization that the participation of marginal communities in markets is a prerequisite
for enhancing their welfare. Enhanced market participation allows farmers, fishers and other
marginalized groups to realize their comparative advantages in agricultural production
activities (Timmer, 2005) and exchange marketable surplus for purchasing products and
services that cannot be produced at home. Dynamic technical change in agriculture and
production specialization is another factor contributing to enhancing opportunities for rural
communities to move from subsistence agriculture towards more specialized, market-
oriented commercial operations (Chenery et al., 1986). Market integration also encourages
rural agrarian households to move into productive agriculture rather than moving out of
agriculture, thereby contributing to agricultural and rural development (Mazumdar, 1987)
and broad-based structural transformation (ADB, 2013).
Although the benefits of smallholder market participation are widely accepted, there
is little consensus on strategies for facilitating their integration into local, regional or national
markets. This makes it imperative to identify plausible channels to facilitate their market
entry and participation, and offer incentives for them to seek improved market opportunities.
Enhanced understanding of such channels will also allow governments and international
agencies to implement strategies and programmes to remove bottlenecks in market
participation. Public policy that has been advanced over two centuries suggests that
improving market access opportunities for smallholders will require addressing two
fundamental factors: an incentives structure for smallholders to seek more opportunities for
specialization and enhancing their productivity, and mechanisms to reduce market
participation costs.
1 World Bank (2003) defines smallholders as farmers with a low asset base and operating less than two hectares of cropland. IFAD (2011) defines them as farmers with small landholdings and associated characteristics including dependence mostly on household labour for production and low use of technology.

Chapter 1
2
There are a number of studies on market participation of smallholders in Africa, but
country-level empirical studies in Asia and the Pacific are limited. Yet, the Asia-Pacific
region is home to 87 per cent of the world’s 500 million small farms with less than 2
hectares (Thapa and Guiha, 2011). While agrifood systems are evolving rapidly in Asia and
Latin America, and emerging in Africa, the diffusion of transformation is highly correlated
with connection to urban growth nodes (Reardon and Timmer, 2014). Farm households in
the ‘hinterlands’ continue to be in the stage of semi-subsistence agriculture, marked by a
slower process of transformation.
Identifying the binding constraints to integration of these marginal communities with
local, regional and national markets should be a policy priority within the post-2015
development agenda. This working paper presents the results of a study undertaken in
Papua New Guinea, which offers a unique case of a marginal community that is also ‘agro-
climatologically’ challenged. The paper summarizes current theoretical and empirical
understanding of smallholder market participation, presents a model that explains the nature
of smallholder market participation along with a procedure for estimating such a model
where data availability is limited, and empirical results of an analysis conducted on a data
set that CAPSA collected in 2012 in the Morobe province in PNG.
The paper hypothesizes that participation of smallholder farm families in agricultural
markets depends on its net benefits. If the cost of market participation rises (reduces) in
relation to benefits, measured in consumption, households will reduce (increase) the
quantity of commodities traded and increase (decrease) the range of commodities produced
within the farm to compensate for the lost consumption. The costs of market participation
are hypothesized to be dependent on distance to markets, transport and transaction costs
(searching, negotiation and organizing production and transportation). The benefits of
market participation originate from households’ capacity to enhance the bundle of
commodities available for consumption, made possible by exchanging surplus production
for non-home produced commodities and services. It also saves the time taken up by
unproductive agricultural activities which can, instead, be used for more productive and
income-generating, activities or for learning new production and processing technologies.
The paper also hypothesizes that a given household first decides whether or not to produce
for markets, and once in the market, how much to sell. Thus, the household decision-
making process is sequential, which some call a ‘double hurdle’ decision-making process.
Chapter 2 discusses the role of agriculture in the economy of PNG, the status of
smallholder agriculture and the national agricultural policy environment. Chapter 3 reviews

3
literature on market participation of smallholder farm households with particular focus on the
current state of knowledge and presents an analytical framework. Chapter 4 describes
smallholder production and marketing arrangements and the nature of crop sales in PNG
using data from the CAPSA survey 2012 carried out in Morobe province. Chapter 5 presents
the results of the data analysis and Chapter 6 summarizes a set of recommendations.
5
2. Agriculture in the Economy and Smallholder
Agriculture
2.1 Country and the economy
Papua New Guinea is a country with harsh and rugged terrain, and has a total land
area of 470,000 km2, made up of the mainland and some 600 large and small islands.
Nearly two-thirds of the land area comprises a vast chain of overlapping mountain ranges
located in the middle of the country, with peaks of over 4,000 m and steep mountain ranges
and valleys. Swamps are predominant in the south-western part of the country. Some areas
have excessive rainfall. As a result, 70 per cent of land has never been used for agriculture.
Only 7 per cent of the total land area is classed as high or of very high quality and a further
20 per cent is of moderate quality for growing crops. PNG was estimated to have a
population of 7.4 million people in 2013 (ADB, 2014) and the rate of population growth was
estimated at 2.13 per cent per annum (World Bank, 2014). The best agricultural lands in the
country are highly populated (Bourke et al., 2009).
By 2050, according to Vision 2050, PNG should realize its full economic potential,
reduced dependence on the mining industry and expanded the capacity of agriculture and
manufacturing industries. Moving in that direction will require credible strategies and
programmes to develop the economy and integrate the vast majority of people who depend
on agriculture, in particular subsistence agriculture. Understanding current economic
conditions will make it possible to devise strategies and programmes that would lead the
economy towards this noble goal.
In 2010, the per capita gross national income (GNI) in PNG was $1,300. The
relatively high per capita income is a reflection of the high income earned through royalties
from extraction industries. However, the fact that 35.8 per cent of the population was living
on less than $.25 a day in 1996 (World Bank, 2014), implies that the national per capita
income figure hides the true nature of poverty and destitution among the lower income
sections of society. In addition, to meet food security requirements of a population more
than twice the current size and probably affluent, the economy must provide suitable
employment opportunities and produce adequate food in a sustainable way. The dominance
of agriculture in livelihoods implies that PNG will need to evolve a strong agricultural sector
to meet the food security and employment generation requirements of the country.
Chapter 2
6
According to 2009 estimates, the Poverty Headcount Ratio (PHR) at national poverty
line is 39.9 per cent, whereas the PHR at rural poverty line is 41.6 per cent and the PHR at
urban poverty line is 29.3 per cent. This indicates that rural poverty is generally higher than
the national average and significantly higher than urban poverty. At the current rate of
population growth of 2.8 per cent during 2009-2011, PNG will have 20 million people by
2050. Most rural families are small and live in scattered communities or hamlets, dependent
on subsistence farming, supplemented by cash income earned from tree and food crops,
livestock and non-agricultural activities. Some estimates suggest that 18 per cent rural
people are extremely poor while 42 per cent are marginally poor. The majority of the cash
crop producers are marginally poor or not so poor.
2.2 Current state of agriculture
2.2.1 Agriculture in the national economy
The total size of the national economy of PNG in 2013 stood at Kina 34,611 million in
2013 (ADB, 2014) or $15,289 million. Agriculture contributes 27 per cent of the GDP,
industry 45 per cent and services 28 per cent. The contribution of the agricultural sector in
the national economy can be significantly higher if all products and services produced and
informally traded are considered in the national accounting system. Some estimates
suggest that agriculture’s contribution would be as high as 37 per cent if informal production
and trading were considered. Agriculture is the major source of cash income for most
villagers. Agriculture also provides employment to a large section of the population as
traders, transporters and retailers. Agriculture is estimated to provide Kina 200 million
annually to rural village households (Bourke et al., 2009).
According to the World Bank Development Indicators database 2014, the value
added as a percentage of GDP in agriculture2 was 37 per cent in 2014 whereas
employment in agriculture as a percentage of total employment in 20003 was 72 per cent.
Assuming that employment in agriculture as a percentage of total employment remains the
same4, agriculture currently employs over 2 million people directly. A large share of
employment in agriculture combined with a moderate share of agriculture in GDP implies a
low level of value addition per worker.
2 The ADB Key Indicators for Asia and the Pacific 2014 reports the share of agriculture in GDP at producers’ prices in 2013 as 27.1 per cent. 3 Latest data available for this indicator. 4 Given that the structure of the economy has not changed significantly within the last 10 years, it may not be inaccurate to assume that this rate remains close to the value for the year 2000.

7
Over 85 per cent of the PNG population lives in rural areas and depends on
subsistence agriculture, forests and rivers for their basic food needs. Fresh food crops sold
in informal open markets provide 21.7 per cent of income and involve 94 per cent of the
total rural population. Arabica coffee is the main income earner, providing 33 per cent of
rural income and involving 44.5 per cent of the rural population. This is followed by cocoa,
providing 10.9 per cent of income and employing 26.7 per cent of the population; betel nut
and betel pepper, providing 9.9 per cent of income and employing 35.2 per cent of the
population; and copra, providing 8.1 per cent of income and employing 16.6 per cent of the
population. All other crops, including oil palm, provide less than 3 per cent of income to rural
people (Allen et al., 2009).
The share of agriculture in GDP has been around 35 per cent of GDP, but the
employment share of agriculture has been even higher, estimated to be still between 75 and
80 per cent (see Figure 2.1). This dichotomy – small share of agriculture in GDP with a high
share of agricultural employment in total employment - means that agriculture continues to
offer employment and livelihoods to the great majority of the people but its share in GDP
does not, and cannot, support them. This results in the greater majority of the people in
agriculture being poorer even by national standards.
Figure 2.1 Agriculture in Papua New Guinea in the world context
Source: Authors based on World Bank (2014)
PapuaNewGuinea
AgricultureshareofGDP
Agriculturalemploymentintotal
employment
PapuaNewGuineay=759671x-5.551R²=0.73072
y=1E+07x-6.44R²=0.63832
0
10
20
30
40
50
60
70
80
90
100
4 5 6 7 8 9 10 11 12
Agriculturein
GDPandagriculturalemploym
entintotal(%)
PercapitaGDP(logarithmicscale)

Chapter 2
8
2.2.2 Agricultural trade
Large-scale corporations, often multinational companies, mostly carry out palm oil
cultivation in the country, much of the production being exported in bulk in raw form. This is
probably due to the fact that many plantations are owned by multinationals who may find it
economical to process the oil palm further in their overseas facilities. Palm oil has been the
main export commodity in the recent past (see Figure 2.2), but traditional agricultural
products, especially coffee and cocoa still earn almost the same export revenues. Rice,
meat and wheat products dominate imports (see Figure 2.3).
Figure 2.2 Composition of agricultural exports - 2010 (value in 1000$)
Palm oil
Coffee, green
Cocoa beans
Palm kernel oil
Coconut (copra) oil
Rubber Nat Dry
Exports (value in 1000$)
Figure 2.3 Composition of agricultural imports - 2010 (value in 1000$)
Rice
Sheep meat
Wheat
Food Prep Nes
Buckwheat
Beef & Veal
Feed prep.
Sugar Conf.
Beverage Non Alc.
MaltPig meat
Cow milk, whole, fresh
Imports (value in 1000$)
Source: Authors based on FAOSTAT (2004)

9
2.2.3 Land allocation
Out of a total land area of 452,860 km2 in PNG, agricultural land is estimated to be
115,500 km2 consisting of 2,600 km
2 of arable land and 7,000 km
2 of permanent crops
(FAOSTAT, 2014). Agricultural land area is 760 km2, which includes arable land, areas
under permanent crops, permanent pasture and land under market or kitchen gardens and
temporarily fallowed (see Figure 2.4). The area under permanent crops is approximately 60
per cent, which mostly consists of palm oil and tree crops. The arable land area is estimated
at 260,000 hectares, consisting of temporary crops. Arable land area per person is
estimated at 0.04 hectares in 2009.
Figure 2.4 Land use pattern – 2010
Forests
64%
Arable land
1%
Permanent
crops1%
Permanent
meadows and pastures
0%
Other
34%
Source: Authors based on FAOSTAT (2014)
2.2.4 Agricultural production
FAO indices on overall agricultural production, cereals, crops, food crops, livestock
and non-food agricultural production show a boom in non-food agricultural commodity
production from 1970 till after the beginning of the new millennium, but no other sector has
experienced any dynamic change (see Figure 2.5). Production of cereals declined during
the same period, bouncing back at the turn of the century but has not grown fast enough to
generate employment or produce adequate food. Other sectors have stagnated during the
last five decades.

Chapter 2
10
Figure 2.5 Agriculture production indices 1962-2010 (2004-2006=100)
0
20
40
60
80
100
120
140
160
180
1962 1966 1970 1974 1978 1982 1986 1990 1994 1998 2002 2006 2010
Ind
ex v
alu
e (
2004-2
006
= 1
00)
Agriculture Cereals Crops Food Livestock Non Food
Source: Authors based on FAOSTAT (2014)
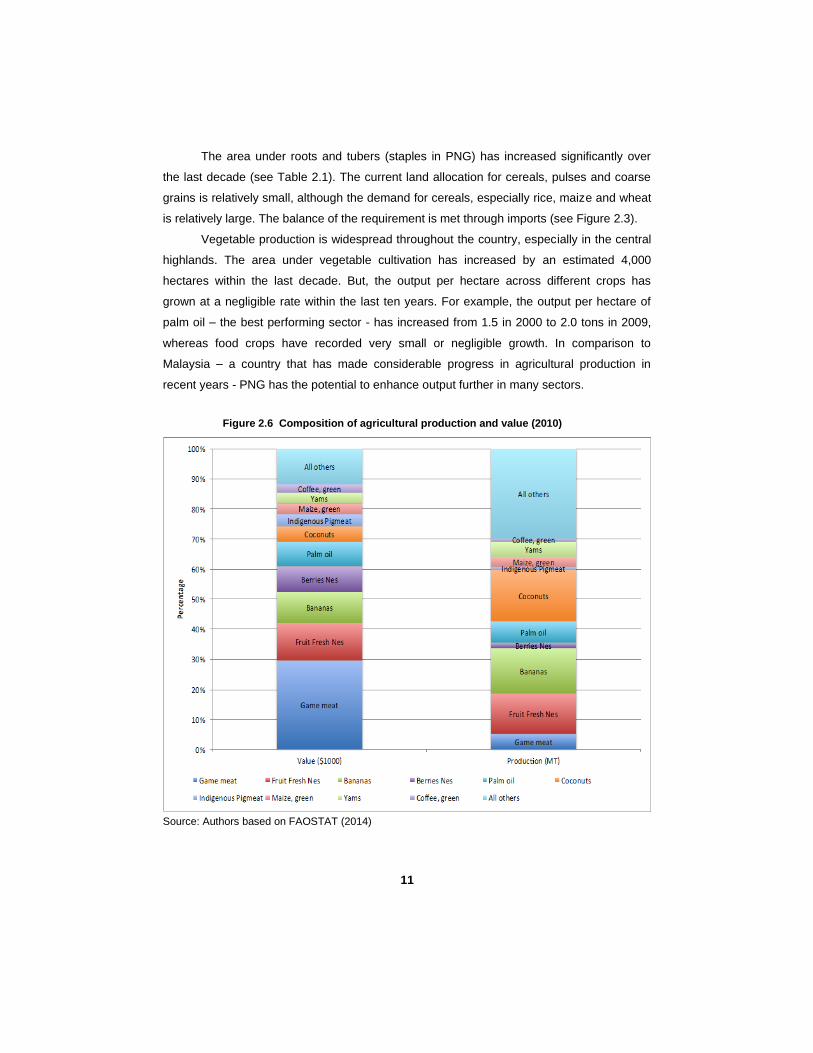
The palm industry’s contribution to the PNG economy is well recognized. It
contributes approximately 10 per cent to agricultural income; traditional industries such as
game meat, fresh fruits, bananas and berries still contribute 60 per cent. The unit price per
ton is the highest for game meat, followed by berries, indigenous pig meat, coffee and palm
oil, in that order. However, coffee still fetches more than twice the price of palm oil per ton.
Thus, traditional agricultural sectors continue to be attractive for investment. Oil crops, fruits,
roots and tubers have dominated agricultural production. While fruits and tubers are
cultivated mostly for domestic consumption, part of the produce is sold in local agricultural
markets, generating some income for households.
Table 2.1 Area harvested and production
Crop type 2000 2009 Output per hectare (tonne)
Area (ha) Production
(tonne)
Area
(ha)
Production
(tonne)
PNG
2000
PNG
2009
Malaysia
2009
Oil crops 332 829 509 560 336 300 684 010 1.5 2.0 4.56
Fruit excl. melon 168 280 1 666 300 210 900 2 076 000 9.9 9.8 11.99
Cereals 2 745 11 300 3 669 15 200 4.1 4.1 3.73
Pulses 5 000 2 500 5 000 2 750 0.5 0.6 NA
Coarse grains 2 466 10 600 3 300 14 400 4.3 4.4 4.9
Vegetables & melon 38 212 473 631 42 244 531 807 12.4 12.6 18.4
Roots and tubers 181 650 1 343 968 224 320 1 698 000 7.4 7.6 9.77
Source: FAOSTAT (2014)
11
The area under roots and tubers (staples in PNG) has increased significantly over
the last decade (see Table 2.1). The current land allocation for cereals, pulses and coarse
grains is relatively small, although the demand for cereals, especially rice, maize and wheat
is relatively large. The balance of the requirement is met through imports (see Figure 2.3).
Vegetable production is widespread throughout the country, especially in the central
highlands. The area under vegetable cultivation has increased by an estimated 4,000
hectares within the last decade. But, the output per hectare across different crops has
grown at a negligible rate within the last ten years. For example, the output per hectare of
palm oil – the best performing sector - has increased from 1.5 in 2000 to 2.0 tons in 2009,
whereas food crops have recorded very small or negligible growth. In comparison to
Malaysia – a country that has made considerable progress in agricultural production in
recent years - PNG has the potential to enhance output further in many sectors.
Figure 2.6 Composition of agricultural production and value (2010)
Source: Authors based on FAOSTAT (2014)

Chapter 2
12
Yam, taro, banana and sweet potato are the main staple food crops. In addition, farm
households cultivate vegetables, fruits and legumes, mostly for home consumption but a
limited quantity is sold for extra income. Bourke et al. (2009) estimate that 94 per cent of
rural villagers engage in such farming. Sago is an important staple, especially in seasonally
flooded areas where the soil and the environment are more suitable for the crop. Some
sago varieties grow in the wild, but other varieties are cultivated. Sweet potato is the most
important root crop in terms of the quantity of production with 2.9 million tons harvested per
year. This accounts for 64 per cent by weight of all staples produced and 34 per cent of all
staples consumed. Tropical and temperate vegetables are also grown, including green leafy
vegetables. Tropical fruits such as pineapple, pawpaw, guava and mango are grown
throughout the country. Many smallholder farmers cultivate cash crops such as coffee,
cocoa, copra, oil palm and betel nut. Smallholders dominate much of commercial crops
production.
Pigs, chicken and cattle are the main livestock, pigs being raised for food and
cultural reasons. An estimated 1.8 million pigs are raised in villages, with relatively smaller
numbers on commercial farms. While 1.5 million chickens are raised every year, production
is mainly by large commercial operations. The cattle population is estimated at 80,000 with
80 per cent commercially maintained and the remainder owned by villagers. Other, less
important livestock raised for meat are ducks, rabbits, sheep and goats (Bourke et al.,
2009).
Agriculture in PNG is of the subsistence or near-subsistence variety in the remote
regions, with a mixture of subsistence and commercial operations elsewhere. The costs of
market participation are often unique to each region, village or even farm household,
depending on social institutions, social norms, legal rules and the technological
environment. Farmers are vulnerable to external shocks caused by weather and market
volatility as well as farm failures. Smallholders are often marginalized, and unable to take
advantage of market opportunities even when market conditions are favourable.
2.2.5 Farming practices and livelihoods
Farming practices in PNG remain basic with limited use of chemical fertilizer and
pesticides, which are, however, applied in tree crop production and vegetables cultivation
for the market. Mechanization is extremely limited and farmers only use simple equipment
such as knives and spades. Labour markets are thin, family labour being primarily used for
farm operations.

13
The yield of staple crops and livestock productivity (feed efficiency and reproduction)
in rural areas is low. The sale of fresh produce is a vital part of smallholders’ livelihood and
cash earnings, especially for those located closer to markets. The fresh produce market is
estimated to be worth $95 million per year5 (Bourke et al., 2009) and demand is anticipated
to increase with rising incomes and the growth of the mining industry. Tubers and roots,
especially sweet potato, taro and yam, sago and banana, provide much of food energy.
Meat from pigs, fish and other animals, coconut and imported vegetable oil are the main
sources of fats.
2.2.6 Smallholder market participation
Smallholders sell their produce through open markets (local municipal outdoor
markets, roadside markets, government or church station markets), and purchase non-
home produced goods (‘store goods’) such as kerosene. Direct marketing is becoming
popular and some smallholders sell to supermarkets, hotels, schools and mines. Some
producers market over long distances through intermediaries, but this involves heavy risks
because of the difficulty of knowing in advance, prices in distant markets and occasional law
and order problems such as armed robberies.
Upland and lowland agriculture differ significantly. Smallholder producers in highland
provinces marketing over long distances, cultivate more temperate fruits and vegetables
such as cabbages, broccoli, carrots and Irish potato. They also ship large volumes of sweet
potato to coastal markets, particularly to Lae, Madang and Port Moresby. Smallholder
producers in the lowland areas mostly cultivate vegetables, tropical fruits, staple crops
(banana, taro and yam), cash crops and cereals. While some farms are located closer to
markets, those in the hinterland and mountainous regions travel longer distances to
markets. Post-harvest handling, processing, storage, transportation and sales are mostly
carried out by family members.
Some researchers have suggested that the marketing behaviour of smallholder
farmers is irrational. One such behaviour pattern discussed by Benediktsson (2002) is the
way farmers lose interest in marketing after long-distance travel, allegedly taking time off to
meet customary and social obligations first, resulting in a considerable loss of income.
Peanut farmers from Markham are also considered to have erratic marketing behaviour
reflected in their loss of interest in marketing at some stage of marketing. Farmers are also
considered to be engaging in marketing only when they need money urgently such as for
5 PGK 250 million per year according to FPDA estimates; converted to $ by using average currency bid rates for PGK as reported by http://www.oanda.com/currency/historical-rates/ for year 2009.

Chapter 2
14
paying school fees or meeting social obligations. Such behaviour cannot be simply
explained by behavioural attributes. The observed behaviour may be the result of an
agricultural production and marketing environment that limits net benefits farmers gain from
market participation. A lack of vertical coordination in marketing systems is a factor
contributing to high costs including the time it takes to organize marketing and waiting for
transporters to arrive to pick up their produce.
2.3 Agricultural policy environment
The Vision 2050 recognized that 80 per cent of PNG’s economy is dependent on
mining and energy. The strategic vision recognized the need to develop agriculture, forestry
and fisheries along with manufacturing, services and ecotourism to “shift an economy that is
currently dominated by the mining and energy sectors, to one that is dominated by
agriculture, forestry, fisheries, eco-tourism and manufacturing” (National Strategic Plan,
Papua New Guinea). The midterm development plan has a target to convert 70 per cent of
subsistence farmers into small- and medium-scale agricultural enterprises. The medium-
term plan proposed five core strategic thrusts to realize this objective: develop an efficient
land administration, allowing land owners to profit from their land; develop roads and supply
chains to link producers and markets; provide extension services to improve productivity;
utilize economic corridors, enabling to utilize niche markets; and enforce CODEX marketing
standards to improve agricultural exports.
The strategic plan of the National Agricultural Research Institute (NARI) proposes,
among others, enhancing the enabling environment; improving access to and utilization of
market information to enable smallholders to access different local and international
markets; identification and implementation of appropriate macro policies on trade, subsidies,
freight, taxation; and the development of infrastructure.
2.4 Agriculture’s potential
The availability of abundant land and water resources, geographic and climatic
variation across regions and biodiversity, mean that PNG has greater potential for
agricultural growth and development. Some researchers have noted a weak potential for
agriculture, mostly on account of geographic and climatic limitations. Heavy rains and cloud
cover are identified as factors contributing to weak agricultural growth. Yet, rainfall has been
fairly stable over the last several decades with occasional extremes. Diversity can be a
major advantage for increasing food production and incomes, as greater variation in climatic

15
conditions, topography and altitudes offer PNG a bigger opportunity for cultivating different
crop varieties and, hence, producing adequate food during the whole year.
PNG receives around 2,000 mm of rainfall annually. Although some changes in
weather patterns have been observed in recent years, the rainfall has been fairly stable.
Except for occasional droughts, the country has a fairly stable supply of water for
agricultural purposes. The soil is relatively good for agriculture, particularly in areas with
sedimentation or with volcanic ash deposits (Bourke and Harwood, 2009). The varying land
altitudes make it possible to grow a number of plants adapted to different climatic
conditions. Smallholders appear to have the capacity to raise agricultural production and,
hence, contribute to economic diversification and reduce dependence on food imports.
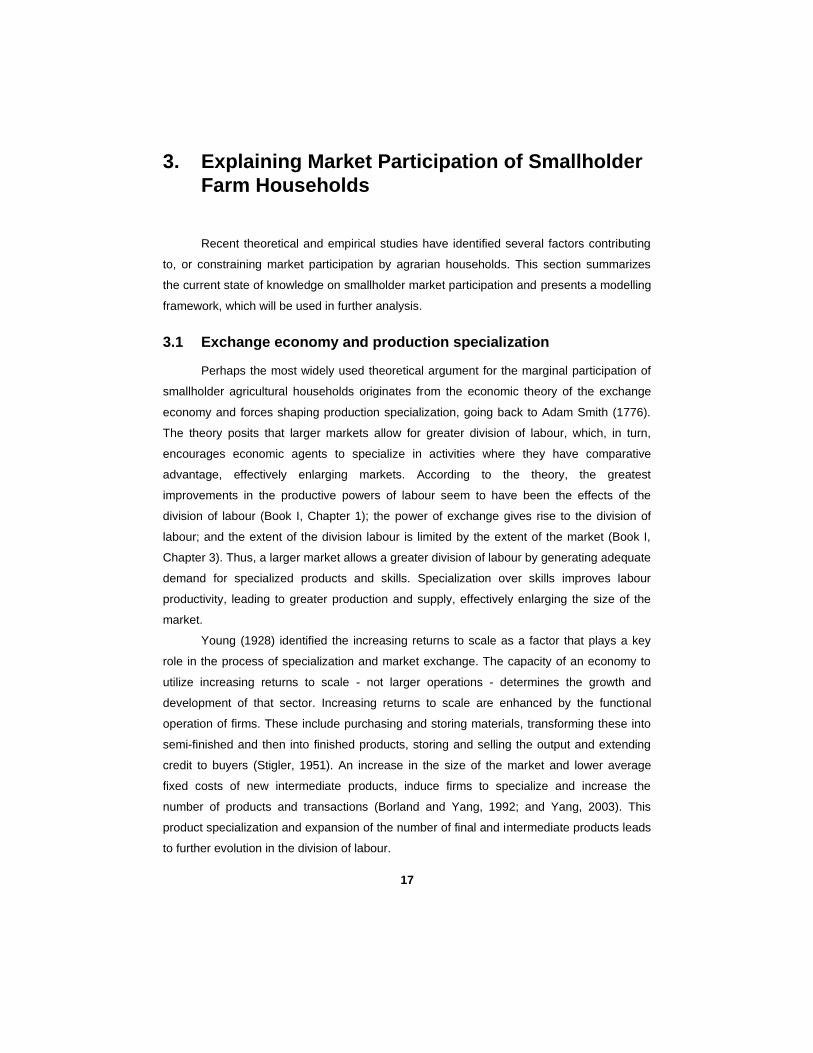
17
3. Explaining Market Participation of Smallholder
Farm Households
Recent theoretical and empirical studies have identified several factors contributing
to, or constraining market participation by agrarian households. This section summarizes
the current state of knowledge on smallholder market participation and presents a modelling
framework, which will be used in further analysis.
3.1 Exchange economy and production specialization
Perhaps the most widely used theoretical argument for the marginal participation of
smallholder agricultural households originates from the economic theory of the exchange
economy and forces shaping production specialization, going back to Adam Smith (1776).
The theory posits that larger markets allow for greater division of labour, which, in turn,
encourages economic agents to specialize in activities where they have comparative
advantage, effectively enlarging markets. According to the theory, the greatest
improvements in the productive powers of labour seem to have been the effects of the
division of labour (Book I, Chapter 1); the power of exchange gives rise to the division of
labour; and the extent of the division labour is limited by the extent of the market (Book I,
Chapter 3). Thus, a larger market allows a greater division of labour by generating adequate
demand for specialized products and skills. Specialization over skills improves labour
productivity, leading to greater production and supply, effectively enlarging the size of the
market.
Young (1928) identified the increasing returns to scale as a factor that plays a key
role in the process of specialization and market exchange. The capacity of an economy to
utilize increasing returns to scale - not larger operations - determines the growth and
development of that sector. Increasing returns to scale are enhanced by the functional
operation of firms. These include purchasing and storing materials, transforming these into
semi-finished and then into finished products, storing and selling the output and extending
credit to buyers (Stigler, 1951). An increase in the size of the market and lower average
fixed costs of new intermediate products, induce firms to specialize and increase the
number of products and transactions (Borland and Yang, 1992; and Yang, 2003). This
product specialization and expansion of the number of final and intermediate products leads
to further evolution in the division of labour.

Chapter 3
18
According to this theory, several factors can discourage market participation of some
communities and groups, such as: high transaction costs; limited opportunities for a greater
division of labour and specialization due to the limited market size; and a limited capacity to
utilize the increasing returns to scale in firm operations.
This theory of specialization is mostly referred to manufacturing industries. Both
Smith (1776) and Marshall (1920) viewed agriculture as a sector with limited opportunities
for specialization, economies of scale or division of labour due to the small size of
agricultural markets, the sharp seasonality of production and agricultural tasks not being
amenable to specialization (Yang et al., 2013). The limited opportunity for the division of
labour over tasks in agriculture makes it difficult for agricultural labourers to keep pace with
technological improvements as in the manufacturing sector.
Stigler (1951) noted that the division of labour was given high prominence in the
development of the manufacturing sector because this was observed to contribute to
technology improvement, whereas in agriculture, the increasingly intensive use of a
relatively fixed supply of land was widely observed to yield diminishing returns. Agriculture
has a lesser potential for division of labour compared to the manufacturing sector.
Recent research has significantly changed this view of agriculture. Roumasset and
Uy (1980), Roumasset and Smith (1981) and Roumasset et al. (1995) recognized that the
agricultural sector not only has the capacity for specialization, but also that division of labour
is a central driving force of the transformation from subsistence to commercial agriculture.
This transformation in agriculture is understood to co-evolve with labour institutions. The
latter evolve from the use of family labour for home production to the use of outside labour
for certain tasks, then to intermediate forms of specialization involving family labour and
hired labour, and to opportunities for hired labour to specialize in certain tasks and
eventually to farmers themselves specializing in certain tasks (Roumasset and Smith, 1981;
Eswaran and Kotwal, 1985; Kikuchi and Hayami, 1999). This process of change is
associated with underlying changes in marginal productivity of routing and managerial tasks
and widening wages of hired and owner-operators (Schaffner, 2001).
The process of commercialization of agriculture induces changes in the opportunity
cost of labour, which affects fertility choice and the composition of family labour (Evenson
and Roumasset, 1986). This further induces specialization of labour institutions and human
capital accumulation. Modernization and development is also associated with reduction of
the differential between the purchase and sales prices of commodities. This is known to be
associated with changes in the opportunity cost of food produced for home consumption,

19
which allow for the increased intensification of production and productivity, and greater
specialization of agricultural production (Roumasset and Lee, 2007).
3.2 Other explanations
Market failure as a reason for the marginal participation of agrarian households has
been studied extensively. Such studies have focused on various aspects of markets,
including market failures in insurance (Bromley and Chavas, 1989), food markets (de Janvry
et al. 1991; Fafchamps, 1993), credit markets (Eswaran and Kotwal, 1985; Rosenzweig and
Wolpin, 1993), and household-specific market failures (Kurosaki, 2003).
Several other factors and behavioural attributes have been shown to affect
smallholder market participation. The farm size per household worker, animal traction, mean
yield, age of household head and climate risk significantly affect market participation,
particularly with cash crop sales (Heltberg and Tarp, 2001). Similarly, the concentration of
crop acreage in districts has been shown to be associated with higher productivity
(Kurosaki, 2003). Land quality differentials have also been attributed an important role in
determining the process as well as the pace of agricultural modernization (Benjamin, 1995).
Access to productive technologies and adequate private and public goods to
produce marketable surpluses play a significant positive role in smallholder market
participation (Barrett, 2008). Significant investment is required to develop the institutional
and physical infrastructure necessary to ensure broad-based, low-cost access to
competitive and well-functioning markets. Public investment is essential, but not sufficient to
enable smallholders to enter markets; farmers need to invest on their lands and other assets
to fully benefit from public infrastructure. For this, smallholders need capital, which normally
comes from savings, and, in turn, their ability to generate a marketable surplus. This
suggests the existence of a vicious cycle among smallholders, which prevents them from
participating in markets. Thus, a trigger mechanism to break the cycle is required.
Traditional, personal connections and relationships, known as guanxi in China, which
can be used to secure resources or benefits in business and social life, have been shown to
reduce market transaction costs, helping farmers to enter into contracts and to access
supermarkets and international marketing channels (Hualing et al., 2008). Here, trust is
important in determining a farm family’s capacity to enter into contracts (Zhang and Hu,
2011). Even with limited technical and financial support, those entering into contracts have
developed opportunities to negotiate with buyers for better prices and flexible conditions.
Armed with their experiences, farmers attempt to move away from traditional ‘arm-length’

Chapter 3
20
business relationships and establish strong relationships with preferred buyers to reduce
costs, increase efficiency and enhance competitive advantage. Contracts can thus be a way
of breaking the vicious cycle, but such contracts also appear dependent on access to family
assets and personal connections.
3.3 Analytical framework
A simple model of household choice has been developed to capture the core issue
of specialization and market participation of smallholder agrarian households. In the case of
agrarian households, the bundle of consumption consists of home-produced staples,
market-bought staples, other market-purchased commodities and services (𝑐𝑖). The
household may earn income by selling staple food and cash crops it produces (𝑞𝑖), labour
and other services it owns such as renting out draft animals (𝑒𝑖). Production of staple and
cash crops is a function of assets held by the household (e.g. land, draft animals), flow of
services provided by resources held by the household (e.g. labour), the public sector (e.g.
irrigation and extension services) and the private sector (e.g. transport services, land tilling,
harvest collection). The household is assumed to maximize utility (U) by choosing how
much of each product or service to consume 𝑐𝑖, produce 𝑞𝑖, buy 𝑏𝑖 and sell 𝑠𝑖, subject to a
standard set of constraints: cash constraint, resources availability and the production
function. The cash constraint shows that the total value of purchases of the household must
be equal to or less than its income earned by selling staple or cash crops it produces and
the revenue it generates by supplying labour and other services. Household endowment
can incorporate borrowing and lending.
Given market-determined prices (𝑝𝑖∗), the household model can be written as
(1) 𝑀𝑎𝑥 𝑈(𝑐𝑖; 𝑧𝑢)
subject to
(2) ∑ 𝑝𝑖∗𝑐𝑖 ≤ ∑ 𝑝𝑖
∗(𝑞𝑖 + 𝑒𝑖)𝑵𝒊=𝟏
𝑵𝒊=𝟏
(3) 𝑐𝑖 ≤ 𝑞𝑖 − 𝑠𝑖 + 𝑏𝑖 + 𝑒𝑖 , 𝑖 = 1, … , 𝑁
(4) 𝑓(𝑞𝑖 ; 𝑧𝑞) ≥ 0.
where 𝑧𝑢 and 𝑧𝑞, respectively, are exogenously determined consumption and
production shifters and 𝑓 is the production technology.
Transaction costs can influence household decisions on whether or not to participate
in markets for goods or services. Three possibilities can be recognized depending on
whether the household is a net buyer, net seller or self-sufficient and hence neutral, which
can be represented by:

21
(5) 𝑝𝑖∗ = 𝑝𝑖 − 𝜏𝑖(𝑍, 𝐴, 𝐺, 𝑌) 𝑖𝑓 𝑠𝑖 > 𝑏𝑖 (𝑛𝑒𝑡 𝑠𝑒𝑙𝑙𝑒𝑟)
(6) 𝑝𝑖∗ = 𝑝𝑖 + 𝜏𝑖(𝑍, 𝐴, 𝐺 , 𝑌) 𝑖𝑓 𝑠𝑖 < 𝑏𝑖 (𝑛𝑒𝑡 𝑏𝑢𝑦𝑒𝑟)
(7) 𝑝𝑖∗ = 𝑝𝑖
𝑎 𝑖𝑓 𝑠𝑖 = 𝑏𝑖 = 0 (𝑠𝑒𝑙𝑓 𝑠𝑢𝑓𝑓𝑖𝑐𝑖𝑒𝑛𝑡)
where 𝑝𝑖 are market prices; 𝜏𝑖 are commodity-specific transaction costs, determined
by; (i) household characteristics (e.g. distance to markets, number of family members, age
and education of household head, social connections) Z; (ii) assets owned by the household
(land, draft animals) A; (iii) infrastructure provided by the government (e.g. irrigation and
extension services), G; and (iv) liquidity position of the household Y.
By rearranging the cash constraint (2) in terms of benefits and costs to market
participation, one can write:
(8) ∑ 𝑡𝑖(𝑏𝑖 + 𝑠𝑖)𝑵𝒊 = ∑ 𝑝𝑖
𝑵𝒊=𝟏 (𝑞𝑖 − 𝑐𝑖 + 𝑒𝑖).
The left side shows the costs of participating in markets for traded goods while the
right side shows the total revenue net of consumption plus endowments evaluated at the
market price. The equality of the equation implies that, for a given level of consumption and
endowment, an increase in the unit transaction cost (𝑡𝑖) will induce households to reduce
the quantity traded and increase the range of commodities produced within the farm to
compensate for lost consumption opportunities. Conversely, a reduction in unit transaction
costs is likely to stimulate commodity specialization and market exchange. This essentially
summarizes the tension between specialization and market participation on the one hand
and subsistence agriculture on the other (North, 1981).
The cost of market participation can thus explain the existence of an impressive
array of production and consumption arrangements. Smallholders may choose the level of
market participation depending on the underlying cost-benefit structure. At one end of the
spectrum there would be complete autarky while at the other end, there would be complete
commercialization. In reality, however, we hardly see the two extreme cases, but we often
observe an intermediate levels of market participation. Omamo (2007), using a numerical
simulation model with data from Kenya, shows that it is possible for households located far
from markets to allocate a larger share of productive resources to intercropping and less to
more specialized activities. The average area devoted to intercropping may increase as
market access falls, whereas that devoted to pure-stand cropping declines. He noted a
need for empirical analysis to determine whether high farm-to-market transaction costs are
associated with low market participation levels and a high degree of farm diversification.

Chapter 3
22
Based on evidence provided by Njehia (1994), the study suggests that the average area
devoted to intercropping rises as market access falls.
The optimization problem defined above would require evaluating the utility function
for each choice variable under the three possible market prices, namely at autarky, buyer
and seller prices. The model above suggests that a farmer faces a unique price for each
crop depending on a unique set of transaction costs, conditional on household
idiosyncrasies. These transaction costs are often unobservable, but can be inferred from
household and other conditions identified above. Followed by Goetz (1992) and Key et al.
(2000), the first order conditions for the maximization of the utility function will yield the
reduced form of the output marketed supply, conditional on market participation. Goetz
(1992) shows that transaction costs affect farmer decisions on whether or not to participate
in markets and, when in the market, how much to produce and sell. Their study confirms
that fixed transaction costs hinder market participation while better information stimulates it.
The study further identifies that changes in grain price have a differential impact on new
sellers compared to those already in the market. Key et al. (2000); and proportional
transaction costs affect the quantity sold whereas fixed transaction costs affect decisions on
whether to participate in markets.
Two questions are of particular interest to this exercise. One is how market
participation in crop sales would vary with distance to markets and, by extension,
transaction costs. Second, whether and to what extent transaction costs influence the
choice of farm diversification. We would also like to identify specific factors significantly
affecting household market participation in the conditions specific to PNG. This paper
hypothesizes that transaction costs, in combination with the production environment,
characterized by household assets - especially land, capital and labour availability -
determine farm decisions on market participation and how much to sell. Thus, households in
production and marketing environments with high transaction costs are expected to be less
market-oriented and, hence, choose agricultural products and crop varieties that do not
require frequent market interaction to earn cash income for purchasing essential non-farm
goods. If indeed, this is true, promoting smallholder market participation will require policy
tools to reduce transaction costs.
The exact procedure for estimating the model described above depends on the
nature of the available data and, hence, the approach taken in the study is discussed after
the data is fully described.

23
4. Data and Description of Production and
Marketing Environments
4.1 Introduction
This chapter describes the methodology adopted in the small Agriculture Household
Survey of Papua New Guinea conducted by the Centre for the Alleviation of Poverty through
Sustainable Agriculture (CAPSA), in collaboration with the National Agricultural Research
Institute (NARI) in Papua New Guinea (CAPSA, 2012) and a discussion of the nature of
agricultural production, marketing arrangements and crop sales.
4.2 Data collection
A questionnaire survey was conducted in the Morobe province of PNG to gather
information on smallholder market participation6. Morobe was selected because of the need
to study lowland agricultural systems in PNG which are less commercialized and oriented
towards home production. This area has less favourable climatic conditions and the farmers’
capacity to generate incomes is considered well below that in the highland. Hence, lowland
farmers can be considered as marginal players in fresh food production and their operating
environment was thus considered suitable for a study of factors limiting farm household
participation in local and national markets.
Logistic difficulties affecting the research team’s access to some remote villages
were a concern and a pragmatic approach was used for sample selection. The NARI staff’s
extensive knowledge of the area from their involvement in development projects there,
together with the intimate agricultural knowledge of the President of PNG Women in
Agriculture, a voluntary association, helped identify two regions within the province with
significant differences in agricultural practices as well as climatic and topological conditions.
Based on this, the research team selected Bulolo and Markham districts in Morobe as target
areas for the survey. Bulolo is a relatively mountainous region where farmers engage in
fresh food production on a small scale. It is located along a tributary of the Markham River
6 Defining smallholders rigidly as having less than two hectares of cropland (World Bank, 2003) is too restrictive in PNG because land ownership is not well defined and is often governed by customary practices. It is estimated that only 3 per cent land is alienated. For all practical purposes, the larger majority of farmers can be considered smallholders except those with over 6 to 7 hectares because many of them earn a small income from crop sales and operate with minimum agricultural equipment and capital.

Chapter 4
24
and has a road link to Lae district which is the main market town of the province. Markham
district is a vast plain surrounded by mountains. It has better soil but relatively drier with
pasture land and sugar plantations the dominant agricultural activity. However, small-scale
farm households cultivate roots and tubers, vegetables and cash crops. The road linking
Lae and Madang, running through the Ramu valley, serves the district.
The next step was selection of Local Level Governments (LLGs) from the district.
From further information on villages in the Bulolo area, it was confirmed that fresh food
production was generally along the Wau-Bulolo region, a long valley extending from Lae to
Bulolo. As much of the fresh food production takes place in the Mumeng LLG, which
stretches more than 10 km along the narrow valley, the research team decided to conduct
the survey in the Mumeng LLG area. Villages in the LLG, villages were selected at random.
In contrast, villages in Markham district are spread across the vast plain over relatively long
distances from each other and, accordingly the team selected six villages randomly from –
the Leron-Wantoat, Onga-Waffa and Umi-Atzera LLGs.
Interviews were conducted from 27 October to 7 November 2012 in the two districts
with the help of experienced agricultural extension workers attached to NARI. The survey
questionnaire was administered to 210 farm households divided equally between the two
districts. Of these, 198 completed questionnaires were retained including 98 from Markham
and 100 from the Wau-Bulolo area. The remaining questionnaires were discarded as the
data collected was found inconsistent not verifiable. In each village the objective was to
administer the survey to every third farm household. However, in some cases, it was not
possible to adhere to this principle due to the non-availability of potential respondents as
well as the smaller size of the village. In such instances, enumerators selected the next
available household.
The small size of the sample survey was compensated for by the detailed
information on household demographic background, agricultural inputs (land, labour, seed,
agricultural capital, fertilizer, pesticides and extension services), outputs (types of production
and distribution), risk and crop damage experienced by farm households, marketing
arrangements, credit and family finance, and consumption. The data collected and its
relationship to the analysis are shown in Figure 4.1. The data were collected in September
2012. Crop production cycles were noted to be different across the two microregions and
crops and, hence, rigid calendar months could not be used for collecting data in the two
districts. Instead, the crop cycle before the survey period was used as the basis for
collecting data. This also made it easier to collect information about secondary harvests,

25
especially of vegetable. The data reported in the paper including production, sales and
income refer to the respective crop cycle values.
Figure 4.1 Conceptual framework for data analysis
4.3 Limitation and scope
As noted by previous surveys, obtaining accurate estimates of income, cash flow
and monetary controls was extremely difficult. No written records are available and income
and consumption data had to be collected using farmers’ recall of these. As selection of the
villages was determined by physical access, the sample may also be biased towards farm
households with relatively better market access against those relying completely on
subsistence farming. Therefore, the authors’ estimates of the proportion of farm households
participating in markets could have an upward bias. This weakness prevented the authors
from undertaking a complete analysis using the model described above where farmers first
decide on market participation and then, its extent. However, this does not affect the
analysis on farmer decisions on how much to sell.

Chapter 4
26
The results of the study do not allow extrapolation beyond the region under study.
However, the data closely mimic that collected elsewhere in similar conditions of agricultural
production, including agricultural inputs, marketing arrangements and consumption patterns.
Therefore, this analysis of the factors limiting market participation can be considered as
reasonably valid for similar farming environments. Appendix 2 provides a statistical
summary of the variables used in the study.
4.4 Description of the production environment
4.4.1 Land ownership, usage and within-farm land fragmentation
An agricultural household has7 on average 2.3 hectares of land. However, 80 per
cent households in the survey area own less than 3 hectares and 60 per cent, less than 2
hectares (see Figure 4.2). Of the area cultivated, 80 per cent farm households cultivate less
than 2.5 hectares and 60 per cent less than 1.5 hectares. Thus, farm households can be
characterized as smallholders even by the most rigid definition of smallholders
(ownership/cultivation of 2 hectares). The land area under cash crops and vegetables is
even smaller. Almost 40 per cent of households do not cultivate vegetables and about 75
per cent do not cultivate cash crops, suggesting that only a smaller percentage of
households actually engage in cash crops cultivation.
Farm households in Bulolo have more land plots on average than those in Markham,
but in both districts the majority of households hold more than 4 plots of land each and
some hold as many as 10 (see Figure 4.3). Thus, the actual operational land size is even
smaller than what is normally assumed based on land ownership data. The ownership of
multiple land plots is known to have emerged from the households’ need to ensure survival
during crop failures. The continuation of this practice implies limited capacity or a lack of
alternative income opportunities outside agriculture that limit consumption smoothing in
case of farm failure. This also implies farm households’ inability for commercial agriculture.
The production environment can be characterized by limited access to agricultural
technology (cultivation and processing technologies and agricultural capital) and public
services (irrigation facilities and extension services) and the limited availability of inputs
such as fertilizer and pesticides, markets and services such as transport, credit and
information.
7 Land is community-owned and only 3 per cent is estimated to have been alienated. Land ownership claims also overlap among clan members. The amount of land indicated owned by households may refer to household-cultivated land or cultivable without dispute.
27
Figure 4.2 Household land ownership and crop allocation
(Cumulative density)
Figure 4.3 Distribution of land plots
Source: Authors based on CAPSA-NARI survey (2012)
4.4.2 Demographic features
The age of the household head varies from between under 20 years to 75 years,
with a near normal distribution. The agricultural population of PNG can, therefore, be
considered as generally young (see Figure 4.4). This may be due to the relatively young
population and limited work opportunities for youth in the industrial and services sectors.
The average level of education of household heads is 5.5 years with a standard deviation of
3.8 years, but a large proportion of them do not have formal education. Households, on
average have three adult members, but the distribution is skewed towards the right.
0.1
.2.3
.4.5
Den
sity
0 2 4 6 8 10 12Number of plots
Bulolo Markham
Overall
Number of land plots per farm
Chapter 4
28
Figure 4.4 Demographic characteristics of farm households
Source: Authors based on CAPSA-NARI survey (2012)
4.4.3 Agricultural inputs and services
The use of important agricultural inputs is discussed in this section including labour,
seeds, fertilizer and pesticides. Hired labour use in a crop cycle is limited to 46 per cent of
farms, but their usage is quite limited. On average, labour is hired for three days, and paid
PGK 198.00 per day. The majority of households do not hire labour (see Figure 4.5) and
those that do, hire for specific tasks such as land preparation, seed sowing, applying
fertilizer, weeding, harvesting, cleaning and transporting.
Approximately 35 per cent farmers buy seeds from the market and about 25 per cent
also use high-yielding varieties for some crops. Only 5 per cent farmers use chemical or
organic fertilizer but over 35 per cent use pesticides (see Figure 4.6). Close to a quarter of
the farmers in Markham, and less than 5 per cent in Bulolo, have received extension
services. Access to credit and the use of price information is limited, but it was observed
that farmers in Markham use more credit facilities and advance price information for
marketing.
0
.01
.02
.03
.04
.05
Den
sity
20 40 60 80Years
Age distribution of household heads
0
.05
.1.1
5.2
.25
Den
sity
0 5 10 15Years
Schooling of household head0
.1.2
.3.4
.5
Den
sity
0 2 4 6 8 10Number
Distribution of adults in the family
Female Male
Gender composition of household heads

29
Figure 4.5 Labour use in agriculture
Source: Authors based on CAPSA-NARI survey (2012)
Figure 4.6 Inputs used and access to credit and information
Source: Authors based on CAPSA-NARI survey (2012)
4.4.4 Agricultural capital, access to irrigation and improved land
Farmers in the study area use very basic agricultural equipment. Table 4.1 shows
the approximate percentage of equipment for cultivation and farming operations. The
0.1
.2.3
.4
Den
sity
0 10 20 30Number of days
Number of days labour hired (per farm / crop cycle)
0
.00
2.0
04
.00
6.0
08
Den
sity
0 500 1000 1500 2000PGK
Payments for labour (per farm / cycle)0
10
20
30
40
50
Bulolo Markham
Seed purchased High-yielding varieties
Chemical fertiliser Pesticides
perc
ent
Graphs by dt
Nature of inputs used
Bulolo Markham
No Yes
Extension services
Bulolo Markham
No Yes
Access to credit
Bulolo Markham
No Yes
Use of price information for marketing
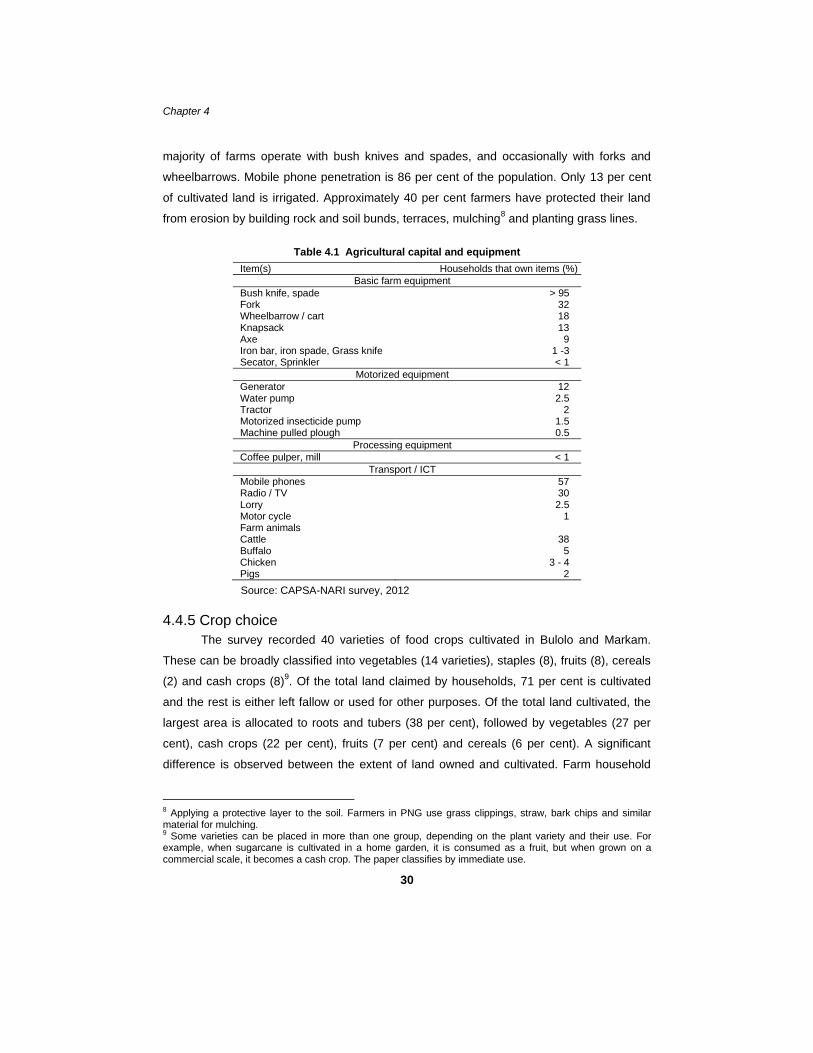
Chapter 4
30
majority of farms operate with bush knives and spades, and occasionally with forks and
wheelbarrows. Mobile phone penetration is 86 per cent of the population. Only 13 per cent
of cultivated land is irrigated. Approximately 40 per cent farmers have protected their land
from erosion by building rock and soil bunds, terraces, mulching8 and planting grass lines.
Table 4.1 Agricultural capital and equipment
Item(s) Households that own items (%)
Basic farm equipment
Bush knife, spade > 95 Fork 32 Wheelbarrow / cart 18 Knapsack 13 Axe 9 Iron bar, iron spade, Grass knife 1 -3 Secator, Sprinkler < 1
Motorized equipment
Generator 12 Water pump 2.5 Tractor 2 Motorized insecticide pump 1.5 Machine pulled plough 0.5
Processing equipment
Coffee pulper, mill < 1
Transport / ICT
Mobile phones 57 Radio / TV 30 Lorry 2.5 Motor cycle 1 Farm animals Cattle 38 Buffalo 5 Chicken 3 - 4 Pigs 2
Source: CAPSA-NARI survey, 2012
4.4.5 Crop choice
The survey recorded 40 varieties of food crops cultivated in Bulolo and Markam.
These can be broadly classified into vegetables (14 varieties), staples (8), fruits (8), cereals
(2) and cash crops (8)9. Of the total land claimed by households, 71 per cent is cultivated
and the rest is either left fallow or used for other purposes. Of the total land cultivated, the
largest area is allocated to roots and tubers (38 per cent), followed by vegetables (27 per
cent), cash crops (22 per cent), fruits (7 per cent) and cereals (6 per cent). A significant
difference is observed between the extent of land owned and cultivated. Farm household
8 Applying a protective layer to the soil. Farmers in PNG use grass clippings, straw, bark chips and similar material for mulching. 9 Some varieties can be placed in more than one group, depending on the plant variety and their use. For example, when sugarcane is cultivated in a home garden, it is consumed as a fruit, but when grown on a commercial scale, it becomes a cash crop. The paper classifies by immediate use.

31
land allocation decisions for crops in the two districts are significantly different. Farmers in
Bulolo have allocated more for vegetables and staples while in Markham, more staples and
cash crops are planted (see Figure 4.7).
Figure 4.7 Land ownership and crop diversification
Figure 4.8 Household crop choice
Source: Authors based on CAPSA-NARI survey (2012)
It was observed that the number of cultivated crops, compared to the pattern of land
allocation under each type, is similar in both districts (see Figure 4.8). For example, farmers
in both districts cultivate a higher number of cash crops, followed by staples, vegetables and
fruits. It was also observed that farmers allocate more land for staples but cultivate a larger
02
46
81
0
He
cta
res
Bulolo Markham
Land cultivated Vegetables
Staples Cash crops
Fruits Cereals
Land allocation by type of crop and district

Chapter 4
32
number of cash crops in a smaller area. It may indicate a higher intensity of cash crop rather
than staple cultivation.
4.5 Marketing arrangements
For each household and each commodity produced, the survey recorded whether
the commodity was sold within the village or in a town, a large city or the capital city. Figure
4.9 summarizes the marketing behaviour by type of commodity and destination. The authors
estimated the probability of selling a given commodity in a particular location and to whom it
was sold. It was observed that a farmer was 83 per cent likely to sell vegetables within the
village itself and 16 per cent likely to market in a nearby town, with a just 1-per cent
likelihood of selling in a large city. However, the marketing of cash crops is very different.
There is only a 1-per cent chance of selling cash crops within the village, a 28-per cent
likelihood of marketing in a nearby town, 56-per cent chance of selling in a large town and
16-per cent likelihood of selling in the capital city.
Figure 4.9 Crop marketing by main markets
Source: Authors based on CAPSA-NARI survey (2012)
This decision appears to depend on the type of commodity, especially its
perishability and bulk. For example, vegetables, staples and fruits are highly perishable and
there is, hence, a higher likelihood of spoilage during transportation as well as high
transaction costs. Transporting small volumes is not cost-effective. Therefore, it can be
concluded that farmers in such a marketing environment behave highly rationally, contrary
to the popular belief that farmers are ignorant.
0%
10%
20%
30%
40%
50%
60%
70%
80%
90%
100%
Cereal Vegetables Staples Fruits Cash crops
Perc
en
tag
e
Village Town Large city Capital city

33
4.6 Nature of crop sales
Similarly, the survey asked farm households whether they sold their produce to
consumers, traders, companies, government agencies or a category other than these. The
analysis shows that farmers mostly sell directly to consumers (see Figure 4.10). It can be
observed that a farmer is 93 per cent likely to sell vegetables and 66 per cent likely to sell
cash crops directly to consumers. As noted earlier about the greater likelihood of cash crops
being sold in large cities and the capital city, there is a slightly higher probability of farmers
selling cash crops, cereals and fruits to traders. Thus, it can be seen that the function of
intermediaries is not widespread in the agricultural sector, being limited to cultivations that
are more commercialized and to certain commodities such as cash crops, cereals and fruits,
which can be considered high-value crops.
Figure 4.10 Crop marketing by main buyers
0%
10%
20%
30%
40%
50%
60%
70%
80%
90%
100%
Cereal Vegetables Staples Fruits Cash crops
Perc
en
tag
e
Consumers Traders Company Govt Agency Others
Source: Authors based on CAPSA-NARI survey (2012)
Of the farmers surveyed, 84 per cent participated in markets, earning on average
PGK 1,632 during the crop cycle. It is observed that farm household market participation
differs significantly by type of commodity, ranging from over 60 per cent for cash crops, 40
per cent for vegetables, 30 per cent for staples and 25 per cent for fruits to less than 10 per
cent for cereals (see Figure 4.11). The contribution of these commodities to total sales
revenue is significantly different to the commodities’ market. Cash crops contribute 80 per
cent to sales revenue while vegetables, staples and fruits, each contribute 6 per cent and
cereals just about 1 per cent.

Chapter 4
34
The volume of sales and main sources of crop sales are significantly different in the
two districts. Farmers in Bulolo earn relatively less from sales but sell a greater variety of
vegetables; farmers in Markham earn relatively more from sales, specializing in cash crops
and staples (see Figure 4.12). Farmers in Markham earn, on average eight times more than
those in Bulolo. These facts suggest that farmers in Markham have a higher orientation
towards cash crop sales, whereas farmers in Bulolo sell more of different types of
commodities, but earn less.
Figure 4.11 Household sales income by crop type
Figure 4.12 Household crop sales by type and district
Source: Authors based on CAPSA-NARI survey (2012)

35
5. Determinants of Farm Sales
5.1 Estimating the model with censored data
As discussed above, around 14 per cent households in the sample do not participate
in markets10
. Thus, the dependent variable is not observed for some farm households, but
independent variables are observed for all. This means that farm households have latent or
unobserved sales and can enter markets as soon as a threshold of critical variables is
reached. In agrarian settings, the threshold could be a level of benefits for the family farm to
participate in markets. The authors are interested in explaining household decisions and the
degree of their market participation. Accordingly, sales values are considered a dependent
variable, which is not observed for some households. Therefore, the data set falls into the
category known as censored data as the full information set is available for all independent
variables, but some data are not observable for the dependent variable. When a data set is
censored this way, estimating the model using the Linear Model becomes untenable. The
Tobit model is a particularly useful model in this environment, which is used for estimating
the regression models.
The model can be specified as a linear combination of an unobserved latent variable,
y*,
𝑦𝑖∗ = Χ𝑖
′𝛽 + 𝜀𝑖 , 𝑖 = 1, … , 𝑁
where 𝜖𝑖 ∼ 𝑁(0, 𝜎2), 𝑎𝑛𝑑 Χ𝑖 denotes the (Kx1) vector of exogenous and fully
observed variables. If y* were to be observed, the model parameters can be estimated by
OLS in the usual way. The observed variable 𝑦𝑖 is related to the latent variable 𝑦𝑖∗ through
the observation rule
𝑦 = [𝑦∗ 𝑖𝑓 𝑦∗ > 𝐿𝐿 𝑖𝑓 𝑦∗ ≤ 𝐿
The probability of an observation being censored is Pr(𝑦∗ ≤ 𝐿) = Pr(Χ𝑖′𝛽 + 𝜀𝑖 ≤ 𝐿) =
Φ{(𝐿 − Χ𝑖′𝛽/𝜎}, where Φ is the standard normal cumulative distribution function. The
conditional mean of the non-censored observations differs from standard OLS because of
the censoring, which leads to OLS being inconsistent. Estimation of the conditional mean
10 As explained in the methodology, the authors suspect overestimation of the market participation rate due to sample bias towards farmers living closer to the road and suggest that it not be used for policy purposes.

Chapter 5
36
depends crucially on the normality assumption. The data set that we have in the case of
PNG is only left censored and L = 0.
As has been shown, the censoring point may be unknown (Carson and Sun, 2007)
and the unknown censoring point can be set to zero as a ‘normalization’ can lead to
inconsistent estimators. In such situations, it has become a standard practice to treat the
unknown threshold, 𝛾 = min(𝑢𝑛𝑐𝑒𝑛𝑠𝑜𝑟𝑒𝑑 𝑦) and proceed as if 𝛾 is known. Estimates of the
Tobit model based on this procedure have been shown to be consistent (Carson and Sun,
2007; Cameron and Trivedi, 2010). Following the suggestion made by Cameron and Trivedi
(2010), the unknown threshold was set to 𝛾 − Δ, where Δ = 10−6.
The standard practice is to use either the maximum likelihood estimator or the two-
step procedure for estimating models and in this case, the MLE was used. However, the
consistency of MLE crucially depends on the normality assumption. During the process of
estimation, it was found that the dependent variable in absolute terms shows high skewness
and heteroskedasticity, and therefore, the dependent variable, sales income, was
transferred by using natural logarithm. It was found that skewness and non-normal kurtosis
are reduced within acceptable levels, and hence the model can be thought to generate
consistent estimates. Thus, the model developed in section 3.3 was estimated by using the
Tobit model structure, implemented by using the MLE method. The model focuses on
estimating market participation of farm households, conditioned on household assets and
characteristics, access to publicly and privately provided services such as extension
services, credit facilities and information and communication, and other market-related
information such as distances and transaction costs.
5.2 Empirical model variables
The model developed in section 3.4 was estimated using the Tobit model structure
as this allows for estimating regression models with truncation. We regress farm sales as a
function of household assets, demographic characteristics, access to publicly and privately
provided services such as extension services, credit facilities, access to information and
communication, and factors that work as barriers for market entry, especially distance and
transportation costs. To further understand how these factors may affect smallholders and
other differently, the model with total sales was estimated separately for households with
less than 2 hectares and greater than 2 hectares.
Descriptive statistics (means, standard errors maximum and minimum values) are
given in Appendix 2 for the variables included in the regressions. The empirical models
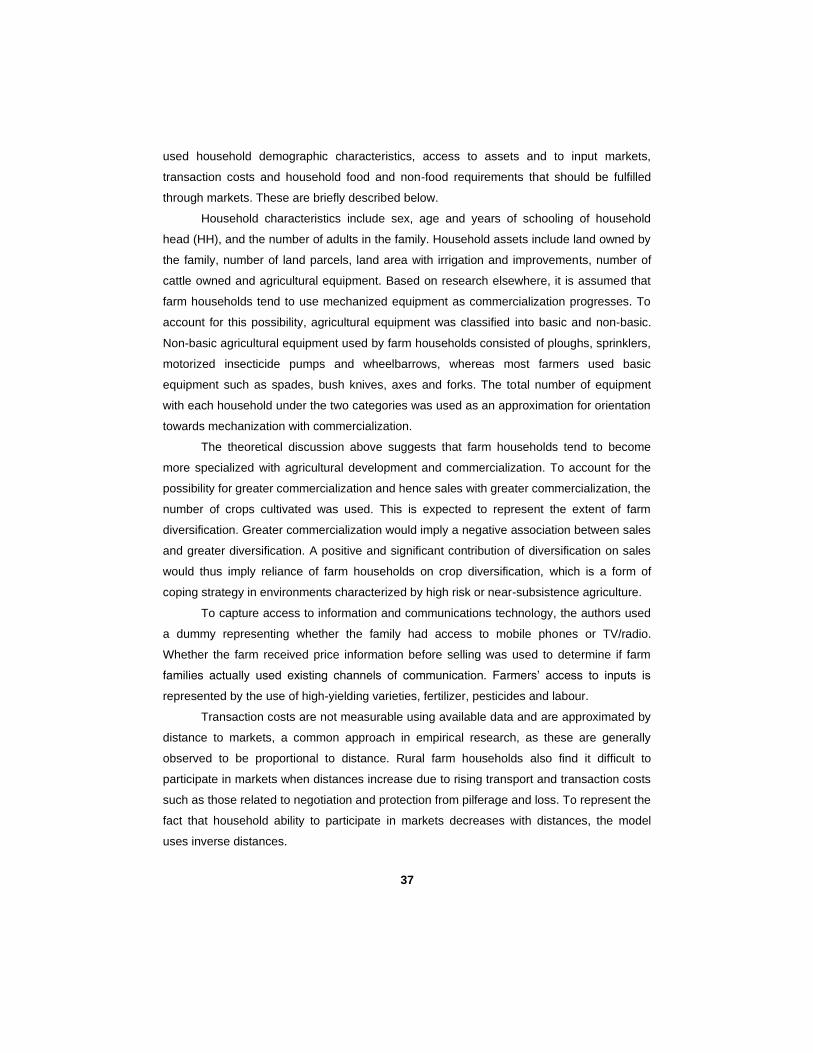
37
used household demographic characteristics, access to assets and to input markets,
transaction costs and household food and non-food requirements that should be fulfilled
through markets. These are briefly described below.
Household characteristics include sex, age and years of schooling of household
head (HH), and the number of adults in the family. Household assets include land owned by
the family, number of land parcels, land area with irrigation and improvements, number of
cattle owned and agricultural equipment. Based on research elsewhere, it is assumed that
farm households tend to use mechanized equipment as commercialization progresses. To
account for this possibility, agricultural equipment was classified into basic and non-basic.
Non-basic agricultural equipment used by farm households consisted of ploughs, sprinklers,
motorized insecticide pumps and wheelbarrows, whereas most farmers used basic
equipment such as spades, bush knives, axes and forks. The total number of equipment
with each household under the two categories was used as an approximation for orientation
towards mechanization with commercialization.
The theoretical discussion above suggests that farm households tend to become
more specialized with agricultural development and commercialization. To account for the
possibility for greater commercialization and hence sales with greater commercialization, the
number of crops cultivated was used. This is expected to represent the extent of farm
diversification. Greater commercialization would imply a negative association between sales
and greater diversification. A positive and significant contribution of diversification on sales
would thus imply reliance of farm households on crop diversification, which is a form of
coping strategy in environments characterized by high risk or near-subsistence agriculture.
To capture access to information and communications technology, the authors used
a dummy representing whether the family had access to mobile phones or TV/radio.
Whether the farm received price information before selling was used to determine if farm
families actually used existing channels of communication. Farmers’ access to inputs is
represented by the use of high-yielding varieties, fertilizer, pesticides and labour.
Transaction costs are not measurable using available data and are approximated by
distance to markets, a common approach in empirical research, as these are generally
observed to be proportional to distance. Rural farm households also find it difficult to
participate in markets when distances increase due to rising transport and transaction costs
such as those related to negotiation and protection from pilferage and loss. To represent the
fact that household ability to participate in markets decreases with distances, the model
uses inverse distances.
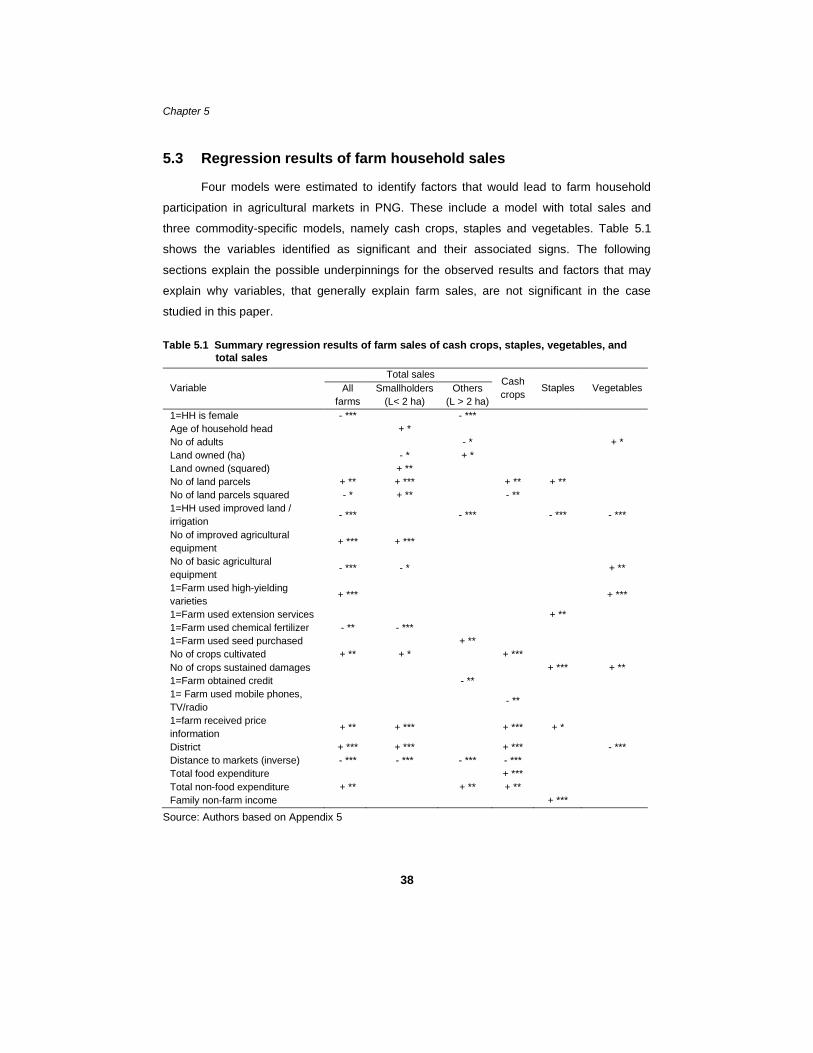
Chapter 5
38
5.3 Regression results of farm household sales
Four models were estimated to identify factors that would lead to farm household
participation in agricultural markets in PNG. These include a model with total sales and
three commodity-specific models, namely cash crops, staples and vegetables. Table 5.1
shows the variables identified as significant and their associated signs. The following
sections explain the possible underpinnings for the observed results and factors that may
explain why variables, that generally explain farm sales, are not significant in the case
studied in this paper.
Table 5.1 Summary regression results of farm sales of cash crops, staples, vegetables, and
total sales
Variable
Total sales Cash
crops Staples Vegetables All
farms
Smallholders
(L< 2 ha)
Others
(L > 2 ha)
1=HH is female - *** - ***
Age of household head + *
No of adults - * + *
Land owned (ha) - * + *
Land owned (squared) + **
No of land parcels + ** + *** + ** + **
No of land parcels squared - * + ** - **
1=HH used improved land /
irrigation - *** - *** - *** - ***
No of improved agricultural
equipment + *** + ***
No of basic agricultural
equipment - *** - * + **
1=Farm used high-yielding
varieties + *** + ***
1=Farm used extension services + **
1=Farm used chemical fertilizer - ** - ***
1=Farm used seed purchased + **
No of crops cultivated + ** + * + ***
No of crops sustained damages + *** + **
1=Farm obtained credit - **
1= Farm used mobile phones,
TV/radio - **
1=farm received price
information + ** + *** + *** + *
District + *** + *** + *** - ***
Distance to markets (inverse) - *** - *** - *** - ***
Total food expenditure + ***
Total non-food expenditure + ** + ** + **
Family non-farm income + ***
Source: Authors based on Appendix 5

39
5.3.1 Land ownership and land fragmentation
The first thing to be noted is that access to land is not significant in the overall model
with all farm households considered. However, increasing land ownership is positively and
significantly associated with sales among those owning more than 2 hectares. Interestingly,
sales are negatively correlated with rising land ownership among smallholders, but the
secondary effect is positive. This implies that increasing land ownership induces farm
households to disengage from markets but increase sales when the land ownership rises.
This may be due to the existence of a sort of land threshold even within smallholder family
farms. It may be that families increase consumption of home-produced commodities when
their land ownership increases at lower levels, but find it profitable to sell when a small
surplus is generated with an increased amount of land. This result is similar to the
observation in other contexts (Wickramasinghe, 2014). To visualize this relationship, a
scatter diagram between the extent of land owned and sales for those who own less than 3
hectares was drawn along with Locally Weighted Scatterplot Smoothing, or Lowess
smoother11
(see Figure 5.1). It can be seen that with rising land ownership at lower levels,
farms hardly increase sales volumes but these begin to increase when the extent of land
rises above 2 hectares. It was also observed that sales continue to rise up to about 4
hectares of land and decline afterwards (not shown in the figure). The result suggests the
existence of a non-linear relationship between land ownership and sales. Thus land
ownership alone cannot explain the farmers’ market participation decisions.
Fragmentation of land within households is common in PNG as seen earlier.
Regression models show a positive association between the number of plots of land owned
and sales. Among smallholders with less than 2 hectares of land, the relationship is even
stronger as can be observed. In addition, the squared value of the number of plots is
significant and negative in the model with total sale and also in cash crop sales, but positive
for smallholders. Like the relationship observed above between sales and land ownership,
the authors observed a non-liner linear relationship between sales and the number of plots.
In particular, it was observed that an increase in the number of land parcels contributed to
farm sales but sales began to decline when the number of plots rose above six. A scatter
diagram of the number of land plots and sales along with a Lowess smoother shows this
relationship (see Figure 5.2). Land fragmentation is noted to be a particularly acute problem
among farm households owning between 5 and 7 hectares of land and the importance of
having many land plots begins to dissipate beyond 7 plots of land. As research shows,
11 The Lowess smoother uses locally-weighted polynomial regression.

Chapter 5
40
holding many plots is a sign that farm households are merely attempting to survive under
difficult conditions, which is a result of expected farm failures (Jodha, 1978) and transaction
costs (Wickramasinghe, 1995).
Figure 5.1 Land ownership and farm sales among smallholders
Figure 5.2 Within-farm land fragmentation
Source: Authors based on CAPSA-NARI survey (2012)

41
5.3.2 Demographic characteristics
The authors find three demographic characteristics affecting farm sales: the gender
of the household head, the age of the household head and the number of adults in the
family. Econometric results suggest that being a female household head decreases the
likelihood of market participation. This seems to suggest that female-headed households
face constraints to effective engagement in markets. This is somewhat puzzling given the
specific conditions in PNG where women appear to contribute significantly in the entire
agricultural value-chain including cultivation, transportation, negotiations with buyers and
vendors, and sales of the produce. Age was found to be a significant factor in explaining
sales only in the regression for farms that own less than 2 hectares, but the result confirms
the general observation that farming operations are increasingly manned by the elderly. The
number of adults in the family is a significant variable among vegetable growers.
5.3.3 Agricultural inputs and services
The models used several variables to gauge the impact of the availability of
agricultural inputs and services, including access to irrigation and improved land, high-
yielding varieties, chemical fertilizer, pesticides and market-purchased seeds. The variable
that represents access to irrigation and improved land, negatively affects sales. A scatter
diagram (not shown) along with Lowess smoother between farms with access to irrigation
and land improvements, showed that only a small proportion of farms had access to
irrigation or engaged in land improvements, but their sales volumes were found to be small,
regardless of the amount of land owned by the household.
The use of high-yielding varieties is positively and significantly correlated with sales.
The authors observed this was the case for regression models for vegetables and total
sales. The fact that the dummy variable on whether farms used high-yielding varieties is
significant only in the regression model on vegetables and the total sales, implies that it is
an important factor for vegetables but may not be the case for cash crops and staples.
The use of chemical fertilizer and pesticides was found to have a negative effect on
sales. This needs further investigation although the authors suspect that the result is due to
the fact that only a fraction of farmers use these and that pesticide use may also reflect
vulnerability to pest attacks and poor soil conditions and, hence, their inability to participate
effectively in markets. Seeds purchased from markets have only been used by farmers with
land over 2 hectares. Access to extension services was found to positively and significantly
contribute to sales only in the case of the sale of staple crops. However, this needs to be

Chapter 5
42
further verified given that only a small proportion of households received such assistance.
Farm households rely on family labour for farming and hired labour is rarely used. As
a result, variables on labour usage were not significant in the estimated models. The use of
hired labour is limited to specialized tasks, particularly among large-scale cash crop
farmers.
Access to information and communication, and in particular to price information, is
known to positively affect market participation. While the authors found evidence that having
advance price information positively and significantly contributed to sales across the four
models estimated, access to channels that receive information, namely mobile phones and
TV/radio, had no positive impact. This is surprising because it was observed that mobile
phone penetration was quite high even in rural areas. It appears that farmers rely on friends
who visit market centres frequently to obtain price information. This shows the need to focus
on mechanisms of information transmission rather than trying to increase access to mobile
phones for enhancing market participation. Finding out how farm households receive market
information needs further investigation.
5.3.4 Agricultural capital and equipment
Ownership or access to improved agricultural equipment affects sales among farms
with less than 2 hectares of land, but having more basic agricultural equipment appears to
have a negative impact on market participation. Those with more basic agricultural
equipment tend not to engage in markets compared to those with improved equipment. This
simply reflects limited access to agricultural equipment among farm households. Given the
importance of agricultural capital formation in agrarian transformation and development as
has been well established in the literature, the authors investigated an additional potential
link with market participation, namely that between land ownership and capital
accumulation. However, a strong and systematic association between agricultural
equipment and sales or with land cultivated was not found. It is thus concluded that
agricultural capital formation is at a rudimentary level in PNG.
5.3.5 Distance to markets and market participation costs
Smallholder market participation is hindered by transaction costs (e.g. of information
gathering, organizing transportation and ensuring goods are not damaged or pilfered during
transport). Transaction costs, especially those of organizing farm operations, managing
labour and controlling shirking, are rarely observable and measurable in practice. Although
the transportation cost was considered as a measurable variable, even that was not

43
observable when farmers were not participating in markets (e.g. from remote rural
communities). Non-participation of farm households in markets is often a result of high
marketing and transportation costs. Thus, the quantity that can be transported for any given
unit of value diminishes with increasing distance. The use of average transport costs in
regression models would have been ideal but it was extremely difficult to measure the
quantities transported due to the non-availability of standard measures to convert various
units used by households to identify the quantities. The distance could only be estimated in
time units and, hence, the authors used the inverse distance as an approximation for the
average transportation cost. To put this in perspective, a farmer located farther away from
the market will be able to transport a smaller quantity of produce with a given amount of
money, compared to a farmer located closer to the market. Thus, distance is a barrier to
market participation. As shown in the theoretical section, farm households located farther
from the market, rely on home-produced goods over market-purchased goods and, hence,
their degree of market participation is lower.
Figure 5.3 Farm-to-market distances and farm sales
Source: Authors based on CAPSA-NARI survey (2012)
Distance from the market is highly significant in sales in four out of five regression
models. Distance does not affect sales only in the case of staples. It is found that most
smallholder farms are less than 300 minutes of travel time away from main markets, but a

Chapter 5
44
few are located away from markets farther away (see Figure 5.3). Sales were observed to
rise with distance until about 400 minutes of travel time. Beyond this distance, sales
remained the same. This shows the possibility that distance itself may not be a
disadvantage and that there is an optimum distance at which farms tend to be profitable. In
the two districts surveyed, it can be observed that most vegetable farms are close to roads
and towns whereas farmers in mountainous regions without access to transport, tend to
practise subsistence agriculture, occasionally travelling to markets with their produce, which
is usually non-perishable.
5.3.6 Crop diversification and market participation
It was shown that the choice between subsistence agriculture and market
participation depends on the net benefits and costs of participating in markets. A study of
crop choice, diversification and how households use markets to meet their basic
consumption requirements, makes it possible to understand household preferences.
There is strong evidence to support the idea that farm households diversify
cultivation and that there is a positive and significant contribution of crop diversification to
farm sales. The number of crops cultivated is significant and has positive impact on sales in
three regression models, namely total sales, sales of smallholders and cash crops. Crop
diversification is widely practised in PNG. It is not surprising to find farm households
engaged in crop diversification in an agrarian environment broadly characterized as
subsistence or near-subsistence in PNG. Similarly, a positive correlation is observed
between distance to markets and the number of crops cultivated (see Figure 5.4). Thus,
farms located away from markets tend to cultivate more crops, selling the surplus in the
market to generate income to purchase food and non-food commodities.
While farm households facing larger risks would be expected to avoid market
participation, the study results suggest that households with higher crop damage tend to sell
more. While further analysis is needed to ascertain the possible causes of this link, it is likely
that farm households adjust crop mix to keep earnings constant in the face of risks. For
example, farms may increase sales of staples and vegetables when cash crops and other
commodities are damaged, reducing the marketable surplus.

45
Figure 5.4 Farm-to-market distance, land and crop
diversification and farm sales
Source: Authors based on CAPSA-NARI survey (2012)
5.3.7 Household consumption and market participation
It was also observed that farm sales were associated with the consumption level of
food and non-food commodities. Food expenditure is significant in the cash crop regression
whereas non-food expenditure is significant in three regressions, namely total sales,
smallholders (l<2 hectares) and cash crop. It may be noted that non-food expenditure is
smaller in percentage terms for every PGK a farm earns through sales, compared to food
expenditure. Food expenditure rises with sales income and becomes constant after sales
reach PGK 7,000 whereas non-food expenditures reaches a maximum slightly earlier, but
05
10
15
20
Num
ber
0 200 400 600 800Distance to markets (minutes)
No of plots Lowess - distance & no. of plots
No of crops cultivated Lowess - distance & no. of crops

Chapter 5
46
declines with an additional rise in sales income (see Figure 5.5). While it cannot be known
from the relationship whether consumption requirements induce farmers to engage in sales
or higher incomes contribute to higher consumption, the positive correlation makes it likely
that market participation may be driven by the need to generate income to fulfil the
household’s basic food and non-food requirements. Conversations with farmers during the
survey confirmed that a motive for market participation was to enable them to buy goods not
produced at home, such as kerosene, tinned fish, clothes and other essentials. The scatter
diagram between consumption expenditure and sales as well as regression results confirm
the positive association between consumption and market sales.
Figure 5.5 Family consumption and sales
Source: Authors based on CAPSA-NARI survey (2012)

47
6. Summary, Conclusions and Recommendations
The Rio+20 Outcome Document urged nations to enhance the welfare of
smallholders and subsistence farmers, and marginalized groups including women and
vulnerable communities dependent on agriculture, through strategies and programmes to
integrate them with local, regional and national markets. The Asia-Pacific region is home to
87 per cent of an estimated 500 million smallholders with less than 2 hectares of land and
some countries in the region have large smallholder agricultural communities that still
depend on subsistence agriculture.
This study is part of a series of investigations in selected Asia-Pacific countries to
identify the main constraints to smallholder market participation in order to integrate such
marginal communities into local, regional and national markets. It summarizes current
theoretical and empirical understanding of smallholder market participation with a modelling
approach and estimation procedure; synthesizes recent studies on smallholder agriculture
in PNG; and presents the results of a mini-household survey in PNG that attempted to
identify factors promoting or limiting smallholder market participation along with a set of
recommendations.
There are several factors behind the international community, coming together at the
United Nations to urge governments to develop strategies and programmes to integrate
agricultural smallholders and marginal communities with local, regional and national
markets. A key reason is the understanding that market participation by marginal agricultural
communities enhances household welfare as it allows households to utilize resources
efficiently, using their comparative advantage to produce food and agricultural commodities
and exchange these for commodities and services that cannot be produced at home.
Dynamic technical change in agriculture and production specialization is also known to
allow rural communities to move from subsistence to more specialized, market-oriented
commercial agricultural operations, thereby promoting their welfare. Market integration also
encourages rural households to move into productive agriculture rather than out of
agriculture, leading to unsustainable urbanization.
Recent theoretical developments and empirical studies have identified several
factors that contribute to, or limit the participation of agrarian households in markets. Market
failure as a reason for marginal participation of agrarian households in markets has been
extensively studied. Such studies have focused on various aspects of markets including

Chapter 6
48
market failures in insurance, food and credit markets as well as household-specific market
failures. The second and, perhaps, the most widely used theoretical argument for the
marginal participation of smallholder agricultural households originates from the economic
theory of the exchange economy and forces shaping production specialization, which goes
back to Adam Smith. The theory posits that larger markets allow for a greater division of
labour, which, in turn, enables economic agents to specialize in activities where they have
comparative advantage, effectively enlarging markets. Increasing returns to scale play a key
role in the process, which is further enhanced by the functional operations of firms and the
lowering of average fixed costs required for producing and selling new and intermediate
products. Recent research has shown that agriculture too offers the potential to specialize in
commodities and increase the division of labour in farming activities. This process enables
agricultural households to participate in markets and move from subsistence to commercial
agriculture.
Recent models have explained market participation, or its lack, in the presence of
transaction costs and that how such costs affect farmers’ decisions on whether and when to
participate in markets, how much to produce and sell, confirming that fixed transaction costs
are a hurdle to market participation while better information promotes it. As shown, market
participation decisions are a result of the underlying net costs and benefits to market
participation, in the sense of the tension between specialization and home production, as
recognized by Douglas North in 1981. Thus, a reduction in transaction costs induces farm
households to increase the quantity traded and reduce the range of commodities produced
within the farm, because market exchange allows farm households to consume a range of
commodities bought from the market.
Recent literature also shows the importance of several additional variables. Some of
these include farm size per household worker, animal traction, mean yield and age of the
household head. A number of other factors have also been recognized, including climate
risk, land quality differentials, access to productive technologies, public goods and services,
and traditional trust and personal connections in contract farming. Recent findings suggest
that the choice of farm specialization over mixed cultivation and enhanced market
participation is a result of the relatively better capacity of households to produce agricultural
commodities, in turn made possible by better access to land and irrigation, and favourable
environments for transaction costs.
PNG has a population of 7.4 million people and a land area of 470,000 km². The
current per capita GNI is $1,300, but poverty measured by the PHR is almost 40 per cent of

49
the population. Rural poverty is endemic primarily because of a heavy dichotomy in the
economy, characterized by extremely large agricultural employment (80 per cent) and the
significantly low value added from agriculture (27 per cent). Mining and construction
contribute 35 per cent to the GDP. The agricultural sector has been stagnant during the last
five decades except for some swings in the production of cereals and non-food agricultural
commodities. Almost 80 per cent of the people who depend on agriculture, practise
subsistence farming. The government’s Vision 2050 aims to reduce the dependency on the
mining industry and expand the contribution of the agriculture, forestry and fisheries sectors
to realize the country’s full economic potential. The midterm development plan of the
government aims to turn 70 per cent of subsistence farmers into small- and medium-scale
agricultural enterprises. Efficient land administration, which allows land owners to profit from
their land, along with the development of roads and supply chains linking producers with
markets, and expanding extension services, are the key strategies towards realizing these
goals. This study intends to deepen understanding of the factors contributing to or limiting
incentives for farmers to invest in agriculture and enhance their capacity to profit from land
and engage in markets productively.
This paper uses a simple model of household choice to capture core issues affecting
the volume of farm sales. The model assumes that a household maximizes utility by
choosing how much of each product or service to consume, produce, buy and sell, subject
to a cash constraint, a resource availability constraint and the production function. The cash
constraint shows that the total value of household purchases must be equal to or less than
the income it earns by selling staple/cash crops it produces and by selling its labour and
other services. It is assumed that borrowing or lending are equal in a given crop cycle and
that the household endowment consists of household savings from previous years or
cropping seasons.
PNG offers a case for investigating factors that may improve understanding of
household choices between market participation and home production for consumption.
This paper investigated factors that led some farm families in PNG to participate, and others
to shun markets. For this purpose, it conducted a mini-household survey in Bulolo and
Markham districts in Morobe province where lowland agriculture is practised. Covering 200
households, the survey included modules on household background, agricultural land,
labour and other services, farm capital and livestock, input markets, crop production,
marketing, access to credit, family income and transfers, and consumption.

Chapter 6
50
This section summarizes the findings of the study. First, as to the nature of
agriculture, lowland farm households operate very small pieces of land, not necessarily
because of lack of ownership but due to economic conditions. Within-family land
fragmentation is widespread across the region and farms are operated with very little
agricultural equipment, limited access to input markets including labour, high-yielding crop
varieties, fertilizer and pesticides, and extension services, in particular. Enhancing land
ownership, including through land alienation is, therefore, unlikely to significantly change the
nature of household agriculture and, hence, will have insignificant impact on integrating
smallholders with local and national markets.
Second, in addition to land fragmentation within the farm family, farmers are
extensively practising crop diversification. Research elsewhere and current theoretical
knowledge suggest that this is primarily due to their inability to cope with the potential risks
of farm failure. Smaller land sizes and extensive crop diversification mean that farmers can
produce only a small surplus of any given commodity for the market. If harvesting periods
also differ for different types of crops, a farmer would have only a small amount of surplus
produce for the market. Transporting small quantities over long distances is also not
economical. Farmers can come together into farmers’ organizations and appoint some of
themselves as agents for transporting and selling in markets. However, this depends on
trust relationships and the costs of organizing and keeping such coalitions together over
time. Public policy can facilitate farmer market participation either through incentives for
establishing farmers’ organizations, addressing the risk of farm failure that is responsible for
extensive crop diversification in the first place, or a combination of the two.
Third, smallholder agricultural marketing arrangements remain informal, with
producers selling small quantities directly to consumers at temporary roadside markets,
earning perhaps just enough to purchase their most basic food and non-food needs. Indeed,
this marketing arrangement may perhaps be the best option given the smaller size of their
marketable surplus. Therefore, any attempt to encourage greater market participation
through better marketing arrangements must be coordinated with attempts to enhance their
production and reduce their risks so that farmers not only produce more but also use their
meagre resources more efficiently, producing a fewer number of high-value crops.
Fourth, although not conclusive and unsure about the causative direction, we find a
highly significant association between the level of food and non-food consumption and
smallholder market participation. Food and non-food expenditure initially rises with rising
farm sales but food expenditure begins to stabilize and non-food expenditure declines

51
slightly when farm incomes rise further. It appears that a key motive for farmer market
participation is the need to enhance the bundle of consumption and services, especially of
commodities not produced at home and other essential services. This suggests that farm
households are making their best effort to improve their living standard. The best that the
government can do is to promote conditions conducive for farm households to enhance their
agricultural production and marketing in order to move out of poverty and food insecurity.
Further analysis of the other key requirements of smallholder households, namely
education, health, social obligations and recreation activities is required to understand how
these affect their market participation. Because such aspects are primary factors
contributing to human welfare and poverty reduction, increasing market participation is likely
to yield greater dividends in terms of enhanced food security and poverty reduction, thus
contributing to sustainable development.

53
7. References
Allen, M., R.M. Bourke, and A. Mc Gregor (2009). Cash income from agriculture. In Food
and Agriculture in Papua New Guinea, R.M. Bourke, and T. Harwood, eds.
Canberra: ANU E Press, The Australian National University.
Asian Development Bank (2013). Asia’s economic transformation: Where to, how, and how
fast? Special chapter. In Key Indicators for Asia and the Pacific 2013.
Asian Development Bank (2014). Key Indicators for Asia and the Pacific. Manila.
Barrett, C. B. (2008). Smallholder market participation: concepts and evidence from eastern
and southern Africa. Food Policy, vol. 33, pp. 299-317.
Benediktsson, K. (2002). Harvesting Development: The Construction of Fresh Food Markets
in Papua New Guinea. Denmark: Nordic Institute of Asian Studies.
Benjamin, D. (1995). Can observed land quality explain the inverse productivity
relationship? Journal of Development Economics, vol. 46, No. 1, pp. 51-84.
Borland, J., and X. Yang (1992). Specialization and a new approach to economic
organization and growth. American Economic Review, Papers and Proceedings of
American Economic Association, vol. 82, No. 2, pp. 386-391.
Bourke, R.M., J. Gibson, A. Quartermain, K. Barclay, B. Allen, and J. Kennedy (2009). Food
production, consumption and imports. In Food and Agriculture in Papua New
Guinea, R.M. Bourke, and T. Harwood, eds. Canberra: ANU E Press, The Australian
National University.
Bromley, D., and J.P. Chavas (1989). On risk, transactions, and economic development in
the semi-arid tropics. Economic Development and Cultural Change, vol. 37, No. 4.
Cameron A.C., and P.K. Trivedi (2010). Microeconometrics Using Stata. Revised edition.
Texas: Stata Press publication, College Station.
Carson, R.T., and Y. Sun (2007). The Tobit model with a non-zero threshold. Econometrics
Journal, vol. 10, Issue 3 (November), pp. 488-502.
Centre for the Alleviation of Poverty through Sustainable Agriculture (2012). Agriculture
Household Survey Papua New Guinea 2012. Bogor, Indonesia.
Chenery, H.B., R. Sherman, and S. Moiss (1986). Industrialisation and Growth: A
Comparative Study. New York: Oxford University Press.
De Janvry, A., M. Fafchamps, and E. Sadoulet (1991). Peasant household behaviour with
missing markets: some paradoxes explained. Economic Journal, vol. 101, No. 409,

References
54
pp. 1400-1417.
Eswaran, M., and A. Kotwal (1985). A theory of two-tier labor markets in agrarian
economies. American Economic Review, vol. 75, Issue 1, pp. 162-77.
Evenson, R.E., and J. Roumasset (1986). Markets, institutions and family size in rural
Philippines households. Journal of Philippine Development, vol. 23, No. 23, pp. 141-
162.
Fafchamps, M. 1993. Sequential labor decisions under uncertainty: An estimable household
model of West-African farmers. Econometrica, vol. 61, No. 5 (September), pp. 1173-
1197.
Food and Agriculture Organization of the United Nations (2014). FAOSTAT - 2014. Rome:
FAO Statistics Division. Available from http://faostat3.fao.org/home/E.
G8 (2009). L’Aquilla Joint Statement on Global Food Security, G8 Summit. L’Aquilla, Italy
Goetz, S.J. (1992). A selectivity model of household food marketing behavior in Sub-
Saharan Africa. American Journal of Agricultural Economics, vol. 74, No. 2 (May),
pp. 444-452.
Heltberg, R., and F. Tarp (2001). Agricultural Supply Response and Poverty in
Mozambique. Discussion Paper No. 2001/114. Helsinki: United Nations University
World Institute for Development Economics Research (UNU-WIDER).
Hualing L., and others (2008). The value of guanxi for small vegetable farmers in China.
British Food Journal, vol. 110, Issue 4/5, pp. 412-429.
International Fund for Agricultural Development (2011). Rural Poverty Report 2011. New
Realities, New Challenges: New Opportunities for Tomorrow’s Generation. Rome.
Jodha, N.S. (1978). Effectiveness of farmers’ adjustment to risk. Economic and Political
Weekly, Special Issue on Agriculture A38-A48.
Key, N., E. Sadoulet, and A de Janvry (2000). Transaction costs and agricultural household
supply response. American Journal of Agricultural Economics, vol. 82, No. 2. pp.
245-259.
Kikuchi, M., and Y. Hayami (1999). Technology, market and community in contract choice:
Rice harvesting in the Philippines. Economic Development and Cultural Change, vol.
47, No. 2, pp. 371-86.
Kurosaki, T. (2003). Specialisation and diversification in agricultural transformation: The
case of West Punjab, 1903-92. American Journal of Agricultural Economics, vol. 85,
No. 2, pp. 372-386.
Marshal, A. (1920). Principles of Economics. Library of Economics and Liberty. Available

55
from www.econlib.org.
Mazumdar, D. (1987). Rural-urban migration in developing countries. Chapter 28. In
Handbook of Regional and Urban Economics. E.S. Mills,ed., vol. 2: 1097-1128.
Njehia, B.K. (1994). The impact of market access on agriculture productivity: A case study
of Nakuru district, Kenya. PhD dissertation, Hohenheim University, Germany.
North, D. (1981). Structure and Change in Economic History. New York: W.M. Norton.
Omamo, S.W. (2007). Farm-to-Market transaction costs and specialization in small-scale
agriculture: Explorations with a non-separable household model. Journal of
Development Studies, vol. 35, Issue 2, pp. 152-163.
Omot, N. (2010). Long distance marketing of sweet potato from the highlands of Papua
New Guinea: An analysis of consumer preferences and supplier responsiveness.
PhD Thesis, University of Canberra.
Omot, N., T. Wilson, and J. Anzen (2005). Peanut production, trading and utilisation in
Papua New Guinea. A Report to the Australian Centre for International Agricultural
Research. mimeo.
Papua New Guinea, Department of National Planning and Monitoring (2010). The Papua
New Guinea Development Strategic Plan 2011-2030.
Papua New Guinea, National Strategic Plan Taskforce (2011). Papua New Guinea Vision
2050. Available from www.treasury.gov.pg/html/publications/.../2011.png.vision.
2050.pdf
Reardon, T., and C.P. Timmer (2014). Five inter-linked transformations in the Asian agrifood
economy: Food security implications. Global Food Security, vol. 3, Issue 2 (July), pp.
108-117.
Rosenzweig, M., and K. Wolpin (1993). Credit market constraint, consumption smoothing,
and the accumulation of durable production assets in low-income countries:
Investments in bullocks in India. Journal of Political Economy, vol. 101, No. 2, pp.
223-244.
Roumasset, J., and J. Smith (1981). Population, technological change and the evolution of
labor markets. Population and Development Review, vol. 7, Issue 3, pp. 401-419
Roumasset, J., and M. Uy (1980). Piece rates, time rates and teams: Explaining patterns in
the employment relation. Journal of Economic Behavior and Organization, vol.1,
Issue 4, pp. 343-360.
Roumasset, J., and others (1995). Specialization and coevolution of agricultural markets.
Working Paper No. 165. Centre for Institutional Reform and the Informal Sector,

References
56
University of Maryland at College Park.
Roumasset, J., and S. Lee (2007). Labor: Decisions, contracts and organization. In
Handbook of Agricultural Economics, R. Evenson, and P. Pingali, eds. vol. 3, New
York: Elsevier.
Shaffner, J.A., 2001, Job stability in developing and developed countries: Evidence from
Columbia and the United States, Economic Development and Cultural Change,
vol.49, No. 3, pp. 511-535.
Smith, A. (1776). An Inquiry into the Nature and Causes of the Wealth of Nations. London:
Methuen & Co.
Stigler, G. J. (1951). The division of labor is limited by the extent of the market. Journal of
Political Economy, vol. 59, No. 3, pp. 185-193.
Thapa, G., and R. Guiha (2011). Smallholder farming in Asia and the Pacific: Challenges
and opportunities. Paper presented at the IFAD Conference on New Directions for
Smallholder Agriculture, January, 2011, Rome: IFAD.
Timmer, P. (2005). Agriculture and pro-poor growth: An Asian perspective. Working Paper
No. 63 (July 2005). Centre for Global Development.
United Nations (2012). The Future We Want. Outcome document of the United Nations
Conference on Sustainable Development, 2012. New York.
Wickramasinghe, U. (1995). The nature and causes of coping strategies among low-income
rural households. PhD dissertation, University of Hawaii at Manoa.
Wickramasinghe, U. (2014). Production specialisation and market participation of
smallholder agricultural households in developing countries. In Sustainable
Economic Development: Resources, Environment and Institutions, A.M. Balisacan,
U. Chakravorty, and M.L.V. Ravago, eds. New York: Elsevier.
World Bank (2014) World Development Indicators database: 2014. Washington, D.C.
Yang, J., and others (2013). The rise of cross-regional agricultural mechanization services
in China. American Journal of Agricultural Economics, vol. 95, No. 5 (October).
Yang, X. (2003). Economic Development and the Division of Labor, New York: Blackwell.
Young, A. A. (1928). Increasing returns and economic progress. The Economic Journal, vol.
38, No.152, pp. 527-542.
Zhang, X., and D. Hu (2011). Farmer-buyer relationships in China: the effects of contracts,
trust and market environment. China Agricultural Economic Review, vol. 3, Issue 1,
pp. 42-53.

57
Appendices
Appendix 1. Map of the study areas

Appendices
58
Appendix 2. Summary statistics: all farms
Variable Obs Mean Std. Dev. Min Max
Total sales (PGK) 198 1 632 4 974 0 65 300
Cash crop sales (PGK) 198 1 292 4 865 0 65 300
Staple sales (PGK) 198 108 310 0 2 300
Vegetable sales (PGK) 198 110 444 0 4 800
Fruits sales (PGK) 198 110 383 0 3 550
Cereal sales (PGK) 198 13 84 0 1 000
1=household head is female 198 0.16 0.37 0 1
Age of household head 198 41 11 16 77
Years of schooling 198 6 4 0 16
Number of adults in the family 198 3 2 0 10
Extent of land owned (ha) 198 2.18 2.20 0 18.9
Number of land parcels 198 4 2 0 11
1=Farms with irrigation and land improvement 198 0.45 0.50 0 1
1=Farms with cattle ownership 198 0.06 0.24 0 1
Value of farm equipment (PGK) 198 1 535 8 817 0 100 000
1=Farm hired labour 198 0.47 0.50 0 1
1=Farm used seed purchased 198 0.27 0.44 0 1
1=Farm used high-yielding varieties 198 0.17 0.38 0 1
1=Farm received extension services 198 0.13 0.34 0 1
1=Farm used fertilizer or pesticides 198 0.29 0.45 0 1
Number of crops cultivated 198 6.68 3.87 0 19
Number of crops sustained damages 198 2.70 2.70 0 13
1=Farm household received credit 198 0.14 0.34 0 1
1=Farm family has TV/Radio 198 0.28 0.45 0 1
1=Farm received advance price information 198 0.25 0.44 0 1
Average distance to markets (minutes) 198 119 191 0 1 560
Food expenditure (PGK) 198 151 299 0 3 101
Non-food expenditure (PGK) 198 46 134 0 860
1=Farm family had non-farm income 198 0.20 0.40 0 1
1=Farm family received assistance 198 0.14 0.34 0 1
Source: CAPSA survey (2012)

59
Appendix 3. Summary statistics: Farms that own less than 2 hectares of land
Variable Obs Mean Std. Dev. Min Max
Total sales (PGK) 115 893 1 506 0 9 690
Cash crop sales (PGK) 115 608 1 200 0 6 000
Staple sales (PGK) 115 79 267 0 2 300
Vegetable sales (PGK) 115 120 495 0 4 800
Fruits sales (PGK) 115 76 253 0 1 730
Cereal sales (PGK) 115 9 48 0 400
1=household head is female 115 0.15 0.36 0 1
Age of household head 115 42 11 25 72
Years of schooling 115 6 4 0 14
Number of adults in the family 115 3 2 0 10
Extent of land owned (ha) 115 1.02 0.60 0 2
Number of land parcels 115 4 2 0 11
1=Farms with irrigation and land improvement 115 0.50 0.50 0 1
1=Farms with cattle ownership 115 0.06 0.24 0 1
Value of farm equipment (PGK) 115 1 370 9 503 0 100 000
1=Farm hired labour 115 0.37 0.48 0 1
1=Farm used seed purchased 115 0.23 0.43 0 1
1=Farm used high-yielding varieties 115 0.15 0.36 0 1
1=Farm received extension services 115 0.07 0.26 0 1
1=Farm used fertilizer or pesticides 115 0.34 0.48 0 1
Number of crops cultivated 115 6.08 3.67 0 18
Number of crops sustained damages 115 2.61 2.74 0 12
1=Farm household received credit 115 0.17 0.37 0 1
1=Farm family has TV/Radio 115 0.19 0.40 0 1
1=Farm received advance price information 115 0.24 0.43 0 1
Average distance to markets (minutes) 115 103 181 0 1 560
Food expenditure (PGK) 115 131 308 0 3 101
Non-food expenditure (PGK) 115 34 104 0 600
1=Farm family had non-farm income 115 0.21 0.41 0 1
1=Farm family received assistance 115 0.12 0.33 0 1
Source: CAPSA survey (2012)

Appendices
60
Appendix 4. Summary statistics: Farms that own more than 2 hectares of land
Variable Obs Mean Std. Dev. Min Max
Total sales (PGK) 83 2 656 7 380 0 65 300
Cash crop sales (PGK) 83 2 239 7 301 0 65 300
Staple sales (PGK) 83 148 359 0 1 900
Vegetable sales (PGK) 83 96 365 0 3 077
Fruits sales (PGK) 83 156 509 0 3 550
Cereal sales (PGK) 83 18 118 0 1 000
1=household head is female 83 0.18 0.39 0 1
Age of household head 83 39 12 16 77
Years of schooling 83 5 4 0 16
Number of adults in the family 83 3 2 0 10
Extent of land owned (ha) 83 3.79 2.58 2.03 18.9
Number of land parcels 83 5 2 1 11
1=Farms with irrigation and land improvement 83 0.40 0.49 0 1
1=Farms with cattle ownership 83 0.06 0.24 0 1
Value of farm equipment (PGK) 83 1 764 7 818 0 54 220
1=Farm hired labour 83 0.61 0.49 0 1
1=Farm used seed purchased 83 0.31 0.47 0 1
1=Farm used high-yielding varieties 83 0.20 0.41 0 1
1=Farm received extension services 83 0.22 0.41 0 1
1=Farm used fertilizer or pesticides 83 0.22 0.41 0 1
Number of crops cultivated 83 7.51 4.00 0 19
Number of crops sustained damages 83 2.82 2.66 0 13
1=Farm household received credit 83 0.10 0.30 0 1
1=Farm family has TV/Radio 83 0.40 0.49 0 1
1=Farm received advance price information 83 0.27 0.44 0 1
Average distance to markets (minutes) 83 140 203 0.1 1 440
Food expenditure (PGK) 83 178 286 0 2 148
Non-food expenditure (PGK) 83 62 167 0 860
1=Farm family had non-farm income 83 0.18 0.39 0 1
1=Farm family received assistance 83 0.16 0.37 0 1
Source: CAPSA survey (2012)

61
Appendix 5. Regression results of farm sales of cash crops, staples, vegetables and total sales
Variables
Total sales
Cash crops
Staples Vegetables All land holders
Smallholders (L<2 ha)
Others (L>2)
1=HH is a female -0.731*** -0.257 -1.762*** -0.546 0.618 -1.072
(0.281) (0.436) (0.362) (0.460) (0.841) (0.897)
Age of HH 0.00615 0.0266* -0.0101 -0.00908 -0.00855 -0.0324
(0.010) (0.014) (0.015) (0.017) (0.031) (0.032)
No of years of schooling of HH
0.0302 0.0398 0.0652 -0.0299 -0.0674 0.013
(0.028) (0.038) (0.043) (0.046) (0.082) (0.086)
No of adults 0.0171 0.0388 -0.153* -0.164 0.307 0.335*
(0.066) (0.097) (0.084) (0.108) (0.192) (0.202)
Land owned (ha) 0.0851 -1.830* 0.343* 0.231 -0.465 -0.0457
(0.114) (0.932) (0.205) (0.182) (0.395) (0.417)
land owned (squared) -0.000996 0.943** -0.0154 -0.00687 0.00918 -0.0208
(0.007) (0.410) (0.011) (0.012) (0.038) (0.039)
No of land parcels 0.478** 0.724*** 0.482 0.813** 1.189** 0.159
(0.184) (0.249) (0.401) (0.321) (0.571) (0.543)
No of land parcels (Sq.) -0.0311* -0.0638** -0.0302 -0.0683** -0.0518 0.0434
(0.016) (0.026) (0.031) (0.027) (0.048) (0.047)
1=farm used irrigation or improved land
-0.746*** -0.252 -1.385*** -0.449 -2.173*** -1.342*
(0.244) (0.332) (0.362) (0.393) (0.751) (0.746)
1=farm owned cattle 0.675 0.606 0.218 1.657** -2.406 -2.603
(0.461) (0.782) (0.717) (0.713) (1.576) (1.838)
Ln(equipment value-PGK) 0.644*** 0.596*** 0.264 0.2 -0.0599 0.429
(0.152) (0.212) (0.228) (0.243) (0.487) (0.492)
Ln(equipment value-PGK) (squared)
-0.387*** -0.920* -0.467 -0.0934 0.00304 -0.689**
(0.098) (0.491) (0.349) (0.157) (0.300) (0.316)
1=farm hired labour -0.0175 -0.56 -0.36 0.101 0.261 -0.272
(0.223) (0.389) (0.295) (0.353) (0.665) (0.708)
1=farm used seed purchased
0.118 -0.0736 0.847** 0.654 -1.306 -0.886
(0.284) (0.493) (0.340) (0.441) (0.930) (0.975)
1=farm used high-yielding varieties
1.116*** 0.937 0.446 0.083 1.433 3.113***
(0.359) (0.605) (0.432) (0.554) (1.124) (1.170)

Appendices
62
Appendix 5. Regression results of farm sales of cash crops, staples, vegetables and total sales
Variables
Total sales
Cash crops
Staples Vegetables All land holders
Smallholders (L<2 ha)
Others (L>2)
1=farm received extension services
0.38 1.006 -0.289 0.481 1.893** 1.301
(0.301) (0.618) (0.351) (0.459) (0.889) (0.967)
1= farm used chemical fertilizer or pesticide
-0.545** -1.201*** -0.308 -0.0194 -0.945 -0.12
(0.245) (0.330) (0.367) (0.400) (0.745) (0.766)
No of crops cultivated 0.0685** 0.0768* 0.00118 0.168*** -0.0379 -0.0792
(0.029) (0.042) (0.040) (0.045) (0.085) (0.092)
No of crops damaged 0.011 0.0653 -0.0198 -0.0947 0.459*** 0.244**
(0.039) (0.054) (0.053) (0.063) (0.115) (0.121)
1=family obtained credit 0.00752 0.29 -1.088** 0.0378 0.721 0.84
(0.313) (0.402) (0.486) (0.494) (0.975) (0.959)
1= family owned mobile phones, TV or radio
0.0258 0.159 -0.234 -0.998** 0.325 0.791
(0.270) (0.398) (0.333) (0.439) (0.824) (0.878)
1=family received advance price information
0.619** 1.247*** 0.72 1.311*** -1.632* 0.222
(0.269) (0.390) (0.433) (0.418) (0.838) (0.850)
District dummy 0.895*** 1.197*** 0.519 1.734*** 0.399 -1.711*
(0.297) (0.405) (0.430) (0.476) (0.865) (0.919)
Distance to markets (inverse)
-0.521*** -0.474*** -0.617*** -0.819*** -0.139 -0.192
(0.063) (0.087) (0.092) (0.129) (0.176) (0.194)
Family food expenditure 0.000203 0.000365 0.000355 0.00142*** -0.00505* -0.00453*
(0.000) (0.000) (0.000) (0.001) (0.003) (0.002)
Family non-food expenditure
0.00192** 0.00222 0.00209** 0.00413*** 0.00141 -0.00205
(0.001) (0.002) (0.001) (0.001) (0.002) (0.003)
Family non-farm income 0.137 -0.386 0.516 -0.554 2.502*** 0.269
(0.280) (0.365) (0.469) (0.464) (0.852) (0.854)
Family assistance received -0.27 -0.299 -0.588 0.177 0.174 0.799
(0.305) (0.413) (0.446) (0.487) (0.875) (0.943)
Constant 1.679** -0.225 2.123 -2.471* -3.28 2.233
(0.739) (0.904) (1.368) (1.330) (2.256) (2.232)
Sigma 1.330*** 1.228*** 1.015*** 1.793*** 2.893*** 3.191***
(0.075) (0.093) (0.084) (0.119) (0.296) (0.318)
Observations 198 115 83 198 198 198

63
Appendix 5. Regression results of farm sales of cash crops, staples, vegetables and total sales
Variables
Total sales
Cash crops
Staples Vegetables All land holders
Smallholders (L<2 ha)
Others (L>2)
Left censored observations 27 20 7 129 135 130
Log likelihood -307.81 -173.25 -116.14 -305.45 -209.99 -234.67
LR chi^2 239.99 142.35 116.39 213.38 77.27 48.37
Prob>chi^2 0.0000 0.0000 0.0000 0.0000 0.0000 0.0000
Pseudo R2 0.2805 0.2912 0.3338 0.2589 0.1554 0.0934
Standard errors in parentheses: *** p<0.01, ** p<0.05, * p<0.1