capitol corridor · capitol corridor 2014 vision plan update final report november 19, 2014 ccjpa...
TRANSCRIPT

CAPITOL CORRIDOR
2014 Vision Plan Update
Final Report
November 19, 2014
CCJPA Board Adoption

2014 VISION PLAN UPDATE FINAL VERSION | CAPITOL CORRIDOR
Capitol Corridor Joint Powers Authority
Nelson\Nygaard Consulting Associates Inc. | i
Table of Contents
Page
1 Introduction ......................................................................................................................... 3
2 Background ......................................................................................................................... 4 History of Growth ............................................................................................................................................... 5 Recent Funding and Outlook ............................................................................................................................. 6 Blended Plan and the IPR Coalition ................................................................................................................. 7 Prior Vision Plan Updates, Regional Rail Plan, and Emerging Megaregion Plan .................................. 7
3 Short- and Medium-Term Plans .......................................................................................... 9 Short-Term Plan ................................................................................................................................................... 9 Medium-Term Plan ............................................................................................................................................ 12
4 Long-Term Plan ................................................................................................................. 15 Principles and Objectives ................................................................................................................................ 15 Toolbox ............................................................................................................................................................... 16 Responding to Climate Change and Sea-Level Rise .................................................................................. 18 Process ................................................................................................................................................................. 21 Concepts by Segment....................................................................................................................................... 22 Travel Time by Alignment Alternatives ......................................................................................................... 33
5 Initial Ridership Analysis.................................................................................................. 38 Ridership Modeling Results .............................................................................................................................. 41 Other Ridership and Market Analysis Tools ................................................................................................ 42
6 Next Steps ......................................................................................................................... 44 Vision Implementation Plan Elements ............................................................................................................. 44 Vision Communications Plan ............................................................................................................................ 46
Appendix A Conceptual Schedules ........................................................................................... 47
Table of Figures
Page
Figure 2-1 Capitol Corridor Service Area ............................................................................................... 5
Table 3-1 Oakland to San Jose Frequency Expansion, Phase Two ................................................ 10
Table 3-2 Placer County Service Expansion ........................................................................................ 10
Table 3-3 Monterey County Service Extension .................................................................................... 11
Table 3-4 Oakland to San Jose Frequency Expansion Table – Phase Three................................ 12
Table 3-5 Placer County Service Expansion ........................................................................................ 13
Table 3-6 Monterey County Service Extension .................................................................................... 13
Figure 4-1 San Jose-Oakland Alignment Alternatives ........................................................................ 24
Figure 4-2 Alignments through Central Oakland ................................................................................. 26
Figure 4-3 Richmond-Suisun/Fairfield Alternatives .............................................................................. 29
Figure 4-4 Reconstructed Freight Right-of-Way in Suisun/Fairfield-Sacramento Segment ........ 32
Figure 4-5 Martinez-Richmond Alignment Options .............................................................................. 33

2014 VISION PLAN UPDATE FINAL VERSION | CAPITOL CORRIDOR
Capitol Corridor Joint Powers Authority
Nelson\Nygaard Consulting Associates Inc. | ii
Figure 4-6 Oakland-San Jose Alignment Options ............................................................................... 35
Table 4-1 Alternative Alignments and Baseline Travel Times ........................................................... 36
Table 4-2 Adjusted Travel Times ............................................................................................................ 36
Table 5-3 Adjusted Travel Times ............................................................................................................ 41
Table 5-1 Ridership Estimates ................................................................................................................. 42
Table A-1 Schedule: Alternative A: Southbound/Westbound:AM/Mid-Day ................................. 47
Table A-2 Schedule: Alternative A: Southbound/Westbound:PM .................................................... 48
Table A-3 Schedule: Alternative A: Northbound/Eastbound:AM/Mid-Day ................................... 49
Table A-4 Schedule: Alternative A: Northbound/Eastbound:PM ...................................................... 50
Table A-5 Schedule: Alternative B: Southbound/Westbound:AM/Mid-Day ................................. 51
Table A-6 Schedule: Alternative B: Southbound/Westbound:PM .................................................... 52
Table A-7 Schedule: Alternative B: Northbound/Eastbound:AM/Mid-Day ................................... 53
Table A-8 Schedule: Alternative B: Northbound/Eastbound:PM ...................................................... 54
Table A-9 Schedule: Alternative C: Southbound/Westbound:AM/Mid-Day ................................. 55
Table A-10 Schedule: Alternative C: Southbound/Westbound:PM .................................................... 56
Table A-11 Schedule: Alternative C: Northbound/Eastbound:AM/Mid-Day ................................... 57
Table A-12 Schedule: Alternative C: Northbound/Eastbound:PM ...................................................... 58

2014 VISION PLAN UPDATE FINAL REPORT | CAPITOL CORRIDOR
Capitol Corridor Joint Powers Authority
Nelson\Nygaard Consulting Associates Inc. | 3
1 INTRODUCTION This update of the Capitol Corridor Vision Plan is the first update to the Vision Plan in nine years.
The updated vision outlined in this document represents a bold departure from the past. It
envisions a railroad dramatically different from what exists today: much faster, more frequent,
cleaner, quieter, better connected and altogether more attractive to users.
The Capitol Corridor envisioned in this document would be a modern railroad built to
international standards, electrified and capable of top speeds of 150 miles per hour. This could
reduce travel times between Sacramento and Oakland to roughly an hour, and between Oakland
and San Jose to a half-hour. This plan also envisions a direct connection to BART in central
Oakland, just minutes from San Francisco.
To achieve this vision, billions of dollars in investments would be required. This plan represents a
first step toward mapping out a long-term strategy for investment. It outlines a range of options
for improving speeds, as well as improving reliability and addressing the effects of climate change
and sea-level rise. It also includes preliminary analysis of the potential performance and impacts
of those improvements. However, other elements such as potential costs and an implementation
strategy will be included in future companion planning documents.
In addition to this introduction, this document includes:
Necessary context for the Vision Plan, including a review of the Capitol Corridor’s
administrative structure, history, funding sources and partnerships, as well as a review of
previous relevant plans including a 2013 draft update that formed the basis for this
document.
A summary of the Capitol Corridor’s existing short- and medium-term plans.
A description of the long-term Vision Plan, including principles and objectives, the
toolbox of measures used, implications of sea level rise, the Plan process and the draft
alternatives that have been developed.
Next steps in the planning process.

2014 VISION PLAN UPDATE FINAL REPORT | CAPITOL CORRIDOR
Capitol Corridor Joint Powers Authority
Nelson\Nygaard Consulting Associates Inc. | 4
2 BACKGROUND The Capitol Corridor runs 15 daily round trips between Sacramento and the Bay Area. The Capitol
Corridor Joint Powers Authority (CCJPA) oversees the service, with Amtrak running day-to-day
operations under contract. For most of the route’s 171 miles, trains operate on tracks owned by
the Union Pacific Railroad (UPRR), though Caltrain owns the tracks used for the southernmost
2.5 miles of the route. Most of the system’s rolling stock is owned by the State of California,
administered through the California Department of Transportation (Caltrans) Division of Rail,
but the authority leases some additional train sets through Amtrak.
The CCJPA is governed by a Board of Directors comprised of 16 elected officials from six member
agencies along the route:
Placer County Transportation Planning Agency (PCTPA)
Solano Transportation Authority (STA)
Yolo County Transportation District (YCTD)
Sacramento Regional Transit District (Sac RT)
San Francisco Bay Area Rapid Transit District (BART)
Santa Clara Valley Transportation Authority (VTA)
Ex-officio members of the CCJPA include the two metropolitan planning organizations along the
route, the Metropolitan Transportation Commission (MTC) and the Sacramento Area Council of
Governments (SACOG).
As administrator for the Capitol Corridor, the CCJPA’s responsibilities include overseeing day-to-
day train and bus scheduling and operations, overseeing the Amtrak-owned rolling stock used on
the Capitol Corridor and San Joaquin routes, and interfacing with Amtrak and the UPRR on
dispatching, engineering, and other railroad-related issues.
Today, the Capitol Corridor serves 17 stations in Placer, Sacramento, Yolo, Solano, Contra Costa,
Alameda, and Santa Clara counties. Figure 2-1 shows the alignment, which parallels the I-80/I-
680 highway corridor between Sacramento and Oakland and I-880 between Oakland and San
Jose.

2014 VISION PLAN UPDATE FINAL REPORT | CAPITOL CORRIDOR
Capitol Corridor Joint Powers Authority
Nelson\Nygaard Consulting Associates Inc. | 5
Figure 2-1 Capitol Corridor Service Area
To supplement train service, the Capitol Corridor provides dedicated bus connections to San
Francisco and communities south of San Jose and east of Sacramento. In addition, the CCJPA
works with transit agencies and other partners to provide local connections throughout the
corridor. The train service connects with BART at the Richmond and Oakland Coliseum stations;
Caltrain at San Jose Diridon station; the Altamont Commuter Express (ACE) commuter rail line
at the Fremont/Centerville, Great America/Santa Clara, and San Jose Diridon stations; the San
Joaquin line at Oakland Jack London, Emeryville, Richmond, Martinez, and Sacramento stations;
VTA light rail at Great America and San Jose Diridon stations; and Sac RT light rail at
Sacramento station. Together with these local transit systems, the Capitol Corridor covers the
second-largest urban service area in the Western United States.
HISTORY OF GROWTH
On December 12, 1991, Caltrans and Amtrak launched the Capitol Corridor with six daily trains,
or three round trips, between San Jose and Sacramento. State legislation established the CCJPA
in 1996, and a 1998 Interagency Transfer Agreement officially gave the CCJPA responsibility for
the service for an initial three-year term. After an extension in July 2001, the sunset date was
eliminated in 2003, establishing CCJPA as permanent manager of the Capitol Corridor.

2014 VISION PLAN UPDATE FINAL REPORT | CAPITOL CORRIDOR
Capitol Corridor Joint Powers Authority
Nelson\Nygaard Consulting Associates Inc. | 6
In response to growing demand in the early 2000s, the CCJPA expanded service three times in
2002-2003 to a schedule of 12 weekday roundtrips between Sacramento and Oakland, using the
same budget as was allocated for nine daily round trips. The authority expanded service again
without an increased budget allocation in 2006, growing to 16 weekday (11 weekend day) round
trips between Sacramento and Oakland, which amounted to hourly service in that segment. Seven
of the daily round trips traveled the full length of the route, serving San Jose. A first phase of
Oakland-San Jose track improvements and the addition of a second main track on the Yolo
Causeway contributed to a 10-minute travel-time reduction and enabled the expansion in San
Jose service.
The opening of the new Sacramento Station in August 2012 allowed the CCJPA and San Joaquin
services to optimize their operations at the station. The update added greater track capacity,
which allowed the CCJPA to transfer two daily round trips to the sister service, leaving the Capitol
Corridor with 30 daily trains, or fifteen round trips. Seven of the round trips still reach San Jose,
and one reaches as far east as Auburn. Current service levels use all of the negotiated “slots”
reserved for passenger trains on the Union Pacific Railroad’s right-of-way, and as such, further
expansions will require additional negotiations or the construction of dedicated passenger right-
of-way. The latter is discussed in this long-term plan.
The track-capacity improvements, corresponding service expansions, and train equipment
acquisitions have enabled the Capitol Corridor to significantly grow ridership and revenues over
the last decade, and the route is now the third busiest in the Amtrak national system.
RECENT FUNDING AND OUTLOOK
The Capitol Corridor outlined a short-term vision in the early 2000s, but a lack of capital funding
sources stalled progress on most of the short-term improvements included in the document.
Since the vision was first expressed in 2002 and updated again in 2005, adjustments to the State
Transportation Improvement Program’s funding-allocation formulas, which previously provided
steady support for intercity passenger rail, resulted in an approximate 90 percent decrease in
capital funding. California’s budgetary difficulties during the period and the 2008 recession
exacerbated the situation. Though California voters approved several state bond measures that
provided some money for short-term improvements over the last decade and a half, the CCJPA
was unable to find enough capital to move forward on many pieces of that original vision.
However, prospects for new funding look better today than they have in many years. State
lawmakers allocated $50 million in revenues from the new Cap and Trade program for local
transit and intercity rail investments in the program’s first year. Federal policymakers have also
increased their focus on intercity passenger rail in recent years, though it has not yet amounted to
much new funding. The 2008 Passenger Rail Investment and Improvement Act jump-started the
nation’s focus on a high-speed and intercity passenger rail, and though Congress let it expire in
2013 without allocating funding to it, policymakers have been considering a replacement bill to
establish a steady source of merit-based project funding. President Obama’s most recent five-year
budget proposal also allocated $40 billion toward intercity and high-speed rail projects, though
Congress has not approved funding at this level.
Stakeholders at the state and federal levels are also exploring alternatives to the gas tax as the
country’s primary source of transportation funding. The buying power of the federal gas tax has
been steadily declining over the last two decades, and a combination of increased fuel efficiency
and declining levels of per capita vehicle miles traveled have further reduced the transportation-

2014 VISION PLAN UPDATE FINAL REPORT | CAPITOL CORRIDOR
Capitol Corridor Joint Powers Authority
Nelson\Nygaard Consulting Associates Inc. | 7
funding pie. Despite political gridlock in Washington, D.C., a growing recognition of this problem,
combined with an increasing sense of urgency to make investments in steadily deteriorating
infrastructure, make it increasingly likely that policymakers will come up with a solution in the
coming years.
In sum, while funding has declined at the state and federal levels in recent years, the prospects for
future increases are looking better than they have in quite some time. This vision will position the
Capitol Corridor to take advantage of new funding opportunities to help the service reach its true
potential as the spine of the megaregion.
BLENDED PLAN AND THE IPR COALITION
The State of California began taking significant strides to truly integrate passenger rail services
across the state in 2012. The California High Speed Rail Authority’s (CHSRA) business plan called
for a system that blended high-speed rail with intercity services, reducing capital costs while
maximizing the impact of high-speed-rail-related investments. The Capitol Corridor, San
Joaquin, and Pacific Surfliner joined in supporting the plan.
Today, working groups for Northern and Southern California, each including representatives
from the CHSRA and the Federal Railroad Administration and with direction from the California
State Transportation Agency (CalSTA), are jointly pursuing a variety of planning efforts to ensure
that the various operators are strongly integrated in time for funding milestones. In the short
term, as the high-speed rail system is built out, Intercity Passenger Rail (IPR) services would
provide a bridge between the Central Valley and the state’s major metropolitan areas. Over the
long term, IPRs would provide complementary services in corridors in which high-speed rail
operates and branch off in other areas to extend the state’s rail service area to smaller cities.
The IPR coalition’s ultimate vision is that Northern California’s rail operators would join together
in rolling-stock procurement, service and operations planning, funding advocacy, and capital-
project prioritization, to grow passenger rail use in California over the long term. For future
customers, the groups’ goal is that blended services will integrate seamlessly with each other and
with the broader transportation system. This would represent a major change in the way
customers relate to passenger rail in California.
PRIOR VISION PLAN UPDATES, REGIONAL RAIL PLAN, AND EMERGING MEGAREGION PLAN
The plan also comes on the heels of two major planning efforts led by MTC, the Bay Area’s
Regional Rail Plan and the Northern California Emerging Megaregion Plan.
The Regional Rail Plan, released in 2007, called for a significant increase in rail investments and
called out the Capitol Corridor as an important part of that vision. Capitol Corridor-related
investments called for in the plan included expanding to at least three sets of tracks between San
Jose and Sacramento, with a four-track section between Oakland and Richmond and in Solano
County. It projected that with these investments, travel times between San Jose and Sacramento
could be reduced to 149 minutes. It called for better coordination among all of the region’s
operators, to help with freight-operator negotiations, and it highlighted right-of-way acquisition
as a high priority.
The Emerging Megaregion Plan, released in 2009, was one of the first efforts to understand
interregional issues in the Sacramento-Bay Area corridor, connected by I-80 and the Capitol

2014 VISION PLAN UPDATE FINAL REPORT | CAPITOL CORRIDOR
Capitol Corridor Joint Powers Authority
Nelson\Nygaard Consulting Associates Inc. | 8
Corridor. The report was an outgrowth of the efforts of a steering committee that convened in
2006 with staff from regional agencies, Caltrans, the regional air districts, local governments
along the corridor, and other stakeholders. It compared several travel-demand forecasts for the
corridor and noted that freight traffic between the regions is projected to increase significantly
over the coming decades, putting additional pressure on private auto travel and passenger rail
services. Though the model projections showed varying levels of Capitol Corridor ridership
growth, the report called on the regions to prioritize capital investments for the train line and find
a dedicated funding source for the service. Tolling I-80 was one potential funding source noted in
the report.
This Vision also follows in the footsteps of the several previous CCJPA visioning efforts. The
authority developed an initial vision for the route in 2002, as it initiated the projects that would
lead to the 2006 service expansion. The document simply aimed to articulate what was next for
the authority after those capital projects. As the state budget situation changed, the authority
updated the vision in 2005, identifying short- and long-term goals to guide the CCJPA’s operating
and capital-development plans for the next 20 years. As noted earlier, very little of the updated
vision has been implemented because of the state’s budgetary situation over the last decade.
As the financial outlook for intercity passenger rail brightened and as high-speed-rail planning
and coordination efforts gained momentum, the CCJPA set out to update the vision in 2012, and
released a draft Vision Plan update in 2013, which, based on CCJPA Board direction at the time,
served as the foundation for this document. The 2013 draft update laid out a specific set of short-
and medium-term projects and noted in more general terms potential long-term projects that
would increase speeds and frequencies in different segments of the corridor. This document
builds on the objectives stated by the CCJPA Board in 2013 and further develops many of these
ideas, noting specific alignment alternatives in each segment.

2014 VISION PLAN UPDATE FINAL REPORT | CAPITOL CORRIDOR
Capitol Corridor Joint Powers Authority
Nelson\Nygaard Consulting Associates Inc. | 9
3 SHORT- AND MEDIUM-TERM PLANS The Capitol Corridor’s long-term vision will be built on smaller short- and medium-term projects
that, together, have the potential to significantly improve the service and ensure that capital
assets in the corridor stay in working order. The sections below note specific projects that can be
executed, at a moderate cost, in the next 10 to 20 years. They largely presume the same rolling
stock equipment, operating speeds, and look and feel of the Capitol Corridor service as it exists
today, unless noted. It is critical to also understand that the Capitol Corridor service in the short
and medium term will continue to be the tenant to Union Pacific Railroad and Caltrain. This
directly influences the scope and content of the short and medium term service expansion plans.
SHORT-TERM PLAN
Over the short term, the Capitol Corridor is focused on service-expansion projects the agency has
been pursuing since 2005. It is feasible for all of these projects to be under construction or
completed in the next 10 years.
The 2006 service expansion, and the resulting increases in ridership and revenue, showed the
potential of the San Jose-Oakland market with the completion of the Oakland to San Jose Phase
One project, and the short-term vision includes investments that would further bolster this part of
the corridor. The plan also notes other markets with potential for growth, including Placer County
and areas south of San Jose, to Salinas. This Vision Plan update targets each of these markets for
extensions or service frequency increases. The short-term plan also includes additional on-board
and station amenities.
Oakland to San Jose Service Frequency Expansion: Phase Two
Phase two of the Oakland-San Jose service expansion would build incrementally on the first
phase, growing from 7 to 11 daily round trips. This expansion will require rail-infrastructure
improvements in that section of the corridor, to both preserve existing and enable future growth
patterns for both freight and passenger services. The CCJPA will continue to work with the host
railroads (UPRR and Caltrain) to implement the particular blend of track infrastructure projects
that will provide the appropriate track-capacity enhancements.
Specifically, the CCJPA is exploring a change in route south of the Oakland Coliseum that may
offer travel time savings and allow for better operating patterns than the existing alignment. If the
CCJPA pursues such a shift, the authority will work with Hayward and Fremont, two
communities that would see low-ridership stations moved, to identify an appropriate location and
build a replacement station on the new alignment. Based on ridership modeling using the Amtrak
Ridership and Revenue Model, the change in alignment and accompanying service increase does
yield some minor ridership difference from the current alignment, and that improves slightly
when a new station is added. The context of a decision to select a new alignment or remain on the
existing alignment with respect to this project will need further analysis and the process for doing

2014 VISION PLAN UPDATE FINAL REPORT | CAPITOL CORRIDOR
Capitol Corridor Joint Powers Authority
Nelson\Nygaard Consulting Associates Inc. | 10
so is outlined below in the discussion of the long-term vision. There are aspects of the Oakland-
San Jose service expansion that are not related to the alignment options and those improvements,
south of Fremont, will be pursued while analysis is being conducted on alignment options.
The ultimate vision is to grow service to 16 daily round trips. The medium-term plan includes the
infrastructure and service-plan changes needed to make this happen.
Table 3-1 Oakland to San Jose Frequency Expansion, Phase Two
Phase Status Frequency Gain Funding Secured Funding Need
Estimate
Phase Two Planned 7 to 11 round-trips $50.8 Million $250 Million
Placer County Service Expansion
Placer County stations have been served by one westbound morning train and a late
afternoon/early evening eastbound train since Capitol Corridor service began in 1996. Expanding
this service is one strategy for reducing congestion on the section of I-80 between Sacramento
and Auburn, which has seen increased volumes since the 1990s and is projected to see further
increases in the future.
The CCJPA and UPRR nearly partnered to make track improvements that would enable one
additional daily round trip in this portion of the corridor, but the UPRR ultimately had to invest
elsewhere in its railroad network.
The 2005 Vision Plan included a goal of increasing service between Roseville and Sacramento.
Since the plan was released, the CCJPA has now completed the initial design and the
environmental documentation processes is underway a this time to grow from today’s single daily
round trip to ten. This work laid a foundation that will allow the authority to move directly into
construction, should sufficient funding become available in the coming years. Construction is
expected to be completed in phases, allowing for incremental growth in service levels over the
short term. Investments required to meet the 10-round-trip goal are included in the medium-
term plan. The projected five round trips and costs noted in Table 3-2 are a placeholder, subject
to future negotiations, phasing discussions, and funding availability.
Table 3-2 Placer County Service Expansion
Phase Status Frequency Gain Funding Secured Funding Need
Estimate
Auburn Expansion
Planned 1 to 2 round-trips $0 $50 Million
Roseville Expansion
Planned 1 (2, with Auburn Expansion) to 5 round-
trips
$18.8 Million $100 Million

2014 VISION PLAN UPDATE FINAL REPORT | CAPITOL CORRIDOR
Capitol Corridor Joint Powers Authority
Nelson\Nygaard Consulting Associates Inc. | 11
Monterey County Extension
Highway congestion between San Jose and Salinas along U.S. Highway 101 is a common
frustration for travelers. The Transportation Agency for Monterey County (TAMC) approached
both Caltrain and CCJPA management to explore which extension of service would best meet
transportation needs along the corridor, and the Capitol Corridor’s equipment and service pattern
best fit the desired operating needs.
An expansion of service to Salinas will only be possible once the Phase Two service expansion
between Oakland and San Jose is implemented. The new Monterey County service would require
two additional train sets. Other capital costs include a phased upgrade to stations along the route
and track-infrastructure upgrades. Existing plans would have service launch with two daily round
trips between San Jose and Salinas, and the eventual goal is expand to as many as six. This
extension is not yet adopted by the CCJPA Board but is included here as a significant governance
and service modification to Capitol Corridor that must be considered in the vision planning
process.
Table 3-3 Monterey County Service Extension
Phase Status Frequency Gain Funding Secured Funding Need
Estimate
Salinas Extension
Planned 2 round-trips $45 million $175 Million
Other Service Extension Options Considered
Over the last 15 years, Capitol Corridor has explored a possible service expansion east of Auburn,
to Reno, Nevada. The idea was largely driven by the natural linkage between the Bay Area and
seasonal recreation opportunities in the communities in and around Lake Tahoe. Prior studies
dismissed the idea because of the frequency of freight rail trips in the corridor, and freight rail use
has actually increased since the idea was last studied in detail. The idea also faces political and
funding challenges. Adding this to the Capitol Corridor’s short-term plan would require a
significant change in political priorities driven by an event like a successful Reno-Tahoe Winter
Olympics bid. This potential extension is not considered further in the vision planning process
due to the inherent travel and market barriers previously analyzed.
Short-Term Service Amenities
The Capitol Corridor has introduced two major new station and on-board amenities since the
2005 Vision Plan: e-ticketing and free passenger Wi-Fi. This version of the plan aims to build on
these improvements to keep Capitol Corridor service as comfortable and convenient for
passengers as possible.
The plan includes a comprehensive on-board information system (OBIS). The Capitol Corridor
and the Caltrans Division of Rail are in the early stages of working with a vendor selected by
Amtrak (CCJPA and Caltrans were on the selection team) for OBIS implementation. An OBIS will
feature a mixture of automated video and audio communications to provide real-time travel
updates, station arrival information, and alerts. The system will also allow the CCJPA to use
screen space for advertising, service promotions, and upcoming service alerts. Each car in the
fleet and any cars added to the fleet will be retrofitted to include these upgrades over time, with
implementation starting this year.

2014 VISION PLAN UPDATE FINAL REPORT | CAPITOL CORRIDOR
Capitol Corridor Joint Powers Authority
Nelson\Nygaard Consulting Associates Inc. | 12
The system will also continue regular Wi-Fi system updates. Future updates could include
features that would provide digital media content (movies, television, and games) via the network.
Digital media rights and delivery systems are, like technology, evolving quickly, and it is likely
that a company will create a viable business model for delivering digital media to train customers
in the United States in the near future. CCJPA plans to remain actively engaged with Amtrak and
digital-media content providers on this front in the future.
The plan also includes bicycle-access improvements at stations and on trains. Bicycles are a
growing access mode for the system, and existing train cars are not always able to accommodate
the increased levels of demand. In the last few years, Caltrans helped modify some train-car
models to nearly double available bicycle parking. Projected increases in bicycle demand will
require similar modifications to additional cars in the Capitol Corridor’s fleet. The CCJPA will
also work to improve bicycle infrastructure at stations. The authority’s Bicycle Access Plan
included the introduction of secure lockers and folding bicycle rental services, both of which will
create more options for bicyclists. Installation of these amenities will start in early 2015, and
further expansions will happen as demand warrants. The Capitol Corridor will also support local
communities’ efforts to expand bike sharing to the system’s stations.
MEDIUM-TERM PLAN
The medium-term plan is comprised mostly of expansions that build on those included in the
short-term plan service.
Oakland to San Jose Service Expansion: Phase Three
Building on the Phase Two service expansion, Phase Three would allow all 15 daily round trips
between Oakland and Sacramento to serve the whole corridor, reaching San Jose. The exact mix
of infrastructure improvements required for such an expansion will require further study, but
they would likely include double- or triple-tracking the segment running over the Alviso
Wetlands, which currently only includes a single track. Designs will need to be mindful of future
sea levels and the surrounding wetlands (see the section addressing this issue in Chapter 4).
Given the sensitive environment, this phase will likely require a detailed environmental review
and significant mitigations, and design and engineering for this segment are likely to be
challenging. Further analysis as described after the long-term vision section will direct the nature
of the improvements so that an effective capital investment strategy can be applied over time.
Table 3-4 Oakland to San Jose Frequency Expansion Table – Phase Three
Phase Status Frequency Gain Funding Secured Funding Need
Estimate
Phase Three Planned 11 to 15 round-trips $0 $210 Million
Placer County Service Frequency Expansion
Building on the projects included in the short-term plan, service expansion in Placer County will
likely require a station relocation and the construction of a third mainline track, with several track
crossovers along the right-of-way. It will also likely require a new American River bridge crossing.
Environmental review is currently underway, and while design is more of less established for the
exact linear alignment and bridge elements required for this project a phasing process related to

2014 VISION PLAN UPDATE FINAL REPORT | CAPITOL CORRIDOR
Capitol Corridor Joint Powers Authority
Nelson\Nygaard Consulting Associates Inc. | 13
funding will help define the remaining phased construction required after the implementation in
the first or early phases as described in the short-term section above.
Table 3-5 Placer County Service Expansion
Phase Status Frequency Gain Funding Secured Funding Need
Estimate
Roseville Expansion
Planned 5 to 10 round-trips $0 Million $100 Million
Monterey County Service Expansion
Medium-term projects will build on short-term projects in the corridor between San Jose and
Salinas, growing service to six daily round trips. As with the short-term plan’s reliance on Phase
Two Oakland-San Jose improvements, the medium-term plan’s service expansions would likely
require Phase Three improvements. The medium-term expansion in the area will also require a
complete operational analysis, considering additional rolling stock needs and capital-
improvement requirements.
Table 3-6 Monterey County Service Extension
Phase Status Frequency Gain Funding Secured Funding Need
Estimate
Salinas Extension
Planned From 2 to 6 round-trips $0 million $200 Million
Medium-Term Service Amenities
Given the pace of technological innovation, it would be futile to plan for specific technology-
related amenity improvements in the 10- to 20-year timeframe however the concept of
maintaining a data pipe connection to and within the moving train will remain a core necessity.
CCJPA must simply be ready to update passenger amenities to keep pace with changes in the way
customers work and entertain themselves. Ticketing is one area in which train travel is likely to
evolve in this period, potentially making tickets more versatile or customizable to better match
both customer and revenue objectives and also mesh with the larger state-wide objectives for
blending passenger rail services.
Demand for other amenities, such as food service, bicycle storage, and customer communications
will likely grow as the service evolves and ridership changes over time. The maturation of
Northern California’s blended passenger rail system and California High Speed Rail are also likely
to require additional investments in station and on-board amenities, to make the passenger
experience consistent across operators.
Medium-Term Speed-Related Improvements
The following chapter describes the Capitol Corridor’s long-term plan. The alternatives described
in the chapter are “build-out” concepts that would be implemented incrementally over a long
period. An implementation strategy including a project timeline will be developed following
adoption of this Vision Plan Update which will include identification of a cost effective capital

2014 VISION PLAN UPDATE FINAL REPORT | CAPITOL CORRIDOR
Capitol Corridor Joint Powers Authority
Nelson\Nygaard Consulting Associates Inc. | 14
investment plan which maximizes the public investment in the service, however some
investments will clearly not be as beneficial as others. It is clear, however, that initial steps could
be taken upon completion of the short-term plan (or earlier, depending on available funding and
political support).
One key policy decision that will have to be made in developing an implementation strategy will
be the extent to which speed- and capacity-related improvements should be made to segments
that would eventually be abandoned. Cost-benefit analysis will need to be conducted to determine
the value of such “throwaway” investments; it might make sense, for example, to make low-cost
improvements with substantial benefits to a segment that will eventually be abandoned, but not
for some time. This analysis will be contained in the Vision Implementation Plan outlined below
and this plan will serve as the companion to this Vision Plan Update.

2014 VISION PLAN UPDATE FINAL REPORT | CAPITOL CORRIDOR
Capitol Corridor Joint Powers Authority
Nelson\Nygaard Consulting Associates Inc. | 15
4 LONG-TERM PLAN The long-term plan lays out a vision for making the Capitol Corridor a fast, reliable, comfortable,
and convenient transit spine for the Northern California Megaregion. It looks at potential
investments that could be made over the next 40 or 50 years, and while many of the potential
projects outlined below would require significant capital expenditures, finding funding for such
large expenditures is reasonable over the course of this long timeframe. It is critical that the
CCJPA and its partners agree on a long-term plan for the service to ensure that investments made
in the short and medium terms align to this vision.
As mentioned previously, and as will be discussed below, a next step in the planning process will
be to examine in detail the short-, medium-, and long-term capital investments covered in the
companion to this Vision Plan Update, to identify preferred improvements, and to identify the
sequence in which they should be implemented.
This section lays out the principles and objectives that undergird the plan, the general options for
meeting these objectives, long-term environmental issues that must be a top consideration of any
long-term investments, and sketch-level alignment alternatives for each segment of the route. A
noted departure from the short- and medium-term plan is that the long-term plan is largely
predicated on the Capitol Corridor obtaining right-of-way so that it is generally no longer a tenant
to a host railroad and instead dictates its own service destiny.
PRINCIPLES AND OBJECTIVES
The Capitol Corridor has the potential to be the transit spine of the emerging megaregion
comprised by the Sacramento metropolitan area and the Bay Area. There are strong economic
linkages between the two regions today, and the regions’ combined population of 9.6 million is
projected to grow another 2 million by the middle of the century. A strong transit link is critical
given existing congestion on roadway connections between the regions and the superior carrying
capacity of passenger rail, relative to private-vehicle travel, in constrained corridors.
To maximize the Capitol Corridor’s role as a transit spine, the service will need to meet several
other objectives:
Integrate seamlessly with both regions’ rail systems: Capitol Corridor service should
integrate seamlessly with BART, Caltrain, VTA light rail, ACE, and Sac RT light rail. Such
links could be made easier and more convenient. For example, a new BART transfer
opportunity at West Oakland would make travel to and from San Francisco destinations
much faster and more convenient than today. Where these links already exist, fare and
scheduling policies should be adjusted to make using more than one system for a single
journey a more seamless process.
Upgrade to modern international railroad standards: Delays related to freight train
priority and dwell times are a notable cause of speed and reliability problems on the

2014 VISION PLAN UPDATE FINAL REPORT | CAPITOL CORRIDOR
Capitol Corridor Joint Powers Authority
Nelson\Nygaard Consulting Associates Inc. | 16
service today. Acquiring right-of-way to give Capitol Corridor service priority and
upgrading stations and train cars to allow for level boarding are two ways to bring the
service in-line with international standards for high quality passenger rail service.
Another is electrification using an overhead contact system, which in addition to
rendering trains cleaner and quieter would allow for faster acceleration and deceleration.
Make service faster in phases based on FRA limits: Trains currently travel an average of
approximately 40 miles per hour through the Capitol Corridor route and only reach
higher speeds through the straightest segments. They are legally allowed to travel up to
125 miles per hour with at-grade crossings, and they can reach even higher speeds in
areas with grade separation and other safer infrastructure arrangements. It will require a
combination of right-of-way acquisition, alignment straightening, vehicle upgrades, and,
ultimately, grade separation to take advantage of this potential. Infrastructure
investments should aim to steadily increase speeds.
Make service more customer-friendly: Service should become more frequent, more
reliable, cleaner, and quieter over time. Improvements in these areas will require a
combination of infrastructure and vehicle improvements. Increasing speeds will also
allow for scheduling built around clockface pulses at hubs, a scheduling approach that is
more intuitive for customers.
Protect the corridor from the threats of sea-level rise: Large stretches of the alignment
run along waterfronts, through marshland, or on soils that are increasingly vulnerable to
liquefaction in the case of a major seismic event. Any investments must decrease the
service’s vulnerability to projected changes in the environment.
The alternatives below reflect these goals and objectives.
TOOLBOX
Today, a one-way trip from Sacramento to San Jose takes, at best, 3 hours and 8 minutes. Trains
are not the biggest speed-limiting factor: Capitol Corridor locomotives have a top speed of 110
miles per hour, and if they were able to travel that fast through large portions of the corridor,
travel times would be close to those outlined in the long-term plan objectives. Physical and
regulatory limitations, including tight curves, conflicts with freight trains, at-grade crossings,
signal systems, bridges that lift for marine vessels, and a lack of automatic safety controls, limit
trains to much slower speeds. In fact, while Capitol Corridor trains can legally only travel as fast
as 79 miles per hour, per regulations and UPRR restrictions, their average speed through the
corridor is only about half that, 42 miles per hour.
Reducing travel times will require a combination of increased top speeds and fewer (and shorter)
delays. There are a number of ways to accomplish this and this section details the options – it
should be noted, however, that not all may be a good fit. The long-term plan alternatives
described later in the chapter, include many of these approaches, from which the most applicable
will be selected.
Positive Train Control and Speed Increases
Positive Train Control (PTC), which is in the process of being installed on Capitol Corridor trains
right now and is soon to be installed by the host railroads, links every train in a system to a central
computer which can set rules for where trains can be in relation to each other and control train

2014 VISION PLAN UPDATE FINAL REPORT | CAPITOL CORRIDOR
Capitol Corridor Joint Powers Authority
Nelson\Nygaard Consulting Associates Inc. | 17
movements to prevent them from getting too close. The technology has the potential to
significantly increase speeds, even without costly infrastructure changes, though there is concern
that it could potentially slow average speeds immediately after implementation as PTC is
optimized for operations in the particular corridor in which it is implemented. When PTC is
installed, the Federal Railroad Administration allows trains to reach 110 mph even without
“sealing” at-grade crossings.
Amtrak trains in Michigan have installed PTC and have been allowed to reach top speeds of 110
miles per hour, though the line on which it was installed is not as heavily integrated with freight
rail services. The FRA is currently working to improve the reliability of the technology for rights of
way with both passenger and freight traffic.
Tilting Rolling Stock
The Capitol Corridor’s trains cannot physically go faster than 110 mph, and they must slow down
dramatically around tight curves like those along the shoreline between Martinez and Richmond.
Allowing train cabins to tilt when going through curves can reduce the effects of centripetal forces
on passengers, making higher speed trips around curves more comfortable. Amtrak’s Cascade
service between Seattle and Portland uses Talgo tilting trains, which allow for higher speeds
through curves, and America’s fastest trains, on the Amtrak Acela between Boston and
Washington, D.C., similarly rely on tilting technology.
Given heavy investment in the Capitol Corridor’s current train fleet, it is unlikely that the CCJPA
will pursue tilting technology in the near term. Still, this could be an option for marginally
increasing speeds when purchasing new vehicles is necessary.
Electrification
Powering trains using electricity, transferred to individual rail cars through overhead wires, also
has the potential to cut travel times by enabling higher speeds and reducing acceleration and
deceleration time. Capitol Corridor trains are currently powered by diesel locomotives, which are
heavier and thus require more time to speed up and slow down. Electric multiple unit (EMU)
railcars are also cleaner and quieter than diesel trains.
As with tilting technology, electrification would require replacement of the Capitol Corridor’s
entire train fleet. While this would require a significant capital investment, it could reduce
operating costs over time, if fuel prices continue to rise.
Under FRA regulations, lightweight EMUs cannot share tracks with heavier equipment like
freight trains, and even if these regulations were amended, UPRR would have to agree to shared
operation of the corridor. As such electrification would likely require constructing separate
passenger-only tracks within existing UPRR rights-of-way.
Caltrain is planning to electrify its system by 2020, and the Altamont Corridor Rail Project will
eventually electrify Altamont Commuter Express service, allowing speeds up to 150 miles per
hour in some segments. Electrification costs can vary widely. Caltrain’s electrification project,
which will also include PTC and 112 new railcars, is projected to cost roughly $30 million per
mile. However, it is projected to reduce operating costs by more than 40 percent.
2014 VISION PLAN UPDATE FINAL REPORT | CAPITOL CORRIDOR
Capitol Corridor Joint Powers Authority
Nelson\Nygaard Consulting Associates Inc. | 18
Straight Lines and Super-Elevation
Because trains must slow down through tight curves, the most basic way to increase speeds is to
simply straighten out a route’s alignment. This approach seems daunting when considering an
entire route, but straightening short segments can lead to significant overall travel-time
reductions. Segments with necessary curves can be sped up slightly by tilting or banking tracks to
the characteristics of a given curve – called “super elevation” – in much the same way as National
Association for Stock Car Auto Racing, more popularly known as NASCAR tracks’ curves are
banked to allow race cars to travel at high speeds.
Geography and settlement patterns can often make straightening alignments quite expensive. For
example, straightening the Capitol Corridor segment between Richmond and Martinez stations
would require either significant tunneling or several new bridges. Similarly, straightening the
segment between the Oakland Coliseum and Emeryville, which includes a tight northbound turn,
would require either a deep-bore tunnel under densely populated parts of Oakland or unrealistic
levels of right-of-way acquisition. Still, there are likely areas along the Capitol Corridor alignment
that would be good candidates for straightening or super-elevation treatments.
Express Train Service
With speed lost in the acceleration and deceleration and dwell time at stations, stops can add
significantly to travel times through a whole route. As such, creating express or limited services is
an effective way to reduce travel times. Caltrain has used this approach to significantly reduce
travel times through the Peninsula corridor, reducing end-to-end travel times from more than 90
minutes to less than an hour by skipping 17 of the line’s 23 stops between San Francisco and San
Jose. Of course, the Capitol Corridor has many fewer stops than Caltrain, so travel-time reduction
benefits of express service would be much more limited. In addition, given the wide spacing
between stops on the line and the Capitol Corridor’s lower frequencies, reducing the number of
stops on some runs would affect a notable share of riders. For both of these reasons, the utility of
limited-stop service may be much lower for the CCJPA.
RESPONDING TO CLIMATE CHANGE AND SEA-LEVEL RISE
The Capitol Corridor has a complicated relationship with the San Francisco Bay. The route’s
proximity to marshland, tidal waters, and the bay-shore make the ride picturesque. However, in
an era of rising sea levels and increasingly frequent strong storms, that proximity may threaten
large segments of the corridor’s physical infrastructure. The route has the most linear exposure to
this threat of any transit service provider in the Bay Area. As the CCJPA considers investments
that will create the next generation of Capitol Corridor service, it must also ensure that the
service’s capital assets are well positioned to weather the effects of climate change.
The corridor is already vulnerable to environmental factors. In the East Bay, large portions of the
alignment and an important maintenance facility sit on land subject to liquefaction in case of an
earthquake. Tracks that run through the Suisun Marsh, in the Central Valley, already require
significant ongoing maintenance due to high groundwater levels. Rising water tables, associated
with sea-level rise, will only make both of these problems worse.
It is critical that CCJPA consider sea-level rise in all of its planning decisions because some will
commit the Capitol Corridor to a particular set of future adaptation responses. For example, the
CCJPA anticipates that the City of Hercules will soon ask the agency to consider a new station in
an area that is particularly vulnerable to rising sea levels, along the existing alignment next to San

2014 VISION PLAN UPDATE FINAL REPORT | CAPITOL CORRIDOR
Capitol Corridor Joint Powers Authority
Nelson\Nygaard Consulting Associates Inc. | 19
Pablo Bay. Such a station and any associated track infrastructure would need to be built to
weather the effects of sea level rise, and its location could commit the railroad to an alignment
that is more difficult to gird against the effects of rising waters.
The CCJPA recently completed a Sea-Level Rise Vulnerability Assessment. This section
summarizes the major issues raised in that assessment, to provide context for some of the
alternatives presented in the next section.
Overall System Vulnerabilities and Recommendations
The Capitol Corridor faces significant system-wide vulnerabilities, many of which will make
preparing the system for higher sea levels more difficult. Among the biggest issues is the
railroad’s relationship to its right-of-way and many of its assets: The CCJPA manages a service
that runs on other entities’ tracks and a mix of agencies and local jurisdictions have dominion
over different parts of its stations and other capital assets. How the CCJPA manages these
relationships, and how closely it can coordinate planning among these many players, will be a key
factor in determining how successfully Capitol Corridor service can confront the coming
environmental challenges.
The most critical vulnerabilities highlighted by the sea-level rise assessment:
Track, railroad bed, and signals: Outages in segments of the Capitol Corridor’s alignment
would likely affect operations along the entire route, and important parts of the linear
infrastructure on which the railroad relies would be inoperable with water damage. Rails
can warp and corrode and track beds can destabilize with sustained exposure to standing
water or the strong wave action associated with storm surges. The electrical systems that
ensure safety along the right-of-way, many of which run under the railroad bed, are
vulnerable to even slight exposure to moisture. Large segments of the alignment are quite
vulnerable to these threats, particularly with just slight increases in sea levels or strong
storms whose frequency is expected to increase over the coming years.
Oakland Maintenance Facility: Maintenance work on all Capitol Corridor trains occurs at
the Oakland Maintenance Facility, which sits on soil that is subject to liquefaction in an
earthquake and is just a few feet above sea level today.
A lack of information on railroad assets: The CCJPA does not currently have an internal
understanding of the state of essential railroad assets owned by the UPRR or other
partners. UPRR may have an internal database with information on the age and state-of-
good-repair of tracks, signals, and other critical pieces of infrastructure, but it has not
shared this information with the CCJPA to date. This lack of information makes planning
for these issues much more difficult.
Complicated Institutional Arrangement: Related, the tens of entities and jurisdictions
with which the Capitol Corridor interacts along its 171 route miles makes any kind of
planning work quite complex. While this presents an opportunity for cost-sharing and
mutually beneficial investments, the administrative challenges and costs associated with
aligning organizations with different values and priorities could be a critical vulnerability.
Based on these vulnerabilities and others, the sea-level rise assessment made a number of
recommendations, many of which focused on institutional steps the agency must take to better
prepare for climate change. The recommendations included building an internal database of
critical capital assets, working with UPRR to gain access to information on the current condition

2014 VISION PLAN UPDATE FINAL REPORT | CAPITOL CORRIDOR
Capitol Corridor Joint Powers Authority
Nelson\Nygaard Consulting Associates Inc. | 20
and maintenance history of those assets, as available. In addition, it also recommended that long-
term plans take sea-level-related threats along different segments of the alignment into account
and that the agency create short-term operational contingency plans for vulnerable segments.
Such plans might include bus bridges and other interim measures to keep some level of service
running after major flooding.
Issues by Segment
The assessment also catalogued major issues facing different segments of the alignment that are
particularly vulnerable to climate-change-related impacts to provide deeper context for the
segment-by-segment alignment alternatives.
Southern East Bay to San Jose
The alignment runs directly through bay lands and tidal areas in this segment, and as such, is
subject to inundation with just slight increases in sea-level rise. A five-year-storm tide level – with
20percent likelihood in any given year – would also flood the most exposed portions of this
segment.
Oakland Coliseum Area
Three feet of sea-level rise would inundate tracks in this segment, and the segment between Lion
Creek and 73rd Avenue, just northeast of the Coliseum complex, is particularly vulnerable to
liquefaction.
Oakland-Richmond
Tracks around the Lake Merritt Channel, the lowest portion of this segment, are subject to
permanent inundation with three feet of sea-level rise or a 25-year storm event, which has a
4percent chance of happening during any given year. Other portions of this segment would be
inundated with four to five feet of sea-level rise. The whole area is subject to liquefaction in an
earthquake.
Point Pinole
Tracks in this segment wind along the shoreline of Carquinez Strait and San Pablo Bay and, as
such, are particularly vulnerable to storm surges and strong waves, and tracks would be
vulnerable to such conditions more frequently with an increase in sea levels. Railroad beds could
wash out with strong waves in this segment, and a series of bridges in this segment, rising over
inlet creeks, could also be vulnerable to flooding.
Martinez Area
Tracks in the segment risk permanent inundation with four feet of sea-level rise and are
vulnerable to the strongest of storms seen in the historical record for the area, or a so-called 100-
year storm. Such an event has a 1percent chance of happening in any given year. The Martinez
station is the fourth busiest in the Capitol Corridor system, and as such, disruptions would have a
major impact on existing users.
Suisun/Fairfield Area
A large share of the right-of-way in this segment runs through Suisun Marsh, a wetland in which
soil subsidence is already the cause for significant track maintenance activity. Tracks in this

2014 VISION PLAN UPDATE FINAL REPORT | CAPITOL CORRIDOR
Capitol Corridor Joint Powers Authority
Nelson\Nygaard Consulting Associates Inc. | 21
segment, as they are currently constructed, risk permanent inundation with as little as two feet of
sea-level rise and are subject to temporary flooding in case of a storm of a strength expected every
five years.
PROCESS
To advance the conceptual vision outlined in the draft 2013 update, a process for this Vision Plan
Update was developed by CCJPA staff and consultants. This process took the fundamental
principles and objectives identified in the draft 2013 update as a starting point, and asked: What
level of alternatives development and analysis would be necessary to create a “roadmap” detailed
enough to allow specific, early-stage projects to be advanced?
As it was ultimately carried out, this process consisted primarily of:
Development of segment-based travel time “targets” for “low,” “medium” and “high”
investment and travel time savings scenarios. Reflecting one of the key principles
identified in the 2013 update – “clockface” arrival and departure times at major hubs –
the low scenario was based on travel time of 1 hour, 45 minutes between Sacramento and
Oakland and 1 hour between Oakland and San Jose (roughly a 10-12 percent reduction
from current travel times). The medium scenario was based on travel time of 1 hour, 15
minutes between Sacramento and Oakland and 45 minutes between Oakland and San
Jose (roughly a 30-35 percent reduction from current travel times). The high scenario,
meanwhile, was based on travel time of 1 hour between Sacramento and Oakland and 30
minutes between Oakland and San Jose (roughly a 50 percent reduction from current
travel times). Reflecting the different geographic and land use conditions within the
Sacramento-Oakland segment, target travel times were also developed for sub-segments
consisting of Sacramento to Suisun City, Suisun City to Richmond, and Richmond to
Oakland. The high scenario was used as the basis for the alternatives development and
travel time analysis in the following steps, while the medium and low scenarios were
intended to serve as a basis for development of a phasing strategy.
Identification of capital improvements that might be used to achieve these targets,
analysis of potential travel time savings for each improvement, and packaging of
improvements into alternatives for analysis. This phase of the process is described in
detail in the following section.
Development of conceptual schedules and ridership forecasts for each alternative. This
phase of the process is described in detail in the following section.
Order-of-magnitude capital cost estimation for major improvements, or types of
improvements. These too are currently in development.
Originally, two additional steps were envisioned: selection of a preferred alternative, and a phased implementation strategy based on cost-benefit analysis. However, it was ultimately determined that this step should be deferred until additional outreach to partners, stakeholders and communities can take place, and some consensus can be developed around a preferred alternative that is not only technically sound but politically acceptable (this is further are discussed in Chapter 0,

2014 VISION PLAN UPDATE FINAL REPORT | CAPITOL CORRIDOR
Capitol Corridor Joint Powers Authority
Nelson\Nygaard Consulting Associates Inc. | 22
Next Steps).
The process also included presentations at key decision points to the CCJPA Board of Directors
Ad Hoc Vision Plan subcommittee.
CONCEPTS BY SEGMENT
Each segment of the Capitol Corridor route presents unique challenges and opportunities. This
section reviews the conceptual capital and alignment alternatives developed for this study,
starting from San Jose in the south and continuing to Sacramento (segments farther to the south
and north will be the subject of separate future analysis).
The alternatives were developed based on analysis of engineering feasibility and potential travel time savings. As this was largely a technical exercise designed to identify the full range of available options, political, cost and other considerations were not a major factor. These issues will be addressed in the next phase of project development (see Chapter 0,

2014 VISION PLAN UPDATE FINAL REPORT | CAPITOL CORRIDOR
Capitol Corridor Joint Powers Authority
Nelson\Nygaard Consulting Associates Inc. | 23
Next Steps).
All alternatives assume eventual development of a double-tracked, electrified, dedicated right-of-
way for use by passenger trains. In some segments, new ROW would be developed, while in
others passengers tracks would be added in shared ROW. In these segments, separation of 25 feet
between freight and passenger track centerlines was assumed, consistent with standard UPRR
requirements. The key factor will be that Capitol Corridor service will, in general, not be on tracks
in the control of a host railroad.
San Jose-Oakland Coliseum
Speed and capacity were identified as the key issues in the southernmost portion of the corridor.
Large stretches of this segment have only a single track, limiting maximum speeds, operational
flexibility, and service frequencies.
Today, the alignment travels north from San Jose Diridon Station for 2.5 miles on Caltrain-owned
right-of-way before switching to UPRR right-of-way just north of Santa Clara station. It follows
the UPRR’s Coast Subdivision into Fremont, where it uses the Niles Cutoff to transition to the
Niles Subdivision for its route to Oakland. Figure 4-1 shows the alternatives developed for this
segment.

2014 VISION PLAN UPDATE FINAL REPORT | CAPITOL CORRIDOR
Capitol Corridor Joint Powers Authority
Nelson\Nygaard Consulting Associates Inc. | 24
Figure 4-1 San Jose-Oakland Alignment Alternatives

2014 VISION PLAN UPDATE FINAL REPORT | CAPITOL CORRIDOR
Capitol Corridor Joint Powers Authority
Nelson\Nygaard Consulting Associates Inc. | 25
Coast Alignment
The Coast Alignment would have the line follow the Coast Subdivision up the bay shoreline to just
south of Davis Street in San Leandro. The segment would be acquired from the UPRR and
converted to a double-track passenger-only line. Track would be laid out within the right-of-way
to flatten curves as much as possible. To connect to the Niles Subdivision for the trip north of this
segment, the alignment would sink into a tunnel under I-880 at Hegenberger Road, joining the
Niles Subdivision just south of the Oakland Coliseum. An alternative would be to tunnel under
98th Avenue to connect with the Oakland Subdivision, and then join the Niles Subdivision at 47th
Avenue in Oakland. This alternative would require the acquisition of an additional 30 to 40 feet of
right of way for the 6.5-mile trip to Jack London Square. Portions of this alternative that use the
Coast Subdivision would need to be constructed to account for sea-level rise and storm tides.
Inland Alignment
The Inland Alignment would leave San Jose Diridon Station via the Warm Springs Subdivision,
which travels around the southeastern end of San Jose Airport, through the northwestern portion
of Downtown San Jose, through Milpitas, and into Fremont between I-880 and I-680. A double-
track passenger line would be constructed in this portion of the alignment. It would then follow
the Niles Subdivision to Jack London Square. The Capitol Corridor would share the right of way
with freight trains on a reconstructed version of the UPRR main track, which would shift toward
one side of the right-of-way with 10,000-foot passing sidings constructed every three to five
miles. The siding locations would require a significant amount of additional right-of-way. The
northernmost portions of this alignment would need to be constructed with sea-level rise in mind.
Hybrid
A third option would follow the Coast Subdivision from the Caltrain alignment to Newark,
connecting on the Niles Cutoff to the Oakland Subdivision, on which the route would travel
through just north of the Coliseum in Oakland. The portions of this alternative that use the Coast
Subdivision would need to be constructed to account for sea-level rise and storm tides.
Oakland
Changes to the right-of-way in Jack London Square are of critical importance. Trains currently
operate in the street, which is neither safe nor efficient, but the Posey and Webster tubes, just
south of Jack London Square, are too shallow to allow a subway under the current alignment. In
short, there are no inexpensive options for fixing this portion of the alignment. Figure 4-2 details
how potential grade-separated alignments through Central Oakland could work.

2014 VISION PLAN UPDATE FINAL REPORT | CAPITOL CORRIDOR
Capitol Corridor Joint Powers Authority
Nelson\Nygaard Consulting Associates Inc. | 26
Figure 4-2 Alignments through Central Oakland

2014 VISION PLAN UPDATE FINAL REPORT | CAPITOL CORRIDOR
Capitol Corridor Joint Powers Authority
Nelson\Nygaard Consulting Associates Inc. | 27
Grade-Separated through Jack London Square
One option would travel through Jack London Square on passenger-only tracks through a right-
of-way shared with freight, with appropriate safety treatments, that is either at grade or partially
lowered. Embarcadero Street would be closed from Martin Luther King Junior Way to Webster
Street, with Water Street extended from Clay Street to Martin Luther King Jr. Way to facilitate
continued vehicle access to the area. Martin Luther King Junior Way and Market Street would
both have grade separated track crossings, while Jefferson, Clay, Washington, Franklin, and
Webster streets and Broadway would dead-end at Embarcadero. Existing roadways north of the
right-of-way would give direct access to a new parking facility under the right-of-way, and a
pedestrian esplanade over the tracks would continue to provide pedestrian access through the
area.
While this would be the lowest-cost option for grade-separating the right-of-way through the Jack
London area, it would result in a physical and visual barrier between Jack London Square and the
rest of the District. Additionally, it would impact existing land uses on Embarcadero itself.
5th Street Subway
A second option would be to have the alignment turn slightly to the north just east of I-880,
traveling in a subway or on an elevated guideway along 5th Street. It would then join a new right-
of-way along the BART alignment through West Oakland, potentially on a viaduct. This would
facilitate BART connections at a new West Oakland Station adjacent to or near the existing West
Oakland BART Station. (Through its Vision Plan process, BART is currently studying a new
intermodal station where the existing Capitol Corridor and BART rights-of-way intersect.)
While this option would have far less of an impact than grade-separation of the existing
alignment, it would be substantially more expensive, and further analysis would be needed to
confirm that a new rail viaduct could pass beneath the existing I-880 viaduct without substantial
reconstruction of the latter.
Tunnel Under Downtown Oakland
A third option would construct a deep-bore tunnel under downtown Oakland, starting just east of
the Lake Merritt Channel and rejoining the UPRR right-of-way just north of I-580 in Emeryville.
This would require boring a tunnel roughly 3.5 miles in length. This would facilitate BART
connections at 19th Street in downtown Oakland. It would be by far the most expensive alternative
for this segment.
Oakland-Richmond
This segment of the corridor is among the most heavily congested rail corridors in California,
leading as it does from the Port of Oakland to inland destinations, through a densely urbanized
area. However, as a practical matter, no alternative at-grade alignments are available. For this
reason, analysis in this segment was limited to the physical requirements for creation of dedicated
passenger tracks. Given the 100-foot existing right-of-way in this area, acquisition of 20 to 30 feet
of right of way between Grand Avenue and 65th Street could be required.
While the alternatives were developed based entirely on technical analysis, without physical
constraints, it is clear that any ROW acquisition in this heavily urbanized corridor would require
the participation of multiple partners, including the Capitol Corridor and UPRR as well as
potentially others such as BART, MTC, and the State.

2014 VISION PLAN UPDATE FINAL REPORT | CAPITOL CORRIDOR
Capitol Corridor Joint Powers Authority
Nelson\Nygaard Consulting Associates Inc. | 28
One alignment alternative at the southern end of this segment that was not assessed in depth but
has been identified through other processes including the Regional Rail Plan and BART Vision
Plan effort is a new underground alignment beneath Mandela Parkway in West Oakland,
connecting to a new Transbay Tube with standard-gauge tracks in addition to tracks for BART.
This would allow for a new subway station immediately below or adjacent to the existing West
Oakland BART Station.
Richmond-Suisun/Fairfield
The segment between Richmond and Suisun is perhaps the most challenging to speed up and
protect from sea-level rise. Running on UPRR right-of-way, it follows a winding route along the
shores of San Pablo Bay and Carquinez Strait before crossing a vertical-lift bridge over the Suisun
Point Channel. The alignment then runs through Suisun Marsh to Fairfield. The route is rather
indirect, and the large number of curves slow trains significantly through this part of the corridor.
In addition, the right-of-way’s position right on a shoreline makes it particularly susceptible to
storm surges in the short term and sea-level-rise over the long-term. The bridge, which halts train
traffic for any shipping traffic through the channel, creates significant reliability issues.
Figure 4-3 shows the three major alternatives for improving this portion of the corridor. On the
southern end of this segment, each alternative would join the BNSF Stockton Subdivision just
north of Richmond, allowing for a more direct route. On the northern end, each one would
include a new high-level crossing near the Carquinez or Benicia/Martinez bridges, to deal with
the current bridge-related reliability issues.

2014 VISION PLAN UPDATE FINAL REPORT | CAPITOL CORRIDOR
Capitol Corridor Joint Powers Authority
Nelson\Nygaard Consulting Associates Inc. | 29
Figure 4-3 Richmond-Suisun/Fairfield Alternatives

2014 VISION PLAN UPDATE FINAL REPORT | CAPITOL CORRIDOR
Capitol Corridor Joint Powers Authority
Nelson\Nygaard Consulting Associates Inc. | 30
Improve Existing Alignment
One alternative would reconnect with the existing right-of-way just north of Hercules. Curves
would be flattened to the extent possible and the alignment would be raised to protect against
rising water levels. This alternative would connect to a high-level crossing just east of Martinez.
While this alternative has the potential to be least expensive because it requires no tunneling or
right-of-way acquisition, it could still require significant time and money to study and mitigate
the environmental impacts and gain the approval of numerous agencies, given that it would
involve heavy construction right on a sensitive shoreline.
Franklin Canyon Tunnels
A second alternative for this segment would follow the BNSF alignment, turning inland at
Hercules and joining Highway 4 in Franklin Canyon via a new 1.3-mile tunnel. A Hercules Station
would be at the Hercules Transit Center, rather than the Hercules New Town Center. After
following Highway 4 for nearly 2 miles, it would enter another tunnel, traveling 2.7 miles before
reconnecting with the existing alignment in Martinez. To reach a new high-level crossing running
parallel to the Benicia-Martinez Bridge, the route would need rise for 1.9 miles on an elevated
guideway through Martinez within the existing right-of-way. On the north side of the crossing, the
route would tunnel under I-680 to rejoin the existing right-of-way.
Vallejo
This alternative would follow the BNSF Stockton Subdivision for 4.5 miles before running
elevated or at grade down the center of the I-80 right-of-way through Vallejo, then next to it
through Jameson and American canyons, connecting back to the existing alignment in Suisun
City via the California Northern right-of-way. This alternative would require a complete
reconstruction of I-80. Another Vallejo alternative would pass through the heart of the city via an
existing, extremely constrained rail right-of-way. Both of these options are viewed as unlikely for
reasons of both cost and impact.
High-Level Crossing
Analysis suggests that the most promising alignment for a new, more reliable high-level crossing
of the Carquinez Strait would be parallel to the existing crossing, which is itself between the twin
spans of the Benicia-Martinez (I-680) auto bridge. This is largely because a new bridge could
connect at its southern end to the existing alignment, which in turn was found to be a more
promising connection point than an I-80 alignment through Vallejo (see above).
Suisun/Fairfield-Sacramento
Interactions with freight traffic are the most significant impediment to speedy service in the
segment between Suisun/Fairfield and Sacramento. The alignment is currently straight through
most of this segment. To help eliminate passenger-freight conflicts, the CCJPA would help rebuild
the Sacramento Northern line from Pittsburg to Sacramento and help construct a new high-level
bridge between Mallard and Chip islands, near where Suisun Bay divides into the Sacramento and
San Joaquin rivers. North of the bridge, the line would follow existing right-of-way for 17.5 miles
before joining an abandoned right-of-way for 15.5 miles, finally rejoining the UPRR alignment
east of Davis for the final few miles into Sacramento. As sub-alternatives, the line could branch off
just south of Davis to join the original Sacramento North line into West Sacramento, or a new 12-

2014 VISION PLAN UPDATE FINAL REPORT | CAPITOL CORRIDOR
Capitol Corridor Joint Powers Authority
Nelson\Nygaard Consulting Associates Inc. | 31
mile connection could be built to connect with the UPRR Sacramento Subdivision, just south of
the city.
Figure 4-4 shows the proposed changes in this alignment.
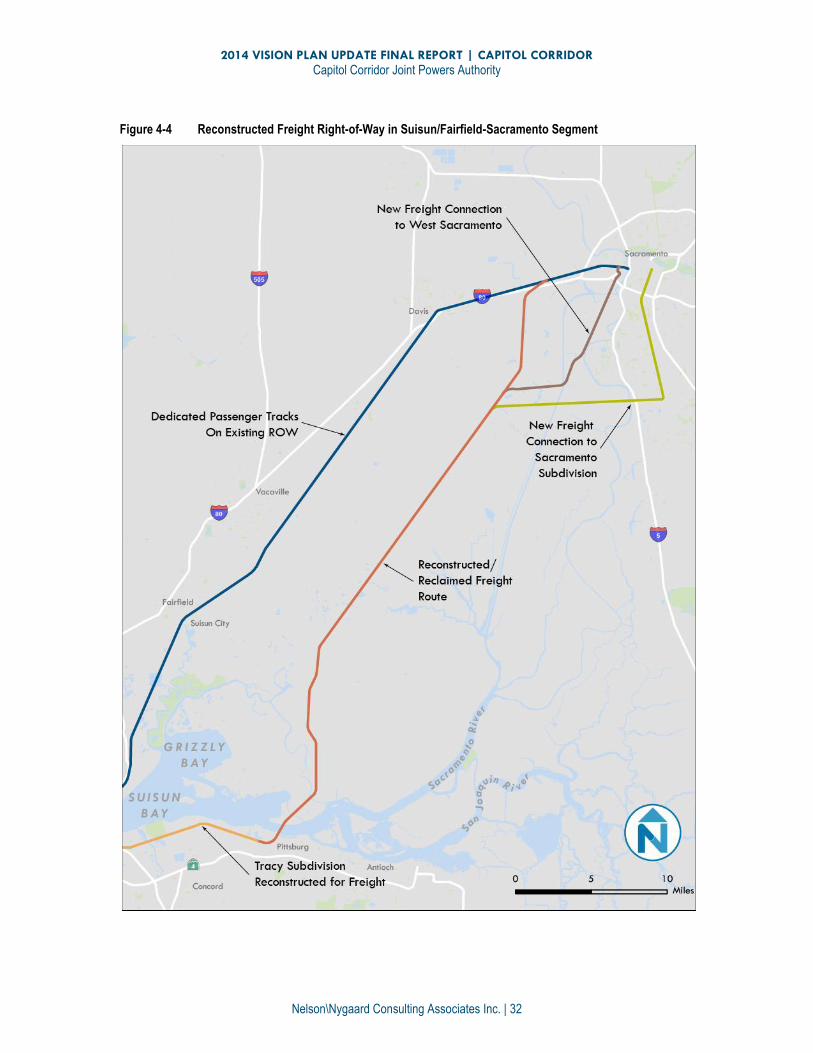
2014 VISION PLAN UPDATE FINAL REPORT | CAPITOL CORRIDOR
Capitol Corridor Joint Powers Authority
Nelson\Nygaard Consulting Associates Inc. | 32
Figure 4-4 Reconstructed Freight Right-of-Way in Suisun/Fairfield-Sacramento Segment

2014 VISION PLAN UPDATE FINAL REPORT | CAPITOL CORRIDOR
Capitol Corridor Joint Powers Authority
Nelson\Nygaard Consulting Associates Inc. | 33
TRAVEL TIME BY ALIGNMENT ALTERNATIVES
For purposes of travel time savings analysis, the capital concepts described in the previous section
were grouped into packages, or formal alternatives. These alternatives were developed so that
schedules could be designed and later tested for their impacts on ridership. Ultimately, it is
crucial to know, early in the long-term vision plan process, if certain alignment options yield
significantly more ridership than other options or if there is not a significant difference between
alternative alignments. If the former, CCJPA would focus on a particular alignment outcome and
pursue it over other alignments even if it has slightly higher costs. Conversely, if the alignments
yielded somewhat similar ridership results, other factors such as cost, environmental impact, and
political feasibility would be the driving force for selecting the alignment.
There are two primary areas of alignment options along the route whereas otherwise the
alignment is common between alternatives. The common alignment sections are, using a north to
south perspective, the portions from Auburn to Martinez and Richmond to Oakland, and San Jose
to Salinas. The locations where clear options are available to a long-term route are between
Martinez and Richmond and Oakland to San Jose.
Between Martinez and Richmond, the options to straighten the existing many curves between
using an engineered series of “cut-and-fill” modifications to establish a solution where higher
speeds can be achieve using the existing alignment is directly contrasted against the option to
generally follow the BNSF Franklin Canyon route, albeit with two sections of tunnels to avoid
steep grades and to ensure re-connecting with the existing route in the Martinez area. Either
routing option has its costs and environmental and political challenges, and in the initial analysis,
either option appears to be similar in order-of-magnitude costs. For the purposes of this exercise,
Alignment A and C utilized the cut/fill solution and Alignment B utilized the Franklin
Canyon/tunnel option. These alignment options are shown in Figure 4-5 below.
Figure 4-5 Martinez-Richmond Alignment Options

2014 VISION PLAN UPDATE FINAL REPORT | CAPITOL CORRIDOR
Capitol Corridor Joint Powers Authority
Nelson\Nygaard Consulting Associates Inc. | 34
The other area of alignment options between Oakland and San Jose includes various existing rail
corridor alignments. There are essentially three options. The first, similar to the existing route
used by the Capitol Corridor, is partially along the Oakland, Niles and Coast Subdivisions, using
the Niles Cutoff in the Fremont/Centerville/Newark area between the subdivisions. This
alternative, however, would bypass the existing Hayward Station and use a new tunneled
connection to more directly access the Niles Cutoff. The other two options involve alignments that
are more direct. One of these primarily uses the Coast Subdivision. This is the route used today by
the Amtrak Long Distance Coast Starlight train, following a coastal alignment, although largely in
the urbanized portion of the East Bay. In contrast to the prior two alignment options which each
have passenger rail use, the last alignment option remains closer to the East Bay Hills and follows
the Niles Subdivision used by Capitol Corridor today, but continuing south of the Fremont area
along the Warm Springs subdivision, an alignment which is not used by passenger rail today (but
will be used, on new, separate tracks, by the BART extension to San Jose). Alignment Alternative
A follows the more coastal option, Alignment B uses the East Bay hills option, and Alignment C
uses the route similar to the existing alignment. Each of the alignment options are shown in
Figure 4-6 on the following page.

2014 VISION PLAN UPDATE FINAL REPORT | CAPITOL CORRIDOR
Capitol Corridor Joint Powers Authority
Nelson\Nygaard Consulting Associates Inc. | 35
Figure 4-6 Oakland-San Jose Alignment Options

2014 VISION PLAN UPDATE FINAL REPORT | CAPITOL CORRIDOR
Capitol Corridor Joint Powers Authority
Nelson\Nygaard Consulting Associates Inc. | 36
Alignment alternatives and “baseline” estimated travel times between Sacramento and San Jose
(before adjustments made during the conceptual schedule development process described below)
are shown in Table 4-1.
Table 4-1 Alternative Alignments and Baseline Travel Times
Existing A B C
Richmond-Fairfield
Improved Existing Franklin Canyon
Tunnels Improved Existing
San Jose-Oakland Coast Niles-Warm Springs
Oakland/Niles/ Coast
Travel Time 3:06 1:54 1:46 2:01
For each alternative, a hypothetical schedule was developed based on adjusted travel times.
These adjustments were made in order to include station stops that were not included in the
initial estimates (West Oakland Intermodal and Suisun for all alternatives, and Fremont/Newark
for Alternative A) or to bypass stations, for limited-stop service (described in the following
paragraphs). The amount of time added or subtracted was two to three minutes per stop, a high-
level estimate based on estimated dwell and acceleration/deceleration times (dwell was assumed
to remain relatively constant, while acceleration and deceleration would vary depending on
operating speed in the segment). Based on these adjustments, the local-stop and limited-stop
travel times shown in Table 4-2 were used to develop schedules. The conceptual schedules
themselves can be found in Appendix A.
Table 4-2 Adjusted Travel Times
Existing A B C
Local-Stop (all-stop)
Sacramento-West Oakland
1:53* 1:15 1:11 1:14
West Oakland-San Jose
1:15 0:47 0:39 0:52
Total 3:08 2:02 1:50 2:06
Limited-Stop (express)
Sacramento-West Oakland
-- 1:03 0:59 1:02
West Oakland-San Jose
-- 0:39 0:33 0:44
Total -- 1:42 1:32 1:46
* Because there is no existing West Oakland station, existing travel times shown are between Sacramento and Oakland Jack London and between Oakland Jack London and San Jose.
2014 VISION PLAN UPDATE FINAL REPORT | CAPITOL CORRIDOR
Capitol Corridor Joint Powers Authority
Nelson\Nygaard Consulting Associates Inc. | 37
Because the travel times used to develop schedules were longer than the “baseline” estimates,
they should be viewed as relatively conservative: for example, travel times via the Alternative A
alignment would be faster if the “Fremont\Newark” station (in the vicinity of the Ardenwood Park
and Ride) were not included. Because the methodology used to add or subtract travel time was
not as refined as that used to develop the baseline estimates, the scheduled times should also be
understood to be somewhat high-level.
In addition to travel times, the conceptual schedules were developed based on 2013 Vision Plan
Update principles including: more frequent service; a mix of service types including limited-stop
or express service as well as all-stop local service; clockface-based headways; and clockface arrival
and departure times at major hubs. Using the estimated travel times, the latter was not always
possible. However, it was possible to develop schedules that had southbound limited-stop trains
“overtaking” local trains at a conceptually new intermodal station with BART in West Oakland (at
either the existing West Oakland BART station or a new intermodal station nearby), thereby
allowing passengers to easily transfer not only to and from BART but between limited-stop and
local trains at that location. It should be noted that BART has not adopted any such revamped or
added new West Oakland station at this time nor has expressed any official plans to locate, serve,
or acquire any real estate necessary for such a change. The inclusion of a new intermodal station
in the West Oakland area is a placeholder for this Vision Plan that would conceptually address the
situation of adding future Capitol Corridor customers to the BART system in the general area.
Even today, if Capitol Corridor trains had a stop at the existing West Oakland station, during peak
hour the BART trains are already extremely crowded and additional Capitol Corridor transfers
would only exacerbate an existing capacity situation with BART. The CCJPA will continue to work
with BART staff to coordinate future responses to intermodal transfers but for the purposes of
this planning process there is an assumption that a new intermodal station with BART would be a
key part of long-term intermodalism for the Bay Area.
Limited-stop or express trains would also serve Sacramento, Davis, Richmond, Oakland Jack
London Square, Santa Clara Great America (if included in that alternative), San Jose Diridon, and
if they operated to Salinas, Gilroy, Pajaro/Watsonville and Castroville. Existing travel times were
assumed between Auburn and Sacramento, and currently projected travel times were assumed
between San Jose and Salinas. The schedule was based on half-hourly local and half-hourly
express service during peak periods (resulting in average headways of 15 minutes at the busiest
stations) and mid-day headways for local trains of one hour, resulting in a total of 90 trains per
day, four of which would serve Auburn, 20 Roseville, and 28 Salinas. In order to allow for
“apples-to-apples” ridership comparisons, the same basic schedule and service level was assumed
for each alternative, with variations only as necessary based on travel time differences.
Importantly to each alternative was the assumed conceptual intermodal connection to BART in
the vicinity of the existing West Oakland BART Station or via the existing Oakland Jack London
Capital Corridor station, if BART were to add a Jack London station as part of its proposed second
Transbay Tube project, now undergoing study as part of the agency’s BART Vision long-term
plan. Regardless of location, the ability to make timed connections with BART service to and from
San Francisco in a location much closer to the city than the existing Richmond and Oakland
Coliseum transfer points is a key objective of the Vision Plan Update. Without that assumed type
of conceptual intermodal connection, the viability of any long-term plan would be compromised.

2014 VISION PLAN UPDATE FINAL REPORT | CAPITOL CORRIDOR
Capitol Corridor Joint Powers Authority
Nelson\Nygaard Consulting Associates Inc. | 38
5 INITIAL RIDERSHIP ANALYSIS Ridership projections are critical to assessing the need for and viability of the service objectives
laid out in the long-term vision plan. A consistent challenge with ridership projections is finding
or building the proper ridership model tool for the task at hand. Developing and testing a
ridership model from scratch is a costly endeavor and was not an option for this Vision Plan
Update. For an initial examination of projected ridership, the best available tool given
resource/timing constraints for this Vision Plan Update was the California-based Amtrak
Ridership and Revenue model. This model is primarily used to assess the effect of incremental
Intercity Passenger Rail service schedule changes and projections of modest service frequency
changes. Typically the model is looking out, at most, over a ten-year planning horizon. Its
accuracy is regularly calibrated against actual ridership counts and thus it is fine-tuned over time.
Historically it has presented slightly conservative estimates of ridership but, in hindsight, it has
proven remarkably accurate, just slightly below Capitol Corridor’s ridership actuals.
Using the Amtrak Ridership and Revenue model for such long term projections taxed what this
model was ideally suited for, yet even if resources and time were available, it is clear there is no
one perfect modeling tool; each is created for different purposes and has unique strengths and
limitations. In order to best use this available tool, CCJPA worked with Caltrans Division of Rail
staff, Amtrak, and their ridership modeling consultants for this ridership analysis to best reflect,
in the professional judgment of the experienced modeling teams, what should be done to best
adjust the model for a ridership analysis for 2040.
A number of factors contribute to make results more speculative the further out a model is
expected to produce values. The further out models predict, the less uncertainty there is for the
underlying future demographics. Another factor is how much frequency increases and speed
changes will affect ridership – the scenarios tested represented a substantial increase in frequency
and a significant reduction in travel time. The future attractiveness of alternative modes available,
i.e., highway congestion, is also another speculative factor. In addition, these model runs each
were adjusted, to account for a conceptually new Bay Area Rapid Transit District (BART) station
located in the vicinity of BART’s existing West Oakland Station – also conceptually associated
with a new Transbay Tube. The modeling team had to account for this hypothetical key, timed,
intermodal transit transfer with rapid connections to and from San Francisco.
The three alternatives discussed above present slight variations in travel time speeds and station
stops, which represented differing levels in capital investment to achieve those travel time speeds.
In this way, the CCJPA could not only assess the magnitude of the model’s result, but also have
some insight into what package of capital investments were most cost-effective according to the
model. The schedules tested are included in Appendix A. As mentioned before, based on the
ridership results and comparison between alternatives, we learn if particular alternatives are vital
in driving ridership projections or if factors other than ridership should drive the selection of a
future alignment alternative.

2014 VISION PLAN UPDATE FINAL REPORT | CAPITOL CORRIDOR
Capitol Corridor Joint Powers Authority
Nelson\Nygaard Consulting Associates Inc. | 39
Future Demographics
Future population growth, land-use changes, and changes in demographics, jobs, housing, were
accounted for in the ridership projection model using data generated by Moody’s Analytics.
Amtrak tailors the model for California, but the ridership and revenue model is a national model,
thus making Moody’s Analytics a nationally trusted source. Moody’s Analytics’ approach to
forecasting the U.S. and its regional economies is informed by both national and regional
analysis.
As described on the Moody’s Analytics website:
“The process starts each month with the U.S. forecast. The Moody's Analytics U.S. macro
model is a large, 1,600-equation simultaneous-equilibrium model that allows for
interrelationships among all of the sectors of the U.S. economy, including production,
income, financial markets, consumer spending, and labor markets. After the U.S. forecast
is finalized, those results are used in the regional forecasts. The national drivers are run
through models for each state and metro area. In addition to the national forecasts,
regional variables such as costs of doing business are included in the regression equations
whenever possible. Demographics and industrial structure also play key roles in defining
the regional outlooks within the context of the U.S. macro forecast. Once the model-based
forecast is derived, analysts review each state and metro area forecast to make sure the
results are consistent with both the national forecast and regional-specific conditions.”
For the use with the ridership model, the modelers used Moody’s county-level forecasts for
population, employment, and total income. These forecasts are appended to census divisions
(CD) based on the ratio of CD demographics to County demographics, and the CD-level forecasts
are used in the station catchment-area and future year growth analysis.
While this approach is the standard used by Amtrak, regional planning forecasts such as those
included with regional transportation plans (RTPs) developed by the Metropolitan Planning
Organizations (MPOs) in the Capitol Corridor service area (e.g. Metropolitan Transportation
Commission (MTC) and the Sacramento Area Council of Governments (SACOG)), may show
more expansive growth or other demographic predictions than what Moody’s may show.
Use of MPO growth predictions is also not without some concern. It should be noted that the
objectives expressed in the RTPs are not guaranteed to be met by 2040. For instance, in the
MTC’s Plan Bay Area objectives, one objective is to house 100 percent of the region’s projected
population growth by income level (very-low, low, moderate, above-moderate) without displacing
current low-income residents. The plan indicates that it will meet this target, yet, there is ample
evidence that turning around a known housing affordability issue that has plagued the Bay Area
for years will be a tall order. The point of bringing attention to demographic forecasts, whether
the input comes from Moody’s Analytics or it reflects meeting the objectives of each MPOs RTP, is
that the use of future demographic and travel projections using models, especially for results over
a quarter of a century away, is that such results may vary, so it would be ideal to use a variety of
inputs and models to develop a bracketed range of future projections. To reiterate, this Vision
Plan Update did not have the resources or timing to consider such an approach for the initial
forecasts. One key action item from adoption of this Vision Plan Update is that CCJPA work with
the Caltrans Rail Division, who oversees the use of the California Ridership and Revenue Model,
to refine and test additional demographic inputs to the model to allow for a more bracketed
analysis, or that there may be another appropriate ridership modeling tool, such as the California

2014 VISION PLAN UPDATE FINAL REPORT | CAPITOL CORRIDOR
Capitol Corridor Joint Powers Authority
Nelson\Nygaard Consulting Associates Inc. | 40
High Speed Rail model which could be used with any follow-on actions from this Vision Plan
Update.
Future Transit Connections
As with assessing future demographics, another test for the ridership model are the effects of
future transit connections that are planned to enhance the transfer between modes from what
they are today. A large assumption of the ridership model was that a faster and timed connection
via a conceptually new BART intermodal station (built adjunct with a new Capitol Corridor
station) could be added in the West Oakland as part of a conceptually new Transbay Tube with
conceptually new San Francisco BART station connections. Nothing such as this is officially
adopted by BART at this time but for the exercise of maximizing the long-term capital investment
in Capitol Corridor as well as presuming some capacity enhancement will be needed for the BART
system over this time frame, this Vision Plan Update process assumes that “something” related to
added BART Transbay Tube capacity and West Oakland will happen in the long-term timeframe.
As well, for the purposes of intercity travel and intermodality, Capitol Corridor’s long-term service
would be significantly enhanced by upgraded BART service/capacity enhancement in the West
Oakland area. BART long-term plans are also a chance to enhance the long-term transit
connectivity over the BART connections that exist today at Richmond and Oakland Coliseum.
The method of analyzing that vastly improved transit connectivity was done by examining travel
time paths (including a timed transfer penalty) to various destinations from the BART system in
addition to a connection with the Capitol Corridor. The method used was akin to how the
California Ridership and Revenue Model is used with planning bus routes connecting to Capitol
Corridor service today. Using a new connection and examining today’s existing origin-destination
pairing using joint Capitol Corridor/BART stations, such as Richmond, the modeling team was
able to divide existing BART usage from Capitol Corridor into quadrants. In short, if existing data
showed transfers at Richmond would travel on the BART system to/from the Richmond line from
MacArthur BART station north as well as stations along Pittsburg/Bay Point, those patrons would
continue to use the Richmond station as a transfer point. However, for all transfers to BART
stations in San Francisco, and even those trips to the Fremont and Dublin/Pleasanton stations,
the new West Oakland intermodal station becomes the optimum Capitol Corridor transfer point.
The model captured this documented behavior and used developed travel times to incorporate the
projected future ridership and transfers using a conceptually new West Oakland Capitol
Corridor/BART intermodal station.
Accounting for Future Highway Congestion
There are two versions of the California Ridership and Revenue Model. The model used is
responsive to does account for time-of-day and frequency. This model, however, does not take
into account long-term mode-shift due to traffic congestion increases. As of this writing, Caltrans
Rail Division staff are working with other staff at Caltrans who monitor future highway
performance and the anticipation is that a qualitative discussion of the effect of highway
congestion for 2040 as compared to conditions today will be included. For any recommended
future ridership modeling, future highway congestion is a recommended component to be
included in the model. This would lead to a modeling approach such as used with the California
High Speed Rail model to further refine the long-term planning inclusive of future highway
congestion. Because the future effects of highway congestion were not included in the ridership
projections shown in Table 5-1 in the following pages, we have every reason to believe the

2014 VISION PLAN UPDATE FINAL REPORT | CAPITOL CORRIDOR
Capitol Corridor Joint Powers Authority
Nelson\Nygaard Consulting Associates Inc. | 41
ridership projections are inherently low and can be considered conservative ridership projections.
We already know that each of the 2040 alternatives have travel times far superior to even the best
possible travel times available today in the best conditions, as shown in Table 4-2 in the previous
chapter.
Table 5-3 Adjusted Travel Times
A B C Existing
Local-Stop (all-stop)
Sacramento-West Oakland
1:15 1:11 1:14 1:53*
West Oakland-San Jose
0:47 0:39 0:52 1:15
Total 2:02 1:50 2:06 3:08
Limited-Stop (express)
Sacramento-West Oakland
1:03 0:59 1:02 --
West Oakland-San Jose
0:39 0:33 0:44 --
Total 1:42 1:32 1:46 --
* Because there is no existing West Oakland station, times shown are between Sacramento and Oakland Jack London and between Oakland Jack London and San Jose.
RIDERSHIP MODELING RESULTS
Table 5-1 on the following page summarizes the ridership results from the modeling effort. To
show the effects of background growth between 2015 and 2040 and the effect of the various
alternative schedules, the table is broken into several distinct columns. For ease of discussion, the
results of the various alternatives are averaged to establish general conclusions regarding
ridership. The first column of results is the base 2015 annual ridership. The next column is the
2015 results if the long-term vision plan for each alternative were implemented overnight and
annual ridership tallied from that point. The next column is what annual ridership would be for
2040 if none of the long-term vision plan, and none of the short or medium-term projects were
implemented and the 2015 service plan were never changed for 25 years. As compared to the 2015
annual ridership, this demonstrates there is a natural background growth of 62% as predicted
using the Moody’s Analytics demographic and economic forecasts. Finally, in the last column, are
the 2040 annual ridership values if the various long-term alternatives were implemented. As
compared to the 2015 service, annual ridership increases on the order of 336% - some of that
being background growth, but the bulk of it being the more frequent, faster service with the timed
connection with the conceptually new BART West Oakland intermodal station.

2014 VISION PLAN UPDATE FINAL REPORT | CAPITOL CORRIDOR
Capitol Corridor Joint Powers Authority
Nelson\Nygaard Consulting Associates Inc. | 42
Table 5-1 Ridership Estimates
Alternative 2015
Service
2015
“Instant” Vision
2015 Service with 2040 Growth
2040 Vision with Growth
Baseline 1,402,300 2,267,200
Alternative A 3,778,200 6,108,600
Alternative B 3,825,700 6,190,700
Alternative C 3,732,700 6,038,400
Avg of Alts 3,778,867 6,112,567
Ridership Gain From “Instant” Vision 2,376,567 From 2015 4,710,267
The relative similarities between the figures for each alternative indicate that while alignments –
specifically travel times and station locations – would have some impact on ridership, all else
being equal, the differences in ridership between the alternatives are not so great that ridership
impacts of alignment choices should be a primary driver of the decision-making process. Put
another way, future decisions on major capital investments should be made on the basis of cost-
benefit analysis taking into account a range of factors in addition to ridership, including political
feasibility, constructability and other inputs.
The CCJPA’s Ad Hoc Vision Plan Subcommittee reviewed these ridership results and collectively
determined that even without accounting for future highway congestion and the other parameter
testing options available, the ridership results were significant enough to warrant moving forward
from this Vision Plan Update into a next step – a Vision Implementation Plan. This will be
discussed in a subsequent section and will include a variety of additional in-depth analysis into
the long-term vision prospects.
OTHER RIDERSHIP AND MARKET ANALYSIS TOOLS
Selecting the Amtrak Ridership and Revenue Model as the model analysis tool for this Vision Plan
Update was clearly the best available tool to use given the resources and timing for the Update.
However, there are other tools which warrant exploration as directed by the CCJPA’s Ad Hoc
Vision Plan Subcommittee especially if the full CCJPA Board directs CCJPA staff to begin work on
a Vision Implementation Plan. These additional options are discussed as a preface to the Vision
Implementation Plan section. In general, the approach with ridership estimates and/or market
analysis would be to bracket the future projections so that future policy makers have some sense
of the consistent magnitude of future ridership as well as the factors which can drive ridership or
consideration of capital investment and environmental analysis..
Emerging California Market Analysis Tool
At this time, the California State Transportation Agency is working with the California High
Speed Rail Authority to blend several travel market analysis tools into one meshed market
analysis tool which has potential to fine tune the service schedule but also help support the
market potential of the Capitol Corridor long-term vision service plan. Unlike a ridership model,
this tool is not a forecasting model but rather a market analysis tool in which, future growth
assumptions could be loaded and then various ‘what-if’ travel time speeds were tested for various

2014 VISION PLAN UPDATE FINAL REPORT | CAPITOL CORRIDOR
Capitol Corridor Joint Powers Authority
Nelson\Nygaard Consulting Associates Inc. | 43
modes, including IPR service. This tool is in development at this time but it includes, as its basis,
the use of actual train origin-destination data, the California Travel Demand Model administered
by Caltrans, and the FRA’s inclusive travel model which includes air travel. By blending these data
sources using several reasoned conversion and assumption tools, a variety of market mode shares
can be determined for longer intercity trips which travel between travel districts created by the
analysis team. The travel districts are group travel analysis zones that exhibit similar grouped
travel behavior when it comes to intercity travel – they are distinctly similar in their travel
patterns enough so that travel between districts can be assessed. Travel path options can also be
assessed using travel time as well. Through this analysis, it is feasible to gain insight into the
existing market share that Capitol Corridor may capture of the district to district trips, for
instance, Sacramento to Oakland. More about this tool needs to be tested, but it does hold
promise to be a useful analysis tool for examining future travel time performance in a given
corridor. Combining it with a refined ridership and revenue model administered by the state
(Caltrans Rail Division or CalSTA) would yield an ideal set of tools to complete a more in-depth
market and ridership analysis of the long-term vision service plan.
California High Speed Rail Model
The California High Speed Rail Model was expressly developed to model and predict future
ridership results for the California High Speed Rail (HSR) service already under construction. It is
oriented toward that objective and treats intercity and commuter passenger rail as one of the
modes of input to the high speed rail service. Thus, it will not be able to provide stand-alone
estimates for the Capitol Corridor service in 2040. The HSR model does include peak and off-
peak model analysis but again, is not ideal for modes such as the Capitol Corridor service. CCJPA
staff need to have the opportunity to interact with the HSR model staff to explore what, if any,
modifications could be made to the model to assist CCJPA with any additional Vision
Implementation Plan refinements and analysis to ridership values over and above any
refinements possible to the already utilized Amtrak Ridership and Revenue model.
2014 VISION PLAN UPDATE FINAL REPORT | CAPITOL CORRIDOR
Capitol Corridor Joint Powers Authority
Nelson\Nygaard Consulting Associates Inc. | 44
6 NEXT STEPS The CCJPA’s Ad Hoc Vision Plan Update Subcommittee has recommended that the CCJPA Board
adopt this Vision Plan Update in November 2014. A follow-up phase of the Vision Plan process,
the Vision Implementation Plan, could then proceed. The Vision Implementation Plan, or VIP,
has been conceived as a more in-depth analysis of future operations and the accompanying capital
program. The VIP would be followed by a third phase of the Vision Plan process, the Vision
Communications Plan or VCP. Once all three phases are completed, the CCJPA Board may direct
CCJPA staff to proceed with funding and environmental documentation efforts, the latter of a
programmatic or possibly even project nature.
Major elements of the VIP are described below.
VISION IMPLEMENTATION PLAN ELEMENTS
Integration with Partner Planning Efforts
An essential first step would be to ensure that the VIP is coordinated with related planning
efforts, that partner agencies are made aware of the VIP, and that input is solicited from key
stakeholders. This would include (but not be limited to):
Discussions with staff from the metropolitan planning organizations (MPOs) in both the
Bay Area and Sacramento region – the Metropolitan Transportation Commission, or
MTC, and the Sacramento Area Council of Governments, or SACOG – about the VIP and
about any joint planning efforts, official or otherwise, that may be underway between the
two of them. Through these discussions, Capitol Corridor staff and consultants should
convey to staff at both agencies that among the core objectives of the Vision Plan process
are:
Provider support for the national and international economic competiveness of the
emerging Northern California “megaregion.”
Offer an alternative for increased mobility in the Interstate 80 corridor to expensive
and environmentally damaging expansion of I-80 itself.
These discussions should also convey the message that while the Capitol Corridor is not
the exclusive responsibility of either region, it is an asset shared by both regions and a key
piece of infrastructure linking the two regions both physically and economically.
Initial discussions with Union Pacific Railroad (UPRR) staff regarding Vision Plan
concepts including a new freight rail corridor between Martinez and Sacramento and
expansion of the shared freight and passenger right-of-way between Oakland and
Richmond.
Coordination with:
The Contra Costa Transportation Authority (CCTA) and West Contra Costa
Transportation Advisory Committee (WCCTAC) regarding their planned I-80
corridor transit study.
The San Joaquin Regional Rail Commission (SJRRC) and Altamont Commuter
Express (ACE) regarding expansion of their service between the Central Valley and
Silicon Valley.

2014 VISION PLAN UPDATE FINAL REPORT | CAPITOL CORRIDOR
Capitol Corridor Joint Powers Authority
Nelson\Nygaard Consulting Associates Inc. | 45
San Joaquin Joint Powers Authority (SJJPA) and Caltrans Division of Rail staff
regarding their most current service and capital planning efforts.
County-level Congestion Management Agencies (CMAs) such as the Alameda County
Transportation Commission (ACTC) and Solano Transportation Authority (STA)
regarding their long-term planning efforts.
Additional Ridership Forecasting
The preliminary ridership projections developed for this Update and described in this document
are, as was previously stated, initial forecasts. The tool that was used, the Amtrak Ridership and
Revenue model, has a proven track record of accuracy, but also known limitations. In short, it
was designed to model the effects of relatively minor changes over the short term, and is typically
not used to forecast the long-range, much greater changes to travel times, service levels and
connectivity envisioned by this plan. It also relies on national rather than local and regional
population and employment forecasts.
Additional modeling will be required, then, in order to:
Better understand the ridership potential associated with a timed and seamless
intermodal connection to BART as close as physically possible to San Francisco.
Better understand the potential impacts of constraints on expansion of Interstate 80
given future growth in demand for travel between the Bay Area and Sacramento region.
Better define and compare subregional travel markets and origin-destination pairs, in
order to better inform decisions regarding alternative alignments, station locations and
service patterns.
Refine and define a range of ridership projections using different tools in order to provide
greater certainty.
Potential tools and methodological approaches are described in the previous section. Just as
occurred during this process, CCJPA staff and consultants will seek to work with partner agencies
to leverage existing ridership forecasting tools, modifying them as necessary, rather than
committing the significantly resources necessary to develop a new, custom modeling application.
Service Planning, Operating Cost Estimates, and ROI Analysis
In this first phase, the Vision Plan update, conceptual schedules were developed based on the
conceptual service plan described in the final section of Chapter 4 (featuring 90 daily trains,
limited-stop service, 15-minute peak headways, etc.). As a precursor to the core VIP outcome
described in the following section, the phased capital strategy, this service plan should be refined
and annual (future-year) operating costs should be estimated. This will allow for more refined
cost-benefit analysis of potential returns on investment, including operating cost commitments.
Costs may also be assessed at the segment level. Benefits to be included in the assessment of ROI
might include ridership and revenue as well as non-transit performance measures such as
reductions in regional vehicle miles traveled (VMT) and accompanying reductions in greenhouse
gas (GHG) emissions as well as mobility improvements for disadvantaged communities. Cost
estimates will take into account both service levels as well as unit costs associated with operation
of 150 mph electrified service.

2014 VISION PLAN UPDATE FINAL REPORT | CAPITOL CORRIDOR
Capitol Corridor Joint Powers Authority
Nelson\Nygaard Consulting Associates Inc. | 46
Phased Capital Strategy
Perhaps the most important outcome of the VIP would be a phased implementation strategy for
capital investments based on cost-benefit analysis, analysis of constraints and opportunities in
terms of timing and sequencing, and assessments of “throwaway” costs, or investments in
alignment segments planned for eventual abandonment (as such investments might make sense,
even if they are not permanent, if they can deliver substantial benefits in the interim at relatively
low cost). This task would seek to identify early returns and ensure that the preferred alternative
can be implemented as efficiently as possible. It would identify initial, early-stage projects that
should be advanced into the planning “pipeline” and subjected to environmental analysis in the
near term. It would include analysis of right-of-way projects as well as station modifications and
other improvements, such as overhead contact system infrastructure.
VISION COMMUNICATIONS PLAN
Following completion of the VIP and prior to environmental analysis, a third and final phase of
the Vision Plan process will need to be carried out. The Vision Communication Plan or VCP will
be a process of formal engagement with CCJPA partners, other agency stakeholders, elected
officials and community members in affected communities regarding the project alternatives.
This will build on the staff outreach element of the VIP described in the previous section. It would
also describe the function of the service in being an asset to business, mobility, and economic
vitality.
This process will be critical, as some of the alternatives identified in this Plan Update and refined
through the VIP could result in negative impacts as well as benefits, and could prove highly
controversial. Additionally, some concepts would be very expensive, and could not be funded
without strong political support. CCJPA staff and Board members will need to work closely with
their partners in the outreach process to ensure that those partners’ concerns are heard,
understood and responded to.
The exact form this process will take has not yet been determined, but the hoped-for outcome is
development of some consensus around a preferred alternative, at which point both
environmental analysis and advocacy for the funding necessary to implement recommended
near-term projects can occur.

2014 VISION PLAN UPDATE FINAL REPORT | CAPITOL CORRIDOR
Capitol Corridor Joint Powers Authority
Nelson\Nygaard Consulting Associates Inc. | 47
APPENDIX A CONCEPTUAL SCHEDULES Table A-1 Schedule: Alternative A: Southbound/Westbound:AM/Mid-Day
Southbound/Westbound
Auburn 6:18A 7:18A
Rocklin 6:36A 7:36A
Roseville 6:15A 6:45A 7:15A 7:45A 9:30A 11:30A 1:30P
Sacramento AR 6:40A 7:10A 7:40A 8:10A 9:55A 11:55A 1:55P
Sacramento DP 5:00A 5:30A 5:45A 6:00A 6:15A 6:30A 6:45A 7:00A 7:15A 7:30A 7:45A 8:00A 8:15A 8:30A 9:00A 10:00A 11:00A 12:00P 1:00P 2:00P
Davis 5:08A 5:38A 5:53A 6:08A 6:23A 6:38A 6:53A 7:08A 7:23A 7:38A 7:53A 8:08A 8:23A 8:38A 9:08A 10:08A 11:08A 12:08P 1:08P 2:08P
Fairfield/Vacaville 5:21A 5:51A 6:21A 6:51A 7:21A 7:51A 8:21A 8:51A 9:21A 10:21A 11:21A 12:21P 1:21P 2:21P
Suisun 5:25A 5:55A 6:25A 6:55A 7:25A 7:55A 8:25A 8:55A 9:25A 10:25A 11:25A 12:25P 1:25P 2:25P
Martinez 5:40A 6:10A 6:19A 6:40A 6:49A 7:10A 7:19A 7:40A 7:49A 8:10A 8:19A 8:40A 8:49A 9:10A 9:40A 10:40A 11:40A 12:40P 1:40P 2:40P
Richmond 6:00A 6:30A 6:39A 7:00A 7:09A 7:30A 7:39A 8:00A 8:09A 8:30A 8:39A 9:00A 9:09A 9:30A 10:00A 11:00A 12:00P 1:00P 2:00P 3:00P
Berkeley 6:06A 6:36A 7:06A 7:36A 8:06A 8:36A 9:06A 9:36A 10:06A 11:06A 12:06P 1:06P 2:06P 3:06P
Emeryville 6:10A 6:40A 7:10A 7:40A 8:10A 8:40A 9:10A 9:40A 10:10A 11:10A 12:10P 1:10P 2:10P 3:10P
West Oakland AR 6:15A 6:45A 6:48A 7:15A 7:18A 7:45A 7:48A 8:15A 8:18A 8:45A 8:48A 9:15A 9:18A 9:45A 10:15A 11:15A 12:15P 1:15P 2:15P 3:15P
West Oakland DP 5:20A 5:50A 6:18A 6:20A 6:50A 6:48A 7:20A 7:18A 7:50A 7:48A 8:20A 8:18A 8:50A 9:20A 10:20A 11:20A 12:20P 1:20P 2:20P 3:20P
Oakland Jack London 5:25A 5:55A 6:23A 6:25A 6:55A 6:53A 7:25A 7:23A 7:55A 7:53A 8:25A 8:23A 8:55A 9:25A 10:25A 11:25A 12:25P 1:25P 2:25P 3:25P
Oakland Coliseum 5:33A 6:03A 6:33A 7:03A 7:33A 8:03A 8:33A 9:03A 9:33A 10:33A 11:33A 12:33P 1:33P 2:33P 3:33P
Fremont/Newark 5:46A 6:16A 6:46A 7:16A 7:46A 8:16A 8:46A 9:16A 9:46A 10:46A 11:46A 12:46P 1:46P 2:46P 3:46P
Santa Clara Great America 5:56A 6:26A 6:48A 6:56A 7:26A 7:18A 7:56A 7:48A 8:26A 8:18A 8:56A 8:48A 9:26A 9:56A 10:56A 11:56A 12:56P 1:56P 2:56P 3:56P
Santa Clara University 6:04A 6:34A 7:04A 7:34A 8:04A 8:34A 9:04A 9:34A 10:04A 11:04A 12:04P 1:04P 2:04P 3:04P 4:04P
San Jose Diridon AR 6:07A 6:37A 6:57A 7:07A 7:37A 7:27A 8:07A 7:57A 8:37A 8:27A 9:07A 8:57A 9:37A 10:07A 11:07A 12:07P 1:07P 2:07P 3:07P 4:07P
San Jose Diridon DP 6:10A 7:10A 8:10A 9:10A 11:10A 1:10P 3:10P 4:10P
Tamien 6:15A 7:15A 8:15A 9:15A 11:15A 1:15P 3:15P 4:15P
Morgan Hill 6:33A 7:33A 8:33A 9:33A 11:33A 1:33P 3:33P 4:33P
Gilroy 6:47A 7:47A 8:47A 9:47A 11:47A 1:47P 3:47P 4:47P
Pajaro/Watsonville 7:16A 8:16A 9:16A 10:16A 12:16P 2:16P 4:16P 5:16P
Castroville 7:31A 8:31A 9:31A 10:31A 12:31P 2:31P 4:31P 5:31P
Salinas 7:41A 8:41A 9:41A 10:41A 12:41P 2:41P 4:41P 5:41P

2014 VISION PLAN UPDATE FINAL REPORT | CAPITOL CORRIDOR
Capitol Corridor Joint Powers Authority
Nelson\Nygaard Consulting Associates Inc. | 48
Table A-2 Schedule: Alternative A: Southbound/Westbound:PM
Southbound/Westbound
Auburn
Rocklin
Roseville 3:45P 4:45P 5:45P
Sacramento AR 4:10P 5:10P 6:10P
Sacramento DP 3:00P 3:30P 3:45P 4:00P 4:15P 4:30P 4:45P 5:00P 5:15P 5:30P 5:45P 6:00P 6:15P 6:30P 7:00P 8:00P 9:00P 10:00P 11:00P
Davis 3:08P 3:38P 3:53P 4:08P 4:23P 4:38P 4:53P 5:08P 5:23P 5:38P 5:53P 6:08P 6:23P 6:38P 7:08P 8:08P 9:08P 10:08P 11:08P
Fairfield/Vacaville 3:21P 3:51P 4:21P 4:51P 5:21P 5:51P 6:21P 6:51P 7:21P 8:21P 9:21P 10:21P 11:21P
Suisun 3:25P 3:55P 4:25P 4:55P 5:25P 5:55P 6:25P 6:55P 7:25P 8:25P 9:25P 10:25P 11:25P
Martinez 3:40P 4:10P 4:19P 4:40P 4:49P 5:10P 5:19P 5:40P 5:49P 6:10P 6:19P 6:40P 6:49P 7:10P 7:40P 8:40P 9:40P 10:40P 11:40P
Richmond 4:00P 4:30P 4:39P 5:00P 5:09P 5:30P 5:39P 6:00P 6:09P 6:30P 6:39P 7:00P 7:09P 7:30P 8:00P 9:00P 10:00P 11:00P 12:00A
Berkeley 4:06P 4:36P 5:06P 5:36P 6:06P 6:36P 7:06P 7:36P 8:06P 9:06P 10:06P 11:06P 12:06A
Emeryville 4:10P 4:40P 5:10P 5:40P 6:10P 6:40P 7:10P 7:40P 8:10P 9:10P 10:10P 11:10P 12:10A
West Oakland AR 4:15P 4:45P 4:48P 5:15P 5:18P 5:45P 5:48P 6:15P 6:18P 6:45P 6:48P 7:15P 7:18P 7:45P 8:15P 9:15P 10:15P 11:15P 12:15A
West Oakland DP 3:48P 3:50P 4:18P 4:20P 4:50P 4:48P 5:20P 5:18P 5:50P 5:48P 6:20P 6:18P 6:50P 7:20P 7:50P 8:20P 9:20P 10:20P 11:20P
Oakland Jack London 3:53P 3:55P 4:23P 4:25P 4:55P 4:53P 5:25P 5:23P 5:55P 5:53P 6:25P 6:23P 6:55P 7:25P 7:55P 8:25P 9:25P 10:25P 11:25P
Oakland Coliseum 4:03P 4:33P 5:03P 5:33P 6:03P 6:33P 7:03P 7:33P 8:03P 8:33P 9:33P 10:33P 11:33P
Fremont/Newark 4:16P 4:46P 5:16P 5:46P 6:16P 6:46P 7:16P 7:46P 8:16P 8:46P 9:46P 10:46P 11:46P
Santa Clara Great America 4:18P 4:26P 4:48P 4:56P 5:26P 5:18P 5:56P 5:48P 6:26P 6:18P 6:56P 6:48P 7:26P 7:56P 8:26P 8:56P 9:56P 10:56P 11:56P
Santa Clara University 4:34P 5:04P 5:34P 6:04P 6:34P 7:04P 7:34P 8:04P 8:34P 9:04P 10:04P 11:04P 12:04A
San Jose Diridon AR 4:27P 4:37P 4:57P 5:07P 5:37P 5:27P 6:07P 5:57P 6:37P 6:27P 7:07P 6:57P 7:37P 8:07P 8:37P 9:07P 10:07P 11:07P 12:07A
San Jose Diridon DP 5:00P 5:10P 6:10P 6:00P 7:10P 8:10P
Tamien 5:15P 6:15P 7:15P 8:15P
Morgan Hill 5:33P 6:33P 7:33P 8:33P
Gilroy 5:31P 5:47P 6:47P 6:31P 7:47P 8:47P
Pajaro/Watsonville 6:00P 6:16P 7:16P 7:00P 8:16P 9:16P
Castroville 6:15P 6:31P 7:31P 7:15P 8:31P 9:31P
Salinas 6:25P 6:41P 7:41P 7:25P 8:41P 9:41P

2014 VISION PLAN UPDATE FINAL REPORT | CAPITOL CORRIDOR
Capitol Corridor Joint Powers Authority
Nelson\Nygaard Consulting Associates Inc. | 49
Table A-3 Schedule: Alternative A: Northbound/Eastbound:AM/Mid-Day
Northbound/Eastbound
Salinas 5:00A 5:40A 6:00A 6:40A 7:05A 7:35A 8:35A 10:35A 12:35P
Castroville 5:10A 5:50A 6:10A 6:50A 7:15A 7:45A 8:45A 10:45A 12:45P
Pajaro/Watsonville 5:25A 6:05A 6:25A 7:05A 7:30A 8:00A 9:00A 11:00A 1:00P
Gilroy 5:54A 6:34A 6:54A 7:34A 7:59A 8:29A 9:29A 11:29A 1:29P
Morgan Hill 6:08A 7:08A 8:13A 8:43A 9:43A 11:43A 1:43P
Tamien 6:26A 7:26A 8:31A 9:01A 10:01A 12:01P 2:01P
San Jose Diridon AR 6:31A 7:05A 7:31A 8:05A 8:36A 9:06A 10:06A 12:06P 2:06P
San Jose Diridon DP 5:10A 5:35A 5:40A 6:05A 6:10A 6:35A 6:40A 7:05A 7:10A 7:35A 7:40A 8:05A 8:10A 8:40A 9:10A 10:10A 11:10A 12:10P 1:10P 2:10P
Santa Clara University 5:13A 5:43A 6:13A 6:43A 7:13A 7:43A 8:13A 8:43A 9:13A 10:13A 11:13A 12:13P 1:13P 2:13P
Santa Clara Great America 5:21A 5:44A 5:51A 6:14A 6:21A 6:44A 6:51A 7:14A 7:21A 7:44A 7:51A 8:14A 8:21A 8:51A 9:21A 10:21A 11:21A 12:21P 1:21P 2:21P
Fremont/Newark 5:31A 6:01A 6:31A 7:01A 7:31A 8:01A 8:31A 9:01A 9:31A 10:31A 11:31A 12:31P 1:31P 2:31P
Oakland Coliseum 5:44A 6:14A 6:44A 7:14A 7:44A 8:14A 8:44A 9:14A 9:44A 10:44A 11:44A 12:44P 1:44P 2:44P
Oakland Jack London 5:52A 6:09A 6:22A 6:39A 6:52A 7:09A 7:22A 7:39A 7:52A 8:09A 8:22A 8:39A 8:52A 9:22A 9:52A 10:52A 11:52A 12:52P 1:52P 2:52P
West Oakland AR 5:57A 6:14A 6:27A 6:44A 6:57A 7:14A 7:27A 7:44A 7:57A 8:14A 8:27A 8:44A 8:57A 9:27A 9:57A 10:57A 11:57A 12:57P 1:57P 2:57P
West Oakland DP 5:00A 5:30A 5:45A 6:00A 6:15A 6:30A 6:45A 7:00A 7:15A 7:30A 7:45A 8:00A 8:30A 9:00A 10:00A 11:00A 12:00P 1:00P 2:00P 3:00P
Emeryville 5:05A 5:35A 6:05A 6:35A 7:05A 7:35A 8:05A 8:35A 9:05A 10:05A 11:05A 12:05P 1:05P 2:05P 3:05P
Berkeley 5:09A 5:39A 6:09A 6:39A 7:09A 7:39A 8:09A 8:39A 9:09A 10:09A 11:09A 12:09P 1:09P 2:09P 3:09P
Richmond 5:15A 5:45A 5:54A 6:15A 6:24A 6:45A 6:54A 7:15A 7:24A 7:45A 7:54A 8:15A 8:45A 9:15A 10:15A 11:15A 12:15P 1:15P 2:15P 3:15P
Martinez 5:35A 6:05A 6:14A 6:35A 6:44A 7:05A 7:14A 7:35A 7:44A 8:05A 8:14A 8:35A 9:05A 9:35A 10:35A 11:35A 12:35P 1:35P 2:35P 3:35P
Suisun 5:50A 6:20A 6:50A 7:20A 7:50A 8:20A 8:50A 9:20A 9:50A 10:50A 11:50A 12:50P 1:50P 2:50P 3:50P
Fairfield/Vacaville 5:54A 6:24A 6:54A 7:24A 7:54A 8:24A 8:54A 9:24A 9:54A 10:54A 11:54A 12:54P 1:54P 2:54P 3:54P
Davis 6:07A 6:37A 6:40A 7:07A 7:10A 7:37A 7:40A 8:07A 8:10A 8:37A 8:40A 9:07A 9:37A 10:07A 11:07A 12:07P 1:07P 2:07P 3:07P 4:07P
Sacramento AR 6:15A 6:45A 6:48A 7:15A 7:18A 7:45A 7:48A 8:15A 8:18A 8:45A 8:48A 9:15A 9:45A 10:15A 11:15A 12:15P 1:15P 2:15P 3:15P 4:15P
Sacramento DP 6:50A 7:50A 8:50A 10:15A 12:15P 2:15P 4:15P
Roseville 7:15A 8:15A 9:15A 10:40A 12:40P 2:40P 4:40P
Rocklin
Auburn

2014 VISION PLAN UPDATE FINAL REPORT | CAPITOL CORRIDOR
Capitol Corridor Joint Powers Authority
Nelson\Nygaard Consulting Associates Inc. | 50
Table A-4 Schedule: Alternative A: Northbound/Eastbound:PM
Northbound/Eastbound
Salinas 2:30P 4:30P 5:35P 6:35P 7:35P
Castroville 2:40P 4:40P 5:45P 6:45P 7:45P
Pajaro/Watsonville 2:55P 4:55P 6:00P 7:00P 8:00P
Gilroy 3:24P 5:24P 6:29P 7:29P 8:29P
Morgan Hill 3:38P 5:38P 6:43P 7:43P 8:43P
Tamien 3:56P 5:56P 7:01P 8:01P 9:01P
San Jose Diridon AR 4:01P 6:01P 7:06P 8:06P 9:06P
San Jose Diridon DP 3:10P 3:40P 4:05P 4:10P 4:35P 4:40P 5:05P 5:10P 5:35P 5:40P 6:05P 6:10P 6:35P 6:40P 7:10P 8:10P 9:10P 10:10P 11:10P
Santa Clara University 3:13P 3:43P 4:13P 4:43P 5:13P 5:43P 6:13P 6:43P 7:13P 8:13P 9:13P 10:13P 11:13P
Santa Clara Great America 3:21P 3:51P 4:14P 4:21P 4:44P 4:51P 5:14P 5:21P 5:44P 5:51P 6:14P 6:21P 6:44P 6:51P 7:21P 8:21P 9:21P 10:21P 11:21P
Fremont/Newark 3:31P 4:01P 4:31P 5:01P 5:31P 6:01P 6:31P 7:01P 7:31P 8:31P 9:31P 10:31P 11:31P
Oakland Coliseum 3:44P 4:14P 4:44P 5:14P 5:44P 6:14P 6:44P 7:14P 7:44P 8:44P 9:44P 10:44P 11:44P
Oakland Jack London 3:52P 4:22P 4:39P 4:52P 5:09P 5:22P 5:39P 5:52P 6:09P 6:22P 6:39P 6:52P 7:09P 7:22P 7:52P 8:52P 9:52P 10:52P 11:52P
West Oakland AR 3:57P 4:27P 4:44P 4:57P 5:14P 5:27P 5:44P 5:57P 6:14P 6:27P 6:44P 6:57P 7:14P 7:27P 7:57P 8:57P 9:57P 10:57P 11:57P
West Oakland DP 3:30P 3:45P 4:00P 4:15P 4:30P 4:45P 5:00P 5:15P 5:30P 5:45P 6:00P 6:15P 6:30P 7:00P 7:30P 8:00P 9:00P 10:00P 11:00P
Emeryville 3:35P 4:05P 4:35P 5:05P 5:35P 6:05P 6:35P 7:05P 7:35P 8:05P 9:05P 10:05P 11:05P
Berkeley 3:39P 4:09P 4:39P 5:09P 5:39P 6:09P 6:39P 7:09P 7:39P 8:09P 9:09P 10:09P 11:09P
Richmond 3:45P 3:54P 4:15P 4:24P 4:45P 4:54P 5:15P 5:24P 5:45P 5:54P 6:15P 6:24P 6:45P 7:15P 7:45P 8:15P 9:15P 10:15P 11:15P
Martinez 4:05P 4:14P 4:35P 4:44P 5:05P 5:14P 5:35P 5:44P 6:05P 6:14P 6:35P 6:44P 7:05P 7:35P 8:05P 8:35P 9:35P 10:35P 11:35P
Suisun 4:20P 4:50P 5:20P 5:50P 6:20P 6:50P 7:20P 7:50P 8:20P 8:50P 9:50P 10:50P 11:50P
Fairfield/Vacaville 4:24P 4:54P 5:24P 5:54P 6:24P 6:54P 7:24P 7:54P 8:24P 8:54P 9:54P 10:54P 11:54P
Davis 4:37P 4:40P 5:07P 5:10P 5:37P 5:40P 6:07P 6:10P 6:37P 6:40P 7:07P 7:10P 7:37P 8:07P 8:37P 9:07P 10:07P 11:07P 12:07A
Sacramento AR 4:45P 4:48P 5:15P 5:18P 5:45P 5:48P 6:15P 6:18P 6:45P 6:48P 7:15P 7:18P 7:45P 8:15P 8:45P 9:15P 10:15P 11:15P 12:15A
Sacramento DP 5:20P 5:50P 6:20P
Roseville 5:45P 6:15P 6:45P
Rocklin 5:54P 6:54P
Auburn 6:12P 7:12P

2014 VISION PLAN UPDATE FINAL REPORT | CAPITOL CORRIDOR
Capitol Corridor Joint Powers Authority
Nelson\Nygaard Consulting Associates Inc. | 51
Table A-5 Schedule: Alternative B: Southbound/Westbound:AM/Mid-Day
Southbound/Westbound
Auburn 6:18A 7:18A
Rocklin 6:36A 7:36A
Roseville 6:15A 6:45A 7:15A 7:45A 9:30A 11:30A 1:30P
Sacramento AR 6:40A 7:10A 7:40A 8:10A 9:55A 11:55A 1:55P
Sacramento DP 5:00A 5:30A 5:45A 6:00A 6:15A 6:30A 6:45A 7:00A 7:15A 7:30A 7:45A 8:00A 8:15A 8:30A 9:00A 10:00A 11:00A 12:00P 1:00P 2:00P
Davis 5:08A 5:38A 5:53A 6:08A 6:23A 6:38A 6:53A 7:08A 7:23A 7:38A 7:53A 8:08A 8:23A 8:38A 9:08A 10:08A 11:08A 12:08P 1:08P 2:08P
Fairfield/Vacaville 5:21A 5:51A 6:21A 6:51A 7:21A 7:51A 8:21A 8:51A 9:21A 10:21A 11:21A 12:21P 1:21P 2:21P
Suisun 5:25A 5:55A 6:25A 6:55A 7:25A 7:55A 8:25A 8:55A 9:25A 10:25A 11:25A 12:25P 1:25P 2:25P
Martinez 5:40A 6:10A 6:19A 6:40A 6:49A 7:10A 7:19A 7:40A 7:49A 8:10A 8:19A 8:40A 8:49A 9:10A 9:40A 10:40A 11:40A 12:40P 1:40P 2:40P
Richmond 5:56A 6:26A 6:35A 6:56A 7:05A 7:26A 7:35A 7:56A 8:05A 8:26A 8:35A 8:56A 9:05A 9:26A 9:56A 10:56A 11:56A 12:56P 1:56P 2:56P
Berkeley 6:02A 6:32A 7:02A 7:32A 8:02A 8:32A 9:02A 9:32A 10:02A 11:02A 12:02P 1:02P 2:02P 3:02P
Emeryville 6:06A 6:36A 7:06A 7:36A 8:06A 8:36A 9:06A 9:36A 10:06A 11:06A 12:06P 1:06P 2:06P 3:06P
West Oakland AR 6:11A 6:41A 6:44A 7:11A 7:14A 7:41A 7:44A 8:11A 8:14A 8:41A 8:44A 9:11A 9:14A 9:41A 10:11A 11:11A 12:11P 1:11P 2:11P 3:11P
West Oakland DP 5:15A 5:45A 6:14A 6:15A 6:45A 6:44A 7:15A 7:14A 7:45A 7:44A 8:15A 8:14A 8:45A 9:15A 10:15A 11:15A 12:15P 1:15P 2:15P 3:15P
Oakland Jack London 5:20A 5:50A 6:19A 6:20A 6:50A 6:49A 7:20A 7:19A 7:50A 7:49A 8:20A 8:19A 8:50A 9:20A 10:20A 11:20A 12:20P 1:20P 2:20P 3:20P
Oakland Coliseum 5:28A 5:58A 6:28A 6:58A 7:28A 7:58A 8:28A 8:58A 9:28A 10:28A 11:28A 12:28P 1:28P 2:28P 3:28P
Hayward 5:35A 6:05A 6:35A 7:05A 7:35A 8:05A 8:35A 9:05A 9:35A 10:35A 11:35A 12:35P 1:35P 2:35P 3:35P
San Jose Diridon AR 5:54A 6:24A 6:47A 6:54A 7:24A 7:17A 7:54A 7:47A 8:24A 8:17A 8:54A 8:47A 9:24A 9:54A 10:54A 11:54A 12:54P 1:54P 2:54P 3:54P
San Jose Diridon DP 5:55A 6:55A 7:55A 8:55A 10:55A 12:55P 2:55P 3:55P
Tamien 6:00A 7:00A 8:00A 9:00A 11:00A 1:00P 3:00P 4:00P
Morgan Hill 6:18A 7:18A 8:18A 9:18A 11:18A 1:18P 3:18P 4:18P
Gilroy 6:32A 7:32A 8:32A 9:32A 11:32A 1:32P 3:32P 4:32P
Pajaro/Watsonville 7:01A 8:01A 9:01A 10:01A 12:01P 2:01P 4:01P 5:01P
Castroville 7:16A 8:16A 9:16A 10:16A 12:16P 2:16P 4:16P 5:16P
Salinas 7:26A 8:26A 9:26A 10:26A 12:26P 2:26P 4:26P 5:26P

2014 VISION PLAN UPDATE FINAL REPORT | CAPITOL CORRIDOR
Capitol Corridor Joint Powers Authority
Nelson\Nygaard Consulting Associates Inc. | 52
Table A-6 Schedule: Alternative B: Southbound/Westbound:PM
Southbound/Westbound
Auburn
Rocklin
Roseville 3:45P 4:45P 5:45P
Sacramento AR 4:10P 5:10P 6:10P
Sacramento DP 3:00P 3:30P 3:45P 4:00P 4:15P 4:30P 4:45P 5:00P 5:15P 5:30P 5:45P 6:00P 6:15P 6:30P 7:00P 8:00P 9:00P 10:00P 11:00P
Davis 3:08P 3:38P 3:53P 4:08P 4:23P 4:38P 4:53P 5:08P 5:23P 5:38P 5:53P 6:08P 6:23P 6:38P 7:08P 8:08P 9:08P 10:08P 11:08P
Fairfield/Vacaville 3:21P 3:51P 4:21P 4:51P 5:21P 5:51P 6:21P 6:51P 7:21P 8:21P 9:21P 10:21P 11:21P
Suisun 3:25P 3:55P 4:25P 4:55P 5:25P 5:55P 6:25P 6:55P 7:25P 8:25P 9:25P 10:25P 11:25P
Martinez 3:40P 4:10P 4:19P 4:40P 4:49P 5:10P 5:19P 5:40P 5:49P 6:10P 6:19P 6:40P 6:49P 7:10P 7:40P 8:40P 9:40P 10:40P 11:40P
Richmond 3:56P 4:26P 4:35P 4:56P 5:05P 5:26P 5:35P 5:56P 6:05P 6:26P 6:35P 6:56P 7:05P 7:26P 7:56P 8:56P 9:56P 10:56P 11:56P
Berkeley 4:02P 4:32P 5:02P 5:32P 6:02P 6:32P 7:02P 7:32P 8:02P 9:02P 10:02P 11:02P 12:02A
Emeryville 4:06P 4:36P 5:06P 5:36P 6:06P 6:36P 7:06P 7:36P 8:06P 9:06P 10:06P 11:06P 12:06A
West Oakland AR 4:11P 4:41P 4:44P 5:11P 5:14P 5:41P 5:44P 6:11P 6:14P 6:41P 6:44P 7:11P 7:14P 7:41P 8:11P 9:11P 10:11P 11:11P 12:11A
West Oakland DP 3:44P 3:45P 4:14P 4:15P 4:45P 4:44P 5:15P 5:14P 5:45P 5:44P 6:15P 6:14P 6:45P 7:15P 7:45P 8:15P 9:15P 10:15P 11:15P
Oakland Jack London 3:49P 3:50P 4:19P 4:20P 4:50P 4:49P 5:20P 5:19P 5:50P 5:49P 6:20P 6:19P 6:50P 7:20P 7:50P 8:20P 9:20P 10:20P 11:20P
Oakland Coliseum 3:58P 4:28P 4:58P 5:28P 5:58P 6:28P 6:58P 7:28P 7:58P 8:28P 9:28P 10:28P 11:28P
Hayward 4:05P 4:35P 5:05P 5:35P 6:05P 6:35P 7:05P 7:35P 8:05P 8:35P 9:35P 10:35P 11:35P
San Jose Diridon AR 4:17P 4:24P 4:47P 4:54P 5:24P 5:17P 5:54P 5:47P 6:24P 6:17P 6:54P 6:47P 7:24P 7:54P 8:24P 8:54P 9:54P 10:54P 11:54P
San Jose Diridon DP 4:50P 4:55P 5:55P 5:50P 6:55P 7:55P
Tamien 5:00P 6:00P 7:00P 8:00P
Morgan Hill 5:18P 6:18P 7:18P 8:18P
Gilroy 5:21P 5:32P 6:32P 6:21P 7:32P 8:32P
Pajaro/Watsonville 5:50P 6:01P 7:01P 6:50P 8:01P 9:01P
Castroville 6:05P 6:16P 7:16P 7:05P 8:16P 9:16P
Salinas 6:15P 6:26P 7:26P 7:15P 8:26P 9:26P

2014 VISION PLAN UPDATE FINAL REPORT | CAPITOL CORRIDOR
Capitol Corridor Joint Powers Authority
Nelson\Nygaard Consulting Associates Inc. | 53
Table A-7 Schedule: Alternative B: Northbound/Eastbound:AM/Mid-Day
Northbound/Eastbound
Salinas 5:05A 5:45A 6:05A 6:45A 7:15A 7:45A 8:45A 10:45A 12:45P
Castroville 5:15A 5:55A 6:15A 6:55A 7:25A 7:55A 8:55A 10:55A 12:55P
Pajaro/Watsonville 5:30A 6:10A 6:30A 7:10A 7:40A 8:10A 9:10A 11:10A 1:10P
Gilroy 5:59A 6:39A 6:59A 7:39A 8:09A 8:39A 9:39A 11:39A 1:39P
Morgan Hill 6:13A 7:13A 8:23A 8:53A 9:53A 11:53A 1:53P
Tamien 6:31A 7:31A 8:41A 9:11A 10:11A 12:11P 2:11P
San Jose Diridon AR 6:36A 7:10A 7:36A 8:10A 8:46A 9:16A 10:16A 12:16P 2:16P
San Jose Diridon DP 5:20A 5:40A 5:50A 6:10A 6:20A 6:40A 6:50A 7:10A 7:20A 7:40A 7:50A 8:10A 8:20A 8:50A 9:20A 10:20A 11:20A 12:20P 1:20P 2:20P
Hayward 5:39A 6:09A 6:39A 7:09A 7:39A 8:09A 8:39A 9:09A 9:39A 10:39A 11:39A 12:39P 1:39P 2:39P
Oakland Coliseum 5:46A 6:16A 6:46A 7:16A 7:46A 8:16A 8:46A 9:16A 9:46A 10:46A 11:46A 12:46P 1:46P 2:46P
Oakland Jack London 5:54A 6:08A 6:24A 6:38A 6:54A 7:08A 7:24A 7:38A 7:54A 8:08A 8:24A 8:38A 8:54A 9:24A 9:54A 10:54A 11:54A 12:54P 1:54P 2:54P
West Oakland AR 5:59A 6:13A 6:29A 6:43A 6:59A 7:13A 7:29A 7:43A 7:59A 8:13A 8:29A 8:43A 8:59A 9:29A 9:59A 10:59A 11:59A 12:59P 1:59P 2:59P
West Oakland DP 5:00A 5:30A 5:45A 6:00A 6:15A 6:30A 6:45A 7:00A 7:15A 7:30A 7:45A 8:00A 8:30A 9:00A 10:00A 11:00A 12:00P 1:00P 2:00P 3:00P
Emeryville 5:05A 5:35A 6:05A 6:35A 7:05A 7:35A 8:05A 8:35A 9:05A 10:05A 11:05A 12:05P 1:05P 2:05P 3:05P
Berkeley 5:09A 5:39A 6:09A 6:39A 7:09A 7:39A 8:09A 8:39A 9:09A 10:09A 11:09A 12:09P 1:09P 2:09P 3:09P
Richmond 5:15A 5:45A 5:54A 6:15A 6:24A 6:45A 6:54A 7:15A 7:24A 7:45A 7:54A 8:15A 8:45A 9:15A 10:15A 11:15A 12:15P 1:15P 2:15P 3:15P
Martinez 5:31A 6:01A 6:10A 6:31A 6:40A 7:01A 7:10A 7:31A 7:40A 8:01A 8:10A 8:31A 9:01A 9:31A 10:31A 11:31A 12:31P 1:31P 2:31P 3:31P
Suisun 5:46A 6:16A 6:46A 7:16A 7:46A 8:16A 8:46A 9:16A 9:46A 10:46A 11:46A 12:46P 1:46P 2:46P 3:46P
Fairfield/Vacaville 5:50A 6:20A 6:50A 7:20A 7:50A 8:20A 8:50A 9:20A 9:50A 10:50A 11:50A 12:50P 1:50P 2:50P 3:50P
Davis 6:03A 6:33A 6:36A 7:03A 7:06A 7:33A 7:36A 8:03A 8:06A 8:33A 8:36A 9:03A 9:33A 10:03A 11:03A 12:03P 1:03P 2:03P 3:03P 4:03P
Sacramento AR 6:11A 6:41A 6:44A 7:11A 7:14A 7:41A 7:44A 8:11A 8:14A 8:41A 8:44A 9:11A 9:41A 10:11A 11:11A 12:11P 1:11P 2:11P 3:11P 4:11P
Sacramento DP 6:45A 7:45A 8:45A 10:15A 12:15P 2:15P 4:15P
Roseville 7:10A 8:10A 9:10A 10:40A 12:40P 2:40P 4:40P
Rocklin
Auburn

2014 VISION PLAN UPDATE FINAL REPORT | CAPITOL CORRIDOR
Capitol Corridor Joint Powers Authority
Nelson\Nygaard Consulting Associates Inc. | 54
Table A-8 Schedule: Alternative B: Northbound/Eastbound:PM
Northbound/Eastbound
Salinas 2:35P 4:35P 5:45P 6:45P 7:45P
Castroville 2:45P 4:45P 5:55P 6:55P 7:55P
Pajaro/Watsonville 3:00P 5:00P 6:10P 7:10P 8:10P
Gilroy 3:29P 5:29P 6:39P 7:39P 8:39P
Morgan Hill 3:43P 5:43P 6:53P 7:53P 8:53P
Tamien 4:01P 6:01P 7:11P 8:11P 9:11P
San Jose Diridon AR 4:06P 6:06P 7:16P 8:16P 9:16P
San Jose Diridon DP 3:20P 3:50P 4:10P 4:20P 4:40P 4:50P 5:10P 5:20P 5:40P 5:50P 6:10P 6:20P 6:40P 6:50P 7:20P 8:20P 9:20P 10:20P 11:20P
Hayward 3:39P 4:09P 4:39P 5:09P 5:39P 6:09P 6:39P 7:09P 7:39P 8:39P 9:39P 10:39P 11:39P
Oakland Coliseum 3:46P 4:16P 4:46P 5:16P 5:46P 6:16P 6:46P 7:16P 7:46P 8:46P 9:46P 10:46P 11:46P
Oakland Jack London 3:54P 4:24P 4:38P 4:54P 5:08P 5:24P 5:38P 5:54P 6:08P 6:24P 6:38P 6:54P 7:08P 7:24P 7:54P 8:54P 9:54P 10:54P 11:54P
West Oakland AR 3:59P 4:29P 4:43P 4:59P 5:13P 5:29P 5:43P 5:59P 6:13P 6:29P 6:43P 6:59P 7:13P 7:29P 7:59P 8:59P 9:59P 10:59P 11:59P
West Oakland DP 3:30P 3:45P 4:00P 4:15P 4:30P 4:45P 5:00P 5:15P 5:30P 5:45P 6:00P 6:15P 6:30P 7:00P 7:30P 8:00P 9:00P 10:00P 11:00P
Emeryville 3:35P 4:05P 4:35P 5:05P 5:35P 6:05P 6:35P 7:05P 7:35P 8:05P 9:05P 10:05P 11:05P
Berkeley 3:39P 4:09P 4:39P 5:09P 5:39P 6:09P 6:39P 7:09P 7:39P 8:09P 9:09P 10:09P 11:09P
Richmond 3:45P 3:54P 4:15P 4:24P 4:45P 4:54P 5:15P 5:24P 5:45P 5:54P 6:15P 6:24P 6:45P 7:15P 7:45P 8:15P 9:15P 10:15P 11:15P
Martinez 4:01P 4:10P 4:31P 4:40P 5:01P 5:10P 5:31P 5:40P 6:01P 6:10P 6:31P 6:40P 7:01P 7:31P 8:01P 8:31P 9:31P 10:31P 11:31P
Suisun 4:16P 4:46P 5:16P 5:46P 6:16P 6:46P 7:16P 7:46P 8:16P 8:46P 9:46P 10:46P 11:46P
Fairfield/Vacaville 4:20P 4:50P 5:20P 5:50P 6:20P 6:50P 7:20P 7:50P 8:20P 8:50P 9:50P 10:50P 11:50P
Davis 4:33P 4:36P 5:03P 5:06P 5:33P 5:36P 6:03P 6:06P 6:33P 6:36P 7:03P 7:06P 7:33P 8:03P 8:33P 9:03P 10:03P 11:03P 12:03A
Sacramento AR 4:41P 4:44P 5:11P 5:14P 5:41P 5:44P 6:11P 6:14P 6:41P 6:44P 7:11P 7:14P 7:41P 8:11P 8:41P 9:11P 10:11P 11:11P 12:11A
Sacramento DP 5:15P 5:45P 6:15P
Roseville 5:40P 6:10P 6:40P
Rocklin 5:49P 6:49P
Auburn 6:07P 7:07P

2014 VISION PLAN UPDATE FINAL REPORT | CAPITOL CORRIDOR
Capitol Corridor Joint Powers Authority
Nelson\Nygaard Consulting Associates Inc. | 55
Table A-9 Schedule: Alternative C: Southbound/Westbound:AM/Mid-Day
Southbound/Westbound
Auburn 6:18A 7:18A
Rocklin 6:36A 7:36A
Roseville 6:15A 6:45A 7:15A 7:45A 9:30A 11:30A 1:30P
Sacramento AR 6:40A 7:10A 7:40A 8:10A 9:55A 11:55A 1:55P
Sacramento DP 5:00A 5:30A 5:45A 6:00A 6:15A 6:30A 6:45A 7:00A 7:15A 7:30A 7:45A 8:00A 8:15A 8:30A 9:00A 10:00A 11:00A 12:00P 1:00P 2:00P
Davis 5:08A 5:38A 5:53A 6:08A 6:23A 6:38A 6:53A 7:08A 7:23A 7:38A 7:53A 8:08A 8:23A 8:38A 9:08A 10:08A 11:08A 12:08P 1:08P 2:08P
Fairfield/Vacaville 5:20A 5:50A 6:20A 6:50A 7:20A 7:50A 8:20A 8:50A 9:20A 10:20A 11:20A 12:20P 1:20P 2:20P
Suisun 5:24A 5:54A 6:24A 6:54A 7:24A 7:54A 8:24A 8:54A 9:24A 10:24A 11:24A 12:24P 1:24P 2:24P
Martinez 5:39A 6:09A 6:18A 6:39A 6:48A 7:09A 7:18A 7:39A 7:48A 8:09A 8:18A 8:39A 8:48A 9:09A 9:39A 10:39A 11:39A 12:39P 1:39P 2:39P
Richmond 5:59A 6:29A 6:38A 6:59A 7:08A 7:29A 7:38A 7:59A 8:08A 8:29A 8:38A 8:59A 9:08A 9:29A 9:59A 10:59A 11:59A 12:59P 1:59P 2:59P
Berkeley 6:05A 6:35A 7:05A 7:35A 8:05A 8:35A 9:05A 9:35A 10:05A 11:05A 12:05P 1:05P 2:05P 3:05P
Emeryville 6:09A 6:39A 7:09A 7:39A 8:09A 8:39A 9:09A 9:39A 10:09A 11:09A 12:09P 1:09P 2:09P 3:09P
West Oakland AR 6:14A 6:44A 6:47A 7:14A 7:17A 7:44A 7:47A 8:14A 8:17A 8:44A 8:47A 9:14A 9:17A 9:44A 10:14A 11:14A 12:14P 1:14P 2:14P 3:14P
West Oakland DP 5:20A 5:50A 6:17A 6:20A 6:50A 6:47A 7:20A 7:17A 7:50A 7:47A 8:20A 8:17A 8:50A 9:20A 10:20A 11:20A 12:20P 1:20P 2:20P 3:20P
Oakland Jack London 5:25A 5:55A 6:22A 6:25A 6:55A 6:52A 7:25A 7:22A 7:55A 7:52A 8:25A 8:22A 8:55A 9:25A 10:25A 11:25A 12:25P 1:25P 2:25P 3:25P
Oakland Coliseum 5:34A 6:04A 6:34A 7:04A 7:34A 8:04A 8:34A 9:04A 9:34A 10:34A 11:34A 12:34P 1:34P 2:34P 3:34P
Fremont Centerville 5:48A 6:18A 6:48A 7:18A 7:48A 8:18A 8:48A 9:18A 9:48A 10:48A 11:48A 12:48P 1:48P 2:48P 3:48P
Santa Clara Great America 6:01A 6:31A 6:52A 7:01A 7:31A 7:22A 8:01A 7:52A 8:31A 8:22A 9:01A 8:52A 9:31A 10:01A 11:01A 12:01P 1:01P 2:01P 3:01P 4:01P
Santa Clara University 6:09A 6:39A 7:09A 7:39A 8:09A 8:39A 9:09A 9:39A 10:09A 11:09A 12:09P 1:09P 2:09P 3:09P 4:09P
San Jose Diridon AR 6:12A 6:42A 7:01A 7:12A 7:42A 7:31A 8:12A 8:01A 8:42A 8:31A 9:12A 9:01A 9:42A 10:12A 11:12A 12:12P 1:12P 2:12P 3:12P 4:12P
San Jose Diridon DP 6:15A 7:15A 8:15A 9:15A 11:15A 1:15P 3:15P 4:15P
Tamien 6:20A 7:20A 8:20A 9:20A 11:20A 1:20P 3:20P 4:20P
Morgan Hill 6:38A 7:38A 8:38A 9:38A 11:38A 1:38P 3:38P 4:38P
Gilroy 6:52A 7:52A 8:52A 9:52A 11:52A 1:52P 3:52P 4:52P
Pajaro/Watsonville 7:21A 8:21A 9:21A 10:21A 12:21P 2:21P 4:21P 5:21P
Castroville 7:36A 8:36A 9:36A 10:36A 12:36P 2:36P 4:36P 5:36P
Salinas 7:46A 8:46A 9:46A 10:46A 12:46P 2:46P 4:46P 5:46P

2014 VISION PLAN UPDATE FINAL REPORT | CAPITOL CORRIDOR
Capitol Corridor Joint Powers Authority
Nelson\Nygaard Consulting Associates Inc. | 56
Table A-10 Schedule: Alternative C: Southbound/Westbound:PM
Southbound/Westbound
Auburn
Rocklin
Roseville 3:45P 4:45P 5:45P
Sacramento AR 4:10P 5:10P 6:10P
Sacramento DP 3:00P 3:30P 3:45P 4:00P 4:15P 4:30P 4:45P 5:00P 5:15P 5:30P 5:45P 6:00P 6:15P 6:30P 7:00P 8:00P 9:00P 10:00P 11:00P
Davis 3:08P 3:38P 3:53P 4:08P 4:23P 4:38P 4:53P 5:08P 5:23P 5:38P 5:53P 6:08P 6:23P 6:38P 7:08P 8:08P 9:08P 10:08P 11:08P
Fairfield/Vacaville 3:20P 3:50P 4:20P 4:50P 5:20P 5:50P 6:20P 6:50P 7:20P 8:20P 9:20P 10:20P 11:20P
Suisun 3:24P 3:54P 4:24P 4:54P 5:24P 5:54P 6:24P 6:54P 7:24P 8:24P 9:24P 10:24P 11:24P
Martinez 3:39P 4:09P 4:18P 4:39P 4:48P 5:09P 5:18P 5:39P 5:48P 6:09P 6:18P 6:39P 6:48P 7:09P 7:39P 8:39P 9:39P 10:39P 11:39P
Richmond 3:59P 4:29P 4:38P 4:59P 5:08P 5:29P 5:38P 5:59P 6:08P 6:29P 6:38P 6:59P 7:08P 7:29P 7:59P 8:59P 9:59P 10:59P 11:59P
Berkeley 4:05P 4:35P 5:05P 5:35P 6:05P 6:35P 7:05P 7:35P 8:05P 9:05P 10:05P 11:05P 12:05A
Emeryville 4:09P 4:39P 5:09P 5:39P 6:09P 6:39P 7:09P 7:39P 8:09P 9:09P 10:09P 11:09P 12:09A
West Oakland AR 4:14P 4:44P 4:47P 5:14P 5:17P 5:44P 5:47P 6:14P 6:17P 6:44P 6:47P 7:14P 7:17P 7:44P 8:14P 9:14P 10:14P 11:14P 12:14A
West Oakland DP 3:47P 3:50P 4:17P 4:20P 4:50P 4:47P 5:20P 5:17P 5:50P 5:47P 6:20P 6:17P 6:50P 7:20P 7:50P 8:20P 9:20P 10:20P 11:20P
Oakland Jack London 3:52P 3:55P 4:22P 4:25P 4:55P 4:52P 5:25P 5:22P 5:55P 5:52P 6:25P 6:22P 6:55P 7:25P 7:55P 8:25P 9:25P 10:25P 11:25P
Oakland Coliseum 4:04P 4:34P 5:04P 5:34P 6:04P 6:34P 7:04P 7:34P 8:04P 8:34P 9:34P 10:34P 11:34P
Fremont Centerville 4:18P 4:48P 5:18P 5:48P 6:18P 6:48P 7:18P 7:48P 8:18P 8:48P 9:48P 10:48P 11:48P
Santa Clara Great America 4:22P 4:31P 4:52P 5:01P 5:31P 5:22P 6:01P 5:52P 6:31P 6:22P 7:01P 6:52P 7:31P 8:01P 8:31P 9:01P 10:01P 11:01P 12:01A
Santa Clara University 4:39P 5:09P 5:39P 6:09P 6:39P 7:09P 7:39P 8:09P 8:39P 9:09P 10:09P 11:09P 12:09A
San Jose Diridon AR 4:31P 4:42P 5:01P 5:12P 5:42P 5:31P 6:12P 6:01P 6:42P 6:31P 7:12P 7:01P 7:42P 8:12P 8:42P 9:12P 10:12P 11:12P 12:12A
San Jose Diridon DP 5:05P 5:15P 6:15P 6:05P 7:15P 8:15P
Tamien 5:20P 6:20P 7:20P 8:20P
Morgan Hill 5:38P 6:38P 7:38P 8:38P
Gilroy 5:36P 5:52P 6:52P 6:36P 7:52P 8:52P
Pajaro/Watsonville 6:05P 6:21P 7:21P 7:05P 8:21P 9:21P
Castroville 6:20P 6:36P 7:36P 7:20P 8:36P 9:36P
Salinas 6:30P 6:46P 7:46P 7:30P 8:46P 9:46P
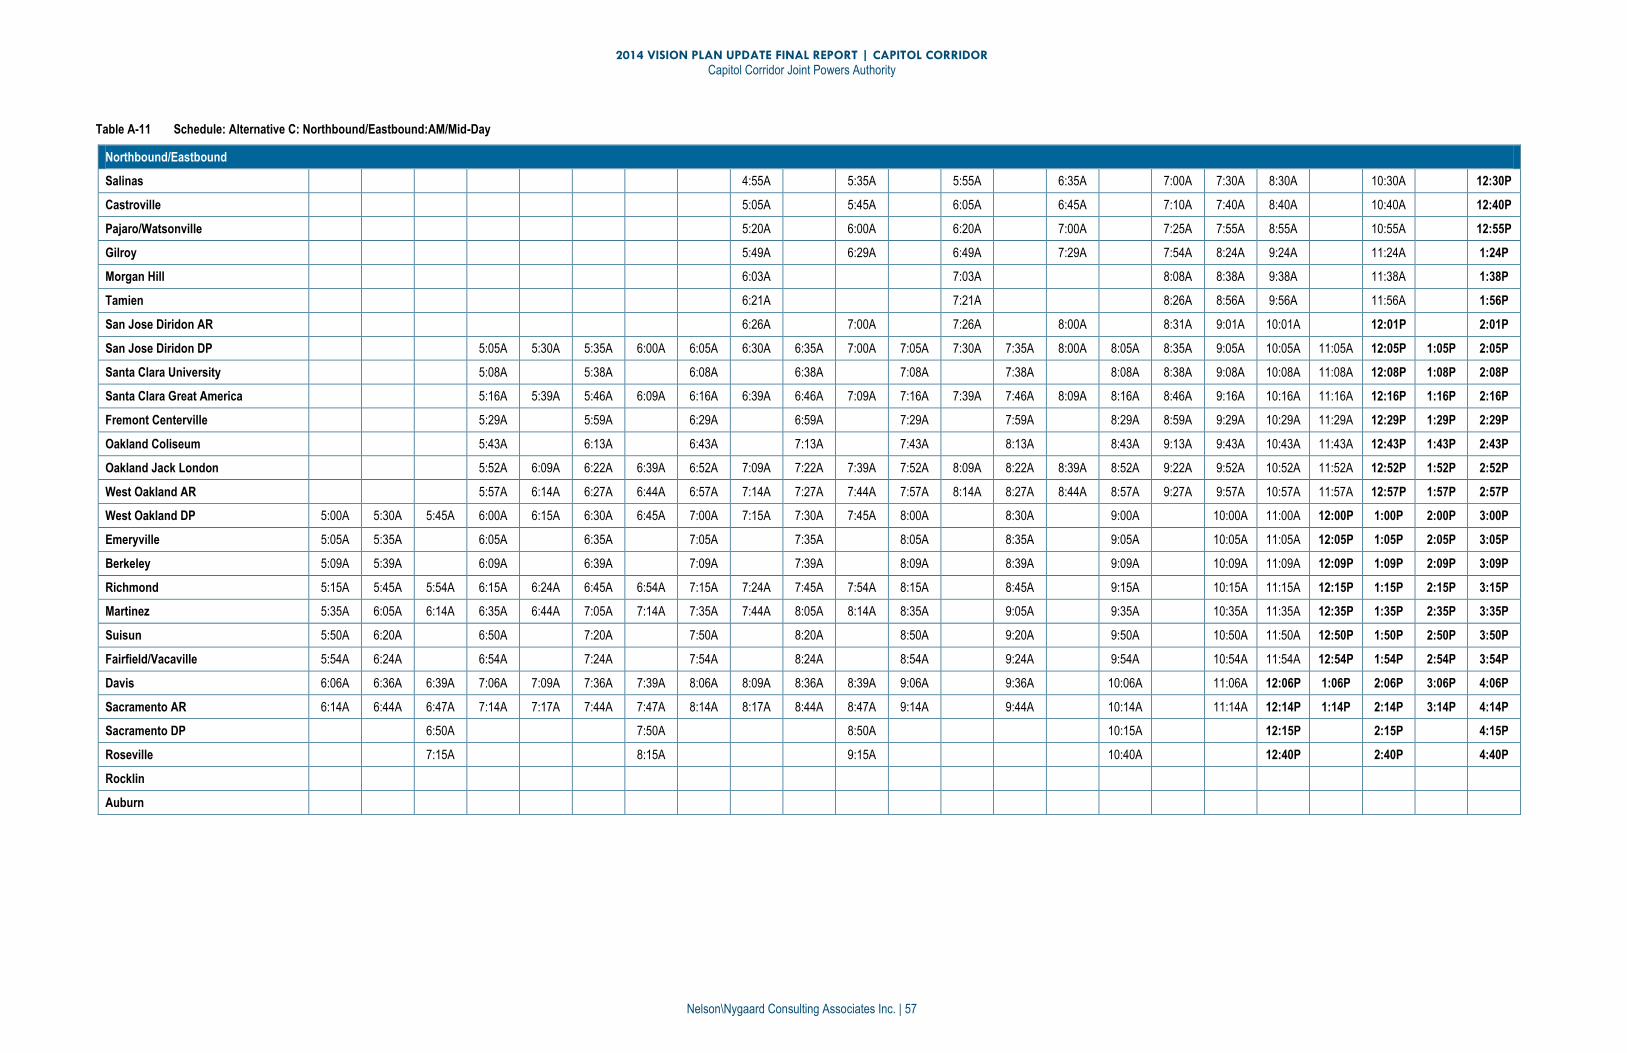
2014 VISION PLAN UPDATE FINAL REPORT | CAPITOL CORRIDOR
Capitol Corridor Joint Powers Authority
Nelson\Nygaard Consulting Associates Inc. | 57
Table A-11 Schedule: Alternative C: Northbound/Eastbound:AM/Mid-Day
Northbound/Eastbound
Salinas 4:55A 5:35A 5:55A 6:35A 7:00A 7:30A 8:30A 10:30A 12:30P
Castroville 5:05A 5:45A 6:05A 6:45A 7:10A 7:40A 8:40A 10:40A 12:40P
Pajaro/Watsonville 5:20A 6:00A 6:20A 7:00A 7:25A 7:55A 8:55A 10:55A 12:55P
Gilroy 5:49A 6:29A 6:49A 7:29A 7:54A 8:24A 9:24A 11:24A 1:24P
Morgan Hill 6:03A 7:03A 8:08A 8:38A 9:38A 11:38A 1:38P
Tamien 6:21A 7:21A 8:26A 8:56A 9:56A 11:56A 1:56P
San Jose Diridon AR 6:26A 7:00A 7:26A 8:00A 8:31A 9:01A 10:01A 12:01P 2:01P
San Jose Diridon DP 5:05A 5:30A 5:35A 6:00A 6:05A 6:30A 6:35A 7:00A 7:05A 7:30A 7:35A 8:00A 8:05A 8:35A 9:05A 10:05A 11:05A 12:05P 1:05P 2:05P
Santa Clara University 5:08A 5:38A 6:08A 6:38A 7:08A 7:38A 8:08A 8:38A 9:08A 10:08A 11:08A 12:08P 1:08P 2:08P
Santa Clara Great America 5:16A 5:39A 5:46A 6:09A 6:16A 6:39A 6:46A 7:09A 7:16A 7:39A 7:46A 8:09A 8:16A 8:46A 9:16A 10:16A 11:16A 12:16P 1:16P 2:16P
Fremont Centerville 5:29A 5:59A 6:29A 6:59A 7:29A 7:59A 8:29A 8:59A 9:29A 10:29A 11:29A 12:29P 1:29P 2:29P
Oakland Coliseum 5:43A 6:13A 6:43A 7:13A 7:43A 8:13A 8:43A 9:13A 9:43A 10:43A 11:43A 12:43P 1:43P 2:43P
Oakland Jack London 5:52A 6:09A 6:22A 6:39A 6:52A 7:09A 7:22A 7:39A 7:52A 8:09A 8:22A 8:39A 8:52A 9:22A 9:52A 10:52A 11:52A 12:52P 1:52P 2:52P
West Oakland AR 5:57A 6:14A 6:27A 6:44A 6:57A 7:14A 7:27A 7:44A 7:57A 8:14A 8:27A 8:44A 8:57A 9:27A 9:57A 10:57A 11:57A 12:57P 1:57P 2:57P
West Oakland DP 5:00A 5:30A 5:45A 6:00A 6:15A 6:30A 6:45A 7:00A 7:15A 7:30A 7:45A 8:00A 8:30A 9:00A 10:00A 11:00A 12:00P 1:00P 2:00P 3:00P
Emeryville 5:05A 5:35A 6:05A 6:35A 7:05A 7:35A 8:05A 8:35A 9:05A 10:05A 11:05A 12:05P 1:05P 2:05P 3:05P
Berkeley 5:09A 5:39A 6:09A 6:39A 7:09A 7:39A 8:09A 8:39A 9:09A 10:09A 11:09A 12:09P 1:09P 2:09P 3:09P
Richmond 5:15A 5:45A 5:54A 6:15A 6:24A 6:45A 6:54A 7:15A 7:24A 7:45A 7:54A 8:15A 8:45A 9:15A 10:15A 11:15A 12:15P 1:15P 2:15P 3:15P
Martinez 5:35A 6:05A 6:14A 6:35A 6:44A 7:05A 7:14A 7:35A 7:44A 8:05A 8:14A 8:35A 9:05A 9:35A 10:35A 11:35A 12:35P 1:35P 2:35P 3:35P
Suisun 5:50A 6:20A 6:50A 7:20A 7:50A 8:20A 8:50A 9:20A 9:50A 10:50A 11:50A 12:50P 1:50P 2:50P 3:50P
Fairfield/Vacaville 5:54A 6:24A 6:54A 7:24A 7:54A 8:24A 8:54A 9:24A 9:54A 10:54A 11:54A 12:54P 1:54P 2:54P 3:54P
Davis 6:06A 6:36A 6:39A 7:06A 7:09A 7:36A 7:39A 8:06A 8:09A 8:36A 8:39A 9:06A 9:36A 10:06A 11:06A 12:06P 1:06P 2:06P 3:06P 4:06P
Sacramento AR 6:14A 6:44A 6:47A 7:14A 7:17A 7:44A 7:47A 8:14A 8:17A 8:44A 8:47A 9:14A 9:44A 10:14A 11:14A 12:14P 1:14P 2:14P 3:14P 4:14P
Sacramento DP 6:50A 7:50A 8:50A 10:15A 12:15P 2:15P 4:15P
Roseville 7:15A 8:15A 9:15A 10:40A 12:40P 2:40P 4:40P
Rocklin
Auburn

2014 VISION PLAN UPDATE FINAL REPORT | CAPITOL CORRIDOR
Capitol Corridor Joint Powers Authority
Nelson\Nygaard Consulting Associates Inc. | 58
Table A-12 Schedule: Alternative C: Northbound/Eastbound:PM
Northbound/Eastbound
Salinas 2:25P 4:25P 5:30P 6:30P 7:30P
Castroville 2:35P 4:35P 5:40P 6:40P 7:40P
Pajaro/Watsonville 2:50P 4:50P 5:55P 6:55P 7:55P
Gilroy 3:19P 5:19P 6:24P 7:24P 8:24P
Morgan Hill 3:33P 5:33P 6:38P 7:38P 8:38P
Tamien 3:51P 5:51P 6:56P 7:56P 8:56P
San Jose Diridon AR 3:56P 5:56P 7:01P 8:01P 9:01P
San Jose Diridon DP 3:05P 3:35P 4:00P 4:05P 4:30P 4:35P 5:00P 5:05P 5:30P 5:35P 6:00P 6:05P 6:30P 6:35P 7:05P 8:05P 9:05P 10:05P 11:05P
Santa Clara University 3:08P 3:38P 4:08P 4:38P 5:08P 5:38P 6:08P 6:38P 7:08P 8:08P 9:08P 10:08P 11:08P
Santa Clara Great America 3:16P 3:46P 4:09P 4:16P 4:39P 4:46P 5:09P 5:16P 5:39P 5:46P 6:09P 6:16P 6:39P 6:46P 7:16P 8:16P 9:16P 10:16P 11:16P
Fremont Centerville 3:29P 3:59P 4:29P 4:59P 5:29P 5:59P 6:29P 6:59P 7:29P 8:29P 9:29P 10:29P 11:29P
Oakland Coliseum 3:43P 4:13P 4:43P 5:13P 5:43P 6:13P 6:43P 7:13P 7:43P 8:43P 9:43P 10:43P 11:43P
Oakland Jack London 3:52P 4:22P 4:39P 4:52P 5:09P 5:22P 5:39P 5:52P 6:09P 6:22P 6:39P 6:52P 7:09P 7:22P 7:52P 8:52P 9:52P 10:52P 11:52P
West Oakland AR 3:57P 4:27P 4:44P 4:57P 5:14P 5:27P 5:44P 5:57P 6:14P 6:27P 6:44P 6:57P 7:14P 7:27P 7:57P 8:57P 9:57P 10:57P 11:57P
West Oakland DP 3:30P 3:45P 4:00P 4:15P 4:30P 4:45P 5:00P 5:15P 5:30P 5:45P 6:00P 6:15P 6:30P 7:00P 7:30P 8:00P 9:00P 10:00P 11:00P
Emeryville 3:35P 4:05P 4:35P 5:05P 5:35P 6:05P 6:35P 7:05P 7:35P 8:05P 9:05P 10:05P 11:05P
Berkeley 3:39P 4:09P 4:39P 5:09P 5:39P 6:09P 6:39P 7:09P 7:39P 8:09P 9:09P 10:09P 11:09P
Richmond 3:45P 3:54P 4:15P 4:24P 4:45P 4:54P 5:15P 5:24P 5:45P 5:54P 6:15P 6:24P 6:45P 7:15P 7:45P 8:15P 9:15P 10:15P 11:15P
Martinez 4:05P 4:14P 4:35P 4:44P 5:05P 5:14P 5:35P 5:44P 6:05P 6:14P 6:35P 6:44P 7:05P 7:35P 8:05P 8:35P 9:35P 10:35P 11:35P
Suisun 4:20P 4:50P 5:20P 5:50P 6:20P 6:50P 7:20P 7:50P 8:20P 8:50P 9:50P 10:50P 11:50P
Fairfield/Vacaville 4:24P 4:54P 5:24P 5:54P 6:24P 6:54P 7:24P 7:54P 8:24P 8:54P 9:54P 10:54P 11:54P
Davis 4:36P 4:39P 5:06P 5:09P 5:36P 5:39P 6:06P 6:09P 6:36P 6:39P 7:06P 7:09P 7:36P 8:06P 8:36P 9:06P 10:06P 11:06P 12:06A
Sacramento AR 4:44P 4:47P 5:14P 5:17P 5:44P 5:47P 6:14P 6:17P 6:44P 6:47P 7:14P 7:17P 7:44P 8:14P 8:44P 9:14P 10:14P 11:14P 12:14A
Sacramento DP 5:20P 5:50P 6:20P
Roseville 5:45P 6:15P 6:45P
Rocklin 5:54P 6:54P
Auburn 6:12P 7:12P