capitalism in crisis? - social enterprise
TRANSCRIPT

CAPITALISM IN CRISIS?Transforming our economy for people and planet
Supported by

This report was written by Claire Mansfield and Dan Gregory for Social Enterprise UK. The research was designed by Claire Mansfield, assisted by Dan Gregory and the wider SEUK team, with support from Emma Osbourne at BMG. The fieldwork was carried out by BMG research.
Social Enterprise UK would like to thank Santander for their sponsorship of this report, and particularly Sophie Graham for her support.
We would like to thank Co-operatives UK, Locality, Social Enterprise East of England, and UnLtd for helping us reach a wide range of survey respondents – as well as the many organisations who promoted this survey through their network. Thanks also to our colleagues in Scotland and Wales who have shared their own work and data with us, as we continue to work towards a fuller picture of the whole social enterprise sector in the UK.
Thanks to the whole Social Enterprise UK team involved in producing this report, especially Shehan Perera, Peter Holbrook, Nancy Towers, Kate Murray, Charlie Wigglesworth, and Fiona Young. The largest thanks of all goes to the social enterprises who gave up their time to respond to this survey.
PHOTO CREDITSAll photographs were provided by the social enterprises themselves or from Social Enterprise UK’s own photo database.
Front cover: SEUKPage 15: The Good HotelPage 22: Jonathan Cole Photography Page 31: CafédirectPage 43: EbicoPages 52 and 53: PSS
ACKNOWLEDGEMENTS

FOREWORD FROM SOCIAL ENTERPRISE UKThis year marks the 220th anniversary of Robert Owen’s purchase of New Lanark. In 1799, Robert bought a mill in Scotland and he shifted its business model and used its profits to improve the lives of the workers. New Lanark provided housing, access to health and education and reduced the working week for employees. It was arguably one of the first social enterprises. Robert’s work inspired the Rochdale Pioneers and this year we celebrated the 175th birthday of their founding and the birth of the modern co-operative movement. These are both important, but too often untold, moments in the evolution of business and social enterprise.
These anniversaries prompt us to pose an interesting question. What would our country be like if it had taken a different path in the 19th and 20th centuries? What if, instead of shareholder-dominated businesses, we had an economy populated primarily by social enterprises? This State of Social Enterprise report gives an impression of what that could look like.
We would have 4 million more people being paid the real Living Wage. We would have over 1 million more women leading businesses. Our FTSE 100 would have forty women CEOs, not five. We would have 400,000 more businesses led by BAME people. We would have over £118 billion of additional profits reinvested back into improving society and protecting the planet every single year. We would have a lower level of regional inequality, with tens of thousands more businesses spread across the Midlands and the North. We’d be innovating more. We’d be exporting more. We’d be more environmentally responsible.
The 2019 State of Social Enterprise report is important, because it gives us a picture of an alternative, better Britain. It shows a different economy that is not a work of economic fiction but is grounded in fact. At a time of crisis: social, environmental and economic – we can show the way forward.
You would think with the possibilities outlined above, politicians and commentators would be chomping at the bit to grow and expand social enterprise – to make it mainstream. Yet this breakthrough hasn’t yet happened.
But we need it to happen and fast. It has taken our sector 220 years from Robert Owen’s purchase of New Lanark to get to where we are now. There are now 100,000 social enterprises contributing £60bn to UK GDP. This is a good progress, but not good enough.
Capitalism is in crisis. The Intergovernmental Panel for Climate Change tells us that we have little more than a decade to drastically cut our carbon emissions. Our society is increasingly divided and tensions are rising more often to the surface. Our younger generation is the first to believe that they won’t have lives as good as their parents. People are fed up and they want change. If they don’t get that change, who knows what will happen next? We certainly don’t have another 200 years to delay.
Yet as is so often the way, when a great crisis emerges – the right solution presents itself.
These State of Social Enterprise reports provide the building evidence to show that a better form of business isn’t pie in the sky. It is practical and real. All we need is the courage to make the right choices.
It is 12 years since the first State of Social Enterprise report. My hope is that in another 12 years’ time we won’t have to explain what a social enterprise is or why it is the future of business. The foundations of our economy will have changed significantly enough for social enterprise to be seen as the natural way of doing business.
If we haven’t achieved this breakthrough, I fear that the triple threat of social division, ecological breakdown and economic stagnation will have overcome us.
I urge you to use the wealth of evidence contained in this report to campaign, fight for and secure the evolution of business and for the UK to finally take the road we should have taken more than two centuries ago.
Lord Victor Adebowale CBE Chair of Social Enterprise UK

FOREWORD FROM SANTANDERWithout doubt, social enterprises are vital to the UK economy and the SME sector. The ‘State of Social Enterprise’ is the most comprehensive report into the sector and as long time members of Social Enterprise UK, we are delighted to be supporting this again. We are committed to supporting financial inclusion and sustainable economic growth, in particular through our Breakthrough Programme and our work with small and medium sized business across all regions in the UK.
We believe social enterprises are leading the way for business in many areas, and this report makes that clear. The start-up wave of social enterprises continues to surge, with 42% under 5 years old. This movement is being driven by women and BAME-led start-ups, demonstrating the vibrancy and diversity of the sector. Social enterprises create vital opportunities in uncertain times, employing those who are disadvantaged, and reinvesting over 75% of their profits into delivering their mission.
Crucially, social enterprises are proving commercially strong as well: with more than half growing their turnover in the last 12 months, and over three-quarters making a profit or breaking even. This is supported by the finding that they are more far innovative than their mainstream counterparts, with 56% introducing a new product or service in 2019.
It’s never been more important to support and invest in the businesses which create jobs, opportunities, and have a positive impact on society. This report from Social Enterprise UK is a powerful testament to the economic, environmental and social value delivered by the social enterprise movement; and provides a compelling case for supporting and investing in social enterprises.
Susan Davies Managing Director, Santander Business, Santander UK

Executive summary 6
1.0 Introduction 11
2.0 Methodology 12
3.0 Scale and Scope 16
4.0 Markets and Money 23
5.0 People and Purpose 32
6.0 Barriers and Enablers 46
7.0 Conclusion and Recommendations 54
CONTENTS

EXECUTIVE SUMMARY
42% of social enterprises are
under 5 years old
52% of social enterprises
grew their turnover in the last 12 months
77% of social enterprises earn more than 75% of their income from trading
40% of social enterprises are led by women
35% of social enterprises
have BAME directors
76% of social enterprises said that they were a living wage employer
88% of social enterprises
actively aim to minimise environmental impact
65% of social enterprises expect to
increase their focus on sustainability and
environmental friendliness
75% of social enterprises consider environmental impact to be
of equal or greater importance than cost
For years, people have talked in earnest about the ‘triple bottom line’ of profits, people and planet. As the world faces the triple threat of economic stagnation, social division and environmental breakdown, social enterprises are meeting these challenges head on.
EC
ON
OM
ICS
OC
IAL
EN
VIR
ON
MEN
TAL
6 Capitalism in Crisis?: State of Social Enterprise Survey 2019

ECONOMIC DYNAMISM Social enterprises are growing businesses. Over a decade of research has shown this time and time again. They are optimistic and ambitious and expect to continue this growth in the year ahead. Despite the economic and political turbulence of recent years, social enterprises are increasing their size, hiring more staff and increasing their impact. This success has been achieved as social enterprises are outperforming their peers in the private sector through higher levels of innovation, investing in people and engaging staff and communities. Social enterprises are showing that business focused on a social and environmental mission can deliver better economic performance.
KEY FINDINGS: GROWING IN NUMBER: 42% of social enterprises are under 5 years old, which is three times the proportion of SMEs more widely (14%). Three in ten social enterprises are three years old or less, even higher than previously, showing that the start-up wave identified in previous research continues to surge.
GROWING IN SIZE: 52% of social enterprises grew their turnover in the last 12 months. This is higher than in 2017 and much higher than the 34% of SMEs who have seen an increase.
INDEPENDENT BUSINESSES: Social enterprises are businesses that earn their income through trading, competing in the marketplace – 77% of social enterprises earn more than 75% of their income from trading, up on our previous survey.
MORE INNOVATIVE: The proportion of social enterprises introducing a new product or service was 56% in 2019, higher again than previous years and far outstripping SMEs, at 36%.
COMMERCIALLY SUCCESSFUL: 48% of social enterprises made a profit in the past year, with 27% breaking even and a lower percentage losing money than in previous research. The longer a social enterprise has been around, the more likely it is to make a profit.
Capitalism in Crisis?: State of Social Enterprise Survey 2019 7

SOCIAL JUSTICE Unlike ‘traditional’ business, whose growth can lead to greater inequality, the value created by social enterprise is shared with everyone. Social enterprises are reinvesting their profits back into delivering their mission. The benefits are shared across communities, often in our most deprived areas. Social enterprises are addressing the principal social challenges we face, including tackling gender and racial inequality through the leadership of women and black and ethnic minority leaders.
KEY FINDINGS MORE DIVERSE: 40% of social enterprises are led by women, over twice as high as SMEs more widely (17%). Two in five (42%) have a majority female workforce; for 13%, women are the entire workforce. 34% of women-led social enterprises are under three years old, compared with 28% led by men.
MORE REPRESENTATIVE: 13% of social enterprises are BAME led and 35% have BAME directors making social enterprises much more representative of the population as a whole. 42% of BAME-led social enterprises are under three years old, showing the vibrancy of this part of the sector.
JOBS WHERE THEY’RE NEEDED: 73% of respondents reported that their organisation works with individuals facing disadvantage, also up on previous years, while 42% reported that their organisation seeks to employ them.
JOBS THAT ARE VALUED: Three-quarters (76%) of respondents said that they were a Living Wage employer.
8 Capitalism in Crisis?: State of Social Enterprise Survey 2019

ENVIRONMENTAL RESPONSIBILITYSocial enterprises are responding to the scale of the climate crisis in a way that many other businesses are not. Social enterprises recognise that environmental impact needs to have a greater weighting in the future and that staff need to be encouraged to act as environmentally responsible as possible.
Yet social enterprises continue to face a diverse range of challenges to their growth, not just financial, but operational, economic and regulatory. They need support from government to match the commitment of their customers and the energy of their leaders if they are going to continue to lead the way to a more prosperous, fairer and greener future.
KEY FINDINGS RESPECTING THE ENVIRONMENT: Nearly nine out of ten social enterprises (88%) report that their organisation actively aims to minimise its environmental impact, up from our previous survey.
DRIVING SUSTAINABILITY: 65% of social enterprises expect the focus on sustainable and environmentally friendly processes within their organisation to increase in the next two to three years. This is significantly higher than SMEs more widely (49%).
BALANCING PROFIT AND PLANET: 75% of social enterprises stated that they see environmental considerations as being of equal or more importance than cost when in comes to procurement decisions. This compares to 24% of SME owners.
Capitalism in Crisis?: State of Social Enterprise Survey 2019 9

10 Capitalism in Crisis?: State of Social Enterprise Survey 2019

This report presents the findings of the State of Social Enterprise Survey 2019. For over a decade this survey has been the largest, most credible, most comprehensive and most representative survey of social enterprises in the UK.
Social enterprises are businesses that trade in order to tackle the challenges we face in society. They make their money selling goods and services in markets using their business and their profits to improve society and protect the planet. As this research makes clear, they work across a wide range of areas: creating jobs and new opportunities, supporting the most vulnerable in society, improving our environment, and delivering high quality public services.
This survey confirms that our sector remains vibrant, with a high number of start-ups and a diverse leadership. The latter is important as social enterprises are not only changing our economy but also addressing the long-standing social inequalities that still dog the country.
Social enterprises cannot be pigeon-holed into one particular sector. They are not just delivering public services. They are not just small volunteer run businesses. They are not located just in socially conscious rich communities. Social enterprises are everywhere.
The model that social enterprises are developing and perfecting works in every sector, in every part of the country and for every size of business. This survey confirms what we outlined in the previous survey, that social enterprises are the future of business.
Social enterprises have evolved at the right time because more than ever, we need them. Last survey, we addressed the political and economic crisis that we face. These challenges sadly remain unaddressed. But over the past two years, the climate crisis has become more dominant in public consciousness and within political and business circles. This is critical. According to the Intergovernmental Panel on Climate Change (IPCC), we have only eleven years to limit the worst effects of climate change. What is required is nothing less than the complete re-engineering
of our economy. Business must change to ensure that we meet this goal. Social enterprises are demonstrating that they are the change that our planet needs.
This survey therefore aims to add to and strengthen the existing evidence base and provide a clear picture of how social enterprises are performing. As in previous years, it does this in four main areas:
Scale and scope: This section looks at the various types of social enterprise, such as start-ups and more well-established social enterprises, where they are located and their geographical reach, the economic sectors in which they work, and their scale.
Markets and money: This section looks at how social enterprises are performing as businesses in different markets, their income sources, and whether they are growing, profitable and optimistic for the future.
People and purpose: This section looks at social enterprises’ aims, who they seek to support and employ, their leadership, and the change they are making.
Barriers and enablers: This section looks at what is helping and hindering social enterprises to achieve their goals, with a particular focus on finance.
Given the pressing issues that we face due to the climate crisis, we have added more information on the approach that social enterprises are taking to the environment. Talent and recruiting staff has also become more of a challenge for social enterprises in the past two years. So we have taken steps to understand how social enterprises approach employing, retaining and engaging staff. We hope that this adds more light on these two important issues facing social enterprises.
1.0 INTRODUCTION
Capitalism in Crisis?: State of Social Enterprise Survey 2019 11

The State of Social Enterprise Survey 2019 was commissioned by Social Enterprise UK, in association with Santander. BMG Research were contracted to carry out the survey fieldwork. A total of 1068 responses were gathered via telephone interviews and online surveys.
1 that they agreed that their business has ‘primarily social objectives whose surpluses are principally reinvested for that purpose in the business or community, rather than being driven by the need to maximise profit for shareholders and owners’.
2 The Wales unweighted sample of 100 constitutes 9% of the unweighted total sample and this is then weighted down to represent 5% of the total sample.
2.1 PROCESSThe survey team used the relationships and networks available to Social Enterprise UK (SEUK hereafter) to identify sample sources, to develop the sample frame and obtain contact data. The sample frame consisted of SEUK members and databases, and members of related social enterprise networks and organisations: specifically, Co-operatives UK, Locality, School for Social Entrepreneurs and UnLtd. The sample frame was further enhanced by other relevant organisations encouraging their memberships to participate in the survey.
This data collection exercise provided a total potential dataset of 30,967 social enterprise contacts. The survey team then applied a three-step approach:
• A telephone survey in instances where contact numbers were available; (802 completed)
• An online version of the survey accessed via unique links sent to all remaining contacts with email addresses; (127 completed)
• An open online version of the survey which was circulated and promoted by SEUK and partners (139 completed)
In total, 1,068 interviews were completed.
As the networks from which data was obtained were diverse, taking in a wide variety of organisational forms, legal forms and objectives, a two-step filter was applied to ensure that
the sample sufficiently reflected the landscape of social enterprise. Organisations were only considered to be in the scope of the survey if they: defined their organisation as a social enterprise1; and generated 25% or more of their income from trading activities.In most cases, the individual within the organisation who undertook the survey was the person in day-to-day control of the business, or the person responsible for the business’s finances, in many cases the Managing Director or CEO (40%) but also other directors or managers.
2.2 SAMPLE CHARACTERISTICS We have maintained approximately the same sample size as 2017. This gives us confidence that it represents a fair overview of, and insight into social enterprises in the UK. As in 2017, the data has been supplemented by the Wales Co-operative Centre’s online survey based on the SEUK survey, which generated 699 completed responses2. In order to ensure that the results are not overly skewed by the inclusion of a large number of responses from Welsh organisations - only a small number of these cases have been included in the main sample, selected at random.
Social enterprises can take a range of legal forms. The most common types of legal status in our survey are:
• Company Limited by Guarantee (CLG) (28%)
• Company Limited by Shares (CLS) (18%),
• Community Interest Company limited by guarantee (15%)
2.0 METHODOLOGY
12 Capitalism in Crisis?: State of Social Enterprise Survey 2019

0 5 10 15 20 25 30
FIGURE 1: LEGAL STATUS
Sample base =1133
Company Limited by Guarantee (CLG) 28%
Company Limited by Shares (CLS) 18%
Community Interest Company (CIC) CLG 15%
Industrial and Provident Society (IPS) Bona Fide 8%
IPS BenCom 7%
CIC CLS 5%
Sole proprietorship 4%
CIC (unsure which) 3%
Limited Liability Partnership 1%
Unincorporated association 1%
Other 11%
Don’t know/can’t remember 4%
Organisational StructureWhen asked which of a number of organisational descriptions best describes their organisation:
• 33% use the term “social enterprise” to describe themselves
• 31% use the term “community business” to describe themselves
• 26% use the term “co-operative” to describe themselves
• Only 11% said that they were registered charities
For the purposes of this survey, all of the respondents are considered to be social enterprises and although understanding the terminology used in the sector is interesting it does not change the fundamental alignment of structure, purpose and profit which defines a social enterprise.
The long-term trend of the sector moving away from “civil society” into the mainstream business
community is one which is important to note. In 2009, 37% of social enterprises said that they were registered charities. Today that figure has fallen to 11%. This survey indicates that it is time for stakeholders, particularly government, to end the use of “VCSE” as a concept to describe the sector. Social enterprises are businesses and need to be considered as such.
SOCIAL ENTERPRISES WHO SEE THEMSELVES AS CHARITIES
2009 37%
2019 11%
Capitalism in Crisis?: State of Social Enterprise Survey 2019 13

2.3 REPORTINGResults have been presented rounded to zero decimal places, which may mean that some percentages may not add up to exactly 100%. Some questions have multiple answers, so responses in these cases will add up to more than 100%.
Comparisons with findings from other relevant surveys have been made under full acknowledgment that underlying caveats exist, making exact like-for-like comparisons difficult.
The vast majority of social enterprises are small businesses, and we compare the data here to the
small and medium enterprises (SMEs) in the Small Business Survey. The number of social enterprises with more than 250 employees in this survey is small enough for the difference to be negligible (c. 1%), so we have used the same set of figures in the report throughout.
This report tries to give regional and local insight into data where relevant, and where statistically significant. Where there is a risk of distorted figures, we have used median averages not mean averages – this can give a more accurate picture of the reality of social enterprise. Otherwise, a few large organisations can skew figures such as average turnover, for instance.
FIGURE 2: ORGANISATION DESCRIPTION
0 5 10 15 20 25 30 35
Sample base = 1133 2017 data was unprompted so not comparable
Social enterprise 33%
Community business 31%
Co-operative 26%
Registered charity 11%
Mutual/employee owned 11%
Social firm 10%
Public service spin-out 4%
Leisure trust 2%
Housing Association 1%
Development Trust 1%
None of these 2%
14 Capitalism in Crisis?: State of Social Enterprise Survey 2019

The Good Hotel is a hotel chain with a difference. With Good Hotels, you can Sleep Good Do Good.
Good Hotels are part of the Good Group, set up by Founder and CEO, Marten Dresen. It aims to showcase a different approach to doing business, built upon being a social enterprise. Good Hotels are a now a successful global business offering customers quality service in stunning settings with hotels currently open in London and Antigua de Guatemala. The Group will be opening new hotels in Rotterdam, Guatemala City and Amsterdam in 2020.
The Good Hotel operates like other luxury hotels with every room designed to maximise space, style and sleep.
Being a social enterprise means that the profits made through running the hotel do not line the pockets of shareholders, instead all profits are invested into educational projects around the world which seek to provide skills and training to those who really need it. The Good Hotel supports the Good Global Foundation which educates children around the world. One night’s good sleep can provide one week at school for a child in the Global South.
Through the Good Global Foundation, Good Hotel has so far donated over $100,000 and is on track to donate $500,000+ per year to its NGO partner Ninos de Guatemala. This NGO has built three schools providing quality education for 500+ students in poor, rural Guatemalan communities
In addition to the work of the Foundation, the Good Group developed their Good Training initiative, an innovative in-house training programme. Good Hotel works with local authorities to identify individuals who have been in long-term unemployment and offer them, regardless of background, a fresh start. Once they have been recruited into the programme, alongside being given the opportunity to be paid to learn the ins-and-outs of the hospitality trade, the focus is on self-development and giving Good Trainees the confidence they need to continue into the working-world long after the programme ends. After graduating, every student has the chance to work full time at the Good Hotel or with a carefully chosen partner organisation. Since launching in 2016 Good Hotels has trained over 300 people, with over 70% now still in full time employment.
Giving back has been at the core of what Good Hotel wanted to do since inception, however Good Hotel is benefitting from the rise of the “conscious consumer” and even more specifically, the trend of the “purpose-driven traveller”. Trends are clear that consumers, specifically of younger generations, are more and more leaning towards products and services that are sustainable and socially responsible. So, whilst a lot of the time, Good Hotel wins custom on the basis that it has great design and features, people are increasingly choosing to stay with Good Hotel over their competitors because of their social and charitable commitments. Even though many people still enter the hotel not knowing that it is a social enterprise, once they are made aware of it, it often results in repeat business and encourages word-of-mouth marketing.
Case study
THE GOOD HOTEL
Capitalism in Crisis?: State of Social Enterprise Survey 2019 15

3.0 SCALE AND SCOPE
KEY FINDINGS
GROWTH IN SOCIAL START-UPS: 42% of social enterprises are under 5 years old, which is three times the proportion of SMEs more widely (14%). Three in ten social enterprises are three years old or less, even higher than previously, showing that the start-up wave identified in previous research continues to surge.
GROWING IN SIZE: 52% of social enterprises grew their turnover in the last 12 months. This is higher than in 2017 and much higher than the 34% of SMEs who have seen an increase.
SUCCEEDING IN CHALLENGING MARKETS: The average turnover for social enterprises in the most deprived areas is £150,000 compared with £90,000 in the least deprived areas. Social enterprises are showing that with the right structures, local economies can be turned around.
REACHING COMMUNITIES: 21% of social enterprises are operating at a neighbourhood or local level, demonstrating the reach of the movement into communities.
WOMEN DRIVING THE MOVEMENT: 34% of women-led social enterprises are under three years old, compared with 28% led by men.
MORE REPRESENTATIVE: 42% of BAME-led social enterprises are under three years old, showing the vibrancy of this part of the sector.
16 Capitalism in Crisis?: State of Social Enterprise Survey 2019

3.1 INTRODUCTIONThis section presents findings on the landscape of social enterprise in the UK: how well established social enterprises are, the proportion of new start-ups, their locations, their turnover, their geographical reach, the types of community in which they work and the economic sectors in which they trade.
3.2 HOW WELL ESTABLISHED ARE SOCIAL ENTERPRISES?Previous surveys since 2009 have shown a consistent pattern among social enterprises: a core of well-established, larger social enterprises being joined by a growing proportion of start-ups.
These 2019 results show this trend broadly continuing. Start-up rates remain high and slightly higher than 2017. Three in ten organisations surveyed (30%) were established within the last three years, compared to one in four in 2017 (25%).
The social enterprise sector continues to be young, providing opportunity for innovation and growth. The proportion of social enterprise start-ups remains significantly higher than the figures for mainstream SMEs where only 14% are less than five years old compared to 42% of social enterprises.
A quarter of organisations (24%) have been trading for 21 or more years, similar to previous years, while the remainder (34%) have been trading between 6 and 20 years.
3.3 HOW BIG ARE SOCIAL ENTERPRISES?Respondents were asked to report their turnover for the most recent financial year. As can be seen in figure 4, there has been little change in the average level of turnover among social enterprises since 2013. This is because the growth of start-ups has kept the average the same, despite the growth of the rest of the social enterprise sector. Social enterprises are much more likely to be small businesses: almost one third are under £50,000. A consistent cohort are operating at scale, but the majority are small or micro.
Turnover is clearly associated with organisation
0
20
40
60
80
100
21 or more years
11-20 years
6-10 years
0-5 years
SMEsSocial enterprises
FIGURE 3: LENGTH OF OPERATION
14%
42% 17%
20%
26%
14%
42%
24%
Capitalism in Crisis?: State of Social Enterprise Survey 2019 17

FIGURE 5: MEDIAN ANNUAL TURNOVER/INCOME BY ORGANISATIONAL CHARACTERISTICS
0 50000 100000 150000 200000 250000 300000
11+ years6-10 years3-5 years
Up to 3 yearsLength of operation
RuralUrban
Urban/rural location
Quintile 5 (least deprived)Quintile 4Quintile 3Quintile 2
Quintile 1 (most deprived)IMD quintile
South excl LondonMidlands
Scotland/ NI/ WalesNorth
LondonLocation of organisation
Median annual turnover in £
0
20
40
60
80
100
Over £5 million
Over £1 million to £5 million
£250,001 to £1 million
£50,001 to £100,000
£0 to £50,000
2013201520172019
FIGURE 4: TURNOVERS OF SOCIAL ENTERPRISES
33%
34%
23%
6%
5%
31%
34%
21%
9%
6%
28%
28%
32%33%
20%21%
10%10%
6% 8%
18 Capitalism in Crisis?: State of Social Enterprise Survey 2019

FIGURE 6: AREA OF OPERATION
Europe 2%
England 9% Northern Ireland 9% Scotland 2% Wales 3%
Neighbourhood/locally 21%
A localauthority
13%
Several localauthorities
9%
A region 14%
Severalregions
6%
Internationally12%
Several localities
National
International
Local
age, with 61% of organisations less than 3 years old turning over up to £50,000, and over two-thirds (71%) of those with a turnover of £1 million or more having been in operation for 11 years or more (20% of these longer established organisations).
Figure 5 shows how the median annual turnover/income varies depending on the organisation’s characteristics.
3.4 ARE SOCIAL ENTERPRISES GROWING?Social enterprises are consistently growing. More organisations (52%) report an increase in turnover compared to the previous financial year than was the case in 2017 (47%). This is better again than the 34% of SME employers which reported
1 Small Business Survey 2018 p3
growth in turnover in the previous year1. The proportion reporting a decrease has significantly fallen from 20% in 2017 to 11% in 2019. Around a third reported no change.
3.5 THE REACH OF SOCIAL ENTERPRISESRespondents were asked to indicate the widest geographic area that the organisation operates across. Their responses are summarised in figure 6 above.
The majority of organisations operate within a region (i.e. at a regional, local authority or community level) including one in five operating locally/within their neighbourhood (21%); one in eight within their local authority area (13%); one in ten across several local authority areas (9%);
Capitalism in Crisis?: State of Social Enterprise Survey 2019 19

one in seven across their region (14%); and a small minority operating across several regions but not nationally (6%).
Organisations within Wales (31%) and the South West (30%) are particularly likely to operate locally/within their neighbourhood, while those based in Yorkshire and the Humber (14%) and London (14%) are least likely to do so.
One in three organisations in Northern Ireland (33%) operates nationally (across Northern Ireland); while the comparable figures in the other nations are lower: 22% of organisations in Wales; 19% of organisations in Scotland; and 10% of organisations in England, operate nationally.
Around one in eight organisations operate internationally (outside the UK) (12%), although this rises to a third (32%) in Wales and one in six organisations based in London (17% - the same proportion as in 2017, 2015 and 2013).
3.6 SOCIAL ENTERPRISES ON THE FRONTLINE The survey collected location data for respondents which can be matched against the Index of Multiple Deprivation (IMD) ranking, enabling an understanding of the communities where social enterprises are working.
As set out in Figure 7, social enterprises have their
2 A new option for 2019
greatest concentration in areas of the greatest deprivation. One in five organisations surveyed (22%) are located in areas that fall into the most deprived quintile, and a further quarter (26%) into the second most deprived quintile.
Social enterprises are also showing that operating within a deprived community does not mean forgoing financial sustainability. The average turnover of social enterprises in the most deprived areas is £150,000 compared with £100,000 in the least deprived areas. More social enterprises made a profit or broke even (68%) in the most deprived areas compared to the least deprived areas (64%).
3.7 WHAT SECTORS DO SOCIAL ENTERPRISES OPERATE IN?Social enterprises operate in all sectors of the economy. They are diverse, creative and solve problems in every part of society. They operate in diverse markets at all scales. Education and skills development2 are the most common sectors, accounting for 13% of organisations. The proportion of those citing hospitality has increased (from 7% in 2017 to 10% in 2019), while retail has fallen from 16% to 9% since 2017.
Social enterprises are evenly balanced between traditional public sector markets such as education or health care and private sector markets such as retail and business support.
Quintile 1 - most deprived Quintile 2 Quintile 3 Quintile 4 Quintile 5 - least deprived
201520172019
FIGURE 7: WHERE SOCIAL ENTERPRISES WORK BY LEVEL OF DEPRIVATION
31%28%
26%22% 25%22% 21%
22%
22%
17%16% 15%
11%13% 10%
20 Capitalism in Crisis?: State of Social Enterprise Survey 2019

FIGURE 8: PRINCIPAL TRADING ACTIVITY
Retail 9%
Social care 4%
Environmental - recycling, re-use, awareness etc. 3%
Workspace/ room hire 2%
£Financial support and services 6%
Agriculture/ farming/ gardening 2%
Utilities (energy)
2%
IT - consultancy/ software development 3%
Community services 4%
Hospitality 10% Creative industries – web, design, print 6%
Health care 4%
Transport 1%
Education and skills development 13%
Manufacturing 2%
Childcare 1%
Culture and leisure 4%
Housing 4%
Business support/ consultancy 6%
Employment and careers services 2%
Other 11%
Sample base = 1116
Capitalism in Crisis?: State of Social Enterprise Survey 2019 21
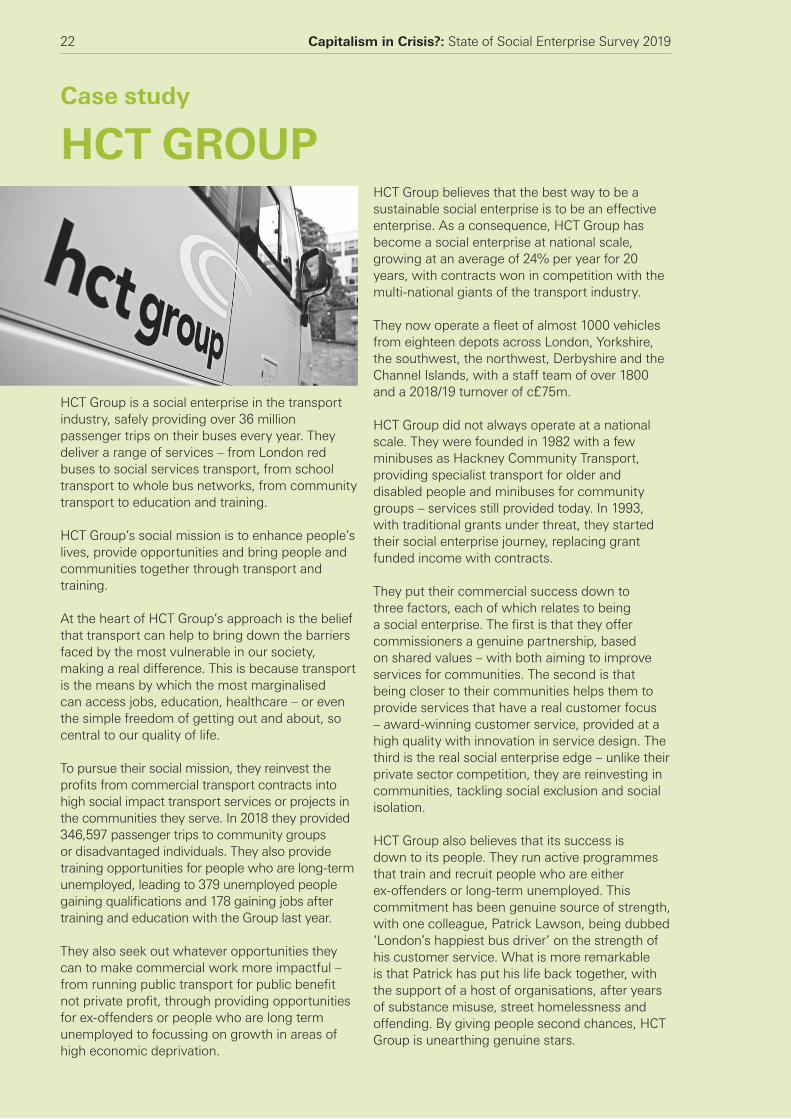
HCT Group is a social enterprise in the transport industry, safely providing over 36 million passenger trips on their buses every year. They deliver a range of services – from London red buses to social services transport, from school transport to whole bus networks, from community transport to education and training.
HCT Group’s social mission is to enhance people’s lives, provide opportunities and bring people and communities together through transport and training.
At the heart of HCT Group’s approach is the belief that transport can help to bring down the barriers faced by the most vulnerable in our society, making a real difference. This is because transport is the means by which the most marginalised can access jobs, education, healthcare – or even the simple freedom of getting out and about, so central to our quality of life.
To pursue their social mission, they reinvest the profits from commercial transport contracts into high social impact transport services or projects in the communities they serve. In 2018 they provided 346,597 passenger trips to community groups or disadvantaged individuals. They also provide training opportunities for people who are long-term unemployed, leading to 379 unemployed people gaining qualifications and 178 gaining jobs after training and education with the Group last year.
They also seek out whatever opportunities they can to make commercial work more impactful – from running public transport for public benefit not private profit, through providing opportunities for ex-offenders or people who are long term unemployed to focussing on growth in areas of high economic deprivation.
HCT Group believes that the best way to be a sustainable social enterprise is to be an effective enterprise. As a consequence, HCT Group has become a social enterprise at national scale, growing at an average of 24% per year for 20 years, with contracts won in competition with the multi-national giants of the transport industry.
They now operate a fleet of almost 1000 vehicles from eighteen depots across London, Yorkshire, the southwest, the northwest, Derbyshire and the Channel Islands, with a staff team of over 1800 and a 2018/19 turnover of c£75m.
HCT Group did not always operate at a national scale. They were founded in 1982 with a few minibuses as Hackney Community Transport, providing specialist transport for older and disabled people and minibuses for community groups – services still provided today. In 1993, with traditional grants under threat, they started their social enterprise journey, replacing grant funded income with contracts.
They put their commercial success down to three factors, each of which relates to being a social enterprise. The first is that they offer commissioners a genuine partnership, based on shared values – with both aiming to improve services for communities. The second is that being closer to their communities helps them to provide services that have a real customer focus – award-winning customer service, provided at a high quality with innovation in service design. The third is the real social enterprise edge – unlike their private sector competition, they are reinvesting in communities, tackling social exclusion and social isolation.
HCT Group also believes that its success is down to its people. They run active programmes that train and recruit people who are either ex-offenders or long-term unemployed. This commitment has been genuine source of strength, with one colleague, Patrick Lawson, being dubbed ‘London’s happiest bus driver’ on the strength of his customer service. What is more remarkable is that Patrick has put his life back together, with the support of a host of organisations, after years of substance misuse, street homelessness and offending. By giving people second chances, HCT Group is unearthing genuine stars.
Case study
HCT GROUP
22 Capitalism in Crisis?: State of Social Enterprise Survey 2019

4.0 MARKETS AND MONEY
KEY FINDINGS
THIS IS BUSINESS: Social enterprises are businesses which earn their income through trading, competing in the marketplace – 77% of social enterprises earn more than 75% of their income from trading, up on our previous survey.
SELLING TO THE PUBLIC: The most common source of income for social enterprises is the general public. 55% of social enterprises report generating income by trading with the public.
DELIVERING PUBLIC SERVICES AT SCALE: Nearly half (47%) of all social enterprises reported trading with the public sector. Two-thirds (66%) of organisations with a turnover between £1-5m trade with the public sector.
COMMISSIONING MATTERS AT ALL LEVELS: For social enterprises earning public sector income, 63% get it from a local authority and others from local clinical commissioning groups (9%) and police and crime commissioners (4%). Over a quarter (27%) win contracts with central government, and 10% are benefiting from European programmes.
MORE INNOVATIVE THAN THE PRIVATE SECTOR: The proportion of social enterprises introducing a new product or service was 56% in 2019, higher again than previous years and far outstripping SMEs, at 36%.
COMMERCIALLY SUCCESSFUL: 48% of social enterprises made a profit in the past year, with 27% breaking even and a lower percentage losing money than in previous research. The longer a social enterprise has been around, the more likely it is to make a profit.
Capitalism in Crisis?: State of Social Enterprise Survey 2019 23

4.1 INTRODUCTIONSocial enterprises are driven by their mission; they exist to pursue an explicit social or environmental goal. But they also have to be financially sustainable. Social enterprises that cannot manage their financial performance cannot deliver their mission effectively.
This section details how social enterprises are performing in the markets in which they operate and looks at key commercial areas: profitability, trading partners, business optimism and strategies for growth.
4.2 PROPORTION FROM TRADE:The survey asked respondents what proportion of their income was earned through trading (rather than grants or donations). The data, set out in Figure 9, shows that 77% of respondents earn between 76% and 100% of their income through trade – slightly higher than last time.
This indicates an increasing trend towards social enterprises earning their income through trade and demonstrates the financial sustainability of the sector.
FIGURE 9: PROPORTION OF INCOME EARNED THROUGH TRADE
4.3 WHO DO SOCIAL ENTERPRISES TRADE WITH? We asked respondents to identify their main source of income for their organisation. As set out in Figures 10 and 11, the survey reveals a wide range of income sources.
Trade with the general public: The most common method of income generation amongst organisations is that of trading with the general public (55%), and this proportion is slightly lower than in previous years (60% in 2017).
Trading with the public sector: The proportion of social enterprises that trade with the public sector has fallen to 47% from 54% in 2017.
Organisations that had traded with the public sector or received grants were asked which part(s) of the government that income came from – respondents could give multiple answers. Nearly two-thirds (63%) reported that it came from a local authority, while a quarter (27%) reported that it came from a central government department. These proportions are both similar to 2017 (63% and 28% respectively). One in ten (10%) reported that it came from a European or other international public sector source, down from 12% last time. Two other local sources were included in the list of options: one in ten respondents (9%) reported that income came from a Clinical Commissioning Group, and one in twenty (4%) stated that income came from a Police and Crime Commissioner, also slightly down from previous research.
Organisations in Scotland were more likely than average to report that their funding came from another source (12%), which would include the Scottish Government. Those in London were less likely than those based elsewhere to report receiving funding from a local authority (51%). Organisations in the North West were less likely
76% to 100%
51% to 75%
26% to 50%
% of respondents 2019
8%
15%
77%
24 Capitalism in Crisis?: State of Social Enterprise Survey 2019

than average to receive funding from a central government department (16%), while those in Yorkshire and the Humber were more likely to receive funding from a local authority (77%).
Larger social enterprises tend to trade with the public sector. 66% of organisations with a turnover between £1-5m trade with the public sector.
Trading with the private sector: The proportion of social enterprises that trade with the private sector has fallen slightly to 47% from 52% in 2017.
Third Sector Organisations: Two-fifths of organisations (40%) generate income through trading with third sector organisations, down from 50% in 2017.
Social Enterprises: Over a third (36%) generate income through trading with other social enterprises, also down from 43% in 2017.
Grants and donations: Just over a quarter (28%) of social enterprises generate income through grants from the public sector down from 37% in 2017); a quarter do so through other grants (compared to 33% in 2017);
Members: A fifth of social enterprises generate income through members (21%, a new option for 2019);
Donations: Just under a fifth (19%) of social enterprises generate income through donations, compared to 27% in 2017;
Trading Internationally: Around one in eight social enterprises generate income through trading internationally, including EU contracts (12%).
Main Source of Income GenerationFor 26% of social enterprises, trading with the public is their main, or only, method of generating income, compared to 28% in 2017 and 30% in both 2015 and 2013.
One in five organisations report that their main or only source of income is generated from trading with the public sector (19% in 2019; 20% in 2017; 27% in 2015; 24% in 2013), indicating a consistent trend away from a reliance on public sector income among social enterprises.
There has been a slight increase in the proportion
0 10 20 30 40 50 60
FIGURE 10: METHODS OF GENERATING INCOME
Sample base =1068
Trading with the general public 55%
Trading with the public sector 47%
Trading with the private sector 47%
Trading with third sector organisations 40%
Trading with other social enterprises 36%
Grants from the government/local authority/public 28%
Other grants 25%
Members 21%
Donations 19%
Trading internationally (including EU contracts) 12%
Capitalism in Crisis?: State of Social Enterprise Survey 2019 25

0
5
10
15
20
25
30
FIGURE 11: MAIN/ONLY METHOD OF GENERATING INCOME
Sample base =1105
26%
19%
16%
9%
8%
6%5%
3%
1% 1%2%
Trading with the general
public
Trading with the public
sector
Trading with the private
sector
Members Trading with third sector
organisations
Grants from the
government/local authority/public sector
Other grants Trading with other social enterprises
Donations Trading internationally (including EU
contracts)]
Other
FIGURE 12: TRADING WITH THE PUBLIC SECTOR BY TURNOVER
0
10
20
30
40
50
60
70
>1m-5m GBP>250k-1m GBP>85k-250k GBP>50k-85k GBP>10k-50K GBP0-10k GBP
26 Capitalism in Crisis?: State of Social Enterprise Survey 2019

of social enterprises reporting their main or only source of income through trading with private sector organisations (16% in 2019; 14% in 2017); while there has been little change in the proportion whose main/only source of income is trading with the third sector since 2015 (8% compared to 7% in both 2017 and 2015).
4.4 ARE SOCIAL ENTERPRISES PROFITABLE?Our survey asked social enterprises whether they had made a profit, had made a loss, or had broken even. The results are presented for the last four surveys in Figure 13:
In 2019, fewer organisations (48%) reported having made a profit in the last financial year than previously. A quarter reported having made a loss (25%) and just over a quarter (27%) reported having broken even. The overall financial position of the sector is slightly better than reported in our previous survey, with 75% of social enterprises having made a profit or breaking even compared with 71% in 2017.
As one might expect, more established organisations are more likely to report a profit. The proportion increases from 32% of
organisations established for up to 3 years, compared to 51% of those established for 4-10 years and 56% of those established for 11 years or longer.
Similarly, larger organisations are significantly more likely than average to report a profit: 79% of organisations with 100 or more employees, compared with 44% of those with 9 employees or fewer.
Reinvesting Profits for GoodAt the heart of the social enterprise business model is the direction of profits to further
FIGURE 13: SOCIAL ENTERPRISE FINANCIAL SUSTAINABILITY
% Social Enterprises
0
10
20
30
40
50
60
2019201720152013
Sample base =1105
55%
18%20% 20%
25%
26%
28% 27%
22%
50%51%
48%
Made a profit Broke even Made a loss
FIGURE 14: SOCIAL ENTERPRISES PROFIT AND LOSSES
Made a profit
Broke even
Made a loss
% of respondents 2019
48%
25%
27%
Capitalism in Crisis?: State of Social Enterprise Survey 2019 27

the social or environmental mission of the organisation – trading for social good. This survey demonstrates again that this is a reality in social enterprise, not just a nice idea.
90% of all the organisations surveyed reported using the majority of their profit to further their social or environmental goals. Almost two-thirds (67%) reinvest all that money back into the business or into achieving their objectives or plan to do so.
4.5 GROWTHAs shown in Section 3, over half of respondents have reported turnover growth over the past 12 months. The survey also explored what steps social enterprises have taken to secure growth, asking what actions they had taken during the past year, and what they have planned for the year ahead. Almost all respondents (95%) had taken specific actions to grow or diversify in the past 12 months, as shown by the results presented in Figure 15.
Social enterprises are most likely to have developed new products and/or services in order to grow or diversify (56%) and nearly two-thirds (62%) plan to innovate and develop new products and services in the next year. This is far higher than traditional SMEs, with only 36% reporting that they planned to develop a new product or service.
Two-fifths reported that they have diversified or expanded into new geographic or customer markets, and nearly half (48%) of all respondents plan to do this in the next 12 months. Slightly fewer (38%) have increased prices while 29% are planning to increase prices in the next 12 months.
Most often, social enterprises are planning to increase the level of marketing/advertising (66%) to grow; followed by developing new products and/or services (62%) and recruiting new staff or increasing the level of training (57%).
0 10 20 30 40 50 60 70 80
Actions taken in last 12 months
Actions planned for next 12 months
Merged with or acquiredanother organisation
None of these
Replicated or franchised
Won business as apart of a consortium
Sought investment to increase the rate
of growth of your business
Invested in new capital assets
Increased prices
Diversified or expanded into new geographic or
different customer markets
Developed a new process
Increased the level of marketing/advertising
Invested in new equipment/IT/computer software
Reduced costs/increased efficiency
Recruited to new staff posts orincreased the level of training
Developed newproducts and/or services
FIGURE 15: SOCIAL ENTERPRISES PATHWAYS TO GROWTH
62%56%
57%54%
49%54%
40%54%
66%50%
37%40%
40%
38%
30%
28%
29%
38%
29%
18%12%
14%6%
5%5%
7%3%
48%
% Social Enterprises
28 Capitalism in Crisis?: State of Social Enterprise Survey 2019

Social enterprises in London are particularly likely to plan to diversify or expand into new geographic or different customer markets (60%) or win business as part of a consortium (29%). Those in the North West are also more likely than others to plan to diversify or expand into new geographic or different customer markets (61%) or replicate or franchise (23%), while those in the South East are more likely to plan to invest in new equipment, IT and/or computer software (51%).
Younger organisations, established in the last 3 years, are more likely than average to be planning a range of activities to grow and diversify, while those established for more than 10 years are significantly less likely to.
Innovating in products and services: The Government’s Small Business Survey uses the percentage of organisations introducing either new or improved products and services over the past 12 months as their principal indicator of innovation. As with each survey in this series, social enterprises continue to out-innovate SMEs by a significant margin. The proportion of social enterprises introducing a new product or service was 56% in 2019 – an increase on previous years (50% in 2017) and far outstripping SMEs, at just 36% in 2018.1
Marketing Social Enterprise: In 2019, 72% of organisations report that they use their status as a social enterprise in marketing their goods and services to at least some extent. Organisations established in the last three years are most likely to use their social enterprise status in marketing (79% use it to some or a great extent), compared with longer established organisations (63% of those established for more than 10 years).
4.6 BUSINESS OPTIMISMBusiness optimism is an important barometer of the health of any sector. We asked whether social enterprises believed that their turnover would increase, decrease or stay the same over the next 12 months.
1 Small Business Survey 2018 p452 Small Business Survey 2018 p4
Two-thirds of organisations providing a response (67%) expect that their turnover will increase over the next 12 months, which is a slightly higher proportion than in 2017, while just 7% expect their turnover to decrease. Social enterprises are more confident about their future than SMEs. In 2018, just 39% of SMEs expected turnover to increase in the following 12 months, and 10% expected it to be lower.2
Organisations in the North East (15%) and North West (12%) are more likely than average to anticipate a decrease in income.
Social enterprises in the most deprived areas were more likely to say that they expected to increase their turnover (70%) compared to those in the least deprived areas (66%).
As in 2017, younger organisations are more likely than average to expect an increase in turnover in the next 12 months (82% of those aged up to 3 years).
Capitalism in Crisis?: State of Social Enterprise Survey 2019 29

PUBLIC SECTOR PARTNERSHIPS – Over one in four social enterprises in the North East increased their paid work with the public sector
GIVING VOICE TO WORKERS – 47% of social enterprises in Yorkshire & Humber have workers on the board
GENDER PARITY – 53% of social enterprises in the East Midlands are run by women
ETHICAL CONSUMERISM – 30% of social enterprises in the East of England trade with the public as their main source of income
GLOBAL BRITAIN – 28% of London-based social enterprises are exporting overseas, double the rate of UK SMEs
LOCAL JOBS FOR LOCAL PEOPLE – the average social enterprise in the South East employs over 92% of its staff locally
PEOPLE AND PLANET – Over 80% of social enterprises in the South West believe that the environmental impact is of equal concern or more important than cost when buying products
WELSH DRAGON RISES – The turnover of social enterprise in Wales has grown by 36%
BUSINESS SENSE – 74% of social enterprises in the West Midlands make a profit or broke even
INVESTORS IN PEOPLE – 63% of social enterprises in the North West either took on new staff or trained existing staff to expand their business, the highest in the country
FIGURE 16:
RURAL POWERHOUSE - 33% of social enterprises operate in rural areas. Rural communities in Scotland have seen the fastest growth in social enterprises with a 22% growth over four years.
30 Capitalism in Crisis?: State of Social Enterprise Survey 2019

Being a social enterprise is embedded into Cafédirect’s DNA. They are an award-winning social enterprise which champions the work and passion of smallholder coffee growers, delivering great tasting hot drinks to improve livelihoods, whilst pioneering new and better ways of doing business. Its products are sold via wholesalers, retailers and to an export market. They also run a subscription service [handpicked.co.uk] which delivers batch-roasted coffee directly to customers. It has 26 full-time employees based across two locations, in their London office in Hoxton and at their roastery in London Fields.
Cafédirect work directly with coffee, tea and cocoa growers in 29 co-operatives in 13 countries, purchasing 100% Fairtrade goods, ensuring growers are paid a minimum price plus an additional Fairtrade premium. Above and beyond this Cafédirect also invests up to 50% of its profits into a farmer-run charity, Producers Direct, which works alongside growers to support them to improve their businesses through access to agricultural training workshops; microloans; marketing support and data management. Since 2004, £18 million has been invested directly back to grower communities. The majority of co-operatives they buy from also hold shares in Cafédirect and two of their eight board members are growers. No other coffee business operates like this.
Cafédirect is a social enterprise operating in the highly competitive fast-moving consumer goods sector and is holding its own against the non-social enterprise competition. They are the fourth largest roast and ground coffee (excluding pods) company in the UK with an annual turnover of £13.1m in 2018. They have achieved strong growth in the grocery retail sector growing 18% in the last 12 months. Cafédirect supplies major UK retailers including Waitrose, Tesco, The Co-operative and Sainsburys, as well as exporting their branded products (Cafédirect and The London Tea Company) to over twenty countries mainly in Europe and Asia. Its Machu Picchu Organic coffee is the best-selling organic coffee in the roast and ground market.
One of the founding principles of Cafédirect is the long term, direct relationships they have with the co-operatives they work with. The business was
founded in 1991, following a crash in the price of coffee which was devastating for coffee farmers. Three co-operatives (from Peru, Costa Rica and Mexico) each sent a container of coffee to Oxfam in the UK without taking any payment at that point. The coffee was roasted, packed and sold and then the money returned to the co-operatives – this is how Cafédirect was born. Four founding charities were key partners in setting Cafédirect up as a social enterprise: Oxfam, Twin, Equal Exchange and Traidcraft.
This type of direct relationship was pioneering in 1991. Traditionally coffee was bought from co-operatives and estates by coffee importers and sold onto coffee companies. By cutting out the importers Cafédirect was able to offer the co-operatives direct access to Western markets and in return could pay a fairer price for coffee. Having pioneered this business model, it is now becoming increasingly common for coffee companies to have this type of direct relationship with co-operatives.
Cafédirect also takes steps to minimise its environmental impact. They support Organic September, a month long campaign raising awareness of organic products, and are increasing their organic purchasing (currently at 39%). They also run engaging consumer campaigns on social media which support positive environmental messages, such as using reusable cups as well as supporting local initiatives run by the Do Nation, where the Cafédirect team made individual pledges over a habit-forming two month period to reduce their carbon emissions such as pledging to eat less meat. Cafédirect have also formed innovative corporate partnerships, such as with Hario, where the V60 method of brewing coffee uses the right amount of water and therefore encourages thoughtful consumption.
Cafédirect will continue to go above and beyond to support smallholders’ livelihoods, whilst producing quality drinks for everyone to enjoy.
Case study
CAFÉDIRECT
Capitalism in Crisis?: State of Social Enterprise Survey 2019 31

5.0 PEOPLE AND PURPOSE
KEY FINDINGS
FEMALE ENTREPRENEURSHIP: Consistent with previous surveys, 40% of social enterprises are led by women, higher than SMEs more widely. Two in five (42%) have a majority female workforce; for 13%, women are the entire workforce.
DIVERSE LEADERSHIP: The leadership teams of social enterprise reflect the communities where we live and work: 13% of social enterprises are BAME led and 35% have BAME directors.
INCLUSIVE LEADERSHIP: 37% of social enterprises have a director with a disability
LOCAL IMPACT: Social enterprises remain very likely to recruit locally. 85% recruit over half their staff locally and around two-thirds (68%) report that they draw their entire workforce from the local area. 58% involve their wider community in their decision-making. All these patterns are up on previous research.
CREATING OPPORTUNITIES IN TOUGH TIMES: 73% of respondents reported that their organisation works with individuals facing disadvantage, also up on previous years, while 42% reported that their organisation seeks to employ them.
A FAIR PAYING FIELD: Three-quarters (76%) of respondents said that they were a Living Wage employer. The average salary of a social enterprise Chief Executive is £43,362.
TRADING FOR THE PLANET: 65% of social enterprises expect the focus on sustainable and environmentally friendly processes within their organisation to increase in the next two to three years. This is significantly higher than SMEs more widely (49%). Only a fifth (22%) of social enterprises consider cost to be more important than environmental impact when it comes to procuring products, compared to 76% of SMEs.
32 Capitalism in Crisis?: State of Social Enterprise Survey 2019

5.1 INTRODUCTION
1 BAME: Black and Minority Ethnic2 Leaders are defined as the owner, chief executive, managing director or equivalent3 Small Business Survey 2018 p524 https://www.equalitytrust.org.uk/news/fat-cat-friday-2019-only-six-ftse-ceos-are-women-and-they-earn-54-salaries-male-
counterparts
This section looks inside social enterprises, at the people who run them, who and how they employ, and at the difference they are trying to make.
5.2 LEADERSHIP: TEAMS AND INDIVIDUAL LEADERSSocial enterprises were asked how many directors, or people on the leadership team they had and the composition of the leadership team in terms of sex, age and ethnicity.
The average size of a social enterprise leadership team is six, the same as in 2017 and 2015. There has been a small rise in leadership teams of one or two (from 21% in 2017 to 24% in 2019).
In terms of the make-up of the leadership team 86% include women and 35% of organisations report having at least one member of the leadership team from a BAME1 background. There is considerable variation by geography in this respect as might be expected, with 68% of organisations in London having at least one member of the leadership team from a BAME background, compared with 22% of organisations
across the rest of the South of England and 20% of organisations in Scotland, Northern Ireland and Wales. This tends to reflect BAME population distribution more widely.
More than a third of organisations that provided a response (37%) reported having directors with a disability.
In terms of age, fewer than one in ten organisations that provided this information reported directors aged 16 to 24 (7%). Three-fifths (61%) reported directors aged 25 to 44, while four in five (78%) had directors aged 45 to 64, and a third (32%) had directors aged 65 or over.
In terms of the leaders2 themselves, two in five (40%) of the organisations surveyed have leaders who are women. This remains significantly ahead of both mainstream SMEs (17%)3 and big business (6% of FTSE 1004). The proportion of female
0 10 20 30 40 50 60 70 80
65 and older
45-64
25-44
16-24
FIGURE 17: AGE BREAKDOWN OF THE LEADERSHIP TEAM
7%
61%
78%
32%
Sample base = 1105
Capitalism in Crisis?: State of Social Enterprise Survey 2019 33

FTSE 100 SMEsSocial enterprises
CharitiesSMEsSocial enterprises
FIGURE 18: FEMALE LEADERSHIP COMPARED WITH SMES AND THE FTSE 100
FIGURE 19: BAME LEADERSHIP COMPARED WITH SMES AND CHARITIES
13% 6%
17%
5%
40% 6%
34 Capitalism in Crisis?: State of Social Enterprise Survey 2019

0 5 10 15 20 25
Other
Providing affordable housing
Supporting women and girls/gender equality
Supporting vulnerable children and young people
Addressing financial exclusion
Promoting education and literacy
Supporting other social enterprises or third sector organisations
Improving mental health and wellbeing
Creating employment opportunities
Protecting the environment
Improving physical health and wellbeing
Addressing social exclusion
Supporting vulnerable people
Improving a particular community
FIGURE 20: MAIN SOCIAL AND/OR ENVIRONMENTAL OBJECTIVES
19%
23%
18%
17%
17%
15%
15%
13%
11%
11%
10%
10%
3%
3%
% Social Enterprises
leaders is significantly higher among organisations in operation for up to 3 years (46% compared with 34% of those in operation for 11 years or more).
The proportion of social enterprises led by a member of a Black and Minority Ethnic community (BAME) is 13%. This level is broadly in line with the UK population as a whole and compares favourably to both SMEs (5%)5 and charities (6%)6. Encouragingly, the figure is higher still for start-up social enterprises (up to 3 years of age) at 18%. In London, the figure is 29%, with over a quarter of social enterprises in the capital led by someone from a BAME background.
Just 1% of leaders are aged below 24, over a quarter (27%) are aged 25 to 44, half (50%) are aged 45 to 64 and around one in eight (13%) are aged 65 or above. Social enterprises operating for up to 3 years are significantly more likely to have a
5 Small Business Survey 2018 p536 ACEVO Pay and Equalities Survey, 2019
leader aged 25-44.
5.4 SOCIAL AND ENVIRONMENTAL OBJECTIVES Social enterprises are businesses that trade in order to achieve social and environmental objectives. The main social and environmental objectives of our respondents are summarised in the figure below.
Although we often talk about social enterprises following their “mission” – this does not mean that social enterprises only focus on one particular set of outcomes or group in society. Many social enterprises combine a variety of social and environmental objectives to benefit people and planet. As a consequence, we allow social enterprises to submit multiple responses to reflect how many of them seek to achieve multiple outcomes. The top two are the same as in
Capitalism in Crisis?: State of Social Enterprise Survey 2019 35

previous years - improving a particular community (23%) and supporting vulnerable people (19%).
5.5 SOCIAL ENTERPRISES ENGAGING THEIR COMMUNITIES Two-thirds of social enterprises report that their beneficiaries are actively involved in decision-making, slightly down year on year (74% in 2013; 73% in 2015; 71% in 2017 and 67% in 2019). While around three-fifths (58%) report that their community is actively involved in decision-making, a slight increase compared with 2017 at 54%.
Almost half (46%) of social enterprises have representatives of the local community (other than employees) sitting on the Board, with a third (35%) having employees on the Board, and a quarter (25%) reporting that service users sit on the Board. One in six (16%) reported that their organisation does not have a Board.
A significantly higher than average proportion of organisations based in the most deprived
(IMD) areas reported representatives of the local community on their Board (52%). The proportion is also significantly higher than average among charities (66%) and community businesses (57%).
5.6 TRADING FOR THE PLANETAlthough some social enterprises may just have a legally binding social mission, we find when engaging with our members that the vast majority of social enterprises are concerned about their environmental impact as well. This is why social enterprises talk about the “triple bottom line” – financial, social and environmental.
Respondents were asked questions designed to gauge the importance their organisation attaches to environmental considerations when making business decisions, and to determine the extent to which these are prioritised and encouraged. Nearly nine out of ten respondents (88%) report that their organisation actively aims to minimise its environmental impact, up slightly from 85% in 2017.
FIGURE 21: SOCIAL ENTERPRISES IN THEIR COMMUNITIES
0
20
40
60
80
100
A large extent
Some extent
Not very much
Not at all
Don't know/NA
My organisation actively aims
to minimise its environmental
impact
My organisation invests well in staff training
and development
My community is actively involved in
decision-making
My beneficiaries are actively involved in
decision-making
My staff are actively involved
in decision-making
61%
25%
7%
3%4%
30%
37%
7%
13%
12%
23%
35%
6%
22%
14%
34%
40%
7%
7%
12%
53%
35%
3%2%
7%
36 Capitalism in Crisis?: State of Social Enterprise Survey 2019

0 10 20 30 40 50 60
None of the above
Other
Open to all
Women (inc single mothers)
Veterans/ex-military
Refugees and asylum seekers
Alcohol or drug addiction/dependency
Young parents
Young people leaving care
Ex-offenders/coming out of offending
Young people in general
Homeless/coming out of homelessness
Older people losingindependence
Long-term unemployed
People with mentalillness or a mental
health problem
Individuals with aphysical disability
Individuals with alearning disability
Seek to employ
Work with
FIGURE 22: ORGANISATIONS WORKING WITH OR SEEKING TO EMPLOY INDIVIDUALS FROM SPECIFIC GROUPS
% Social Enterprises
Capitalism in Crisis?: State of Social Enterprise Survey 2019 37

Encouraging employees to be environmentally responsible: Over four-fifths of respondents (82%) reported that their organisation actively encourages its employees to be more environmentally responsible.
The future: Two-thirds of respondents expect the focus on sustainable and environmentally friendly processes within their organisation to increase in the next two to three years (65%). This is higher than SMEs, where only 49%7 think the importance of sustainable and environmentally- friendly processes will increase in their business over the next year.
Respondents at social enterprises that have been established in the last three years are significantly more likely than those in more established businesses to believe this focus on environmental concerns will increase (72% compared with 61%).
Procurement: When asked whether cost or environmental considerations are more important in procurement decisions, almost two-thirds of respondents (63%) stated that their organisation considers both to be of equal importance with 12% considering that environmental considerations to be foremost. 76% of SME owners8 consider cost to be more important than the environmental impact when it comes to procuring products, compared to just a fifth (22%) of social enterprises.
Young organisations established in the last three years are more likely than average to prioritise environmental considerations (16%) and less likely to prioritise cost (15%).
A quarter of those with male leaders or directors (25%) state that cost is the greater concern, with less than a tenth (9%) prioritising environmental considerations. This compares with a more responsible 20% and 15% respectively at social enterprises with female leaders or directors.
7 Collaborate UK 20188 https://www.closeassetfinance.co.uk/industry-insights/business-owners-prioritise-cost-goods-over-their-environmental-
impact
5.7 SOCIAL ENTERPRISES AS EMPLOYERS
Working to Help OthersRespondents were asked whether they worked with and/or sought to employ individuals facing particular issues. 73% of respondents reported that their organisation works with disadvantaged people, while 42% reported that their organisation seeks to employ them.
Social enterprises were most likely to work with people with a physical disability (20% of organisations worked with them, and 10% sought to employ them); a learning disability (20% worked with, 10% sought to employ); and/or a mental illness or a mental health problem (19% worked with, 8% sought to employ). Individuals who were long-term unemployed were also a group relatively frequently supported (16% worked with, 10% sought to employ). These four groups were also the most commonly cited in 2017.
There was some geographical variation. Social enterprises in Yorkshire and the Humber were more likely than average to work with people with a mental illness or mental health problem (32%) while social enterprises in the East of England were more likely than average to work with individuals with a learning disability (28%). Businesses in the South West were more likely than average to work with individuals with a physical disability (28%), and older people losing independence (17%).
Social enterprises in the most deprived areas are more likely than average to work with ex-offenders or those coming out of offending (11%), refugees and asylum seekers (10%), and those with alcohol or drug addiction/dependency (9%). These businesses were more likely than average to seek to employ the long-term unemployed (15%) and refugees/asylum seekers (5%).
38 Capitalism in Crisis?: State of Social Enterprise Survey 2019

Local Focus: Social enterprises continue to recruit locally. 85% recruit over half their staff locally and around two-thirds (68%) report that they draw their entire workforce from the local area.
Fair Pay: Three-quarters (76%) of respondents said that they were a Living Wage employer, in line with the Living Wage Foundation standards. This is a similar proportion to 2017 (78%).
The survey also asked about remuneration of the Chief Executive or highest paid person, revealing that the average (mean) rate of pay of a social enterprise CEO is £43,362. The ratio between the average of highest paid to lowest paid in our survey is just 2.7:19 This is somewhat indicative of the larger proportion of smaller social enterprises; the average rate of CEO pay in enterprises with between 26 and 100 employees is £89,636, and for those with over 100 employees it is £134,610. Chief executive pay continues to be in direct proportion with size. Even for this latter group,
9 Ratio calculated assuming that the lowest paid is a full-time employee working a 37.5-hour week receiving the national minimum wage of £8.21 p/h.
10 https://www.cipd.co.uk/about/media/press/150818-ftse-ceo-pay
the pay ratio would be 8.4:1, far below the likes of FTSE 100 chief executives (145:1).10
There continues to be some evidence of a gender pay gap, with the average (mean) salary for women CEOs being £41,053 and for male CEOs being £43,512.
The social enterprise sector is also more geographically diverse compared to traditional businesses. CEOs in the North West earn more on average (£61,055) than their counterparts in London (£44,893). Social enterprise CEOs in the North East earn the lowest on average - £25,600.
Empowering staff The majority of social enterprises (86%) report that, to at least some extent, their staff are actively involved in decision-making.
When asked about the ways in which employees are engaged in organisational decisions, respondents are most likely to report that their
0 10 20 30 40 50 60 70 80
None of these
Other
Use of staff council/representative employee groups
Staff have voting rights on certain matters under the organisation's
articles of association
Staff engagement forums
Staff feedback is presented through emails, survey and so on
Staff can submit or present items for board meetings
Open door policies between employees and leaders
FIGURE 23: STAFF ENGAGEMENT POLICIES
Sample base: 1068
Capitalism in Crisis?: State of Social Enterprise Survey 2019 39

organisation has ‘open door’ policies between employees and leaders (77%). The next most frequently mentioned mechanism for staff engagement is that staff are able to submit or present items for board meetings (63%).
A third of organisations (35%) use staff engagement forums, while just over a quarter of respondents (28%) report that their organisation gives staff voting rights on certain matters under the organisation’s articles of association. A fifth (21%) use staff council/representative employee groups.
‘Open door’ policies between employees and leaders are most common within organisations based in the North West (88%), the East of England (86%), and within organisations established for more than 10 years (84%).
Half the respondents (50%) reported that staff feedback is sought through emails, surveys and so on, and this figure is significantly higher than average among those based in the North of England11 (58%), and those which are CLGs (58%).
Understandably, larger organisations with more staff and more capacity for formal organisation tend to report higher levels of worker representation and more democratic forms of governance. With the exception of staff voting rights, organisations with 10 or more employees are significantly more likely than those with fewer employees to have any of these policies in place. All organisations with 100 or more employees have at least one of the policies, which is most likely to be staff engagement forums (97%), staff feedback through emails, surveys and so on (91%) and ‘open door’ policies between employees and leaders (91%). Additionally, these large organisations are significantly more likely than average to use staff council/representative employee groups (60%).
Staff TrainingThree-quarters of social enterprises reported that their organisation invests well in staff training
11 North East, North West and Yorkshire and the Humber12 Employer Skills Survey 2017 p1113 Employer Skills Survey p127
and development. Around two-thirds (64%) of organisations have arranged or funded some formal or informal training or development for employees over the past 12 months, with a third (35%) stating that this is not the case. This is in line with the Employer Skills Survey results.12
The key factor in the propensity to train staff is organisational size with the proportion increasing from 57% of organisations with 0-9 employees to 79% of those with 10 to 25 employees. 92% of those with 26 to 99 employees trained staff rising to 97% of those with 100 or more employees
Organisations that have been in operation for 6 to 10 years (74%), are significantly more likely to have provided training to their staff.
Flexibility for staff Seven in ten social enterprises offer flexitime (70%), making it by far the most commonly offered flexible working arrangement. This is almost double the rate of UK employers in general – only 36% of employers offer flexible benefits.13 The propensity to offer flexitime increases with organisational size to 89% of organisations with 26 to 99 employees and 94% of those with 100 or more employees. This compares with just 65% of those with fewer than 10 employees.
Just over a quarter of social enterprises (28%) offer term-time working, increasing to 51% of organisations with 100 or more employees.
A similar proportion (27%) offer an annualised hours job contract, while slightly fewer (25%) offer a job-sharing arrangement, increasing to 71% within organisations with 100 or more employees.
A fifth (20%) offer a four-and-a-half-day week, and this proportion is significantly higher in organisations with more than 25 employees (36%) and in London (26%).
Around one in seven (13%) offer on-call working, increasing to 40% of organisations with 100 or more employees. This proportion is significantly
40 Capitalism in Crisis?: State of Social Enterprise Survey 2019

higher than average in the East of England (20%) and London (17%), and significantly lower in the North West (6%) and the West Midlands (3%).
Workforce Our survey asked social enterprises how many staff they employed, with the number of all staff, both full and part time, shown in Figure 25.
We also asked what proportion of the workforce was made up of women. For 13%, this is their entire workforce, and for 42% it is over half of their workforce.
14 Small Business Survey 2018 p1
In addition to asking about current levels, organisations over a year-old were also asked how many people they employed 12 months ago. 31% have increased the size of their workforce from 12 months ago, while 12% have reduced the size of their workforce. This is a noticeable shift from 2017 when only 12% had increased their workforce and 30% had reduced it. This is positive news for the social enterprise sector, showing confidence and growth. This compares favourably with SME employers in the same period: 22% had increased their workforce and 13% had reduced its size.14
FIGURE 24: FLEXIBLE WORKING ARRANGEMENTS
0
10
20
30
40
50
60
70
80
None of these
OtherA nine day fortnight
On callworking
Zero hours contracts
A four and a half day week
Job-sharingAn annualisedhours contract
Term-time working
Flexitime
Sample base: 1068
70%
28%27%
25%
20% 17%
13%
8%
2%
19%
Capitalism in Crisis?: State of Social Enterprise Survey 2019 41

Creating more employment opportunities There is considerable optimism for the future with half of respondents (49%) expecting the number of people they employ to increase in the next 12 months. Just 4% expect their organisation to employ fewer people in 12 months than it does currently. This is considerably more positive and ambitious than SMEs where 25% expected to employ more people in a year’s time and 9% expected to employ fewer people.15
15 Small Business Survey 2018 p2
0 10 20 30 40 50 60
2015
2017
2019
Large (250+)
Medium (50–249)
Small (10–49)
Micro (1–9)
Zero
FIGURE 25: NUMBER OF EMPLOYEES IN SOCIAL ENTERPRISES
% Social Enterprises
15%
53%
23%
3%
6%
10%
56%
23%
3%
8%
17%
57%
20%
1%
5%
42 Capitalism in Crisis?: State of Social Enterprise Survey 2019

Ebico is the UK’s first not-for-profit energy provider established over 20 years ago in Oxfordshire with a sole mission to tackle fuel poverty in Britain. Although an underreported and complex issue, there are over 3.4 million people living in fuel poverty in the UK today.
Back in 1998, the founders of the company felt that the fuel poor were being ignored and that the then recently privatised energy market was doing very little to help them. In fact, the energy suppliers were structuring their energy plans in such a way that vulnerable and low-income households were more likely to be pushed into fuel poverty.
Ebico’s founders thought that this was profoundly unfair and decided that, rather than just lobbying the government to do more to tackle fuel poverty, they would set up an energy company with a mission to address the issue head-on – which is how Ebico was born.
Over the years, Ebico’s products have changed with new ones launched and old ones replaced, but Ebico has always looked to innovate in the household energy market. Today, Ebico offers competitively priced green energy to British households. All electricity supplied is certified as being sourced from existing UK-based wind and solar generators, and Ebico’s supply partner is continuously on the look-out for opportunities to support new green generation schemes in the UK. Ebico is a national brand and can supply almost any home in Britain.
Ebico is a not-for-profit social enterprise and, through its charitable arm, the Ebico Trust, it uses its profits to fund fuel poverty-fighting projects up and down the country. The Trust approves grants of up to £60K which support organisations dedicated to combat fuel poverty. This can range from supporting charities which run educational events and offer support to improve energy efficiency, to programmes working with unpaid carers to support them on issues such as fuel debt and energy advice.
Since 2009, when the Ebico Trust1 was first established, Ebico has donated over £1.4 million to The Trust which has helped to fund and support
1 You can find out more about the Ebico Trust on ebico.org.uk/trust.
50 fuel poverty fighting projects up and down the country.
Ebico provides energy to over 60,000 British households. While it does not hold a gas and electricity supply licence, it partners with a licensed supply partner, Robin Hood Energy, which provides both the energy and the account management services on Ebico’s behalf.
Operating in the energy market is very challenging due to high levels of both competition and regulation. There are over 50 energy providers in the market, each one fighting for their market share. The need to grow quickly to a size where start-up loans can begin to be repaid means many smaller entrants resort to offering cheap, but loss-making, deals to attract customers. Wholesale electricity and gas prices are often very volatile and require careful risk management. Yet, to save money, these companies skimp on this essential risk management. It is because of this that the UK market has seen a significant number of small suppliers fail in the past two years.
By providing sustainable pricing to customers and carefully managing risk, Ebico has thrived in the competitive market for over 20 years – and with many more years to come.
Case study
EBICO
Capitalism in Crisis?: State of Social Enterprise Survey 2019 43

SOCIAL ENTERPRISE IN SCOTLAND
The Social Enterprise in Scotland: Census 2019 was published in September 2019. The Census is a project led by Community Enterprise in Scotland (CEIS), researched and produced by Social Value Lab and supported by the Scottish Government.
Overall the report identifies 6,025 social enterprises currently operating in Scotland, with a total annual income of £4.4 billion, employing 88,318 people.
Scotland is ahead of the rest of the UK when it comes to female leadership with 65% of social enterprises being led by women, compared with 40% in the UK as a whole.
Most Scottish social enterprises can now be considered mature in trading terms with 62% earning more than half their income through trade.
There is much similar to the broader UK picture – social enterprises are paying fairly with 75% paying at least the minimum wage, they are creating opportunities for people furthest in the labour market and are driving growth at a local level.
The main headlines from the report are grouped below, consistent with the structure of this report to aid comparison
SCALE AND SCOPE• 15% of Scottish social enterprises are under 5
years old (17% in 2017)
• 33% of social enterprises operate in rural areas. Rural communities in Scotland have seen the fastest growth in social enterprises with a 22% growth over four years.
• 17% are located in Scotland’s 20% most deprived areas
• 55% have a turnover below £100,000, with 8% having a turnover of over £1m
• 57% operate in a single neighbourhood or in one local authority area; 3% across the UK; 7% internationally
MONEY AND MARKETS• 79% sell to the general public and 53% earn
income from the public sector. 65% of those that do trade with the public sector turnover over £500K.
• 62% of social enterprises earn over half of their income from trading (a rise of 11% over 4 years). 17% earn between a quarter and a half of their income from trading.
• 42% believed that their turnover will increase in the next 12 months, down on 53% in 2017. 31% expected they would increase their workforce.
• 57% made a profit in the last financial year, 42% a loss
PEOPLE AND PURPOSE• 65% are led by women
• The overall average pay ratio between the highest and lowest paid is 2.5:1. This has been consistent across the last three censuses
• 79% employ more than half their workforce locally. 55% employ someone with a disability or long-term condition and 69% employ previously unemployed people.
• Primary sectors of operation include community centres, arts and the creative industries, health and social care, and childcare.
BARRIERS AND ENABLERS • The most widely declared barriers relates to
insecure or declining grant funding. With 50% seeing this as a key obstacle. 47% also cited increasing costs as a major barrier.
• 72% applied for a grant in the last 12 months, 10% a loan and 4% an overdraft.
Full report available at: www.socialenterprisecensus.org.uk
44 Capitalism in Crisis?: State of Social Enterprise Survey 2019

Mapping the Social Business Sector in Wales was published in June 2019 by Social Business Wales. Social Business Wales is funded by the European Regional Development Fund and Welsh Government and delivered by the Wales Co-operative Centre. The research was undertaken by Wavehill Ltd.
The report showed that the number of social enterprises in Wales is 2,022 (a 19% increase from 2017). There are an estimated 55,000 people employed in the sector, representing 36% more than the 40,800 identified in 2017. The total value of the sector is £3.18 billion, a 34% increase on estimations in 2017.
The report showed a sector going from strength to strength and making an increasingly significant annual contribution to the Welsh economy. It identified a maturing and healthy sector with a positive outlook for future growth. It also, however, identified some challenges, notably the threats posed by Brexit, an ageing leadership profile and a continued squeeze on resources.
Main headlines from the research are grouped below, consistent with the structure of this report to aid comparison:
SCALE AND SCOPE • There is an increasing maturity within
the sector with 28% of social businesses established for more than 20 years
• Geographic data reveals a concentration of social businesses in the most deprived areas. For example, whilst throughout the whole of Wales social businesses account for 2% of the business stock, in Merthyr Tydfil the sector accounts for 5.2% of all businesses
• 52% have a turnover below £100,000; 70% have a turnover under £250,000
• 59% operate across just one local authority area; 15% serve all of Wales
MONEY AND MARKETS • 63% earn income from trading with the general
public
• 67% earn more than half of their income from trading; for 56% it is over three-quarters
• 72% expect their turnover to increase in the next 2-3 years; on average, 44% expect to employ more people over the next 12 months
• 73% have attracted new customers and clients; 28% have attracted investment;
PEOPLE AND PURPOSE • 92% of social enterprises include at least one
woman in their leadership teams, while 27% of social enterprise leaders are over 65
• 17% of new staff were unemployed immediately before taking up the post
• The most common social objective by far is to ‘improve a particular community’ (an aim for 57%); The most commonly identified sectors include arts / entertainment / recreation, health and care, education and Community Centre / Social Space / Youth Club services. Taken together, these four sectors account for 65% of all businesses
BARRIERS AND ENABLERS• 47% say access to finance is the main barrier
(up from 33% in 2016), followed by time pressures, economic climate, cash flow and lack of marketing skills;
• 60% applied for finance in the last year; 92% applied for a grant, with 0% seeking a loan
Full report available at: https://wales.coop/ helping-social-businesses-grow/research/
SOCIAL ENTERPRISE IN WALES
Capitalism in Crisis?: State of Social Enterprise Survey 2019 45
6.0 BARRIERS AND ENABLERS
KEY FINDINGS
OPERATIONAL FOCUS: Operational challenges include the most commonly cited challenges (55%) by social enterprises, these including recruiting staff; finding available premises and time pressures.
FINANCIAL TIMES: Access to appropriate finance remains the biggest barrier for both start-ups and established social enterprises. 38% sought finance in the previous 12 months, still significantly more than their mainstream SME equivalents (12%).
DEMAND FOR SMALLER DEALS: Over half of social enterprises are seeking finance under £50,000. The median amount of finance sought by social enterprises was £50,000 and the median amount raised was £40,000.
FINANCE AVAILABLE: Over half (51%) of social enterprises feel that the amount of external finance available to their organisation is sufficient.
46 Capitalism in Crisis?: State of Social Enterprise Survey 2019

6.1 INTRODUCTION
1 Small Business Survey 2018 p25
This section explores the barriers and enablers for social enterprises in the UK: what factors help and hinder them in achieving their social and commercial objectives. It looks specifically at barriers to sustainability, business capability, and access to finance.
6.2 BARRIERS Our survey asked all respondents to list their main three barriers to sustainability and growth.
Access to finance is still the principal, most significant barrier to sustainability and growth cited by respondents, for the fifth survey in a row. If we combine the barriers of obtaining grant funding and obtaining debt or equity finance, it is at 43%, similar to 2017. A much smaller proportion (17%) of SMEs1 state that finance is an obstacle to their business success.
Recruiting staff was reported to be a barrier by 14% of respondents, the same percentage as 2017. Although this is the same as the previous survey, relatively compared to other challenges, the recruiting issue has become more important over the past two years rising from 6th most commonly cited challenge, to 4th.
The challenges of recruiting staff are reported across the whole country. However, social enterprises in the East Midlands (18%) and South West (18%) were most likely to cite recruitment as an issue. Social enterprises in the North East were least likely. Unsurprisingly, those social enterprises
in the most deprived communities were more likely to encounter challenges with recruiting staff (18%) compared with the least deprived (15%). Larger organisations also found recruiting staff more of a challenge than smaller organisations, with 46% of social enterprises with more than 100 staff citing this challenge as a barrier to growth.
Cash flow is the third most commonly reported barrier (15%) having been the second most frequently mentioned in 2017 (23%) indicating that cash flow may be improving for social enterprises. Likewise, the percentage of those stating time pressures has improved - only 8% feel that time pressures are a barrier to sustainability as opposed to 16% in 2017. Also positively, a lack of demand and the economic climate was only reported as a barrier by 10% of respondents. This was reported by 17% of respondents in 2017 indicating a more buoyant market for social enterprises, especially encouraging given wider economic uncertainty.
6.3 FINANCE AND SOCIAL ENTERPRISE As access to finance is such a significant barrier for many social enterprises, this survey again looked at this issue in depth: how many social
FIGURE 26: OPERATIONAL ISSUES ARE A BIGGER CONCERN THAN FINANCE
47%48%55% 24% 7% 4%
FinanceEconomicOperational Policy OtherAwareness
Capitalism in Crisis?: State of Social Enterprise Survey 2019 47

enterprises had sought funding, what types of finance, and how successful they were.
Just under two-fifths of all organisations (38%) reported having applied for external finance in the past 12 months. Although this is a higher proportion than reported in 2017 (34%), it is lower than in 2015 (44%) and 2013 (48%). A much higher percentage of social enterprises applied for external finance than SMEs. Just 12% of SMEs sought external finance in 2018.2
2 Small Business Survey 2018 p30
The proportion that have applied is significantly higher among newly established organisations (54% of those operating for up to three years) and lower than average among those operating for eleven or more years (28%).
Types of Finance Sought: As shown in Figure 28 the most common type of finance applied for was grant funding, with 74% of respondents applying. However, this has fallen from 84% in 2017. A third of social enterprises applied for a
0 5 10 15 20 25
None
Other
Pensions
Late payment
Shortage of managerial skills
Recruiting non-executive directors or trustees
Lack of understanding/awareness of SE - banks/support orgs
Lack of capacity re: procurement/commissioning criteria
Lack of access to/poor advice/business support
Taxation, VAT, NI, business rates
Affordability of (debt or equity) finance
Difficulty accessing procurement/commissioning services
Understanding/awareness of social enterprise among general public/customers
Leaving the EU
Shortage of skills generally
Regulations/red tape
Time pressures
Economic instability/economic climate
Lack of demand
Difficulties in accessing customers
Availability/cost of suitable premises
Recruiting staff
Cash flow
Obtaining debt or equity finance
Obtaining grant funding
FIGURE 27: MAIN THREE BARRIERS TO SUSTAINABILITY/GROWTH
% Social EnterprisesSample base = 1105
25%
18%
15%
14%
14%
13%
10%
10%
8%
8%
8%
7%
5%
5%
4%
4%
4%
4%
2%
2%
2%
2%
1%
4%
7%
48 Capitalism in Crisis?: State of Social Enterprise Survey 2019

loan (32% up from 24% in 2017), and around one in eight for an overdraft (13% up from 7% in 2017).
Amount of finance applied for and received: The survey asked those who had applied for finance / capital how much their business wanted to raise. The median amount applied for was £50,000, lower than the 2017 median of £80,000, and also 2015 (£60,000), 2013 (£58,000) and 2011 (£100,000). This is excluding those who had applied for grants.
Half the respondents that had applied for finance/capital wanted to raise up to £50,000.
In terms of the level of finance actually raised, the median amount was lower than the median applied for, at £40,000 (compared with £60,000 in both 2017 and 2015).
3 a new option for 2019
Sixteen per cent of organisations that applied for finance were unable to obtain any. This is a similar proportion to the figure reported in 2017 (15%).
Purpose of Finance: The survey also asked social enterprises what the purpose of the funding they sought was for, as set out in Figure 30.
Around half (52%) the organisations who have applied for finance reported intending to use it as working capital, with around two-fifths intending to use finance or capital for development (39%). A third intended to use the capital for purchase or refurbishment of property or equipment, while relatively fewer intended to use it in order to sustain operations through difficult or challenging times (16%3).
FIGURE 28: FORM OF FINANCE OR CAPITAL APPLIED FOR
0
10
20
30
40
50
60
70
80
A mortgageLeasing/HPEquityBlended capitalAn overdraftA loanA grant
74%
32%
10%
5%
13%
4%2%
Capitalism in Crisis?: State of Social Enterprise Survey 2019 49

0 5 10 15 20
Amount raised
Target amount
Don't know
£1,000,001 to £5 million
£500,001 to £1 million
£300,001 to £500,000
£250,001 to £300,000
£200,001 to £250,000
£150,001 to £200,000
£100,001 to £150,000
£50,001 to £100,000
£30,001 to £50,000
£20,001 to £30,000
£10,001 to £20,000
£5,001 to £10,000
£1 to £5,000
No funding raised
FIGURE 29: AMOUNT OF FINANCE WANTED TO RAISE VERSUS AMOUNT ACTUALLY RAISED
0 10 20 30 40 50 60
Other
To finance payments by results contracts
To sustain operations through difficult/
challenging times
Property or equipment purchase/refurbishment
Development Capital
Working capital
FIGURE 30: PURPOSE OF FINANCE
% Social Enterprises
% Social Enterprises
0%16%
11%13%
10%9%
9%8%
52%
39%
33%
4%
16%
5%
8%7%
11%8%
8%9%
7%5%
5%1%
3%3%
2%1%
8%7%
3%
3%3%
2%
2%2%
Sample base = 229
Sample base = 208
50 Capitalism in Crisis?: State of Social Enterprise Survey 2019

Barriers to FinanceRespondents were asked to indicate if they agree or disagree with a number of statements about the process of accessing external finance.
In terms of whether the amount of external finance available to their organisation was sufficient, 44% agree that it was while 30% disagreed. Younger organisations are more likely than average to disagree (35%) compared to only 24% of organisations established for more than 10 years.
Opinion is more evenly split on whether the finance available to their organisation is well signposted, with two-fifths (41%) agreeing that this is the case, compared with 37% that disagree.
Respondents in England are significantly more likely than those based elsewhere to disagree that it is well signposted (38%) and the proportion is also significantly higher for young organisations (43%).
Around a third of respondents (34%) feel that the application process is easy to navigate, with only slightly fewer disagreeing (32%).
The majority of respondents reported that their organisation had the financial, marketing and business skills required to obtain external finance and investment (60% agreed, including 14% that strongly agree.
FIGURE 31: ACCESSING EXTERNAL FINANCE
0
20
40
60
80
100
Strongly agree
Agree
Disagree
Strongly disagree
Don't know/NA
My organisation has the financial, marketing
and business skills required to obtain external finance and investment
The application process is easy
to navigate
The finance available to my organisation is well signposted
The amount of financeavailable to my
organisation is sufficient
26% 22%
34%
16%
8%9%
9%
4%
22% 28%
23%
20%
37% 34%
30%
46%
7% 7% 4%
14%
Sample base = 1068
Capitalism in Crisis?: State of Social Enterprise Survey 2019 51

Case study
PSSPSS is a social enterprise which has been up and running for 100 years, being founded by Eleanor Rathbone back in 1919. It works in the health, social care and criminal justice sectors, providing support to lots of different people with lots of different needs, delivering a whole host of services from offender rehabilitation and troubled families work to day support services.
PSS’s team consists of 350 staff and 350 self-employed carers who are based across the North West of England, the Midlands, the East and Lincolnshire, North Wales and the Isle of Man. In 2018/19 it turned over £16.9m with the vast majority of that income coming from local authority, NHS and probation contracts. It supports around 1500 people per year.
PSS’s largest project is working on its Shared Lives scheme. Shared Lives is a unique form of support for people with a wide range of support needs – whether that’s people who have mental health challenges, who live with learning or physical disabilities, who are moving from children’s services to adults’ services or people who have a history of offending. With Shared Lives, the people who need support can go and live with one of PSS’s specially-recruited and trained Shared Lives carers, where they’re given the support, empowerment and confidence to live
life as independently as possible, in the warmth of a family environment. They can also choose not to live with their carer, but be supported by them during the daytimes as and when they feel they need it. People are matched with a Shared Lives carer based on their personal preferences and get to choose who supports them and how much. It’s an incredibly flexible model and can be adapted to suit the support needs and goals of anyone who wants to use it. PSS founded the Shared Lives model in 1978 – and it’s now one of the fastest-growing forms of social care in the UK delivered not just by PSS, but by other providers, too.
Other PSS services include Women’s Turnaround, which supports women who have a history of offending to turn over a new leaf and make better choices; Ruby, a service that supports women who have been victims of domestic violence; Family Impact: Prisoners’ Families, which supports children of prisoners to come to terms with their parent’s imprisonment; Making Days, two day centres for people living with learning disabilities in the Liverpool community; and Parent and Baby Wellness, which supports new and expectant parents to form strong, healthy bonds with their babies.
PSS’s social mission is ‘to help people get the most out of life – no matter what challenges it
52 Capitalism in Crisis?: State of Social Enterprise Survey 2019

brings’ and this ethos has been at its heart for the last 100 years. From its Liverpool home, it has been responsible for laying the foundations for a whole host of social movements. It’s founding motto was ‘A society for any citizen in difficulty’, and during a time when there was no welfare state, PSS (or Liverpool Personal Services Society, as it was called then) had an open door to those who needed support, gaining a reputation in the city as a guardian angel helping any and all people without judgement or discrimination.
“With its ear to the ground, it recognised what needed to be done and responded by plugging as many gaps as it could with services that, in many cases, had never-before been provided in the country.”
These laid the foundations for some recognisable household names - from Age UK, Legal Aid and the Citizens’ Advice Bureau to Relate and Riverside Housing.
PSS is currently in the process of developing its new Big Plan for 2020-2025 and a key priority is going to be further pushing its green goals and looking at the organisations wider impact on people, places and the planet. Its new head office is solar powered (supplying some power back to the grid), PSS uses no disposable crockery or cutlery, has a travel policy which makes trains the preferable option, has a cycle to work programme in place and an office which is very, very nearly paper free.
Working in the current climate is challenging, austerity continues to bite and there are a lot of organisations trying to do similar vital work.
PSS is a social enterprise often called upon to deliver services owing to its balance of business-like commercialism and strong moral values. What sets it apart from other organisations is its ability to retain the pioneering spirit of its early days – liberated from the red tape that stops so many organisations from trying something new, it is brave enough to break the mould, challenge the status quo and trial the next generation of systems and processes. With social purpose still firmly at its core, it is not motivated to maximise shareholder value, but instead what is best for the people it works with and supports.
Capitalism in Crisis?: State of Social Enterprise Survey 2019 53

The evidence is building. As previous State of Social Enterprise surveys have shown, social enterprise is the future of business.
Social enterprises are greener, more innovative and less divisive than traditional forms of business. Social enterprises operate in every sector and every part of the country.
The conclusion that we should reach from this data is clear. We need more social enterprises and a greater proportion of business activity trading for a purpose. The obvious analogy is with modern technology. Every year when new phones or computers are launched, we trade in our old devices and buy the new. We need to do the same with business. The time has come to “upgrade” our economy.
There is no quick fix or silver bullet. Government must take a comprehensive approach to growing the sector and realising the benefits outlined in this report.
In broad terms, there are five key areas that we need to see change.
1. REGULATION We need every business to pay more than lip service to its social and environmental responsibility and to put that on equal footing with shareholders. The shouts for capitalism to be more ethical and sustainable need to be turned into practical action and structural reform. We need to change the reporting framework so that all businesses have to report on their social and environmental impact.
This will encourage more businesses to spend with social enterprise, increasing trading opportunities and growing the sector more rapidly.
Recommendation: Sections 172 and 396 of the Companies Act 2006 should be reformed to put a duty to improve society and protect the environment on an equal footing with the duty to shareholders and to change reporting requirements to mandate reporting of social and environmental impact.
Recommendation: Given the scale of the climate crisis, all social enterprises should take steps to embed environmental purpose into their organisation and take further steps to reduce their environmental impact.
2. TAX The tax system needs to reflect that some businesses are better than others and generate more value for the country. Social enterprises currently receive little additional support through the tax system (unless they are registered as charities). Business rates, employment taxes (reflecting that social enterprises are often employing those furthest from the labour market) and corporation taxes need to be reduced for those who contribute more and raised for those who don’t do enough. Not only will this help the growth of businesses that make a difference, but it will also encourage new entrepreneurs to go down the social enterprise route.
Recommendation: Government should launch a review of social enterprise taxes at the next Budget.
3. PROCUREMENT The public sector spends over £250bn a year on outsourcing and contracting, nearly 14% of GDP. This is a huge amount of spending and it should be used to deliver greater real social and environmental benefits to the country as a whole.
Campaigning by Social Enterprise UK led to the creation of the Social Value Act and 2019 has seen a new policy drive to expand this in central government. However, we need to go much further. Procurement for social and environmental value is still “optional” in local government and there is no legal accountability for public bodies. The Social Value Act is coming up to 8 years old, and as our most recent research, Front and Centre, shows, it needs a thorough upgrade.
Just like the original Act opened opportunities for social enterprises, a beefed up version of the Act would help social enterprises in public sector markets to compete and strengthen the role of social enterprises in areas of public service delivery such as health and social care.
7.0 CONCLUSION AND RECOMMENDATIONS
54 Capitalism in Crisis?: State of Social Enterprise Survey 2019

Recommendation: The Government should reform the Social Value Act 2012 to make all public bodies accountable for how they create additional social and environmental value when they spend public money.
4. TALENT The evidence shows that people, particularly young people, want to work in socially responsible businesses. A social purpose at work leads to a higher level of engagement and higher levels of productivity. Unfortunately, people are often not told of the opportunities that exist in the social enterprise sector and social enterprises do not do enough to spread the word. Sometimes, social enterprises do not do enough to connect their staff to their social purpose and fail to instill in them the benefits of working for a social enterprise. All of this has led to talent becoming a bigger issue for social enterprises, particularly larger employers.
Recommendation: Schools, colleges and universities should work with social enterprises to ensure that young people entering the workforce are aware of the opportunities to work in social enterprise.
Recommendation: Social enterprises must do more to advertise the career paths in the sector and engage existing staff to boost engagement and retention.
5. INVESTMENT Social enterprises need access to capital in order to grow. Unfortunately, up to now, most of this capital has been in forms which are only relevant for a few forms of social enterprises. Blended capital, venture or “risk” capital and hire purchase finance is not readily available – yet these are the forms of finance that the sector needs in order to meet demand. Moreover, finance is currently targeted at only a handful of areas and potential growth markets, such as the business to business sector, remain under resourced. Investment needs to change in order to reflect the reality of social enterprise.
Recommendation: Social investors, foundations and government programmes need to go further to make social investment
work – making it more patient, more responsive, more flexible, more speedy and more attuned to a social mission.
Recommendation: The Shared Prosperity Fund, Dormant Assets and other initiatives to grow social enterprises should include forms of blended capital and venture and risk capital as part of their offer.
Recommendation: Any proposed Green New Deal must put social enterprise at the heart of its plan ensuring that significant public investment is used to create a better economy that is focused on balancing people, planet and profit.
Capitalism in Crisis?: State of Social Enterprise Survey 2019 55

Published by Social Enterprise UK
We are the national body for social enterprise. Our members come from across the social enterprise movement – from local grassroots organisations to multi-million pound businesses, as well as the private and public sectors. Together with our members we are the voice for social enterprise. We believe that social enterprise is our best chance of creating a fairer world and protecting the planet.
Join us and support our work.
Social Enterprise UKThe Fire Station139 Tooley StreetLondon, SE1 2HZ
Website: www.socialenterprise.org.ukTwitter: @SocialEnt_UKTelephone: 020 3589 4950Email: [email protected]
Company number 4426564. The Social Enterprise Coalition is a community interest company limited by guarantee registered in England and Wales, trading as Social Enterprise UK (SEUK).
Designed by: 15northdesign.comPrinted by www.dtp.co.uk
© Social Enterprise UK 2019
You are welcome to copy this publication for internal use within your organisation. Otherwise, no part of this publication may be reproduced, stored in a retrieval system, or transmitted in any form or by any means, electronic, electrical, chemical, optical, photocopying, recording or otherwise, without prior written permission of the copyright owner.
Supported by