capital structure and performance in latin american companies
TRANSCRIPT

Full Terms & Conditions of access and use can be found athttps://www.tandfonline.com/action/journalInformation?journalCode=rero20
Economic Research-Ekonomska Istraživanja
ISSN: (Print) (Online) Journal homepage: https://www.tandfonline.com/loi/rero20
Capital structure and performance in LatinAmerican companies
Juan Gallegos Mardones & Gonzalo Ruiz Cuneo
To cite this article: Juan Gallegos Mardones & Gonzalo Ruiz Cuneo (2020) Capital structure andperformance in Latin American companies, Economic Research-Ekonomska Istraživanja, 33:1,2171-2188, DOI: 10.1080/1331677X.2019.1697720
To link to this article: https://doi.org/10.1080/1331677X.2019.1697720
© 2019 The Author(s). Published by InformaUK Limited, trading as Taylor & FrancisGroup.
Published online: 10 Dec 2019.
Submit your article to this journal
Article views: 3056
View related articles
View Crossmark data
Citing articles: 3 View citing articles
Capital structure and performance in LatinAmerican companies
Juan Gallegos Mardonesa and Gonzalo Ruiz Cuneob
aDepartment Audit and Information Systems, Faculty of Economics and Administrative Sciences,Universidad Cat�olica de la Sant�ısima Concepci�on, Concepci�on, Chile; bFaculty of Engineering,Universidad de Concepci�on, Concepci�on, Chile
ABSTRACTThe purpose of this study is to explain the financial performanceof companies in Latin America through the lens of capital struc-ture and ownership structure. We perform a quantitative analysisof companies in Brazil, Chile, Mexico, and Peru using a panel datamethod. To avoid endogeneity problems, instrumental variables,generalised method of moments models, and panels with randomeffects are employed. The data cover the period 2000 to 2015.We find a positive relationship between financial performance,growth, and size of the company. However, there are mixedresults for short- and long-term financial leverage, as well as forcompany liquidity. With respect to the ownership structure ofChilean companies, a positive effect is observed for the first majorshareholder with financial performance. In general, our results arein line with those of previous studies. However, the existence ofmixed results between companies and countries makes for aninteresting and novel conclusion.
ARTICLE HISTORYReceived 15 February 2019Accepted 18 November 2019
KEYWORDSFinancial performance;capital structure; ownershipstructure; Latin America
JEL CLASSIFICATIONSC23; C26; G32
1. Introduction
Company performance is a key issue for investors, shareholders, and the economy ingeneral. In addition, performance is a mechanism for control, allocation of resources,and assessment of the financial health of a company over a period of time (Rumelt,1991). According to Iswatia and Anshoria (2007), a company’s performance is a func-tion of the organisation’s ability to obtain and manage its resources in order todevelop a competitive advantage (Omondi & Muturi, 2013). Previous studies haveused return on assets (ROA), return on equity (ROE), and Tobin’s Q as measures ofcompetitive advantage (Liargovas & Skandalis, 2008).
The factors determine a company’s performance, including corporate governance,financial leverage, liquidity, and company size, as well as industry-related factors,such as growth and industry concentration (Cohn, Mills, & Towery, 2014; Liargovas
CONTACT Juan Gallegos Mardones [email protected]� 2019 The Author(s). Published by Informa UK Limited, trading as Taylor & Francis Group.This is an Open Access article distributed under the terms of the Creative Commons Attribution License (http://creativecommons.org/licenses/by/4.0/), which permits unrestricted use, distribution, and reproduction in any medium, provided the original work isproperly cited.
ECONOMIC RESEARCH-EKONOMSKA ISTRAŽIVANJA2020, VOL. 33, NO. 1, 2171–2188https://doi.org/10.1080/1331677X.2019.1697720
& Skandalis, 2008). Other theories complement previous studies that use entrepre-neurship management and innovation as drivers of company profitability (Audretsch,Castrogiovanni, Ribeiro, & Roig, 2005; Palacios-Marqu�es, Roig-Dob�on, & Comeig,2017; Rico & Cabrer-Borr�as, 2018). Kyvik (2018) incorporates the business model,creativity, and management and financial control as key variables in his analysis.
Unlike previous studies, the objective of the present work is to reveal the relation-ships in Latin American economics between financial performance and the followingfinancial variables: leverage, operational risk, size, liquidity, growth, tangibility andownership structure. The evidence shows inconclusive results for these types ofeconomies (Hawawini, Subramanian, & Verdin, 2004). In this investigation, we usethe following three measures of financial performance: ROA, ROE and Q of Tobin.
Our work helps to reveal the variables that affect the performance of companies inLatin American countries. Using a panel data analysis, our research provides relevantinformation about these variables and their specific effects by country.
The rest of the paper is structured as follows. The next section presents a summaryof the literature focused on methods employed and main findings. Thereafter, thedatabase and methodological framework, and details of the variables are discussed.Then, the results are presented and discussed. The final section summarises andpresents future research challenges.
2. Literature review and hypothesis development
Modigliani and Miller (1958) argue that in a perfect and complete market in whichthere are no personal and corporate taxes, the structure of capital (i.e., distribution ofa company’s debt and equity) is irrelevant to the value of the company. However, ina later study, in the context of imperfect markets, Modigliani and Miller (1963) findthat financial leverage can allow a company to increase its value by benefiting fromfiscal shield through using debt. In addition, the authors propose the existence of apositive relationship between performance and leverage. Later, Kraus andLitzenberger (1973), through a marginal analysis for use of debt, propose the exist-ence of an optimal leverage and recognise a non-linear relationship between leverageand performance. This is because when the firm finds this optimal leverage, it maxi-mises its value and has no incentives to increase its leverage, as this implies decreas-ing its value (Vargas, 2014). Then, Myers (1984) and Myers and Majluf (1984)propose the pecking order theory based on asymmetrical information between man-agers and new investors increasing adverse selection costs (Frank & Goyal, 2009). Inthis theory, it is assumed there is no optimal leverage and firms choose financing fol-lowing a preference order: internal finance, debt, and equity. Myers and Majluf(1984) argue that there is information asymmetry between managers and investors,because managers have more information than new investors and act in favour of oldshareholders. Jensen (1986) and Hart and Moore (1994) regard this conflict as anagency problem that can be controlled with an adequate capital structure allowingadequate control and minimising agency costs. Jensen (1986) proposes that in compa-nies with high levels of debt, managers are motivated to invest in profitable projectsto generate cash flow to pay interest and capital, reducing the conflict between
2172 J. G. MARDONES AND G. R. CUNEO

shareholders and administrators, but the conflict between shareholders and bondhold-ers increases, because it can lead shareholders to invest sub optimally (Harris &Raviv, 1988). A significant association is also observed between cash flow and com-pany performance (Park & Jang, 2013).
Abor (2005) finds a positive relationship between leverage and financial per-formance and an inverse relationship for companies listed in Ghana. Gill, Biger,and Mathur (2011) find a positive relationship when they use ROE as a measureof profitability and a negative relationship when they use ROA. The same resultsare found by Olorunfemi and David (2010) when they relate earnings per shareand dividend per share with leverage for Nigerian oil companies. Nawaz, Ali, andNaseem (2011) obtain the same result for textile companies in Pakistan. Zeitunand Tian (2007) find a negative relationship between financial performance andleverage and a positive relationship using Tobin’s Q for companies from Jordan.Mohamad and Abdullah (2012) show a negative relationship for Malaysian compa-nies between 2002 and 2010 while Seetanah, Seetah, Appadu, and Padachi (2014)show a negative and significant relationship between leverage ratio and firm per-formance measures, like ROA and ROE, for a group of firms in emerging coun-tries, supporting hierarchical order theory. However, growth opportunities, freecash flow, oil price, and firm age have insignificant influence. Therefore, we pro-pose the following relationships.
Hypothesis 1a. There is a positive relationship between leverage and companyperformance.
Hypothesis 1b. There is a negative relationship between leverage and companyperformance.
Hypothesis 2a. There is a non-linear relationship between debt and companyperformance.
Hypothesis 2b. There is a linear relationship between debt and company performance.
In addition, the authors highlight company growth and size as key variables incompany performance (Chiang, Chan, & Hui, 2002). The results are inconclusiveregarding the relationship between growth and profitability, since companies withgrowth capacity can generate greater market share and synergy effects, leading tofavourable returns (Abor, 2005; Danis, Rettl, & Whited, 2014; Kester, 1986; Nawazet al., 2011; Reilly & Brown, 2006). Rapid company growth can lead to greater com-petition and economic fluctuations (Idol, 1978; Logue & Merville, 1972). In addition,higher growth can negatively affect the owner’s wealth (Ba~nos-Caballero, Garc�ıa-Teruel, & Mart�ınez-Solano, 2014; Goddard, Tavakoli, & Wilson, 2005; Simerly & Li,2000). Therefore, we propose the following relationships.
Hypothesis 3a. There is a positive relationship between growth and companyperformance.
Hypothesis 3b. There is a negative relationship between growth and companyperformance.
On the one hand, the literature shows that large companies can achieve betterreturns by developing economies of scale and scope than by using the capital market
ECONOMIC RESEARCH-EKONOMSKA ISTRAŽIVANJA 2173

as a source of financing (Berman, Wicks, Kotha, & Jones, 1999; Gupta, 1969). Thus,larger companies have more profitable investment opportunities, greater efficiency,more diversification, and a lower level of risk (Mainelli & Giffords, 2010). On theother hand, other research shows that larger companies may incur inefficiencies, lead-ing to inferior financial performance and thereby poor performance (Fama & French,1993; Klapper & Love, 2004; O’Neill, Saunders, & McCarthy, 1989; Wu, 2006; Zajac,1990). The most commonly used size measures are level of assets or sales(Schmalensee, 1989). Therefore, we propose the following relationships.
Hypothesis 4a. There is a positive relationship between size and company performance.
Hypothesis 4b. There is a negative relationship between size and company performance.
Liquidity is another variable used to explain company profitability. Myers andRajan (1998) state that companies with greater liquidity tend to increase their bor-rowing capacity, favouring greater financial performance and quickness in convertingassets into cash at fair market value. Good liquidity management improves operatingresults and company performance, and favours access to the capital market (Moyer,McGuigan, & Kretlow, 2001). Goddard et al. (2005) argue that liquidity shows howquickly companies can react and adapt to changes in their environment; it can alsoreduce the risk of not being able to meet companies’ short-term financial obligations.Therefore, we propose the following relationships.
Hypothesis 5a. There is a positive relationship between liquidity and companyperformance.
Hypothesis 5b. There is a negative relationship between liquidity and companyperformance.
The relationship between ownership structure and performance has received con-siderable attention by researchers all over the world (Kumar, 2003) as has the effectof the board’s diversity on performance (De Abreu Dos Reis, Sastre-Castillo, & Roig-Dob�on, 2007). The presence of large shareholders is considered to improve controland, therefore, to positively impact the value of the business (He & Rui, 2016).Grossman and Hart (1983) argue that shareholders with an important share in thecompany’s capital show more interest in decision making, because they can partiallyinternalise the benefits of their effort. On the contrary, research has identified costsassociated with certain levels of ownership concentration that can negatively affectcompany performance (Demsetz & Lehn, 1985). A high concentration of ownershipreduces managers’ freedom to make decisions and take risks, and reduces opportuni-ties for new projects (Bushee, 1998; Pound, 1988). Meanwhile, Perrini, Rossi, andRovetta (2008) find that ownership concentration of a company’s five biggest share-holders positively influences firm valuation. Khamis, Hamdan, and Elali (2015) findthat, for the first stockholder, there is a negative effect on financial performance usingROA and Tobin’s Q but there is no effect for the second, third, fourth, and fifthmain shareholders. Maury and Pajuste (2006) find that the presence of a strong thirdshareholder positively affects company value, while a second large shareholder cannegatively affect it. Konijn, Kr€aussl, and Lucas (2011) investigate the effect of the dis-persion of the concentration of ownership on the value of the company, finding a
2174 J. G. MARDONES AND G. R. CUNEO

negative relationship between it and financial performance. The literature reviewreveals increasing empirical evidence on the effects of ownership structure on firmperformance in developed markets, but little attention has been given to emergingmarkets. Therefore, we propose the following relationships.
Hypothesis 6a. There is a negative relationship between high ownership structure andcompany performance.
Hypothesis 6b. There is a positive relationship between high ownership structure andcompany performance.
3. Data and methodology
3.1. Sample, variables, and data collection
The study uses a set of financial data and the ownership structure of public compa-nies in Latin American countries. Brazil, Chile, Mexico, and Peru are selected for thisresearch, because their economies have more developed markets in the region. Thedata collected correspond to consolidated financial statements for each of these com-panies. Our main source is Thomson Reuters Eikon and the Commission for theChilean Financial Market. One limitation of the database used in this research is thatinformation regarding ownership structure is available only for Chilean companies.The period under study covers the years 2005–2015. The estimation is conductedusing STATA 14 software.
For the validity of our research hypotheses, we consider the research developed byEspinosa, Maquieira, Vieito, and Gonz�alez (2012), Paniagua, Rivelles, and Sapena(2018), Phuong and Bich (2017), Rajan and Zingales (1995), and Zeitun and Tian(2007). This study uses panel data to estimate a regression model to identify the rela-tionship between financial factors and financial performance. As Wooldridge (2002)indicates, the panel data have transverse and time-series dimensions. The fixed effectsmodel and the random effects model stand out (Yaffee, 2005). In the fixed effectsmodel, the individual effect is a random variable which can be correlated with theexplanatory variables while in the random effects model, it is assumed that the indi-vidual effect is random and uncorrelated with the explanatory variables (Borenstein,Hedges, Higgins, & Rothstein, 2010).
Endogeneity is defined as the existence of correlation between the independentvariable and the error term, that is, there is a causal relationship between the inde-pendent and the dependent variable whereby both explain each other. Endogeneitymay result from measurement errors, simultaneity, or omitted variables. In this case,regression using ordinary least squares (OLS) is not adequate and other models mustbe employed to correct it (Labra & Torrecillas, 2014). Based on previous studies,some authors have argued that endogeneity is a typical problem in panel models thatshould be corrected (Espinosa et al., 2012; Margaritis & Psillaki, 2010; Phuong &Bich, 2017; Rajan & Zingales, 1995). To do so, Phuong and Bich (2017) and Espinosaet al. (2012) do not recommend the use of fixed or random effects models, since theyconsider the independent variables as exogenous.
ECONOMIC RESEARCH-EKONOMSKA ISTRAŽIVANJA 2175

These authors instead suggest the use of dynamic data panels by means of eitherthe inclusion of instrumental variables (IV) or the use of the generalised method ofmoments (GMM), which yields consistent estimators in the parameters in situationsin which the OLS estimator is inconsistent. It is preferable to use the GMM in twostages with a robust estimator, since it is more efficient and reduces the loss of infor-mation (Arellano & Bover, 1995). This method does not lead to problems of over-identification. To estimate the effect of the non-linear relationship between debt andfinancial performance, the random effects method with robust estimator is suggested(Phuong & Bich, 2017). We propose three models for our study. The first modeldefines the relationship between financial variables and financial performance (1).The second model recognises the existence of a possible non-linear relationshipbetween debt and financial performance (2). Finally, the third model recognises theeffects of ownership structure on financial performance (3).
DESi, t ¼ aþ b1SDi, t þ b2LDi, t þ b3GROi, t þ b4SIZEi, t þ b5 TANi, t þ b6TAXi, t
þ b7RISKi, t þ b8INV i, t þ b9CASH i, t þ b10PROFi, t þ b11LQi, t þ b12DIVi, t
þ ei, t
(1)
DESi, t ¼ aþ b1SDi, t þ b2SD2i, t þ b3LDi, t þ b4LD
2i, t þ b5GROi, t þ b6SIZEi, t
þ b7 TANi, t þ b8TAXi, t þ b9RISKi, t þ b10INV i, t þ b11CASH i, t
þ b12PROFi, t þ b13LQi, t þ b14DIVi, t þ ei, t (2)
DESi, t ¼ aþ b1SDi, t þ b2SD2i, t þ b3LDi, t þ b4LD
2i, t þ b5GROi, t þ b6SIZEi, t
þ b7 TANi, t þ b8TAXi, t þ b9RISKi, t þ b10INV i, t þ b11CASH i, t
þ b12PROFi, t þ b13LQi, t þ b14DIVi, t þ b15PRO1i, t þ b16PRO3i, t
þ b17PRO5i, t þ ei, t (3)
Measurement of variables and descriptive statistics
The sample comprises 4,715 companies studied between 2000 and 2015. Specifically,2,272 Brazilian, 847 Chilean, 1,000 Mexican, and 596 Peruvian companies are ana-lysed. To carry out our estimates, we present the details of each variable in Table 1.
The summarised descriptive statistics of all variables (see Table 2) show that aver-age ROA for all companies is 10.1%, average ROE is 13.2%, and average Tobin’s Q is1.378. For all companies, ROE shows a greater standard deviation than ROA, whichcan be explained by the volatility of operational income and leverage. Peruvian com-panies show the greatest profitability with ROA of 14.8% and ROE of 16.9%.However, these companies have the lowest Tobin’s Q of 1.189. Mexican companieshave the highest Tobin’s Q of 1.665. With regard to leverage, the companies usemore short-term debt (SD) than long-term debt (LD). Peruvian companies show the
2176 J. G. MARDONES AND G. R. CUNEO

highest rate of growth in sales (GRO) of 19.5% and Mexican companies show thelowest of 10.1%. Mexican and Brazilian companies are largest in size and Chileancompanies are smallest. Meanwhile, Chilean companies have the highest proportionof tangible assets (TAN) of 45.6% as well as investments in capital expenditure(CAPEX) of 6.9%. In addition, Peruvian companies have the highest level of risk(RISK) 4.5%, as well as highest profitability (PROF) 20.4% and payment of dividends(DIV) 8.1%. Finally, Brazilian companies have greatest liquidity (LIQ) 16.3%.
There is positive correlation between SD and financial performance for all compa-nies, but in the case of LD, there is positive correlation with Tobin’s Q. The variablesGRO, RISK, INV, CASH, PROF, and LIQ are correlated positively with performance.The variables LD, SIZE, TAN, TAX, and DIV produce mixed results (see Table 3).
4. Regression results and discussion
To solve the endogeneity problems, we propose using instruments and lag variables(Espinosa et al., 2012; Rajan & Zingales, 1995). As instruments for SD and LD, theendogeneity variables we propose asset turnover ratio (Dumont & Svensson, 2014)and total debt to capitalisation ratio (Espinosa et al., 2012; Phuong & Bich, 2017).Based on the results of the Hausman test, the random effects model is recommended.
Table 4 summarises (1) and shows the IV results. The regressions performed aresignificant at the 99% and 95% confidence levels. For ROA, �0.157 of the variation isexplained by the independent and control variables; for ROE, it is �0.007 and forTobin’s Q, it is �11.040. SD shows mixed results, with a negative and significant rela-tionship with ROA of 0.0018, with ROE of 0.266, and with Tobin’s Q of �1.604. ForLD, there is a negative relationship for Brazilian, Mexican, and Peruvian companieswhen the performance measures are ROA and Tobin’s Q. However, the results arepositive for Chilean companies when ROE is the performance measure. For SD, theresults are mixed for each of the performance measures. These results are
Table 1. Details of model variables.Variables Abbreviation Detail
Return on assets ROA Earnings after tax to total assetsReturn on equity ROE Earnings after tax to equityTobin’s Q Q Accounting value total liability plus stock capitalisation to total assetsShort-term debt SD Short-term debt to total assetsLong-term debt LD Long-term debt to total assetsGrowth GRO Percentage of change in sales with respect to previous yearSize SIZE Natural logarithm of total assetsTangibility TAN Property, plant, and equipment to total assetsTax TAX Tax paid on earnings before interest and taxOperational risk RISK Standard deviation of the last 3 years of ROACapital expenditure INV Capital expenditure to total assets of the companyCash CASH Earnings after tax plus annual depreciation to total assetsProfitability PROF Earnings before interest and tax to total salesLiquidity LQ Cash and cash equivalent to total assetsPaid dividend DIV Dividend per share to share’s market priceOwnership PRO1 Ownership of largest shareholder of company i in period t.Ownership PRO3 Ownership of three largest shareholders of company i in period t.Ownership PRO5 Ownership of five largest shareholders of company i in period t.
Source: Own elaboration.
ECONOMIC RESEARCH-EKONOMSKA ISTRAŽIVANJA 2177
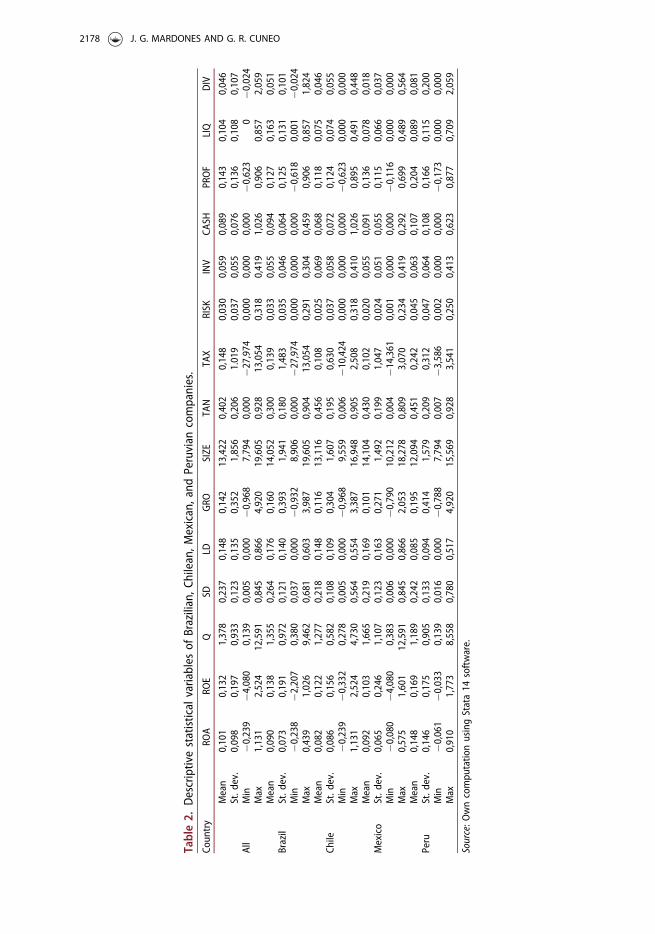
Table2.
Descriptivestatistical
variables
ofBrazilian,C
hilean,M
exican,and
Peruvian
companies.
Coun
try
ROA
ROE
QSD
LDGRO
SIZE
TAN
TAX
RISK
INV
CASH
PROF
LIQ
DIV
Mean
0,101
0,132
1,378
0,237
0,148
0,142
13,422
0,402
0,148
0,030
0,059
0,089
0,143
0,104
0,046
St.d
ev.
0,098
0,197
0,933
0,123
0,135
0,352
1,856
0,206
1.019
0,037
0,055
0,076
0,136
0,108
0,107
All
Min
�0,239
�4,080
0,139
0,005
0,000
�0,968
7,794
0,000
�27,974
0,000
0,000
0,000
�0,623
0�0
,024
Max
1,131
2,524
12,591
0,845
0,866
4,920
19,605
0,928
13,054
0,318
0,419
1,026
0,906
0,857
2,059
Mean
0,090
0,138
1,355
0,264
0,176
0,160
14,052
0,300
0,139
0,033
0,055
0,094
0,127
0,163
0,051
Brazil
St.d
ev.
0,073
0,191
0,972
0,121
0,140
0,393
1,941
0,180
1,483
0,035
0,046
0,064
0,125
0,131
0,101
Min
�0,238
�2,207
0,380
0,037
0,000
�0,932
8,906
0,000
�27,974
0,000
0,000
0,000
�0,618
0,001
�0,024
Max
0,439
1,026
9,462
0,681
0,603
3,987
19,605
0,904
13,054
0,291
0,304
0,459
0,906
0,857
1,824
Mean
0,082
0,122
1,277
0,218
0,148
0,116
13,116
0,456
0,108
0,025
0,069
0,068
0,118
0,075
0,046
Chile
St.d
ev.
0,086
0,156
0,582
0,108
0,109
0,304
1,607
0,195
0,630
0,037
0,058
0,072
0,124
0,074
0,055
Min
�0,239
�0,332
0,278
0,005
0,000
�0,968
9,559
0,006
�10,424
0,000
0,000
0,000
�0,623
0,000
0,000
Max
1,131
2,524
4,730
0,564
0,554
3,387
16,948
0,905
2,508
0,318
0,410
1,026
0,895
0,491
0,448
Mean
0,092
0,103
1,665
0,219
0,169
0,101
14,104
0,430
0,102
0,020
0,055
0,091
0,136
0,078
0,018
Mexico
St.d
ev.
0,065
0,246
1,107
0,123
0,163
0,271
1,492
0,199
1,047
0,024
0,051
0,055
0,115
0,066
0,037
Min
�0,080
�4,080
0,383
0,006
0,000
�0,790
10,212
0,004
�14,361
0,001
0,000
0,000
�0,116
0,000
0,000
Max
0,575
1,601
12,591
0,845
0,866
2,053
18,278
0,809
3,070
0,234
0,419
0,292
0,699
0,489
0,564
Mean
0,148
0,169
1,189
0,242
0,085
0,195
12,094
0,451
0,242
0,045
0,063
0,107
0,204
0,089
0,081
Peru
St.d
ev.
0,146
0,175
0,905
0,133
0,094
0,414
1,579
0,209
0,312
0,047
0,064
0,108
0,166
0,115
0,200
Min
�0,061
�0,033
0,139
0,016
0,000
�0,788
7,794
0,007
�3,586
0,002
0,000
0,000
�0,173
0,000
0,000
Max
0,910
1,773
8,558
0,780
0,517
4,920
15,569
0,928
3,541
0,250
0,413
0,623
0,877
0,709
2,059
Source:O
wncompu
tatio
nusingStata14
software.
2178 J. G. MARDONES AND G. R. CUNEO

Table3.
Matrix
ofcorrelations
betweenvariables
ofBrazilian,C
hilean,M
exican,and
Peruvian
companies.
ROA
ROE
QSD
LDGRO
SIZE
TAN
TAX
RISK
INV
CASH
PROF
LQDIV
ROA
1,000
ROE
0,759
1,000
Q0,307
0,299
1,000
SD0,082
0,193
0,075
1,000
LD�0
,184
�0,040
0,074
�0,080
1,000
GRO
0,192
0,189
0,104
0,096
�0,027
1,000
SIZE
�0,071
�0,002
0,151
�0,060
0,461
�0,038
1,000
TAN
0,008
�0,073
�0,065
�0,336
�0,002
�0,059
�0,022
1,000
TAX
0,078
�0,023
0,034
0,024
�0,047
0,024
�0,018
�0,058
1,000
RISK
0,472
0,350
0,072
�0,032
�0,198
0,164
�0,205
�0,021
�0,034
1,000
INV
0,204
0,189
0,179
�0,042
0,122
0,049
0,083
0,316
�0,040
0,110
1,000
CASH
0,886
0,766
0,331
0,031
�0,224
0,184
�0,026
0,004
0,051
0,434
0,257
1,000
PROF
0,690
0,486
0,186
�0,238
�0,024
0,126
0,038
0,067
0,064
0,336
0,167
0,584
1,000
LQ0,162
0,166
0,045
�0,052
�0,056
0,006
�0,048
�0,353
0,072
0,232
�0,051
0,205
0,110
1,000
DIV
0,356
0,249
�0,129
�0,049
�0,093
�0,024
�0,019
0,019
0,032
0,267
0,038
0,330
0,230
0,166
1,000
Source:O
wncompu
tatio
nusingStata14
software.
ECONOMIC RESEARCH-EKONOMSKA ISTRAŽIVANJA 2179

Table4.
Regression
results
with
estim
ations
ininstrumentalvariables
with
robu
stestim
ator.
ROA
ROE
Tobin’sQ
Variables
All
Brazil
Chile
Mexico
Peru
All
Brazil
Chile
Mexico
Peru
All
Brazil
Chile
Mexico
Peru
SD0,018
(0,015)
0,083
(0,038)
0,043
(0,028)
�0,059�
(0,021)
�0,036�
(0,024)
0,266���
(0,041)
0,500���
(0,119)
�0,273���
(0,081)
�0,295���
(0,058)
0,304���
(0,056)
�1,604�
(0,886)
�0,400
(2,386)
3,608��
(1,487)
�2,598��
(1,362)
0,791
(2,032)
LD�0
,157���
(0,027)
�0,310���
(0,063)
�0,178
(0,079)
�0,094���
(0,026)
�0,257��
(0,090)
�0,007
(0,116)
�0,647
(0,265)
0,184
(0,256)
0,227��
(0,094)
0,439
(0,327)
�11,040���
(0,999)
�15,490���
(3,257)
�15,567���
(4,225)
�7,375���
(1,012)
�27,215���
(8,819)
SIZE
0,001��
(0,001)
0,007��
(0,002)
0,006��
(0,003)
0,001��
(0,001)
0,004��
(0,002)
0,003
(0,004)
0,028��
(0,010)
0,006
(0,008)
�0,001
(0,004)
�0,013
(0,008)
0,437���
(0,041)
0,530���
(0,116)
0,598���
(0,154)
0,412���
(0,056)
0,608���
(0,209)
GRO
0,004��
(0,003)
0,001
(0,005)
�0,004
(0,010)
0,009��
(0,006)
0,010��
(0,003)
0,015�
(0,008)
0,019��
(0,017)
0,008�
(0,020)
0,017��
(0,017)
�0,003�
(0,011)
0,223�
(0,131)
0,156
(0,218)
0,389�
(0,337)
0,195�
(0,432)
0,588�
(0,329)
TAN
�0,007
(0,005)
0,017
(0,016)
0,021
(0,009)
�0,016
(0,008)
0,005��
(0,011)
�0,012
(0,013)
0,030
(0,046)
0,056��
(0,023)
�0,044��
(0,021)
0,037��
(0,018)
�1,169���
(0,289)
�0,905
(0,871)
1,615���
(0,633)
1,022���
(0,386)
�0,602
(1,078)
TAX
�0,003
(0,003)
0,002�
(0,002)
0,006
(0,003)
�0,016���
(0,004)
�0,004
(0,006)
�0,016
(0,016)
0,005
(0,004)
0,012��
(0,005)
�0,081���
(0,023)
0,009
(0,008)
�0,026
(0,066)
0,117�
(0,105)
�0,069
(0,072)
�0,174��
(0,071)
0,056
(0,381)
RISK
0,001
(0,029)
0,054
(0,061)
�0,109
(0,069)
�0,170���
(0,052)
�0,010
(0,039)
0,050
(0,107)
0,374
(0,206)
0,157
(0,183)
�0,231
(0,146)
0,312��
(0,161)
�2,308
(1,871)
2,929
(4,1
42)
�8,814���
(3,550)
�4,940�
(2,849)
�8,675��
(3,742)
INV
�0,003
(0,022)
0,052
(0,063)
�0,016
(0,046)
�0,071
(0,038)
0,034
(0,031)
0,003
(0,077)
0,401
(0,253)
�0,182
(0,160)
�0,171
(0,131)
�0,055
(0,062)
6,693���
(0,978)
13,251���
(3,367)
5,977���
(2,034)
8,226���
(1,621)
8,090���
(3,065)
CASH
0,713���
(0,039)
0,545���
(0,070)
0,922���
(0,059)
0,607���
(0,046)
0,792���
(0,038)
1,404���
(0,148)
0,851���
(0,222)
1,910���
(0,250)
1,553���
(0,143)
1,639���
(0,205)
�0,471
1,055
�7,991��
(3,455)
2,974��
(1,374)
�0,738
(2,189)
�0,782
(2,533)
PROF
0,094���
(0,016)
0,118���
(0,035)
�0,013
(0,016)
0,108���
(0,025)
0,059���
(0,018)
0,164���
(0,038)
0,327���
(0,100)
0,015
(0,043)
0,124
(0,078)
0,000
(0,044)
0,960
(0,824)
1,948
(1,802)
�0,736
(1,058)
2,843��
(1,315)
�0,696
(1,356)
LQ0,011
(0,010)
0,065���
(0,019)
�0,014
(0,014)
0,047
(0,026)
�0,001
(0,017)
0,032
(0,049)
0,178�
(0,067)
0,008
(0,031)
0,248���
(0,077)
�0,126��
(0,059)
�0,196
(0,446)
0,618
(1,041)
�1,392�
(0,837)
0,083
(1,204)
�0,842
(1,660)
DIV
0,026
(0,012)
�0,047���
(0,014)
0,065
(0,039)
0,081
(0,047)
0,030���
(0,008)
0,005
(0,029)
�0,105�
(0,040)
0,121
(0,105)
0,173��
(0,085)
�0,018
(0,028)
�2,439���
(0,499)
�3,015���
(0,881)
�0,040
(1,442)
�7,000���
(2,298)
�1,398�
(0,869)
Constant
0,002
(0,011)
�0,087�
(0,032)
�0,070
(0,030)
�0,012
(0,016)
�0,039
(0,026)
�0,111�
(0,041)
�0,457���
(0,125)
�0,205���
(0,079)
�0,115��
(0,046)
0,029
(0,076)
�2,296���
(0,522)
�3,325��
(1,676)
�6,016���
(1,796)
�2,436���
(0,684)
�3,575
(2,488)
Observatio
ns2.671
786
667
651
567
2.671
786
667
651
567
2.671
786
667
651
567
WaldCh
i2214,21
71,35
34,18
168,78
75,96
128,33
31,07
35,73
90,75
61,78
206,22
50,12
48,08
129,64
55,29
Prob
>Ch
i20,0000
0,0000
0,0000
0,0000
0,0000
0,0000
0,0001
0,0000
0,0000
0,0000
0,0000
0,0000
0,0000
0,0000
0,0000
Note:Standard
deviationin
parentheses.
� p<0.1;
��p<0.05;
��� p
<0.01.
Source:O
wncompu
tatio
nusingStata14
software.
2180 J. G. MARDONES AND G. R. CUNEO

inconclusive, and do not allow us to accept or reject hypothesis 1 for any perform-ance measure.
Regarding the growth variable (GRO), we observe a positive and significant rela-tionship for most countries, for each performance measure, which is consistent withthat proposed in the literature and indicates that companies with higher growth ratesgenerate more profits and improve their profitability. On average, a positive and sig-nificant relationship is observed for each performance measure of ROA at 0.004, ROEat 0.015, and Tobin’s Q at 0.223. However, this relationship is not observed for Chileand Brazil when the dependent variable is ROA or for Brazil when the measure isTobin’s Q. Still, we can accept hypothesis 3 for any performance measure.
In terms of size (SIZE), a positive and significant relationship is observed at the99% and 95% confidence levels for each performance measure of ROA at 0.001, ROEat 0.003, and Tobin’s Q at 0.437. Larger companies are expected to face lower bank-ruptcy costs and, therefore, have higher profitability; in our analysis, the effect of sizeis highlighted by Tobin’s Q for Peruvian companies of 0.608. These results allow usto support hypothesis 4 for all performance measures.
Meanwhile, liquidity (LIQ) does not show a significant or positive relationship foreach of the performance measures. Specifically, Brazil’s relationship is 0.065 and0.178 at the 99% and 90% confidence level when the performance measure is ROAand ROE, respectively. For Mexico liquidity show a similar relationship of 0.248when the performance measure is ROE. These results do not support hypothesis 5.
Table 5 shows the estimates for (1) through the GMM method. The resultsobtained for LD are similar to those obtained with the IVs for ROA and ROE at aconfidence level of 99% and 95%, respectively. However, it is not significant whenconsidering Tobin’s Q of 0.240. On the contrary, SD is significant and negative whenconsidering ROA as a performance measure. These results are inconclusive, and donot allow us to accept or reject hypothesis 1 for any performance measure.
With respect to growth, a result similar to the use of instruments is observed foreach of the variables at the 95% confidence level with ROA of 0.003, ROE of 0.013,and Tobin’s Q of 0.287. In terms of size, there is a positive and significant relation-ship for most countries with ROA of 0.006, ROE of 0.010, and Tobin’s Q of 0.026.Thus, we support hypotheses 3 and 4. Meanwhile, liquidity (LIQ) shows a significantand negative relationship only for Peru (0.065) at the 99% confidence level when theperformance measure is ROE. This result does not support hypothesis 5.
This study estimates (2), and thus, tests hypothesis 2 on the non-linear effects forSD and LD. For SD, there is a negative and significant relationship when ROA is theperformance measure of -0.069 at the 90% confidence level. At the country level,there is a similar effect for Chile and Peru when we use Tobin’s Q of �7.890 and�3.053, respectively. However, there is a positive and significant effect for Chilewhen we use ROA and ROE as performance measures. When we analyse the effectsof long-term debt, there is a negative and significant effect for Mexico of �2.489.However, there is a positive relationship for Brazil of 0.129, for Mexico of 0.085, andfor Peru of 0.144 when we use ROA as well as for Mexico of 0.337 and for Peru of3.497 when the performance measure is ROE and Tobin’s Q. These results do notsupport hypothesis 2 for any performance measure (see Table 6).
ECONOMIC RESEARCH-EKONOMSKA ISTRAŽIVANJA 2181

Table5.
Regression
results
with
estim
ations
inGMM
system
s.RO
ARO
ETobin’sQ
Variables
All
Brazil
Chile
Mexico
Peru
All
Brazil
Chile
Mexico
Peru
All
Brazil
Chile
Mexico
Peru
SD�0
.003��
�0.015
0.162
�0.013��
0.001
0.206���
0.156
0.354���
�0.078
0.333���
0.269
0.416
�0.351
0.019
0.343
(0.011)
(0.019)
(0.068)
(0.031)
(0.032)
(0.042)
(0.218)
(0.072)
(0.060)
(0.081)
(0.479)
(0.910)
(0.583)
(0.190)
(0.098)
LD�0
.151��
�0.016
0.601
�0.075��
0.024��
�0.159��
0.152
�0.425���
�0.050
0.155
0.240
0.274
�0.134��
0.267
�0.230
(0.011)
(0.019)
(0.062)
(0.044)
(0.024)
(0.053)
(0.221)
(0.105)
(0.089)
(0.104)
(0.391)
(0.602)
(0.799)
(0.868)
(0.098)
SIZE
0.006��
0.002
0.003
0.007
�0.003
0.010��
�0.001
�0.005
0.015
�0.007
0.266��
0.028
0.240��
0.350�
0.267�
(0.003)
(0.002)
(0.008)
(0.005)
(0.004)
(0.009)
(0.017)
(0.009)
(0.017)
(0.011)
(0.136)
(0.205)
(0.109)
(0.227)
(0.185)
GRO
0.003�
0.002
0.012
0.012��
0.008��
0.013���
0.026��
0.031�
0.012
0.021
0.087
0.141��
0.288��
0.112
�0.137
(0.002)
(0.003)
(0.011)
(0.006)
(0.004)
(0.004)
(0.012)
(0.018)
(0.016)
(0.022)
(0.106)
(0.078)
(0.133)
(0.175)
(0.131)
TAN
�0.016
�0.014
0.002
�0.040�
�0.020
0.040
0.116
�0.021
�0.090�
0.033
�0.367
�0.553
0.174
0.071
�1.712
(0.011)
(0.016)
(0.025)
(0.024)
(0.029)
(0.042)
(0.125)
(0.064)
(0.053)
(0.114)
(0.379)
(0.558)
(0.552)
(0.858)
(1.919)
TAX
0.002���
0.000
0.005���
�0.001
�0.001
0.001
�0.000
0.002
�0.004
0.012
�0.020
0.000
�0.104��
0.169�
0.011
(0.001)
(0.001)
(0.001)
(0.002)
(0.008)
(0.002)
(0.006)
(0.004)
(0.008)
(0.009
(0.042)
(0.030)
(0.059)
(0.109)
(0.287)
RISK
0.018
�0.020
�0.074
�0.172
0.014
0.123
0.189
�0.178
�0.237
0.337��
1.218
0.478
�1.162
�0.408
0.129
(0.020)
(0.023)
(0.043)
(0.122)
(0.039)
(0.099)
(0.300)
(0.182)
(0.189)
(0.163)
(1.111)
(1.414)
(2.364)
(1.9033)
(1.174)
INV
�0.025
�0.129��
�0.093���
�0.003
�0.043
�0.020
�0.202
�0.141
0.045
0.199
0.529
1.071
1.083
2.357��
0.028
(0.022)
(0.046)
(0.037)
(0.035)
(0.022)
(0.066)
(0.172)
(0.092)
(0.099)
(0.101)
(0.574)
(1.122)
(1.339)
(1.116)
(1.896)
CASH
0.898���
0.802���
0.919���
0.762���
0.912���
1.626���
1.677���
1.968���
1.535���
1.520���
5.196���
3.450��
2.408��
5.552��
6.041���
(0.035)
(0.055)
(0.051)
(0.091)
(0.039)
(0.122)
(0.202)
(0.255)
(0.167)
(0.301)
(1.171)
(1.415)
(1.361)
(3.093)
(1.610)
PROF
0.038���
0.066���
0.023
0.072
0.026
0.038
0.131
0.074
0.133
0.001
�0.881�
�1.989���
0.403
�1.593
�0.233
(0.014)
(0.018)
(0.029)
(0.049)
(0.013)
(0.048)
(0.102)
(0.104)
(0.117)
(0.043)
(0.668)
(0.580)
(0.936)
(1.249)
(1.146)
LQ0.006
0.008
0.011
0.039
�0.002
0.018
0.101
�0.083
0.067
�0.234���
0.745
0.886�
0.502
0.708
�1.173
(0.012)
(0.010)
(0.036)
(0.040)
(0.055)
(0.035)
(0.092)
(0.081)
(0.071)
(0.087)
(0.751)
(0.631)
(0.984)
(1.142)
(1.152)
DIV
�0.016
�0.020
0.046
0.036
�0.016
�0.001
0.071
0.068
0.109
�0.019
�1.949��
�2.195�
�1.925��
�1.511
�1.793
(0.016)
(0.015)
(0.045)
0.061
(0.022)
(0.035)
(0.092)
(0.074)
(0.105)
(0.152)
(0.836)
(1.163)
(0.897)
(1.394)
(1.504)
Constant
�0.099���
�0.017
�0.051
�0.103
0.032
�0.267��
�0.144
�0.096
�0.254
�0.040
�3.045
0.434
�2.435
�4.437
�1.940
(0.037)
(0.015)
(0.081)
(0.074)
(0.075)
(0.132)
(0.220)
(0.129)
(0.235)
(0.135)
(1.981)
(3.137)
(1.390)
(3.418)
(2.041)
Observatio
ns1.519
549
307
417
246
1.519
549
307
417
246
1.519
549
307
417
246
WaldCh
i2(11)
5.904.05
1.584.80
1.664.73
747.86
18.600.48
707.64
247.90
5.559.76
374.01
1.374.83
113.10
38.55
189.31
92.85
368.94
Prob
>Ch
i20.0000
0.0000
0.0000
0.0000
0.0000
0.0000
0.0000
0.0000
0.0000
0.0000
0.0000
0.0001
0.0000
0.0000
0.0000
Sargan
test
0.1027
0.2537
0.6470
0.5644
0.2751
0.7910
0.7591
0.2535
0.4680
0.3940
0.3966
0.3518
0.2497
0.6808
0.7155
AR(1)
0.0009
0.0069
0.0008
0.0010
0.0777
0.0055
0.0089
0.1794
0.0046
0.0346
0.0001
0.0358
0.0061
0.0001
0.0591
AR(2)
0.7184
0.1431
0.8129
0.6527
0.3443
0.4993
0.4818
0.3154
0.2021
0.2503
0.4530
0.2486
0.6316
0.2719
0.1925
Note:Standard
deviationin
parentheses.
� p<0.1;
��p<0.05;
��� p
<0.01.
Source:O
wncompu
tatio
nusingStata14
software.
2182 J. G. MARDONES AND G. R. CUNEO

Table6.
Regression
results
ofno
n-linearrelatio
nshipof
performance
anddebt
with
estim
ations
onrand
omeffectsandrobu
stestim
ators.
ROA
ROE
Tobin’sQ
Variables
All
Brazil
Chile
Mexico
Peru
All
Brazil
Chile
Mexico
Peru
All
Brazil
Chile
Mexico
Peru
SD0,023
0,044
�0,087
0,018
0,002
0,157
0,109
�0,426�
0,231�
0,001
0,248
�0,855
5,015���
�0,091
2,804��
(0,026)
(0,050)
(0,059)
(0,045)
(0,025)
(0,115)
(0,248)
(0,262)
(0,122)
(0,198)
(0,763)
(1,314)
(1,511)
(1,286)
(1,195)
SD2
�0,069�
�0,138
0,196�
�0,072
�0,029
0,082
0,029
1,388���
�0,221
0,518
�0,292
1,662
�7,890���
0,511
�3,053�
(0,041)
(0,088)
(0,111)
(0,056)
(0,037)
(0,230)
(0,493)
(0,526)
(0,148)
(0,411)
(1,061)
(2,030)
(2,689)
(1,463)
(1,595)
LD�0
,052��
�0,105���
�0,001
�0,108���
�0,042
0,170��
0,384�
0,232��
�0,042
0,299���
0,964
1,339
0,312
1,321
�0,699
(0,023)
(0,033)
(0,057)
(0,034)
(0,030)
(0,080)
(0,219)
(0,094)
(0,091)
(0,101)
(0,694)
(1,693)
(0,767)
(1,1
31)
(1,346)
LD2
0,068
0,129��
0,070
0,085�
0,144�
0,038
�0,633
0,155
0,337��
�0,253
�1,356
�1,022
�0,264
�2,489�
3,497
(0,043)
(0,060)
(0,116)
(0,045)
(0,085)
(0,223)
(0,692)
(0,202)
(0,168)
(0,251)
(1,161)
2,827
(1,485)
(1,448)
(3,479)
GRO
0,003��
0,002
0,003
0,013���
0,003�
0,017���
0,021��
0,025�
0,040���
0,006
0,078
0,029
0,167
0,259
�0,065
(0,002)
(0,002)
(0,008)
(0,004)
(0,002)
(0,006)
(0,009)
(0,013)
(0,015)
(0,006)
(0,063)
(0,070)
(0,224)
(0,255)
(0,082)
SIZE
�0,003���
�0,001
0,000
0,000
�0,001
�0,003
�0,002
0,007�
�0,001
�0,007��
0,065
0,043
0,019
0,254��
0,040
(0,001)
(0,001)
(0,001)
(0,001)
(0,001)
(0,003)
(0,004)
(0,004)
(0,005)
(0,004)
(0,033)
(0,049)
(0,032)
(0,107)
(0,084)
TAN
�0,021���
�0,021�
0,006
�0,042���
�0,003
�0,022
�0,055
0,050�
�0,098���
0,035
�0,461�
�0,924���
0,203
�0,861�
�0,533
(0,007)
(0,011)
(0,005)
(0,011)
(0,009)
(0,021)
(0,045)
(0,030)
(0,035)
(0,024)
(0,205)
(0,269)
(0,242)
(0,458)
(0,518)
TAX
�0,002
0,000
0,003��
�0,013���
�0,002
�0,013
�0,001
0,002
�0,071���
0,011�
0,027��
0,029
�0,024��
0,050
0,046
(0,002)
(0,000)
(0,001)
(0,003)
(0,002)
(0,012)
(0,002)
(0,001)
(0,019)
(0,006)
(0,020)
(0,026)
(0,012)
(0,041)
(0,080)
RISK
0,021
0,022
�0,027
�0,095��
0,029
0,184
0,142
0,193
�0,198�
0,246��
0,260
1,503
�1,936
1,273
�0,326
(0,022)
(0,023)
(0,039)
(0,040)
(0,023)
(0,122)
(0,129)
(0,134)
(0,121)
(0,098)
(1,210)
(2,038)
(1,802)
(1,594)
(1,170)
INV
�0,045��
�0,107���
�0,030
0,008
�0,034�
�0,023
�0,136
�0,081
0,089
0,016
0,535
0,321
0,697
1,224�
0,145
(0,018)
(0,033)
(0,026)
(0,027)
(0,020)
(0,052)
(0,159)
(0,078)
(0,109)
(0,030)
(0,565)
(0,820)
(0,832)
(0,708)
(1,052)
CASH
0,843���
0,757���
0,954���
0,655���
0,934���
1,617���
1,514���
2,010���
1,418���
1,604���
4,057���
5,228���
2,825���
4,494���
4,267��
(0,034)
(0,052)
(0,043)
(0,051)
(0,023)
(0,149)
(0,093)
(0,244)
(0,159)
(0,174)
(0,836)
(1,494)
(0,953)
(1,492)
(1,705)
PROF
0,043���
0,062���
�0,027
0,076���
0,022�
0,061
0,147��
�0,039
0,099
�0,024
�0,694
�1,714
1,141��
�0,304
�0,322
(0,015)
(0,023)
(0,019)
(0,023)
(0,012)
(0,040)
(0,063)
(0,066)
(0,085)
(0,038)
(0,615)
(1,1
01)
(0,588)
(0,866)
(0,439)
LQ0,006
0,012
0,007
0,014
�0,011
�0,008
0,044
�0,057
0,151��
�0,144�
0,053
�0,403
�0,035
1,250��
0,130
(0,010)
(0,012)
(0,021)
(0,023)
(0,010)
(0,058)
(0,061)
(0,050)
(0,081)
(0,088)
(0,264)
(0,483)
(0,437)
(0,512)
(0,742)
DIV
0,008
�0,018�
0,039
0,060
0,010��
0,001
�0,032
0,071
0.023
0,001
�0,936���
�0,688��
�1,144��
�1,532���
�1,185���
(0,009)
(0,011)
(0,037)
(0,052)
(0,004)
(0,031)
(0,024)
(0,090)
(0,064)
(0,032)
(0,257)
(0,335)
(0,467)
(0,580)
(0,441)
Constant
0,034���
0,023�
0,000
0,024
0,010
�0,041
�0,045
�0,154���
�0,022
0,018
0,360
0,702
0,030
�2,173
0,429
(0,011)
(0,014)
(0,018)
(0,025)
(0,016)
(0,039)
(0,075)
(0,061)
(0,077)
(0,052)
(0,463)
(0,791)
(0,375)
(1,399)
(1,165)
Note:Standard
deviationin
parentheses.
� p<0.1;
��p<0.05;
��� p
<0.01.
Source:O
wncompu
tatio
nusingStata14
software.
ECONOMIC RESEARCH-EKONOMSKA ISTRAŽIVANJA 2183

Table 7 summarises (3) and shows the results for each of the measures of concen-tration of ownership of Chilean companies. There are mixed results. The effects ofownership concentration of the first main shareholder shows a negative relationshipof �0.008 and �0.046 when we use ROA and ROE, respectively. However, a there isa positive and significant effect of 0.622 when Tobin’s Q is used. With respect to thesecond largest shareholder, there is a negative but not significant effect of �0.018 and�0.984 when using ROA and Tobin’s Q, respectively. However, the ratio is positiveat 0.056 when the performance measure is ROE. Finally, the fifth largest shareholderhas a positive but not significant effect of 0.034, 0.006, and 0.651 when using ROA,ROE, and Tobin’s Q, respectively.
The results in this study in relation to the concentration of ownership and finan-cial performance are inconclusive when we use Tobin’s Q, which is in accordancewith Evans and Dion (2012), Goodstein, Gautam, and Boeker (1994), and Maquieira,Espinosa, and Vieito (2011), who showed a positive relationship between greater con-centration and financial performance. The other results are in accordance withPaniagua et al. (2018), who cannot establish causality between the ownership struc-ture and the company’s financial performance. Finally, these results do not supporthypothesis 2 for any performance measure.
5. Conclusions
The objective of this study was to estimate the effects of the variables that affect theprofitability of Brazilian, Chilean, Mexican, and Peruvian companies. Our results
Table 7. Regression results of ownership and financial performance with estimations on randomeffects and robust estimators.Variables ROA Standard deviation ROE Standard deviation Q Standard deviation
SD 0,089 0,073 0,206 0,160 7,391��� 2,075SD2 �0,118 0,138 0,084 0,318 �12,469��� 3,758LD �0,095�� 0,049 0,090 0,082 0,238 0,878LD2 0,212�� 0,088 0,169 0,154 �0,161 1,380GRO �0,009�� 0,004 0,010 0,007 0,226 0,146SIZE 0,000 0,001 0,003 0,003 0,020 0,037TAN �0,001 0,006 0,003 0,029 �0,024 0,285TAX 0,006��� 0,002 0,006��� 0,002 �0,119��� 0,017RISK �0,016 0,071 �0,099 0,159 1,013 2,887INV �0,047 0,043 �0,048 0,059 1,615�� 0,781CASH 0,882��� 0,053 1,531��� 0,093 4,913��� 1,225PROF 0,005 0,018 0,075 0,048 1,305�� 0,639LQ �0,025 0,017 �0,014 0,039 �0,444 0,564DIV 0,088 0,056 0,193�� 0,088 �0,5890� 0,328PROP1 �0,008 0,014 �0,046 0,037 0,622�� 0,320PROP3 �0,018 0,031 0,056 0,082 �0,984 0,891PROP5 0,034 0,025 0,006 0,056 0,651 0,694Constant �0,006 0,021 �0,125�� 0,058 �0,556 0,517Observations 185 185 185Wald Chi2 1341,99 3181,55 227,68Prob> Chi2 0,0000 0,0000 0,0000
Note: Standard deviation in parentheses.�p< 0.1;��p< 0.05;���p< 0.01.Source: Own computation using Stata 14 software.
2184 J. G. MARDONES AND G. R. CUNEO

provide relevant and updated information on the variables that affect performance.The results did not allow us to observe the effect of leverage on financial perform-ance, as there were mixed results between SD and LD.
This study could not establish the existence of a non-linear relationship betweenleverage and firm performance for all performance measures, although a non-linearrelationship for SD and LD was observed when considering ROA and Tobin’s Q.
This study found a positive relationship between company performance whit sizeand growth as proposed performance measures. Finally, this study observed no rela-tionship between firm performance and ownership structure, except for first largestshareholder with Tobin’s Q.
Some of the major limitations to this work identified are perhaps related to itslack of consideration strategic variables that enable establishing the effects of businessdiversification, entrepreneurship management, and innovation as key variables ofcompetitive advantage. As future research, we propose identification of strategic vari-ables that contribute to company performance. In addition, this study could beextended to other countries in South America.
The practical contribution of this study is as follows. We conclude that financialperformance is partially explained by and must be studied alongside such variables asthe business model, industry cycle, and competitive and corporate strategy in orderto strengthen analysis and quality of company performance.
Disclosure statement
The authors reports no conflicts of interest.
Funding
This work was partially funded by the Office of Research of the Universidad Cat�olica de laSant�ısima Concepci�on through Project DIN 01-2006.
References
Abor, J. (2005). The effect of capital structure on profitability: An empirical analysis of listedfirms in Ghana. The Journal of Risk Finance, 6(5), 438–445. doi:10.1108/15265940510633505
Arellano, M., & Bover, O. (1995). Another look at the instrumental variable estimation of error-components models. Journal of Econometrics, 68(1), 29–51. doi:10.1016/0304-4076(94)01642-D
Audretsch, D. B., Castrogiovanni, G. J., Ribeiro, D., & Roig, S. (2005). Linking entrepreneur-ship and management: Welcome to the International Entrepreneurship and ManagementJournal. The International Entrepreneurship and Management Journal, 1(1), 5–7. doi:10.1007/s11365-005-6672-4
Ba~nos-Caballero, S., Garc�ıa-Teruel, P. J., & Mart�ınez-Solano, P. (2014). Working capital man-agement, corporate performance, and financial constraints. Journal of Business Research,67(3), 332–338. doi:10.1016/j.jbusres.2013.01.016
Berman, S., Wicks, A., Kotha, S., & Jones, T. M. (1999). Does stakeholder of orientation mat-ter? The relationship between stakeholder management models and firm financial perform-ance. Academy of Management Journal, 42(5), 488–506. doi:10.5465/256972
Borenstein, M., Hedges, L. V., Higgins, J. P. T., & Rothstein, H. R. (2010). A basic introduc-tion to fixed-effect and random-effects models for meta-analysis. Research SynthesisMethods, 1(2), 97. doi:10.1002/jrsm.12
ECONOMIC RESEARCH-EKONOMSKA ISTRAŽIVANJA 2185

Bushee, B. J. (1998). The influence of institutional investors on myopic R&D investmentbehaviour. The Accounting Review, 73(3), 305–333.
Chiang, Y. H., Chan, P. C. A., & Hui, C. M. E. (2002). Capital structure and profitability ofthe property and construction sectors in Hong Kong. Journal of Property Investment andFinance, 20(6), 434–454.
Cohn, J. B., Mills, L. F., & Towery, E. M. (2014). The evolution of capital structure and operat-ing performance after leveraged buyouts: Evidence from U.S. corporate tax returns. Journalof Financial Economics, 111(2), 469–494. doi:10.1016/j.jfineco.2013.11.007
Danis, A., Rettl, D. A., & Whited, T. M. (2014). Refinancing, profitability, and capital struc-ture. Journal of Financial Economics, 114(3), 424–443. doi:10.1016/j.jfineco.2014.07.010
De Abreu Dos Reis, C. R., Sastre-Castillo, M. A., & Roig-Dob�on, S. (2007). Diversity and busi-ness performance: 50 years of research. Service Business, 1(4), 257–274. doi:10.1007/s11628-007-0022-2
Demsetz, H., & Lehn, K. (1985). The structure of corporate ownership: causes and consequen-ces. Journal of Political Economy, 93(6), 1155–1177. doi:10.1086/261354
Dumont, R., & Svensson, R. (2014). Capital structure and firm performance—a study ofSwedish public companies (Unpublished Bachelor’s Dissertation). Business AdministrationAccounting.
Espinosa, C., Maquieira, V. C., Vieito, J. P., & Gonz�alez, M. (2012). Capital structures in devel-oping countries: The Latin American case. Investigation Econ�omica, 71(282), 35–54.
Evans, C. R., & Dion, K. L. (2012). Group cohesion and performance: A meta-analysis. SmallGroup Research, 43(6), 690–701. doi:10.1177/1046496412468074
Fama, E. F., & French, K. R. (1993). Common risk factors in the returns on stock and bonds.Journal of Financial Economics, 33(1), 3–56. doi:10.1016/0304-405X(93)90023-5
Frank, M. Z., & Goyal, V. K. (2009). Capital structure decisions: Which factors are reliablyimportant? Financial Management, 38(1), 1–37. doi:10.1111/j.1755-053X.2009.01026.x
Gill, A., Biger, N., & Mathur, N. (2011). The effect of capital structure on profitability:Evidence from the United States. International Journal of Management, 28(4), 3–15.
Goddard, J., Tavakoli, M., & Wilson, J. O. S. (2005). Determinants of profitability in Europeanmanufacturing and services: Evidence from a dynamic panel model. Applied FinancialEconomics, 15(18), 1269–1282. doi:10.1080/09603100500387139
Goodstein, J., Gautam, K., & Boeker, W. (1994). The effect of board size and diversity on stra-tegic change. Strategic Management Journal, 15(3), 241–250. doi:10.1002/smj.4250150305
Grossman, S., & Hart, O. (1983). An analysis of the principal–agent problem. Econometrica,51(1), 7–45. doi:10.2307/1912246
Gupta, M. (1969). The effect of size, growth, and industry on the financial structure of manu-facturing companies. The Journal of Finance, 24(3), 517–529. doi:10.1111/j.1540-6261.1969.tb00370.x
Harris, M., & Raviv, A. (1988). Corporate governance: Voting rights and majority rules.Journal of Financial Economics, 20, 203–235. doi:10.1016/0304-405X(88)90045-1
Hart, O., & Moore, J. (1994). A theory of debt based on the inalienability of human capital.The Quarterly Journal of Economics, 109(4), 841–879. doi:10.2307/2118350
Hawawini, G., Subramanian, V., & Verdin, P. (2004). The home country in the age of global-ization: How much does it matter for firm performance?. Journal of World Business, 39(2),121–135. doi:10.1016/j.jwb.2003.08.012
He, Q., & Rui, O. (2016). Ownership structure and insider trading: Evidence from China.Journal of Business Ethics, 134(4), 553–574. doi:10.1007/s10551-014-2384-4
Idol, C. (1978). The financial determinants of systematic risk. Baylor Business Studies, 9(3),55–69.
Iswatia, S., & Anshoria, M. (2007). The influence of intellectual capital to financial perform-ance at insurance companies in Jakarta Stock Exchange (JSE). In Proceedings of the 13thAsia Pacific Management Conference. Melbourne, Australia
Jensen, M. C. (1986). Agency costs of free cash flow, corporate finance, and takeovers.American Economic Review, 76, 323–329.
2186 J. G. MARDONES AND G. R. CUNEO
Kester, W. C. (1986). Capital and ownership structure: A comparison of United States andJapanese manufacturing corporations. Financial Management, 15(1), 5–16. doi:10.2307/3665273
Khamis, R., Hamdan, A. M., & Elali, W. (2015). The relationship between ownership structuredimensions and corporate performance: Evidence from Bahrain. Australasian Accounting,Business and Finance Journal, 9(4), 38–56. doi:10.14453/aabfj.v9i4.4
Klapper, L., & Love, I. (2004). Corporate governance, investor protection, and performance inemerging markets. Journal of Corporate Finance, 10(5), 703–728.
Konijn, S. J. J., Kr€aussl, R., & Lucas, A. (2011). Blockholder dispersion and firm value. Journalof Corporate Finance, 17(5), 1330–1339. doi:10.1016/j.jcorpfin.2011.06.005
Kraus, A., & Litzenberger, R. H. (1973). A state-preference model of optimal financial leverage.The Journal of Finance, 28(4), 911–922. doi:10.2307/2978343
Kumar, J. (2003). Does ownership structure influence firm value? Evidence from India. EFMA2004 Basel Meeting Paper.
Kyvik, O. (2018). The global mindset: a must for international innovation and entrepreneur-ship. International Entrepreneurship and Management Journal, 14(2), 309–327. doi:10.1007/s11365-018-0505-8
Labra, R., & Torrecillas, C. (2014). Estimating dynamic panel data. A practical approach toperform long panels. Revista Colombiana de Estad�ıstica, 41, 31–52. doi:10.15446/rce.v41n1.61885
Liargovas, P., & Skandalis, K. (2008). Factor affecting firms’ financial performance: The case ofGreece. Working Paper No. 12, Department of Economics, University of Peloponnese.
Logue, L., & Merville, J. (1972). Financial policy and market expectations. FinancialManagement, 1(2), 37. doi:10.2307/3665142
Mainelli, M., & Giffords, B. (2010). Size matters: Risk and scale. The Journal of Risk Finance,11(3), 344–348. doi:10.1108/15265941011043701
Maquieira, C., Espinosa, C., & Vieito, J. (2011). Corporate performance and ownership struc-ture: Empirical evidence for Chile. Quarterly Journal of Finance and Accounting, 50(1),75–96.
Margaritis, D., & Psillaki, M. (2010). Capital structure, equity ownership and firm perform-ance. Journal of Banking & Finance, 34(3), 621–632. doi:10.1016/j.jbankfin.2009.08.023
Maury, B., & Pajuste, A. (2006). Family ownership and firm performance: Empirical evidencefrom Western European corporations. Journal of Corporate Finance, 12(2), 321–341. doi:10.1016/j.jcorpfin.2005.02.002
Modigliani, F., & Miller, M. (1958). The cost of capital, corporation finance and the theory ofinvestment. American Economic Review, 48, 655–669.
Modigliani, F., & Miller, M. (1963). Corporate income taxes and the cost of capital: A correc-tion. American Economic Review, 53, 433–443.
Mohamad, N. E. A. B., & Abdullah, F. N. B. A. (2012). Reviewing relationship between capitalstructure and firm’s performance in Malaysia. International Journal of Advances inManagement and Economics, 1(4), 151–156.
Moyer, R. C., McGuigan, J. R., & Kretlow, W. J. (2001). Contemporary financial management(8th ed.). Cincinnati, OH: South-Western College Publishing.
Myers, S. (1984). The capital structure puzzle. The Journal of Finance, 39(3), 575–592. doi:10.2307/2327916
Myers, S., & Majluf, N. (1984). Corporate financing and investment decisions when firms haveinformation that investors do not have. Journal of Financial Economics, 13(2), 187–221. doi:10.1016/0304-405X(84)90023-0
Myers, S., & Rajan, R. (1998). The paradox of liquidity. The Quarterly Journal of Economics,113(3), 733–771. doi:10.1162/003355398555739
Nawaz, A., Ali, R., & Naseem, M. A. (2011). Relationship between capital structure and firmsperformance: A case of textile sector in Pakistan. Global Business and ManagementResearch: An International Journal, 3(3–4), 270–275.
ECONOMIC RESEARCH-EKONOMSKA ISTRAŽIVANJA 2187
Olorunfemi, S., & David, D. F. (2010). Capital structure and corporate performance in theNigeria petroleum industry. Journal of Mathematics and Statistics, 6(2), 168–173.
Omondi, M. M., & Muturi, W. (2013). Factors affecting the financial performance of listedcompanies at the Nairobi Securities Exchange in Kenya. Research Journal of Finance andAccounting, 4(15), 99–105.
O’Neill, H. M., Saunders, C. B., & McCarthy, A. D. (1989). Board members, corporate socialresponsiveness and profitability: Are tradeoffs necessary? Journal of Business Ethics, 8(5),353–357. doi:10.1007/BF00381726
Palacios-Marqu�es, D., Roig-Dob�on, S., & Comeig, I. (2017). Background factors to innovationperformance: Results of an empirical study using fsQCA methodology. Quality & Quantity,51(5), 1939–1953. doi:10.1007/s11135-016-0414-2
Paniagua, J., Rivelles, R., & Sapena, J. (2018). Corporate governance and financial performance:The role of ownership and board structure. Journal of Business Research, 89, 229–234. doi:10.1016/j.jbusres.2018.01.060
Park, K., & Jang, S. S. (2013). Capital structure, free cash flow, diversification and firm per-formance: A holistic analysis. International Journal of Hospitality Management, 33, 51–63.doi:10.1016/j.ijhm.2013.01.007
Perrini, F., Rossi, G., & Rovetta, B. (2008). Does ownership structure affect performance?Evidence from the Italian market. Corporate Governance: An International Review, 16(4),312–325. doi:10.1111/j.1467-8683.2008.00695.x
Phuong, T., & Bich, T. (2017). Capital structure and firm performance: Empirical evidence froma small transition country. Research in International Business and Finance, 42, 710–726.
Pound, J. (1988). Proxy contests and the efficiency of shareholder oversight. Journal ofFinancial Economics, 20, 237–265. doi:10.1016/0304-405X(88)90046-3
Rajan, R., & Zingales, Z. (1995). What do we know about capital structure? Some evidencefrom international data. The Journal of Finance, 50(5), 1421–1460. doi:10.2307/2329322
Reilly, F. K., & Brown, K. C. (2006). Investment analysis and portfolio management (8th ed.).Mason, OH: Thomson Higher Education.
Rico, P., & Cabrer-Borr�as, B. (2018). Necessity and opportunity entrepreneurs: Survival factors.International Entrepreneurship and Management Journal, 14(2), 249–264. doi:10.1007/s11365-018-0504-9
Rumelt, R. P. (1991). How much does industry matter? Strategic Management Journal, 12(3),167–185. doi:10.1002/smj.4250120302
Schmalensee, R. (1989). Intra-industry profitability differences in US manufacturing:1953–1983. The Journal of Industrial Economics, 37(4), 337–357. doi:10.2307/2098372
Seetanah, B., Seetah, K., Appadu, K., & Padachi, K. (2014). Capital structure and firm performance:Evidence from an emerging economy. The Business & Management Review, 4(4), 185–196.
Simerly, R., & Li, M. (2000). Environmental dynamism, capital structure and performance: Atheoretical integration and an empirical test. Strategic Management Journal, 21(1), 31–49.doi:10.1002/(SICI)1097-0266(200001)21:1<31::AID-SMJ76>3.3.CO;2-K
Vargas, A. (2014). Estructura de capital �optima en presencia de costos de dificultades finan-cieras. Investigaci�on & Desarrollo, 1(14), 44–65.
Wooldridge, J. M. (2002). Econometric analysis of cross section and panel data. Cambridge,MA: MIT Press.
Wu, M. (2006). Corporate social performance, corporate financial performance, and firm size:A meta-analysis. Journal of American Academy of Business, 8(1), 163–171.
Yaffee, R. (2005). Primer for panel data analysis. Connect: Information Technology at NYU.Zajac, E. J. (1990). CEO selection, succession, compensation and firm performance: A theoret-
ical integration and empirical analysis? Strategic Management Journal, 11(3), 217–230. doi:10.1002/smj.4250110304
Zeitun, R., & Tian, G. (2007). Capital structure and corporate performance: Evidence fromJordan. Australasian Accounting, Business and Finance Journal, 1(4), 40–53. doi:10.14453/aabfj.v1i4.3
2188 J. G. MARDONES AND G. R. CUNEO