capital markets and colonial institutions in china -...
TRANSCRIPT
Capital Markets and Colonial Institutions in China
Wolfgang Keller and Carol H. Shiue
Stanford and Colorado
Hong Kong Monetary Authority, May 28 2014

China’s Treaty Port Era (1842-1943) A political turning point in China’s history after her
ports of trade were opened (by “treaty”) after the Opium War (1840-42)
New foreign presence in terms of Military occupation Legal system: foreign courts Customs system
Diverging views on impact of foreign presence China’s view (official textbook): Destructive; postponed
China’s development Other views more nuanced: Learning (Feuerwerker 1983),
increased population growth (Jia 2013) Overall, foreign presence had no substantial effect on
China as a whole (Fairbanks; Feuerwerker; Rawski)

Question of the paper
Did the new foreign presence affect capital markets? As evidenced by the price for capital
Present evidence on changes in price of capital in China caused by the new foreign presence Mechanism?
Motivation: Low price of capital as indicator of
secure contractual institutions, spurring investment North and Weingast (1989); also DeLong and Shleifer
1993, Acemoglu, Johnson, and Robinson (2001)

Answers
Foreign presence reduced price of capital by about 5-10% In areas of up to 400 kilometers away from ports
Legal system contributed to it, but customs more important

0.04
0.045
0.05
0.055
0.06
0.065
t-3 t-2 t-1 t+1 t+2 t+3
Cost of Capital and Foreign Presence

Institutions & investment: a framework
Households own all factors, capital (K), labor (L), and land (T), which they rent out to firms
Price at which hh rent out K with competitive markets, depreciation rate 𝛿, and a θ percent chance of losing property of K due to theft is
𝑝𝐾 = 𝑟⏟𝑀𝑀
𝑜𝑜 𝐶𝐶𝐶𝐶𝐶𝐶𝐶
+ 𝛿⏟𝐷𝐷𝐶𝐷𝐷−𝑐𝐶𝐶𝐶𝐶𝑜𝑐
+ 𝜃⏟𝑇𝑇𝐷𝑜𝐶
Lower 𝜃 translates into lower costs of capital to firms
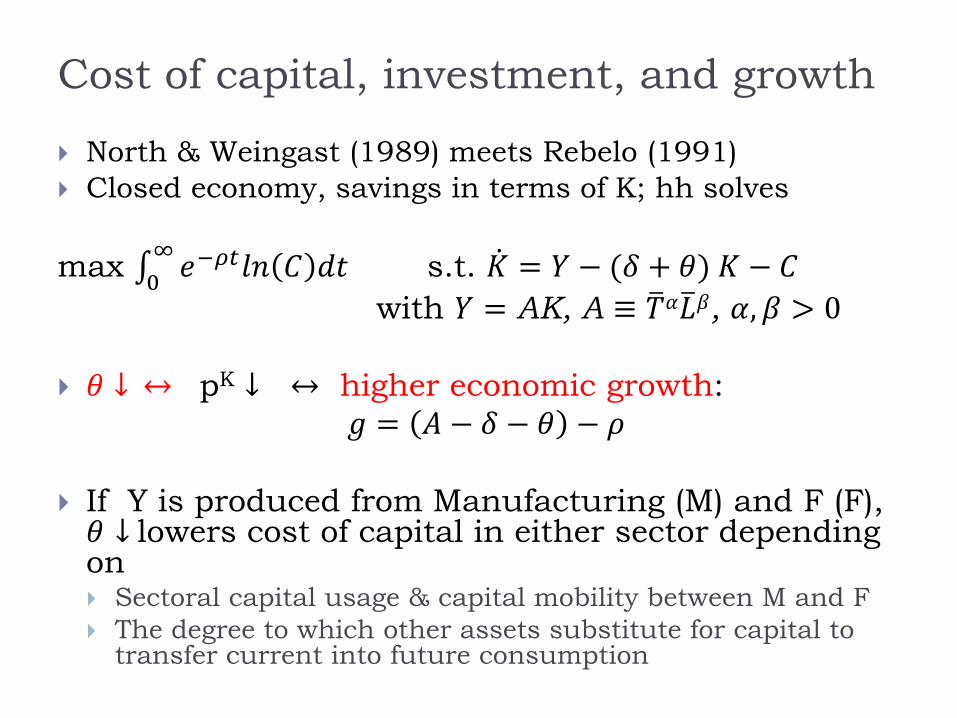
Cost of capital, investment, and growth
North & Weingast (1989) meets Rebelo (1991) Closed economy, savings in terms of K; hh solves max ∫ 𝑒−𝜌𝐶𝑙𝑙 𝐶 𝑑𝑑 ∞
0 s.t. �̇� = 𝑌 − (𝛿 + 𝜃) 𝐾 − 𝐶 with 𝑌 = AK, A ≡ 𝑇�𝛼𝐿�𝛽, 𝛼,𝛽 > 0 𝜃 ↓ ↔ pK ↓ ↔ higher economic growth:
𝑔 = 𝐴 − 𝛿 − 𝜃 − 𝜌
If Y is produced from Manufacturing (M) and F (F), 𝜃 ↓ lowers cost of capital in either sector depending on Sectoral capital usage & capital mobility between M and F The degree to which other assets substitute for capital to
transfer current into future consumption
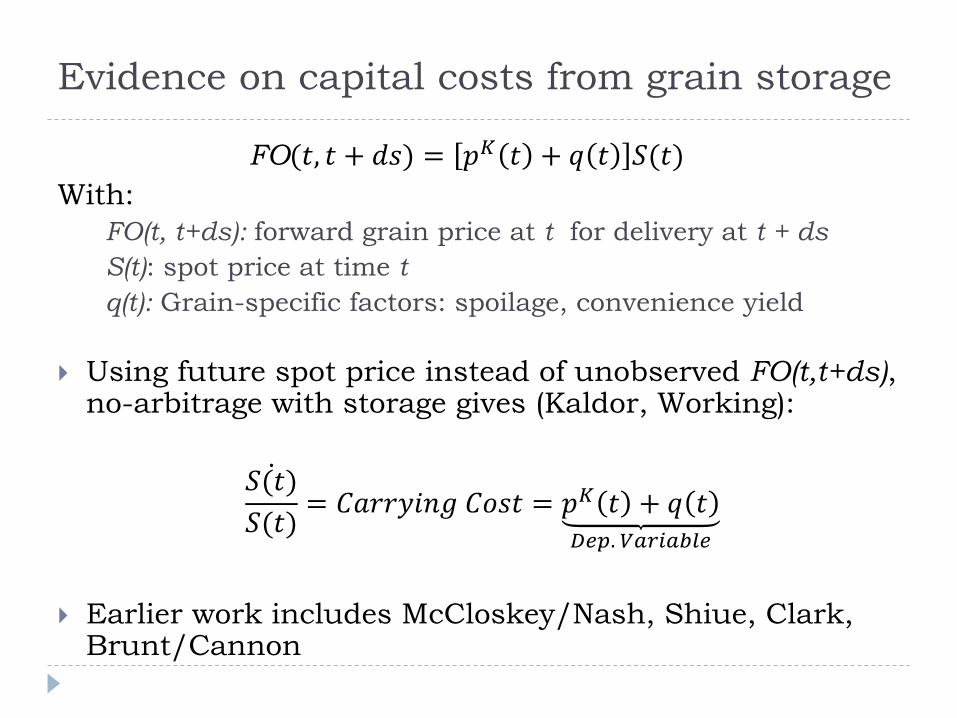
Evidence on capital costs from grain storage
FO(𝑑, 𝑑 + 𝑑𝑑) = 𝑝𝐾 𝑑 + 𝑞 𝑑 𝑆(𝑑) With:
FO(t, t+ds): forward grain price at t for delivery at t + ds S(t): spot price at time t q(t): Grain-specific factors: spoilage, convenience yield
Using future spot price instead of unobserved FO(t,t+ds), no-arbitrage with storage gives (Kaldor, Working):
𝑆(𝑑)̇𝑆(𝑑)
= 𝐶𝐶𝑟𝑟𝐶𝐶𝑙𝑔 𝐶𝐶𝑑𝑑 = 𝑝𝐾 𝑑 + 𝑞 𝑑𝐷𝐷𝐶. 𝑉𝐶𝐷𝐶𝐶𝑉𝐶𝐷
Earlier work includes McCloskey/Nash, Shiue, Clark,
Brunt/Cannon

1
1.1
1.2
1.3
1.4
1.5
1.6
1821
1825
1830
1835
1840
1845
1850
1855
1860
Grain prices over time Prefecture in Guangxi province, First-grade rice
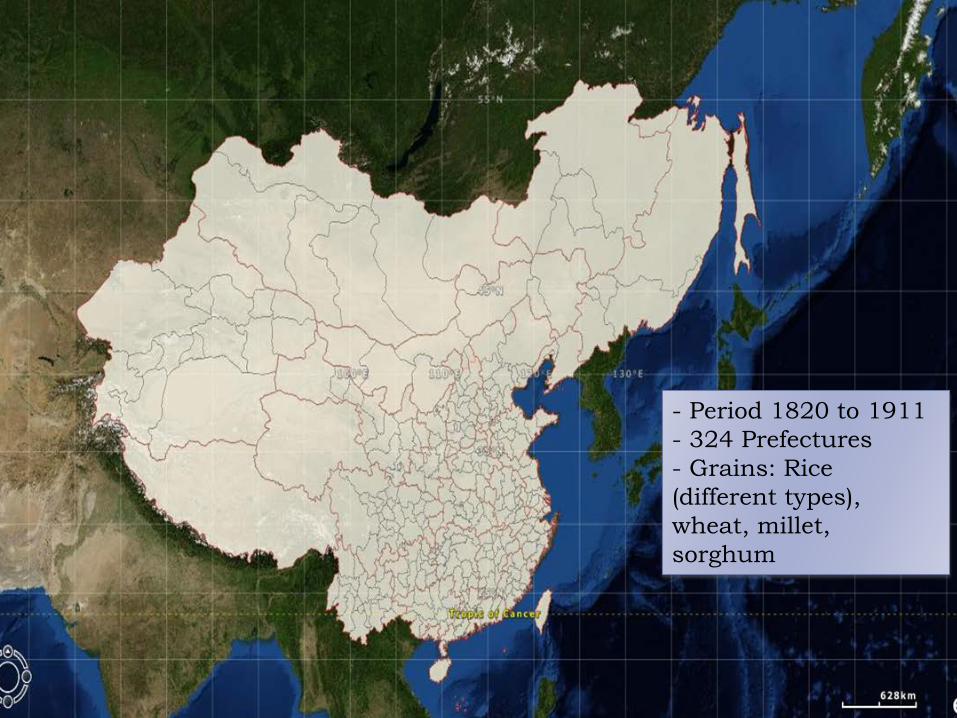
- Period 1820 to 1911 - 324 Prefectures - Grains: Rice (different types), wheat, millet, sorghum
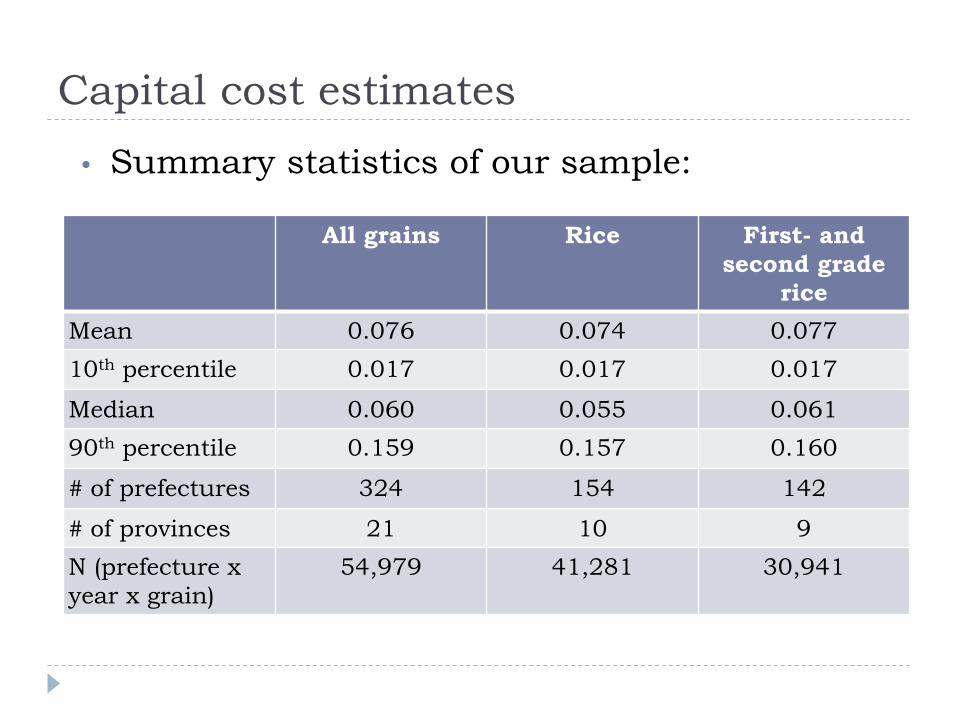
Capital cost estimates
All grains Rice First- and second grade
rice Mean 0.076 0.074 0.077 10th percentile 0.017 0.017 0.017
Median 0.060 0.055 0.061 90th percentile 0.159 0.157 0.160
# of prefectures 324 154 142
# of provinces 21 10 9 N (prefecture x year x grain)
54,979 41,281 30,941
• Summary statistics of our sample:

Foreign presence and carrying cost of capital
All Grains All Rice 1st and 2nd Grade Rice
1st and 2nd Grade Rice
No Shanghai Foreign -0.093**
(0.010) -0.054** (0.021)
-0.064** (0.019)
-0.067** (0.024)
N 54,979 41,201 30,941 30,790
Clusters 1,778 982 731 725 s.e. clustered by prefecture x grain; **(*) p<1% (p<5%)
controlstrendXyeartgraingprefectureieXForeignCostCarry igtigtitigt
:;;;
'_ln 1
===
++++= ββββ
Foreign ≝ 1 if either Occupation or Customs or Court in prefecture at time t, 0 otherwise
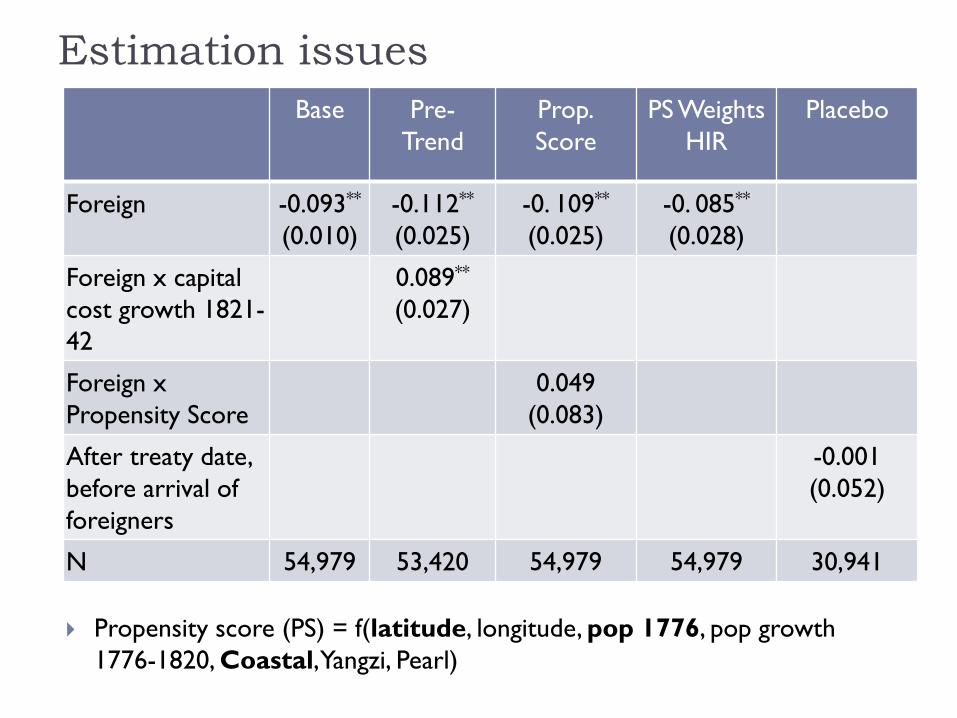
Estimation issues Base Pre-
Trend Prop. Score
PS Weights HIR
Placebo
Foreign -0.093** (0.010)
-0.112** (0.025)
-0. 109** (0.025)
-0. 085** (0.028)
Foreign x capital cost growth 1821-42
0.089** (0.027)
Foreign x Propensity Score
0.049 (0.083)
After treaty date, before arrival of foreigners
-0.001 (0.052)
N 54,979 53,420 54,979 54,979 30,941
Propensity score (PS) = f(latitude, longitude, pop 1776, pop growth 1776-1820, Coastal, Yangzi, Pearl)
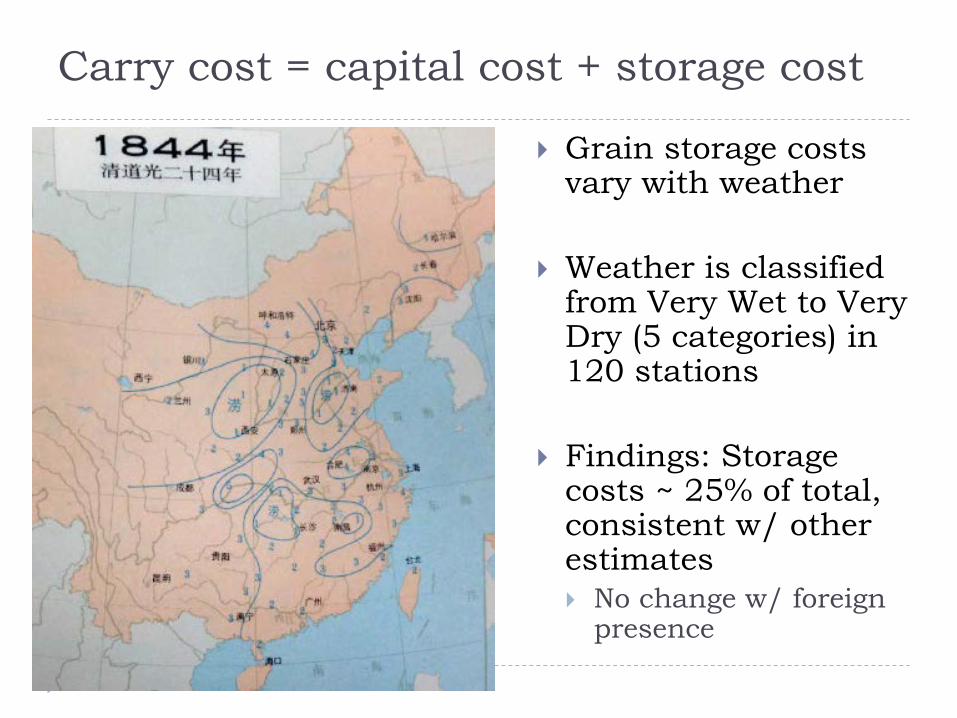
Carry cost = capital cost + storage cost
Grain storage costs vary with weather
Weather is classified from Very Wet to Very Dry (5 categories) in 120 stations
Findings: Storage costs ~ 25% of total, consistent w/ other estimates No change w/ foreign
presence
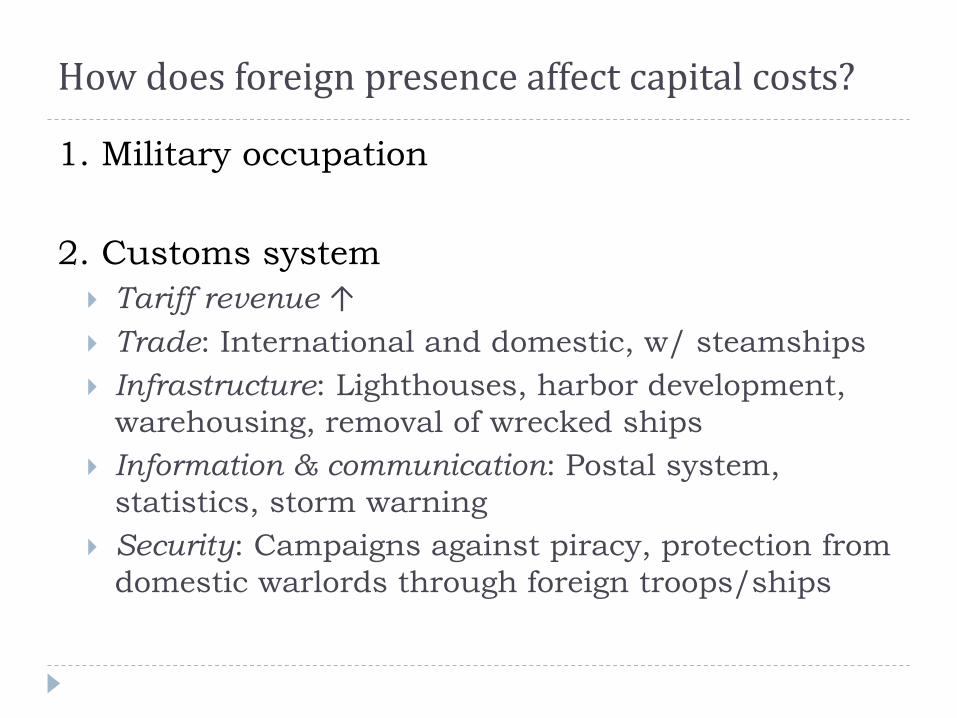
How does foreign presence affect capital costs?
1. Military occupation
2. Customs system Tariff revenue ↑ Trade: International and domestic, w/ steamships Infrastructure: Lighthouses, harbor development,
warehousing, removal of wrecked ships Information & communication: Postal system,
statistics, storm warning Security: Campaigns against piracy, protection from
domestic warlords through foreign troops/ships

Customs operations in treaty ports
First opening in 1854 (Shanghai)
Last opening in 1907
Total of 46 locations
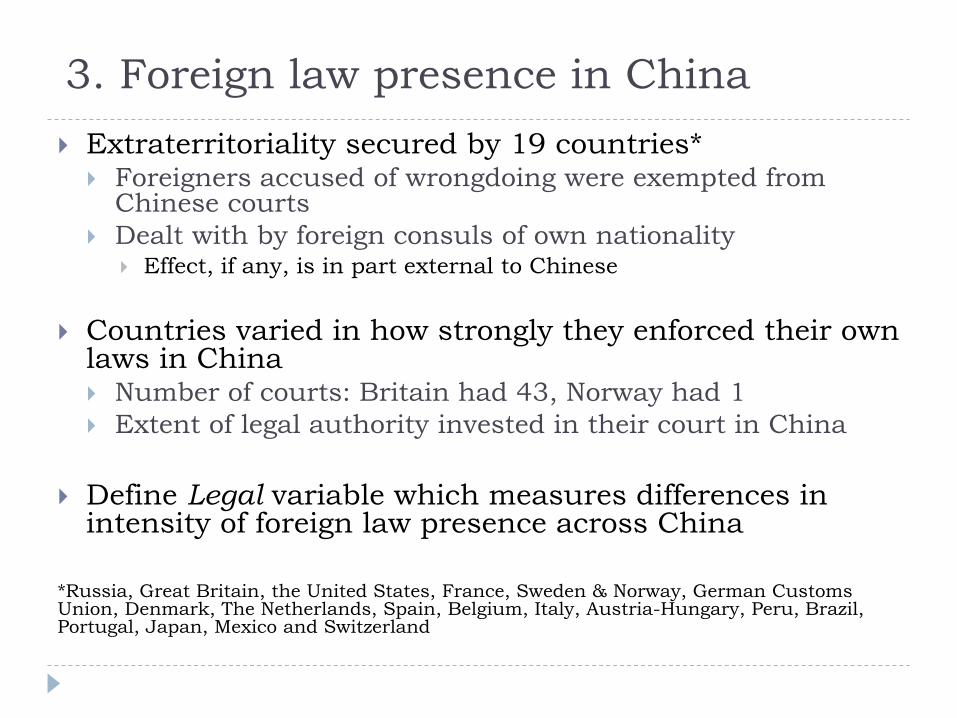
3. Foreign law presence in China Extraterritoriality secured by 19 countries*
Foreigners accused of wrongdoing were exempted from Chinese courts
Dealt with by foreign consuls of own nationality Effect, if any, is in part external to Chinese
Countries varied in how strongly they enforced their own laws in China Number of courts: Britain had 43, Norway had 1 Extent of legal authority invested in their court in China
Define Legal variable which measures differences in intensity of foreign law presence across China
*Russia, Great Britain, the United States, France, Sweden & Norway, German Customs Union, Denmark, The Netherlands, Spain, Belgium, Italy, Austria-Hungary, Peru, Brazil, Portugal, Japan, Mexico and Switzerland

Box 2, continued
[Box 2 continues.J
I
L
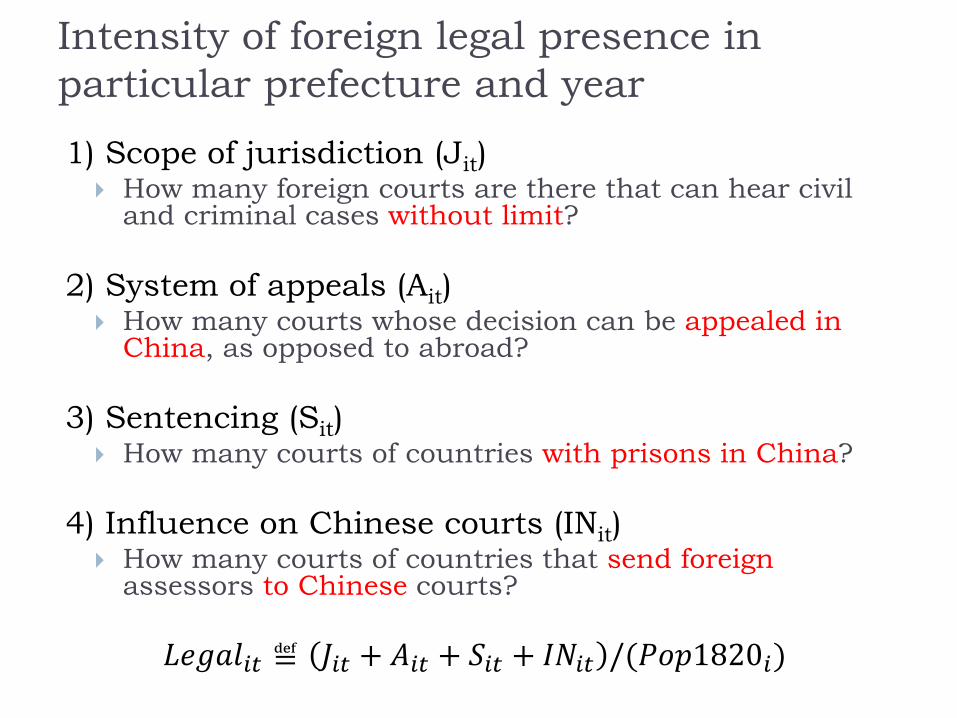
Intensity of foreign legal presence in particular prefecture and year
1) Scope of jurisdiction (Jit) How many foreign courts are there that can hear civil
and criminal cases without limit?
2) System of appeals (Ait) How many courts whose decision can be appealed in
China, as opposed to abroad?
3) Sentencing (Sit) How many courts of countries with prisons in China?
4) Influence on Chinese courts (INit) How many courts of countries that send foreign
assessors to Chinese courts?
𝐿𝑒𝑔𝐶𝑙𝐶𝐶 ≝ 𝐽𝐶𝐶 + 𝐴𝐶𝐶 + 𝑆𝐶𝐶 + 𝐼𝐼𝐶𝐶 /(𝑃𝐶𝑝𝑃𝑃𝑃𝑃𝐶)
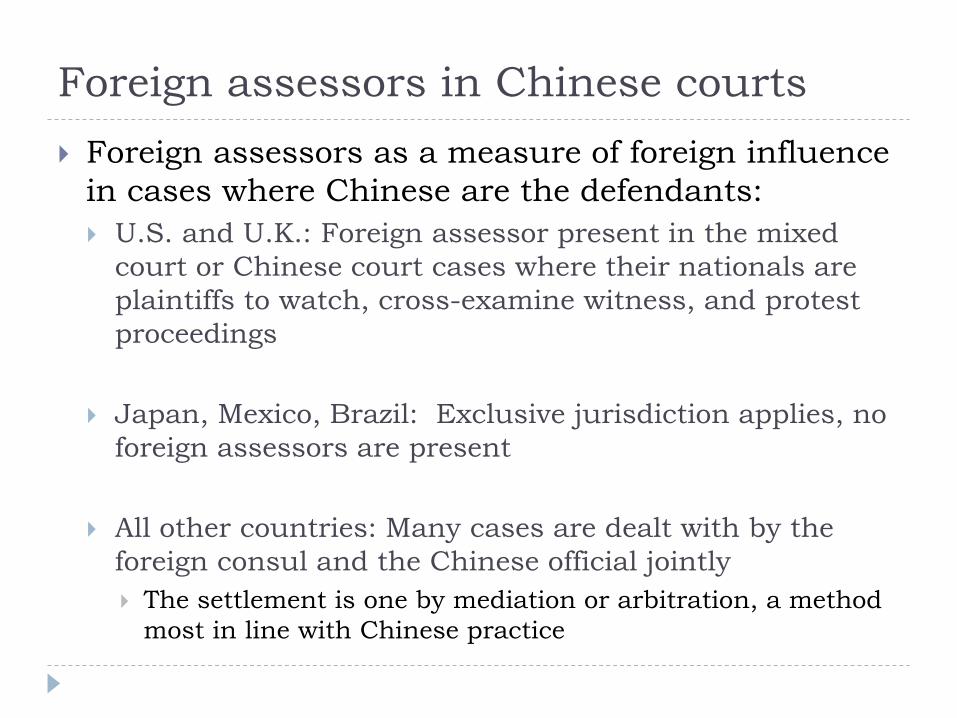
Foreign assessors in Chinese courts Foreign assessors as a measure of foreign influence
in cases where Chinese are the defendants: U.S. and U.K.: Foreign assessor present in the mixed
court or Chinese court cases where their nationals are plaintiffs to watch, cross-examine witness, and protest proceedings
Japan, Mexico, Brazil: Exclusive jurisdiction applies, no foreign assessors are present
All other countries: Many cases are dealt with by the
foreign consul and the Chinese official jointly The settlement is one by mediation or arbitration, a method
most in line with Chinese practice
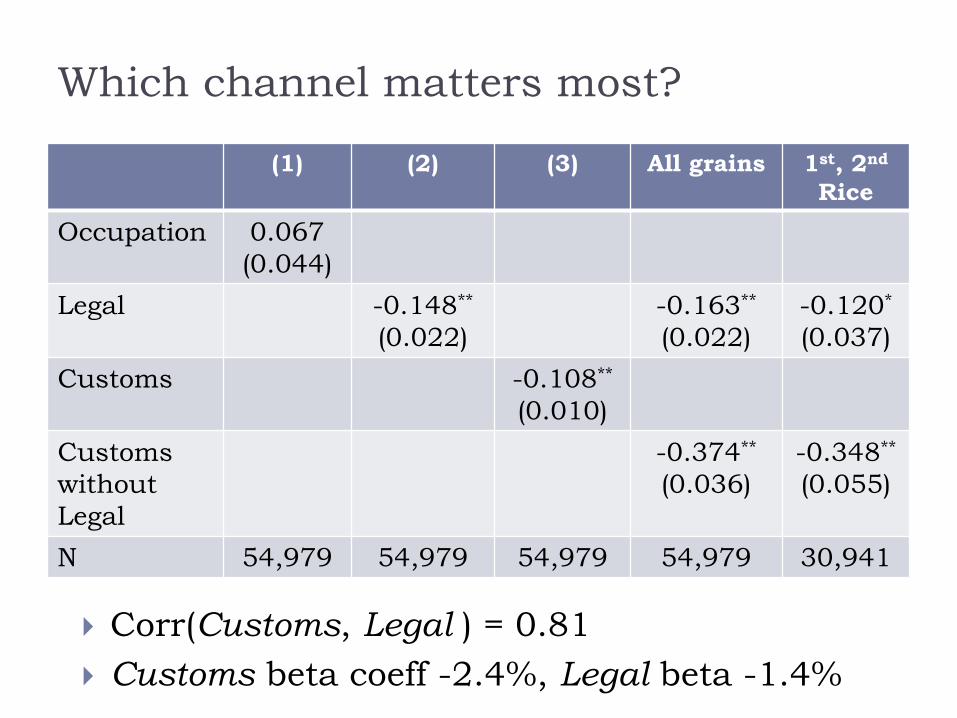
Which channel matters most?
Corr(Customs, Legal ) = 0.81 Customs beta coeff -2.4%, Legal beta -1.4%
(1) (2) (3) All grains 1st, 2nd Rice
Occupation 0.067 (0.044)
Legal -0.148**
(0.022) -0.163**
(0.022) -0.120*
(0.037) Customs -0.108**
(0.010) Customs without Legal
-0.374**
(0.036) -0.348**
(0.055)
N 54,979 54,979 54,979 54,979 30,941

Spillovers: Do capital costs fall in prefectures that do not have customs operations themselves but that are geographically nearby customs stations?
𝐶𝐶𝑟𝑟𝐶𝐶𝐶𝑑𝑑𝐶𝑖𝐶 = 𝛽1𝐶𝐶𝑑𝑑𝐶𝐶𝑑𝐶𝐶 + 𝜸′𝑿 + 𝑒𝐶𝑖𝐶+𝛽2 ∑ 𝐼𝐶𝑖 0 < 𝐷𝐶𝑑𝑑𝐶𝑖 ≤ 𝑃𝑃𝑃 𝐶𝐶𝑑𝑑𝐶𝐶𝑑𝑖𝐶𝑖
+𝛽3 ∑ 𝐼𝐶𝑖 𝑃𝑃𝑃 < 𝐷𝐶𝑑𝑑𝐶𝑖 ≤ 400 𝐶𝐶𝑑𝑑𝐶𝐶𝑑𝑖𝐶𝑖
We estimated the effect of foreign presence in prefecture i on capital costs in prefecture i :
𝐶𝐶𝑟𝑟𝐶𝐶𝐶𝑑𝑑𝐶𝑖𝐶 = 𝛽1𝐶𝐶𝑑𝑑𝐶𝐶𝑑𝐶𝐶 + 𝜸′𝑿 + 𝑒𝐶𝑖𝐶
Spillovers from foreign presence
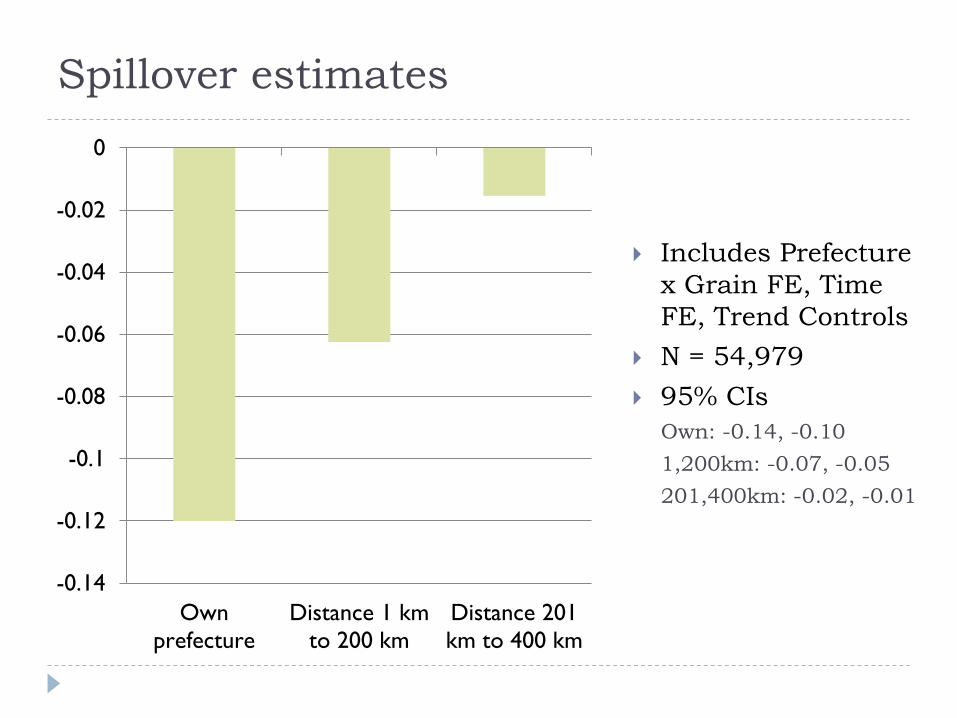
Spillover estimates
Includes Prefecture x Grain FE, Time FE, Trend Controls
N = 54,979 95% CIs
Own: -0.14, -0.10 1,200km: -0.07, -0.05 201,400km: -0.02, -0.01
-0.14
-0.12
-0.1
-0.08
-0.06
-0.04
-0.02
0
Ownprefecture
Distance 1 kmto 200 km
Distance 201km to 400 km
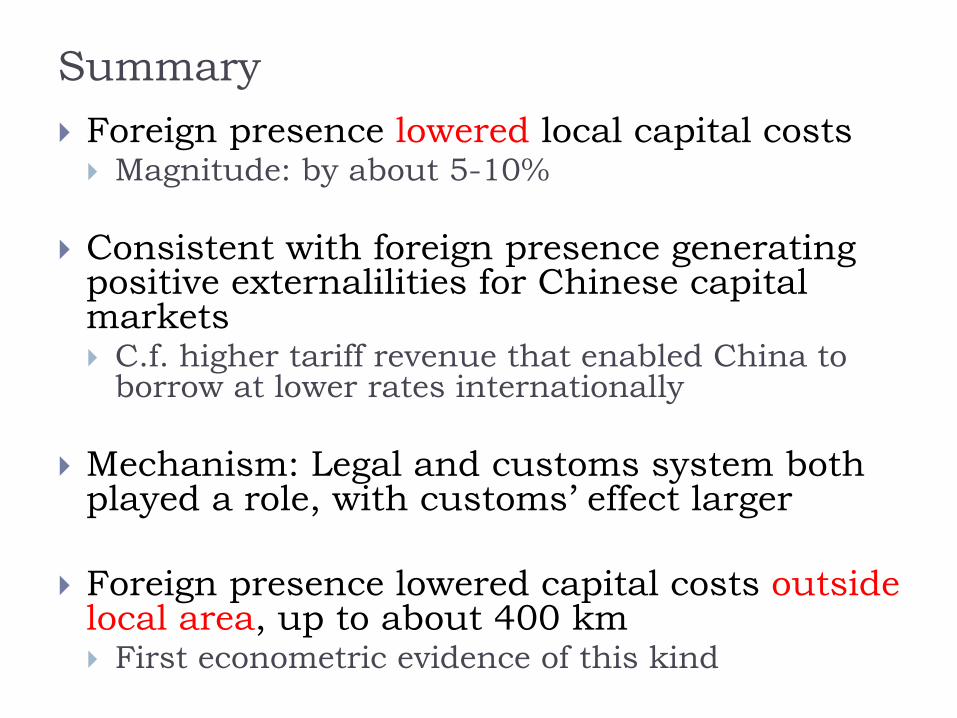
Summary Foreign presence lowered local capital costs Magnitude: by about 5-10%
Consistent with foreign presence generating
positive externalilities for Chinese capital markets C.f. higher tariff revenue that enabled China to
borrow at lower rates internationally
Mechanism: Legal and customs system both played a role, with customs’ effect larger
Foreign presence lowered capital costs outside local area, up to about 400 km First econometric evidence of this kind


Foreign presence and trade
(1) (2) (3) (4)
Customs -0.108** -0.059+ -0.112** 0.024
Customs x Coastal
-0.092+
Customs x Yangzi River
0.034
Customs x Water Access
-0.158**
With some variation, the Customs effect is closely related to water access and ports

Estimating the role of storage costs
(1) (2) (3) (4) Foreign -0.028**
(0.006) -0.028** (0.006)
-0.027** (0.006)
-0.029** (0.006)
Very Wet 0.013** (0.004)
0.025** (0.007)
0.011** (0.004)
Very Wet x Post 1842
-0.018** (0.008)
Very Wet x Foreign
0.030 (0.018)
R2 0.337 0.338 0.338 0.338
Storage costs do not mimic the new foreign presence

Foreign presence and carrying costs Foreign = 1 if either Occupation or Customs or Court in prefecture, 0 otherwise
Robust Clustered Prefecture x grain
Clustered Prefecture
Foreign -0.093 (0.016)
-0.093 (0.010)
-0.093 (0.016)
N 54,979 54,979 54,979
Clusters 1,778 324
igtigtitigt XForeignCostCarry εβµµβ ++++= '_ln 1
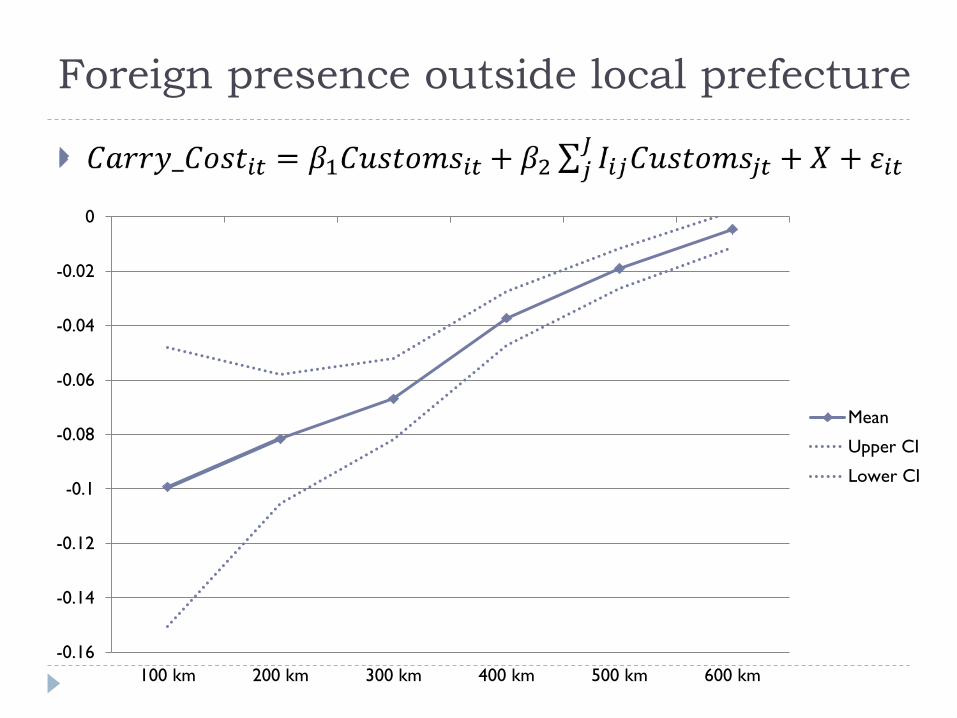
Foreign presence outside local prefecture
-0.16
-0.14
-0.12
-0.1
-0.08
-0.06
-0.04
-0.02
0
100 km 200 km 300 km 400 km 500 km 600 km
Mean
Upper CI
Lower CI
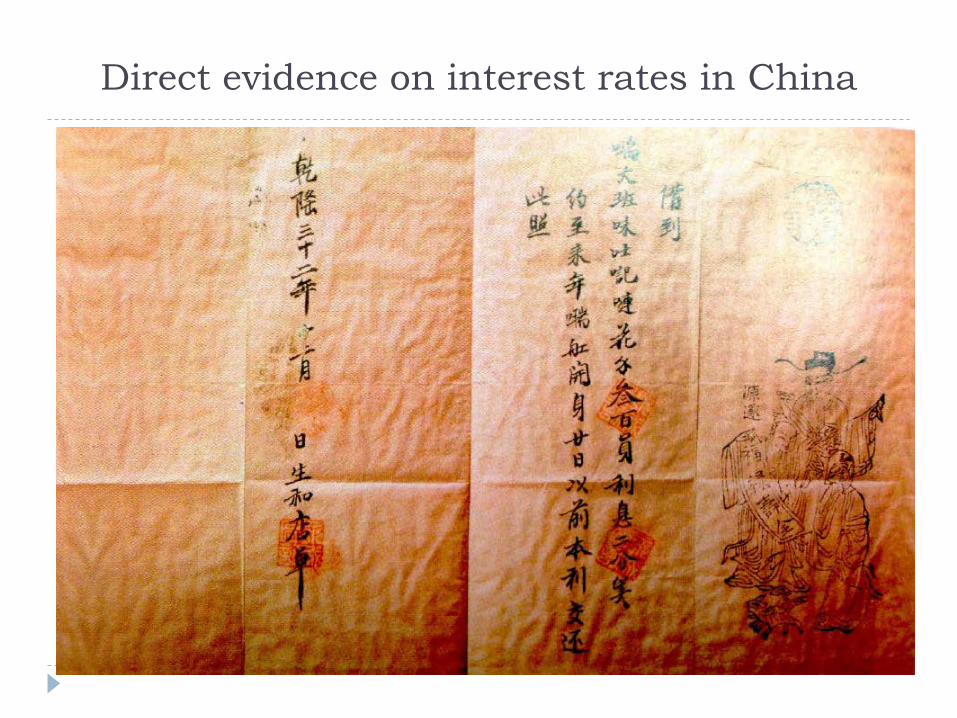
Direct evidence on interest rates in China
[Put the beautiful picture of the Swedish contract here]

Direct information on capital costs
Specific to 1. Borrower 2. Lender 3. Date Year, month, day
4. Location 5. Maturity 6. Risk 7. Collateral 8. Insurance Given a relatively low number of contracts, it is
hard to avoid comparing ‘apples with oranges’
• Relatively high interest rates high in Lower Yangzi Delta (Yang 1952, Lieu 1937, Chao 1977)
• Rate on fixed dividends in 1920s Shanghai machine weaving was 9.6% (Shiroyama 2004)
• Rate on stocks in 1895 Dasheng cotton mill was 8% ; rates for long term contracts: 10.5%; short-term contracts (3 mo.): 6% to 14.5% plus collateral
• Maximum interest rate around 15% • Interest rates at pawnshops often greater than
15% (Li/van Zanden 2013) • Qing Government loans from abroad 8-9% in
1864-1886; 5.3-7% in 1886-1894