capital market day - · pdf fileprocess technology division agri ... procter & gamble...
TRANSCRIPT

Capital Market DayOctober 9th, 2002Our brand is about performance
Sigge HaraldssonPresident and CEOAlfa Laval Group
© Alfa Laval Slide 3 www.alfalaval.com
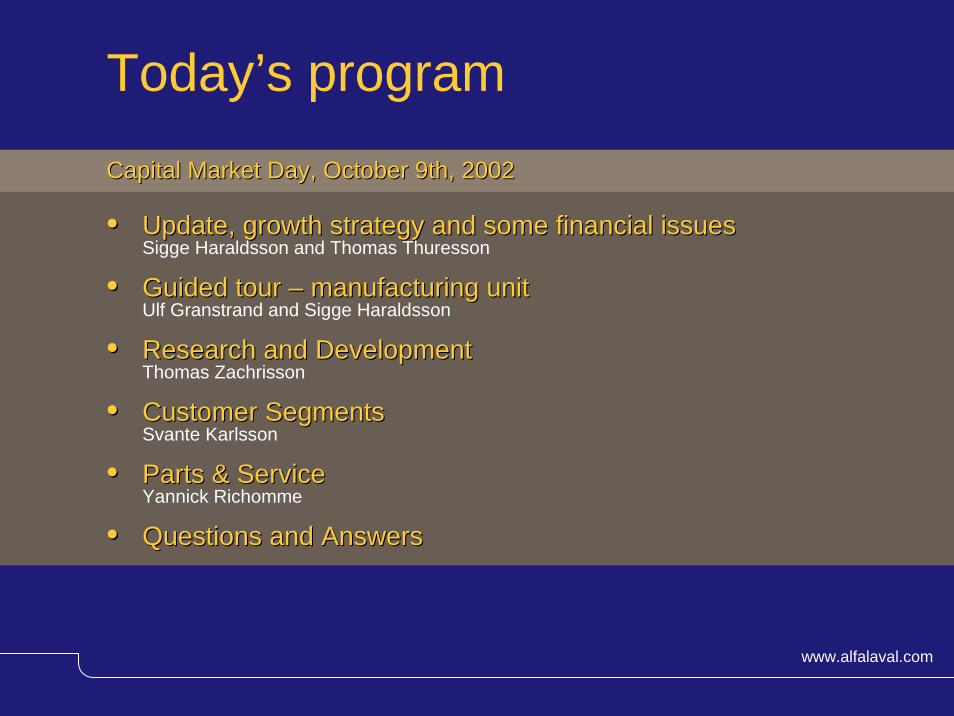
Today’s programCapital Market Day, October 9th, 2002Capital Market Day, October 9th, 2002
•• Update, growth strategy and some financial issuesUpdate, growth strategy and some financial issuesSigge Haraldsson and Thomas Thuresson
•• Guided tour Guided tour –– manufacturing unitmanufacturing unitUlf Granstrand and Sigge Haraldsson
•• Research and DevelopmentResearch and DevelopmentThomas Zachrisson
•• Customer Customer SSegmentsegmentsSvante Karlsson
•• Parts & ServiceParts & ServiceYannick Richomme
•• Questions and AnswersQuestions and Answers

© Alfa Laval Slide 4 www.alfalaval.com
Q302 Interim Report
•• Release 7:30 AM CET, October 31Release 7:30 AM CET, October 31stst..
•• RoadshowRoadshow, Stockholm, London and Copenhagen, Stockholm, London and Copenhagen
October October 3131stst 09:00 AM CET 09:00 AM CET Group breakfast in StockholmGroup breakfast in Stockholm, , including conference callincluding conference call
October October 3131stst 04:00 PM CET04:00 PM CET Conference callConference call
November 1November 1stst 12:30 AM GMT 12:30 AM GMT Group lunch in LondonGroup lunch in London
© Alfa Laval Slide 5 www.alfalaval.com
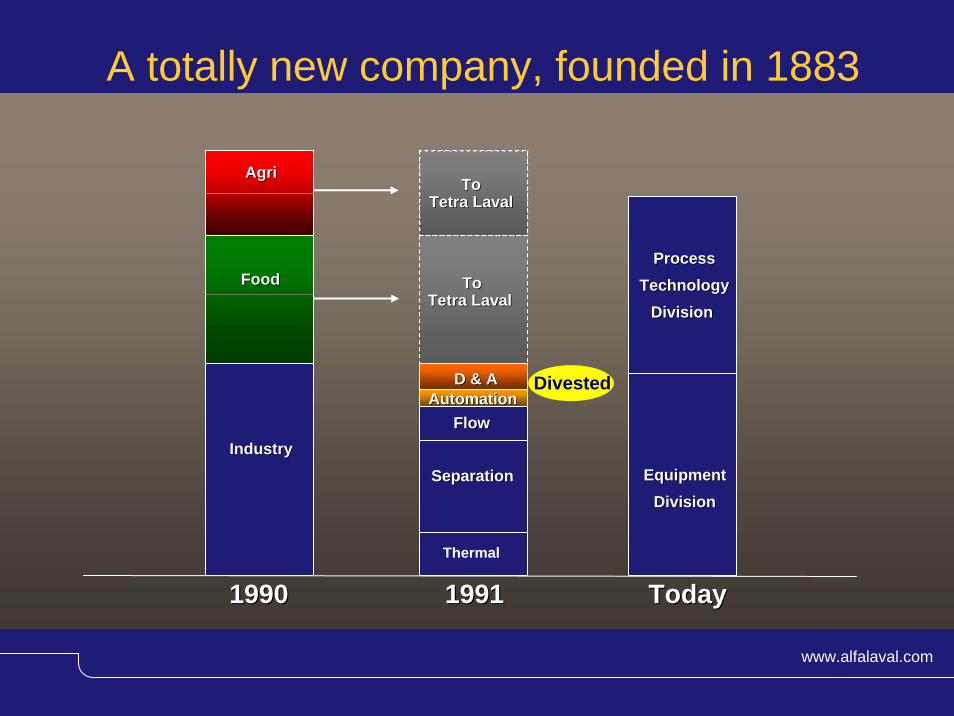
A totally new company, founded in 1883
Thermal
EquipmentEquipmentDivisionDivision
Industry Industry
Separation Separation
FoodFoodProcessProcess
TechnologyTechnologyDivisionDivision
AgriAgri
Flow Flow AutomationAutomation
D & AD & A Divested
To To Tetra Laval Tetra Laval
19901990 19911991 TodayToday
ToToTetra Laval Tetra Laval
© Alfa Laval Slide 6 www.alfalaval.com
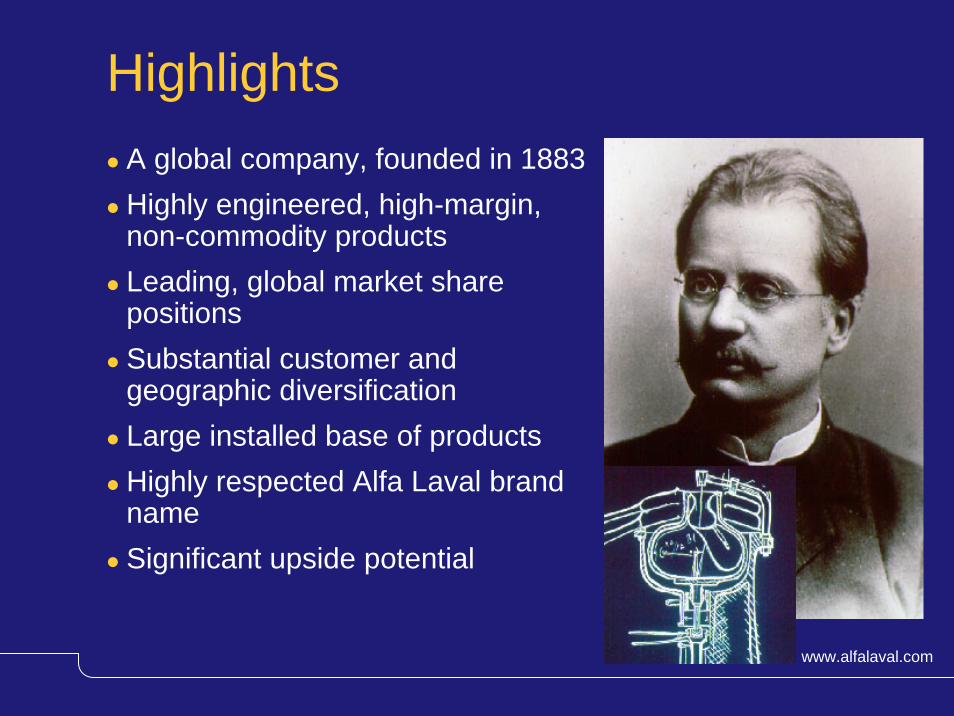
HighlightsA global company, founded in 1883Highly engineered, high-margin, non-commodity productsLeading, global market share positionsSubstantial customer and geographic diversificationLarge installed base of productsHighly respected Alfa Laval brand nameSignificant upside potential

© Alfa Laval Slide 7 www.alfalaval.com
A global company
Year 200Year 20011
• Total sales: MSEK 15,830• No. of employees: 9,259• 20 production units• 70 service centres• Sales Companies in 50 countries • Other sales representation in more than 45 countries
© Alfa Laval Slide 8 www.alfalaval.com
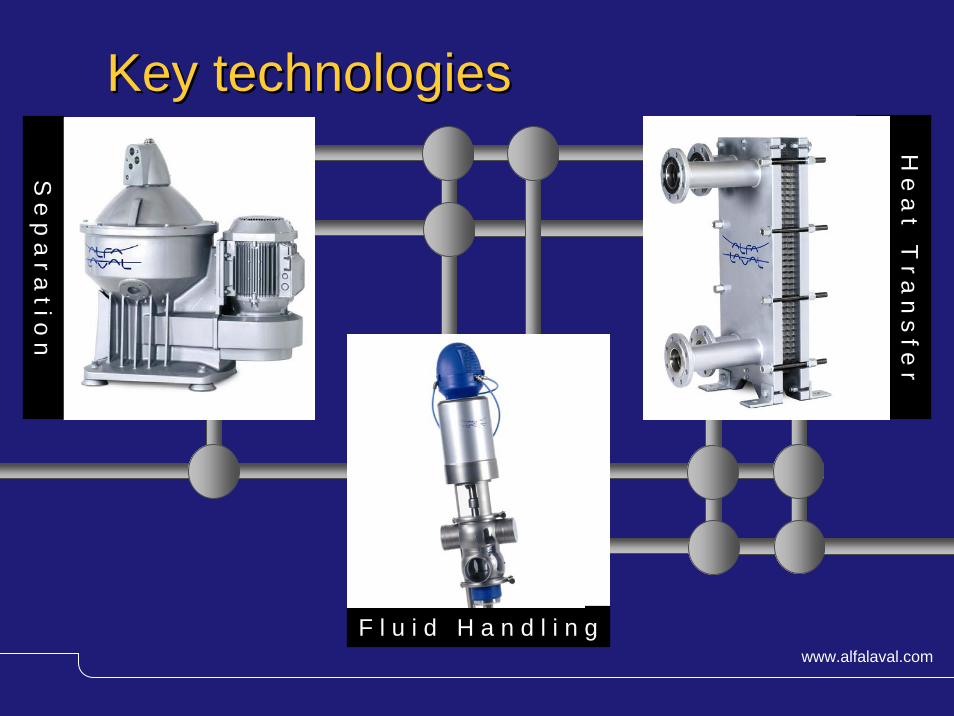
Key technologiesKey technologies
S e p a r a t i o n
F l u i d H a n d l i n g
H e a t T r a n s f e r
© Alfa Laval Slide 9 www.alfalaval.com
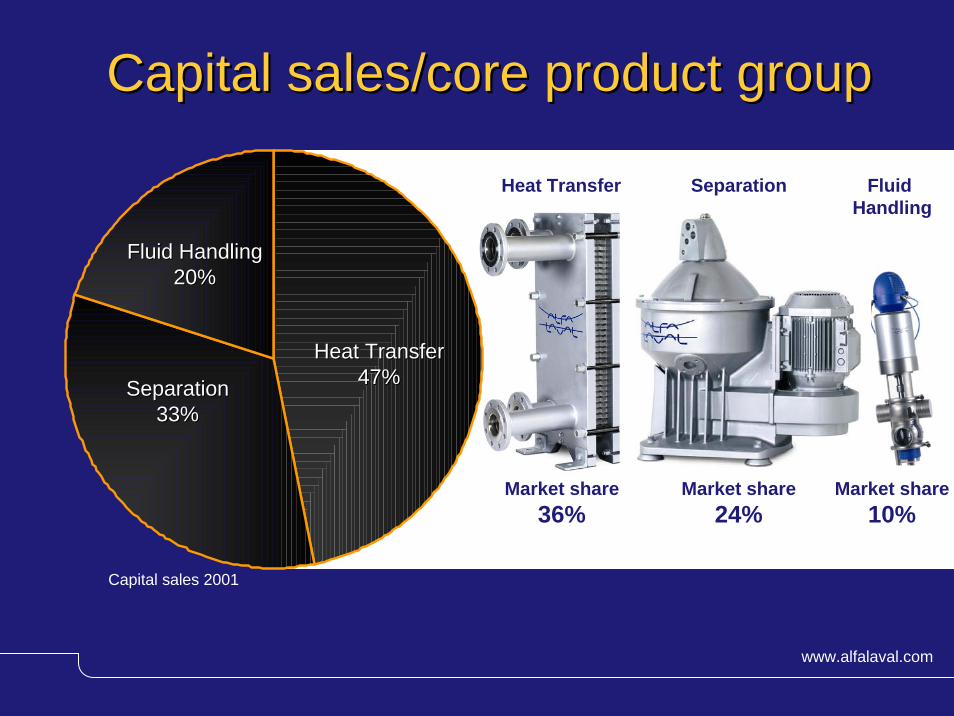
Capital salesCapital sales//core product groupcore product group
Capital sales 2001
Heat TransferHeat Transfer47%47%SeparationSeparation
33%33%
Fluid HandlingFluid Handling20%20%
Heat Transfer Separation Fluid Handling
Market share36%
Market share24%
Market share10%

© Alfa Laval Slide 10 www.alfalaval.com
Examples of End-User Markets
Heating and Cooling
Fresh water generation
Brewing
Personal Care / Biopharm
Refrigeration
© Alfa Laval Slide 11 www.alfalaval.com
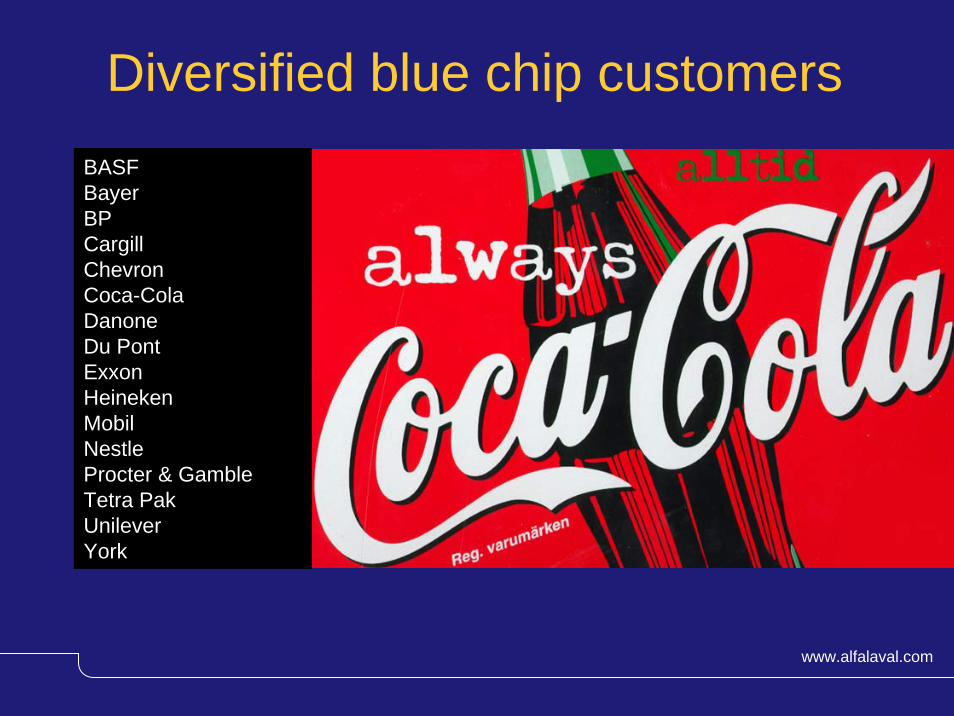
Diversified blue chip customersBASFBayerBPCargillChevronCoca-ColaDanoneDu PontExxonHeinekenMobilNestleProcter & GambleTetra PakUnileverYork
© Alfa Laval Slide 12 www.alfalaval.com
Highlights
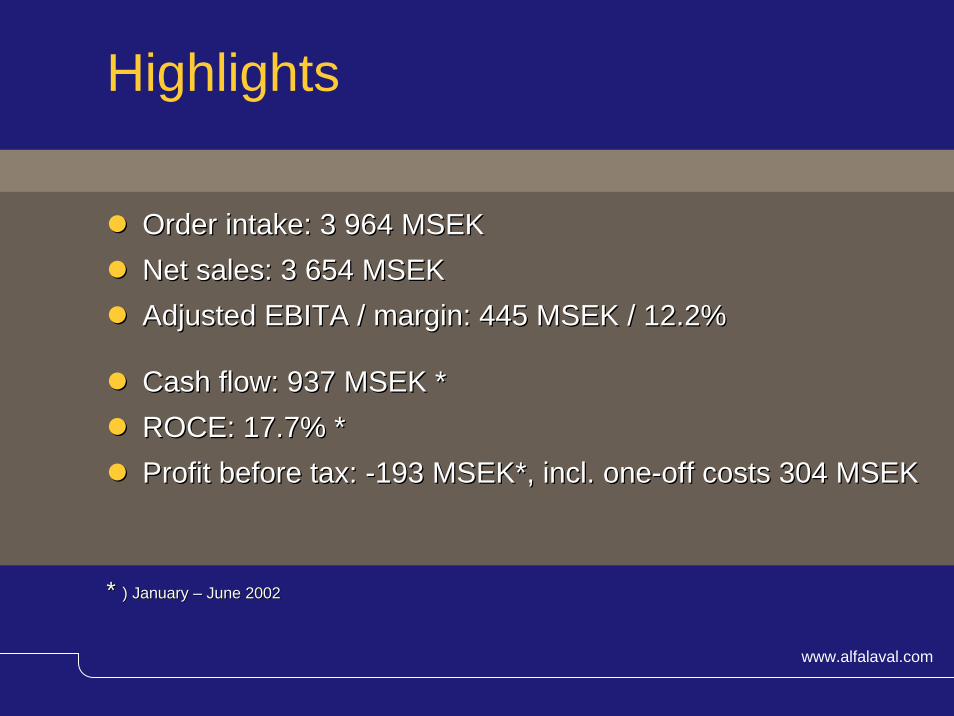
Order intake: 3 964 MSEKOrder intake: 3 964 MSEKNet sales: 3 654 MSEKNet sales: 3 654 MSEKAdjusted EBITA / margin: 445 MSEK / 12.2%Adjusted EBITA / margin: 445 MSEK / 12.2%
Cash flow: 937 MSEK *Cash flow: 937 MSEK *ROCE: 17.7% *ROCE: 17.7% *Profit before tax: Profit before tax: --193 MSEK*, incl. one193 MSEK*, incl. one--off costsoff costs 304 MSEK304 MSEK
* * ) January ) January –– June 2002June 2002

© Alfa Laval Slide 13 www.alfalaval.com
Q on Q vs. last year (like for like)
-10
-8
-6
-4
-2
0
2
4
Q102 Q202 Jan-June 02
Orders receivedOrders received
-10
-8
-6
-4
-2
0
2
4
Q102 Q202 Jan-June 02
Net salesNet sales
© Alfa Laval Slide 14 www.alfalaval.com
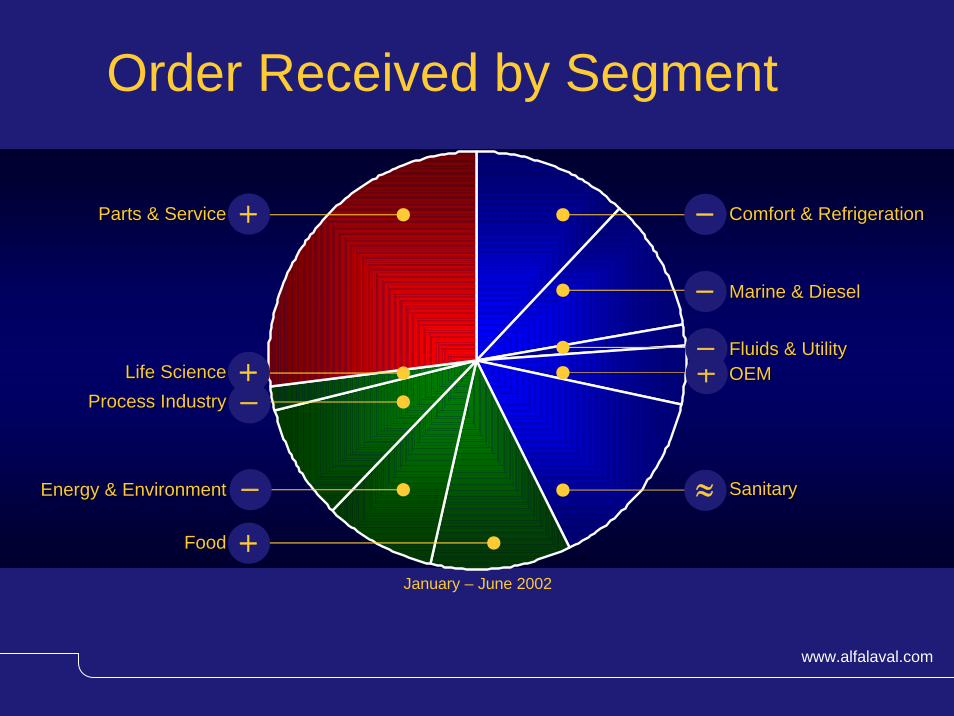
Order Received by Segment
January – June 2002
Comfort & RefrigerationComfort & Refrigeration
SanitarySanitary
Marine & DieselMarine & Diesel
Fluids & UtilityFluids & UtilityOEMOEM
Parts & ServiceParts & Service
Life ScienceLife ScienceProcess IndustryProcess Industry
Energy & EnvironmentEnergy & Environment
FoodFood
+
−
∼ ∼
−
−
+
−
−
+
+
© Alfa Laval Slide 15 www.alfalaval.com
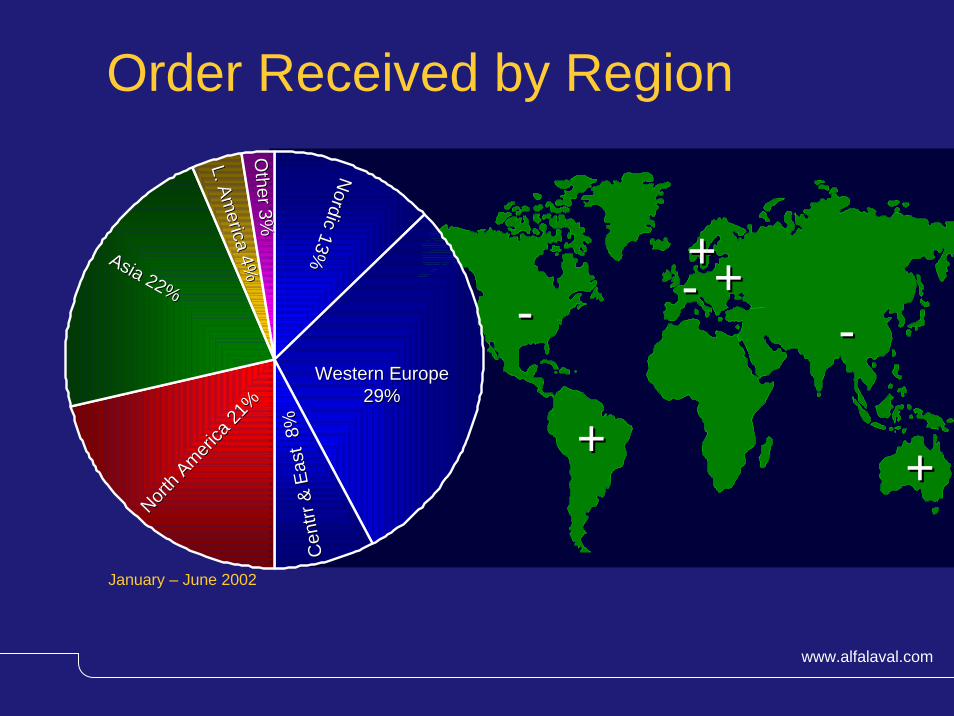
Order Received by Region
Cen
trrC
entrr
& Ea
st 8
%&
East
8%
North A
merica
21%
North A
merica
21%
Asia 22%
Asia 22%
L. America 4%
L. America 4%
Other 3%
Other 3%
Western EuropeWestern Europe29%29%
Nordic 13%
Nordic 13%
++
-- --++++
--
++
January – June 2002

© Alfa Laval Slide 16 www.alfalaval.com
Adjusted EBITA / Margin *MSEK and in percent of salesMSEK and in percent of sales
* Adjusted EBITA – ”Earnings before interests, taxes, amortization of goodwill and step up values and comparison distortion items.”
0
100
200
300
400
500
600
700
800
900
0,0
2,0
4,0
6,0
8,0
10,0
12,0
14,0
JanJan--June 00June 00 JulyJuly--Dec 00Dec 00 JanJan--June 01June 01 JulyJuly--Dec 01Dec 01 JanJan--June 02June 02
© Alfa Laval Slide 17 www.alfalaval.com
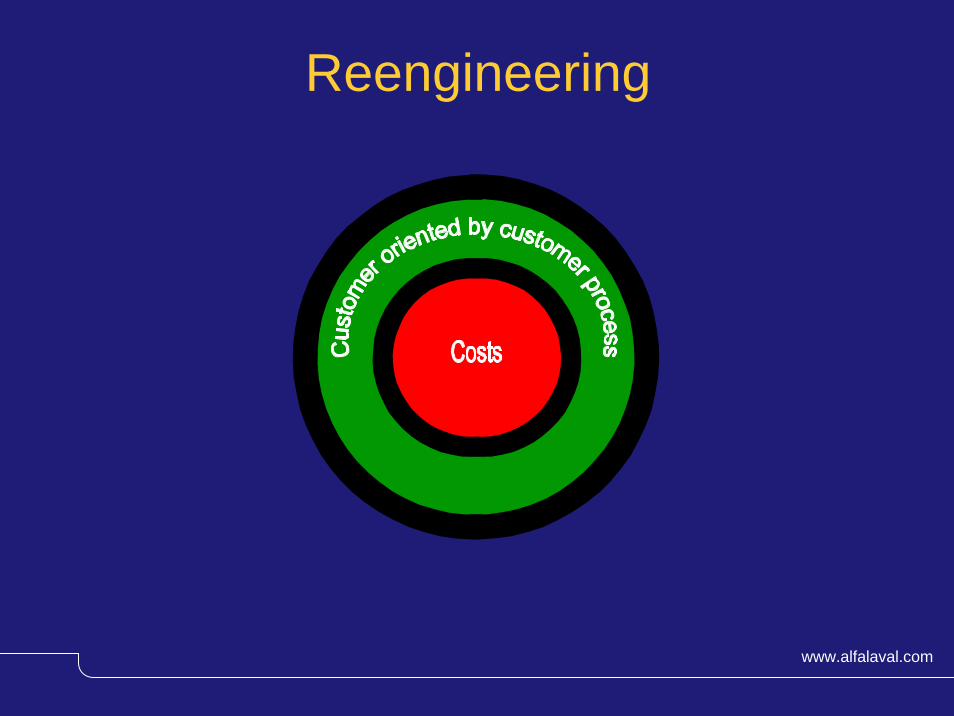
Reengineering
© Alfa Laval Slide 18 www.alfalaval.com
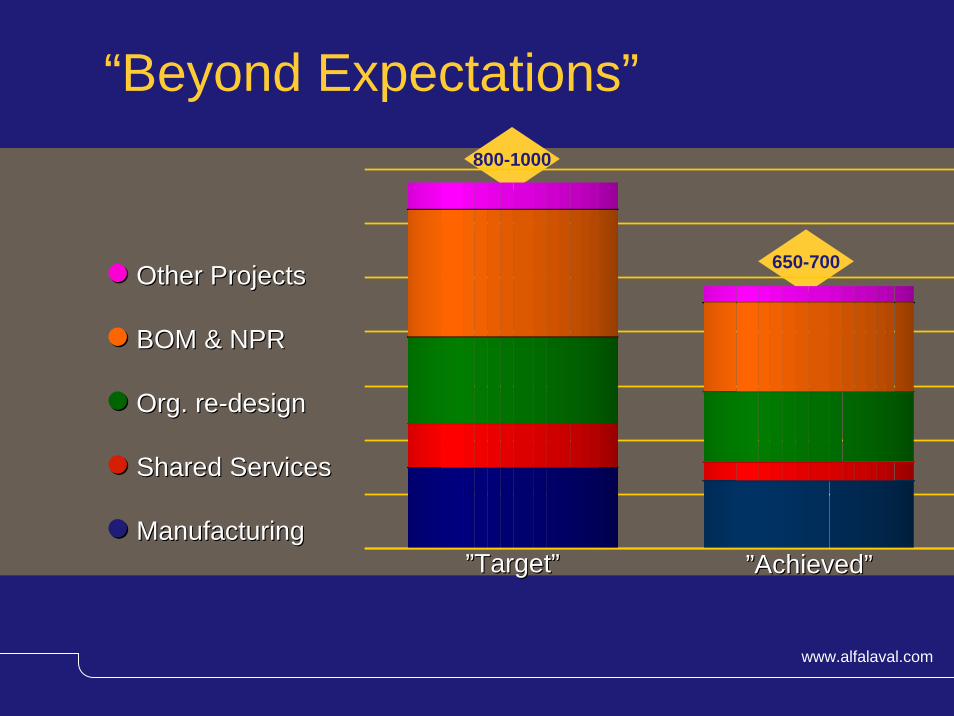
800-1000
650-700
“Beyond Expectations”
Other ProjectsOther Projects
BOM & NPRBOM & NPR
Org. reOrg. re--designdesign
Shared ServicesShared Services
ManufacturingManufacturing””TargetTarget”” ””AchievedAchieved””

Financials A couple of ”your issues”
Thomas ThuressonCFOAlfa Laval Group

© Alfa Laval Slide 20 www.alfalaval.com
Net sales
Adjusted EBITA
Amortization of goodwill
and step-up
Financial net
Comparison distortion items
Profit before tax
Profit after tax
Consolidated Profit and LossMSEK 1.1-30.6 2002 1.1-30.6 2001
Proforma*1.1-30.6 2002
6,916
807
- 252
- 217
0
338
210
6,916
807
- 252
- 399
- 348
- 193
- 321
7,259
851
- 254
- 551
0
46
35
* Based on new capital structure and exclusive of comparison distortion items.
© Alfa Laval Slide 21 www.alfalaval.com
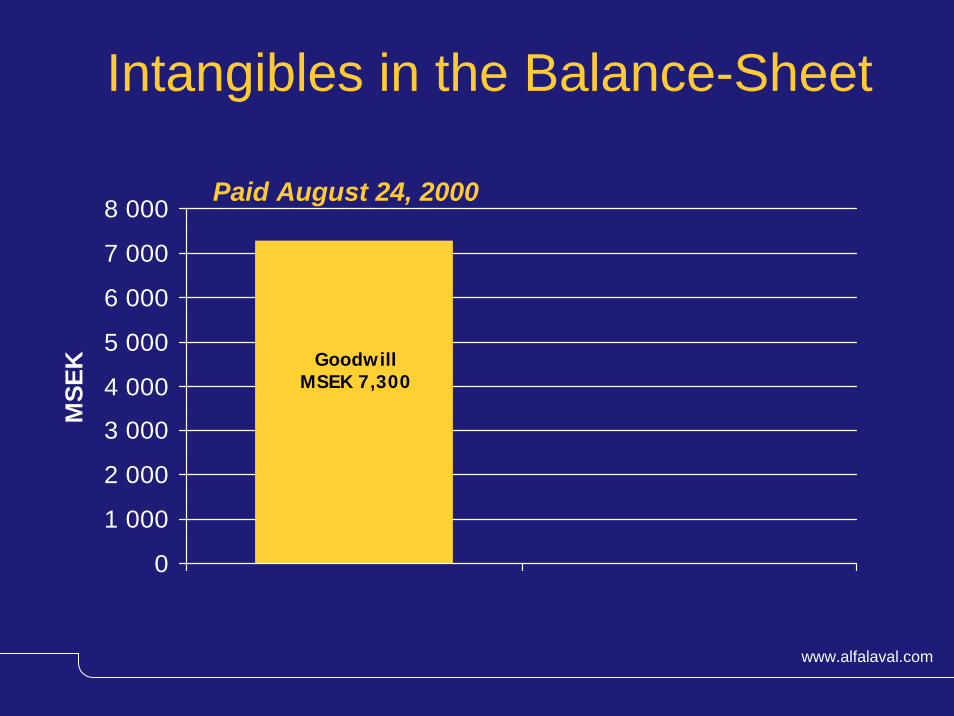
Intangibles in the Balance-Sheet
0
1 000
2 000
3 000
4 000
5 000
6 000
7 000
8 000
MSE
K
Paid August 24, 2000
GoodwillMSEK 7,300
© Alfa Laval Slide 22 www.alfalaval.com
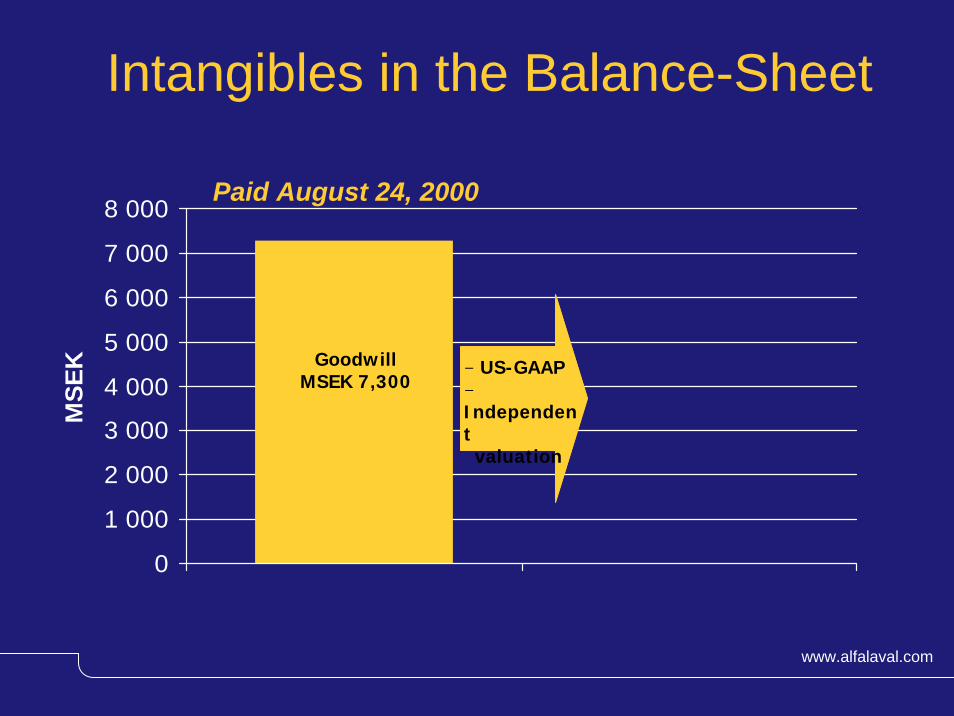
Intangibles in the Balance-Sheet
0
1 000
2 000
3 000
4 000
5 000
6 000
7 000
8 000
MSE
K
Paid August 24, 2000
- US-GAAP-Independent
valuation
GoodwillMSEK 7,300
© Alfa Laval Slide 23 www.alfalaval.com
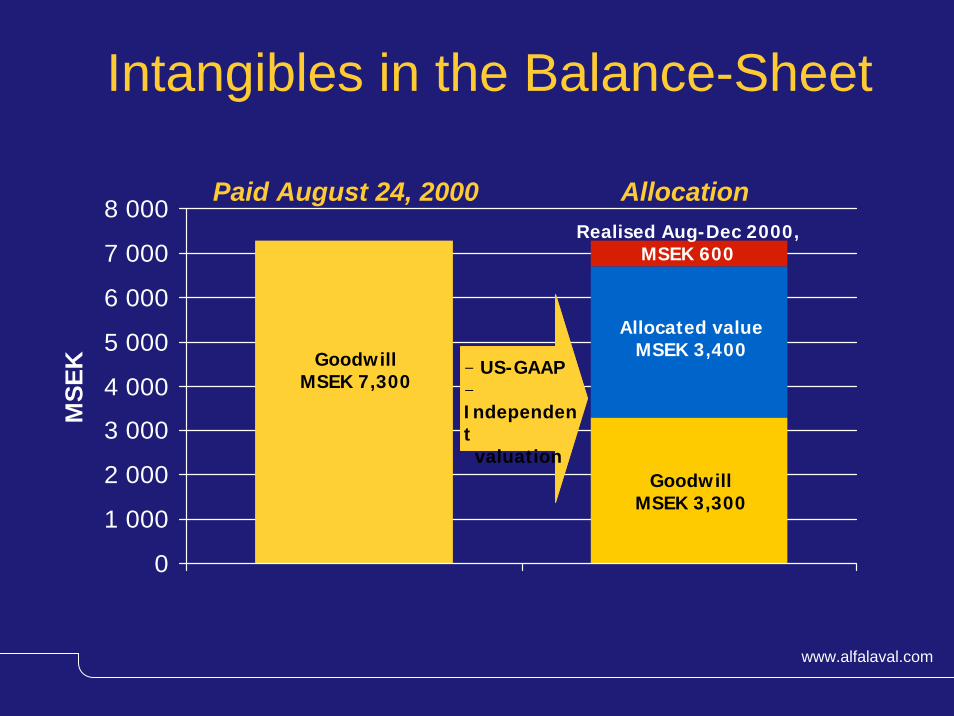
Intangibles in the Balance-Sheet
0
1 000
2 000
3 000
4 000
5 000
6 000
7 000
8 000
MSE
K
Paid August 24, 2000 Allocation
- US-GAAP-Independent
valuation Goodwill
MSEK 3,300
Allocated valueMSEK 3,400
Realised Aug-Dec 2000,MSEK 600
GoodwillMSEK 7,300
© Alfa Laval Slide 24 www.alfalaval.com
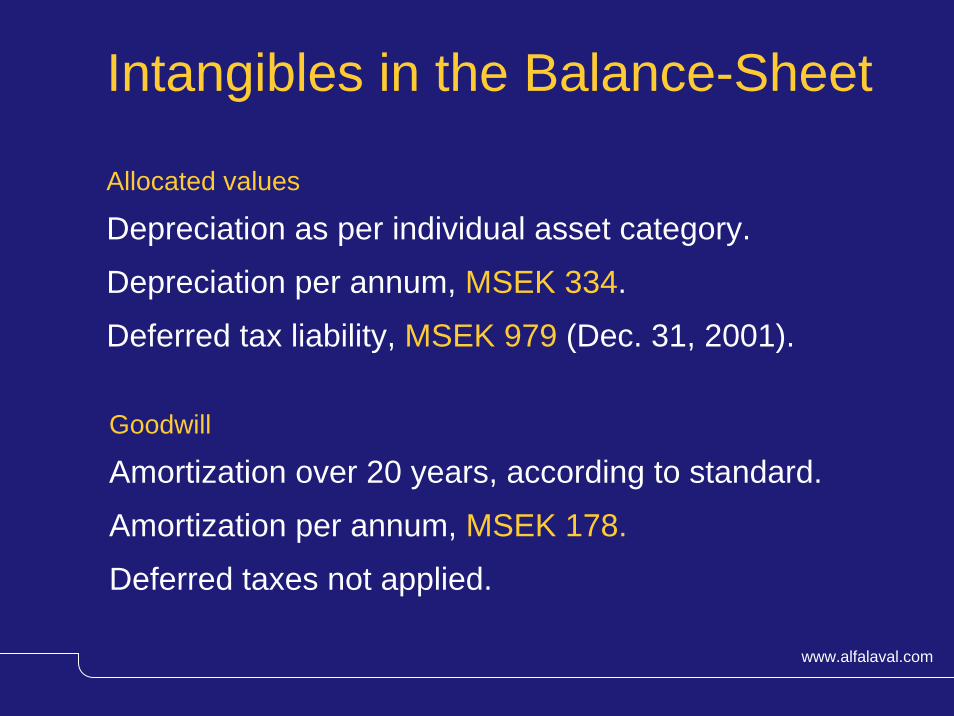
Intangibles in the Balance-Sheet
Allocated values
Depreciation as per individual asset category.
Depreciation per annum, MSEK 334.
Deferred tax liability, MSEK 979 (Dec. 31, 2001).
Goodwill
Amortization over 20 years, according to standard.
Amortization per annum, MSEK 178.
Deferred taxes not applied.

© Alfa Laval Slide 25 www.alfalaval.com
Cash and Deposits
Financial Debt
- Credit institutions
- Bond
- Other
IRS’s
Capital. financing costs
Financial Debt and Financial Net
+ 957
3,919
1,298
27
(78)
As perJune 30, 2002
MSEK
Proforma*Financial Income/ Cost
MSEK
*Calculated on an annual base
+ 19
176
157
28012
Net 4,286 408
(2 %)
(4 1/2%)
(12 1/8 %)
(7%)
(Until 9/03)
Assumptions

© Alfa Laval Slide 26 www.alfalaval.com
EBITDA
Working capital
Taxes paid
Cash flow from operating activities
Capital expenditures
Divestments
Acquisitions*
Provisions
Cash flow from investing activities
Cash flow from financing activities
Net increasein cash and bank
978
117
- 158
937
- 152
61
- 368
- 27
- 486
- 237
214
978
117
- 158
937
- 152
-
-
- 27
- 179
- 212
546
MSEK 1.1-30.6 2002Proforma
1.1-30.6 2002
Cash-flow statement
* Vendor Warrant, MEUR 40
© Alfa Laval Slide 27 www.alfalaval.com
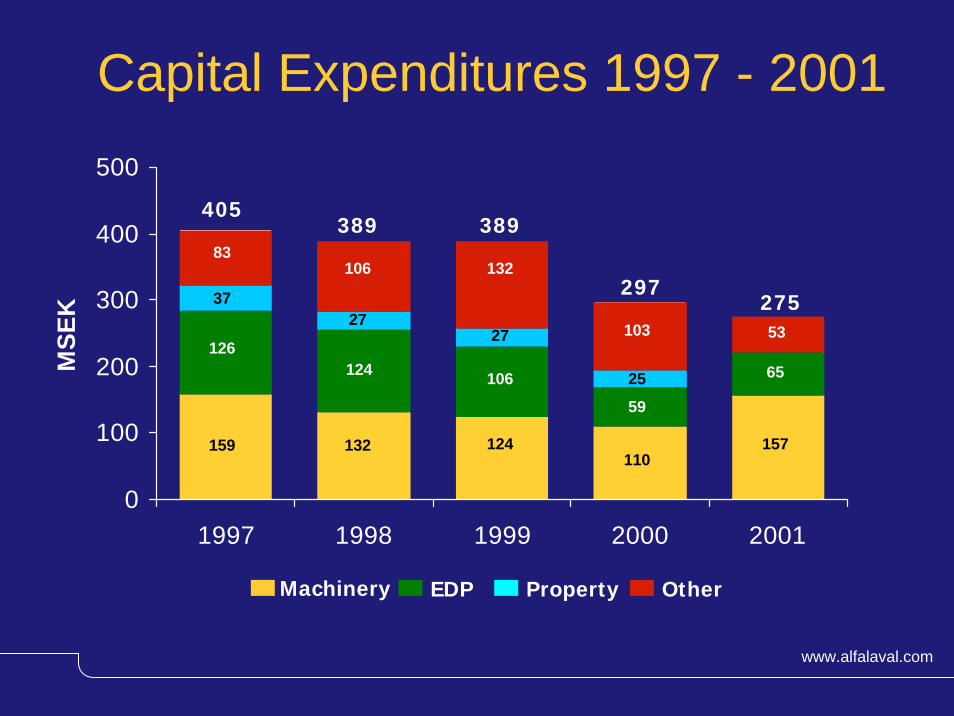
Capital Expenditures 1997 - 2001
0
100
200
300
400
500
1997 1998 1999 2000 2001
MSE
K
EDP Property Other
405389 389
297
Machinery
275
159
126
37
83
132
124
27
106
124
106
27
132
110
59
25
103
157
65
53

© Alfa Laval Slide 28 www.alfalaval.com
Key ratios
RatioRatio
Earnings Per Share(proforma)
Earnings Per Share(proforma, excl. goodwillamortization and step-updepreciation
Cash Earnings Per Share(proforma)
RemarksRemarks
- Current number of shares- New capital structure- Exclusive of comparison distortion items
- As above adding back goodwill amortization and step-up depreciation
- New capital structure- Excl. disposals and
acquisitions
JanuaryJanuary--June 2002 June 2002
Before tax, SEK 3.03After tax SEK 1.88
Before tax SEK 5.28After tax SEK 4.14
Before tax SEK 6.30After tax SEK 4.89
© Alfa Laval Slide 29 www.alfalaval.com
Reengineering
© Alfa Laval Slide 30 www.alfalaval.com
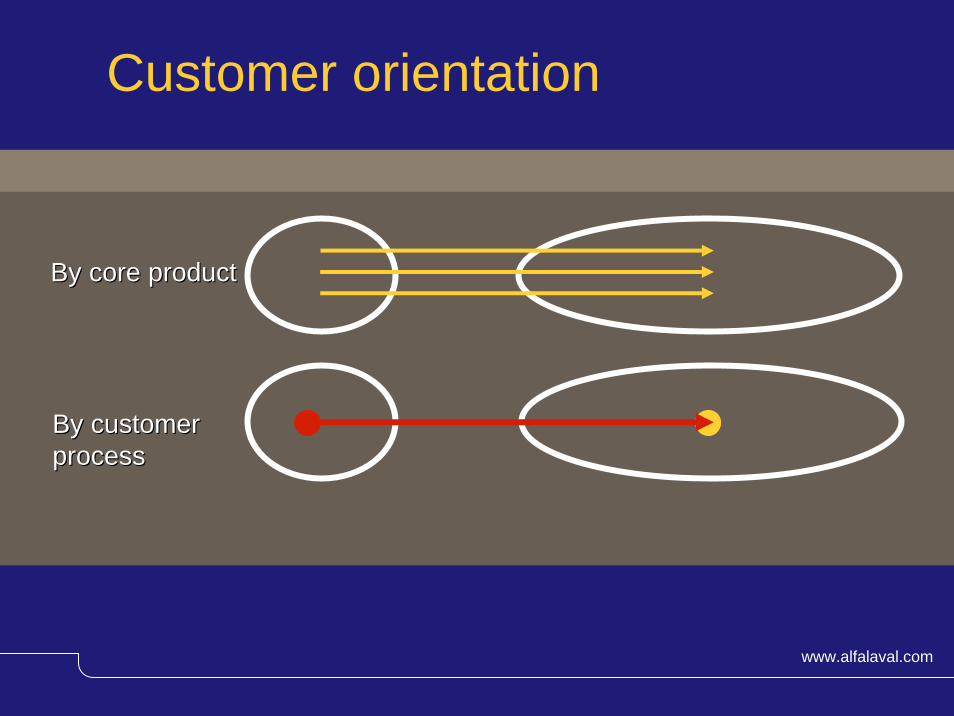
Customer orientation
By core productBy core product
By customer By customer processprocess

© Alfa Laval Slide 31 www.alfalaval.com
Reengineering
© Alfa Laval Slide 32 www.alfalaval.com
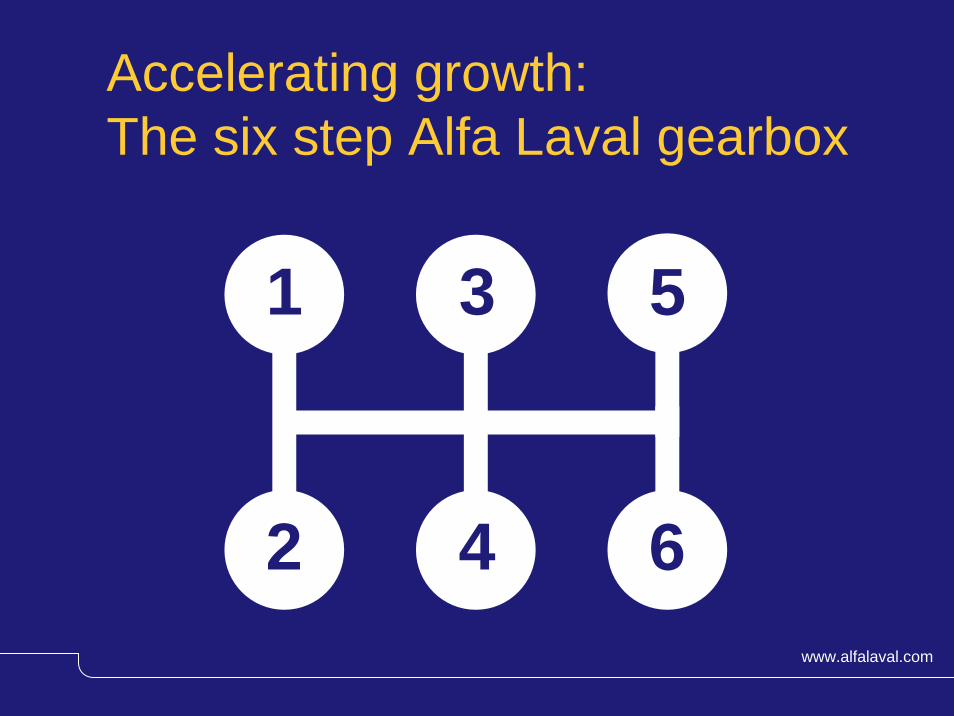
Accelerating growth: The six step Alfa Laval gearbox
1 3 5
2 4 6

© Alfa Laval Slide 33 www.alfalaval.com
The drivers behind Alfa Laval’s growth strategy
1 3 5
2 4 6
1st gear: EExistingxisting range of productsproducts
2nd gear: MMarketarket--driven R&Ddriven R&D
3rd gear: Focus on customer segmentscustomer segments
4th gear: Strong commitment to Parts & ServiceParts & Service
5th gear: Exploitation of new market conceptsnew market concepts
6th gear: Ambition to add new core productsnew core products

© Alfa Laval Slide 34 www.alfalaval.com
666
3 51
2
4
1
22
53
4
551
6
The six step Alfa Laval gearboxExistingExistingproductsproducts
CustomerCustomersegmentssegments
New marketNew marketconceptsconcepts
MarketMarket--drivendrivenR&DR&D
Parts & ServiceParts & Service New coreNew coreproductsproducts
44
44

© Alfa Laval Slide 35 www.alfalaval.com
666
3 51
2 4
1
2
53
4
55
2
1
6
3
4
5
6
The six step Alfa Laval gearboxExistingExistingproductsproducts
CustomerCustomersegmentssegments
New marketNew marketconceptsconcepts
MarketMarket--drivendrivenR&DR&D
Parts & ServiceParts & Service New coreNew coreproductsproducts
All six gears willgive us an annual average growth of5 % over a business cycle.
