capital market assumptions presentation 2015rpgplanner.com/wp-content/uploads/2016/01/capital... ·...
TRANSCRIPT

Plan Right. Invest Smart. Live Well.
RPG Capital Market AssumptionsData Through 7/31/15

Plan Right. Invest Smart. Live Well.
• The inputs to a financial plan cannot be known with certainty in advance. However, successful financial planning requires making intelligently coordinated assumptions using all relevant information.
• Expected portfolio returns are obviously an important factor in determining the success of a financial plan. But estimating future returns is difficult and, as a result, many advisors either use historical returns or choose a return rate that provides a successful financial plan, without a well reasoned process to validate these assumptions.
• Our objective is to consider the factors that influence investment returns to develop reasonable and informed capital market assumptions that are consistent with the current and forward-looking environment.
• It is important to note that the methodology we employ to estimate future returns is based on a simple portfolio of domestic stocks, foreign stocks, and investment grade fixed income. This results from the fact that return assumptions used in our financial plans are meant to be representative of a broadly diversified index portfolio.
• This differs from our portfolio construction methodology which employs a more nuanced approach with a variety of asset classes and factor tilts to exploit inefficiencies and achieve returns in excess of a simple market index.
PurposePurpose
RPG’s Capital Market Assumption Methodology
2

Plan Right. Invest Smart. Live Well.
• RPG employs a building blocks methodology to construct reasonable expected returns for equities and bonds over a 10-15 year horizon. As the name applies, this approach considers the ultimate building blocks of return to develop expectations for stocks and bonds.
• We utilize historical relationships as well as current macroeconomic conditions to determine suitable estimates for each expected return building block component.
• In order to obtain all the necessary inputs for proper financial planning, we also use historical relationships to forecast expected volatility of equities and bonds and the correlation between them.
• It is worth noting that our expectations are not intended to represent short-term forecasts. Abundant empirical evidence reveals that longer term outlooks are better correlated with forecast accuracy. In the short-term, markets tend to reflect emotion, noise, and irrationality, which are difficult, if not impossible, to forecast.
• As a result, we update capital market assumptions only once per year to reflect changes in yield, valuation, or other factors.
• Our capital market assumptions are then used as variables in our financial plans with an assumed log-normal distribution for the Monte Carlo simulations.
ApproachApproach
RPG’s Capital Market Assumption Methodology
Time HorizonTime
Horizon
UsageUsage
3

Plan Right. Invest Smart. Live Well.
Building BlocksBuilding Blocks
Payout YieldPayout Yield
Real Earnings Growth
Real Earnings Growth
InflationInflation
Valuation ChangeValuation Change
Payout YieldPayout Yield
Default LossesDefault Losses
Valuation ChangeValuation Change
EquitiesEquities BondsBonds
Payout yields for equities equals the dividend yield plus or minus the yield resulting from share buybacks or issuance. Bond payout yield equals simply the bond coupon plus or minus any roll yield.
Equity owners also receive a return from the real growth in earnings (inflation adjusted), which can be positive or negative. Bond owners have to subtract losses resulting from default.
/
/
/
/Both equities and bonds typically achieve returns that differ from their fundamental components. This stems from changes in their valuation.
Unlike traditional bonds, equities are a real asset and the expected return reflects the change in inflation.
Components of Building Block Methodology
4

Plan Right. Invest Smart. Live Well.
Forecast Comments
Inflation 3.0%Inflation has averaged 2.5% over the past 10 years and current breakeven spreads suggest a 10-year inflation rate of 1.7%. We use a slightly higher rate to account for the impact of global expansionary monetary policy.
US Real Earnings Growth 1.3%Real earnings growth averaged 1.5% between 1950 – 2009. We expect that GDP growth and, subsequently, earnings growth will be lower over the next decade as the public and private sectors reduce leverage.
Foreign Real Earnings Growth 1.3%
We estimate that some regions of the world will grow significantly faster than this 1.3% rate but that highly indebted countries with poor demographics will reduce the overall growth rate to a level on par with the US.
US Equity Payout Yield 2.8% The current dividend yield of 2.0% is adjusted upward by 0.8% to account for the share buyback yield.
Foreign Equity Payout Yield 3.2% The current dividend yield of 2.6% is adjusted upward by 0.6% to account for the share buyback yield.
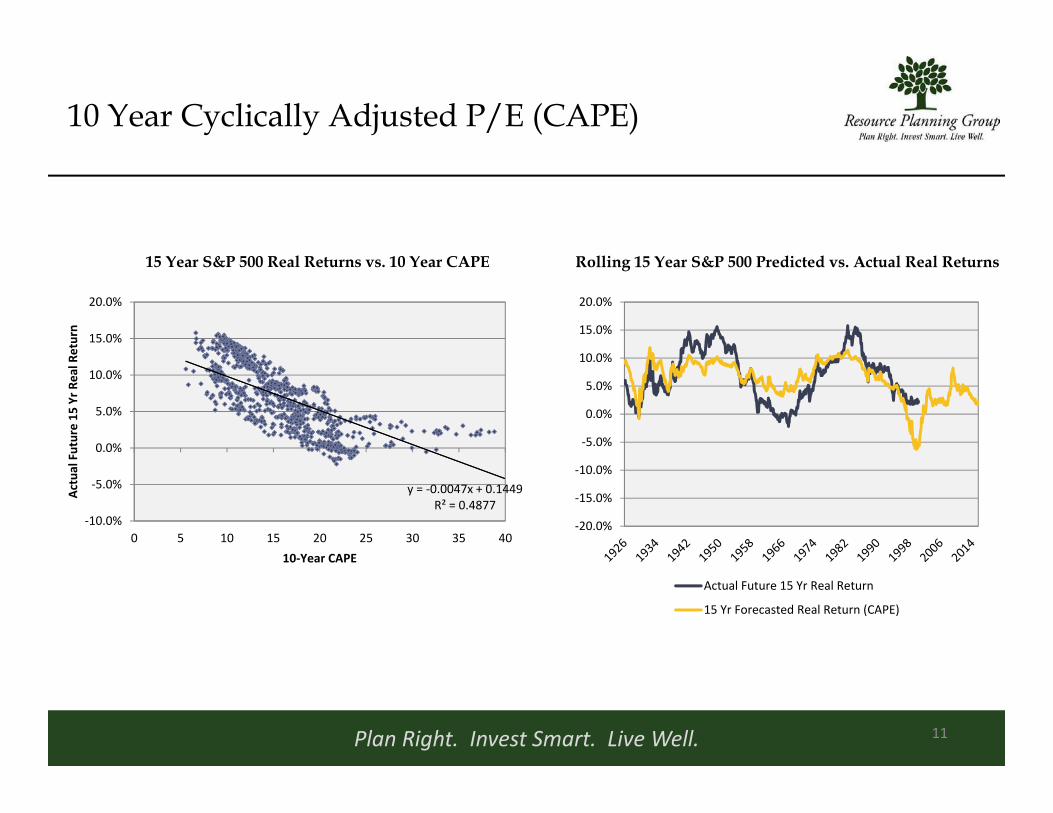
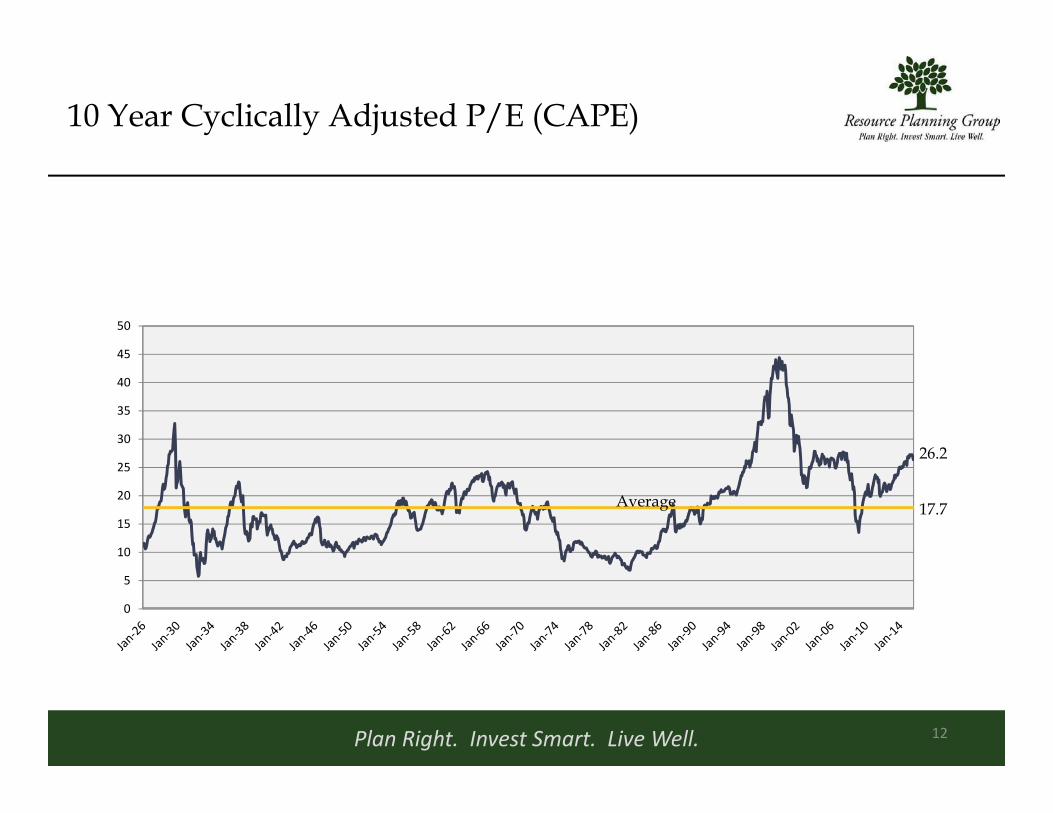
US Equity Valuation Change -2.6%Assuming the cyclically adjusted P/E ratio reverts to its average level over the past 60 years, this valuation reversion to the mean will result in a 2.6% per annum drag on equity returns.
Foreign Equity Valuation Change 0.8% Assuming the cyclically adjusted P/E ratio reverts to its average level, the change in
valuation will result in a 0.8% per annum addition to equity returns.
10-Year Treasury Yield 2.3% Current yield on 10-year Treasuries.
Credit Risk Premium 0.3% Risk premium reflects the historic additional yield of investment grade credit over Treasuries, after accounting for defaults.
Components of Building Block Methodology
5

Plan Right. Invest Smart. Live Well.
3.0%
1.3%
4.8%
0.5%
9.6%
0%
2%
4%
6%
8%
10%
12%
Real EarningsGrowth
Inflation
Payout Yield
ValuationChange
HistoricalReturn
Building Block Components of US Historical ReturnsS&P 500 Index, 1900 - 2009
Building Block Components of US Expected Return
Expectations for domestic equity returns are significantly lower than historical levels as a result of reduced dividend yields and historically rich valuations.
6
3.0%
1.3%
2.8% -2.6%
4.5%
0%
2%
4%
6%
8%
10%
12%
Real EarningsGrowth
Inflation
Payout YieldValuationChange
ExpectedReturn

Plan Right. Invest Smart. Live Well.
Building Block Components of Foreign Equity Expected Return
However, foreign equities present a more rewarding picture with higher payout yields and more attractive valuations
7
3.0%
1.3%
3.2%
0.8%
8.3%
0%
1%
2%
3%
4%
5%
6%
7%
8%
9%
Real EarningsGrowth
Inflation
Payout Yield
ValuationChange
ExpectedReturn

Plan Right. Invest Smart. Live Well.
Fixed Income return expectations are also lower than historical figures as a result of the unprecedented low yield environment
US 10-Year Treasury Yield and Subsequent 10-Year Bond Returns
8
0.0%
2.0%
4.0%
6.0%
8.0%
10.0%
12.0%
14.0%
16.0%
18.0%
10‐Year US Treasury Yield 10 Year Future Return on Barclays Aggregate Bond Index

Plan Right. Invest Smart. Live Well.
100% Growth(100/0)
90% Growth(90/10)
80% Growth(80/20)
70% Growth(70/30)
60% Growth(60/40)
50%Growth(50/50)
40% Growth(40/60)
30% Growth(30/70)
Expected Return 6.4% 6.0% 5.7% 5.3% 5.0% 4.6% 4.3% 3.9%
Expected Volatility 14.4% 13.0% 11.7% 10.3% 9.0% 7.7% 6.5% 5.4%
The End Result – Capital Market Assumptions
9
100/090/1080/20
70/3060/40
50/5040/60
30/70
0.0%
1.0%
2.0%
3.0%
4.0%
5.0%
6.0%
7.0%
4.0% 6.0% 8.0% 10.0% 12.0% 14.0% 16.0%
Expe
cted
Return (Ann
ualized
)
Expected Volatility (Annualized)

Plan Right. Invest Smart. Live Well.
Supporting Materials
Plan Right. Invest Smart. Live Well.
10 Year Cyclically Adjusted P/E (CAPE)
Rolling 15 Year S&P 500 Predicted vs. Actual Real Returns15 Year S&P 500 Real Returns vs. 10 Year CAPE
11
y = ‐0.0047x + 0.1449R² = 0.4877
‐10.0%
‐5.0%
0.0%
5.0%
10.0%
15.0%
20.0%
0 5 10 15 20 25 30 35 40
Actual Future 15
Yr R
eal R
eturn
10‐Year CAPE
‐20.0%
‐15.0%
‐10.0%
‐5.0%
0.0%
5.0%
10.0%
15.0%
20.0%
Actual Future 15 Yr Real Return
15 Yr Forecasted Real Return (CAPE)
Plan Right. Invest Smart. Live Well. 12
10 Year Cyclically Adjusted P/E (CAPE)
0
5
10
15
20
25
30
35
40
45
50
Average
26.2
17.7

Plan Right. Invest Smart. Live Well.
Q-Ratio
Rolling 15 Year S&P 500 Predicted vs. Actual Real Returns15 Year S&P 500 Real Returns vs. Q-Ratio
13
y = ‐0.1162x + 0.1363R² = 0.5166‐10.0%
‐5.0%
0.0%
5.0%
10.0%
15.0%
20.0%
0% 50% 100% 150% 200%
Actual Future 15
Yr R
eal R
eturn
Q‐Ratio
‐20.0%
‐15.0%
‐10.0%
‐5.0%
0.0%
5.0%
10.0%
15.0%
20.0%
Actual Future 15 Yr Real Return
15 Yr Forecasted Real Return (Q‐Ratio)

Plan Right. Invest Smart. Live Well. 14
Q-Ratio
0%
20%
40%
60%
80%
100%
120%
140%
160%
180%
Average 71%
106%
Plan Right. Invest Smart. Live Well.
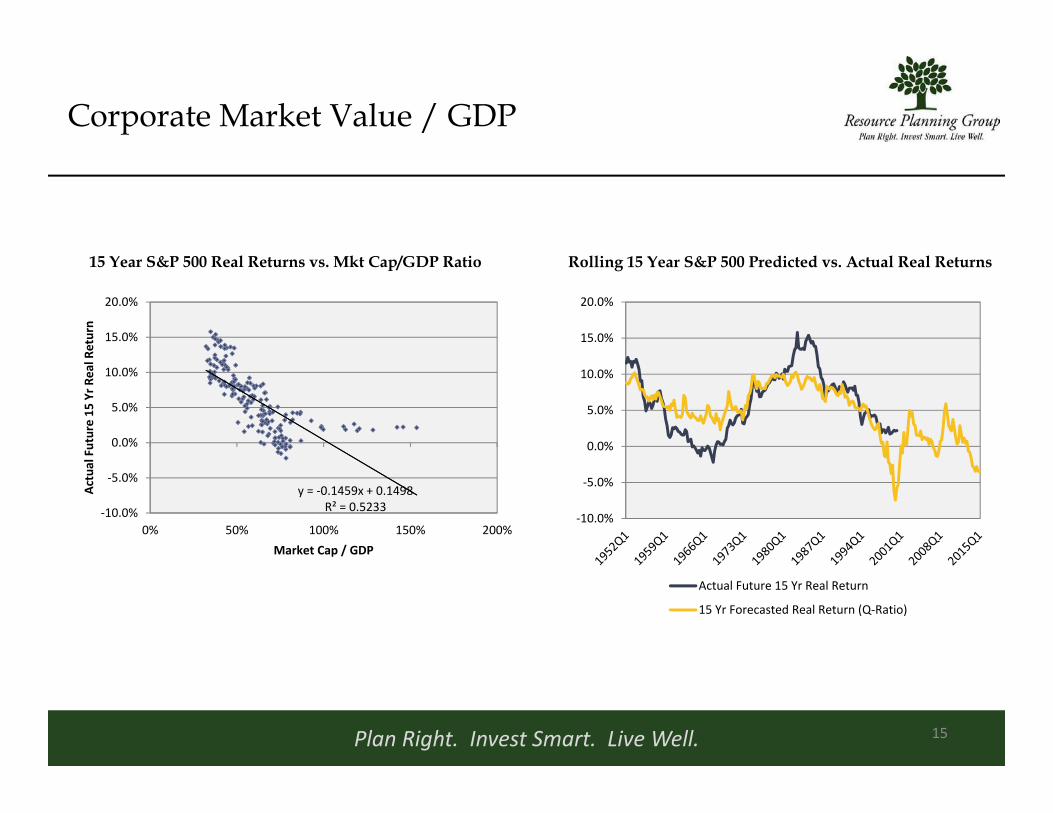
Corporate Market Value / GDP
Rolling 15 Year S&P 500 Predicted vs. Actual Real Returns15 Year S&P 500 Real Returns vs. Mkt Cap/GDP Ratio
15
y = ‐0.1459x + 0.1498R² = 0.5233‐10.0%
‐5.0%
0.0%
5.0%
10.0%
15.0%
20.0%
0% 50% 100% 150% 200%
Actual Future 15
Yr R
eal R
eturn
Market Cap / GDP
‐10.0%
‐5.0%
0.0%
5.0%
10.0%
15.0%
20.0%
Actual Future 15 Yr Real Return
15 Yr Forecasted Real Return (Q‐Ratio)
Plan Right. Invest Smart. Live Well. 16
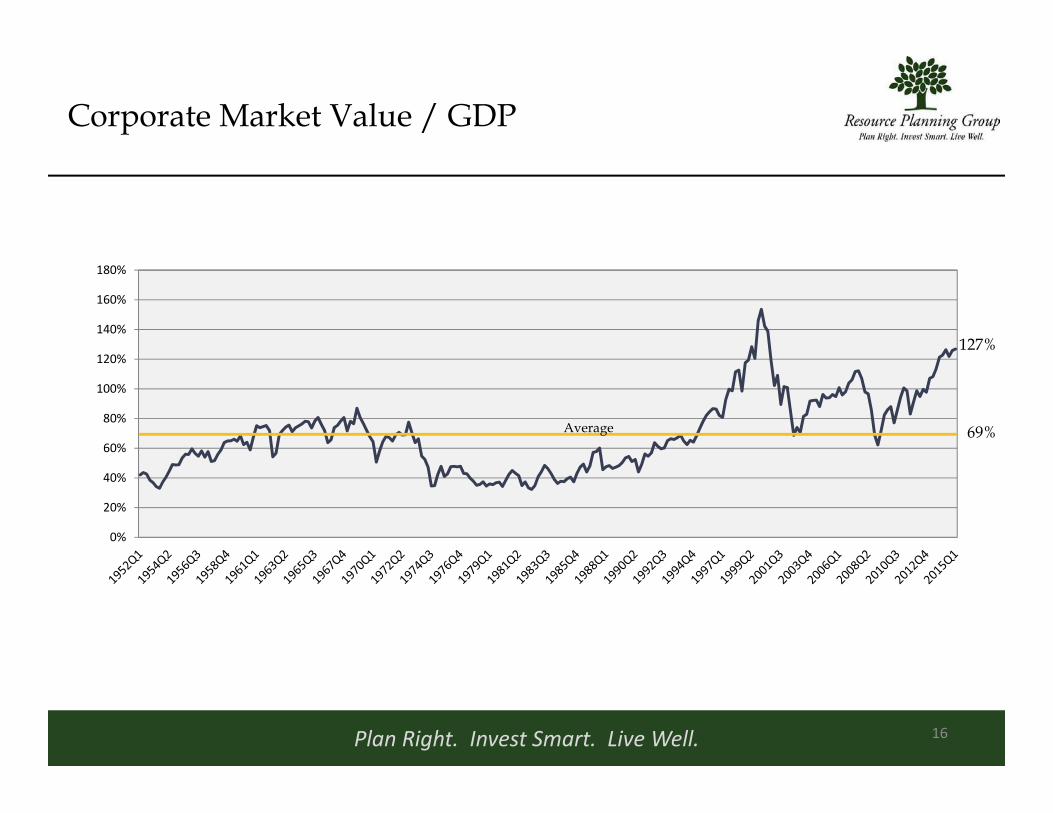
Corporate Market Value / GDP
0%
20%
40%
60%
80%
100%
120%
140%
160%
180%
Average
127%
69%

Plan Right. Invest Smart. Live Well. 17
Stock Prices and Demographic Trends
0%
10%
20%
30%
40%
50%
60%
70%
80%
0
5
10
15
20
25
30
35
M/O
Ratio
One
‐Year P
/E Ratio
P/E Ratio M/O Ratio
• Historical data provides a strong link between the age distribution of the population in the United States and the performance of the stock market. The chart to the right depicts that historical relationship.
• The M/O Ratio was developed by the San Francisco Federal Reserve and measures the proportion of 40‐49 year olds (middle‐age cohort) to the 60‐69 year olds (old‐age cohort).
• The aging of the population creates clear headwinds for the stock market which is demonstrated in the chart.
Demographics and Stock Returns

Plan Right. Invest Smart. Live Well. 18
Historic Dividend Yields
0%
2%
4%
6%
8%
10%
12%
14%
16%

Plan Right. Invest Smart. Live Well. 19
Historic 10 Year TIPS Yields
‐1.5%
‐1.0%
‐0.5%
0.0%
0.5%
1.0%
1.5%
2.0%
2.5%
3.0%
3.5%

Plan Right. Invest Smart. Live Well.
Estimating Expected Volatility
Rolling 3-Year Volatility of S&P 500 Index Rolling 3-Year Volatility of Barcap Aggregate Bond Index
We use historical correlations and volatility measures for stocks and bonds in order to estimate the expected volatility of portfolios. Importantly, we are careful to select appropriate historical time periods for bonds and
stocks that are reflective of the correlation and volatility environments we expect in the future.
20
0.0
5.0
10.0
15.0
20.0
25.0
Geometric Average
0.0
1.0
2.0
3.0
4.0
5.0
6.0
Geometric Average