capital gains lock-in and governance choices
TRANSCRIPT

NBER WORKING PAPER SERIES
CAPITAL GAINS LOCK-IN AND GOVERNANCE CHOICES
Stephen G. DimmockWilliam C. Gerken
Zoran Ivkovi�ćScott J. Weisbenner
Working Paper 20176http://www.nber.org/papers/w20176
NATIONAL BUREAU OF ECONOMIC RESEARCH1050 Massachusetts Avenue
Cambridge, MA 02138May 2014
Author contact information: [email protected], [email protected], [email protected],and [email protected]. We thank Jonathan Brogaard, Diane Del Guercio, Alex Edmans, SlavaFos, Huasheng Gao, Jiekun Huang, Jun-Koo Kang, Wei-Lin Liu, Angie Low, Michelle Lowry, FelixMeschke, Angela Morgan, Stewart Myers, Kasper Neilsen, Francisco Perez-Gonzalez, Yuehua Tang,Jack Wolf, Fei Xie, Hanjiang Zhang, Lei Zhang and seminar participants at Clemson University, HongKong University of Science and Technology, Nanyang Technological University, and the Universityof Saskatchewan and conference participants at the 2013 AIM Investment Center Conference onInstitutional Investment, 2014 American Finance Association, 2014 Finance Down Under, and 2013Singapore Finance Symposium. The findings and conclusions expressed are solely those of the authorsand do not represent the views of the NBER. The views expressed herein are those of the authorsand do not necessarily reflect the views of the National Bureau of Economic Research.
NBER working papers are circulated for discussion and comment purposes. They have not been peer-reviewed or been subject to the review by the NBER Board of Directors that accompanies officialNBER publications.
© 2014 by Stephen G. Dimmock, William C. Gerken, Zoran Ivković�, and Scott J. Weisbenner. Allrights reserved. Short sections of text, not to exceed two paragraphs, may be quoted without explicitpermission provided that full credit, including © notice, is given to the source.

Capital Gains Lock-In and Governance ChoicesStephen G. Dimmock, William C. Gerken, Zoran Ivkovi�ć, and Scott J. WeisbennerNBER Working Paper No. 20176May 2014JEL No. G11, G23, G34, H20
ABSTRACT
Because of differences in accrued gains and investors’ tax-sensitivity, capital gains “lock-in” variesacross mutual funds even for the same stock at the same time. Using this variation, we show that taxlock-in affects funds’ governance decisions. Higher tax lock-in decreases the likelihood a fund sellsa stock prior to contentious votes, and increases the likelihood the fund votes against management.Consistent with tax motivations, these findings are concentrated among funds with tax-sensitive investors.High aggregate capital gains across funds holding a stock predicts a higher likelihood managementloses a vote and a lower likelihood a contentious vote is proposed.
Stephen G. DimmockDivision of Finance and BankingNanyang Technological UniversitySingapore, [email protected]
William C. GerkenGatton College of Business and Economics550 S. LimestoneLexington, KY [email protected]
Zoran Ivkovi�ćDepartment of FinanceMichigan State University315 Eppley CenterEast Lansing, MI [email protected]
Scott J. WeisbennerUniversity of Illinois at Urbana-ChampaignDepartment of Finance340 Wohlers Hall, MC-7061206 South Sixth StreetChampaign, IL 61820and [email protected]

Prior research shows that capital gains taxation affects mutual funds’ trading decisions
(Huddart and Narayanan (2002); Cici (2012); Sialm and Starks (2012)). These studies document
a “lock-in” effect: to some extent, a mutual fund with a largely taxable clientele is locked into a
position with an unrealized capital gain; realized gains are costly for taxable investors because
they trigger a tax liability. Bergstresser and Poterba (2002) show that ignoring tax incentives is
costly for fund managers because tax-efficiency affects investment flows. Therefore, because of
this lock-in effect, the cost of exiting a position will differ across mutual funds even for the same
stock at any given time, depending on the tax status of the funds’ investors and the size of the
accrued gain (or loss) in that stock.
Capital gains lock-in may also affect mutual funds’ governance activities. Prior studies
suggest that, upon anticipating an imminent conflict with a company’s management, a fund
generally prefers to exit a position, rather than fight (i.e., directly oppose management).1
Economic incentives for this preference are clear: voting against management may reduce both
the likelihood the mutual fund will be included in corporate defined contribution plans (Davis
and Kim (2007); Ashraf, Jayaraman, and Ryan (2012)) and access to information from
management (Butler and Gurun (2012)).2 Roe (1990) argues that political and legal constraints
encourage mutual funds to exit rather than directly oppose management.
A mutual fund faces a dilemma when considering how to vote on a contentious proposal
(a proposal for which the fund believes that opposing management is likely value-enhancing for
shareholders). The mutual fund must weigh the potential value created by opposing the firm’s
management against the potential costs outlined above. Another consideration, relevant for
mutual funds with tax-sensitive investors and a capital gain on a stock, is that exiting a position,
rather than “staying and fighting” the firm’s management, would impose tax costs on the funds’
1 For related studies conducted on a broader set of institutional investors see, for example, Parrino, Sias, and Starks (2003) and McCahery, Sautner, and Starks (2011). 2 Matvos and Ostrovsky (2010), illustrating that voting against management can be costly, quote a mutual fund company’s statement to the SEC regarding vote disclosure rules that ‘‘… retaliation [from the firm] could be in the form of denial of access to company management in the course of our investment research on behalf of our shareholders.’’ See http://www.sec.gov/rules/proposed/s73602/rmason1.txt for further details.
1

investors. Thus, for a position with an unrealized capital gain, mutual funds with taxable
clientele must trade off these countervailing forces.
In this paper, we study the relation between capital gains lock-in and the funds’
willingness to oppose management on contentious proposals at annual shareholder meetings. A
mutual fund locked-in to a position for tax reasons may be more likely to oppose management
because the capital gains tax provides an incentive to hold a position with an accrued gain even if
the fund is not fully enamored with the firm’s management. There are two related reasons for
this. First, because exit from a holding with a gain is more costly for funds with tax-sensitive
investors, the fund’s investment horizon increases and the fund can benefit from the long-term
value created by the corrective action they take through their voting. Second, funds that are not
locked-in and that continue to hold the position are more likely aligned with management than
funds holding the stock because exit would trigger a tax liability for investors. Thus, funds with
larger accrued gains in a stock and with a tax-sensitive clientele may be more likely to oppose
management on contentious votes because the lock-in effect, rather than an affinity for
management, causes them to continue holding the stock in the first place. Thus, for funds that are
locked into a holding for tax reasons, a pragmatic alternative to sale is actively monitoring the
firm while continuing to hold the stock.3
Specifically, we test whether higher accrued gains, by making exit less attractive because
of the tax consequences from realizing accrued gains, increase the likelihood that a mutual fund
will oppose management. Our empirical setup is well-suited for these tests. We first confirm,
consistent with the studies referenced above, that there is indeed a negative relation between the
probability of a mutual fund selling a stock and the accrued capital gain4 of the stock holding
(and that this relation is stronger for funds with tax-sensitive investors). We then test how the
accrued gain affects the decision regarding whether to provide governance (i.e., “fight” by voting
against management) conditional on staying. For these tests, we focus on a subset of contentious
3 Bhide (1993, p.42) explicitly mentions that capital gains tax lock-in encourages active governance by reducing an investor’s willingness to sell shares. 4 For expositional simplicity, we use the term “capital gains” to refer to the percent change in a stock holding’s price since the time of purchase). Therefore, “capital gains” refer to both gains and losses in a stock position.
2

votes, for which opposing management is potentially value-increasing. Accordingly, based on
the results of Alexander, Chen, Seppi, and Spatt (2010), in our main results we limit the sample
to votes for which Institutional Shareholder Services (ISS) recommends that a vote against
management is in the interests of shareholders. Throughout the paper we refer to such
proposals/votes as being “contentious,” with opposition to management potentially value-
increasing for shareholders.5 In robustness tests, we show that our results also hold in the full
sample of all votes (although, as expected, the results are weaker in magnitude, because the full
sample of votes includes many non-controversial proposals).
In our Oppose Management regressions we obtain identification by including two sets of
fixed effects: one set for each vote and one set for each mutual fund-quarter combination. First,
for a given vote, the accrued capital gain since purchase varies across the different funds holding
the company’s stock, as does the tax status of those funds’ investors. This variation allows us to
include vote fixed effects in our specifications. These fixed effects eliminate many potential
sources of confounding variation, including the issue voted on, as well as the company’s
finances, governance, and past performance. For example, the past performance of the stock
(over the past quarter, past year, past five years, and so on) could certainly affect whether a
mutual fund opposes management (i.e., opposition to management may be lower following good
performance). Our vote fixed effects control for any relation between opposition to management
on a particular vote and past stock returns over any horizon because the stock return over a given
past horizon is the same for all investors. We identify the effect of capital gains lock-in on
governance by exploiting the differences across funds in their accrued capital gain in the same
stock at a given time, as well as differences across funds in the tax status of their investors. For
funds with taxable investors, it is this accrued capital gain that is relevant for tax-motivated
decisions. This identification strategy is possible because capital gains tax lock-in varies across
5 Alexander, Chen, Seppi, and Spatt (2010) examine stock-price reactions to ISS announcements of voting recommendations that oppose management, and show that ISS’s voting recommendations are generally value enhancing. Although Iliev and Lowry (2014) argue that ISS recommendations are not always value enhancing, at a minimum proposals for which ISS and management recommendations disagree are contentious in nature, with support for management not clearly in shareholders’ best interests.
3

different funds holding the same stock at the same point in time, allowing us to eliminate the
most obvious sources of omitted variables bias.
Second, for a fixed fund-quarter combination, the accrued capital gains vary across the
different stocks held by the fund at that point in time. This variation allows us to include fund-
quarter fixed effects in our specifications. These fixed effects eliminate many other potential
sources of confounding variation, such as the fund’s overall propensity to vote against
management during that quarter, propensity to follow ISS’s recommendations, factors related to
the fund’s family, as well as the fund’s flows and past fund performance.
The results show that mutual funds with higher accrued capital gains in a stock are more
likely to oppose management.6 Our results further demonstrate that, consistent with a tax
motivation, the relation between voting against management and accrued capital gains is stronger
for funds with a tax-sensitive clientele. In contrast, for mutual funds with a high proportion of
tax-deferred retirement assets, there is no relation between voting against management and
accrued capital gains. Also consistent with tax motivation, we find that the relation between
voting against management and accrued capital gains in a stock holding is stronger for funds that
have a high level of gains elsewhere in their portfolio (as opposed to having losses, which could
be used to offset realized capital gains for tax purposes). Again, this effect is only present for the
mutual funds with a primarily tax-sensitive clientele. We also find that the effects are present for
both long-term and short-term capital gains, with the magnitude of the effect greater for short-
term capital gains (that are taxed at a higher rate).
We use a multinomial logit framework to model the multiple choices available for mutual
funds facing a contentious vote: to exit, support, or oppose, and find further evidence that tax-
induced lock-in affects governance. For mutual funds with a tax-sensitive clientele, estimates
suggest that, as the accrued capital gain in the stock holding increases from -50% to 100%, the
probability of continuing to hold the stock and opposing management increases from 46% to
6 Consistent with prior studies, such as Del Guercio, Seery, and Woidtke (2008) and Fischer, Gramlich, Miller, and White (2009), we define opposing management as the fund either voting against, or withholding its vote from, management’s recommendation.
4

59%. At the same time, the probability of selling the stock falls from 8% to 3% and the
probability of continuing to hold the stock and supporting management falls from 46% to 38%.
Finally, we also show that the governance lock-in effect has consequences for the firms
held by mutual funds. When the aggregate accrued capital gains held by mutual funds are high
(relative to the firm’s total market value), management is significantly more likely to lose a
contentious vote. Furthermore, high aggregate accrued capital gains are associated with a lower
likelihood that a contentious vote appears on the agenda of the shareholder meeting in the first
place, and thus deter an agency conflict from arising. This holds after controlling for firm returns
at various horizons, mutual fund characteristics such as their average holding period in the stock,
and firm characteristics, including size, institutional ownership, and various entrenchment
measures. In our sample, management ultimately loses about one quarter of the contentious
votes. A one-standard deviation increase in the fraction of a firm’s ownership comprised of
accrued gains held by mutual funds is associated with a 1.0 percentage point increase in the
likelihood management loses the vote. However, this marginal effect increases to 4.4 percentage
points if the accrued gains are all held by funds with largely taxable investors, and falls to 0.1
percentage points if the accrued gains are all held by funds with largely tax-deferred retirement-
account investors. We also find that the lock-in effect for mutual funds is associated with fewer
contentious proposals coming up for vote at the shareholders’ meeting in the first place. In 39%
of the shareholder meetings in our sample, the agenda includes a contentious vote (i.e., one for
which ISS and management offer different recommendations). These contentious votes are
significantly less likely to occur if the aggregate accrued gains across all mutual funds holding
the stock is larger (but only if those gains are held by mutual funds with a tax-sensitive clientele).
Thus, tax lock-in affects not only individual mutual fund voting decisions, but also both vote
outcomes and the presence of contentious proposals on the meeting agenda.
As open-end mutual funds acquire an increasingly large fraction of total U.S. equity
(open-end mutual funds surpassed direct holdings by individuals as the largest category of U.S.
equity owners in 2004; Figure 1, based on French (2008, Table I)), it is all the more important to
improve our understanding of mutual funds’ decisions regarding whether to exit, stay and
5

support, or stay and fight. Overall, mutual funds appear to be relatively activist shareholders;
they are more likely to oppose management than are other categories of stockholders, and mutual
fund voting is a key determinant of whether a resolution passes (Morgan, Poulsen, Wolf, and
Yang (2011)). Thus, this trend in U.S. stock ownership has important implications for corporate
governance, and our paper contributes to understanding the governance decisions of this
increasingly influential class of investors.
FIGURE 1 ABOUT HERE
Indeed, our study contributes to a recent literature examining various motivations for
mutual funds’ voting decisions. Davis and Kim (2007), Matvos and Ostrovsky (2008), Ashraf,
Jayaraman, and Ryan (2012), Butler and Gurun (2012), and Cvijanović, Dasgupta, and
Zachariadis (2013) show that various conflicts of interest affect mutual funds’ voting decisions,
while Matvos and Ostrovsky (2010) consider peer effects in mutual fund voting. Morgan,
Poulsen, Wolf, and Yang (2011) consider many fund-level characteristics that affect mutual
funds’ voting decisions, such as fund size, turnover ratios, and social responsibility objectives. In
contrast with these papers, we focus on how capital gains lock-in affects mutual funds’ voting
decisions. As discussed above, many other factors influence how mutual funds vote at annual
shareholder meetings. Our specification includes both vote-level and fund-level fixed effects,
which subsume many of these other factors, and thus allows us to identify the effect of lock-in on
governance.
Another contribution of this paper is to document another avenue through which capital
gains taxation influences the behavior of institutional investors. Huddart and Narayanan (2002),
Cici (2012), Sialm and Starks (2012), and Sialm and Zhang (2013) show that capital gains
taxation affects mutual funds’ trading decisions. We further find that capital gains lock-in
increases the likelihood that a locked-in fund will oppose a firm’s management during
contentious votes. This is an important finding because just over one-half of equity mutual fund
assets are held by taxable investors (Sialm, Starks, and Zhang (2014)).
6
Our study is also related, although indirectly, to a voluminous literature that examines
how liquidity affects the governance activities of blockholders,7 in that capital gains tax lock-in
can loosely be viewed as a measure of illiquidity. In several respects, however, our study differs
from the papers in that literature. First, they are concerned with the governance activities of
large, concentrated blockholders. In contrast, we consider mutual fund holdings. Although,
collectively, mutual funds are the single largest category of equity owners in the U.S. (French
(2008)), their ownership is more diffuse than that of traditional blockholders. Our study thus
sheds light on the relation between governance and liquidity for a large, but less-studied class of
investors. Second, we consider a very different form of “liquidity” than the studies referenced
above, which consider traditional measures of liquidity such as bid-ask spreads or Amihud’s
(2002) measure. These commonly-used measures of liquidity vary across firms, but not across
investors within a firm, while our measure of capital gains tax lock-in varies across investors in
a given stock at a given time. This provides a compelling identification strategy to identify the
lock-in effect on governance. Third, because our empirical design focuses on how governance
decisions are influenced by the accrued gains of stocks already held by the mutual fund, we do
not test the theories that focus on whether liquidity attracts investors to accumulate blocks of
shares in the first place. Instead, we test whether, conditional that the stock is already held, tax
lock-in affects governance activities by mutual funds.
The remainder of the paper is organized as follows. Section I reviews the data and
variables. Section II first confirms that, consistent with several prior studies, there is a negative
relation between mutual funds’ sale decisions and accrued capital gains in the stock holding. We
then show that accrued capital gains also predict mutual funds’ voting decisions. Section III then
shows how capital gains affect the joint voting/trading decision. Section IV documents that the
aggregate accrued capital gains of all mutual funds that hold a stock affect both the outcome of a
7 As Kahn and Winton (1998) highlight, the relation between governance by blockholders and liquidity is complicated, with various theories predicting different relations between the two. For example, Coffee (1991), Bhide (1993), and Back, Li, and Ljungqvist (2013) argue that liquidity discourages blockholders from actively engaging in governance: when exit is easy, blockholders do not engage in information acquisition or costly governance activities. Kyle and Vila (1991), Maug (1998), Faure-Grimaud and Gromb (2004), Edmans (2009), Edmans and Manso (2011), and Edmans (2014) argue that liquidity instead encourages blockholders to engage in governance, either because liquidity allows the investor to acquire a block or because liquidity allows the investor to profit from intervention. Edmans (2009) further argues that, conditional on already owning a block, liquidity improves governance because it increases the credibility of the threat of exit, which constrains management.
7
contentious vote as well as whether such a contentious vote appears on the agenda of the
shareholder meeting. Section V concludes.
I. Data and Summary Statistics
The data for this study come from multiple sources, including the CRSP Open-End
Survival Bias Free Mutual Fund Database, Thompson-Reuters Mutual Fund Holdings Database,
Pensions & Investments’ Survey of Defined Contribution Plans, CRSP Stock File, ISS Voting
Analytics Database, and RiskMetrics Governance Database.
A. Data
A.1 Mutual Fund Data
Mutual fund data come from the CRSP Open-End Survival Bias Free Mutual Fund
Database. We focus on actively-managed U.S. domestic equity mutual funds, and eliminate
balanced, bond, international, money market, and sector funds. Moreover, we also remove funds
that hold fewer than ten stocks or have less than two million dollars in total net assets at the end
of the previous quarter. These screening criteria correspond closely to those of Kacperczyk,
Sialm, and Zheng (2008). Mutual fund stock holdings come from the Thompson-Reuters Mutual
Fund Holdings Database. Funds are required to disclose their holdings semiannually, but during
our sample period many funds disclose their holdings quarterly. We match the CRSP Mutual
Fund data to the holdings data using the MFLINKS file. Finally, for a subset of our analyses we
use information on the tax status of the mutual funds’ investors, obtained from Pensions &
Investments’ annual Survey of Defined Contribution Plans. Each year the trade publication
Pensions & Investments asks mutual fund families to list the proportion of assets held by defined
contribution pension plans for the family’s 12 largest mutual funds.8 We match the Pensions &
Investments data, available for only a subset of our sample, with the CRSP Mutual Fund data
using the funds’ ticker symbols and names.
8 Sialm and Starks (2011) and Sialm, Starks, and Zhang (2014) provide a detailed description of this dataset.
8

A.2 Stock Data
We obtain information on stock prices, trading volume, stock splits, market capitalization
and share type from the CRSP (monthly and daily) stock database. We match mutual fund
holdings to the CRSP stock database by CUSIP.
A.3 Mutual Fund Voting Data
As of July 2003, the SEC requires all mutual funds to disclose their voting records by
filing Form N-PX. Institutional Shareholder Services (ISS) compiles the information from these
filings to create the ISS Voting Analytics database. Our dataset includes fund voting records
from 2003 through the end of 2008. For each fund-stock combination, we have one observation
per proposal (i.e., per fund-company-vote).9 For each observation, we observe how the fund
voted, the issue voted upon (e.g., director election, compensation proposal), management
recommendation, ISS recommendation (which is disseminated a few weeks before the vote
occurs), and the overall vote outcome. We match the ISS Voting Analytics database to the CRSP
Mutual Funds database by hand, using fund and fund family names. The sample of mutual funds
included in Voting Analytics increases over the sample period; in the earlier years Voting
Analytics focused on the largest mutual fund families. Consequently, we do not have voting data
for all mutual funds.
B. Select Variables
B.1 Capital Gains
To conduct this study, we impute the accrued capital gain embedded in each individual
stock in each mutual fund’s portfolio. Numerous prior papers impute stock-level capital gains
9 If a fund lends shares to short-sellers and fails to recall the shares before the record date of the vote, the fund cannot vote its shares. In our data, we drop observations in which a fund holds the stock at the end of the quarter prior to the quarter of a vote, is not recorded voting or withholding its vote, but holds the stock at the end of the quarter (as these observations may reflect instances in which the fund did not sell the stock before the vote, but instead just lent out shares). As a practical matter, we find that at most 0.2% of fund-vote combinations are missing due to securities lending (i.e., are dropped due to our sample restriction), suggesting this issue is very unlikely to affect our results. This apparent negligible security-lending by mutual funds during votes in which ISS and management’s recommendations disagree is very much consistent with a pair of SEC No-Action Letters to State Street Bank & Trust Company in 1972 that established that funds have a fiduciary duty to recall shares prior to “material” votes. Additionally, Aggarwal, Saffi, and Sturgess (2012) find that institutional investors frequently recall loaned shares prior to a vote.
9

using a variety of methods.10 These methods vary across two dimensions: (1) imputed
transaction price; (2) assumed sales rule.
We observe holdings at the end of each quarter, and from this we infer transactions
during the quarter. Prior studies impute transaction prices in four different ways: beginning of
quarter prices, end of quarter prices, daily average prices, and daily transaction weighted prices.
In this paper, we report results based on daily transaction weighted prices, likely the most
accurate estimate of actual transaction prices.
Funds may accumulate and divest positions over several quarters. Therefore, a fund may
have multiple tranches of shares, each with a different cost basis. To impute the overall capital
gain for a position, we must assign partial sales to a specific tranche. Prior studies use four
different rules: the share-weighted average price, last-in-first-out, first-in-first-out, and highest-
in-first-out. In this paper, we report results based on the highest-in-first-out method, because
Dickson, Shoven, and Sialm (2000) show this is the most tax efficient rule.11
For each stock i held by fund f at time t, we compute the value weighted cost basis
(VWCB) as:
𝑉𝑊𝐶𝐵𝑓,𝑖𝑡 =
∑ 𝑆𝑓,𝑖𝑡,𝑡−𝑛 ∙ 𝑃𝑓,𝑖
𝑡,𝑡−𝑛𝑡𝑛=0
∑ 𝑆𝑓,𝑖𝑡,𝑡−𝑛𝑡
𝑛=0,
(1)
where 𝑆𝑓,𝑖𝑡,𝑡−𝑛 is the number of shares of stock i purchased by fund f at date t-n, still held at time t,
and 𝑃𝑓,𝑖𝑡,𝑡−𝑛 is the imputed price paid for these shares.
The accrued capital gains for fund-stock combination f, i at time t, is:
𝐶𝑎𝑝𝑖𝑡𝑎𝑙𝐺𝑎𝑖𝑛𝑓,𝑖𝑡 =
𝑃𝑓,𝑖𝑡 − 𝑉𝑊𝐶𝐵𝑓,𝑖
𝑡
𝑉𝑊𝐶𝐵𝑓,𝑖𝑡 (2)
10 See, for example, Huddart and Narayanan (2002), Frazzini (2006), Jin (2006), and Cici (2012). 11 As a robustness check, we compute all 16 possible imputed capital gains variables from the intersection of the four transaction price rules and four sales rules. All 16 methods give similar results. Prior studies, including Jin (2006) and Cici (2012), also find that different methods give similar results.
10

B.2 Voting
As discussed in the introduction, we focus on votes that likely represent a meaningful
conflict between management and shareholders. Therefore, for our main analyses, we limit our
sample to votes for which ISS recommendation differs from management recommendation. This
results in a final sample of 10,950 unique votes12 over the period from 2003 to 2008. We note,
however, that our results are robust to using the full sample of all votes, although, as expected,
the results are weaker in magnitude because the full sample of votes includes many non-
controversial proposals.
The dependent variable in our analyses of mutual fund voting is an indicator variable
OpposeManagement. It is set to one if the mutual fund does not follow management’s
recommendation, either by voting against management or by withholding its vote, and is set to
zero if the fund votes to support management. Specifically, a mutual fund does not follow
management recommendation when management recommends voting “For” (“Against”), yet the
fund either votes against (for) the proposal or withholds its vote. Withholding a vote is an active
decision, just like voting for or against a proposal, not a default category. This definition is very
natural and is consistent with recent literature (e.g., Del Guercio, Seery, and Woidtke (2008);
Fischer, Gramlich, Miller, and White (2009)). As discussed by Fischer, Gramlich, Miller, and
White (2009, p. 175), “Withhold” and “Against” are often functionally equivalent because the
vote passage often depends on the ratio of “For” votes to total votes (including withheld votes).
Under the Investment Advisers Act (1940), advisers have a duty to monitor corporate events and
to vote the proxies (i.e., for, against, or withhold).13
C. Summary Statistics
Table I presents summary statistics for the key variables over the 2003-2008 sample
period for the merged mutual fund holding – Voting Analytics dataset, which we limit to the
12 Of these votes, 68% involve director elections, 13% involve compensation proposals, 8% involve non-director board issues (e.g., change the size of the board or eliminate cumulative voting), 7% involve governance issues (e.g., amend the articles or bylaws of the company), and the remaining 4% represent other issues (e.g., social issues). 13 Consistent with this regulation, only 0.5% of funds do not vote in our sample of contentious proposals and only 2.6% abstain.
11
fund-vote combinations for which the ISS recommendation does not equal the management
recommendation (these data form the basis for our regressions in Tables II and III). Particularly
relevant for our analyses of voting patterns is the indicator variable OpposeManagement, which
is one for 53% (0.53) of the fund-vote observations in our sample. Thus, funds support
management for 47% of the fund-vote observations.
The table also displays summary statistics of the capital gains (and losses) since purchase
for mutual funds’ stock holdings. Our key independent variable is CapitalGain, defined as the
percentage accrued capital gain or loss in natural units (e.g., 0.34 = 34% and -0.61 = -61%).14
The average accrued capital gain of a mutual fund’s stock holding is 34%, with one-tenth of
holdings having a capital gain of at least 109% and one-tenth having a capital gain of -17% or
worse. We also calculate the standard deviation of CapitalGain for each vote. If all mutual funds
bought a stock at the same time, the within-vote standard deviation of CapitalGain would be
zero because all mutual funds would have the same return since purchase. This is definitely not
the case; the average within company-vote standard deviation in accrued capital gains is quite
large, 49% (0.49). Similarly, we calculate the standard deviation in CapitalGain for each fund-
quarter combination. Once again, the average standard deviation in accrued capital gains across
the stocks held in the portfolio of a given fund at a point in time is also large, 51% (0.51). Thus,
there is substantial variation in both the accrued capital gain across mutual funds for a given
stock at a given time, as well as in the accrued capital gain across the stocks held by a given
mutual fund at a given time, allowing us to employ specifications with both vote fixed effects
and fund-quarter fixed effects.
In addition to exploiting variation in the accrued capital gain mutual funds have in a
given stock, we also exploit variation across funds in the tax sensitivity of their
investors. % Defined Contribution Investors is the percentage of the fund owned by defined-
contribution retirement plans. For ease of interpretation, in some analyses we create an indicator
14 Although our vote sample begins in 2003, we begin tracking capital gains for mutual funds in 1984, when the mutual fund-holding data begin, assuming that all positions in the fund’s first filing were purchased in the prior quarter. We then carry these imputed capital gains forward to the beginning of our voting sample in 2003. In our sample, only 0.2% of positions were purchased prior to 1984.
12

variable, HighDC, indicating whether the proportion of fund assets held by retirement plans is
above the median (27.1% of assets across all fund-quarter observations in our sample). As an
additional measure of a fund’s tax sensitivity, we also calculate FundOverhang, the value-
weighted capital gain across all of the stocks held by the fund. Funds can reduce the tax liability
they pass on to their investors from realized capital gains by realizing capital losses elsewhere in
their portfolio. Thus, funds with a lower FundOverhang are likely less tax sensitive. At the
sample median, accrued capital gains are 17% of the fund’s total value. For ease of
interpretation, in some analyses we create an indicator variable, LowFundOverhang, set to one
for funds with a below median level of total accrued capital gains across all of their holdings and
set to zero otherwise.
Finally, although the primary focus of this paper is whether capital gains lock-in affects a
given fund’s vote at a firm meeting, in Section IV we also consider whether the aggregate
accrued gains of all mutual funds holding a given firm’s stock predicts whether the management
of that firm actually lose a contentious vote, and whether these aggregate accrued gains deter a
contentious proposal from appearing on the meeting agenda in the first place.
ManagementLosesVote is an indicator variable set to one if management loses a contentious
vote, and set to zero if management wins (thus, this variable is measured at the vote-level).
Management loses 24% of the contentious votes in our sample. ContentiousVoteHeldAtMeeting
is an indicator variable set to one if there are any contentious proposals to be voted on in a
particular meeting and is set to zero if none of the proposals are contentious (thus, this variable is
measured at the firm-meeting level, which is typically once a year). There is at least one
contentious proposal at 39% of the meetings. This variable is calculated using the full sample of
votes from Voting Analytics, determining for a given firm meeting whether the voting
recommendations of management and ISS differ for any of the proposals.
TABLE I ABOUT HERE
13

II. Capital Gains Lock-in and the Propensity to Oppose
Management
In this section, we examine the relation between the mutual fund’s voting decisions for a
stock and the fund’s accrued capital gains on that stockholding. As mentioned in the
introduction, Huddart and Narayanan (2002), Cici (2012), and Sialm and Starks (2012) all
document a negative relation between the likelihood a fund sells a stock and the accrued capital
gains on that stock holding, which they attribute, at least in part, to tax motivations.15 Because
capital gains lock-in must affect the sale decision of mutual funds for lock-in to affect
governance decisions, we confirm this finding in Appendix Table I. In that table, we test whether
accrued capital gains and the tax status of a mutual fund’s clientele affect funds’ sales-
propensity. In these tests, we interact CapitalGain (the accrued capital gain of a mutual fund in a
given stock holding) with an indicator variable for the presence of a large proportion of tax-
deferred investors (HighDC). Because a mutual fund’s likelihood of selling a stock next quarter
falls with how long the stock has already been held,16 we follow Ivković, Poterba, and
Weisbenner (2005) in using a Cox proportional hazards model. As shown in Appendix Table I,
we find a strong negative relation between the likelihood a fund sells a given stock during the
current quarter and the fund’s accrued capital gain in the stock. Further, this negative relation is
significantly weaker for funds with a more tax-sensitive clientele, as captured by the coefficient
on HighDC. Having established that capital gains lock-in exists, we next consider whether this
lock-in affects mutual funds’ voting decisions. Specifically, we consider whether the fund is
more likely to oppose management, given that the fund is already stuck holding the stock (not
15 In contrast to the studies referenced above, Frazzini (2006) finds that mutual fund managers seem to be subject to the disposition effect (a tendency to realize gains and hold on to losses that could result from prospect theory and loss aversion). In particular, Frazzini finds that, over the period 1980-2002, the aggregate proportion of gains realized (PGR) by mutual funds exceeds the aggregate proportion of losses realized (PLR). However, using similar data as we do, Cici (2012) finds that, consistent with tax lock-in, PLR exceeds PGR for mutual funds over the period 1980-2009, as well as for each of the subperiods 1980-89, 1990-99, and 2000-09. While Frazzini uses a different methodology and a different sample than we do, in unreported results we replicate Cici’s findings. 16 On average, 11% of stock positions are sold in any given quarter (without controlling for the length of the holding period up to that quarter). In untabulated results, we find that the unconditional probability of a mutual fund selling a stock during the next quarter is 19% if the stock has been held for only one quarter, but declines to 12% after six quarters, and to 8% after 12 quarters.
14

necessarily because of an affinity for management but rather for tax reasons) and will thus
continue to hold the stock instead of exiting.
As previously discussed, voting against management may be costly to the mutual fund
(e.g., Davis and Kim (2007); Ashraf, Jayaraman, and Ryan (2012); Butler and Gurun (2012)). If
a mutual fund disagrees with management, but does not want to directly vote against them, one
solution is for the fund to vote with its feet by selling the stock. The benefits of doing so,
however, might be outweighed by the tax liability triggered by realizing an accrued capital gain;
Bergstresser and Poterba (2002) highlight that realizing an accrued capital gain can be costly to
the fund, because such tax inefficiency reduces future investment flows from tax-savvy investors
(not to mention the tax liability passed on to the current investors!).
Thus, if a mutual fund is locked-in to a position for tax reasons (by virtue of having a tax-
sensitive clientele), instead of exiting, the fund may choose a pragmatic alternative to sale – to
continue holding stocks with accrued capital gains and to devote more resources to monitoring.
For many votes, however, management recommendations are likely uncontroversial in nature, so
there is less reason to expect a strong relation between opposition to management and accrued
capital gains in the full sample of all proposals (as compared to the subsample of contentious
votes for which the ISS and management recommendations differ). Therefore, we use the
subsample of contentious proposals for most of our analyses.
A. Voting Behavior of Mutual Funds and Relation with Accrued Gains in a Stock
We begin our analysis of whether capital gains lock-in affects mutual funds’ voting
decisions by estimating models conditional on funds holding the stock at the time of the
shareholder meeting – the decision for these funds at that time is whether to vote for or against
management. This analysis provides straightforward and easy-to-interpret results. We expand
upon these results in the next section, by estimating multinomial logit models of a fund’s three-
way choice of selling a stock just before the shareholder meeting, continuing to hold the stock
and supporting management, or continuing to hold the stock and opposing management.
15

In this section, we estimate a linear probability model that relates the indicator variable
OpposeManagement (set to one if the mutual fund votes against or withholds its vote from the
management recommendation, and set to zero otherwise) with Capital Gain (the accrued capital
gain or loss in the stock holding) in the following panel regression:
𝑂𝑝𝑝𝑜𝑠𝑒𝑀𝑎𝑛𝑎𝑔𝑚𝑒𝑛𝑡𝑓,𝑖,𝑣,𝑡 = 𝛽 ∙ 𝐶𝑎𝑝𝑖𝑡𝑎𝑙𝐺𝑎𝑖𝑛𝑓,𝑖,𝑡−1 + 𝛿𝑖,𝑣
+ 𝜃𝑓,𝑡 + ��𝛾𝑞 ∙ 𝐼𝑞�20
𝑞=1
+ 𝜀𝑖,𝑓,𝑣,𝑡
(3)
where δi,v are vote fixed effects, θf,t are fund-quarter fixed effects, and Iq, q = 1,...,20 are
indicator variables set to one if fund f has held stock i for q quarters, and to zero otherwise. We
report t-statistics based on standard errors clustered by fund-quarter. The vote effects remove all
variation in the issue voted on, as well as any company-level effects such as past stock
performance, size, and governance. The fund-quarter fixed effects remove all variation at the
fund-period level, such as past fund returns, overall voting tendencies that quarter, or flows into
the fund. Thus, our identification comes from variation in accrued capital gains across different
stocks held by the same fund in the same quarter, after conditioning out fund-level and vote-level
differences. Finally, the length-of-holding indicator variables control for the possibility that a
funds’ propensity to oppose management changes with the length of the holding period,
independent of accrued capital gains.
To test whether the relation between voting patterns and capital gains differs for funds
that have a tax-insensitive clientele, we also estimate a similar regression in which we interact
CapitalGain with HighDC (an indicator variable set to one if the proportion of fund assets held
by retirement plans is above the sample median and set to zero otherwise). Because HighDCf,t
does not vary across fund f’s holdings in calendar quarter t, it is absorbed by the fund-quarter
fixed effects, resulting in the following specification:
16

𝑂𝑝𝑝𝑜𝑠𝑒𝑀𝑎𝑛𝑎𝑔𝑚𝑒𝑛𝑡𝑓,𝑖,𝑣,𝑡 = 𝛽1 ∙ 𝐶𝑎𝑝𝑖𝑡𝑎𝑙𝐺𝑎𝑖𝑛𝑓,𝑖,𝑡−1
+ 𝛽2 ∙ �𝐶𝑎𝑝𝑖𝑡𝑎𝑙𝐺𝑎𝑖𝑛𝑓,𝑖,𝑡−1 × 𝐻𝑖𝑔ℎ𝐷𝐶𝑓,𝑡�
+ 𝛿𝑖,𝑣 + 𝜃𝑓,𝑡 + ��𝛾𝑞 ∙ 𝐼𝑞�20
𝑞=1
+ 𝜀𝑖,𝑓,𝑣,𝑡
(4)
In some specifications, we also include interactions with LowFundOverhang, an indicator
variable set to one for funds whose total accrued capital gains across all of their holdings is
below the median, and set to zero otherwise.
Column (1) of Table II presents the first specification (Equation (3)), which includes only
accrued capital gains. As expected, we find a positive relation between OpposeManagement and
CapitalGain in Table II (with the regression coefficient of 0.003, statistically significant at the
5-percent level). This result is consistent with our prediction – funds that are locked-in to a stock
holding because of capital gains taxes are more likely to oppose management.
As discussed earlier, prior research demonstrates that tax lock-in affects mutual funds’
sales decisions; the holding period of a stock increases with its accrued gain, which we confirm
in Appendix Table I. In this section, we find that, conditional on holding the stock at the time of
the vote, funds with larger accrued gains are also more likely to oppose management. This
reflects a simple tradeoff. Opposing management may be costly for all funds for the reasons cited
in the introduction and at the beginning of this section. As discussed earlier, however, funds with
accrued gains in a stock can benefit more from opposing management in an attempt to boost the
stock’s price in the future, because they have a longer expected holding period relative to funds
with accrued losses in the stock. Another, similarly-motivated, explanation for this result is that
the tax lock-in effect may cause affected funds to continue to hold a stock even if they are not
enamored with the management – making them more likely to vote against management on
contentious proposals relative to funds not “forced” by taxes to be holding the stock at the time
of the vote.
The result in column (1) does not differentiate by the tax status of the funds’ investors –
the lock-in effect on governance should be weaker for funds with more assets held by tax-
17
deferred retirement accounts. We use the Pensions & Investments data to identify more precisely
why accrued capital gains explain mutual funds’ decisions to vote against management. If this
relation stems from tax motivations, the positive relation between opposing management and
capital gains in the stock should be weaker for funds with more tax-deferred retirement assets
under management. To test this, column (2) presents the second specification (Equation (4)),
which includes both accrued capital gains and its interaction with HighDC. Consistent with the
tax lock-in hypothesis, the coefficient on the interaction CapitalGain × HighDC is -0.009. It is
negative and significant at the 1-percent level, almost exactly offsetting 0.011, the positive and
statistically significant coefficient for CapitalGain (which, in this specification, represents the
relation between opposing management and accrued capital gains for funds with tax-sensitive
investors). Thus, the propensity to oppose management varies with the amount of accrued capital
gains for funds with low levels of retirement account assets, but not for funds with high levels of
retirement account assets.17
In column (3), we also include interaction terms with LowFundOverhang, an indicator
variable set to one for funds whose total accrued capital gains across all of their holdings is
below the median, and set to zero otherwise. Because funds can use realized capital losses to
offset realized capital gains, the effect of tax lock-in should be weaker for funds with lower fund-
level capital gains (i.e., LowFundOverhang = 1) This predicts a negative coefficient on
CapitalGain × LowFundOverhang. Moreover, LowFundOverhang should mitigate the lock-in
effect more for funds with a tax-insensitive clientele (i.e., HighDC = 0) than for funds with a tax-
sensitive clientele (HighDC = 1). Thus, we expect a positive coefficient on the triple interaction
CapitalGain × HighDC × LowFundOverhang. This is precisely what we find. The positive effect
of CapitalGain on OpposeManagement (the regression coefficient, statistically significant at the
1-percent level, is 0.013) is almost fully offset for those funds with a low fund-level capital gains
17 By definition, HighDC funds have both a higher fraction of investment that is tax-insensitive as well as more retirement plan business. Therefore, the lack of a relation between CapitalGain and OpposeManagement for HighDC funds could simply reflect that funds with more retirement-plan business are less willing to vote against management. The key point of our identification strategy is that, while funds with a tax-sensitive clientele (i.e., HighDC = 0) may also care about alienating management by opposing them on a vote, they are more likely to do so if the stock holding has a gain than a loss because of the tax-induced lock-in effect.
18

overhang (the regression coefficient associated with CapitalGain × HighDC, significant at the
1-percent level, is -0.012). The positive and significant coefficient of 0.017 on the triple
interaction, CapitalGain × HighDC × LowFundOverhang shows that, for funds with a tax-
insensitive clientele, the fund-level capital gains overhang does not influence the relation
between CapitalGain and OpposeManagement because the tax sensitivity of these funds is
already low.
TABLE II ABOUT HERE
B. Robustness Tests
We conclude this section by reporting various robustness tests of our
OpposeManagement regression. In particular, in untabulated analyses, we consider the effect of
holding period (short-term vs. long-term), expanding the sample to analyze all vote outcomes
(not just votes on proposals for which the ISS recommendation differed from that of
management), and dividing the sample into management proposals (the votes of which are
binding) and other votes that may be more symbolic in nature (such as shareholder proposals
with nonbinding results and director elections in which candidates are often unopposed).
Short-term capital gains are taxed at a higher rate than long-term gains, suggesting that
our regression results should be stronger for short-term gains. Also, because most mutual fund
holdings in our sample are long-term (68% of mutual fund holdings have been held at least 12
months), a concern is that our OpposeManagement results may only apply to short-term capital
gains and thus be more transitory in nature. In a regression otherwise analogous to Equation (3),
yet with capital gains separated by short-term and long-term status, the coefficient associated
with short-term gains is 0.014 (significant at the 5-percent level), and the coefficient associated
with long-term gains is 0.003 (significant at the 1-percent level). Among funds that have a more
tax-sensitive clientele (i.e., HighDC = 0), the coefficient associated with short-term gains is
0.046, and the coefficient associated with long-term gains is 0.011 (both significant at the
19

1-percent level). Thus, as predicted, the lock-in effect on voting is stronger for short-term gains,
but is present for both short-term and long-term mutual fund holdings.18
The analyses in this section have focused on mutual fund voting decisions on proposals in
which the recommendations of ISS and management differ. This is done to identify a set of
proposals for which, a priori, opposing management may be value-increasing – or, at a
minimum, to identify a set of contentious proposals in which support for management is not
clearly in shareholders’ best interests. Nonetheless, as a robustness test, we also estimate the
OpposeManagement regression on the sample of votes in the Voting Analytics dataset in which
the recommendations of ISS and management are the same. We conduct this analysis for two
reasons. First, to ensure the results are generalizable for the overall sample. Second, because
funds and ISS may occasionally disagree about the value-maximizing course of action19 and,
thus, funds may oppose management even in some instances in which ISS supports
management’s view on a proposal. In these latter cases, we would also expect opposition to
management to be positively associated with accrued capital gains in a stock holding, but with a
smaller magnitude than is found for the sample of votes in which the ISS and management
recommendations differ (because the full sample contains a large number of non-controversial
votes). This is exactly what we find. In the specification in which we interact CapitalGain with
HighDC, analogous to column (2) of Table II, the coefficient on CapitalGain is 0.004
(significant at the 1-percent level) and the coefficient on CapitalGain × HighDC is -0.001
(significant at the 5-percent level). Thus, capital gains lock-in does affect mutual funds’ voting
decisions in the full sample of all votes, but, as expected, the effect is much larger in the
subsample of contentious votes.
Finally, our sample contains votes on management proposals, shareholder proposals, and
director elections. Votes on management proposals are binding. In contrast, votes on shareholder
proposals are generally not binding and candidates in director elections are often unopposed,
18 In untabulated results, and consistent with Sialm and Starks (2012), we also find that the lock-in effect in mutual fund sales is indeed stronger for fund holdings with a holding period less than 12 months. Importantly, we find that a lock-in effect is also present for long-term capital gains, with this effect stronger for funds with more tax-sensitive investors. 19 Iliev and Lowry (2014) note that some mutual funds place relatively little weight on ISS recommendations in their voting decisions.
20

making these votes perhaps more symbolic in nature. In interpreting the results, we assess
whether these symbolic votes drive the results20 by separating our sample into votes on
management proposals and other votes (i.e., shareholder proposals and director elections). We
find that, if anything, the results are stronger for the binding management proposals. Focusing on
the OpposeManagement specification that includes interactions with HighDC, for the binding
management proposals, the coefficient on CapitalGain is 0.024 (significant at the 1-percent
level) and the coefficient on CapitalGain × HighDC is -0.021 (significant at the 5-percent level).
For the non-binding shareholder proposals and director elections, the coefficient on CapitalGain
is 0.007 (significant at the 5-percent level) and the coefficient on CapitalGain × HighDC
is -0.005 (t-statistic of 1.60). Thus, our key results regarding the lock-in effect on mutual fund
voting are significant for both binding and non-binding proposals.
III. Support, Oppose, or Exit: A Multinomial Logit Approach
The dependent variable in the previous section was an indicator variable contrasting two
choices – conditional upon holding the stock at the time of the vote, the fund can either support
or oppose management. An alternative specification, presented in this section, is to model the
dependent variable as a choice between three alternatives: sell, stay and support management, or
stay and oppose management. In this framework, the sample includes all fund holdings at the end
of the quarter before a vote. We define sell (i.e., exit) as the complete liquidation of the stock
before the vote (i.e., in the time period from the start of the quarter until the date of record for
voting in the shareholder meeting). For those funds that continue to hold the stock until the vote,
we measure whether the fund supports or opposes management (as in Section II).
We use a multinomial logit model to test the relation between these three choices and
accrued capital gains. This approach thus unites the results presented in Appendix Table I
(relating sale propensity and accrued capital gains) and in Section II (relating opposing
20 Cai, Garner, and Walkling (2009) and Fischer, Gramlich, Miller, and White (2009) show that significant levels of dissenting votes, even if they fall short of winning, are often followed by changes in the board, management, or corporate actions within the next year.
21

management and accrued capital gains), and thus simultaneously explores the full range of
choices available to the funds. The covariates are the same as in Table II, and the specification
includes both vote and fund-quarter fixed effects, as well as indicator variables for the number of
quarters the fund has held the stock. We use the method of Chamberlain (1980) to control for the
vote and fund-quarter fixed effects.21
Table III presents the multinomial logit results. In Panel A, the key independent variable
is CapitalGain. In Panel B, we add the interaction term CapitalGain × HighDC. In Panel C, we
add further interactions with LowFundOverhang. For all three panels, the first column shows
results for the Sell decision and the second column shows results for the OpposeManagement
decision. Continuing to hold the stock and supporting management is the excluded category. The
t-statistics are based on standard errors clustered by fund-quarter. Note that the number of
observations increases relative to Table II, because the sample now includes fund-vote
combinations for which the fund sells the stock before the vote. The unconditional probabilities
of the three outcomes across all the fund-quarter observations are: 6% probability of a complete
stock sale before the vote, 44% probability of continuing to hold the stock and support
management, and 50% probability of continuing to hold the stock and oppose management (by
either a vote against management or a withheld vote).22
The results displayed in Table III are consistent with our earlier results. Column (1) of
Panel A shows that higher accrued capital gains in a stock holding are associated with a lower
probability that the fund sells the stock (relative to the probability of supporting management).
Column (2) shows that higher accrued capital gains are associated with a higher probability that
the fund opposes management (again, relative to the probability of supporting management). A
common way to assess the economic magnitude of the results of the multinomial logit model is
to convert the coefficients to relative risk ratios. For the coefficients in Panel A, the relative risk
21 Charbonneau (2013) provides details on implementing Chamberlain (1980) in a model with multiple fixed effects. 22 At first glance, the 6% probability of exiting a stock position before the vote seems low/inconsistent relative to the 11% probability of liquidating a stock holding over the subsequent quarter that was reported in an earlier footnote in Section II. However, across all the observations in the multinomial logit model, 32% of the votes are in the first month of a quarter, 52% of the votes are in the middle month of the quarter, and 16% of the votes are in the last month of the quarter. Thus, the timeframe over which a stock can be sold before a vote is often only one or two months (as opposed to a full quarter), thus explaining the difference between the 6% and 11% figures.
22

ratio of selling the stock relative to holding it and supporting management is 0.77, implying that
if CapitalGain increases by 100 percentage points the relative probability of selling the stock
decreases by 23%. The relative risk ratio of holding the stock and opposing management relative
to supporting management is 1.06, implying that if CapitalGain increases by 100 percentage
points the relative probability of opposing management increases by 6%.
Panel B of Table III includes an interaction term between accrued capital gains and an
indicator variable for funds with a high proportion of defined contribution retirement plan assets
(indicating less sensitivity to tax lock-in effects). The results show that, as the accrued capital
gain increases: (1) the probability of sale decreases, but the effect is weaker for the funds with
higher defined contribution assets; and (2) the probability of opposing management increases,
but not for the funds with a higher share of defined contribution assets.
For the group of funds with fewer tax-deferred investors, the implied economic
magnitudes are large. In Panel B, the coefficients on CapitalGain represent the effects of accrued
capital gains on the decision to exit/support/oppose management for funds with a low fraction of
retirement account assets (i.e., HighDC = 0). For this group of tax-sensitive funds, a
transformation of the coefficients in Panel B results in a relative risk ratio of selling the stock
relative to holding the stock and supporting management of 0.57, while the relative risk ratio of
holding the stock and opposing management relative to supporting management is 1.35. These
relative risk ratios imply that as CapitalGain increases from 0% to 100%, the relative probability
of selling the stock decreases by 43%, while the relative probability of opposing management
increases by 35%.
In Panel C of Table III, we report results of a multinomial logit model that includes
further interactions with the indicator variable LowFundOverhang. The positive relation between
the likelihood of a mutual fund voting against management and accrued capital gains in a stock
holding is significantly weaker for funds with a low level of capital gains across all their fund
holdings (i.e., LowFundOverhang=1). We also find, as predicted, that LowFundOverhang
mitigates the lock-in effect on voting more for funds with fewer retirement assets than for funds
23

with more retirement assets (i.e., the triple interaction term CapitalGain × HighDC ×
LowFundOverhang has a negative and significant coefficient).
Based on the coefficient estimates from Table III, Figure 2 illustrates how the
probabilities of exit, support of management, and opposition to management change when the
accrued gain in the stock increases from -50% to 100%.23 Panel A, capturing all funds, shows
that, as the accrued capital gain in a stock holding increases, the probability of continuing to hold
the stock and opposing management increases from 49.9% (for an accrued capital gain of -50%)
to 53.3% (for an accrued capital gain of 100%). At the same time, the probability of both exit
and of supporting management decline. Not surprisingly, given our tax lock-in hypothesis and
our prior results, the effects are much stronger for the funds with more tax-sensitive investors.
Panel B, capturing funds with more tax-sensitive investors (i.e., HighDC = 0), shows that, as the
accrued capital gain in the stock holding increases from -50% to 100% for this group of funds,
the probability of continuing to hold the stock and opposing management increases 13
percentage points (from 46.2% to 59.4%). At the same time the probability of selling the stock
falls from 7.8% to 2.8%, and the probability of continuing to hold the stock and supporting
management falls from 46.0% to 37.9%. Finally, Panel C, capturing funds with more tax-
sensitive investors and a high fund capital gains overhang (i.e., HighDC = 0 and
LowFundOverhang = 0), shows that, consistent with the tax lock-in hypothesis, the effects are
further amplified when we examine the subset of funds with more tax-sensitive investors that
also have large portfolio-wide capital gains (and thus a lack of losses available to offset realized
gains for tax purposes). For this group of particularly tax-sensitive funds, as the accrued capital
gain in the stock holding increases from -50% to 100%, the probability of continuing to hold the
stock and opposing management increases almost 20 percentage points (from 51.9% to 70.3%).
In sum, the findings presented in this section are consistent with the results reported in
the Appendix and Section II. Tax-induced lock-in not only affects the sale of stocks, but also
23 For both all funds and for funds with a more tax-sensitive clientele (i.e., HighDC = 0), we record the unconditional probabilities of the exit/support/oppose decision, as well as, the unconditional average accrued capital gain in a stock holding. From that baseline, we then extrapolate the probabilities of the exit/support/oppose decision for higher and lower accrued capital gains using the coefficients from Panels A, B, and C of Table III for Panels A, B, and C of Figure 2.
24
affects the likelihood mutual funds with taxable investors will vote against management on
contentious votes. Nonetheless, as documented in Table I, management loses these contentious
votes only about a quarter of the time. Section IV investigates whether the effect of capital gains
lock-in on mutual fund voting is large enough to actually influence vote outcomes and the
agenda of proposals to be voted on at the shareholder meeting.
TABLE III ABOUT HERE
FIGURE 2 ABOUT HERE
IV. Does the Lock-In Effect Influence Vote Outcomes/Agenda?
In the prior sections, we have analyzed the decisions of individual mutual funds regarding
whether to exit, support management, or oppose management on a given proposal. This
framework enables us to control for vote specific fixed effects as well as fund-quarter fixed
effects. Thus, we identify the effect of capital gains lock-in on fund voting by exploiting
differences across funds in both the accrued capital gains since purchase in a given stock as well
as the tax status of the funds’ investors (while at the same time controlling for a fund’s
underlying tendency to oppose or support management).
From these analyses, however, we cannot determine whether the effect of tax lock-in on
voting is sufficiently large to influence the actual vote outcome, or to influence whether a
contentious proposal even appears on the meeting’s agenda in the first place. To answer these
questions, we must conduct analyses at the vote level (does management win or lose the vote) or
at the firm-meeting level (does the meeting agenda contain at least one vote for which ISS and
management have different recommendations). In this section, we conduct precisely these tests.
Because the unit of observation is at the vote-level, or even broader at the meeting-level, we
must relax some of the precision of our identification strategy because we can no longer control
for individual vote fixed effects (which absorbed all firm characteristics that may influence
whether a fund would oppose or support management). Nonetheless, these specifications provide
25
useful evidence on the importance of this governance channel for mutual funds with taxable
investors.
A. Aggregate Capital Gains Lock-In and Vote Outcomes
In Table IV, we examine whether the total amount of accrued capital gains held by all
mutual fund investors in a firm’s stock predicts whether the firm’s management will lose a
contentious vote. Our dependent variable in this analysis, ManagementLosesVote, is an indicator
variable set to one if management actually loses a contentious vote (i.e., a vote in which the
recommendations of ISS and management diff), and set to zero if management wins. Thus, this
analysis is conducted at the vote level. Our key explanatory variable, MF Capital Gain % of
Market Cap, is the aggregate dollar value of capital gains held by mutual funds in the firm’s
stock normalized by the firm’s total market capitalization.24 It quantifies how important the
aggregate lock-in effect for mutual funds is for a particular firm and, thus, how influential it
should be in determining the vote outcome.
Besides MF Capital Gain % of Market Cap, we also include the value-weighted average
holding period of mutual funds (VW Average MF Holding Period), the share of the firm’s stock
owned by mutual funds (MF % of Firm Owned), and the value-weighted average capital gain in
a stock by mutual funds (VW MF Average Capital Gain) – the product of these last two variables
equals MF Capital Gain % of Market Cap. The inclusion of these additional aggregate mutual
fund shareholder variables in the regression helps us test whether it is really the presence of large
accrued capital gains that drives management losing votes, as opposed to other characteristics of
mutual fund shareholders in the firm (such as how long they have held shares, how many shares
they own, and the return earned since purchase). Finally, the regressions in Table IV also include
various firm-level and proposal-level characteristics (all of which were subsumed by the fixed
effects in our earlier analyses). Specifically, we include as controls lagged 3-month and lagged
12-month stock returns, log(market capitalization), book-to-market ratio, leverage ratio, cash
24 This variable has a mean of 0.006 (i.e., the aggregate capital gains held by mutual funds represent 0.6% of a firm’s value), with a 75th percentile of 0.020 and a 90th percentile of 0.040, and a standard deviation of 0.033.
26

flow-to-assets, capital expenditure-to-assets, S&P 500 membership, the G-Index of Gompers,
Ishii, and Metrick (2003), institutional ownership percentage, percent of the company owned by
the top five executives, indicator variables for management sponsored proposals and for director
elections, and quarter fixed effects.25
The coefficient on MF Capital Gain % of Market Cap of 0.290, presented in column (1)
of Table III, is positive and is both statistically and economic significant. For example, a one-
standard deviation increase in MF Capital Gain % of Market Cap, (0.033), is associated with a
1.0 percentage point increase in the likelihood management loses the vote (0.290×0.033). To put
this effect in perspective, recall that management loses a vote on average 24% of the time in the
sample. Moreover, the coefficient on MF Capital Gain % of Market Cap is obtained while also
controlling for the value-weighted holding period of mutual funds, the share of the firm’s stock
owned by mutual funds, and the value-weighted average capital gain in a stock by mutual funds
– the product of these last two variables equals MF Capital Gain % of Market Cap. The
regressions include these additional aggregate mutual fund shareholder variables to ensure it is
really the presence of large accrued capital gains that drives management losing votes, as
opposed to other characteristics of mutual fund stockholdings in the firm.26
For brevity, the coefficients associated with the other controls are suppressed from Table
IV. The complete table is provided as Appendix Table II. Other controls generally have the
expected signs; management is less likely to lose a vote if stock returns were high over the prior
3 months, cash flow are high, the firm is large, or if management’s ownership is high. On the
other hand, the management of firms with higher capital expenditures (perhaps representing over
investment) and higher institutional ownership are more likely to lose a vote. Not surprisingly,
management is less likely to lose management-sponsored proposals and director elections (which
often feature only one candidate). The coefficient on the prior 3-month return is particularly
25 These control variables follow from Matvos and Ostrovsky (2010), Morgan, Poulsen, Wolf, and Yang (2011), and Iliev and Lowry (2014), among others. 26 We also estimated a version of the specification in column (1) of Table IV in which we do not include these other mutual fund shareholder variables. In that specification, the coefficient on MF Capital Gain % of Market Cap is 0.262, which is very similar to the coefficient of 0.290 from column (1), and it is still highly significant. The similarity of these coefficients is not surprising, given the trivial magnitudes of the coefficients on these other mutual fund shareholder variables in Table IV. Thus, it really is the amount of accrued capital gains aggregated across mutual funds as a whole that affects vote outcomes.
27

noteworthy; although high accrued gains by mutual fund investors predicts management is more
likely to lose the vote, a higher prior 3-month return predicts management is more likely to win.
In column (2) of Table IV, we split the four mutual fund shareholder variables into
aggregates for the HighDC mutual funds and for the LowDC mutual funds (i.e., for each vote-
level observation we create separate aggregated variables for all mutual funds whose proportion
of assets held by retirement funds is above and below the sample median, respectively). For
example, MF Capital Gain % of MktCap by HighDC is the accrued gains aggregated across all
funds with a primarily tax-insensitive clientele (normalized by firm market value), whereas MF
Capital Gain % of MktCap by LowDC is the analogous variable constructed for those funds with
a tax-sensitive clientele. The p-value, reported below the coefficients on these two variables,
gives the significance of the difference in the effect of accrued capital gains held by these two
types of funds.
If tax lock-in really influences vote outcomes, the coefficient on MF Capital Gain % of
MktCap by LowDC should be larger than the coefficient on MF Capital Gain % of MktCap by
HighDC. This is exactly what we find. In column (2) of Table IV, the coefficient on MF Capital
Gain % of MktCap by LowDC is a positive and highly significant 2.040, while that on MF
Capital Gain % of MktCap by HighDC is an insignificant 0.050 (with the difference between the
two significant). The results imply that, if all of the mutual funds holding the stock have a tax-
sensitive clientele, a one-standard deviation increase in accrued capital gains held by mutual
funds is associated with a 4.4 percentage point increase in the likelihood management loses the
vote (2.040×0.0215).27 This 4.4 percentage point effect is quite large relative to the baseline
probability that management loses a contentious vote of 24%. If, instead, all of the mutual funds
holding the stock have a tax-insensitive clientele, a one-standard deviation increase in accrued
capital gains held by mutual funds implies only a 0.1 percentage point increase in the likelihood
management loses the vote (0.050×0.0215), a result statistically indistinguishable from zero.
27 In our sample, mutual funds with data on the tax status of their investors through Pensions and Investments’ annual survey hold roughly 65.4% of the total aggregate capital gains held by all mutual funds. Thus, the standard deviation used in this calculation, 0.0215, differs from 0.033 computed from the full sample because information concerning investors’ tax status is not available for some funds (and thus the accrued gains of the funds missing this information are not included in either MF Capital Gain % of MktCap by HighDC or MF Capital Gain % of MktCap by LowDC).
28

Thus, not only do accrued capital gains influence an individual mutual fund’s decision whether
to oppose management on a contentious vote, but aggregate mutual fund capital gains can also
predict vote outcomes (with this effect driven by aggregate gains held by funds with taxable
investors).
TABLE IV ABOUT HERE
B. Aggregate Capital Gains Lock-In and Contentious Votes on Meeting Agenda
In this section, we test whether the aggregate accrued capital gain of the mutual fund
investors in a firm’s stock affects whether a contentious proposal appears on the meeting agenda
in the first place.28 Table V shows the results of this analysis. ContentiousVoteHeldAtMeeting is
an indicator variable set to one if there are any contentious proposals to be voted on in a
particular meeting, and is set to zero if none of the proposals are contentious (thus, this variable
is measured at the firm-meeting level, which is typically once a year). We construct this variable
using data from the full Voting Analytics database. Using these data, we calculate that 39% of
shareholder meetings have at least one contentious proposal, with a contentious proposal defined
as one in which the ISS and management voting recommendations differ. We include the same
aggregate mutual fund investor variables, as well as the same firm-level controls as in Table IV
(since the unit of observation is now at the firm-meeting level, the regressions do not include any
proposal-specific variables); once again, the coefficients associated with the other controls are
suppressed from the table, but are reported in their entirety in Appendix Table III.
The negative and statistically significant coefficient of -0.726 on MF Capital Gain % of
Market Cap, presented in column (1) of Table V, suggests that the aggregate accrued capital
gains of mutual fund investors indeed deter contentious proposals from appearing on the firm’s
meeting agenda. This effect is economically substantive as well, with a one-standard-deviation
increase in MF Capital Gain % of Market Cap associated with a 2.4 percentage point decrease in
the likelihood a contentious proposal appears on the meeting agenda. The value-weighted
28 Unless there is an unusual event for the firm, such as a potential merger, shareholder meetings occur once a year.
29
holding period of mutual fund shareholders, the share of the firm’s stock owned by mutual funds,
and the value-weighted average capital gain of mutual fund shareholders have no effect on the
presence of contentious proposals; all that matters is the aggregate amount of the accrued capital
gains held by mutual funds.
In column (2), we test whether the deterrent effect of locked-in gains by mutual fund
shareholders differs for funds with tax-sensitive versus tax-insensitive clienteles. This is indeed
the case. The coefficient on MF Capital Gain % of MktCap by LowDC is -2.869 (highly
statistically significant), compared to the coefficient on MF Capital Gain % of MktCap by
HighDC of only -0.505 (statistically insignificant), with the difference between the two effects
just missing conventional levels of statistical significance with a p-value of 0.11.
In closing, we reiterate that, because we examine the outcomes of contentious votes and
the presence of contentious votes on the meeting agenda, we cannot include vote-level fixed
effects, a key to our identification strategy earlier in the paper when we examined the voting
behavior of individual mutual funds. Thus, we must be more cautious in making causal
interpretations of the coefficients from Tables IV and V. Nonetheless, the significant positive
relation between the amount of accrued gains aggregated across mutual fund shareholders and
management losing a contentious vote, as well as the deterrent effect these accrued capital gains
have on a contentious proposal appearing on the agenda in the first place, are certainly
suggestive in nature and complement our earlier results.
TABLE V ABOUT HERE
V. Conclusion
Over the last thirty years, the share of U.S. equity held by mutual funds has grown
drastically, accounting for roughly a third of total U.S. equity (French (2008)). Despite this
growth, we know relatively little about the governance activities of mutual funds. This study
investigates one channel that may influence the governance activities of this growing shareholder
group – the capital gains lock-in effect. In particular, we investigate whether the taxation of
30

realized gains not only deters funds from selling shares with accrued capital gains, but also
whether these accrued gains make funds more likely to oppose the firm’s management on
contentious votes.
Our empirical design is well suited to answer this question. Capital gains lock-in varies
across funds simply based on the fund’s accrued gain and on the tax status of the fund’s
investors–thus, the magnitude of the capital gains lock-in will vary across funds even for the
same stock at the same time. Thus, our identification comes from variation across investors in a
given stock at a given time. To implement our identification strategy, we construct a rich data set
that combines mutual fund holdings, their clientele (taxable and tax-deferred), and detailed
voting data for proposals at the company meeting.
Consistent with prior studies, we find that there is a negative relation between a mutual
fund’s propensity to sell a stock and accrued capital gains on the stock, and that this relation is
stronger for funds with more tax-sensitive investors. Given this tax-induced reluctance to sell
shares, we next examine whether funds with higher accrued capital gains in a stock are more
likely to oppose the company’s management (in a sample of contentious votes). Simply put,
given these locked-in funds are likely to continue to hold the stock, they could potentially benefit
from monitoring the company. Relatedly, the tax lock-in effect may prompt affected funds to
continue to hold a stock even if they are not enamored with the management, making them more
likely to vote against management on contentious proposals relative to funds not “forced” by
taxes to be holding the stock at the time of a vote.
We find that funds with higher accrued capital gains in a stock are indeed more likely to
oppose management in our sample of contentious votes. Our results further demonstrate that,
consistent with a tax motivation, the relation between accrued capital gains and funds’ voting
decisions is stronger for funds with a high fraction of tax-sensitive investors.
Thus, this paper documents another avenue through which capital gains taxation
influences the behavior of institutional investors. Huddart and Narayanan (2002), Cici (2012),
and Sialm and Starks (2012) show that capital gains taxation affects mutual funds’ trading
decisions. We further find that capital gains lock-in not only reduces the likelihood that a fund
31

will sell a stock, but also increases the likelihood that a locked-in fund will oppose the firm’s
management.
Finally, the effect of capital gains lock-in on voting has important implications for the
firm, that is, the effects on mutual fund voting behavior at shareholder meetings is large enough
to materially affect the outcome of the vote as well the type of proposals that are put up for vote
on the meeting agenda in the first place. Specifically, the presence of accrued capital gains
among mutual funds with taxable investors leads to a higher likelihood of a vote outcome against
management and a lower likelihood of a contentious proposal being voted on at the meeting in
the first place. In sum, our results thus show one determinant of corporate governance by mutual
funds, operating through the tax-induced capital gains lock-in channel. As open-end mutual
funds continue to own an increasingly larger fraction of total U.S. equities, mutual funds’
decisions regarding whether to exit, stay and support, or stay and fight a firm’s management will
be an increasingly important component of corporate governance.
32
REFERENCES
Aggarwal, Reena, Pedro A.C. Saffi, and Jason Sturgess, 2012, The role of institutional investors in voting: Evidence from the securities lending market, Working paper, Georgetown University.
Alexander, Cindy R., Mark A. Chen, Duane J. Seppi, and Chester S. Spatt, 2010, Interim news and the role of proxy voting advice, Review of Financial Studies 23, 4419-4454.
Amihud, Yakov, 2002, Illiquidity and stock returns: Cross-section and time-series effects, Journal of Financial Markets 5, 31-56.
Ashraf, Rasha, Narayanan Jayaraman, and Harley E. Ryan, Jr., 2012, Do pension-related business ties influence mutual fund proxy voting? Evidence from shareholder proposals on executive compensation, Journal of Financial and Quantitative Analysis 47, 567-588.
Back, Kerry, Tao Li, and Alexander Ljungqvist, 2013, Liquidity and governance, NBER working paper 19669.
Bergstresser, Daniel, and James Poterba, 2002, Do after-tax returns affect mutual fund inflows?, Journal of Financial Economics 63, 381-414.
Bhide, Amar, 1993, The hidden costs of stock market liquidity, Journal of Financial Economics 34, 31-51.
Butler, Alexander W., and Umit G. Gurun, 2012, Educational networks, mutual fund voting patterns, and CEO compensation, Review of Financial Studies 25, 2533-2562.
Cai, Jie, Jacqueline L. Garner, and Ralph A. Walkling, 2009, Electing directors, Journal of Finance 64, 2389-2421.
Chamberlain, Gary, 1980, Analysis of covariance with qualitative data, Review of Economic Studies 47, 225-238.
Charbonneau, Karyne B., 2013, Multiple fixed effects in nonlinear panel data models: Theory and evidence, Working paper, Princeton University.
Cici, Gjergji, 2012, The prevalence of the disposition effect in mutual funds’ trades, Journal of Financial and Quantitative Analysis 47, 795-820.
Coffee, J.C., Jr., 1991, Liquidity versus control: The institutional investor as corporate monitor, Columbia Law Review 90, 1277-1368.
Cvijanović, Dragana, Amil Dasgupta, and Konstantinos Zachariadis, 2013, Ties that bind: How business connections affect mutual fund activism, Working paper, University of North Carolina at Chapel Hill.
33

Davis, Gerald F., and E. Han Kim, 2007, Business ties and proxy voting by mutual funds, Journal of Financial Economics 85, 552-570.
Del Guercio, Diane, Laura Seery, and Tracie Woidtke, 2008, Do boards pay attention when institutional investor activists “just vote no”?, Journal of Financial Economics 90, 84-103
Dickson, Joel M., John B. Shoven, and Clemens Sialm, 2000, Tax externalities of mutual funds, National Tax Journal 53, 607-628.
Edmans, Alex, 2009, Blockholder trading, market efficiency, and managerial myopia, Journal of Finance 64, 2481-2513.
Edmans, Alex, 2014, Blockholders and corporate governance, Annual Review of Financial Economics, forthcoming.
Edmans, Alex, and Gustavo Manso, 2011, Governance through trading and intervention: A theory of multiple blockholders, Review of Financial Studies 24, 2395-2428.
Faure-Grimaud, Antoine, and Denis Gromb, 2004, Public trading and private incentives, Review of Financial Studies 17, 985-1014.
Fischer, Paul E., Jeffrey D. Gramlich, Brian P. Miller, and Hal D. White, 2009, Investor perceptions of board performance: Evidence from uncontested director elections, Journal of Accounting and Economics 48, 172-189.
Frazzini, Andrea, 2006, The disposition effect and underreaction to news, Journal of Finance 61, 2017-2046.
French, Kenneth, 2008, Presidential address: The cost of active investing, The Journal of Finance 63, 1537-1573.
Gompers, Paul, Joy Ishii, and Andrew Metrick, 2003, Corporate governance and equity prices, Quarterly Journal of Economics 118, 107-155.
Han, Aaron, and Jerry Hausman, 1990, Flexible parametric estimation of duration and competing risk models, Journal of Applied Econometrics 5, 1-28.
Huddart, Steven, and V.G. Narayanan, 2002, An empirical examination of tax factors and mutual funds’ stock sales decisions, Review of Accounting Studies 7, 319–341.
Iliev, Peter and Michelle Lowry, 2014, Are mutual funds active voters?, Working paper, Pennsylvania State University.
Ivković, Zoran, James Poterba, and Scott Weisbenner, 2005, Tax-motivated trading by individual investors, American Economic Review 95, 1605-1630.
Jin, Li, 2006, Capital gains tax overhang and price pressure, Journal of Finance 61, 1399-1431.
34

Kacperczyk, Marcin, Clemens Sialm, and Lu Zheng, 2008, Unobserved actions of mutual funds, Review of Financial Studies 21, 2379-2416.
Kahn, Charles, and Andrew Winton, 1998, Ownership structure, speculation, and shareholder intervention, Journal of Finance 53, 99-129.
Kyle, Albert S., and Jean-Luc Vila, 1991, Noise trading and takeovers, Rand Journal of Economics 22, 54-17.
Matvos, Gregor, and Michael Ostrovsky, 2008, Cross-ownership, returns, and voting in mergers, Journal of Financial Economics 89, 391-403.
Matvos, Gregor, and Michael Ostrovsky, 2010, Heterogeneity and peer effects in mutual fund proxy voting, Journal of Financial Economics 98, 90-112.
Maug, Ernst, 1998, Large shareholders as monitors: Is there a trade-off between liquidity and control?, Journal of Finance 53, 65-98.
McCahery, Joseph A., Zacharias Sautner, and Laura T. Starks, 2011, Behind the scenes: The corporate governance preferences of institutional investors, Working paper, University of Texas at Austin.
Morgan, Angela, Annette Poulsen, Jack Wolf, and Tina Yang, 2011, Mutual funds as monitors: Evidence from mutual fund voting, Journal of Corporate Finance 17, 914-928.
Parrino, Robert, Richard W. Sias, and Laura T. Starks, 2003, Voting with their feet: Institutional ownership changes around forced CEO turnover, Journal of Financial Economics 68, 3-46.
Roe, Mark J., 1990, Political and legal restraints on ownership and control of public companies, Journal of Financial Economics 27, 7-41.
Sialm, Clemens, and Laura Starks, 2012, Mutual fund tax clienteles, Journal of Finance 67, 1397-1422.
Sialm, Clemens, Laura Starks, and Hanjiang Zhang, 2014, Defined contribution pension plans: Sticky or discerning money?, Journal of Finance, forthcoming.
Sialm, Clemens, and Hanjiang Zhang, 2013, Tax efficient asset management: Evidence from equity mutual funds, Working paper, University of Texas at Austin.
35
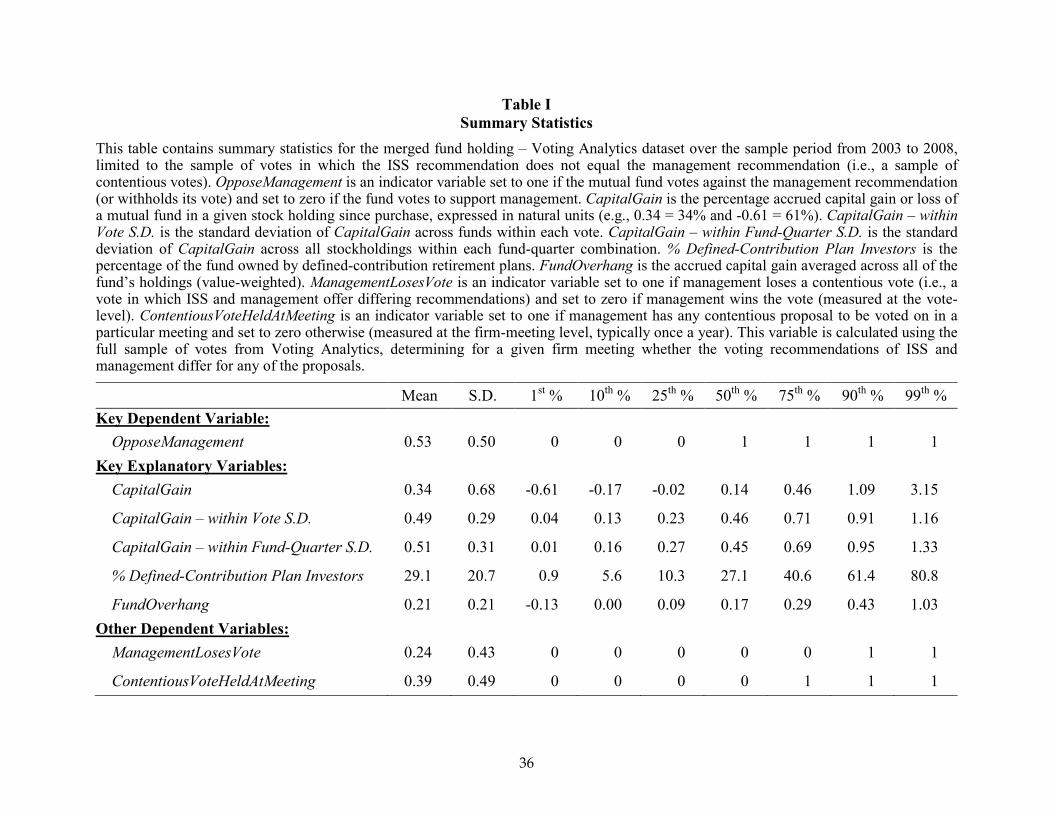
Table I Summary Statistics
This table contains summary statistics for the merged fund holding – Voting Analytics dataset over the sample period from 2003 to 2008, limited to the sample of votes in which the ISS recommendation does not equal the management recommendation (i.e., a sample of contentious votes). OpposeManagement is an indicator variable set to one if the mutual fund votes against the management recommendation (or withholds its vote) and set to zero if the fund votes to support management. CapitalGain is the percentage accrued capital gain or loss of a mutual fund in a given stock holding since purchase, expressed in natural units (e.g., 0.34 = 34% and -0.61 = 61%). CapitalGain – within Vote S.D. is the standard deviation of CapitalGain across funds within each vote. CapitalGain – within Fund-Quarter S.D. is the standard deviation of CapitalGain across all stockholdings within each fund-quarter combination. % Defined-Contribution Plan Investors is the percentage of the fund owned by defined-contribution retirement plans. FundOverhang is the accrued capital gain averaged across all of the fund’s holdings (value-weighted). ManagementLosesVote is an indicator variable set to one if management loses a contentious vote (i.e., a vote in which ISS and management offer differing recommendations) and set to zero if management wins the vote (measured at the vote-level). ContentiousVoteHeldAtMeeting is an indicator variable set to one if management has any contentious proposal to be voted on in a particular meeting and set to zero otherwise (measured at the firm-meeting level, typically once a year). This variable is calculated using the full sample of votes from Voting Analytics, determining for a given firm meeting whether the voting recommendations of ISS and management differ for any of the proposals.
Mean S.D. 1st % 10th % 25th % 50th % 75th % 90th % 99th % Key Dependent Variable: OpposeManagement 0.53 0.50 0 0 0 1 1 1 1 Key Explanatory Variables: CapitalGain 0.34 0.68 -0.61 -0.17 -0.02 0.14 0.46 1.09 3.15
CapitalGain – within Vote S.D. 0.49 0.29 0.04 0.13 0.23 0.46 0.71 0.91 1.16
CapitalGain – within Fund-Quarter S.D. 0.51 0.31 0.01 0.16 0.27 0.45 0.69 0.95 1.33
% Defined-Contribution Plan Investors 29.1 20.7 0.9 5.6 10.3 27.1 40.6 61.4 80.8
FundOverhang 0.21 0.21 -0.13 0.00 0.09 0.17 0.29 0.43 1.03 Other Dependent Variables: ManagementLosesVote 0.24 0.43 0 0 0 0 0 1 1
ContentiousVoteHeldAtMeeting 0.39 0.49 0 0 0 0 1 1 1
36

Table II Propensity to Oppose Management, Accrued Capital Gains, and Tax Motivation
This table presents results of the linear probability model, described by Equation (3), in which we relate a mutual fund’s voting decision for a stock to the fund’s tax lock-in for that stock holding. The dependent variable is an indicator variable OpposeManagement, set to one if the mutual fund does not follow the management recommendation (either by voting against management or by withholding its vote) and set to zero if the mutual fund votes to support the management recommendation. This regression is estimated for funds holding the stock at the time of the shareholder meeting. CapitalGain is the accrued capital gain or loss since purchase of the stock. We also estimate a regression in column (2), described by Equation (4), to test for the effects of a high presence of defined-contribution retirement accounts in the fund. HighDC is an indicator variable set to one if the proportion of fund assets held by retirement plans is above the median and set to zero otherwise. In column (3), we estimate a regression that adds interactions with LowFundOverhang to the specification in Equation (4). LowFundOverhang is an indicator variable set to one for funds with a level of total accrued capital gains across all of their holdings below the median and set to zero otherwise. The specification also contains vote fixed effects, fund-quarter fixed effects, and length of holding period fixed effects for the number of quarters that the fund has held the stock. Direct effects of HighDC and LowFundOverhang on OpposeManagement are absorbed by fund-quarter fixed effects. The sample includes all observations in the merged mutual fund holding – Voting Analytics dataset, covering the period from 2003 to 2008, in which the ISS recommendation for a proposal does not equal the management recommendation (i.e., a sample of contentious votes). Finally, ***, **, * denote significance at the 1%, 5%, and 10% levels, respectively, and t-statistics are listed in square brackets below the point estimates (t-statistics are based on standard errors clustered at the fund-quarter level).
(1) (2) (3) CapitalGain 0.003** 0.011*** 0.013*** [2.01] [3.77] [4.21] CapitalGain × HighDC -0.009*** -0.012*** [2.63] [3.27] CapitalGain × LowFundOverhang -0.011* [1.84] CapitalGain × HighDC × LowFundOverhang 0.017** [1.99] Vote Fixed Effects? Yes Yes Yes Fund-Quarter Fixed Effects? Yes Yes Yes Length of Holding Period Fixed Effects? Yes Yes Yes Adjusted R2 0.205 0.306 0.306 Number of Observations 366,644 107,377 107,377
37

Table III Multinomial Logit Analyses of Exit/Voting Decisions
This table presents results of multinomial logit models that relate the dependent variable, a choice with three alternatives – sell the stock, continue to hold the stock and support management (the excluded category), or continue to hold the stock and oppose management to the set of covariates used in Table II. A fund is classified as holding and opposing management if the fund continues to hold the stock and either votes against the management recommendation or withholds its vote. CapitalGain is the accrued capital gain or loss since purchase of the stock. HighDC is an indicator variable set to one if the proportion of fund assets held by defined-contribution retirement plans is above the median and set to zero otherwise. LowFundOverhang is an indicator variable set to one for funds with a below median level of total accrued capital gains across all of their holdings and set to zero otherwise. Panel A displays estimates from a multinomial logit model without any interaction terms; Panel B displays estimates from a model with an interaction between CapitalGain and HighDC; and Panel C displays estimates from a model with further interactions with LowFundOverhang. Each specification includes vote fixed effects, fund-quarter fixed effects, and length of holding period fixed effects for the number of quarters that the fund has held the stock. The sample includes all observations in the merged mutual fund holding – Voting Analytics dataset, covering the period from 2003 to 2008, in which the ISS recommendation for a proposal does not equal the management recommendation (i.e., a sample of contentious votes). Finally, ***, **, * denote significance at the 1%, 5%, and 10% levels, respectively, and t-statistics are listed in square brackets below the point estimates (t-statistics are based on standard errors clustered at the fund-quarter level).
Panel A:
No interaction with HighDC
Panel B:
Interaction with HighDC
Panel C:
Interaction with HighDC and LowFundOverhang
Sell Stock Hold, Oppose Management Sell Stock Hold, Oppose
Management Sell Stock Hold, Oppose Management
(1) (2) (3) (4) (5) (6) CapitalGain -0.265*** 0.062*** -0.563*** 0.296*** -0.638*** 0.469*** [6.21] [4.08] [4.45] [7.03] [7.01] [37.68] CapitalGain × HighDC 0.154* -0.437*** 0.397*** -0.587*** [1.75] [6.74] [4.18] [38.09] CapitalGain × LowFundOverhang 0.185 -0.428*** [0.34] [16.12] CapitalGain × HighDC × LowFundOverhang -1.909*** 0.431*** [7.61] [10.69] Vote, Fund-Quarter, & Holding Period Effects? Yes Yes Yes Yes Yes Yes Number of Observations 391,040
112,027 112,027
38
Table IV
Management Loses a Contentious Vote (continued on next page) This table presents results of linear probability models that relate the vote outcome to a range of aggregate mutual fund shareholder variables as well as various firm and vote characteristics. The dependent variable is an indicator variable, ManagementLosesVote, set to one if management loses a contentious vote and set to zero if management wins (thus, this variable is measured at the vote-level). Our sample of contentious votes includes all proposals in the merged mutual fund holding – Voting Analytics dataset, covering the period from 2003 to 2008, in which the ISS recommendation for a proposal does not equal the management recommendation. The key independent variable is MF Capital Gain % of Market Cap, the aggregate dollar value of capital gains held by mutual funds in the firm’s stock normalized by the firm’s total market capitalization. VW Average MF Holding Period is the value-weighted holding period of mutual funds. MF % of Firm Owned is the share of the firm’s stock owned by mutual funds, and VW MF Average Capital Gain is the value-weighted average capital gain in a stock by mutual funds. The specifications contain various firm-level and proposal-level characteristics (lagged 3-month and lagged 12-month stock returns, log(market capitalization), book-to-market ratio, leverage ratio, cash flow-to-assets, capital expenditure-to-assets, S&P 500 membership, the G-Index of Gompers, Ishii, and Metrick (2003), institutional ownership percentage, the percent of the company owned by the top five executives), indicator variables for management sponsored proposals and for director elections, as well as quarter fixed effects. The second column of the table includes versions of the four aggregate mutual fund shareholder variables calculated separately for all HighDC and LowDC mutual funds (i.e., mutual funds whose proportion of assets held by retirement funds is above and below the sample median, respectively). Finally, ***, **, * denote significance at the 1%, 5%, and 10% levels, respectively, and t-statistics are listed in square brackets below the point estimates (t-statistics are based on standard errors clustered at the fund-quarter level). For brevity, the coefficients associated with other controls beyond the aggregate mutual fund shareholder variables are suppressed. The complete table is provided as Appendix Table II.
39

Table IV
Management Loses a Contentious Vote (continued from prior page) (1) (2) MF Capital Gain % of Market Cap 0.290*** [2.64]
MF CG% of MktCap by HighDC 0.050 [0.25]
MF CG% of MktCap by LowDC 2.040*** [3.14]
p-value of difference 0.008*** VW Average MF Holding Period 0.001** [2.46]
VW Avg Hold Period of HighDC 0.0004* [1.72]
VW Avg Hold Period of LowDC -0.0004 [1.59] MF % of Firm Owned -0.0005 [0.87]
MF% of Firm Owned of HighDC -0.001 [1.47]
MF% of Firm Owned of LowDC -0.004* [1.68] VW MF Average Capital Gain -0.009 [1.05]
VW MF Avg CG by HighDC 0.010 [1.55]
VW MF Avg CG by LowDC -0.019*** [2.63] Other Controls? Yes Yes Quarter Fixed Effects? Yes Yes Adjusted R2 0.658 0.659 Number of Observations 10,192 10,192
40

Table V Presence of a Contentious Proposal on the Meeting Agenda (continued on next page)
This table presents results of linear probability models that relate the presence of a contentious proposal on the meeting agenda to a range of aggregate mutual fund shareholder variables as well as various firm characteristics. The dependent variable is an indicator variable ContentiousVoteHeldAtMeeting, set to one if there are any contentious proposals to be voted on in a particular meeting and set to zero if none of the proposals are contentious (thus, this variable is measured at the firm-meeting level). Our sample of meeting agendas includes all proposals in the merged mutual fund holding – Voting Analytics dataset, covering the period from 2003 to 2008. A contentious proposal is one in which the ISS recommendation as to how to vote does not equal the management recommendation. We include the same aggregate mutual fund shareholder variables, as well as the same firm-level controls as in Table IV (since the unit of observation is now at the firm-meeting level, the regressions do not include any proposal-specific variables). The second column of the table includes versions of the four aggregate mutual fund shareholder variables calculated separately for all HighDC and LowDC mutual funds (i.e., mutual funds whose proportion of assets held by retirement funds is above and below the sample median, respectively). Finally, ***, **, * denote significance at the 1%, 5%, and 10% levels, respectively, and t-statistics are listed in square brackets below the point estimates (t-statistics are based on standard errors clustered at the fund-quarter level). For brevity, the coefficients associated with other controls beyond the aggregate mutual fund shareholder variables are suppressed. The complete table is provided as Appendix Table III.
41

Table V Presence of a Contentious Proposal on the Meeting Agenda (continued from prior page)
(1) (2) MF Capital Gain % of Market Cap -0.726*** [3.23]
MF CG% of MktCap by HighDC -0.505 [1.30] MF CG% of MktCap by LowDC -2.869** [2.16] p-value of difference 0.111
VW Average MF Holding Period 0.001 [1.24]
VW Avg Hold Period of HighDC -0.0002 [0.40] VW Avg Hold Period of LowDC 0.00003
[0.08] MF % of Firm Owned -0.001 [1.05]
MF% of Firm Owned of HighDC 0.001 [0.66]
MF% of Firm Owned of LowDC -0.002 [0.44] VW MF Average Capital Gain 0.020 [1.24]
VW MF Avg CG by HighDC 0.021* [1.68]
VW MF Avg CG by LowDC 0.005 [0.35]
Other Controls? Yes Yes Quarter Fixed Effects? Yes Yes Adjusted R2 0.048 0.047 Number of Observations 11,062 11,062
42

Figure 1: Rise in open-end mutual fund ownership in the U.S. (crimson line). Data come from French (2008), Table I.
43

Panel A: Panel B: Panel C: All Funds Funds with Tax-Sensitive Clientele Funds with Tax-Sensitive Clientele and High Fund Capital Gains Overhang Figure 2: Relation between Exit/Voting Decisions of Mutual Fund and Accrued Capital Gains in Stock Holding. The sample includes all observations in the merged fund holding – Voting Analytics dataset, covering the period from 2003 to 2008, in which the ISS recommendation for a proposal does not equal the management recommendation (i.e., a sample of contentious votes). For a given proposal, the fund can sell the stock before the shareholder meeting, continue to hold the stock and support management, or continue to hold the stock and oppose management. Panel A shows results for all funds. Panel B shows results for funds with a tax-sensitive clientele (the fund’s share of assets in retirement accounts is below the sample median). Panel C shows results for funds with a tax-sensitive clientele and a high fund capital gains overhang (the fund’s portfolio-wide gains are above the sample median). We record the unconditional probabilities of the exit/support/oppose decision, as well as the unconditional average accrued capital gain in a stock holding. From that baseline, we extrapolate the probabilities of the exit/support/oppose decision for higher and lower accrued capital gains using the coefficients from panels of Table III for the corresponding panels of this figure.
0
0.05
0.1
0.15
0.2
0.25
0.3
0.35
0.4
0.45
0.5
0.55
0.6
0.65
0.7-0.50
-0.40
-0.30
-0.20
-0.10
0.00
0.10
0.20
0.30
0.40
0.50
0.60
0.70
0.80
0.90
1.00
Accrued Capital Gain in Stock Holding
Probability of Mutual Fund Action
Sell StockHold Stock and Support ManagementHold Stock and Oppose Management
0
0.05
0.1
0.15
0.2
0.25
0.3
0.35
0.4
0.45
0.5
0.55
0.6
0.65
0.7
-0.50
-0.40
-0.30
-0.20
-0.10
0.00
0.10
0.20
0.30
0.40
0.50
0.60
0.70
0.80
0.90
1.00
Accrued Capital Gain in Stock Holding
Probability of Mutual Fund Action
0
0.05
0.1
0.15
0.2
0.25
0.3
0.35
0.4
0.45
0.5
0.55
0.6
0.65
0.7
-0.50
-0.40
-0.30
-0.20
-0.10
0.00
0.10
0.20
0.30
0.40
0.50
0.60
0.70
0.80
0.90
1.00
Accrued Capital Gain in Stock Holding
Probability of Mutual Fund Action
44

APPENDIX Table I Cox Proportional Hazards Model of Stock Sales
This table presents results of Cox proportional hazards models that relate a mutual fund’s propensity to sell a stock to the fund’s accrued capital gain on that stock and the tax status of the fund’s investors. The baseline hazard rates are estimated non-parametrically, following Han and Hausman (1990), with a separate baseline for each fund-quarter combination (i.e., each fund can have different sale propensities from quarter to quarter, at different calendar times t):
𝑆𝑒𝑙𝑙𝑓,𝑖,𝑡(𝑞) = 𝛾𝑓,𝑡(𝑞) ∙ 𝑒�𝑿𝒇,𝒊,𝒕∙𝜷�, (A1)
where Sellf,i,t(q) is the hazard rate of fund f selling stock i at time t (quarter t in calendar time) after holding the stock for the past q-1 quarters, γf,t(q) is the non-parametric (fund-calendar-quarter specific) baseline rate of fund f selling a stock previously held for q-1 quarters at time t, and X are covariates that shift the baseline rate: CapitalGain, accrued capital gains or losses since the purchase of the stock; HighDC, an indicator variable set to one if the proportion of fund assets held by defined-contribution retirement plans is above the sample median and set to zero otherwise; and the interactions of HighDC with CapitalGain. Panel A shows the results of estimation over the full sample of observations in the period from 2003 to 2008. Panel B shows results from the subsample of observations with coverage in the Voting Analytics data, also from 2003 to 2008. We lose observations as we move from Panel A to Panel B because the Voting Analytics data do not include all mutual funds, especially for the first two years of the sample (in which Voting Analytics focused on large mutual funds). The coverage is better for the defined contribution subsample, as Pensions & Investments also focuses on the largest mutual funds, so fewer observations are lost in the merged subsample. Finally, ***, **, * denote significance at the 1%, 5%, and 10% levels, respectively, and t-statistics are listed in square brackets below the point estimates (t-statistics are based on standard errors clustered at the fund level).
Panel A: All Observations
Panel B: Observations with
Data in Voting Analytics
(1) (2) (3) (4) CapitalGain -0.482*** -0.500*** -0.525*** -0.511*** [26.13] [14.80] [24.79] [14.08] CapitalGain × HighDC 0.128*** 0.107** [2.89] [2.29] Fund-Quarter Fixed Effects? Yes Yes Yes Yes Number of Observations 8,063,230 1,247,917 5,998,671 1,128,516
45

APPENDIX Table II Management Loses a Contentious Vote (continued on next page)
This table presents results of the linear probability model that relates the vote outcome to a range of aggregate mutual fund shareholder variables as well as various firm and vote characteristics. It replicates Table IV and further provides all the regression coefficients associated with the controls that are suppressed from Table IV.
46
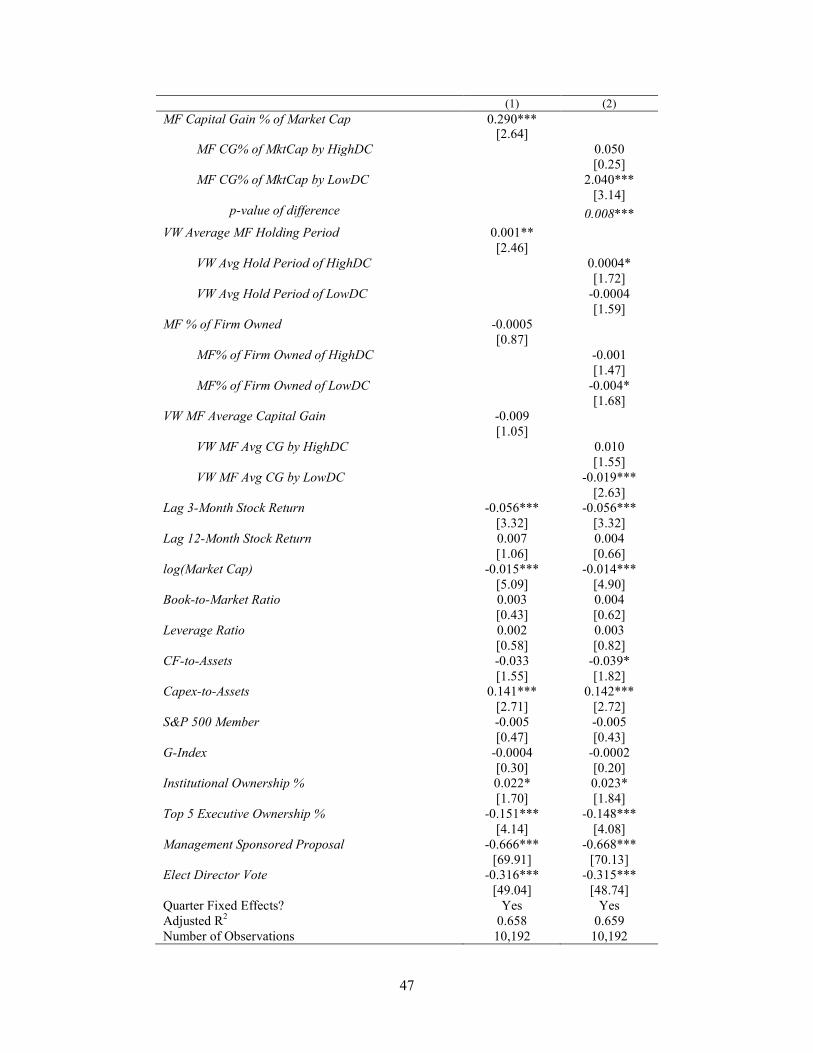
(1) (2) MF Capital Gain % of Market Cap 0.290*** [2.64] MF CG% of MktCap by HighDC 0.050 [0.25] MF CG% of MktCap by LowDC 2.040*** [3.14] p-value of difference
0.008*** VW Average MF Holding Period 0.001** [2.46] VW Avg Hold Period of HighDC 0.0004* [1.72] VW Avg Hold Period of LowDC -0.0004 [1.59] MF % of Firm Owned -0.0005 [0.87] MF% of Firm Owned of HighDC -0.001 [1.47] MF% of Firm Owned of LowDC -0.004* [1.68] VW MF Average Capital Gain -0.009 [1.05] VW MF Avg CG by HighDC 0.010 [1.55] VW MF Avg CG by LowDC -0.019*** [2.63] Lag 3-Month Stock Return -0.056*** -0.056*** [3.32] [3.32] Lag 12-Month Stock Return 0.007 0.004 [1.06] [0.66] log(Market Cap) -0.015*** -0.014*** [5.09] [4.90] Book-to-Market Ratio 0.003 0.004 [0.43] [0.62] Leverage Ratio 0.002 0.003 [0.58] [0.82] CF-to-Assets -0.033 -0.039* [1.55] [1.82] Capex-to-Assets 0.141*** 0.142*** [2.71] [2.72] S&P 500 Member -0.005 -0.005 [0.47] [0.43] G-Index -0.0004 -0.0002 [0.30] [0.20] Institutional Ownership % 0.022* 0.023* [1.70] [1.84] Top 5 Executive Ownership % -0.151*** -0.148*** [4.14] [4.08] Management Sponsored Proposal -0.666*** -0.668*** [69.91] [70.13] Elect Director Vote -0.316*** -0.315*** [49.04] [48.74] Quarter Fixed Effects? Yes Yes Adjusted R2 0.658 0.659 Number of Observations 10,192 10,192
47

APPENDIX Table III Presence of a Contentious Proposal on Meeting Agenda (continued on next page)
This table presents results of the linear probability model that relates the appearance of a contentious proposal on the meeting agenda to a range of aggregate mutual fund shareholder variables as well as various firm characteristics. It replicates Table V and further provides all the regression coefficients associated with the controls that are suppressed from Table V.
48

(1) (2) MF Capital Gain % of Market Cap -0.726*** [3.23] MF CG% of MktCap by HighDC -0.505 [1.30] MF CG% of MktCap by LowDC -2.869** [2.16] p-value of difference 0.111 VW Average MF Holding Period 0.001 [1.24] VW Avg Hold Period of HighDC -0.0002 [0.40] VW Avg Hold Period of LowDC 0.00003 [0.08] MF % of Firm Owned -0.001 [1.05] MF% of Firm Owned of HighDC 0.001 [0.66] MF% of Firm Owned of LowDC -0.002 [0.44] VW MF Average Capital Gain 0.020 [1.24] VW MF Avg CG by HighDC 0.021* [1.68] VW MF Avg CG by LowDC 0.005 [0.35] Lag 3-Month Stock Return 0.034 0.029 [1.02] [0.87] Lag 12-Month Stock Return -0.009 -0.015 [0.71] [1.17] log(Market Cap) 0.036*** 0.036*** [6.20] [6.01] Book-to-Market Ratio 0.030* 0.034** [1.84] [2.10] Leverage Ratio 0.022** 0.024** [2.35] [2.54] CF-to-Assets -0.024 -0.026 [0.56] [0.61] Capex-to-Assets 0.022 0.004 [0.24] [0.04] S&P 500 Member 0.061*** 0.072*** [3.25] [3.84] G-Index -0.024*** -0.023*** [10.47] [10.26] Institutional Ownership % -0.257*** -0.279*** [10.29] [11.69] Top 5 Executive Ownership % 0.294*** 0.295*** [3.75] [3.76] Quarter Fixed Effects? Yes Yes Adjusted R2 0.048 0.047 Number of Observations 11,062 11,062
49