capital expenditure - preliminary... · web viewrpp revenue and pricing principles saidi system...
TRANSCRIPT
PRELIMINARY DECISIONErgon Energy determination
2015−16 to 2019−20
Attachment 6 − Capital expenditure
April 2015
0 Attachment 6 – Capital expenditure | Ergon Energy determination 2015–20

© Commonwealth of Australia 2015
This work is copyright. In addition to any use permitted under the Copyright Act 1968, all material contained within this work is provided under a Creative Commons Attributions 3.0 Australia licence, with the exception of:
the Commonwealth Coat of Arms
the ACCC and AER logos
any illustration, diagram, photograph or graphic over which the Australian Competition and Consumer Commission does not hold copyright, but which may be part of or contained within this publication. The details of the relevant licence conditions are available on the Creative Commons website, as is the full legal code for the CC BY 3.0 AU licence.
Requests and inquiries concerning reproduction and rights should be addressed to the Director, Corporate Communications,Australian Competition and Consumer Commission, GPO Box 4141, Canberra ACT 2601or [email protected].
Inquiries about this publication should be addressed to:
Australian Energy RegulatorGPO Box 520Melbourne Vic 3001
Tel: (03) 9290 1444Fax: (03) 9290 1457
Email: [email protected]
1 Attachment 6 – Capital expenditure | Ergon Energy determination 2015–20
NoteThis attachment forms part of the AER's preliminary decision on Ergon Energy's
2015–20 distribution determination. It should be read with all other parts of the preliminary decision.
The preliminary decision includes the following documents:
Overview
Attachment 1 – Annual revenue requirement
Attachment 2 – Regulatory asset base
Attachment 3 – Rate of return
Attachment 4 – Value of imputation credits
Attachment 5 – Regulatory depreciation
Attachment 6 – Capital expenditure
Attachment 7 – Operating expenditure
Attachment 8 – Corporate income tax
Attachment 9 – Efficiency benefit sharing scheme
Attachment 10 – Capital expenditure sharing scheme
Attachment 11 – Service target performance incentive scheme
Attachment 12 – Demand management incentive scheme
Attachment 13 – Classification of services
Attachment 14 – Control mechanism
Attachment 15 – Pass through events
Attachment 16 – Alternative control services
Attachment 17 – Negotiated services framework and criteria
Attachment 18 – Connection policy
2 Attachment 6 – Capital expenditure | Ergon Energy determination 2015–20

Contents
Note...............................................................................................................6-2
Contents........................................................................................................6-3
Shortened forms..........................................................................................6-6
6 Capital expenditure................................................................................6-8
6.1 Preliminary decision.......................................................................6-8
6.2 Ergon Energy's proposal..............................................................6-11
6.3 AER’s assessment approach.......................................................6-12
6.4 Reasons for preliminary decision...............................................6-18
A Assessment Techniques.....................................................................6-35
A.1 Economic benchmarking.............................................................6-35
A.2 Trend analysis...............................................................................6-36
A.3 Category analysis.........................................................................6-37
A.4 Predictive modelling.....................................................................6-37
A.5 Engineering review.......................................................................6-38
B Assessment of capex drivers.............................................................6-41
B.1 Alternative estimate......................................................................6-41
B.2 AER findings and estimates of augmentation expenditure......6-42
B.2.1 Trend analysis.............................................................................6-44
B.2.2 Forecasting methodology............................................................6-48
B.2.3 Driver and project analysis..........................................................6-51
B.3 AER findings and estimates of connections and capital contributions........................................................................................6-64
B.4 AER findings and estimates of replacement expenditure.........6-67
B.4.1 Position........................................................................................6-67
B.4.2 Ergon Energy's proposal.............................................................6-68
3 Attachment 6 – Capital expenditure | Ergon Energy determination 2015–20

B.4.3 AER approach.............................................................................6-68
B.5 AER findings and estimates for capitalised overheads............6-90
B.5.1 Position........................................................................................6-90
B.5.2 Our assessment..........................................................................6-90
B.6 AER findings and estimates for non-network capex.................6-98
B.6.1 Position........................................................................................6-98
B.6.2 Ergon Energy's proposal.............................................................6-99
B.6.3 Buildings and property capex....................................................6-101
B.6.4 Fleet capex................................................................................6-107
B.7 Demand management.................................................................6-112
B.7.1 Position......................................................................................6-112
B.7.2 Ergon Energy's proposal on demand management..................6-113
B.7.3 Reasons for preliminary decision..............................................6-113
C Demand...............................................................................................6-115
C.1 AER position on system demand trends..................................6-116
C.2 AER approach.............................................................................6-116
C.3 Ergon Energy's proposal............................................................6-117
C.4 AEMO forecasts..........................................................................6-119
D Real material cost escalation............................................................6-120
D.1 Position........................................................................................6-120
D.2 Ergon Energy's proposal............................................................6-121
D.3 Assessment approach................................................................6-122
D.4 Reasons.......................................................................................6-123
D.5 Review of independent consultant's reports............................6-127
D.6 Conclusions on materials cost escalation................................6-133
D.7 Labour and construction escalators.........................................6-134
E Predictive modelling approach and scenarios................................6-135
4 Attachment 6 – Capital expenditure | Ergon Energy determination 2015–20
E.1 Predictive modelling techniques...............................................6-135
E.2 Data specification process.........................................................6-136
E.3 Data collection and refinement..................................................6-137
E.4 Benchmarking repex asset data................................................6-137
E.4.1 Benchmark data for each asset category..................................6-138
E.5 Repex model scenarios..............................................................6-140
E.6 The treatment of staked wooden poles and plated stobie poles. .6-143
E.6.1 Like-for-like repex modelling.....................................................6-143
E.6.2 Non-like-for-like replacement....................................................6-143
E.7 Calibrating staked wooden poles..............................................6-145
F Contingent projects...........................................................................6-147
F.1 Position........................................................................................6-147
F.2 Assessment approach................................................................6-148
F.3 Ergon Energy's proposal............................................................6-149
F.3.1 Aquis development....................................................................6-150
F.3.2 General contingent project for large customer connections......6-152
F.4 Reasons for preliminary decision.............................................6-152
F.4.1 Aquis development....................................................................6-153
F.4.2 General contingent project for large customer connections......6-157
G Overheads: Confidential appendix...................................................6-159
5 Attachment 6 – Capital expenditure | Ergon Energy determination 2015–20
Shortened formsShortened form Extended form
AEMC Australian Energy Market Commission
AEMO Australian Energy Market Operator
AER Australian Energy Regulator
augex augmentation expenditure
capex capital expenditure
CCP Consumer Challenge Panel
CESS capital expenditure sharing scheme
CPI consumer price index
DRP debt risk premium
DMIA demand management innovation allowance
DMIS demand management incentive scheme
distributor distribution network service provider
DUoS distribution use of system
EBSS efficiency benefit sharing scheme
ERP equity risk premium
Expenditure Assessment GuidelineExpenditure Forecast Assessment Guideline for electricity distribution
F&A framework and approach
MRP market risk premium
NEL national electricity law
NEM national electricity market
NEO national electricity objective
NER national electricity rules
NSP network service provider
opex operating expenditure
PPI partial performance indicators
PTRM post-tax revenue model
RAB regulatory asset base
RBA Reserve Bank of Australia
repex replacement expenditure
RFM roll forward model
6 Attachment 6 – Capital expenditure | Ergon Energy determination 2015–20

Shortened form Extended form
RIN regulatory information notice
RPP revenue and pricing principles
SAIDI system average interruption duration index
SAIFI system average interruption frequency index
SLCAPM Sharpe-Lintner capital asset pricing model
STPIS service target performance incentive scheme
WACC weighted average cost of capital
7 Attachment 6 – Capital expenditure | Ergon Energy determination 2015–20

6 Capital expenditureCapital expenditure (capex) refers to the capital expenses incurred in the provision
of standard control services. The return on and of forecast capex are two of the building blocks that form part of Ergon Energy's total revenue requirement.1
This attachment sets out our preliminary decision on Ergon Energy's proposed total forecast capex. Further detailed analysis is in the following appendices:
Appendix A − Assessment Techniques
Appendix B − Assessment of capex drivers
Appendix C − Demand
Appendix D − Real material cost escalation
Appendix E − Predictive modelling approach
Appendix F − Contingent Projects.
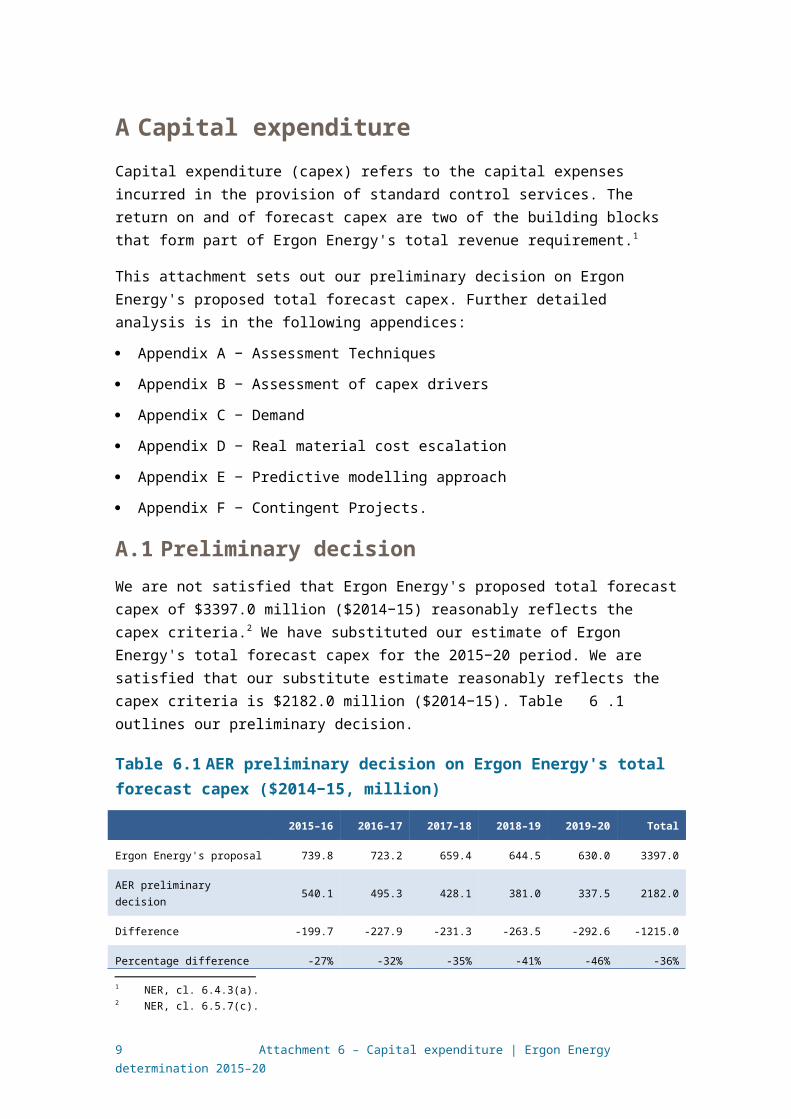
6.1 Preliminary decisionWe are not satisfied that Ergon Energy's proposed total forecast capex of $3397.0 million ($2014−15) reasonably reflects the capex criteria.2 We have substituted our estimate of Ergon Energy's total forecast capex for the 2015−20 period. We are satisfied that our substitute estimate reasonably reflects the capex criteria is $2182.0 million ($2014−15). Table 6.1 outlines our preliminary decision.
Table 6.1 AER preliminary decision on Ergon Energy's total forecast capex ($2014−15, million)
2015–16 2016–17 2017–18 2018–19 2019–20 Total
Ergon Energy's proposal 739.8 723.2 659.4 644.5 630.0 3397.0
AER preliminary decision 540.1 495.3 428.1 381.0 337.5 2182.0
Difference -199.7 -227.9 -231.3 -263.5 -292.6 -1215.0
Percentage difference (%) -27% -32% -35% -41% -46% -36%
Source: Ergon Energy Regulatory Proposal; AER analysis.
Note: Numbers may not add up due to rounding.
A summary of our reasons that we present in this attachment and appendix B are set out in Table 6.2. These reasons include our responses to stakeholders' submissions on Ergon Energy's regulatory proposal. In the table we present our reasons largely by ‘capex driver’ such as augex and repex. This reflects the way in which we tested Ergon Energy's proposed total forecast capex. Our testing used techniques tailored to the different capex drivers taking into account the best available
1 NER, cl. 6.4.3(a).2 NER, cl. 6.5.7(c).
8 Attachment 6 – Capital expenditure | Ergon Energy determination 2015–20
evidence. The outcomes of some of our techniques revealed that some aspects of Ergon Energy’s proposal, such as customer connections, were consistent with the NER requirements in that they reasonably reflected the efficient costs of a prudent service provider as well as a realistic expectation of the demand forecasts and cost inputs required to achieve the capex objectives. We found that other aspects of Ergon Energy’s proposal associated with some capex drivers, in particular augex and repex, revealed inefficiency inconsistent with the NER. Consequently, our findings on augex and repex largely explain why we were not satisfied with Ergon Energy's proposed total forecast capex.
Our findings on the capex associated with specific capex drivers are part of our broader analysis and are not intended to be considered in isolation. Our preliminary decision concerns Ergon Energy’s total forecast capex for the 2015−20 regulatory control period. We do not approve an amount of forecast expenditure for each capex driver. However, we do use our findings on the different capex drivers to arrive at a substitute estimate for total capex because as a total, this amount has been tested against the NER requirements. We are satisfied that our estimate represents the total forecast capex that as a whole reasonably reflects all aspects of the capex criteria.
Table 6.2 Summary of AER reasons and findings
Issue Reasons and findings
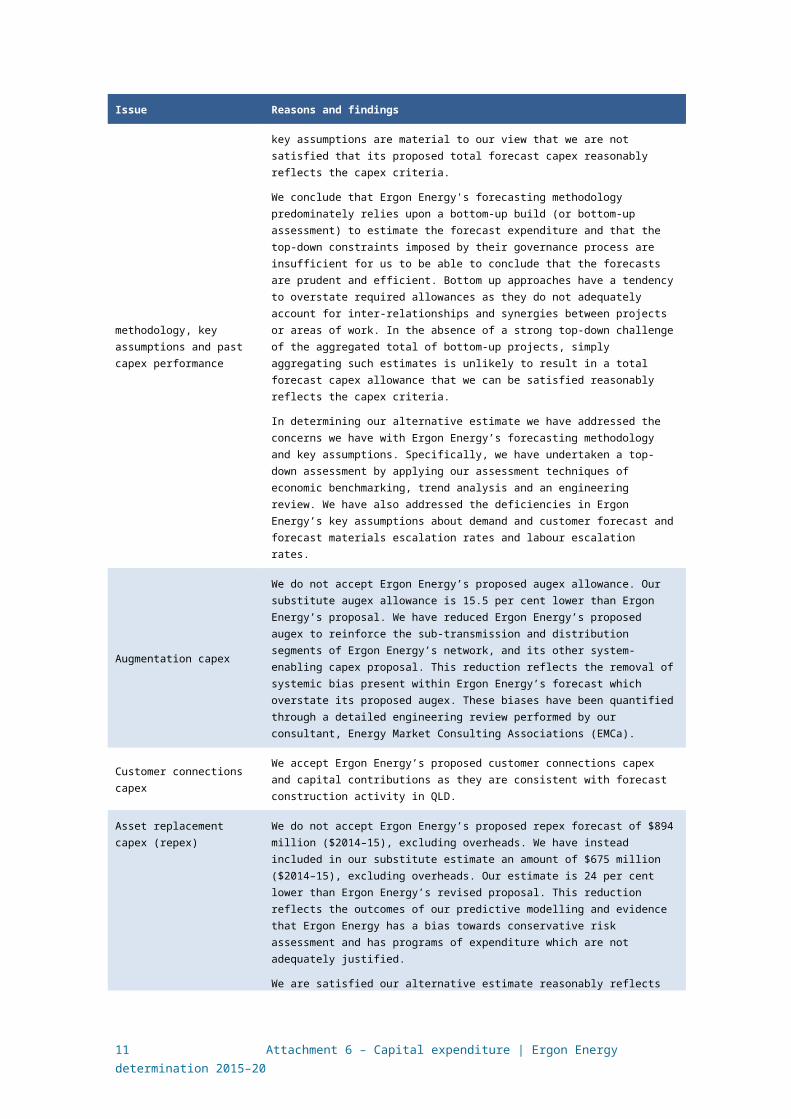
Forecasting methodology, key assumptions and past capex performance
Our concerns with Ergon Energy’s forecasting methodology and key assumptions are material to our view that we are not satisfied that its proposed total forecast capex reasonably reflects the capex criteria.
We conclude that Ergon Energy's forecasting methodology predominately relies upon a bottom-up build (or bottom-up assessment) to estimate the forecast expenditure and that the top-down constraints imposed by their governance process are insufficient for us to be able to conclude that the forecasts are prudent and efficient. Bottom up approaches have a tendency to overstate required allowances as they do not adequately account for inter-relationships and synergies between projects or areas of work. In the absence of a strong top-down challenge of the aggregated total of bottom-up projects, simply aggregating such estimates is unlikely to result in a total forecast capex allowance that we can be satisfied reasonably reflects the capex criteria.
In determining our alternative estimate we have addressed the concerns we have with Ergon Energy’s forecasting methodology and key assumptions. Specifically, we have undertaken a top-down assessment by applying our assessment techniques of economic benchmarking, trend analysis and an engineering review. We have also addressed the deficiencies in Ergon Energy’s key assumptions about demand and customer forecast and forecast materials escalation rates and labour escalation rates.
Augmentation capex
We do not accept Ergon Energy’s proposed augex allowance. Our substitute augex allowance is 15.5 per cent lower than Ergon Energy’s proposal. We have reduced Ergon Energy’s proposed augex to reinforce the sub-transmission and distribution segments of Ergon Energy’s network, and its other system-enabling capex proposal. This reduction reflects the removal of systemic bias present within Ergon Energy’s forecast which overstate its proposed augex. These biases have been quantified through a detailed engineering review performed by our consultant, Energy Market Consulting Associations (EMCa).
Customer connections capexWe accept Ergon Energy’s proposed customer connections capex and capital contributions as they are consistent with forecast construction activity in QLD.
Asset replacement capex (repex)
We do not accept Ergon Energy’s proposed repex forecast of $894 million ($2014–15), excluding overheads. We have instead included in our substitute estimate an amount of $675 million ($2014–15), excluding overheads. Our estimate is 24 per cent
9 Attachment 6 – Capital expenditure | Ergon Energy determination 2015–20

Issue Reasons and findings
lower than Ergon Energy’s revised proposal. This reduction reflects the outcomes of our predictive modelling and evidence that Ergon Energy has a bias towards conservative risk assessment and has programs of expenditure which are not adequately justified.
We are satisfied our alternative estimate reasonably reflects the capex criteria. It includes:
1. $271 million for pole and overhead conductor replacement, which is consistent with Ergon Energy’s proposal.
2. $178 million of expenditure for the four remaining modelled asset categories.
3. $225 million for assets we consider that are not suitable for predictive modelling. This consists of $126 million for the SCADA, $61 million for pole top structures and $38 million for assets classified by Ergon Energy as ‘other’.
Non-network capex
We do not accept do not accept Ergon Energy’s proposed non-network capex of $506.3 million ($2014−15). We have instead included in our alternative estimate of overall total capex an amount of $420.3 million ($2014−15) for non-network capex. This reflects our conclusion that Ergon Energy’s forecast capex for fleet and property assets does not reflect the efficient costs of a prudent operator. In our view, the major property project proposed for Townsville would not be undertaken by a prudent operator in the 2015–20 regulatory control period. Our substitute estimate of Ergon Energy’s fleet capex is in line with its fleet service requirements and operational employee numbers.
Capitalised overheads
We do not accept Ergon Energy’s proposed capitalised overheads. We have instead included in our substitute estimate of overall total capex an amount of $961.8 million ($2013−14) for capitalised overheads.
Given that our assessment of Ergon Energy's proposed direct capex demonstrates that a prudent and efficient distributor would not undertake the full range of direct expenditure contained in Ergon Energy's proposal, it follows that we would expect some reduction in the size of Ergon Energy’s capitalised overheads. We have adjusted Ergon Energy’s overheads on the basis of information they provided to us.
We also note that 34 per cent of Ergon Energy's proposed $1017.1 million ($2014−15) total capitalised overheads is attributable to information, communications and technology (ICT) services. We have identified some issues regarding this expenditure which we expect Ergon Energy to address in its revised proposal.
Real cost escalators
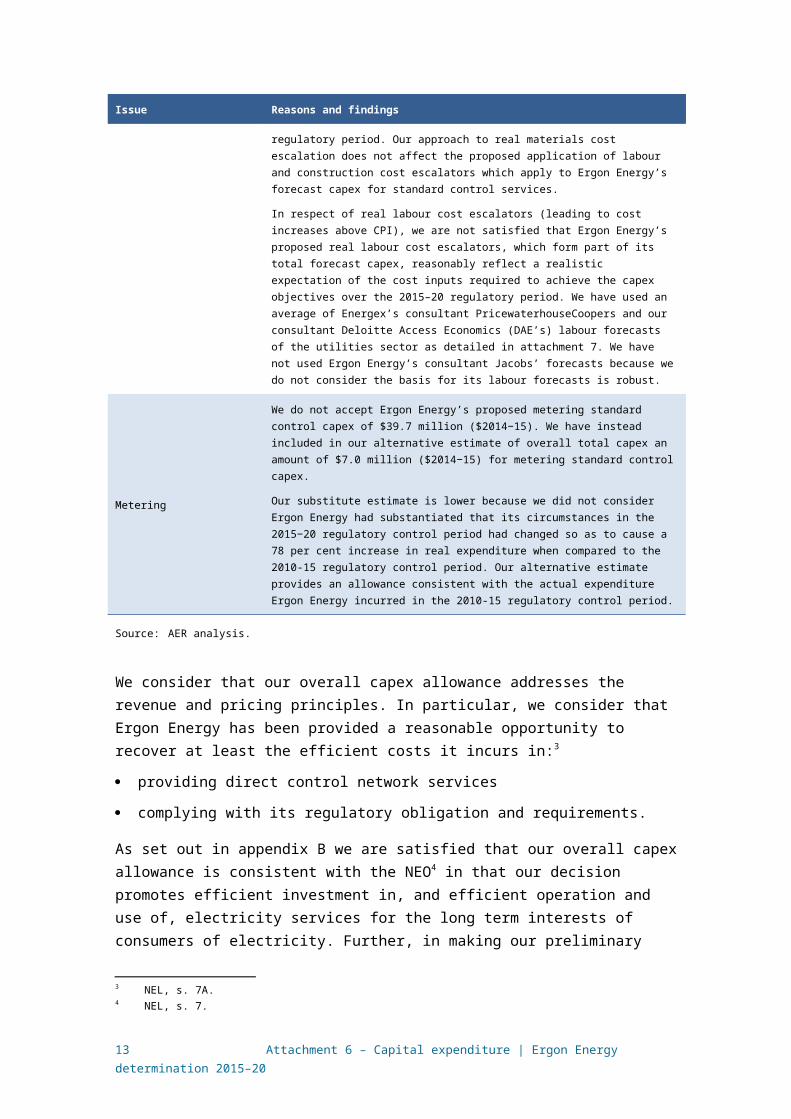
In respect of real material cost escalators (leading to cost increases above CPI), we are not satisfied that Ergon Energy’s proposed real material cost escalators, which form part of its total forecast capex, reasonably reflect a realistic expectation of the cost inputs required to achieve the capex objectives over the 2015–20 regulatory period. We consider that zero per cent real cost escalation is reasonably likely to reflect the capex criteria including that it is likely to reasonably reflect a realistic expectation of the cost inputs required to achieve the capex objectives over the 2015–20 regulatory period. Our approach to real materials cost escalation does not affect the proposed application of labour and construction cost escalators which apply to Ergon Energy’s forecast capex for standard control services.
In respect of real labour cost escalators (leading to cost increases above CPI), we are not satisfied that Ergon Energy’s proposed real labour cost escalators, which form part of its total forecast capex, reasonably reflect a realistic expectation of the cost inputs required to achieve the capex objectives over the 2015–20 regulatory period. We have used an average of Energex’s consultant PricewaterhouseCoopers and our consultant Deloitte Access Economics (DAE’s) labour forecasts of the utilities sector as detailed in attachment 7. We have not used Ergon Energy’s consultant Jacobs’ forecasts because we do not consider the basis for its labour forecasts is robust.
Metering We do not accept Ergon Energy’s proposed metering standard control capex of $39.7 million ($2014−15). We have instead included in our alternative estimate of overall total capex an amount of $7.0 million ($2014−15) for metering standard control capex.
10 Attachment 6 – Capital expenditure | Ergon Energy determination 2015–20
Issue Reasons and findings
Our substitute estimate is lower because we did not consider Ergon Energy had substantiated that its circumstances in the 2015−20 regulatory control period had changed so as to cause a 78 per cent increase in real expenditure when compared to the 2010-15 regulatory control period. Our alternative estimate provides an allowance consistent with the actual expenditure Ergon Energy incurred in the 2010-15 regulatory control period.
Source: AER analysis.
We consider that our overall capex allowance addresses the revenue and pricing principles. In particular, we consider that Ergon Energy has been provided a reasonable opportunity to recover at least the efficient costs it incurs in:3
providing direct control network services
complying with its regulatory obligation and requirements.
As set out in appendix B we are satisfied that our overall capex allowance is consistent with the NEO4 in that our decision promotes efficient investment in, and efficient operation and use of, electricity services for the long term interests of consumers of electricity. Further, in making our preliminary decision, we have specifically considered the impact our decision will have on the safety and reliability of Ergon Energy's network. We consider our substitute estimate will allow a prudent and efficient service provider in Ergon Energy's circumstances to maintain the safety, service quality, security and reliability of its network consistent with its current obligations.
6.2 Ergon Energy's proposalErgon Energy proposed total forecast capex of $3397.0 million ($2014–15) for the
2015–20 period. Figure 6.1 shows the decrease between Ergon Energy's proposal for the 2015–20 period and the actual capex that it spent during the 2010–15 regulatory control period. This forecast reduction in capex is mainly attributable to changing market and economic conditions, including a reduction in peak demand growth, and the ENCAP review in 2011−12,5 both of which impacted Ergon Energy’s planned augmentation program. Additionally, Ergon Energy has transitioned away from the deterministic Electricity Distribution and Service Delivery (EDSD) Review N-1 security standards.6
Figure 6.1 Ergon Energy's total actual and forecast capex 2010–2020
3 NEL, s. 7A.4 NEL, s. 7.5 https://www.business.qld.gov.au/__data/assets/pdf_file/0018/9117/ENCAP_Review_Final_Report_3_new.pdf6 Ergon, Regulatory Proposal, p. 94.
11 Attachment 6 – Capital expenditure | Ergon Energy determination 2015–20

Source: AER analysis.
6.3 AER’s assessment approachThis section outlines our approach to capex assessments. It sets out the relevant
legislative and rule requirements, our assessment techniques, and explains how we build an alternative estimate of total forecast capex against which we compare that proposed by the service provider. Key to our assessment is the information provided by the distributor in its regulatory proposal. At the same time as Ergon Energy submitted its proposal, it also submitted its response to our RIN. We have also sought further clarification from Ergon Energy on some aspects of its regulatory proposal through information requests.
Our assessment approach involves two key steps:
First, our starting point for building an alternative estimate is Ergon Energy's regulatory proposal.7 We apply our various assessment techniques, both qualitative and quantitative, to assess the different elements of Ergon Energy's proposal at the total level and at the capex driver level such as its proposed augex and repex. This analysis not only informs our view on whether Ergon Energy's proposal reasonably reflects the capex criteria set out in the NER8 but it also provides us with an alternative forecast that does meet the criteria. In arriving at our alternative estimate, we have had to weight the various techniques used in our assessment.
Second, having established our alternative estimate of the total forecast capex, we can test the service provider's proposed total forecast capex. This includes
7 AER, Expenditure Forecast Electricity Distribution Guideline, November 2013, p. 9; see also AEMC, Economic Regulation Final Rule Determination, pp. 111 and 112.
8 NER, cl. 6.5.7(c).
12 Attachment 6 – Capital expenditure | Ergon Energy determination 2015–20
comparing our alternative estimate total with the service provider's proposal total. If there is a difference between the two, we may need to exercise our judgement as to what is a reasonable margin of difference.
If we are satisfied that the service provider's proposal reasonably reflects the capex criteria, we accept it. If we are not satisfied, the NER requires us to put in place a substitute estimate which we are satisfied reasonably reflects the capex criteria. Where we have done this, our substitute estimate is based on our alternative estimate.
The capex criteria are:
the efficient costs of achieving the capital expenditure objectives
the costs that a prudent operator would require to achieve the capital expenditure objectives
a realistic expectation of the demand forecast and cost inputs required to achieve the capital expenditure objectives.
The AEMC noted that '[t]hese criteria broadly reflect the NEO [National Electricity Objective]'.9 The capital expenditure objectives (capex objectives) referred to in the capex criteria, are to:10
meet or manage the expected demand for standard control services over the period
comply with all regulatory obligations or requirements associated with the provision of standard control services
to the extent that there are no such obligations or requirements, maintain service quality, reliability and security of supply of standard control services and maintain the reliability and security of the distribution system
maintain the safety of the distribution system through the supply of standard control services.
Importantly, our assessment is about the total forecast capex and not about particular categories or projects in the capex forecast. The AEMC has described our role in these terms:11
It should be noted here that what the AER approves in this context is expenditure allowances, not projects.
In deciding whether we are satisfied that Ergon Energy's proposed total forecast capex reasonably reflects the capex criteria, we have regard to the capex factors. The capex factors are:12
the AER's most recent annual benchmarking report and benchmark capex that would be incurred by an efficient distributor over the relevant regulatory control period
9 AEMC Final Rule Determination: National Electricity Amendment (Economic Regulation of Network Service Providers) Rule 2012, 29 November 2012, p. 113 (AEMC, Economic Regulation Final Rule Determination).
10 NER, cl. 6.5.7(a).11 AEMC, Economic Regulation Final Rule Determination, p. vii.12 NER, cl. 6.5.7(e).
13 Attachment 6 – Capital expenditure | Ergon Energy determination 2015–20

the actual and expected capex of the distributor during the preceding regulatory control periods
the extent to which the capex forecast includes expenditure to address the concerns of electricity consumers as identified by the distributor in the course of its engagement with electricity consumers
the relative prices of operating and capital inputs
the substitution possibilities between operating and capital expenditure
whether the capex forecast is consistent with any incentive scheme or schemes that apply to the distributor
the extent to which the capex forecast is referable to arrangements with a person other than the distributor that, in the opinion of the AER, do not reflect arm's length terms
whether the capex forecast includes an amount relating to a project that should more appropriately be included as a contingent project
the extent to which the distributor has considered, and made provision for, efficient and prudent non-network alternatives.
In addition, the AER may notify the distributor in writing, prior to the submission of its regulatory proposal, of any other factor it considers relevant.13 We have not had regard to any additional factors in this preliminary decision for Ergon Energy.
In taking these factors into account, the AEMC has noted that:14
…this does not mean that every factor will be relevant to every aspect of every regulatory determination the AER makes. The AER may decide that certain factors are not relevant in certain cases once it has considered them.
For transparency and ease of reference, we have included a summary of how we have had regard to each of the capex factors in our assessment at the end of this attachment.
More broadly, we also note that in exercising our discretion, we take into account the revenue and pricing principles which are set out in the NEL.15
Expenditure Assessment Guidelines
The rule changes the AEMC made in November 2012 require us to make and publish an Expenditure Forecast Assessment Guideline for Electricity Distribution, released in November 2013 (Expenditure Guideline).16 We undertook extensive consultation with stakeholders in the preparation of the Expenditure Guideline. The Expenditure Guideline sets out the AER's proposed general approach to assessing capex (and opex) forecasts. The rule changes also require us to set out our approach
13 NER, cl. 6.5.7(e)(12).14 AEMC, Economic Regulation Final Rule Determination, p. 115.15 NEL, ss. 7A and 16(2).16 AEMC, Economic Regulation Final Rule Determination, p. 114 and AER, Expenditure Forecast Electricity
Distribution Guideline.
14 Attachment 6 – Capital expenditure | Ergon Energy determination 2015–20

to assessing capex in the relevant framework and approach (F&A). For Ergon Energy, our final F&A (published in April 2014) stated that we would apply the guideline, including the assessment techniques outlined in it.17 We may depart from our Expenditure Guideline approach and if we do so, we need to explain why. In this determination we have not departed from the approach set out in our Expenditure Guideline.
RIN data forms part of a distributor's regulatory proposal.18 In our Expenditure Guideline we set out that we would "require all the data that facilitate the application of our assessment approach and assessment techniques" and the RIN we issued in advance of a service provider lodging its regulatory proposal would specify the exact information required.19 Accordingly, we consider that our intention to materially rely upon the RIN data was made clear as part of the Expenditure Guideline.
6.3.1 Building an alternative estimate of total forecast capex
Our starting point for building an alternative estimate is Ergon Energy's proposal.20 We then considered Ergon Energy's performance in the previous regulatory control period to inform our alternative estimate. We also reviewed the proposed forecast methodology and the service provider's reliance on key assumptions that underlie its forecast.
We then applied our specific assessment techniques, to develop and estimate and assess the economic justifications that the service provider put forward. Many of our assessment techniques encompass the capex factors that we are required to take into account. Further details on each of these techniques are included in appendix A and appendix B.
Some of these techniques focus on total capex; others focus on high level, standardised sub-categories of capex. Importantly, the techniques that focus on sub-categories are not conducted for the purpose of determining at a detailed level what projects or programs of work the service provider should or should not undertake. They are but one means of assessing the overall total forecast capex required by the service provider. This is consistent with the regulatory framework and the AEMC's statement that the AER does not approve specific projects but rather an overall revenue requirement that included total capex forecast.21 Once we approve total revenue, which will be determined by reference to our analysis of the proposed capex, the service provider is then able to prioritise its capex program given the prevailing circumstances at the time (such as demand and economic conditions that impact during the regulatory period). Some projects or programs of work that were not anticipated may be required. Equally likely, some of the projects or programs of work that the service provider has proposed for the regulatory control period required may not ultimately be required in
17 AER, Final F&A for SA Power Networks, April 2014, p.8818 NER, cl. 6.8.2(c2) and (d). 19 AER, Expenditure Forecast Electricity Distribution Guideline, p. 25.20 AER, Expenditure Forecast Electricity Distribution Guideline, p. 9; see also AEMC, Economic Regulation Final
Rule Determination, pp. 111 and 112.21 AEMC, Final Rule Determination: National Electricity Amendment (Economic Regulation of Network Service
Providers) Rule 2012, 29 November 2012, p. vii.
15 Attachment 6 – Capital expenditure | Ergon Energy determination 2015–20

the regulatory period. We consider that a prudent and efficient service provider would consider the changing environment throughout the regulatory period and make sound decisions taking into account their individual circumstances.
As explained in our Guideline:
Our assessment techniques may complement each other in terms of the information they provide. This holistic approach gives us the ability to use all of these techniques, and refine them over time. The extent to which we use each technique will vary depending on the expenditure proposal we are assessing, but we intend to consider the inter-connections between our assessment techniques when determining total capex … forecasts. We typically would not infer the findings of an assessment technique in isolation from other techniques.22
In arriving at our estimate, we have had to weight the various techniques used in our assessment. How we weight these techniques will be determined on a case by case basis using our judgement as to which techniques are more robust, in the particular circumstances of each assessment. By relying on a number of techniques and weighting as relevant, we ensure we can take into consideration a wide variety of information and can take a holistic approach to assessing the proposed capex forecast.
Where our techniques involve the use of a consultant, to the extent that we accept our consultants' findings, we have set this out clearly in this preliminary decision and they form part of our reasons for arriving at our preliminary decision on overall capex. In all cases where we have relied on the findings of our consultants, we have done so only after carefully reviewing their analysis and conclusions, and evaluating these in the light of the outcomes from our other techniques and our examination of the distributor's proposal.
We also need to take into account the various interrelationships between the total forecast capex and other components of a service provider's distribution determination. The other components that directly affect the total forecast capex are forecast opex, forecast demand, the service target performance incentive scheme, the capital expenditure sharing scheme, real cost escalation and contingent projects. We discuss how these components impact the total forecast capex in table 6.4.
Underlying our approach are two general assumptions:
The capex criteria relating to a prudent operator and efficient costs are complementary such that prudent and efficient expenditure reflects the lowest long-term cost to consumers for the most appropriate investment or activity required to achieve the expenditure objectives:23
22 AER, Expenditure Forecast Electricity Distribution Guideline, p. 12.23 AER, Expenditure Forecast Electricity Distribution Guideline, pp. 8 and 9. The Tribunal has previously endorsed
this approach: see : Application by Ergon Energy Corporation Limited (Non-system property capital expenditure) (No 4) [2010] ACompT 12; Application by EnergyAustralia and Others [2009] ACompT 8; Application by Ergon Energy Corporation Limited (Labour Cost Escalators) (No 3) [2010] ACompT 11; Application by DBNGP (WA) Transmission Pty Ltd (No 3) [2012] ACompT 14; Application by United Energy Distribution Pty Limited [2012] ACompT 1; Re: Application by ElectraNet Pty Limited (No 3) [2008] ACompT 3 ; Application by DBNGP (WA)
16 Attachment 6 – Capital expenditure | Ergon Energy determination 2015–20

Past expenditure was sufficient for Ergon Energy to manage and operate its network in that previous period, in a manner that achieved the capex objectives.24
After applying the above approach, we arrive at our alternative estimate of the total capex forecast.
6.3.2 Comparing the service provider's proposal with our alternative estimate
Having established our estimate of the total forecast capex, we can test the service provider's proposed total forecast capex. This includes comparing our alternative estimate of forecast total capex with the service provider's proposal. The service provider's forecast methodology and its key assumptions may explain any differences between our alternative estimate and its proposal.
As the AEMC foreshadowed, we may need to exercise our judgement in determining whether any 'margin of difference' is reasonable:25
The AER could be expected to approach the assessment of a NSP's expenditure (capex or opex) forecast by determining its own forecast of expenditure based on the material before it. Presumably this will never match exactly the amount proposed by the NSP. However there will be a certain margin of difference between the AER's forecast and that of the NSP within which the AER could say that the NSP's forecast is reasonable. What the margin is in a particular case, and therefore what the AER will accept as reasonable, is a matter for the AER exercising its regulatory judgment.
We have not relied solely on any one technique to assist us in forming a view as to whether we are satisfied that a service provider's proposed forecast capex reasonably reflects the capex criteria. We have drawn on a range of techniques as well as our assessment of other elements that impact upon capex such as demand and real cost escalators.
Our decision concerns Ergon Energy’s total forecast capex and we are not approving specific projects. It is important to recognise that the service provider is not precluded from undertaking unexpected capex works, if the need arises, and despite the fact that such works did not form part our assessment in this determination. We consider that acting prudently and efficiently, the service provider will consider the changing environment throughout the regulatory period and make sound decisions taking into account their individual circumstances to address any unanticipated issues. Our provision of a total capex forecast does not constrain a service provider’s actual spending—either as a cap or as a requirement that the forecast be spent on specific projects or activities. It is conceivable that a service provider might wish to expend particular capital expenditure differently or in excess of the total capex forecast set out in our this decision. Our decision does not constrain it from doing so.
24 AER, Expenditure Forecast Electricity Distribution Guideline, p. 9.25 AEMC, Economic Regulation Final Rule Determination, p. 112.
17 Attachment 6 – Capital expenditure | Ergon Energy determination 2015–20

The regulatory framework has a number of mechanisms to deal with unanticipated expenditure needs. Importantly, where unexpected events leads to an overspend of the approved capex forecast, a service provider does not bear the full cost, but rather bears 30 per cent of this cost, if the expenditure is found to be prudent and efficient. Further, for significant unexpected capex, the pass-through provisions provide a means for a service provider to pass on such expenses to customers where appropriate.
This does not mean that we have set our alternative estimate below the level where Ergon Energy has a reasonable opportunity to recover at least its efficient costs. Rather, we note that Ergon Energy is able to respond to any unanticipated issues that arise during the 2015−20 regulatory period and in the event that the approved total revenue underestimates the total capex required, Ergon Energy has significant flexibility to allow it to meet its safety and reliability obligations.
Conversely, if we overestimate the amount of capex required, the stronger incentives put in place by the AEMC in 2012 should lead to a distributor spending only what is efficient, with the benefits of the underspend being shared between the distributor and consumers.
6.4 Reasons for preliminary decisionWe applied the assessment approach set out in section 6.3 to Ergon Energy. We are not satisfied that Ergon Energy's total forecast capex reasonably reflects the capex criteria. We compared Ergon Energy's capex forecast to our alternative capex forecast we developed using the approach and techniques outlined in appendices A and B. Ergon Energy's proposal is materially higher than ours. We are satisfied that our alternative estimate reasonably reflects the capex criteria.
Table 6.3 sets out the capex amounts by capex driver that we have included in our alternative estimate of Ergon Energy's total forecast capex for the 2015–2020 period.
Table 6.3 AER assessment of required capex by capex driver 2015−20 ($2014−15, million)
Category 2015−16 2016−17 2017−18 2018−19 2019−20 Total
Augmentation 133.5 126.3 117.6 91.6 90.0 559.0
Connections 85.2 86.3 87.6 88.8 90.0 437.8
Replacement 131.3 146.0 125.4 137.1 134.8 674.6
Metering 1.4 1.4 1.4 1.4 1.4 7.0
Non-Network 112.7 90.5 80.0 71.7 65.4 420.3
Capitalised overheads 197.3 194.4 189.9 193.0 187.2 961.8
Materials escalation adjustment
-91.5 -119.3 -141.8 -169.7 -197.9 -720.3
Gross Capex (includes capital contributions) 569.9 525.7 460.0 413.8 370.9 2340.3
18 Attachment 6 – Capital expenditure | Ergon Energy determination 2015–20

Capital Contributions SCS 29.8 30.4 31.9 32.9 33.4 158.3
Net Capex (excluding capital contributions) 540.1 495.3 428.1 381.0 337.5 2182.0
Source: AER analysis.
Note: Numbers may not add up due to rounding.
Our detailed assessment of Ergon Energy's forecasting methodology, key assumptions and past capex performance is discussed in the section 6.4 below.
Our assessment of capex drivers is in appendix B. This sets out the application of our assessment techniques to the capex drivers, and the weighting we gave to particular techniques. We used our reasoning in the appendices to form our alternative estimate.
6.4.1 Key assumptions
The NER requires Ergon Energy to include in its regulatory proposal the key assumptions that underlie its proposed forecast capex and a certification by its directors that those key assumptions are reasonable.26
Ergon Energy's key assumptions are as follows.27
The current company structure, ownership arrangements and service classification will continue.
Ergon Energy will deliver its forecast capital expenditure for 2014−15.
The current legislative and regulatory obligations will not change materially.
Ergon Energy applies an “economic” customer value based approach to reliability, supported by “safety net” measures—this is in response to a Queensland Government Direction.
The minimum security standards in its Distribution Authority will remain at 2010−11 levels until 2019−20.
Actual maximum demand and customer connection growth will not vary materially from its forecasts.
Ergon Energy will apply a new Connections Policy—this will replace its Capital Contributions Policy, dated April 2005.
Ergon Energy's contestability arrangements that allow capital works to be undertaken by third parties will continue on the current basis.
Ergon Energy's forecast capital expenditure is based on its efficient costs for specific investments and programs of work, which are explained in its regulatory proposal.
26 NER, cll. S6.1.1(2), (4) and (5).27 Ergon Energy, Regulatory Proposal, p.108
19 Attachment 6 – Capital expenditure | Ergon Energy determination 2015–20

Ergon Energy's parametric insurance will cover the financial impact of extreme wind-generated weather events and its works delivery and expenditure requirements will not be materially disrupted by extreme weather events.
Ergon Energy's labour, material and other cost escalations are realistic and reasonable.
We have assessed Ergon Energy's key assumptions in the appendices to this capex attachment.
6.4.2 Forecasting methodology
Ergon Energy is required to inform us about the methodology it proposes to use to prepare its forecast capex allowance before it submits its regulatory proposal.28 It is also required to include this information in its regulatory proposal.29
The main points of Ergon Energy's forecasting methodology are:30
The process begins with the development of ‘category level’ expenditure forecasts. Each of the category level forecasts is then consolidated into a total capital expenditure amount. Both the capital expenditure forecasts and the revenue and pricing outcomes are assessed against a number of factors, including:
o customer expectations regarding pricing and service outcomes, both within the next regulatory control period and in future periods
o corporate and stakeholder expectations and commitments in respect of price and service delivery
o Asset replacement capital expenditure—Ergon Energy uses a combination of replace on fail and proactive asset replacement approaches. Ergon Energy forecast costs using standard estimates of replacement for each asset type and forecast volumes using a combination of:
Discrete engineering analysis of individual projects in order to address specific known needs
Condition Based Risk Modelling that uses available asset information and complex ageing models to predict asset failure probabilities and associated risks
Simplified predictive models that use statistical relationships between known asset information and future replacement needs, including the AER’s repex model and historical trend models.
Augmentation capital expenditure—Ergon Energy uses a combination of:
o Detailed engineering analysis that compares forecast demand and capacity in the sub-transmission and distribution systems in order to identify emerging constraints. We then undertake detailed assessments of the least cost options to address the identified constraints
28 NER, cll. 6.8.1A; Ergon Energy, Expenditure Forecasting Methodology, November 2013.29 NER, cl. S6.1.1(2); 30 Ergon Energy, Regulatory Proposal, p. 110
20 Attachment 6 – Capital expenditure | Ergon Energy determination 2015–20

o The AER’s augex model, which it describes as a simplified predictive model that uses information on capacity, utilisation and demand patterns in network segments, and unit costs.
Customer Connection Initiated Capital Works—Ergon Energy uses average historical costs and an econometric model that forecasts volumes using several macroeconomic variables
Reliability capital expenditure—Ergon Energy uses average historical costs for comparable projects and an assumption that they will deliver three reliability projects each year.
Quality improvement capital expenditure—This Is forecast on the basis that Ergon Energy will complete the installation of power quality monitors across three phase and Single Wire Earth Return (SWER) distribution feeders and power quality analysers at zone substations. These forecasts are also based on historical costs.
Other system capital expenditure—This is forecast on a project-by-project basis using a combination of vendor pricing, historical costs and standard labour rates and material costs.
Fleet capital expenditure—Ergon Energy uses the results of a simulation model which forecasts the entry and exit of vehicles from the Ergon Energy fleet.
We have identified two aspects of Ergon Energy's forecasting methodology which indicate that it is not a sufficient basis from which to conclude that its proposed total forecast capex reasonably reflects the capex criteria. These are:
Ergon Energy's forecasting methodology generally applies a bottom-up build (or bottom-up assessment) to estimate the forecast expenditure for all its capex categories.
Ergon Energy's cost-benefit evaluation of each of its capital projects or programs reveals that its underlying risk assessment is excessively conservative.
Insufficient top-down restraint
Ergon Energy's forecasting methodology is primarily based upon a bottom-up build (or bottom-up assessment) to estimate the forecast expenditure for all its capex categories.31 Ergon Energy stated that where the aggregate capital expenditure forecasts or the revenue/pricing outcomes are inconsistent with the customer, corporate, workforce capability or regulatory expectations, refinements are made to the forecast volumes and the costs at the category level.32
Ergon Energy stated that it then assesses the category level forecasts using:33
benchmarking and category based assessment techniques (such as augex and repex modelling) recommended and used by the AER as part of its own assessment processes
31 Ergon Energy, Regulatory Proposal, p.10632 Ergon Energy, Regulatory Proposal, p.10633 Ergon Energy, Regulatory Proposal, p.106
21 Attachment 6 – Capital expenditure | Ergon Energy determination 2015–20

independent verification of the expenditure forecasting methodology, assumptions and inputs
historical and trend analysis
detailed project reviews
technical assessments
governance and documentation reviews.
The drawback of deriving an estimate of capex by applying a bottom-up assessment is that of itself it does not provide any evidence that the estimate is efficient. Bottom up approaches have a tendency to overstate required allowances as they do not adequately account for inter-relationships and synergies between projects or areas of work. Whereas reviewing aggregated areas of expenditure or the total expenditure, allows for an overall assessment of efficiency. In certain very limited circumstances, a bottom up build may be a reasonable starting point to justifying expenditure.34 However, simply aggregating such estimates is unlikely to result in a total forecast capex allowance that we are satisfied reasonably reflects the capex criteria.
As we stated in our Expenditure Guideline, we intend to assess forecast capex proposals through a combination of top down and bottom up modelling.35 Our top-down assessment of Ergon Energy's proposed forecast is a material consideration in determining whether we are satisfied if it reasonably reflects the capex criteria. For example, trend analysis is a top-down assessment that can be applied in the context of a distribution network. This technique is able to test whether an estimate that results from a bottom-up assessment might be efficient. We have used this technique in this determination.
A top-down assessment should also clearly evidence a holistic and strategic consideration or assessment of the entire forecast capex program at a portfolio level. It should also demonstrate how the forecast capex proposal has been subject to governance and risk management arrangements. In turn, these arrangements should demonstrate how the timing and prioritisation of certain capital projects or programs has been determined over both the short and the long-term. It should also demonstrate that the capex drivers, such as asset health and risk levels, are well defined and justified. In particular, asset health and risk level metrics are key elements of capex drivers.
Ergon Energy's forecast methodology cites the application of a top-down forecasting approach. We have examined the top-down approach used by Ergon Energy and do not consider that it brings sufficient restraint to bear on the overall forecast. This is supported by our consultant Energy Market Consulting associates (EMCa) which concluded that:36
34 It is possible for a bottom-up approach to reasonably reflect the capex criteria and if our assessment demonstrated this to be the case, then we would accept a total capex forecast derived from the bottom-up assessment. However, due to potential overestimation in a bottom-up approach, a top down assessment is a vital aspect of testing the validity of the bottom-up forecast.
35 AER, Expenditure Forecast Electricity Distribution Guideline, p. 17.36 EMCa, Review of Proposed Network Augmentation and Replacement Expenditure in Ergon’s Regulatory Proposal
2015−2020, p.iv.
22 Attachment 6 – Capital expenditure | Ergon Energy determination 2015–20

Ergon’s proposed forecast is not reasonable and exhibits a degree of upwards bias that reflects cost and risk over-estimation and the application of a CPI-based price objective as its primary top-down challenge constraint. EMCa note that Ergon Energy’s proposed repex appears to be less than is shown by Ergon’s application of the repex model.37 However, EMCa remain of the view that Ergon Energy’s aggregated bottom up forecast is likely to have excessive costs over that which is efficient and prudent.38 We consider that Ergon’s proposed repex is higher than required to reasonably reflect the capex criteria. Our assessment is based on our own application of the repex model, which used observations from Ergon’s own data, in combination with the more detailed program review conducted by EMCa. Our application of predictive modelling, along with other assessment techniques, is discussed in appendix B.
We note that Ergon Energy has targeted no more than CPI increases in price over the 2015−20 period.39 However, this price constraint does not address the prudency and efficiency requirement contained in the NER. There is no prima facie reason to conclude that CPI price increases reflects the efficient price path in the 2015−20 regulatory period. We again agree with EMCa which stated that:40
Capex should be set to provide the prudent and efficient expenditure required to operate a safe and reliable network. In the current environment, we consider that a CPI price cap objective on the business overall does not provide a meaningful discipline that would lead Ergon Energy to a prudent and efficient capex level.
Having concluded that an upwards bias is likely to exist, we have applied a range of assessment techniques to perform our own top-down assessment. These techniques enable us to test whether an estimate that results from a bottom-up assessment might be efficient. We have applied top down assessments to the overall level of expenditure as well as each major sub-category of capex. The combination of our techniques informs our decision as to whether the proposed total capex forecast reasonably reflects the capex criteria.
Lack of cost benefit analysis
Secondly, Ergon Energy's cost-benefit evaluation where it exists for its capital projects or programs reveals that its underlying risk assessment is excessively conservative. Ultimately, this excessively conservative approach to risk means that Ergon Energy is forecasting more capex in the 2015–20 regulatory control period than is necessary to achieve the capex objectives. EMCa found that for both augex and repex the expenditure has not been:41
37 EMCa, Review of Proposed Network Augmentation and Replacement Expenditure in Ergon’s Regulatory Proposal 2015−2020, p.iii.
38 EMCa, Review of Proposed Network Augmentation and Replacement Expenditure in Ergon’s Regulatory Proposal 2015−2020, p.iii.
39 Ergon, 07.00.02 CIA Expenditure Forecast Summary, p. i.40 EMCa, Review of Proposed Network Augmentation and Replacement Expenditure in Ergon’s Regulatory Proposal
2015−2020, p. i.41 EMCa, Review of Proposed Network Augmentation and Replacement Expenditure in Ergon’s Regulatory Proposal
2015−2020, p.62.
23 Attachment 6 – Capital expenditure | Ergon Energy determination 2015–20

adequately supported by cost-benefit analysis and appropriately-applied risk assessment.
We do note that the As Low As Reasonably Practical (ALARP) principle allows for risks to be mitigated to the point where the cost is ‘grossly disproportionate’ to the benefits. However, we agree with EMCa's assessment that this is applicable to high or intolerable risks, leaving standard cost/benefit analysis the preferred tool for the majority of risk assessments.42
The lack of a rigorous cost-benefit approach, combined with a top-down assessment designed to meet price, rather than efficiency objectives, indicates that Ergon Energy's forecast methodology is likely to result in a capex forecast that does not reasonably reflect the capex criteria.
6.4.3 Interaction with the STPIS
We consider that our approved capital expenditure forecast is consistent with the setting of targets under the STPIS. In particular, we consider that the capex allowance should not be set such that there is an expectation that it will lead to Ergon Energy systematically under or over performing against its STPIS targets. We consider our approved capex forecast is sufficient to allow a prudent and efficient Ergon Energy to maintain performance at the targets set under the STPIS. As such, it is appropriate to apply the STPIS as set out in attachment 11.
In making our decision, we have specifically considered the impact our decision will have on the safety and reliability of Ergon Energy's network. We consider our substitute estimate is sufficient for Ergon Energy to maintain the safety, service quality and reliability of its network consistent with its obligations. In any event, our provision of a total capex forecast does not constrain a service provider’s actual spending – either as a cap or as a requirement that the forecast be spent on specific projects or activities. It is conceivable that a service provider might wish to expend particular capital expenditure differently or in excess of the total capex forecast set out in our Decision. Our decision does not constrain it from doing so. Under our analysis of specific capex drivers, we have explained how our analysis and certain assessment techniques factor in safety and reliability requirements.
6.4.4 Ergon Energy's capex performance
We have looked at a number of historical metrics of Ergon Energy's capex performance against that of other distributors in the NEM. We also compare Ergon Energy's proposed forecast capex allowance against historical trends. These metrics are largely based on outputs of the annual benchmarking report and other analysis undertaken using data provided by the distributors for the annual benchmarking report. This includes Ergon Energy's relative partial and multilateral total factor productivity (MTFP) performance, capex per customer and maximum demand, and Ergon Energy's historic capex trend.
42 EMCa, Review of Proposed Network Augmentation and Replacement Expenditure in Ergon’s Regulatory Proposal 2015−2020, p. 31.
24 Attachment 6 – Capital expenditure | Ergon Energy determination 2015–20

The NER sets out that we must have regard to our annual benchmarking report.43 This section shows how we have taken it into account. We consider this high level benchmarking at the overall capex level is suitable to gain an overall understanding of Ergon Energy's proposal in a broader context. However, in our capex assessment we have not relied on our high level benchmarking metrics set out below other than to gain a high level insight into Ergon Energy's proposal. We have not used this analysis deterministically in our capex assessment.
Partial factor productivity of capital and multilateral total factor productivity
Figure 6.2 shows a measure of partial factor productivity of capital taken from our benchmarking report. This measure incorporated the productivity of transformers, overhead lines and underground cables. Ergon Energy falls towards the lower end of the range on this assessment, falling behind the Victorian, South Australian and some NSW distributors.
Figure 6.2 Partial factor productivity of capital (transformers, overhead and underground lines)
2006 2007 2008 2009 2010 2011 2012 20130.600
0.800
1.000
1.200
1.400
1.600
1.800
2.000
03CIT13UED08JEN10SAP05ENX04END11AND06ERG02AGD09PCR01ACT07ESS12TND
Source: AER annual benchmarking report.
Figure 6.3 shows that Ergon Energy performs similarly on MTFP. MTFP measures how efficient a business is in terms of its inputs (costs) and outputs (energy delivered,
43 NER, cl. 6.5.7(e).
25 Attachment 6 – Capital expenditure | Ergon Energy determination 2015–20

customer numbers, ratcheted maximum demand, reliability and circuit line length). Across all of these measures, Ergon Energy performed relatively poorly.
Figure 6.3 Multilateral total factor productivity
2006 2007 2008 2009 2010 2011 2012 20130.600
0.800
1.000
1.200
1.400
1.600
1.800
2.000
CITSAPUEDJENPCRENXENDANDESSAGDERGACTTND
Source: AER annual benchmarking report
Relative capex efficiency metrics
Figures 6.4 and 6.5 show capex per customer and per maximum demand, against customer density. Capex is taken as a five year average for the years 2008−12. For the QLD and SA distributors, we have also included the businesses' proposed capex for the 2015–20 regulatory control period. We have considered capex per customer as it reflects the amount consumers are charged for additional capital investments.
Figure shows that Ergon Energy had the highest capex per customer for the 2008−2012 period. Ergon Energy's capex per customer will reduce for the 2015–20 regulatory control period based on their proposed forecast capex. However, even after this reduction Ergon Energy's capex per customer is still among the highest in the NEM.
26 Attachment 6 – Capital expenditure | Ergon Energy determination 2015–20

Figure 6.4 Capex per customer (000s, $2013−14), against customer density
0 10 20 30 40 50 60 70 80 90 100 1100
0.1
0.2
0.3
0.4
0.5
0.6
0.7
0.8
0.9
1
ActewAGL
AusGrid
CitiPower
Endeavour EnergyEnergex
Ergon EnergyEssential Energy
JemenaPowercorSA Power Networks
SP AusNetTasNetworks
United Energy
Energex forecast
Ergon forecastSA Power Network
forecast
Customer density
Cap
ex p
er c
usto
mer
Source: AER analysis
Figure 6.5 shows that Ergon Energy's capex per maximum demand for the 2008−2012 period was among the highest in the NEM. Capex per maximum demand is forecast to reduce for Ergon Energy in the next period and is close to the Victorian distributors.
27 Attachment 6 – Capital expenditure | Ergon Energy determination 2015–20

Figure 6.5 Capex per maximum demand (000s, $2013−14), against customer density
0 10 20 30 40 50 60 70 80 90 100 110$0
$50
$100
$150
$200
$250
$300
$350
ActewAGL
AusGrid
CitiPower
Endeavour EnergyEnergex
Ergon Energy
Essential Energy
JemenaPowercor
SA Power Networks
SP AusNet
TasNetworks
United Energy
Energex forecastErgon forecast
SA Power Network forecast
Customer density
Cap
ex p
er M
axim
um d
eman
d
Source: AER analysis.
6.4.5 Ergon Energy historic capex trends
We have compared Ergon Energy's capex proposal for the 2015–20 regulatory control period against the long term historical trend in capex levels.
Figure 6.6 shows actual historic capex and proposed capex between 2001−12 and 2018−19. This figure shows that while Ergon Energy's average proposed capex for the 2015–20 regulatory control period is similar to that in the previous regulatory period, it is also a substantial increase over the expenditure in the early 2000's.
28 Attachment 6 – Capital expenditure | Ergon Energy determination 2015–20

Figure 6.6 Ergon Energy total capex (including overheads)—historical and forecast for 2015–20 regulatory control period
Source: AER analysis
6.4.6 Interrelationships
There are a number of interrelationships between Ergon Energy's total forecast capex for the 2015–20 regulatory control period and other components of its distribution determination that we have taken into account in coming to our preliminary decision. Table 6.4 summarises these other components and their interrelationships with Ergon Energy's total forecast capex.
Table 6.4 Interrelationships between total forecast capex and other components
Other component Interrelationships with total forecast capex
Total forecast opex There are elements of Ergon Energy's total forecast opex that are related to its total forecast capex. These are:
29 Attachment 6 – Capital expenditure | Ergon Energy determination 2015–20

Other component Interrelationships with total forecast capex
the labour cost escalators that we approved in (refer to attachment 7)
the amount of maintenance opex that is reflected in Ergon Energy's opex base year that we approved in (refer to Attachment 7
The labour cost escalators are interrelated with capex because Ergon Energy's total forecast capex includes expenditure for capitalised labour. Maintenance opex is also related to capex, although we did not approve a specific amount of maintenance opex as part of assessing Ergon Energy's total forecast opex. This is because the amount of maintenance opex that is reflected in Ergon Energy's opex base in part determines the extent to which Ergon Energy needs to spend repex during the 2015–20 regulatory control period.
Forecast demand
Forecast demand is related Ergon Energy's total forecast capex. Growth driven capex, which includes augex and customer connections capex, is typically triggered by a need to build or upgrade a network to address changes in demand or to comply with quality, reliability and security of supply requirements. Hence, the main driver of growth-related capex is maximum demand and its effect on network utilisation and reliability.
Capital Expenditure Sharing Scheme (CESS)
The CESS is related to Ergon Energy's total forecast capex. In particular, the effective application of the CESS is contingent on the approved total forecast capex being efficient, and that it reasonably reflects the capex criteria. As we note in table 6-5, this is because any efficiency gains or losses are measured against the approved total forecast capex. In addition, in future distribution determinations we will be required to undertake an ex post review of the efficiency and prudency of capex, with the option to exclude any inefficient capex in excess of the approved total forecast capex from Ergon Energy's regulatory asset base. In particular, the CESS will ensure that Ergon Energy bears at least 30 per cent of any overspend against the capex allowance. Similarly, if Ergon Energy can fulfil their objectives without spending the full capex allowance, it will be able to retain 30 per cent of the benefit of this. In addition, if an overspend is found to be inefficient through the ex post review, Ergon Energy risks having to bear the entire overspend.
Service Target Performance Incentive Scheme (STPIS)
The STPIS is interrelated to Ergon Energy's total forecast capex, in so far as it is important that it does not include any expenditure for the purposes of improving supply reliability during the 2015–20 regulatory control period. This is because such expenditure should be offset by rewards provided through the application of the STPIS.
Further, the forecast capex should be sufficient to allow Ergon Energy to maintain performance at the targets set under the STPIS. The capex allowance should not be set such that there is an expectation that it will lead to Ergon Energy systematically under or over performing against its targets.
Contingent project
A contingent project is interrelated to Ergon Energy's total forecast capex. This is because an amount of expenditure that should be included as a contingent project should not be included as part of Ergon Energy's total forecast capex for the 2015–20 regulatory control period.
Ergon Energy proposed two contingent projects in the 2015020 regulatory control period.
Source: AER analysis.
6.4.7 Capex factors
In applying our assessment techniques to determine whether we are satisfied that Ergon Energy's proposed total forecast capex and our alternative estimate reasonably reflects the capex criteria, we have had regard to the capex factors. Where relevant, we have also had regard to the capex factors in assessing the forecast capex associated with its underlying capex drivers as set out in appendix B. Table 6.5 summarises how we have taken into account the capex factors.
Table 6.5 AER consideration of the capex factors
30 Attachment 6 – Capital expenditure | Ergon Energy determination 2015–20

Capex factor AER consideration
The most recent annual benchmarking report and benchmarking capex that would be incurred by an efficient distributor over the relevant regulatory control period
We have had regard to our most recent benchmarking report in assessing Ergon Energy's proposed total forecast capex and in determining our alternative estimate for the 2015–20 regulatory control period. This can be seen in the metrics we used in our assessment of Ergon Energy's capex performance.
The actual and expected capex of Ergon Energy during any preceding regulatory control periods
We have had regard to Ergon Energy's actual and expected capex during the 2010–15 and preceding regulatory control periods in assessing its proposed total forecast capex.
This can be seen in our assessment of Ergon Energy's capex performance. It can also be seen in our assessment of the forecast capex associated with the capex drivers that underlie Ergon Energy's total forecast capex.
For non-network related capex, we rely on trend analysis to arrive at an estimate that meets the capex criteria.
The extent to which the capex forecast includes expenditure to address concerns of electricity consumers as identified by Ergon Energy in the course of its engagement with electricity consumers
We have had regard to the extent to which Ergon Energy's proposed total forecast capex includes expenditure to address consumer concerns that have been identified by Ergon Energy. Ergon Energy has undertaken engagement with its customers and presented high level findings regarding its customer preferences. These findings suggest that consumers value lower prices and reliable networks.
On the information available to us, including stakeholder submissions, we have been unable to identify the extent to which Ergon Energy's proposed total forecast capex includes capex that address the concerns of its consumers that it has identified.
The relative prices of operating and capital inputs
We have had regard to the relative prices of operating and capital inputs in assessing Ergon Energy's proposed real cost escalation factors for materials. In particular, we have accepted Ergon Energy's proposal to not apply real cost escalation for materials.
The substitution possibilities between operating and capital expenditure
We have had regard to the substitution possibilities between opex and capex. We have considered whether there are more efficient and prudent trade-offs in investing more or less in capital in place of ongoing operations. See our discussion about the interrelationships between Ergon Energy's total forecast capex and total forecast opex in Table 6.4 above.
Whether the capex forecast is consistent with any incentive scheme or schemes that apply to Ergon Energy
We have had regard to whether Ergon Energy's proposed total forecast capex is consistent with the CESS and the STPIS. See our discussion about the interrelationships between Ergon Energy's total forecast capex and the application of the CESS and the STPIS in Table 6.4 above.
The extent to which the capex forecast is referable to arrangements with a person other than the distributor that do not reflect arm's length terms
We have had regard to whether any part of Ergon Energy's proposed total forecast capex or our alternative estimate that is referable to arrangements with a person other than Ergon Energy that do not reflect arm's length terms. We have considered the arrangements between Ergon Energy and its related party SPARQ regarding the provision of ICT services and do not have evidence to indicate that this does not reflect arm's length terms.
Whether the capex forecast includes an amount relating to a project that should more appropriately be included as a contingent project
We have had regard to whether any amount of Ergon Energy's proposed total forecast capex or our alternative estimate that relates to a project that should more appropriately be included as a contingent project. We did not identify any such amounts that should more appropriately be included as a contingent project.
31 Attachment 6 – Capital expenditure | Ergon Energy determination 2015–20

Capex factor AER consideration
The extent to which Ergon Energy has considered and made provision for efficient and prudent non-network alternatives
We have had regard to the extent to which Ergon Energy made provision for efficient and prudent non-network alternatives as part of our assessment of the capex associated with the non-network capex driver. We discuss this further in Appendix B.
Any other factor the AER considers relevant and which the AER has notified Ergon Energy in writing, prior to the submission of its revised regulatory proposal, is a capex factor
We did not identify any other capex factor that we consider relevant.
Source: AER analysis.
32 Attachment 6 – Capital expenditure | Ergon Energy determination 2015–20

A Assessment TechniquesThis appendix describes the assessment approaches we have applied in assessing
Ergon Energy's proposed forecast capex. We use a variety of techniques to determine whether the proposed capex reasonably reflects the capex criteria. The extent to which we rely on each of the assessment techniques is set out in appendix B.
The assessment techniques that we apply in capex are necessarily different from those we apply in the assessment of opex. This is reflective of differences in the nature of the expenditure being assessed. As such, we use some assessment techniques in our capex assessment that are not suitable for assessing opex and vice versa. We set this out in our expenditure assessment guideline, where we stated:44
Past actual expenditure may not be an appropriate starting point for capex given it is largely non-recurrent or 'lumpy', and so past expenditures or work volumes may not be indicative of future volumes. For non-recurrent expenditure, we will attempt to normalise for work volumes and examine per unit costs (including through benchmarking across distributors) when forming a view on forecast unit costs.
Other drivers of capex (such as replacement expenditure and connections works) may be recurrent. For such expenditure, we will attempt to identify trends in revealed volumes and costs as an indicator of forecast requirements.
The assessment techniques that we have used to asses Ergon Energy's capex are set out below.
A.1 Economic benchmarkingEconomic benchmarking is one of the key outputs of our annual benchmarking
report. We are required to consider economic benchmarking as it is one of the capex factors under the NER.45 Economic benchmarking applies economic theory to measure the efficiency of a distributor's use of inputs to produce outputs, having regard to environmental factors.46 It allows us to compare the performance of a distributor against its own past performance, and the performance of other distributors. Economic benchmarking helps us to assess whether a distributor's capex forecast represents efficient costs.47 As stated by the AEMC, 'benchmarking is a critical exercise in assessing the efficiency of a NSP'.48
A number of economic benchmarks from the annual benchmarking report are relevant to our assessment of capex. These include measures of total cost efficiency and overall capex efficiency. In general, these measures calculate a distributor's efficiency with consideration given to its inputs, outputs and its operating environment. We have considered each distributor's operating environment in so far as there are
44 AER, Expenditure assessment guideline, p. 8.45 NER, cl. 6.5.7(e)(4).46 AER, Explanatory Statement: Expenditure Forecasting Assessment Guidelines, November 2013.47 NER, cl. 6.5.7(c).48 AEMC, Economic Regulation Final Rule Determination, p. 25.
33 Attachment 6 – Capital expenditure | Ergon Energy determination 2015–20

factors that are outside of a distributor's control but which affect a distributor's ability to convert inputs into outputs.49 Once such exogenous factors are taken into account, we expect distributors to operate at similar levels of efficiency. One example of an exogenous factor that we have taken into account is customer density. For more on how we have forecast these measures, see our annual benchmarking report.50
In addition to the measures in the annual benchmarking report, we have considered how distributors have performed on a number of overall capex metrics, including capex per customer, and capex per maximum demand. We have calculated these economic benchmarks based on actual data from the previous regulatory control period.
The results from the economic benchmarking give an indication of the relative efficiency of each of the distributors, and how this has changed over time.
A.2 Trend analysisWe have considered past trends in actual and forecast capex. This is one of the
capex factors to which we are required to have regard.51
Trend analysis involves comparing service providers' forecast capex and work volumes against historic levels. Where forecast capex and volumes are materially different to historic levels, we have sought to understand what has caused these differences. In doing so, we have considered the reasons given by the distributors in their proposals, as well as changes in the circumstances of the distributor.
In considering whether a business' capex forecast reasonably reflects the capex criteria, we need to consider whether the forecast will allow the business to meet expected demand, and comply with relevant regulatory obligations.52 Demand and regulatory obligations (specifically, service standards) are key drivers of capex. More onerous standards will increase capex, as will growth in maximum demand. Conversely, reduced service obligations or a decline in demand will likely cause a reduction in the amount of capex required by a distributor.
Maximum demand is a key driver of augmentation or demand driven expenditure. As augmentation often needs to occur prior to demand growth being realised, forecast rather than actual demand is relevant when a business is deciding what augmentation projects will be required in an upcoming regulatory control period. However, to the extent that actual demand differs from forecast, a business should reassess the need for the projects. Growth in a business' network will also drive augmentation and connections related capex. For these reasons it is important to consider how trends in capex (and in particular, augex and connections) compare with trends in demand (both maximum demand and customer numbers).
For service standards, there is generally a lag between when capex is undertaken (or not) and when the service improves (or declines). This is important in considering
49 AEMC, Economic Regulation Final Rule Determination, p.113. Exogenous factors could include geographic factors, customer factors, network factors and jurisdictional factors.
50 AER, Annual Benchmarking Report, 2014.51 NER, cl. 6.5.7(e)(5).52 NER, cl. 6.5.7(a)(3).
34 Attachment 6 – Capital expenditure | Ergon Energy determination 2015–20

the expected impact of an increase or decrease in capex on service levels. It is also relevant to consider when service standards have changed and how this has affected a service provider's capex requirements.
We have looked at trends in capex across a range of levels including at the total capex level, for growth related capex, for replacement capex, and for each of the categories of capex, as relevant. We have also compared these with trends in demand and changes in service standards over time.
A.3 Category analysisExpenditure category level analysis allows us to compare expenditure across
service providers, and over time, for various levels of capex:
overall costs within each category of capex
unit costs, across a range of activities
volumes, across a range of activities
asset lives, across a range of asset classes which we have used in assessing repex.
Using standardised reporting templates, we have collected data on augex, repex, connections, non-network capex, overheads and demand forecasts for all distributors in the NEM. The use of standardised category data allows us to make direct comparisons across distributors. Standardised category data also allows us to identify and scrutinise different operating and environmental factors that affect the amount and cost of works performed by distributors, and how these factors may change over time.
A.4 Predictive modellingPredictive modelling uses statistical analysis to determine the expected efficient
costs over the regulatory control period associated with the demand for electricity services for different categories of works. We have two predictive models:
the repex model
the augex model (only used in a qualitative sense)
The use of the repex and augex models is directly relevant to assessing whether a distributor's capex forecast reasonably reflects the capex criteria.53 The models draw on actual capex incurred by a distributor during the preceding regulatory control period. This past capex is a factor that we must take into account.54
The repex model is a high-level probability based model that forecasts asset replacement capex (repex) for various asset categories based on their condition (using age as a proxy), and unit costs. In instances where we consider a distributor’s proposed repex does not conform to the capex criteria, we have used this (in combination with other techniques where appropriate) to generate a substitute forecast. 53 NER, cl. 6.5.7(c).54 NER, cl. 6.5.7(e)(5).
35 Attachment 6 – Capital expenditure | Ergon Energy determination 2015–20

The augex model compares utilisation thresholds with forecasts of maximum demand to identify the parts of a network segment that may require augmentation.55 The model then uses capacity factors to calculate required augmentation, and unit costs to derive an augex forecast for the distributor over a given period.56 In this way, the augex model accounts for the main internal drivers of augex that may differ between distributors, namely peak demand growth and its impact on asset utilisation. We can use the augex model to identify general trends in asset utilisation over time as well as to identify outliers in a distributor's augex forecast.57 However, we have not relied heavily on the augex model for this reset. This is because Ergon experienced negative demand growth and positive growth in augex in some network segments during the 2010−15 regulatory control period. This resulted in the model being unable to produce reliable benchmark results from the previous period. Therefore, for this decision we have only had regard to trends in utilisation rates in a qualitative sense. We will apply the augex model to a greater degree in future determinations as we build up our dataset.
A.5 Engineering reviewWe have engaged engineering consultants, EMCa, to assist with our review of
distributors' capex proposals. This has involved reviewing distributor's processes, and specific projects and programs of work.
In particular, in respect of augex and repex, we have engaged engineers to consider whether the distributor's:
Forecast is reasonable and unbiased, by assessing whether the distributor’s proposed capex is a reasonable forecast of the unbiased efficient cost of maintaining performance at the required or efficient service levels.
Risk management is prudent and efficient, by assessing whether the business manages risk such that the cost to the customer of achieving the capex objectives at the required or efficient service levels is commensurate with the customer value provided by those service levels.
Costs and work practices are prudent and efficient, by assessing whether the distributor uses the minimum resources reasonably practical to achieve the capex objectives and maintain the required or efficient service levels.
These factors relate directly to our assessment of whether the distributor's proposal reflects the efficient costs that a prudent operator would require to achieve the capex objectives:58
If a capex forecast is reasonable and unbiased, the forecast should reflect the efficient costs required to meet the capex objectives. That is, there should be no systemic biases which result in a forecast that is greater than or less than the
55 Asset utilisation is the proportion of the asset's capability under use during peak demand conditions.56 For more information, see: AER, Guidance document: AER augmentation model handbook, November 2013.57 AER, 'Meeting summary – distributor replacement and augmentation capex', Workshop 4: Category analysis
work-stream – Replacement and demand driven augmentation (Distribution), 8 March 2013, p. 1.58 NER, cl. 6.5.7(c).
36 Attachment 6 – Capital expenditure | Ergon Energy determination 2015–20

efficient forecast. Further, the forecast should be reasonable in that it reflects what a prudent operator would incur to achieve the capex objectives.
If the distributor's risk management is prudent and efficient, the distributor's forecast is likely to reflect the costs that a prudent operator would require to achieve the capex objectives. A prudent operator would consider both the probability of a risk eventuating and the impact of the risk (if it were to occur) in determining whether to undertake work to mitigate the risk.59
If the distributor's costs and work practices are prudent and efficient, the distributor will have the appropriate governance and asset management practices to ensure that the distributor has determined an efficient capex forecast that is based on a realistic expectation of the demand forecast and cost inputs required to achieve the capex objectives.
The engineers applied a sampling approach in considering the above factors. Where this revealed concerns about systemic issues, we asked the engineers to take a broader sample and to quantify the likely impact of these biases.
In some cases we have also reviewed specific capex projects or programs of work to determine whether these meet the capex criteria. These reviews have been undertaken in respect of particular capex categories including for non-network capex and have included the assessment of:
the options the distributor investigated to address the economic requirement (for example, for augmentation projects the review should have included an assessment of the extent to which the distributor considered and provided for efficient and prudent non-network alternatives60)
whether the timing of the project is efficient
unit costs and volumes, including comparisons with relevant benchmarks
whether the project should more appropriately be included as a contingent project61
deliverability of the project, given other capex and opex works
the relative prices of operating and capital inputs and the substitution possibilities between operating and capital expenditure62
the extent to which the capex forecast is referable to arrangements with a person other than the distributor that, in the opinion of the AER, do not reflect arm's length terms,63 where relevant
the extent to which the capex forecast includes expenditure to address the concerns of electricity consumers as identified by the distributor in the course of its engagement with electricity consumers.64 This is most relevant to core network
59 This approach is supported by NERA Economic Consulting, see NERA, Economic Interpretation of cll. 6.5.6 and 6.5.7 of the National Electricity Rules, Supplementary Report, Ausgrid submission, 8 May 2014, p. 7.
60 NER, cl. 6.5.7(c)(10).61 This principally relates to augex. See NER, cl. 6.5.7(e)(9A).62 This principally relates to augex. See NER, cll. 6.5.7(e)(6) and (e)(9A).63 NER, cl. 6.5.7(e)(9).64 NER, cl. 6.5.7(e)(5A).
37 Attachment 6 – Capital expenditure | Ergon Energy determination 2015–20

expenditure (augex and repex) and may include the distributor's consideration of the value of customer reliability (VCR) standard or a similar appropriate standard.
38 Attachment 6 – Capital expenditure | Ergon Energy determination 2015–20

B Assessment of capex driversWe present our detailed analysis of the sub-categories of Ergon Energy's revised
forecast capex for the 2015–20 regulatory control period in this appendix. These sub-categories reflect the drivers of forecast capex over the 2015–20 regulatory control period. These drivers are augex, customer connections capex, repex, reliability improvement capex, capitalised overheads and non-network capex.
As we discuss in the capex attachment, we are not satisfied that Ergon Energy's proposed total forecast capex reasonably reflects the capex criteria. In this appendix we set out further analysis in support of this view. This further analysis also explains the basis for our alternative estimate of Ergon Energy's total forecast capex that we are satisfied reasonably reflects the capex criteria. In coming to our views and our alternative estimate we have applied the assessment approach that we discuss in appendix A.
This appendix sets out our findings and views on each sub-category of capex. The structure of this appendix is:
Section B.1: alternative estimate
Section B.2: forecast augex
Section B.3: forecast customer connections capex, including capital contributions
Section B.4: forecast repex
Section B.5: forecast capitalised overheads
Section B.6: non-network capex
Section B.7: demand management.
In each of sections B.1 to B.7 we examine seven sub-categories of capex which we include in our alternative estimate. For each such sub-category, we explain why we are satisfied the amount of capex that we include in our alternative estimate reasonably reflects the capex criteria.
B.1 Alternative estimateHaving examined Ergon Energy's proposal, we formed a view on our alternative estimate of the capex required to reasonably reflect the capex criteria. Our alternative estimate is based on our assessment techniques, explained in section 6.3 and appendix B. Our weighting of each of these techniques, and our response to Ergon Energy's submissions on the weighting should be given to particular techniques, is set out under the capex drivers in appendix B.
We are satisfied that our alternative estimate reasonably reflects the capex criteria.
39 Attachment 6 – Capital expenditure | Ergon Energy determination 2015–20

B.2 AER findings and estimates of augmentation expenditure
Augmentation capex (augex) is typically triggered by a need to build or upgrade a network to address changes in demand or to comply with quality, reliability and security of supply requirements. Typically, the main driver of augex is maximum demand and its effect on network utilisation and reliability.
Ergon Energy proposes a forecast of $660 million ($2014−15) for augex (excluding overheads). This is an 18 per cent decrease compared to actual augex incurred in the 2010–15 regulatory control period. As shown in Table B.1, Ergon Energy's proposed augex forecast is comprised of demand-related capex (for its distribution and sub-transmission networks), reliability and quality of supply capex, and other system-enabling capex. There is also a component that is unexplained.
Table B.1 Ergon Energy's proposed augex ($2014−15, million, excluding overheads)
Category 2015−16 2016−17 2017−18 2018−19 2019−20 Total
Sub-transmission 49 53 51 20 21 193
Distribution 69 64 64 63 63 323
Quality of supply 1.3 1.3 1.3 1.3 1.3 6.5
Reliability 1.1 1.1 1.1 1.1 1.1 5.5
Other system enabling capex 29 21 13 19 16 99
Sub-total 143 134.8 124.2 100 97.7 627
Unexplained capex 11.3 12.3 13.5 10.9 12.5 33.1
Total augex proposal 154.3 147.1 137.7 110.9 110.2 660.1
Source: Ergon Energy reset RIN; Ergon Energy regulatory proposal, Attachments 07.00.02, 07.00.04 and 07.00.05
Note: Ergon Energy's total augex forecast is derived from its reset RIN. The direct costs of the individual programs
within this forecast are derived from the supporting attachments to Ergon Energy's regulatory proposal.
There is a remaining component of the total forecast that is unexplained based on our review of Ergon
Energy's regulatory proposal, supporting documentation and its response to our information requests. Ergon
Energy Ergon Energy explained the reconciliation between the total forecast in its reset RIN and the
regulatory proposal in its response to our information request AER Ergon Energy 004.
Numbers may not add up due to rounding.
We do not accept Ergon Energy's augex forecast. We have instead included an amount of $558.1 million ($2014−15) in our alternative estimate, excluding overheads, a reduction of 15.5 per cent.
We have formed this view by reviewing all of the material submitted by Ergon Energy in its regulatory proposal. Our review was undertaken in four parts. First, we considered the proposed forecast in the context of past expenditure, demand and
40 Attachment 6 – Capital expenditure | Ergon Energy determination 2015–20

current network utilisation.65 This is set out in section B.2.1 and takes into account changes in demand, network capacity, design standards and reliability obligations.
Second, we examined the governance processes and forecasting methodologies that underpinned Ergon Energy's forecast. As set out in section B.2.2, our examination of Ergon Energy's processes was assisted by a technical review undertaken by our independent consultants, Energy Market Consulting Associates (EMCa).66 We asked EMCa to undertake a review to test three hypotheses:
The business’ forecast is reasonable and unbiased: the business’s proposed expenditures are a reasonable forecast of the unbiased efficient cost of maintaining performance at the required or efficient service levels. There are no in-built systemic biases which result in the forecast being higher or lower than is efficient.
The business’s costs and work practices are prudent and efficient: the business uses the minimum resources reasonably practical to achieve the capex objectives and maintain the required or efficient service levels.
The business’s risk management is prudent and efficient: the business manages risk such that the cost to the customer of achieving the capex objectives at the required or efficient service levels is commensurate with the customer value provided by those service levels.
Third, to quantify the impact of any identified biases, we have had regard to the technical review of a sample of projects undertaken by EMCa. We asked EMCa to estimate the impact of any overestimation bias for Ergon Energy's sub-transmission, distribution, power quality and reliability programs. As set out in section B.2.3, we accept EMCa's findings because EMCa has satisfied the scope of work we assigned them, and has demonstrated that it has applied independent engineering expertise to Ergon Energy's own planning documentation and supporting evidence.
Finally, we reviewed the remaining augex forecast that was not considered by EMCa. This is Ergon Energy's other system-enabling capex and the unexplained capex, as set out in the later parts of section B.2.3.
Our preliminary decision to include $558.1 million ($2014−15) for augex in our alternative estimate is based on:
removing the impact of the identified overestimation bias evident in the Ergon Energy's forecast of distribution and sub-transmission capex by adopting the mid-point of the range established through the technical review of a sample of projects undertaken by EMCa
65 The augex model has been developed to derive an estimate of required augex based on predicted augmentation requirements (based on demand and asset utilisation) and unit costs. However, we have not relied heavily on the augex model for this reset. This is because Ergon experienced negative demand growth and positive growth in augex in some network segments during the 2010−15 period. This resulted in the model being unable to produce reliable benchmark results from the previous period. Therefore, for this decision we have only had regard to trends in utilisation rates in a qualitative sense. We will apply the augex model to a greater degree in future determinations as we build up our dataset.
66 EMCa, Review of Proposed Network Augmentation and Replacement Expenditure in Ergon Energy’s Regulatory Proposal 2015−20, April 2015
41 Attachment 6 – Capital expenditure | Ergon Energy determination 2015–20

removing the impact of the identified overestimation bias evident in the Ergon Energy forecast of other system-enabling capex by adopting the upper range established by EMCa for the distribution and sub-transmission forecasts
removing the unexplained capex forecast from Ergon Energy's forecast.
This amount should provide Ergon Energy with a reasonable opportunity to recover at least the efficient costs to augment its network to meet forecast demand, and network reliability, quality and security requirements.
Table B.2 sets out our preliminary decision for each year of the 2015−20 regulatory control period. Our detailed findings are set out sections B.2.1, B.2.2 and B.2.3.
Table B.2 AER's alternative estimate of augex ($2014–2015, million, excluding overheads)
2015−16 2016−7 2017−18 2018−19 2019−20 Total
Ergon Energy proposal 154.3 147.1 137.7 110.9 110.2 660.1
Adjustment to account for over-estimation -9.5 -8.5 -6.6 -8.4 -7.7 -69.0
Removal of unexplained capex -11.3 -12.3 -13.5 -10.9 -12.5 -33.1
AER alternative estimate 133.5 126.3 117.6 91.6 90.0 558.1
Difference -13.5% -14.1% -14.6% -17.4% -18.3% -15.5%
Source: AER analysis.Note: Numbers may not add up due to rounding.
B.2.1 Trend analysis
Figure B.2 shows the trend in augex between 2005−06 and 2019−20 (as proposed) for demand, reliability and quality of supply, and other augex. This shows that forecast capex for each augex driver has decreased compared to the actual capex from the current period, and significantly so for reliability and other augex.
42 Attachment 6 – Capital expenditure | Ergon Energy determination 2015–20

Figure B.2 Ergon Energy's augex (excluding overheads) historic actual and proposed for 2015–2020 period ($2014–15, million)
Source: Ergon Energy regulatory proposal, AER analysis.
The largest component of Ergon Energy's augex proposal is $528 million ($2014−15) for demand-related augex (excluding overheads).67 This is 5 per cent less than the actual demand-related augex that Ergon Energy spent during the 2010−15 regulatory control period.68 The major drivers of Ergon Energy's demand-driven augex proposal are forecast capacity constraints in its sub-transmission, distribution and low-voltage networks from localised demand growth.69
We have reviewed the trends in maximum demand and network utilisation as these are the key drivers of augmentation. This provides an initial sense of whether Ergon Energy's augex forecast is reasonably required to meet forecast demand and alleviate forecast capacity constraints.
As outlined in appendix C, the available evidence points to low demand growth over the 2015−20 regulatory control period. This forecast for low demand growth follows declining demand in the previous period. Consistent with this fall in demand, Figure B.3 below highlights a small decline in network utilisation between 2009–10 and 2013–14 based on outputs from our augex model. Network utilisation is a measure of the installed network capacity that is in use (or is forecast to be). Where utilisation rates
67 Ergon Energy refers to this expenditure as 'corporation initiated augmentation' in its regulatory proposal. See Ergon Energy, Regulatory proposal: July 2015 to June 2020, 31 October 2014, Attachment 07.00.02, p. 7.
68 Ergon Energy, Regulatory proposal: July 2015 to June 2020, 31 October 2014, Attachment 07.00.02, p. 7.69 Ergon Energy, Regulatory proposal: July 2015 to June 2020, 31 October 2014, Attachment 07.00.02, pp. 37−55.
43 Attachment 6 – Capital expenditure | Ergon Energy determination 2015–20

are shown to be declining over time, it is expected that total augex requirements would similarly fall.
Figure B.3 Zone substation utilisation 2009−10 and 2013−14
Source: AER analysis, augex model, Ergon Energy reset RIN.
Note: Utilisation is the ratio of maximum demand and the normal cyclic rating of each substation for the specified
years.70 Figure B.3 shows the number of Ergon Energy's total zone substations at each utilisation band.
This decrease in utilisation is also consistent with the changes to Ergon Energy's design standards. Since 2004, Ergon Energy had invested significantly in duplicating network assets to increase network security (and hence decrease network utilisation) following a Government-initiated review of QLD electricity distribution and service delivery.71 A subsequent review of Ergon Energy's capex programs (the Electricity Network Capital Program Review 2011) recommended a relaxation of these design standards and recommended a move to more probabilistic network planning approaches.72 Ergon Energy's reduced augex following 2010−11 is consistent with these recommendations.73
70 Normal cyclic rating is the maximum peak loading based on a given daily load cycle that a substation can supply each day of its life under normal conditions resulting in a normal rate of wear.
71 Electricity Network Capital Program Review 2011: Detailed report of the independent panel, December 2011, p. 772 Electricity Network Capital Program Review 2011: Detailed report of the independent panel, December 2011, p.
1073 Ergon Energy identified $700 million worth of capex savings in the 2010−15 period (compared to the AER's capex
allowance). This included $250 million savings based on the recommended changes to network design standards, and $190 million in augex savings from reduced demand. See Electricity Network Capital Program Review 2011: Detailed report of the independent panel, p. 73).
44 Attachment 6 – Capital expenditure | Ergon Energy determination 2015–20

A number of parties have made submissions noting that there is little justification for Ergon Energy's proposed augex allowance given the excess capacity present within Ergon Energy's network. In particular:
AGL encouraged the AER to confirm that any augmentation of existing capacity is founded on realistic maximum demand forecasts as the network’s forecast of peak demand appear aggressive.74
The Energy Users Association of Australia (EUAA) submits that Ergon Energy's augex appears high considering the Queensland jurisdiction has relaxed its security and reliability standards following the 2011 ENCAP review.75
The CCP submitted that Ergon Energy's augex proposal has not taken into account significant levels of excess capacity and declines in network utilisation.76 It stated that the AER needs to ensure that Ergon Energy's excess capacity is more efficiently utilised ahead of any additional augmentation investment.77
While growth in system-wide demand is forecast to be low over the 2015−20 regulatory control period and there is some existing excess capacity, Ergon Energy proposed that augmentation of some zone substations is necessary. This is due to forecast localised demand growth, for example from new residential developments and major industrial customers. We have examined forecast zone substation utilisation for the 2015−20 period based on forecast demand at each substation and existing levels of capacity from our augex model. This gives us a high-level indication of whether localised augmentation may be required and whether this might reasonable drive the augex proposal.
Figure B.4 shows that the majority of Ergon Energy's substations are not forecast to be heavily utilised (e.g. less than 60 per cent utilised) by 2020 and that the number of highly utilised substations is forecast to decline over the 2015−20 regulatory control period. This is consistent with existing levels of utilisation in the network. However, there remain a number of highly utilised substations that Ergon Energy may need to augment over the 2015−20 regulatory control period. While it is not clear that this supports the overall level of augex Ergon Energy is proposing, it lends support to some level of network augmentation over the 2015−20 regulatory control period.
74 AGL, Submission on Ergon Energy's regulatory proposal, p. 12.75 EUAA, Submission on Ergon Energy's regulatory proposal, p. 19.76 CCP, Submission on Ergon Energy's regulatory proposal, p. 14.77 CCP, Submission on Ergon Energy's regulatory proposal, p. 14.
45 Attachment 6 – Capital expenditure | Ergon Energy determination 2015–20

Figure B.4 Zone substation forecast utilisation 2014-15 to 2019-20
Source: AER analysis; augex model, Ergon Energy reset RIN.
Notes: Utilisation is the ratio of maximum demand and the thermal rating of each feeder for the specified years.
Forecast utilisation in this figure is based on forecast weather corrected 50 per cent POE maximum demand
at each substation and existing capacity without additional augmentation over 2015−20.
B.2.2 Forecasting methodology
The forecasting methodology adopted by Ergon Energy is important in determining whether the augex forecast is prudent and efficient. As a starting point in our detailed analysis of Ergon Energy's augex forecast, we have reviewing the forecasting methodology.
For growth related augex, Ergon Energy employs a bottom-up forecasting methodology to determine its expenditure requirements. The key input into this process is the spatial demand forecast, which is then compared against the capacity of the existing network at various levels, together with a consideration of its planning and reliability requirements. Where constraints are found to emerge, a project is then developed and is subjected to a risk assessment process against a counterfactual that the project does not proceed as planned.
Our assessment of Ergon Energy's forecasting methodology is informed by the findings and recommendations from engineering consultants EMCa. These findings suggest that the framework and methodology applied by Ergon Energy is consistent with industry standards and that the top-down assessment process applied by Ergon Energy delivered material reductions in its initial bottom-up forecast.78 However, the
78 EMCa, Review of Proposed Network Augmentation and Replacement Expenditure in Ergon Energy’s Regulatory Proposal 2015 −20, April 2015, p. 21.
46 Attachment 6 – Capital expenditure | Ergon Energy determination 2015–20

application of the top-down assessment to meet a price path objective may result in an overstated augex forecast. The top-down challenge to the bottom-up forecast is discussed further below.
Our review of Ergon Energy's governance and forecasting methodology has focussed on:
how the spatial demand forecasts have been used and how they reconcile with top-down system-wide forecasts
how the estimation process is undertaken to cost augex projects
the governance process and evidence of a top-down check on bottom-up builds, and
evidence of consideration of options other than augex.
Demand forecasting
Demand forecasting is a key input into determining network augmentation requirements. Augmentation decisions are made based on forecast demand at the localised zone substation level. These localised forecasts are referred to as spatial demand forecasts.
Appendix C contains our assessment of the top-down system wide forecast is prepared by Ergon Energy. Ergon Energy uses a combination of bottom up spatial forecasting for each individual zone substation, combined with an adjustment process to take into account the top-down system wide demand forecast.79 The individual substation forecasts are made up of Ergon Energy's assessment of large demand connections (block loads) entering or exiting the network, together with growth in the communities supplied from each zone substation. The zone substation growth forecasts are summed to a system total demand. A reconciliation process is then used to adjust the top-down whole of system demand forecast and the bottom-up zone-substation forecast.
Ergon Energy's reconciliation process resulted in a small up-lift in the spatial demand forecasts. As we set out in Appendix C, our final decision will take account of AEMO's connection point demand forecasts for Queensland that are due by July 2015. We expect that Ergon Energy's revised proposal will take account of these revised forecasts and consider the implications for their spatial demand forecast reconciliation. Pending AEMO's demand forecasts that are due in July 2015, we are satisfied that on current forecasts, the augex forecast is based on a realistic expectation of demand.
However, EMCa note that the growth related component of the augex forecast is significant (31 per cent) and that this was taken into account in their sample of projects, outlined in section B.2.3.
Both the CCP and the EUAA submit that previous poor forecasting of demand have had a negative impact on customers in terms of inflated augmentation expenditure.80 Furthermore, these submissions encourage us to interrogate the forecasts of demand
79 Ergon Energy, Regulatory proposal: July 2015 to June 2020, 31 October 2014, attachment 07.00.02, pp. 15−21.
47 Attachment 6 – Capital expenditure | Ergon Energy determination 2015–20

to ensure that they reflect declines in maximum demand.81 We have taken into account Ergon Energy's demand forecast when assessing Ergon Energy's augmentation program, considered in sections B.2.3 and appendix C below.
Cost estimation
EMCa have reviewed the project cost estimation process that Ergon Energy used to develop its forecasts for augex projects and found that it was consistent with industry standards.82 As such, our project sampling review discussed in section B.2.3 focusses on the process that Ergon Energy uses to define the need for projects and accepts the costings of those projects.
That said, there is evidence of the scope of works for some projects leading to overestimation in total project costings. For example, the scope of the project for the Gatakers Bay feeder work includes 700 metres of undergrounding. However, Ergon's own planning report states that it may be possible to build the majority of this length overhead. So while the cost estimation methodology employed by Ergon is sound, there is evidence of the scope and design of some projects leading to a total forecast that is higher than is necessary for a prudent and efficient distributor.83 This is considered further in the sample review of projects in section B.2.3.
Governance and top-down constraints
As set out above, Ergon Energy subjects projects in its forecast program of works to a risk assessment process. The risk assessment process requires that each project be given a score against its likelihood of occurring and its impact if it did occur. Projects are then ranked in order of risk score and compared against a budget constraint.
Ergon Energy has provided evidence of its internal governance and committee structure that it employs to impose a top-down constraint on the bottom-up project forecasts. EMCa conclude that this internal iterative approach led to material reductions in the forecast augex included in the regulatory proposal, compared to forecasts prepared earlier in Ergon Energy's planning processes.84
Ergon Energy has also structured its proposal to limit network price growth. This is a form of top-down constraint on Ergon Energy's capex forecast by setting a limit on capex so that prices do not increase. While we recognise Ergon Energy's objectives in limiting capex over the 2015-20 regulatory control period, we have not seen evidence that demonstrates the top-down constraint operates to limit capex to a prudent and efficient level. For example, an objective to limit price increase may result in Ergon
80 EUAA, Submission on Ergon Energy's regulatory proposal, p. 19; CCP, Submission on Ergon Energy's regulatory proposal, p. 13.
81 CCP, Submission on Ergon Energy's regulatory proposal, p. 13; EUAA, Submission on Ergon Energy's regulatory proposal, p. 19.
82 EMCa, Review of Proposed Network Augmentation and Replacement Expenditure in Ergon Energy’s Regulatory Proposal 2015 −20, April 2015, pp. 37−41.
83 Ergon Energy, Establishment of four additional feeders from Point Vernon zone substation and upgraded required Pialba feeders, Planning Report, July 2010, p 16.
84 EMCa, Review of Proposed Network Augmentation and Replacement Expenditure in Ergon Energy’s Regulatory Proposal 2015 −20, April 2015, p. 14.
48 Attachment 6 – Capital expenditure | Ergon Energy determination 2015–20

Energy not sufficiently reviewing projects that are low risk and may not be necessary, but which can be undertaken within the price path expectation.85 The potential for this overestimation is considered further in the review of sample projects and programs.
B.2.3 Driver and project analysis
Ergon Energy's overall augex forecast is comprised of different cost drivers. Table B.3 shows these cost drivers and their contribution to the overall augex forecast.
Table B.3 Ergon Energy proposed augex ($2014−15, million, excluding overheads)
Category 2015−16 2016−17 2017−18 2018−19 2019−20 Total
Sub-transmission 49 53 51 20 21 193
Distribution 69 64 64 63 63 323
Quality of supply 1.3 1.3 1.3 1.3 1.3 6.5
Reliability 1.1 1.1 1.1 1.1 1.1 5.5
Other system enabling capex 29 21 13 19 16 99
Unexplained capex 11.3 12.3 13.5 10.9 12.5 33.1
Total augex proposal 154.3 147.1 137.7 110.9 110.2 660.1
Source: Ergon Energy, Regulatory proposal, Attachments 07.00.02, 07.00.04 and 07.00.05.
To quantify the impact of the forecasting biases we identified in section B.2.2, we have had regard to the technical review of a sample of projects undertaken by EMCa.86 The purpose of the engineering review is to determine whether there is evidence of systemic forecasting bias resulting from either governance processes or cost estimates, by identifying incidence of forecasting bias in bottom-up project estimates.
EMCa reviewed Ergon Energy's distribution, sub-transmission, reliability and quality of supply capex forecasts. It did not review the other system-enabling capex forecast, or the unexplained capex. We consider these further below.
In general, EMCa found that Ergon Energy followed a robust methodology to estimate the cost of augmentation, noting in particular the use of:
sensitivity analysis, using a range of possible values for the value of customer reliability when considering augmentation options87
85 EMCa, Review of Proposed Network Augmentation and Replacement Expenditure in Ergon Energy’s Regulatory Proposal 2015 −20, April 2015, pp. 13−14 and 21.
86 EMCa, Review of Proposed Network Augmentation and Replacement Expenditure in Ergon Energy’s Regulatory Proposal 2015 −20, April 2015, pp. 47−65.
87 EMCa, Review of Proposed Network Augmentation and Replacement Expenditure in Ergon Energy’s Regulatory Proposal 2015−20, April 2015, p. 48.
49 Attachment 6 – Capital expenditure | Ergon Energy determination 2015–20

annual review of previously planned augmentation projects which have not yet commenced, with evidence that some projects have been deferred or cancelled as a result of this project88
some consideration of demand management options as an alternative to network augmentation, although EMCa note that more capex will likely be deferred than is currently forecast (see section B.7 for our consideration of forecasting demand management deferrals).89
However, EMCa also identified systemic issues of overestimation across the sample of projects which they consider means that Ergon Energy's total forecast augex for 2015–20 is overestimated. In particular, EMCa found that:
the augex is not always adequately linked to a prudent needs-driven analysis, including efficient timing of expenditure and connection of new load
the augex is not always adequately supported by cost-benefit analysis, robust options analysis and appropriately-applied risk assessment, and
the augex includes some estimates that have led to a higher level of expenditure than may be required.90
Based on these findings and its sample of projects, EMCa estimated the impact of the over-estimation bias at each of the cost category levels:91
Sub-transmission augex – 0 to 5 per cent over-estimation
Distribution augex – 10 to 20 per cent over-estimation.
EMCa concludes that if Ergon Energy's augex forecast is reduced by these levels of overestimation, it would be representative of a prudent and efficient expenditure level.92 We agree with EMCa's findings because EMCa has satisfied the scope of work we assigned them, and has demonstrated that it has applied independent engineering expertise to Ergon Energy's own planning documentation and supporting evidence. These reasons are demonstrated within the following sections.
We have adopted the mid-point of EMCa's recommended ranges for each cost category it reviewed. In the absence of evidence pointing towards to the top or bottom of the range, we consider that adopting the mid-point reflects a reasonable estimate of the level of augex Ergon Energy requires to prudently and efficiently meet the capital expenditure objectives. These results are shown in Table B.4 below.
88 EMCa, Review of Proposed Network Augmentation and Replacement Expenditure in Ergon Energy’s Regulatory Proposal 2015 −20, April 2015, p. 46.
89 EMCa, Review of Proposed Network Augmentation and Replacement Expenditure in Ergon Energy’s Regulatory Proposal 2015 −20, April 2015, p. 46.
90 EMCa, Review of Proposed Network Augmentation and Replacement Expenditure in Ergon Energy’s Regulatory Proposal 2015−20, April 2015, p. 62.
91 EMCa, Review of Proposed Network Augmentation and Replacement Expenditure in Ergon Energy’s Regulatory Proposal 2015−20, April 2015, p. 63.
92 EMCa, Review of Proposed Network Augmentation and Replacement Expenditure in Ergon Energy’s Regulatory Proposal 2015−20, April 2015, p. 63.
50 Attachment 6 – Capital expenditure | Ergon Energy determination 2015–20

Table B.4 AER adjusted Ergon Energy augex allowance ($2014−15, million, excluding overheads)
Category 2015−16 2016−17 2017−18 2018−19 2019−20 Total
Sub-transmission 47.8 51.7 49.7 19.5 20.5 188.2
Distribution 58.7 54.4 54.4 53.6 53.6 274.6
Quality of supply 1.3 1.3 1.3 1.3 1.3 6.5
Reliability 1.1 1.1 1.1 1.1 1.1 5.5
Other system enabling 24.6 17.8 11 16.1 13.6 83.3
Unexplained capex 0 0 0 0 0 0
Total 133.5 126.3 117.6 91.6 90 558
Source: AER analysis.
The following sections set out Ergon Energy's proposed capex for each cost driver, EMCa's assessment and findings, and our conclusions.
Sub-transmission
Ergon Energy proposed an allowance of $193 million ($2014−15) to augment its sub-transmission network.93 The augmentation program consists of 23 projects currently in progress valued at $39.7 million ($2014−15) and 31 new projects valued at $143.6 million ($2014−15).94 Ergon Energy provided a detailed cost build-up of augmentation projects to address network constraints which considered not-network solutions and the value of customer reliability.
Broadly, Ergon Energy proposed sub-transmission augmentation programs driven by the need to expand and reinforce the network to:95
comply with safety net provisions of it distribution licence to ensure restoration of load within specified timeframe following network outages
meet reliability performance targets as specified in its distribution licence, considering customers’ value of load at risk (value of customer reliability)
comply with technical regulations by addressing network exceedance of plant rating, non-compliance with statutory requirements
augment joint projects with Powerlink involving distribution works to compliment upgrading of Powerlink’s transmission network
property acquisition sites for future network augmentation can proceed in the relevant areas.
93 Ergon Energy, Regulatory proposal: July 2015 to June 2020, 31 October 2014, Attachment 07.02.03. 94 Ergon Energy, Regulatory proposal: July 2015 to June 2020, 31 October 2014, Attachment 07.02.03.95 Ergon Energy, Regulatory proposal: July 2015 to June 2020, 31 October 2014, Attachment 07.00.02, p. 58.
51 Attachment 6 – Capital expenditure | Ergon Energy determination 2015–20
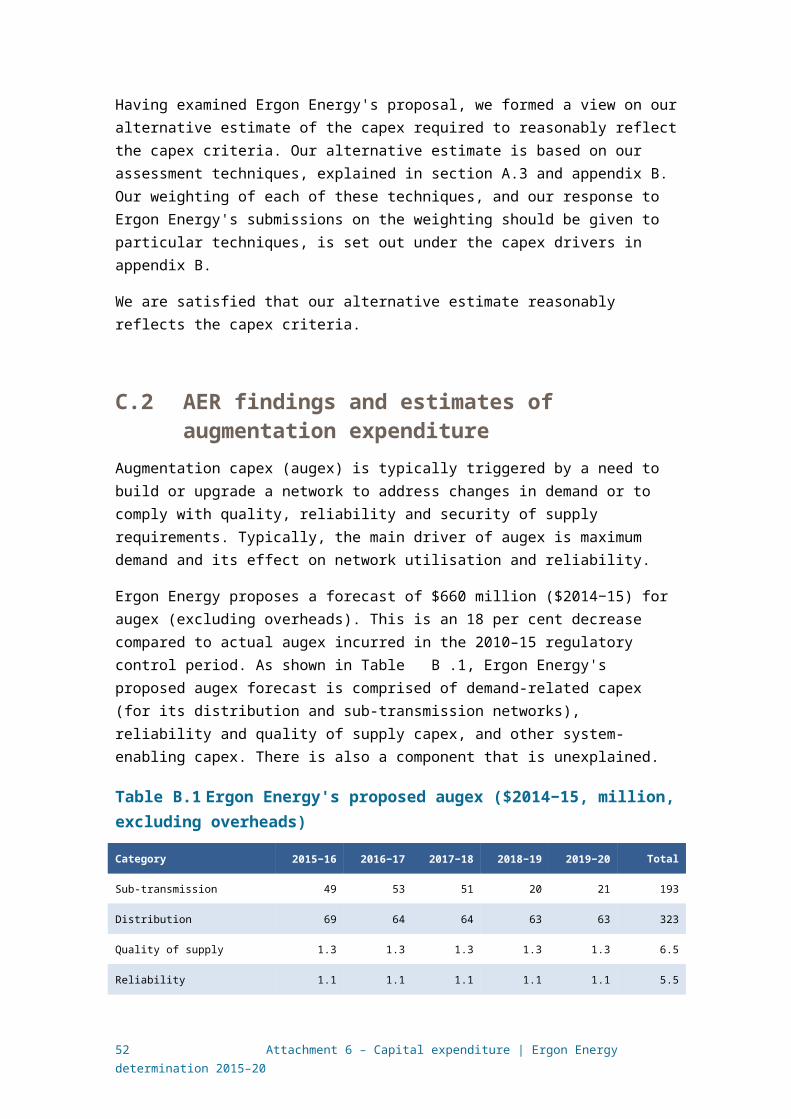
EMCa reviewed a sample of Ergon Energy's proposed sub-transmission projects and made these key findings:
The $65.4 million ($2014−15) reinforcement of the Gayndah 66 kV network was well justified on the basis that the existing Childers-Degilbo Tee-Gayndah line is extremely brittle, in poor condition and with an inadequate rating. Ergon Energy demonstrated use of the value of customer reliability to calculate the cost of outages against the costs of augmenting the network.96
The $7 million ($2014−15) augmentation around the Emerald distribution network and construction of an 11kV network in the Avoca area are sufficiently justified on the basis that it addressed growth known to occur in the 2015−20 regulatory control period. The augmentation was less costly than the non-network solution which was also considered.97
Reinforcement of the network to Gracemere which has been sufficiently justified to avoid breaching security of supply criteria and accommodate forecast demand requirements in the near future. Ergon Energy presented two alternative network solutions to address this constraint and chose a higher cost option which defers expenditure in the 2015–20 regulatory control period. EMCa considered that the project cost should be reduced from $28 to $21.5 million ($2014−15) to reflect the lowest cost network solution proposed by Ergon Energy. The deferral of expenditure could not justify the significantly higher cost of the more expensive project option.98
The $9.3 million ($2014−15) reinforcement of the South Mackay zone substation project proposed to meet increased demand growth from commercial and industrial customers was not justified on the basis of the documents presented by Ergon Energy. EMCa found that the increase in forecast demand could be met with Ergon Energy implementing demand management solutions and should defer expenditure beyond the 2015–20 regulatory control period.99 As such, Ergon Energy should only receive capex to implement a verified demand management solution to address this network constraint.100
Overall, EMCa found that Ergon Energy’s proposed forecast sub-transmission allowance showed indications of some over-estimation of several individual project costs, in particular where Ergon Energy’s planning with did not reflect:
forecast demand increases being slower than expected as a result of large new loads which may not eventuate precisely as planned due to macroeconomic and
96 EMCa, Review of Proposed Network Augmentation and Replacement Expenditure in Ergon Energy’s Regulatory Proposal 2015−20, April 2015, pp. 48−50.
97 EMCa, Review of Proposed Network Augmentation and Replacement Expenditure in Ergon Energy’s Regulatory Proposal 2015−20, April 2015, p. 50.
98 EMCa, Review of Proposed Network Augmentation and Replacement Expenditure in Ergon Energy’s Regulatory Proposal 2015−20, April 2015, pp. 50−51.
99 EMCa, Review of Proposed Network Augmentation and Replacement Expenditure in Ergon Energy’s Regulatory Proposal 2015−20, April 2015, p. 53.
100 As set out in section B.7, where we assess a specific capex/opex trade-off can be shown to meet the capex and opex criteria we will include the amounts in the forecasts. Should Ergon Energy propose any capex or opex to defer the South Mackay project in its submission on the revocation and substitution of this preliminary decision, we would consider this in our final decision.
52 Attachment 6 – Capital expenditure | Ergon Energy determination 2015–20
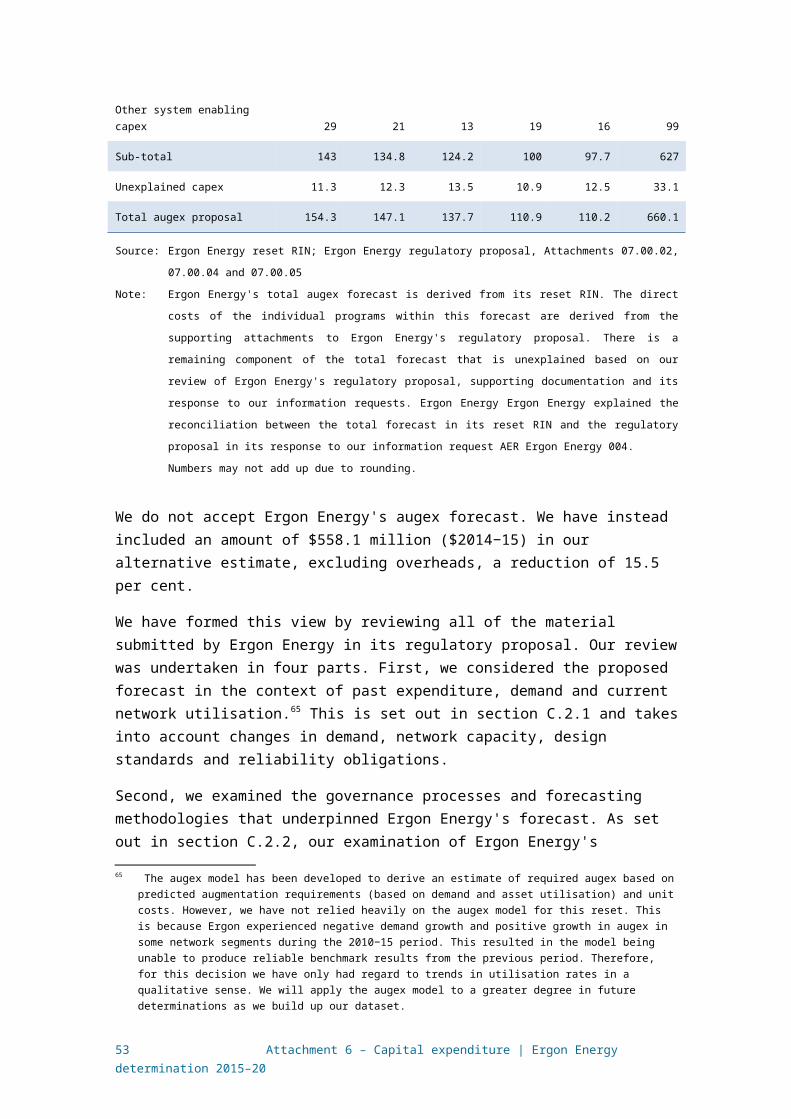
state-wide factors (i.e. uptake of solar panel installations) delaying the commencement of some augmentation projects
application of risk analysis to consider opportunities to defer some projects with demand management or hybrid augmentation and demand management solutions such as the arrangement of network feeders around generation sites, and
insufficient or non-existent risk analysis to justify specific augmentation projects.
EMCa concluded that there are opportunities for Ergon Energy to optimise its sub-transmission programs, including project deferral, greater tolerance of risk and the timing of capex.101 Based on these findings, EMCa considered that Ergon Energy’s sub-transmission proposal is overestimated by 0 to 5 per cent.102
In light of these findings, we have applied a 2.5 per cent reduction to the sub-transmission forecast (which is the mid-point of EMCa's recommended range). As set out previously, we consider that the mid-point is reasonable in the absence of evidence pointing towards to the top or bottom of the range.
Distribution
Ergon Energy proposed an allowance of $323 million ($2014−15) to augment its distribution network. Ergon Energy's proposal is set out in its distribution network augmentation plan.103 This plan is separated into:
$136 million ($2014−15) of specific projects to address known and forecast network constraints (e.g. assets which are over-utilised and managing future growth and voltage control resulting from uptake of solar systems, and
$80 million ($2014−15) for unspecified projects (e.g. un-modelled) to address reactive needs of the network due to unforeseen constraints.
EMCa reviewed the following sample of Ergon Energy's proposed distribution projects and made these findings:
Ergon Energy proposed network augmentation to manage voltage fluctuations in the network, resulting from solar systems installations.104 EMCa found that this capex has not been justified with a business case demonstrating an economic basis for the projects.105 While EMCa agrees with Ergon Energy that voltage control
101 EMCa, Review of Proposed Network Augmentation and Replacement Expenditure in Ergon Energy’s Regulatory Proposal 2015 −20, April 2015, p. 63−64.
102 EMCa, Review of Proposed Network Augmentation and Replacement Expenditure in Ergon Energy’s Regulatory Proposal 2015−20, April 2015, p. 64.
103 Ergon Energy, Regulatory proposal: July 2015 to June 2020, 31 October 2014, Attachment 07.02.02.104 Ergon Energy, Regulatory proposal: July 2015 to June 2020, 31 October 2014, Attachment 07.02.12, pp. 5−6.105 EMCa, Review of Proposed Network Augmentation and Replacement Expenditure in Ergon Energy’s Regulatory
Proposal 2015−20, April 2015, p. 58.
53 Attachment 6 – Capital expenditure | Ergon Energy determination 2015–20

is a potentially costly issue associated with growth in inverter energy system connections, these costs need to be articulated in the form of a detailed business case. Additionally, EMCa considers that Ergon Energy's analysis should take into account how the uptake of solar installations will reduce augmentation requirements on the LV network over the 2015–20 regulatory control period.106
The $80 million ($2014−15) dedicated to unspecified augmentation projects is proposed to fund miscellaneous works to address voltage control complaints, small urgent works, pole removals and overloaded distribution transformers.107 The forecast is based on historical trend.108 EMCa found that this capex is not justified and has not been supported with analysis to explain the underlying drivers of this expenditure. EMCa considered that the use of a historical trend to forecast expenditure in this category does not account for the expected changes in demand and energy consumption.109
The $3.3 million ($2014−15) installation of additional feeders to address bedding of existing buried cables and additional feeders to address new estate developments is justified but contains some over-estimation of project costs.110 EMCa considered that a 6 per cent bias exists in Ergon Energy's cost estimates, reflecting a contingency to re-tension existing feeders as the need arises whilst completing the proposed project.111
The $1.8 million ($2014−15) augmentation of the Warwick 11 kV network was sufficiently justified to avoid breaching security of supply criteria to address feeders in the region which are currently overloaded.
Overall, EMCa found that a number of systemic issues within Ergon Energy's forecast distribution projects which means that the forecast is likely overestimated. Key observations were:
Despite the top-down assessment undertaken by Ergon Energy, some projects have been included based on the aggregated bottom-up forecast with insufficient challenge.112
Ergon Energy proposes allowance for demand growth and new large loads in specific locations which may not occur as anticipated during the 2015–20 regulatory control period. EMCa considers that, when aggregated, it would be reasonable to make some adjustment to reflect the level of probability that not all regional demand growth will occur within the forecasted timeframe.113
106 EMCa, Review of Proposed Network Augmentation and Replacement Expenditure in Ergon Energy’s Regulatory Proposal 2015−20, April 2015, p. 59.
107 Ergon Energy, Regulatory proposal: July 2015 to June 2020, 31 October 2014, Attachment 07.00.02, p. 54.108 Ergon Energy, Regulatory proposal: July 2015 to June 2020, 31 October 2014, Attachment 07.00.02, p. 46.109 EMCa, Review of Proposed Network Augmentation and Replacement Expenditure in Ergon Energy’s Regulatory
Proposal 2015−20, April 2015, p. 56 and 64.110 EMCa, Review of Proposed Network Augmentation and Replacement Expenditure in Ergon Energy’s Regulatory
Proposal 2015−20, April 2015, p. 55.111 EMCa, Review of Proposed Network Augmentation and Replacement Expenditure in Ergon Energy’s Regulatory
Proposal 2015−20, April 2015, p. 56.112 EMCa, Review of Proposed Network Augmentation and Replacement Expenditure in Ergon Energy’s Regulatory
Proposal 2015−20, April 2015, p. 6
54 Attachment 6 – Capital expenditure | Ergon Energy determination 2015–20

Ergon Energy could apply further risk analysis to consider opportunities to defer some projects with demand management or hybrid augmentation and demand management solutions.114
EMCa concludes that there are opportunities for Ergon Energy to optimise its distribution programs, including project deferral, greater tolerance of risk and the timing of capex.115 Based on its findings, EMCa considered that Ergon Energy’s distribution proposal is overestimated by 10 to 20 per cent.116
In light of these findings, we have applied a 15 per cent reduction to the sub-transmission forecast (which is the mid-point of EMCa's recommended range). As set out previously, we consider that the mid-point is reasonable in the absence of evidence pointing towards to the top or bottom of the range.
Power quality
Ergon Energy proposes $6.5 million ($2014−15) to extend the network monitoring of power quality to approximately 67 per cent of the network feeders.117 This is a continuation of an existing network monitoring program.118 The proposed capex is significantly less than the actual capex incurred by Ergon Energy for power quality in the 2010−15 regulatory control period.
Ergon Energy submits that an allowance to monitor its network supply is necessary to ensure timely identification and remediation of breaches against statutory quality of supply standards.119 EMCa observed that Ergon Energy proposes to install 1,120 power quality monitors across its three phase and SWER distribution feeders, together with 100 power quality analysers at its zone substations.120 Ergon Energy's supporting documentation lists a number of economic benefits; however, EMCa note that there is no financial analysis provided to confirm how the benefits were considered.
EMCa did not identify any systemic issues in its review of Ergon Energy’s power quality augex and considered that, on balance, the proposed expenditure is aligned with what it would expect to see in an efficient and prudent expenditure forecast.121
113 EMCa, Review of Proposed Network Augmentation and Replacement Expenditure in Ergon Energy’s Regulatory Proposal 2015−20, April 2015, p. 59.
114 EMCa, Review of Proposed Network Augmentation and Replacement Expenditure in Ergon Energy’s Regulatory Proposal 2015−20, April 2015, p. 5.
115 EMCa, Review of Proposed Network Augmentation and Replacement Expenditure in Ergon Energy’s Regulatory Proposal 2015−20, April 2015, p. 64.
116 EMCa, Review of Proposed Network Augmentation and Replacement Expenditure in Ergon Energy’s Regulatory Proposal 2015−20, April 2015, p. 64.
117 Ergon Energy, Regulatory proposal: July 2015 to June 2020, 31 October 2014, Attachment 07.00.05, p. 25.118 Ergon Energy, Power Quality Monitoring Strategy 2012−20.119 Ergon Energy, Regulatory proposal: July 2015 to June 2020, 31 October 2014, Attachment 07.00.05, p. 26.120 EMCa, Review of Proposed Network Augmentation and Replacement Expenditure in Ergon Energy’s Regulatory
Proposal 2015−20, April 2015, p. 60.121 EMCa, Review of Proposed Network Augmentation and Replacement Expenditure in Ergon Energy’s Regulatory
Proposal 2015−20, April 2015, p. 60.
55 Attachment 6 – Capital expenditure | Ergon Energy determination 2015–20

Based on EMCa's findings, and our comparison of the forecast against historic expenditure, we accept that the proposed power quality forecast of $6.5 million reasonably reflects a prudent and efficient amount.
Reliability
Ergon Energy proposes $5.5 million ($2014−15) in capex (excluding overheads) to meet the reliability obligations set out in its Distribution Authority.122 This is a 97 per cent reduction over the actual 2010–15 expenditure for reliability.
Ergon Energy's relevant reliability obligations under its Distribution Authority include meeting the jurisdictional Minimum Service Standard and implementing a program for improving the worst performing distribution feeders.123 Ergon Energy submitted that the proposed $5.5 million ($2014−15) capex will enable it to meet these reliability obligations.124
Ergon Energy's network reliability has been steadily improving over the current regulatory period. Figure B.5 and B.5 show that the number of unplanned sustained interruptions to supply on Ergon Energy's network and duration of the events has reduced between 2008–09 and 2013–14.125
Figure B.5 Ergon Energy's reliability performance (SAIFI) 2006–2014
0.0
0.5
1.0
1.5
2.0
2.5
3.0
3.5
2006-07 2007-08 2008-09 2009-10 2010-11 2011-12 2012-13 2013-14
Unplannedsustained
interruptionsto supply
(SAIFI)
Source: AER analysis.
122 Ergon Energy, Regulatory proposal: July 2015 to June 2020, 31 October 2014, Attachment 07.00.05, p. 25.123 Ergon Energy, Regulatory proposal: July 2015 to June 2020, 31 October 2014, p.89.124 Ergon Energy, Regulatory proposal: July 2015 to June 2020, 31 October 2014, Attachment 07.00.05, p.10.125 The data presented in Figure 5 and Figure 6 have been normalised with the method specified in the AER’s STPIS.
These normalised results represent Ergon Energy's System Average Interruption Frequency Index (SAIFI) and System Average Interruption Duration Index after removing the impact of events deemed to be beyond the control of the distributor.
56 Attachment 6 – Capital expenditure | Ergon Energy determination 2015–20

Figure B.6 Ergon Energy's reliability performance (SAIDI) 2006–2014
0
50
100
150
200
250
300
350
2006-07 2007-08 2008-09 2009-10 2010-11 2011-12 2012-13 2013-14
Minutes persustained
interruptionto supply(SAIDI)
Source: AER analysis.
The improved network reliability is driven by capex spending on reliability improvement over the 2010–15 period. Ergon Energy submitted that this spending improved reliability across all distribution feeder types on its network.126 Given these reliability improvements, we would expect Ergon Energy's spending on reliability capex in 2015–20 to fall considerably. Ergon Energy's proposed capex meets this expectation.
The worst performing feeder improvement program requires Ergon Energy to improve any distribution which meets the following criteria:
the three year average SAIDI outcome is 200% or more than the minimum service standard SAIDI limit applicable to that feeder, and
the distribution feeder is determined to be in the 50 worst performing feeders across all feeder categories, excluding feeders with less than 20 customers.127
Ergon Energy submitted that while its proposed capex to improve worst performing feeders is a reliability improvement program, it is a program prescribed in its Distribution Authority.128
We received submissions on the proposed reliability capex. Submissions raised the following issues:
126 Ergon Energy, Regulatory proposal: July 2015 to June 2020, 31 October 2014, p. 70 and Attachment 0.7.00.05, pp. 15 –18.
127 The minimum service standard targets are expressed as the minimum duration and frequency of outages experienced by the average customer in a year. These are expressed as the System Average Interruption Duration Index (SAIDI) and the System Average Interruption Frequency Index (SAIFI).
128 Ergon Energy, Regulatory proposal: July 2015 to June 2020, 31 October 2014, Attachment 07.00.05, pp. 24−25.
57 Attachment 6 – Capital expenditure | Ergon Energy determination 2015–20

the current reliability standards are too high and asset utilisation should be improved129
Queensland Council of Social Service and Total Environment Care submitted that reduced reliability standards should be taken into account130
COTA Queensland and Origin submitted that Ergon Energy's customer survey should not be relied on131
Cummings Economics submitted that large industrial customers are not satisfied with the reliability standard offered to them.132
We took these submissions into account in making our decision on the proposed reliability capex. We do not assess Ergon Energy's reliability standards, but rather the capex it proposes to meet its reliability obligations or otherwise maintain network reliability. As Ergon Energy has generally proposed reliability capex to meet its regulatory obligations, we have allowed this capex as it is consistent with the capex criteria. We have also had regard to the technical review conducted by our consultants EMCa of whether the capex is the prudent and efficient expenditure amount for maintaining reliability and meeting the reliability obligations. EMCa found that there are no systemic issues with Ergon Energy's forecast and, on balance, it was satisfied that the $5.5 million ($2014−15) capex proposed for meeting reliability is prudent and efficient.133
Based on these findings, we are satisfied that Ergon Energy has shown that the proposed capex meets the capex criteria in that it is for meeting obligations under the Distribution Authority and for maintaining reliability. We will accept the $5.5 million ($2014−15) Ergon Energy proposed for reliability capex and will include this expenditure in our alternative capex estimate.
Other system-enabling capex
Ergon Energy proposes $99 million ($2014−15) capex to address a number of network operation issues which fell outside of the reporting definitions for the main capex driver
129 Chamber of commerce and industry Queensland submission, 30 January 2015, p.11; Cotton Australia, submission to the AER, Queensland Electricity Distribution Regulatory Proposals 2015–16 to 2019–20, 30 January 2015, pp. 6–7; SPA Consulting Engineers (QLD) Pty Ltd, submission to the AER, Queensland Electricity Distribution Determination for the period 2015–16, 30 January 2015; Townsville Enterprise, submission to the AER, Queensland Electricity Distributors’ Regulatory Proposal, 30 January 2015, p. 5.
130 Queensland Council of Social Services, submission to the AER, Understanding the long term interests of electricity customers, submission to the AER’s Queensland electricity distribution determination 2015–20, 30 January 2015, p. 20; Total Environment Centre, Submission to the AER on Queensland Distribution Networks’ 2015–20 Proposals, February 2015, p. 14.
131 COTA Queensland, Ergon Energy Regulatory Proposal, 30 January 2015, p. 2; Origin Energy, submission to the AER, Queensland Electricity Distributors’ Regulatory Proposals, 30 January 2015, p. 2.
132 Cummings Economics, Ergon Energy Regulatory Proposal, 30 January 2015, pp.23–24.133 EMCa, Review of Proposed Network Augmentation and Replacement Expenditure in Ergon Energy’s Regulatory
Proposal 2015−20, April 2015, p. 62.
58 Attachment 6 – Capital expenditure | Ergon Energy determination 2015–20

categories.134 This compares with $183 million incurred under this expenditure category in the 2010–15 period.135
Broadly, this capex is comprised of the following three categories which address data and communications, legislative compliance and miscellaneous network upgrades:
Operation technology projects – seven projects aimed at installing remote communication technologies associated with data acquisition and data management to monitor network performance and risk.
Protection projects – two projects associated with installing equipment to protect feeders and substations by monitoring network faults and operating network assets to comply with technical legislative and regulatory requirements.
Miscellaneous projects – three projects designed to augment power supply on substations and retrofit feeders with additional causes to reduce the likelihood of potential safety risks and service outages to customers.
We do not accept Ergon Energy's forecast for other system enabling capex. We have instead included an amount of $82.4 million ($2014−15) in our alternative estimate, a reduction of 15 per cent.
We are satisfied there is a need to address some of the issues raised by Ergon Energy to justify the other system enabling projects. However, it is unclear whether the forecast capex reflects the efficient amount a prudent operator would spend to address these issues. In particular, based on the supporting information provided by Ergon Energy in its regulatory proposal, there are a number of systematic issues with Ergon Energy's approach to developing the forecast programs of work:
The benefits to consumers and Ergon Energy have generally not been quantified and assessed against the costs of the programs. For example, while Ergon Energy state a range of business and technical benefits for its Distribution Management System upgrade,136 it has not quantified the benefits and cost savings to consumers and the impact of service quality. This is similar for its supporting documentation for the new Integrated Network Operations Centre137 and Alternative Data Acquisition Service.138
There is insufficient risk assessment and it is not evident that the proposed volume of work has not been optimised for risk. For example, Ergon Energy's proposed oil containment funding for power transformers does not demonstrate why it is the most cost effective solution to managing environmental risks.139 Similarly, the documentation supporting the Integrated Network Operations Centre, Alternative Data Acquisition Service and Distribution Management System do not appear to consider how the costs of these programs are the most cost effective to manage risk associated with monitoring the network.
134 Ergon Energy, Regulatory proposal: July 2015 to June 2020, 31 October 2014, Attachment 07.00.04, p. 6.135 Ergon Energy, Regulatory proposal: July 2015 to June 2020, 31 October 2014, Attachment 07.00.04, p. 6.136 Ergon Energy, Regulatory proposal: July 2015 to June 2020, 31 October 2014, Attachment 07.04.12.137 Ergon Energy, Regulatory proposal: July 2015 to June 2020, 31 October 2014, Attachment 07.04.05.138 Ergon Energy, Regulatory proposal: July 2015 to June 2020, 31 October 2014, Attachment 07.04.06.139 Ergon Energy, Regulatory proposal: July 2015 to June 2020, 31 October 2014, Attachment 07.04.01.
59 Attachment 6 – Capital expenditure | Ergon Energy determination 2015–20

There is insufficient exploration of alternative options and solutions, and the cost/benefit of these options to achieve the desired outcomes. This is most evident in the supporting documentation for the Alternative Data Acquisition Service,140 Distribution Management System141 and Meter configuration management system.142
Performance outcomes and targets for the projects were generally not defined in term of improvement in service performances, productivity, safety and cost. Therefore it is difficult to be satisfied that the costs and benefits of these programs are reasonably required to meet the capex objectives of the NER.
Our analysis above identified that Ergon Energy's forecasts for sub-transmission and distribution capex were over-estimated by 5 to 15 per cent based on systemic biases in Ergon Energy's forecasting process. These systemic biases were:
the capex has not been adequately linked to a prudent needs-driven analysis
the capex has not been adequately supported by cost-benefit analysis, robust options analysis and appropriately-applied risk assessment, and
the capex includes estimates that have led to a higher level of expenditure than may be required.
We consider these biases are systemic to Ergon Energy's capex forecasting approach and are therefore also present within Ergon Energy's forecasting of other systems enabling capex. Accordingly, we have reduced Ergon Energy's proposed capex forecast for other system enabling technologies by 15 per cent to $82.4 million ($2014−15). This is at the upper end of the range of the expected over-estimation within Ergon Energy's sub-transmission and distribution forecasts.
For sub-transmission and distribution, we adopted a mid-point of the range found by EMCa in its sample review. While there was no evidence pointing towards the upper or lower bounds of the range, there was some evidence that Ergon Energy followed robust methodologies to estimate augex (including prudent deferral of some projects). However, as we are not satisfied based on the evidence (as discussed above) that Ergon Energy has generally applied prudent forecasting techniques in developing its other system-enabling capex proposal, we consider that the upper end of the range more reasonably reflects the expected over-estimation within Ergon Energy's forecast of other system-enabling capex.
Unexplained capex
As noted, Ergon Energy's total proposed augex forecast is $660 million ($2014−15). Based on our review of Ergon Energy's supporting documentation, we can account for $627 million through the individual forecasts for sub-transmission, distribution, reliability, power quality, and other system-enabling capex (as set out in Table B.3). The remaining $33 million ($2014−15) is not accounted for within Ergon Energy's
140 Ergon Energy, Regulatory proposal: July 2015 to June 2020, 31 October 2014, Attachment 07.04.06.141 Ergon Energy, Regulatory proposal: July 2015 to June 2020, 31 October 2014, Attachment 07.04.12.142 Ergon Energy, Regulatory proposal: July 2015 to June 2020, 31 October 2014, Attachment 07.04.04.
60 Attachment 6 – Capital expenditure | Ergon Energy determination 2015–20

regulatory proposal and its supporting documentation. Furthermore, it was not identified by EMCa in its technical review.
We cannot be satisfied that this additional $33 million ($2014−15) is prudent and efficient without supporting evidence of the underlying driver of the capex and how it can be calculated. On this basis, we have not included it in our alternative estimate.
In Ergon Energy's submission on the revocation and substitution of our preliminary decision, we encourage Ergon Energy to provide further information to account for this additional capex and why it is prudent and efficient. We will have regard to this information in our final decision.
B.3 AER findings and estimates of connections and capital contributions
Connections capex is incurred by Ergon Energy to connect new small customers to its network and augment the shared network in order to connect customers.
Capital contributions are made up of the value of assets constructed by third parties which are operated by Ergon Energy, and cash provided by customers to fund connection works which specifically benefit them. These contributions are subtracted from total gross capex and as such decrease the revenue that is recovered from all consumers.
Ergon Energy proposed an allowance of $279.5 million ($2014−15) to fund forecast connection works for the 2015–20 regulatory control period, net of customer contributions. Table B.5 below presents Ergon Energy's proposed allowance to fund connections expenditure.
Table B.5 Ergon Energy proposed connections capex ($2014−15, million)
Category 2015−16 2016−17 2017−18 2018−19 2019−20 Total
Connections expenditure 85.1 86.3 87.6 88.8 89.9 437.8
Customer contributions std. control 29.8 30.4 31.9 32.9 33.4 158.3
Net connections capex 55.3 55.9 55.7 55.9 56.5 279.5
Source: Ergon Energy, Regulatory proposal, pp. 90, 93.
We accept Ergon Energy's forecast of proposed forecast connections capex and capital contributions. Our reasons are set out below.
Ergon Energy developed its forecast for connections capex based upon forecast employment, housing and residential building approvals.143 As shown in Figure B.1, Ergon Energy proposed forecast for connections expenditure has decreased from the current regulatory period. The connections forecasts increases slightly over the 2015−20 regulatory control period.143 Ergon Energy, Regulatory proposal: July 2015 to June 2020, 31 October 2014, Attachment 07.00.03.
61 Attachment 6 – Capital expenditure | Ergon Energy determination 2015–20

Cummings Economics considered that it would appear optimistic that the value of customer-initiated works would increase by $143 million ($2014–15) over the 2015–20 regulatory control period since the 2010–15 period when Ergon Energy is forecasting a flat demand.144 We note that connections capex is not driven by forecast system demand, and often connections activities can increase while peak demand decreases or remains flat. As set out below, our assessment of the proposed connections forecast is informed by the forecast trend in construction activity in Queensland.
Figure B.1 Connection capex historic actual and proposed for 2010–20 period ($2014–15, million, including overheads)
Source: Ergon Energy, Regulatory proposal, October 2014.
Note: Connections capex is shown net of customer capital contributions.
We consider that forecast dwelling growth and construction expenditure are reasonable proxies for forecast growth in connections services for residential and commercial customers. We consider that the trend of Ergon Energy's forecast of connections expenditure and capital contributions is not inconsistent with the trends in forecast construction activity in Queensland as per Figure B.2. On the basis of these comparisons, we accept Ergon Energy's proposed forecast for connections expenditure and customer contributions.
144 Cummings Economics, Submission to Australian Energy Regulator on behalf of a Network of electricity users in far North Queensland, 30 January 2015, p. 32.
62 Attachment 6 – Capital expenditure | Ergon Energy determination 2015–20

Figure B.2 Connection capex and non-residential construction activity
Source: BIS Shrapnel, Ergon Energy, Regulatory proposal, October 2014.
The Alliance of Electrical Consumers contends that Ergon Energy has not provided sufficient evidence to demonstrate why the average cost per connection needs to increase in the 2015–20 regulatory control period.145 The alliance calls for the AER to limit Ergon Energy's connection allowance to the levels of the current regulatory period. We consider that comparing the proposed unit costs for Ergon Energy's new connections with those of other distributors will help us be satisfied that the connections forecast is prudent and efficient. To be able to make meaningful comparisons, unit costs of network connections would need to be consistently calculated for different types of connections across the NEM, for example simple and complex and under and above ground. For this preliminary decision, we do not have the required data to effectively undertake this comparison. On this basis, we have relied more primarily on trend analysis of forecast construction activity in Queensland. However, we intend to work with distributors to ensure that data is collected that would enable meaningful unit cost comparisons to be undertaken for future decisions.
The EUAA suggests that we should scrutinise the basis of estimating increases in customer-initiated capital works expenditure before allocations across standard and alternative control services and capital contributions.146 We note that the funding and
145 Alliance of electricity consumers, Submission on Ergon Energy's regulatory proposal 2015–20, 30 January 2015, p. 16.
146 Energy Users Association of Australia, Submission to Energex and Ergon Energy revenue proposals 2015/16 to 2019/20, 30 January 2015, p. 22.
63 Attachment 6 – Capital expenditure | Ergon Energy determination 2015–20
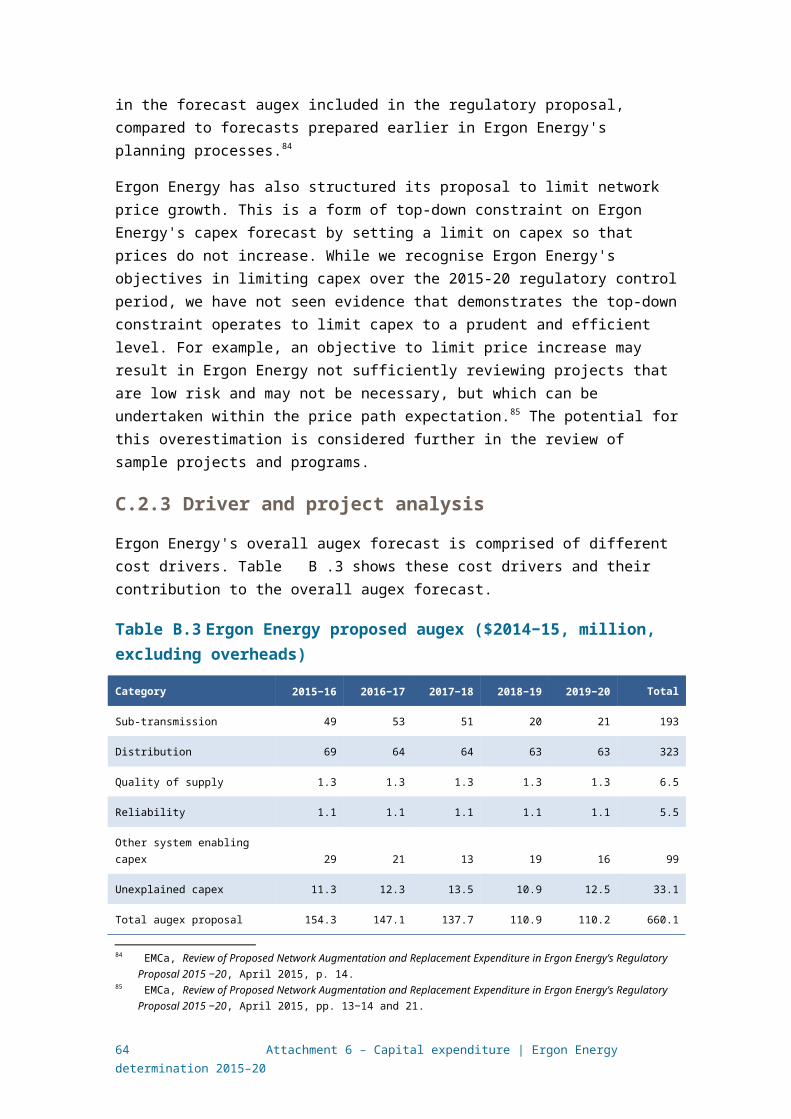
charges across the entire customer base for connection services is made on a net basis. That is, after subtracting capital contributions and allocating expenditure to alternative control services, for which individual customers entirely bear the cost for those connection services that they solely benefit. We have therefore assessed the proposed capex allowance for connection services on a net basis when deciding how connection costs should be recovered across the entire customer base.
B.4 AER findings and estimates of replacement expenditure
Repex is driven by a service provider's need to replace its assets. In the long run, a service provider's assets will no longer meet the requirements of the network and need to be replaced, refurbished or removed.147 Replacement may occur when an asset fails, or a condition assessment may find it is likely to fail soon and replacement is the most economic option. It may also occur because jurisdictional safety regulations mean it can no longer be safely operated on the network, or because the risk of using the asset exceeds the benefit of continuing to operate it on the network.
In general, the majority of network assets will remain in efficient use for far longer than a single five year regulatory period. As a consequence, a distributor will only need to replace a portion of its network assets in each regulatory control period. The majority of its assets will remain in commission beyond the end of the regulatory control period, and be replaced in subsequent regulatory periods.
Our assessment of repex seeks to establish the portion of Ergon Energy's assets that will likely require replacement over the 2015–20 regulatory control period and the associated expenditure.
B.4.1 Position
We do not accept Ergon Energy's proposed repex of $894 million. We have instead included in our alternative estimate of overall total capex, an amount of $675 million ($2014–15), excluding overheads, 24 per cent lower than Ergon Energy's proposal. We are satisfied that this amount reasonably reflects the capex criteria.
B.4.2 Ergon Energy's proposal Ergon Energy's proposed forecast repex is $1.36 billion ($2014–15) in total costs,148
or $894 million ($2014–15) in direct costs excluding overheads.149 Ergon Energy submitted that this expenditure is driven by: 150
compliance requirements related to obligations under the Electrical Safety Act 2002, the Work, Health and Safety Act 2002 and the Queensland Electrical Safety Code of Practice 2010
147 Assets may also be replaced due to network augmentation. In these cases the primary reason for the asset expenditure is not the replacement of an asset that has reached the end of its economic life, but the need to deploy new assets to augment the network, predominantly in response to changing demand.
148 Ergon Energy, Forecast Expenditure Summary – Asset Renewal, November 2014, p. 10.149 Ergon Energy, Forecast Expenditure Summary – Asset Renewal, November 2014, p. 7. 150 Ergon Energy, 07.00.01 Asset Renewal Expenditure Forecast Summary, October 2014, p. 9.
64 Attachment 6 – Capital expenditure | Ergon Energy determination 2015–20

safety requirements driven by the risk of asset failure (e.g. copper conductors)
replacing assets that have reached the end of useful life.
B.4.3 AER approach
We have applied several assessment techniques to assess Ergon Energy’s forecast of repex against the capex criteria. These techniques are:
analysis of Ergon Energy’s long term repex trends
predictive modelling of Ergon Energy’s assets in commission; and
technical review of Ergon Energy’s approach to forecasting, costs, work practices and risk management
consideration of various asset health indicators.
We primarily use our predictive modelling to assess approximately 66 per cent of Ergon Energy's proposed repex in combination with the findings of EMCa's technical review. For the remaining categories of expenditure, we do not use our predictive modelling but rely instead on the analysis of historical expenditure for those categories as supported by the findings of EMCa's technical review. We note that the other two assessment techniques were considered, but were not ultimately used to reject Ergon Energy's forecast repex or develop our alternative estimate, though our findings from those other assessment techniques are consistent with our overall conclusion.
Trend analysis
We recognise the limitations of expenditure trends, especially in circumstances where replacement needs may change over time (e.g. a service provider may have a lumpy asset age profile or legislative obligations may change over time). In recognising these limitations we have used this analysis as follows:
we have drawn general observations from the historic trend analysis and benchmarking in relation to repex, but we have not used trend analysis to reject Ergon Energy's forecast of repex or develop our alternative estimate
for repex to which we have not applied predictive modelling, we have relied on trend analysis at the asset category level for assessing these repex programs in combination with the findings of EMCa's technical review (see below).
Predictive modelling
We use a predictive model known as the repex model to predict likely asset replacement volumes and expenditure based on the number and age of assets in commission, the assumed age of replacement of these assets and their corresponding unit costs.151 The model uses age as a proxy for many factors that drive individual
151 We first used the predictive model to inform our assessment of the Victorian distributors' repex proposals in 2010. We undertook extensive consultation on this technique in developing the Expenditure Forecasting Assessment Guideline. We have since used the repex model to inform our assessment of repex proposals for Tasmanian, NSW, ACT and QLD distributors.
65 Attachment 6 – Capital expenditure | Ergon Energy determination 2015–20

asset replacement.152 The technical underpinnings of the repex model are discussed in detail in the Replacement expenditure model handbook.153 At a basic level, the model predicts the volume of a distributor's assets that may need to be replaced over each of the next 20 years. This prediction is made by looking at the age of assets already in commission, and the time at which, on average, these assets would be expected to be replaced. The unit cost of replacing the assets is used to provide an estimate of replacement expenditure. The data used in the model is derived from the distributor’s regulatory information notice (RIN) responses and from the outcomes of the unit cost and replacement life benchmarking across all distribution businesses in the NEM. More detail on the repex model and input data is at appendix E.
The repex model can predict the reasonable amount of repex Ergon Energy would require if it maintains its current risk profile for condition-based replacement into the next regulatory control period. Using what we refer to as calibrated replacement lives in the repex model gives an estimate that reflects 'business as usual' asset management practices consistent with achieving the capex objectives. We explain the calibrated replacement life scenario, along with other input scenarios, further below.
Any material difference from the calibrated (business as usual) estimate could be explained by evidence of a non-age related increase in asset risk in the network (such as a change in jurisdictional safety or environmental legislation) or evidence of significant asset degradation that could not be explained by asset age. We use our qualitative techniques, particularly EMCa's technical review, to assess whether there is any such evidence.
We recognise that our predictive modelling cannot perfectly predict Ergon Energy's necessary replacement volumes and expenditure over the next regulatory control period, in the same way that no prediction of future needs will be absolutely precise. However, we consider the repex model is suitable for providing a reasonable statistical estimate of replacement volumes and expenditure for certain types of assets, where we are satisfied we have the necessary data. We explain our reasons for this in appendix E.
We also recognise that there are reasons why some assets may be better assessed outside of the model. Where we considered this was justified, we have separately assessed those assets by using techniques other than predictive modelling.
Technical review
Ergon Energy's proposed repex was subject to a technical review by Energy Market Consulting Associates (EMCa). EMCa assessed Ergon Energy’s approach to forecasting including whether it has had regard to cost-benefit analysis that was robust and appropriate. It also assessed Ergon Energy's costs, work practices and risk management approach. This was to identify whether Ergon Energy systematically overestimated risk and, in turn, whether its approach to repex and repex forecasts was in accordance with its risk profile in the next regulatory control period.
152 AER, Electricity network service providers, Replacement expenditure model handbook, November 2013, p. 10.153 AER, Electricity network service providers, Replacement expenditure model handbook, November 2013.
66 Attachment 6 – Capital expenditure | Ergon Energy determination 2015–20

As set out above, we have had regard to EMCa's findings to assess whether Ergon Energy's risk profile is different in the next regulatory control period, such that it requires repex above the business as usual prediction of our repex model. We have also relied on it, in combination with trend analysis at the category level, to inform our assessment of repex programs to which we did not apply our predictive modelling.
Asset health indicators
We have used a number of asset health indicators with a view to observing asset health. Asset utilisation is one such indicator. We have relied on changes in asset utilisation to provide an indication as to whether Ergon Energy's assets are likely to deteriorate more or less than would be expected given the age of its assets. Utilisation in particular is a useful check on the outcomes of our predictive modelling in that unlike the other indicators, and the predictive modelling itself, it is not age based.
The remaining indicators we have used are aged based. We acknowledge that these are less useful for providing a check on the outcomes of our predictive modelling because the model also assumes age is a reasonable proxy for asset condition. Similar to measures of asset utilisation we have not relied on these age-based indicators to any extent to inform our alternative estimate, they have however provided context for our decision.
Trends in historical and forecast repex
We have conducted a trend analysis of repex. The NER requires that we consider the actual and expected capital expenditure during any preceding regulatory control period.154
Our use of trend analysis is used to gauge how Ergon Energy's historical actual repex compares to its expected repex for the 2015−20 regulatory control period. Figure B.3 shows Ergon Energy's repex spend since the early 2000s is highly variable with its proposal for the 2015−20 regulatory control period is above the long term average repex.
154 NER, cl. 6.5.7(e)(5).
67 Attachment 6 – Capital expenditure | Ergon Energy determination 2015–20

Figure B.3 Ergon Energy's repex - historic actual and proposed for 2015−20 regulatory control period (real $ million 2014−15)
Source: Historical years: Ergon Energy 2010-15 Revised Regulatory Proposal - RIN response - Table 2 - Capital
expenditure by purpose. Current and forthcoming regulatory periods: Ergon Energy - Regulatory Proposal
2015-20 - Reset RIN - Table 2.1.1 - Standard Control Services Capex
When considering the above trend we acknowledge there are limitations in long term year on year comparisons of replacement expenditure. In particular, we are mindful that:
Ergon Energy's regulatory reporting has been subject to varied definitions of replacement expenditure across time.155
There are natural variations in a distributors replacement needs over time. Such variations can be a result of a lumpy asset age profiles or changes in relevant regulatory obligations.156
Ergon Energy submitted that its expenditure profile in the initial years of the trend shown in Figure B.3:
…reflects that from early 2000 Ergon Energy was investing heavily in the network in response to population growth and in an effort to meet our customer’s changing expectations around reliability and quality of supply; driven by the uptake of lifestyle appliances. Additional network investment was required from 2004, to meet the higher reliability standards introduced in response to the Electricity Distribution Service Delivery (EDSD) Review.157
155 In the Reset RIN we defined replacement expenditure to be: Repex: The non-demand driven capex to replace an asset with its modern equivalent where the asset has reached the end of its economic life. Capex has a primary driver of replacement expenditure if the factor determining the expenditure is the existing asset's inability to efficiently maintain its service performance requirement.
156 NER, cl. 6.5.7 (a).157 Ergon Energy, Regulatory Proposal 2015 to 2020, October 2014, p. 94 (Ergon Energy, Regulatory Proposal
2015–20, October 2014).
68 Attachment 6 – Capital expenditure | Ergon Energy determination 2015–20

On the basis of the above we are satisfied that expenditure levels in the initial years of Figure B.3 is, in part be attributed to higher reliability standards that are no longer in effect.158
Figure B.4 compares actual and expected repex in the current and forthcoming regulatory control period.
Figure B.4 Actual and expected repex ($ million real 2014−15)
Source: Ergon Energy - Regulatory Proposal 2015−20 - Reset RIN - Table 2.1.1 - Standard Control Services Capex
Ergon Energy submitted that its expenditure outcomes in the current regulatory control period are driven by: 159
prudent deferral in response to changes in market conditions and demand management initiatives
network revenue reductions as a result of the ENCAP Review, and absorbed costs associated with Cyclone Yasi and Oswald. 160
changes in security standards away from the deterministic EDSD Review N-1 security standards.161
We note that the historical trend in repex indicates significant variability in repex across time. Further, we note that Figure B.4 indicates Ergon Energy's proposal represents an
158 Under the Electricity Act 1994 and the Electricity Regulation 2006 Ergon Energy is subject to a distribution authority which specifies conditions on how it supplies electricity. This distribution authority specifies the security standards Ergon Energy must comply with, these were changed in March 2014 to adopt a probabilistic planning standard. This has removed Ergon Energy's obligations under the higher N-X planning standards from 1 July 2014.
159 Ergon Energy, Regulatory Proposal 2015–20, October 2014, p. 94.160 The ENCAP review of Electricity Network Capital Program Review 2011 examined improvements made to the
Queensland electricity network since the 2004 Electricity Distribution and Service Delivery (EDSD) Review, and how appropriate the network businesses' capital programs were in achieving a balance between security, reliability and cost.
161 Ergon Energy, Regulatory Proposal 2015-20, October 2014, p.94
69 Attachment 6 – Capital expenditure | Ergon Energy determination 2015–20
eight per cent increase in aggregate repex compared to the current regulatory control period.162 Our observations from the trend analysis support the need for a more detailed review using our other assessment techniques to inform our view of the efficient and prudent amount of total proposed repex.
Predictive modelling
We use predictive modelling to estimate how much repex Ergon Energy is expected to need in future, given how old its current assets are, and based on when it is likely to replace the assets. We modelled six asset groups using the repex model. These were poles, overhead conductors, underground cables, service lines, transformers and switchgear. To ensure comparability across different service providers, these asset groups have also been split into various asset sub categories. Pole top structures and SCADA were not modelled, along with specialised categories of capex defined by Ergon Energy that were not classified under the groups above. In total, the assets modelled represent 66 per cent of Ergon Energy's proposed repex. Our predictive modelling calculation process is described at appendix E.
We consider the best estimate of business as usual repex for Ergon Energy is provided by using calibrated asset replacement lives and unit costs derived from Ergon Energy's recent forecast expenditure. We have assessed this finding in the context of our technical review before forming a view as to the appropriate repex component of capex for Ergon Energy. We set out below our views on the modelling input scenarios and our views on their suitability for use in our assessment.
In total for all six modelled categories we have included an amount of $449 million ($2014–15) in our alternative estimate of total forecast capex, compared to Ergon Energy's forecast of $590 million. We have had regard to the outcome and the findings of the technical review in considering whether it is appropriate to forecast repex on the basis of a business as usual estimate, or whether Ergon Energy has provided sufficient evidence to suggest that its replacement needs are higher in the next period.
In its report EMCa noted that Ergon Energy's proposed repex appeared lower in total than shown in Ergon Energy's application of the repex model. Despite this EMCa considered Ergon Energy's overall aggregated bottom-up repex forecast was likely to have excessive costs over that which is prudent and efficient.163
Submissions on Ergon Energy's proposal also considered that Ergon Energy's proposed repex for the 2015–20 regulatory control period was higher than necessary:
The Chamber of Commerce and Industry Queensland (CCIQ) submitted the proposed levels of repex appear very high. Particularly, in light of the substantial replacement capex programs performed during the previous regulatory periods as well as the asset age and asset utilisation trends it considered were declining.
162 Comparison of current regulatory control period based on aggregated comparison of ($ 2014-15) repex reported in Ergon Energy - Regulatory Proposal 2015−20 - Reset RIN - Table 2.1.1 - Standard Control Services Capex.
163 EMCa, Review of Proposed Network Augmentation and Replacement Expenditure in Ergon’s Regulatory Proposal 2015 - 2020, April 2015, p, iii (EMCa, Review Ergon Energy's Proposed Augex and Repex, April 2015).
70 Attachment 6 – Capital expenditure | Ergon Energy determination 2015–20

CCIQ stated it would expect to see reductions in repex of around 40 per cent similar to those of our other determinations.164
The Queensland Resources Council (QRC) noted the ability of many distributors including Ergon Energy to defer previously approved expenditure such as repex when pressured by shareholders. The QRC considered there was evidence demonstrating the inefficiencies of Ergon Energy.165
Cotton Australia submitted there has been a considerable trend upwards of repex. It was of the view there was a strong case for this and that repex should have peaked as there is now a very consistent trend downwards on the average life of assets. Cotton Australia considered the distributors cannot argue that they need to spend more due to an aging assets base.166
The Queensland Council of Social Services (QCOSS) submitted it was difficult to understand the justification for Ergon Energy's large repex proposal as it considered there had been a decline in the average asset age for Ergon Energy. QCOSS considered Ergon Energy's proposal needed further scrutiny as replacements should be able to be deferred through corrective maintenance, acceptance of risk of failure, or the fact that assets may not be needed given weak or declining demand and peak forecasts.167
Model scenario inputs
The repex model uses the following inputs:
The asset age profile input is the number of assets in commission and when each one was installed.
The replacement life input is a mean replacement life and standard deviation (i.e. on average, how old assets are when they are replaced).
The unit cost input is the unit cost of replacement (i.e. on average, how much each asset costs to replace).
In appendix E, we describe using the repex model to create three scenarios. In each of the three modelling scenarios (base case scenario, calibrated scenario and benchmark scenario) we combined different data for the final two inputs.
Under all scenarios, the first input is Ergon Energy's asset age profile (how old Ergon Energy's existing assets are). This is fixed and does not change.
The second and third inputs can be varied by using different input assumptions about:
how long we expect an asset to last before it needs replacing; and
how much it costs to replace it.
164 Chamber of Commerce and Industry Queensland (CCIQ), Submission on Ergon Energy's regulatory proposal 2015-20 - 30, January 2015, p. 13.
165 Queensland Resources Council, Submission on Ergon Energy's regulatory proposal 2015-20, January 2015, p. 2. 166 Cotton Australia, Submission on Qld distributors' regulatory proposals 2015-20, January 2015, p. 7.167 Queensland Council of Social Service (QCOSS), Submission on Qld distributors' regulatory proposals 2015-20,
January 2015, pp. 55–56.
71 Attachment 6 – Capital expenditure | Ergon Energy determination 2015–20
The repex model takes the replacement life input for each asset category and applies it to the actual age of the assets in each asset category, on an asset category basis. In doing this it calculates when and how many assets in the asset category will need replacement in the near future.168 The model then applies the unit cost input to calculate how much expenditure is needed for that amount of replacement in each asset category. This is aggregated to a total repex forecast for each of the next 20 years.
The remaining part of this section outlines the replacement lives and unit cost inputs we tested in the repex model to assess Ergon Energy's proposed repex. As part of our assessment, we compared the outcomes of using Ergon Energy's estimated replacement lives and its unit costs, both forecast and historical, with the replacement lives and unit costs achieved by other NEM distributors. We also used the repex model to determine calibrated replacement lives that are based on Ergon Energy's past five years of actual replacement data. These reflect Ergon Energy's immediate past approach to replacement.
We calculated historic unit costs by dividing historic expenditure by historic volumes and forecast unit costs by dividing forecast expenditure by forecast volumes.
Detail on how we prepared the model inputs is at appendix E.
Finding 'business as usual' repex
The calibrated asset life scenario gives an estimate based on Ergon Energy's current risk profile, as evidenced by its own replacement practices. Our estimate trends forward Ergon Energy's current approach to asset risk management, weighted by the actual age of its assets. Calibrated replacement lives use Ergon Energy's recent asset replacement practices to estimate a replacement life for each asset type. These replacement lives are calculated by using Ergon Energy's past five years of replacement volumes, and its current asset age profile (which reveals how many, and how old, Ergon Energy's assets are), to find the age at which, on average, Ergon Energy replaces its assets. The calibrated replacement life represents this age. The calibrated asset life scenario has been our preferred modelling scenario in recent reviews of other service providers.169 This is because we considered the calibrated replacement lives formed the basis of a business as usual estimate of repex, as they are derived from the service provider's actual replacement practice observed over the past five years. The service provider decides to replace each asset at a certain time by taking into account the age and condition of its assets, its operating environment, and its regulatory obligations. If the service provider is currently meeting its network reliability, quality and safety requirements by replacing assets when they reach a certain age, then by adopting the same approach to replacement in future they are likely to continue to meet its obligations.
However, if underlying circumstances are different in the next regulatory control period, then this approach to replacement may no longer allow a service provider to meet its obligations. We consider a change in underlying circumstances to be a genuine
168 The repex model predicts replacement volumes for the next 20 years.169 See draft decisions for Essential Energy, Endeavour Energy, ActewAGL and Ausgrid.
72 Attachment 6 – Capital expenditure | Ergon Energy determination 2015–20

change in the underlying risk of operating an asset, genuine evidence that there has been a change in the expected non-age related condition of assets from the last regulatory control period, or a change in relevant regulatory obligations (e.g. obligations governing safety and reliability).
If we are satisfied that there is evidence of a change in a service provider's underlying circumstances, we will accept that future asset replacement should not be based on a business as usual approach. This means that where there is evidence that a service provider's risk profile has changed then it may be necessary to provide a forecast of repex different to the business as usual estimate. This alternative forecast would be required in order to satisfy us that the amount reasonably reflects the capex criteria.
Calibrated scenario outcomes
We have modelled the calibrated lives using two unit cost assumptions, being:
Ergon Energy's own historical unit costs from the current regulatory period. These reflect the unit costs Ergon Energy has incurred over the last five years.
Ergon Energy's own forecast unit costs for the next regulatory period. These reflect the unit costs Ergon Energy expects to incur over the next five years.
Ergon Energy's historic unit costs as submitted under its RIN gave forecast outcomes under the calibrated scenario that were higher than when we used Ergon Energy's forecast unit costs, or benchmark unit costs. This suggests historic unit costs are not likely to reflect a realistic expectation of future input costs. We compared Ergon Energy's forecast unit costs with industry benchmark unit costs. We observed that Ergon Energy's forecast unit costs resulted in similar or lower forecasts under the calibrated scenario. As a result we accepted the use of Ergon Energy's own forecast unit costs rather than industry benchmarks.
The calibrated scenario gives an output of $711 million for the modelled categories when using forecast unit costs. Ergon Energy's forecast was $590 million in the six modelled asset categories. Since the calibrated scenario outcomes were higher in total than Ergon Energy's forecast we investigated the modelled outputs for each asset category. The model predicted significantly higher repex than Ergon Energy for the poles and overhead conductor categories, and lower repex than Ergon Energy for the underground cables, service lines, transformers and switchgear asset categories.
The majority of Ergon Energy's pole assets are wood poles (90 per cent). Ergon Energy's calibrated lives for wood poles appear to be shorter than the benchmark average calibrated lives, that is, Ergon Energy appears to have been replacing its wood poles earlier compared to other NEM distributors. When we input benchmark average calibrated lives for all poles categories, along with Ergon Energy's forecast unit costs into the model, the predicted forecast repex for the poles group was closer to but still above Ergon Energy's forecast. In its report EMCa inferred the reduction in Ergon Energy's forecast repex for its pole assets reflected a change in risk and performance of the asset group described in Ergon Energy's supporting information. EMCa did not identify any systemic issues with the poles category.170 Having regard to
170 EMCa, Review Ergon Energy's Proposed Augex and Repex, April 2015, pp. 80−82.
73 Attachment 6 – Capital expenditure | Ergon Energy determination 2015–20

the information before us, we consider that Ergon Energy's proposed forecast repex for poles is likely to reasonably reflect the capex criteria and have included this amount of $76 million ($2014–15) in our alternative estimate of total forecast capex.
We observed that Ergon Energy's forecast unit costs for overhead conductors appear to be higher (in some cases significantly higher) than benchmark average unit costs. When we input benchmark average unit costs for overhead conductors along with Ergon Energy's calibrated lives into the model, the predicted forecast repex for overhead conductors was closer to but still above Ergon Energy's forecast. In its report EMCa expressed reservations about the completeness of Ergon Energy's analysis supporting its overhead conductor program and considered the justification for the forecast repex was not proven. However, EMCa considered the focus of the program was consistent with industry practice.171 On balance, we consider that Ergon Energy's proposed forecast repex for overhead conductors is likely to reasonably reflect the capex criteria and have included this amount of $195 million ($2014–15) in our alternative estimate of total forecast capex.
For the remaining modelled categories (underground cables, service lines, transformers and switchgear) the calibrated scenario with forecast unit costs predicted a business as usual amount of repex of $178 million ($2014–15) compared to Ergon Energy's forecast of $319 million ($2014–15) for these remaining modelled categories. In its report EMCa considered Ergon Energy provided insufficient justification to support the proposed repex forecasts in the transformers and switchgear asset categories, and that the proposed repex for service lines was likely to be higher than necessary.172 EMCa did not identify any systemic issues in its review of the underground cables asset category.173 However we note this category represents less than two per cent of Ergon Energy's forecast repex. For these remaining modelled categories, given that the calibrated scenario predicted a lower amount of business as usual repex, and that EMCa found Ergon Energy lacked justification for these repex forecasts, we do not consider there is reason to adopt a forecast other than the business as usual calibrated scenario. We consider the amount of $178 million ($2014–15) is likely to reasonably reflect the capex criteria for these remaining modelled categories and have included this amount in our alternative estimate of total forecast capex.
In total for all six modelled categories we have included an amount of $449 million ($2014–15) in our alternative estimate of total forecast capex, compared to Ergon Energy's forecast of $590 million. The amount of $449 million represents Ergon Energy's forecast repex for the poles and overhead conductor, and the total calibrated scenario repex model amount for the remaining four categories (underground cables, service lines, transformers and switchgear).
Testing other model inputs
171 EMCa, Review Ergon Energy's Proposed Augex and Repex, April 2015, pp. 72−75.172 EMCa, Review Ergon Energy's Proposed Augex and Repex, April 2015, pp. 75−80.173 EMCa, Review Ergon Energy's Proposed Augex and Repex, April 2015, p. 85.
74 Attachment 6 – Capital expenditure | Ergon Energy determination 2015–20
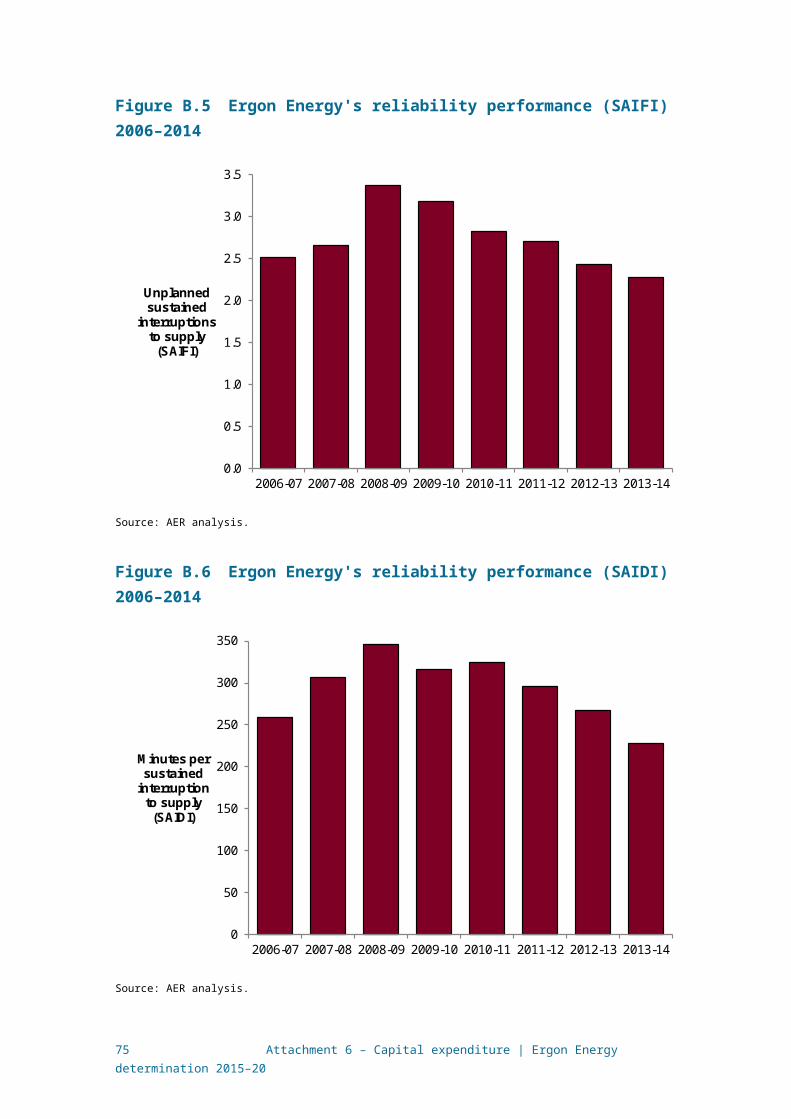
As outlined earlier (and in appendix E) we used the repex model to create other scenarios combining different input data. In this section we explain how the outcomes of these other scenarios support our conclusion to use the calibrated scenario.
Base case scenario outcomes
Ergon Energy provided its own estimate of asset replacement lives in its RIN response. To test this inputs we include them in a predictive modelling scenario that is referred to as the base case. The base case scenario gives repex estimates of $5.04 billion (historical unit cost) and $4.36 billion (forecast unit cost). These forecasts are significantly higher than Ergon Energy's forecast of $590 million for the six modelled asset groups.
The replacement profile predicted by the repex model under the base case scenario features a sharp step-up in expenditure in the first year of the forecast, which then declines over the remainder of the period (see Figure B.5). This replacement profile indicates that a significant portion of the asset population currently in commission is much older than would be expected using Ergon Energy's estimated replacement lives. Using this input causes the model to immediately predict the replacement of this stock of assets. This, in turn, results in a large stock of predicted asset replacements in the first year of the forecast, which then declines over time.
Figure B.5 Base case scenario outcome
0
200
400
600
800
1000
1200
1400
Total Repex ($ millions)
Year
Actual repex ($real, 2014-15)
Forecast repex using Ergon Energy estimated lives, historic unit costs ($nominal)
Forecast repex using Ergon Energy estimated lives, forecast unit costs ($nominal)
Source: Ergon Energy, AER analysis.
75 Attachment 6 – Capital expenditure | Ergon Energy determination 2015–20

Based on our analysis of the base case scenario outcomes we consider that Ergon Energy's estimated replacement lives are not credible or reliable for the following reasons.
First, if Ergon Energy's actual replacement lives were consistent with their estimated replacement lives, we would not expect to see the observed asset replacement profile. If Ergon Energy's actual asset replacement profile followed its estimated replacement lives, the older assets would have:
already reached the end of their economic (replacement) lives and would have already been largely replaced; and
would therefore not be expected to be in the asset age profile, or be in such insignificant volumes that it would not materially affect the outcome of predictive modelling.
The 'step-up/trend down' replacement profile observed from the base case scenario suggests that a significant proportion of the asset population has survived longer than would be expected using Ergon Energy's estimated replacement lives. These 'survivor' assets have a material effect on the observed outcome. This outcome suggests that Ergon Energy's estimated replacement lives are shorter than those it achieves in practice.
Second, further analysis of the base case scenario reveals the replacement life inputs are the main drivers of the base case scenario outcome. Under the calibrated scenario where Ergon Energy's estimated replacement lives are substituted with calibrated replacement lives the model outputs are $879 million for historical unit costs and $711 million for forecast unit costs. Taken together with the information from our other analytical techniques, and our concerns that Ergon Energy's estimated replacement lives do not reflect its actual replacement practices, we consider that the estimated replacement life information provided by Ergon Energy will not result in a reasonable forecast of business as usual repex.
Benchmarked scenario outcomes
Benchmarked uncalibrated replacement lives
We developed a series of benchmark replacement lives using the data collected from all NEM distributors in the category analysis RINs. For model inputs we used the average, third quartile (above average), and longest replacement lives of all NEM distributors for each category. We discuss how we prepared this data in appendix E.
As with Ergon Energy's estimated replacement lives, we found using these benchmark replacement lives produced sharp 'step-up/trend down' forecast expenditure, indicating the replacement lives used are likely to be too short for modelling purposes as they predict a large unrealistic 'backlog' of replacement. When used in the model these also produced outcomes higher than Ergon Energy's own forecasts.
Benchmarked calibrated replacement lives
76 Attachment 6 – Capital expenditure | Ergon Energy determination 2015–20

We developed benchmark calibrated lives by first using the repex model to calculate calibrated lives based on the replacement data from all NEM distributors. For model inputs we again used the average, third quartile (above average), and longest of the calibrated lives of all NEM distributors for each category. We discuss how we prepared this data in appendix E.
When applied to the model for Ergon Energy, these replacement lives produced outcomes lower than when we used the calibrated replacement lives based on Ergon Energy's data. The outcome was also lower than Ergon Energy's forecast. The calibrated benchmark replacement lives may reflect to some extent the particular circumstances of a distributor and this may not be applicable to the business under review. However, this input provided us with a check that Ergon Energy's calibrated replacement lives were reasonable against its peer service providers in the NEM.
Benchmarked unit costs
We developed industry benchmark unit costs using the data collected from all NEM distributors in the category analysis RINs. For model inputs we used the average, first quartile (below average), and lowest unit costs of all NEM distributors for each asset category. We discuss how we prepared this data in appendix E.
Applying the average benchmark unit costs in the repex model for Ergon Energy gave an outcome that was higher compared to when we used Ergon Energy's forecast unit costs, but lower compared to when we used Ergon Energy's historic unit costs. The outcome when using the first quartile benchmark unit cost was similar compared to Ergon Energy’s forecast unit costs, and the lowest unit cost benchmark numbers were lower than this. We considered the benchmark average unit cost was a useful comparison with the cost of other distributors in the NEM.
Technical review
This section sets out the findings of a technical review undertaken by EMCa that we commissioned to help us to assess whether Ergon Energy's repex forecast reasonably reflects the capex criteria. In particular, we engaged EMCa to test whether Ergon Energy's:
repex forecast is reasonable and unbiased
costs and work practices are prudent and efficient; and
risk management is prudent and efficient.
We consider that EMCa's assessment assists in determining whether Ergon Energy's costs, work practices, and expectations are prudent and efficient.174 EMCa's report also assists us in assessing the proposed expenditure against the capex objectives and some of the capex factors that we are required to have regard to. For example, we expect a prudent operator would comply with regulatory obligations or requirements and maintain safety as part of its costs, work practices and risk management.175 Another example is in relation to Ergon Energy's actual and expected
174 NER, cl. 6.5.7(c).175 NER, cl. 6.5.7(a).
77 Attachment 6 – Capital expenditure | Ergon Energy determination 2015–20

repex in the previous regulatory control period, and the substitution possibilities between repex and opex (whether to replace or maintain).176
By assessing Ergon Energy's approach to repex forecasting and risk management, the technical review assists us in forming a view as to whether Ergon Energy's underlying circumstances (particularly its asset risk) in the 2015–20 regulatory control period have changed from the last regulatory period. This allows us to form a view on whether Ergon Energy would require more or less repex than the business as usual estimate of repex in the 2015–20 regulatory control period.
We engaged EMCa to provide advice on the issues identified above. Broadly, on these aspects EMCa found that:177
Ergon Energy's proposed forecast is not reasonable and exhibits a degree of upwards bias reflecting cost and risk over-estimation. Further, a CPI price objective driving the top-down governance of Ergon Energy’s expenditure forecast does not provide a meaningful discipline that would lead Ergon Energy to a prudent and efficient capex level. EMCa considered Ergon Energy's repex forecast was likely to have excessive costs over that which is prudent and efficient.
Ergon Energy’s costs and work practices are reasonably prudent and efficient, within the bounds of reasonableness as referred to in the NER.
Ergon Energy’s risk management framework has elements that are likely to have led to a degree of engineering conservatism contributing to a degree of upwards bias in Ergon Energy's forecast.
Ergon Energy did not test positively on two of the three broad issues above. We discuss EMCa's findings in more detail below.
EMCa findings
EMCa considered Ergon Energy's top-down process resulted in a more prudent and efficient forecast than it initially considered, but still resulted in an upwardly biased capex forecast. This is because there was insufficient evidence that Ergon Energy's iterative feedback loops delivered an optimum risk/cost position, and that Ergon Energy tends to adopt a conservative approach to risk when assessing project and program need.178
EMCa found that Ergon Energy's bottom-up forecast was broadly based on identified focus areas. However, that there was insufficient justification to include increasing levels of repex in some programs. Further, elements of the proposed repex were not subjected to rigorous top-down challenge to achieve and demonstrate an optimal risk/cost position.179
176 NER, cl. 6.5.7(e).177 EMCa, Review Ergon Energy's Proposed Augex and Repex, April 2015, pp. i–iv.178 EMCa, Review Ergon Energy's Proposed Augex and Repex, April 2015, p. i.179 EMCa, Review Ergon Energy's Proposed Augex and Repex, April 2015, pp. iii.
78 Attachment 6 – Capital expenditure | Ergon Energy determination 2015–20

EMCa considered the prudency of Ergon Energy's repex forecast was undermined by:180
insufficient project and program analysis supporting the timing and volume of activity
bias in Ergon Energy's replacement programs towards bulk replacements of targeted asset categories, with insufficient justification for choosing the 2015–20 regulatory control period as the replacement period
application of risk assessments appearing to result in a reactive approach to identified issues
step changes in expenditure that are not a result of a condition based risk management (CBRM) methodology or trend data, but appear to align with regulatory control periods
lack of identified condition data on which to make informed asset management decisions using CBRM tools.
EMCa observed that the objective of Ergon Energy is to cap network price increases at CPI (or less). EMCa considered it would only be coincidence if a forecast developed under this objective was prudent and efficient. Specific factors provide significant headroom which may allow Ergon Energy to meet this objective without necessarily allowing only for prudent and efficient capex. These include a low WACC, transfer of services from standard control to alternative control (in regards to repex), and considerably reduced augex in the 2010–15 and 2015–20 regulatory control periods relative to forecast capex. EMCa consider capex should be set to provide the prudent and efficient expenditure necessary to operate a safe and reliable network. EMCa considers that a CPI price cap objective on the overall business does not provide a meaningful discipline that would lead Ergon Energy to a prudent and efficient capex level.181
EMCa expressed concerns that Ergon Energy's risk framework may have led to an overestimation bias through the inclusion of low risk projects without adequate justification.182 EMCa found that Ergon Energy's top-down challenge process on its forecasts may embed a conservative approach to risk given iterations around an assessed 'extreme risk'. Capex may not be constrained to that which is prudent and efficient where a potential contingency is built into Ergon Energy's expenditure forecast that reflects conservative risk management, anticipated reductions by the AER, and/or a CPI or less price objective.183
Ergon Energy stated it is committed to stronger predictive forecasting capability in its CBRM programs and investment in network monitoring and data collection. However, EMCa observed that repex program levels and timings do not seem to result from the application of a CBRM methodology. Rather, there is evidence Ergon Energy plans these programs to occur within regulatory control periods without explicit justification
180 EMCa, Review Ergon Energy's Proposed Augex and Repex, April 2015, p. iii.181 EMCa, Review Ergon Energy's Proposed Augex and Repex, April 2015, pp. 13–14.182 EMCa, Review Ergon Energy's Proposed Augex and Repex, April 2015, pp. 33–37.183 EMCa, Review Ergon Energy's Proposed Augex and Repex, April 2015, pp. 14–16.
79 Attachment 6 – Capital expenditure | Ergon Energy determination 2015–20

for those timing assumptions. EMCa considered this does not reflect sound engineering and asset management practices. Further, this tends to undermine the credibility of claims regarding expenditure drivers and risk-based prioritisation.184 EMCa was therefore concerned about the stability of the application of Ergon Energy's repex forecasting methodologies, given the step changes coinciding with regulatory control periods and programs of work 'shoe-horned' into regulatory cycles.185
A summary of EMCa's findings on specific programs is presented in Table B.6 below. We consider EMCa's findings support the outcomes of our overall assessment which is that a lower amount of repex than Ergon Energy's proposed amount is more likely to contribute to a prudent and efficient amount of total forecast capex for the 2015–20 regulatory control period.
Table B.6 EMCa review of asset replacement programs
Asset category EMCa's consideration
PolesEMCa infer that reductions in forecast expenditure reflect a change in strategy following consideration of the current level of risk and performance of this asset category. EMCa did not identify any systemic issues with the poles category.
Pole top structuresEMCa considers the development of a targeted program to manage sub-transmission pole tops is reasonable. However, EMCa considers there was insufficient analysis provided by Ergon Energy to conclude that the proposed program reflects optimal timing, volume and cost.
Overhead conductor
EMCa expressed reservations about the completeness of Ergon Energy's analysis supporting its overhead conductor program and considered the justification for the forecast repex was not proven. However, EMCa considered the focus of the program due to the associated elevated risk was consistent with industry practice.
TransformersThere was evidence of application of CBRM methodologies however there was insufficient justification to support the proposed repex forecast.
SwitchgearThere was evidence of application of CBRM methodologies however there was insufficient analysis to support the proposed repex forecast.
Service Lines
There was insufficient demonstration of a needs based assessment of the proposed forecast. The assumptions Ergon Energy applied have resulted in an inflated forecast for particular replacement programs within the category. There is evidence of conservative risk assessments with a bias to including projects and programs that may otherwise have been reviewed as a consequence of a more rigorous top down challenge process.
Underground cables
EMCa did not identify any systemic issues in its review of the underground cables asset category.
SCADA network control and protection systems
Ergon Energy did not provide sufficient justification for the change in performance and risk levels for the proposed repex given the current age and condition of its protection relay population.
"Other"EMCa observed the forecast repex was broadly consistent with the historic averages. EMCa did not identify any systemic issue in its review of this asset category.
Source EMCa, Review of Proposed Network Augmentation and Replacement Expenditure in Ergon’s Regulatory
Proposal 2015−20, April 2015, pp. 72–86.
184 EMCa, Review Ergon Energy's Proposed Augex and Repex, April 2015, pp. 16–17.185 EMCa, Review Ergon Energy's Proposed Augex and Repex, April 2015, p. 37.
80 Attachment 6 – Capital expenditure | Ergon Energy determination 2015–20

Un-modelled repex
As noted in appendix E, repex categorised as: supervisory control and data acquisition (SCADA), network control and protection (collectively referred to hereafter as SCADA); Pole top structures; and "Other" in Ergon Energy's RIN response was not included in the repex model.
We did not consider these asset groups were suitable for inclusion in the model, either because of lack of commonality, or because we did not possess sufficient data to include them in the model (see appendix E below). Together, these categories of repex account for 34 per cent of Ergon Energy's proposed repex.
Because we are not in a position to directly use predictive modelling for these asset categories, we have placed more weight on trend analysis and EMCa's findings in relation to these categories. Our analysis of these categories of proposed repex is set out below.
SCADA, network control and protection
Ergon Energy has proposed repex of $163 million for SCADA, network control and protection (referred to as SCADA). This represents a 30 per cent increase over the 2010–15 regulatory control period, or $37 million.
Ergon Energy's expenditure on SCADA remained relatively constant over the 2010–15 regulatory control period. Ergon Energy's proposal for the next period has:
a step increase in repex over the first two years of the 2015–20 regulatory control period
repex over the remaining three years similar to, but slightly higher than, the average repex in the category incurred in the 2010–15 regulatory control period.
Ergon Energy identified a need for repex to address its aging protection relay asset population. However, EMCa raised concerns with the application of the risk assessment framework supporting the replacement program, considering there was a potential overestimation of risk. EMCa concluded Ergon Energy did not provide sufficient justification for the change in performance and risk levels for the proposed repex given the current age and condition of its protection relay population.186
In reaching our view on Ergon Energy's SCADA, we have considered EMCa's specific views on SCADA, and EMCa's overall views on systemic issues with Ergon Energy's forecasting approach and its assessment of risk. Taking all of this and other information before us into account, we see no justification for the step change proposed by Ergon Energy. As Ergon Energy has not established the need for a step increase in expenditure for these assets, we consider Ergon Energy's historical repex from last period of $126 million is likely to reasonably reflect the capex criteria and have included this amount in our alternative estimate of total forecast capex.
Pole top structures
186 EMCa, Review Ergon Energy's Proposed Augex and Repex, April 2015, pp. 82–83.
81 Attachment 6 – Capital expenditure | Ergon Energy determination 2015–20

Ergon Energy has forecast $103 million of repex on pole top structures over the 2015–20 regulatory control period. This represents a 69 per cent increase over the 2010–15 regulatory control period, or $42 million.
Ergon Energy's expenditure on pole top structures remained relatively constant over the 2010–15 regulatory control period. Ergon Energy's proposal for the next period has a step increase in repex that remains at a constant higher level over the 2015–20 regulatory control period. EMCa observed that the increase is attributed to Ergon Energy's proposed sub-transmission line pole top replacement program. On the basis of improved data from its asset inspection and defect management program, Ergon Energy determined it was imprudent to continue its line rebuild projects. Instead, Ergon Energy proposes to expand its pole-top replacement program in its place.187
EMCa stated that Ergon Energy's proposed pole top replacement program appears to be based on subjective assessments, and no sensitivity analysis or risk assessment was provided. EMCa also observed that, in contrast with Ergon Energy's strategy of moving to condition based monitoring, Ergon Energy stated it does not record and monitor pole top condition. EMCa considered the development of a targeted program to manage sub-transmission pole tops is reasonable. However, EMCa considered there was insufficient analysis provided by Ergon Energy to conclude that the proposed program reflects optimal timing, volume and cost.188
In reaching our view on Ergon Energy's pole top structures, we have considered EMCa's specific views on pole top structures, and EMCa's overall views on systemic issues with Ergon Energy's forecasting approach and assessment of risk, as well as the information provided by Ergon Energy. We do not consider there is sufficient justification to support the significant step change proposed by Ergon Energy. We consider Ergon Energy's pole top repex from last period of $61 million is likely to reflect the capex criteria and have included this amount in our alternative estimate of total forecast capex.
Other repex
Ergon Energy categorised a number of assets under an "Other" asset group in its RIN response. Ergon Energy forecast $38 million of repex for these assets for the 2015–20 regulatory control period. This represents a five per cent increase over the 2010–15 regulatory control period, or $2 million. The assets include:
capacitor banks
current transformers
static var compensators
voltage transformers.
EMCa observed the forecast repex was broadly consistent with the historic averages with the exception of 2017–18 which is dominated by expenditure for a single project for replacement of a static var compensator. EMCa did not identify any systemic issue
187 EMCa, Review Ergon Energy's Proposed Augex and Repex, April 2015, p. 83–85.188 EMCa, Review Ergon Energy's Proposed Augex and Repex, April 2015, p. 83–85.
82 Attachment 6 – Capital expenditure | Ergon Energy determination 2015–20

in its review of this asset category.189 We consider Ergon Energy's forecast repex of $38 million is likely to reflect the capex criteria and have included this amount in our alternative estimate of total forecast capex.
Network health indicators
We consider an important determinant of variations in repex levels over time is the condition of network assets. We expect service providers will have regard to the condition of its network assets when forecasting the capex it requires to maintain the quality, reliability and security of supply.190
Our trend analysis indicates that Ergon Energy is forecasting an increase to its recent repex requirements for the 2015−20 regulatory control period. We would expect that this increase would reflect a deterioration in the condition of its network assets in recent years and/or Ergon Energy's age profile which may suggest a need for increases in asset replacement.
To inform our understanding of the condition of Ergon Energy's network assets, we have considered the following high level indicators of network health:
trends in the remaining service life of Ergon Energy's network assets
trends in the utilisation of network assets (with lower (higher) asset utilisation in certain asset classes correlating to lower (higher) rates of asset deterioration).
Trends in the remaining service life of network assets
Figure B.6 plots the estimated residual service life of Ergon Energy's network assets across time.
Figure B.6 Ergon Energy estimated residual service life by asset class
0
10
20
30
40
50
60
2005-06 2006-07 2007-08 2008-09 2009-10 2010-11 2011-12 2012-13 2013-14 2014-15 2015-16 2016-17 2017-18 2018-19 2019-20
Asset lives -estimated residual service life(years)
Overhead network assets less than 33kV (wires and poles) Underground network assets less than 33kV (cables)
Distribution substations including transformers Overhead network assets 33kV and above (wires and towers / poles etc)
Underground network assets 33kV and above (cables, ducts etc) Zone substations and transformers
189 EMCa, Review Ergon Energy's Proposed Augex and Repex, April 2015, p. 85.190 NER, cl. 6.5.7(c) & (a).
83 Attachment 6 – Capital expenditure | Ergon Energy determination 2015–20

Source: Ergon Energy - EBT RIN - 4. Assets (RAB) - Table 4.4.2 Asset Lives – estimated residual service life
(Standard control services).
Figure B.6 shows that Ergon Energy's residual asset lives have been stable since 2006 (with the exception of the estimate year) and is forecast to remain relatively stable, albeit with slight downward trend through the 2015−20 regulatory control period for some asset categories.
We acknowledge limitations exist when using estimated residual service life to indicate the trend in the underlying condition of network assets. In particular, we are mindful that increases in growth related capex relative to repex can distort this measure's effectiveness as a proxy of the trend in the existing network asset's condition. That is, if additions to the asset base are of a higher value than those being replaced the residual service life will improve without necessarily addressing any underlying asset condition deterioration. However, the stability in the trend in residual lives (where age is a proxy for asset condition) does not suggest that there are asset health issues that require increases in repex that Ergon Energy has proposed.
Asset utilisation
Another indicator of asset health we consider can impact asset condition is the degree of utilisation of certain types of network assets. As set out in the analysis of augex above, we note Ergon Energy has experienced a steady decrease in utilisation levels at its zone substations and HV feeders between 2009−10 and 2013−14 We are satisfied this demonstrates that Ergon Energy's network has significant spare capacity in its network based on past investments to meet expected demand that did not eventuate and due to the higher security standards required under the Distribution Authority. All else being equal we expect a positive correlation between asset condition and lower network utilisation exists for certain asset classes.
This relationship is evidenced in the design standards for all distributors. However we recognise that:
The relationship between asset utilisation and condition is not uniform between asset types. For example; poles and fuses.
The relationship is not necessarily linear (e.g. condition may not be materially impacted until a threshold point is reached).
The condition of the asset may be difficult to determine (e.g. overhead conductor). As such early-life asset failures may be due to utilisation or, more commonly, a combination of factors (e.g. utilisation and vibration).
Table B.7 below describes our view regarding the general relationship between an asset type's utilisation and its condition and major asset classes.
Table B.7 Utilisation and asset deterioration by asset type
Asset type Generalised observation
84 Attachment 6 – Capital expenditure | Ergon Energy determination 2015–20

Poles and pole-top structures Generally not impacted by electrical utilisation.
Overhead conductors
Impacted by high levels of electrical utilisation. Low and moderate utilisation will have a minimal impact on condition, while increasing utilisation above design standards will have a compounding impact on condition. Conductors that have been historically overloaded may exhibit reduced tensile strength and increased brittleness and therefore be more prone to conductor failure.
Underground Cables
Impacted by high levels of electrical utilisation. Low and moderate utilisation will have a minimal impact on condition, while increasing utilisation above design standards will have a compounding impact on condition. Underground cables that have been historically overloaded may exhibit overheating and therefore be more prone to conductor failure through joint failure or insulation failure.
Transformers
Impacted by high levels of electrical utilisation. Low and moderate utilisation will have a minimal impact on condition, while increasing utilisation above design standards will have a compounding impact on condition. High levels of utilisation can result in failure of the insulating materials and a short-circuit.
Switchgear
Impacted by electrical load and by duty cycle. All utilisation can impact condition (where utilisation is measured as both the number of operations and the load made or broken when operated). Typically operation of the unit will result in degradation of the contact surfaces. Both the duty cycle and the electrical current that is connected/interrupted will impact condition.
Non-network assets Generally not impacted by electrical utilisation.
Source: AER analysis.
We do note that high levels of utilisation can occur through many practices. Even for assets that are generally lightly loaded, emergency and switching conditions can introduce short term levels of utilisation that may impact the condition of the asset. In general, a lightly loaded network will also be less subject to overload conditions from emergency and switching conditions.
Consistent with the trend in residual service life we consider utilisation on Ergon Energy's network should not have had a material impact on the deterioration of network assets in recent years. Further, we note falls in the value of customer reliability, with all else being equal should result in deferral of repex that previously would have resulted from increases in asset utilisation.191
These observations are of a general nature. They support our view that there is a need for a more detailed review using our other assessment techniques to ascertain the efficient and prudent amount of total proposed repex.
B.5 AER findings and estimates for capitalised overheads
Capitalised overheads are costs associated with capital works that have been capitalised in accordance with Ergon Energy's capitalisation policy. They are generally costs shared across different assets and cost centres.
191 AEMO, Value of Customer Reliability final report, 27 November 2014.
85 Attachment 6 – Capital expenditure | Ergon Energy determination 2015–20

B.5.1 Position
We do not accept do not accept Ergon Energy's proposed capitalised overheads. We have instead included in our alternative estimate of overall total capex and amount of $961.8 million ($2013−14) for capitalised overheads. This is 5 per cent lower than Ergon Energy's proposal of $1017. We are satisfied that this amount reasonably reflects the capex criteria.
B.5.2 Our assessment
As a logical proposition we consider that reductions in Ergon Energy's forecast expenditure should see some reduction in the size of Ergon Energy's total overheads. Given that our assessment of Ergon Energy's proposed direct capex, demonstrates that a prudent and efficient distributor would not undertake the full range of direct expenditure contained in Ergon Energy's revised proposal. It follows that we would expect some reduction in the size of Ergon Energy's capitalised overheads. We do accept that some of these costs are relatively fixed in the short term and so are not correlated to the size of the expenditure program. However, we maintain that a portion of the overheads should vary in relation to the size of the expenditure.
We have engaged with Ergon Energy regarding its overheads.192 We sought to understand how overheads vary with the size of Ergon Energy's expenditure program and in particular to quantify the proportion of overheads that are fixed and varied. Ergon Energy submitted that:193
The majority of overhead costs are labour related (approximately 75 per cent of the overhead pool is labour) and considered fixed in the short term. While in the longer term these may be considered variable in nature, the majority of these costs increase or decrease in step changes as the programme increases or decreases.
…
Other costs in the overhead pool that would be considered fixed include property costs and ICT costs where assets are owned or licence agreements span multiple years (approximately 12 per cent of overhead pool). This leaves approximately 13 per cent of the overhead pool that is variable in the short term.
Further Ergon Energy submitted that:194
by way of example a $10m decrease in the direct cost of capex would see approximately $4m of overhead flow back to the pool and be re-allocated with approximately $2.4m returning to capex and $1.6m adding to opex. If we assumed 13 per cent of the $4m is variable in the short term and is reduced in proportion to the direct cost reduction then $2.1m would return to capex and $1.4m would add to opex. Please note, this example assumes that the
192 AER, Information request Ergon 063193 Ergon, Response to information request Ergon 063194 Energex's response to EGX 050; and Info request Ergon 063.
86 Attachment 6 – Capital expenditure | Ergon Energy determination 2015–20

reduction in direct capex has no impact itself on direct opex costs (e.g. as a result of increased maintenance costs).
We have considered the relationship between opex and capex—specifically whether it is necessary to account for the way the CAM allocates overheads between capex and opex in making this decision. We considered that this was not necessary in order to satisfy the capex criteria. This is because:
our opex assessment sets the efficient level of opex inclusive of overheads and so has accounted for the efficient level of overheads required to deliver the opex program by applying techniques which utilise the best available data and information for opex.
the starting point of our capitalised overheads assessment is Ergon Energy's proposal, which is based on their CAM. As such, Ergon Energy’s forecast application of the CAM underlies our estimate. We have only reduced the capitalised overheads to account for the reduced scale of Ergon Energy’s approved capex based on assessment techniques best suited to each of the capex drivers. In doing so we have accounted for there being a fixed proportion of capitalised overheads.
We have formed our alternative estimate on the basis of the information provided by Ergon Energy. On this basis we consider that a $1.0 million reduction in Ergon Energy's forecast capex should result in a $0.05 million reduction in Ergon Energy's capitalised overheads. As a result of a $1106 million ($2013−14) reduction in Ergon Energy's direct capex that attract overheads we consider a reduction of $55.3 million ($2013−14) in capitalised overheads reasonably reflect the capex criteria.
SPARQ ICT expenditure included within overheads
In this preliminary decision, we have included in our alternative estimate the forecast expenditure for ICT overheads as proposed by Ergon Energy, adjusted to reflect the lower direct costs. We accept this expenditure because we do not have any firm evidence that this expenditure is not prudent or efficient given a realistic expectation of demand and cost inputs.
However, our assessment of Ergon Energy's proposed ICT expenditure has revealed some areas of concern. These include that Ergon Energy:
proposed using 2012−13 as the base year for forecasting 'operational support' and the 'telecommunications pass through' costs which does not capture the efficiencies identified by the Independent Review Panel on Network Costs (the Panel) and ITNewcom (SPARQ's consultant);
is over-recovering the financing costs which SPARQ charges to Ergon Energy, via the asset services fee. The over-recovery is due to Ergon Energy proposing to apply a significantly higher return on capital (WACC) than we have forecast in our preliminary decision. There is also potential for over- and under-recovery in the future as the WACC is not constant through the regulatory period with annual updating of the cost of debt;
87 Attachment 6 – Capital expenditure | Ergon Energy determination 2015–20

is relying on SPARQ ICT costs, the majority of which have not been market tested and there is evidence to suggest that there is further scope for efficiencies through reforms to the arrangements between Ergon Energy and SPARQ.
is not transparently reporting its ICT costs. We consider that Ergon Energy's ICT should be reported within 'overheads' rather than in 'non-network IT'. We also consider that the off-balance sheet arrangement with SPARQ lacks transparency which hinders our ability to assess and track Ergon Energy' ICT expenditure across regulatory periods.
These issues are material given the amount of expenditure proposed by Ergon Energy for ICT costs. We expect Ergon Energy to address these issues in its revised proposal.
2012−13 base year
We note that Ergon Energy applied a 'base-step-trend approach' to forecasting 'operational support' and the 'telecommunications pass through' costs. It used 2012−13 as the base year. We note that this year has the highest expenditure for the current regulatory control period. There is an unexplained step up in 2014−15 of 11.9 per cent from the 2012−13 base year amount of $33.5 million, before an annual average decline in the base of 2.5 per cent over the 2015−20 regulatory control period.195 The decline in the base over this period is more than offset by a significant step change proposed for the increased operational support for the 2014−15 program of work.196 We consider that the savings measures that have been suggested by SPARQ's consultants, as well as those recommended by the Independent Review Panel on Network Costs (the Panel), could be expected to have a cost decrease rather than the increase proposed by Ergon Energy on the 2012−13 base year level of expenditure.
At this stage, we have not been able to confirm this to our satisfaction or quantify any possible efficiencies but we note that such efficiencies, if achievable, would be broadly consistent with KPMG's NEM-wide findings. We expect that Ergon Energy will evaluate the possibility of achieving efficiencies in preparing its revised proposal. We will be further reviewing this expenditure as part of our final decision.
Over-recovery of financing costs
We also note that Ergon Energy may wish to reconsider its reporting approach as it may have implications for the over- or under- recovery of expenditure relating to the asset services fee. Ergon Energy proposed applying a significantly higher WACC than our forecast for calculating the finance costs for the assets held by SPARQ for the 2015−20 regulatory control period (and these costs are passed through to Ergon as part of the asset services fee).197 This will result in a material over recovery in 2015−16 and is likely to be increasingly material over the rest of the regulatory period. We will give further consideration to the implications of Ergon Energy reporting approach and consequently, the possible inclusion of the SPARQ assets in the RAB.
195 Ergon Energy, Regulatory proposal, Appendix 07.00.07AER2015-2020 EE ICTPlan.pdf, p.15 and Table 4, p.15.196 Ergon Energy, Regulatory proposal, Appendix 07.00.07AER2015-2020 EE ICTPlan.pdf, Table 4, p.15.197 Ergon Energy, Response to information request AER Ergon 44, received 10 February 2015, p.1.
88 Attachment 6 – Capital expenditure | Ergon Energy determination 2015–20

In turn, this may impact upon our consideration of Ergon Energy's revised proposal, as explained below.
We note that 34 per cent of Ergon Energy's proposed $1,017.1 million ($2014−15) total capitalised overheads, is attributable to information, communications and technology (ICT) services.198 Energex and Ergon Energy have a 50 per cent shareholding each in SPARQ Solutions Pty Ltd (SPARQ). SPARQ provides ICT services to Energex and Ergon Energy. The total ICT service cost is allocated between alternate control services and standard control services overheads (and then between opex and capex overheads) in proportion to the relative direct expenditure.199
SPARQ's forecast of ICT total expenditure for Ergon Energy consists of:200
Asset service fees ($211.5 million)—this fee consists of SPARQ's finance and depreciation charge for Ergon Energy's consumption of the ICT assets held by SPARQ.
Service level agreement ($242.1 million)—for SPARQ's costs associated with the on-going operation, support and maintenance of ICT services.
Telecommunications ($56.1 million)—for the costs of carrier, mobile, data, voice and device management services
Non-capital project expenditure ($23.5 million)—for non-recurrent opex reflecting the ICT specific expenses which cannot be capitalised.
Sixty five per cent, or $344.3 million, of SPARQ's total ICT expenditure for Ergon Energy is capitalised.
We note KPMG surveyed 10 distributors, including Energex and Ergon Energy, across four states in Australia, benchmarking the distributors' ICT expenditure and activities.201 KPMG found that for 2012−13 on average the surveyed businesses spent:202
7 per cent of total opex and capex on non-network ICT.203
4.48 per cent of total capex on non-network ICT.204
198 Ergon Energy, Regulatory proposal, October 2014, Att. 0C020101 QLD - RESET RIN 2015-20 - Consolidated Information Confidential Claim.xlsx, tab'2.10 Overheads'.
199 This is as per Ergon Energy's Cost Allocation Methodology.200 Ergon Energy, Regulatory proposal, October 2014, Appendix 07.00.07AER2015-2020 EE ICTPlan.pdf, Table 2,
p.13.201 SA Power Networks, Regulatory proposal, Attachment 20.31 KPMG Independent Prudence and Efficiency
Review, p. 68.202 SA Power Networks, Regulatory proposal, Attachment 20.31 KPMG Independent Prudence and Efficiency
Review, p. 70. 203 SA Power Networks, Regulatory proposal, Attachment 20.31 KPMG Independent Prudence and Efficiency
Review, pp. 22,70. 204 KPMG defines non-network ICT capex as 'Actual capital expenditure of non-network (non-system) IT and
communications directly attributable to the replacement, installation and maintenance of IT and communication systems for Standard Control Services (excluding SCADA and network control systems)' [SA Power Networks, Response to AER SAPN 023 IT - Q2 - KPMG Non-Network IT and Communications Benchmarking.pdf, p.6. The AER RIN definition is documented below.
89 Attachment 6 – Capital expenditure | Ergon Energy determination 2015–20

Applying the benchmark of 4.48 per cent to our substitute capex forecast yields an ICT capex forecast of $146.2 million for Ergon Energy. This is 61 per cent below Ergon Energy's forecast ICT capex of $370.1 million205.
In addition to this benchmarking observation, we have the following concerns regarding Ergon Energy's proposed expenditure:
SPARQ is a related party and its costs are not market tested; and
Ergon Energy's reporting approach to its ICT expenditure lacks complete transparency and leads to over- and under- cost recovery.
We consider each of these points below.
SPARQ's costs are not market tested
We are concerned that the SPARQ ICT costs have not been market tested. We have no evidence that this arrangement does not reflect arm's length terms but the following information does provide a starting point for further consideration at the time of our final decision. Deloitte, in reviewing the SPARQ arrangement for us, noted that:206
… ICT costs are a material source of inefficiency within Energex’s and Ergon Energy’s opex … and we estimate that so far only 4 per cent of SPARQ’s costs which were passed through to Energex and Ergon Energy in 2013−14 have been market-tested). There appear to be material savings to be made from further reforms to the relationship between the DNSPs and SPARQ, and improvements to the distributors' ICT systems, processes and use of the market.
The Independent Review Panel on Network Costs (the Panel) was established by the Queensland Government to develop options to address the impact of network costs on electricity prices in Queensland.207 The Panel assessed Energex and Ergon Energy's essential capabilities, processes and outcomes against industry benchmarks.208
In relation to overheads more generally, the Panel found that:209
[t]he overhead expense … of Ergon Energy and Energex is more than $1 billion annually [and] … has grown rapidly in recent years and places the Queensland DNSPs among the least efficient in the NEM.
The three NSPs have all commenced programs to improve the efficiency of their operations and reduce both indirect and direct costs. The Panel acknowledges that these programs will yield results but believes that additional
205 The $370.1 million consists of the $344.3 million SPARQ ICT cost included in overheads and the $25.8 million included in non-network IT for client devices.
206 Deloitte Access Economics, Queensland Distribution Network Service Providers - Opex Performance Analysis, March 2015, p.xii; Ergon Energy, Email ‘RE: TRIM: AER Ergon 24 - follow up to SPARQ discussion [SEC=UNCLASSIFIED]’, received 24 April 2015: AER Ergon024 Confidential SPARQ Followup Response to AER 006.pdf, question 1, p.1.
207 Independent Review Panel on Network Costs, Electricity Network Costs Review, Final Report, p. 107.208 Independent Review Panel on Network Costs, Electricity Network Costs Review, Final Report, p. 107.209 Independent Review Panel on Network Costs, Electricity Network Costs Review, Final Report, p. vii.
90 Attachment 6 – Capital expenditure | Ergon Energy determination 2015–20

impetus is needed to produce the level of savings required to restore affordability for customers.
Five of the Panel's 45 recommendations (Recommendations 12 to 16) relate to Energex and Ergon Energy's ICT:210
Return the role of the Office of the Chief Information Officer to each of the distributors and SPARQ Solutions focus on its role as a service provider to the distributors. [Recommendation 12]
Each of the distributors reassess its ICT capex priorities and focus on the prudent capex required to maintain its core distribution business activities (including regulatory compliance and safety obligations). [Recommendation 13]
In addition to the cost savings already identified by SPARQ Solutions, further efficiencies should be achieved through actions such as:
o Streamlining the testing process through the adoption of an automated testing tool;
o Developing a common set of automated financial and management reports for the distributors; and
o Reviewing existing system contracts to reduce user licence costs in line with future staffing levels within SPARQ Solutions and the distributors. [Recommendation 14]
Alternative service delivery models for Information and Communication Technology services currently delivered by SPARQ Solutions should be tested as follows:
o issue market tenders for the delivery of capital projects; and
o issue market tenders for the delivery of the relevant operational Information Communication and Technology services. [Recommendation 15]
Implement an integrated operating model that consolidates the Planning and Partnering positions within distributors to minimise the number of touch points between SPARQ Solutions and the distributors. [Recommendation 16]
The Panel stated that one of the objectives in forming SPARQ was to realise cost savings through the joint delivery of projects to Energex and Ergon Energy.211 However, the Panel submitted that there 'has been very limited delivery of joint projects to date'.212 It also noted that there is '[i]ncongruent ICT strategic planning between Ergon Energy and Energex' and that there were 'few instances where the DNSPs have chosen to work together to minimise ICT capital costs'.213 In relation to this the Panel recommend changes to governance.214 The Panel stated that it 'considers that the services currently provided by SPARQ may be delivered more efficiently by external
210 Independent Review Panel on Network Costs, Electricity Network Costs Review, Final Report, pp. x−xi.211 Independent Review Panel on Network Costs, Electricity Network Costs Review, Final Report, p. 54.212 Independent Review Panel on Network Costs, Electricity Network Costs Review, Final Report, p. 54.213 Independent Review Panel on Network Costs, Electricity Network Costs Review, Final Report, p. 54.214 Independent Review Panel on Network Costs, Electricity Network Costs Review, Final Report, p. 54.
91 Attachment 6 – Capital expenditure | Ergon Energy determination 2015–20

service providers'.215 It recommended that Energex and Ergon Energy test the provision of these services by competitive tender.216
We note that there have been some changes implemented since the Panel’s final report. This includes the formation of an ICT Panel which is managed by SPARQ. However, we consider that the reforms undertaken to date do not fully reflect the IRP recommendations and have not yet significantly increased competitive pressures on SPARQ. We note that the ICT panel established by SPARQ is for tendering capital works projects, not ICT commodity services.217 We therefore consider that SPARQ’s service provision is not actually market-test, as was recommended by the Panel.
ITNewcom, engaged by SPARQ in 2013, partially identified the magnitude of savings that could be realised through outsourcing. For the costs it examined, it found that there was potential to realise significantly greater cost reductions by outsourcing.218 We note that ITNewcom only made recommendations in relation to application and infrastructure services.219 No recommendations relating to telecommunications, Data centre and Service Desk costs were made.
Ergon Energy's reporting approach
Ergon Energy should consider increasing the transparency by adopting the approach outlined below or otherwise provide us with information as to the trend in actual ICT capex as incurred by SPARQ as part of its revised proposal.
We consider that Ergon Energy has not correctly captured the SPARQ costs in reporting its ICT costs as overheads expenditure. We consider that the SPARQ costs would most accurately and transparently be captured as 'Non-Network—IT & Communications Expenditure'. By definition this is 'all non-network expenditure directly attributable to IT and communications assets including replacement, installation, operation, maintenance, licensing, and leasing costs but excluding all costs associated with SCADA and Network Control Expenditure that exist beyond gateway devices (routers, bridges etc.) at corporate offices'.220 Capturing the ICT costs as non-network costs would provide for consistent comparison against other businesses and for comparison of the business' own-trend expenditure.
In addition, we note that the off balance sheet treatment of ICT expenditure by Energex and Ergon Energy means that it is difficult to assess the trend in actual ICT capex, as incurred by SPARQ. We are presented with an asset services fee, which reflects a combination of depreciation from ICT capex incurred in past regulatory periods, 215 Independent Review Panel on Network Costs, Electricity Network Costs Review, Final Report, p. 54.216 Independent Review Panel on Network Costs, Electricity Network Costs Review, Final Report, p. 54.217 Ergon Energy, Email ‘RE: TRIM: AER Ergon 24 - follow up to SPARQ discussion [SEC=UNCLASSIFIED]’,
received 24 April 2015: AER Ergon024 Confidential SPARQ Followup Response to AER 006.pdf, question 1, p.2; AER Ergon024 SPARQ Confidential Attachment.pdf, pp.6, 10
218 Ergon Energy, Email ‘RE: TRIM: AER Ergon 24 - follow up to SPARQ discussion [SEC=UNCLASSIFIED]’, received 24 April 2015: AER_Ergon024_Confidential_SPARQ_Followup_Response_to_AER_006.pdf, p.2; AER_Ergon024_SPARQ_Confidential Attachment, p.9.
219 Ergon Energy, Email ‘RE: TRIM: AER Ergon 24 - follow up to SPARQ discussion [SEC=UNCLASSIFIED]’, received 24 April 2015: AER_Ergon024_Confidential_SPARQ_Followup_Response_to_AER_006.pdf, p.2; AER_Ergon024_SPARQ_Confidential Attachment, pp.7-8.
220 AER, Regulatory Information Notice, issued 25 August 2014, p. 105.
92 Attachment 6 – Capital expenditure | Ergon Energy determination 2015–20

depreciation from ICT capex proposed for the 2015−18 regulatory period, plus finance costs for the residual ICT asset value from past and proposed expenditure.
By contrast, if these respective ICT assets were reflected in Energex and Ergon Energy's regulatory asset balance (RAB), this would lead to greater transparency. We consider that this would be possible because SPARQ is a joint operation of Energex and Ergon Energy. We understand that Energex and Ergon Energy have rights to the assets of SPARQ and obligations for the liabilities. In particular, Energex and Ergon have rights to substantially all of the economic benefits of SPARQ as they are its only customers. SPARQ also relies upon Energex and Ergon Energy for the settling of its liabilities, and the funding required for working capital as well as asset loans. Hence, this arrangement should be directly translated to Energex and Ergon Energy's respective RAB for regulatory assessment purposes.
The other reason that Ergon Energy may wish to reconsider its reporting approach is that this arrangement has implications for the over- or under- recovery of expenditure. This may impact upon our consideration of its revised proposal, as explained below.
Ergon Energy proposed applying a significantly higher WACC than that in our preliminary decision for calculating the finance costs for the assets held by SPARQ for the 2015−20 regulatory control period (where these costs are passed through to Ergon Energy as part of the asset services fee).221
However, this is likely to result in over- or under- recovery of the return on the SPARQ ICT assets. A mismatch is created between the rate of return that would have applied if the asset was recognised directly in the Ergon Energy RAB and that which is applied under the SPARQ ICT asset loan agreement. That is, the finance 'cost pass through' to Ergon Energy by SPARQ as part of the asset services fee. The mismatch is created because:
the WACC will update annually under the application of our cost of debt approach (see attachment 3). That is, it will not be static across the regulatory control period.
we have proposed a different WACC to that proposed by Ergon Energy. We have calculated an initial WACC of 5.85 per cent—significantly lower than the WACC Ergon Energy proposed to be applied by SPARQ.
Given the magnitude of the ICT costs, the over and under-recovery is material in 2015−16 and likely to be increasingly material as the regulatory period progresses.
A further mismatch is presented where there is a difference between the depreciation rate assumed by SPARQ and that assumed by Ergon Energy.
There is no reason to suggest that the over and under-recoveries will be symmetrical over time.
B.6 AER findings and estimates for non-network capex
221 Ergon Energy, Response to information request AER Ergon 44, received 10 February 2015, p. 1.
93 Attachment 6 – Capital expenditure | Ergon Energy determination 2015–20

Non-network capex includes expenditure on information technology (IT),222 buildings and property, motor vehicles (fleet), and plant and equipment.
B.6.1 Position
Ergon Energy forecast total non-network capex for the 2015–20 regulatory control period of $506.3 million ($2014−5) excluding overheads.223 We do not accept Ergon Energy's proposal. We have instead included an amount of $420.3 million ($2014−15) for forecast non-network capex in our alternative estimate which we consider reasonably reflects the capex criteria.
In coming to this view, we have found that:
Ergon Energy's forecast non-network buildings and property capex of $231.5 million ($2014−15) does not reflect the efficient costs of a prudent operator. We are not satisfied that the major property project proposed for Townsville is sufficiently justified or would necessarily be undertaken by a prudent and efficient operator in the 2015–20 regulatory control period.
Ergon Energy's forecast fleet capex does not reasonably reflect the efficient costs that a prudent operator would require to meet the capex criteria. We consider that forecast capex of $160.0 million ($2014−15) reasonably reflects the required expenditure. This represents a reduction of 21.5 per cent from Ergon Energy's proposed fleet capex for the 2015–20 regulatory control period and is in line with its fleet service requirements and operational employee numbers.
B.6.2 Ergon Energy's proposal
Figure B.7 shows Ergon Energy's actual and expected non-network capex for the period from 2001−02 to 2014−15, and forecast capex for the 2015–20 regulatory control period.
222 IT capex includes expenditure on multi-function devices, laptops and related equipment not provided by SPARQ.223 Ergon Energy, RIN response, template 2.6, October 2014.
94 Attachment 6 – Capital expenditure | Ergon Energy determination 2015–20

Figure B.7 Ergon Energy's non-network capex 2001−02 to 2019−20 ($million, 2014−15)
0
20
40
60
80
100
120
140
160
180
200
$ million 2014-15
Ergon Energy - Non-network capex
Source: Ergon Energy, Regulatory proposal, October 2014, pp. 90, 92 and 93. Includes overheads.
Ergon Energy's forecast non-network capex for the 2015–20 regulatory control period is nine per cent lower than actual and expected capex in the 2010–15 regulatory control period. The forecast reduction in non-network capex is less than Ergon Energy's forecast reduction in total capex of 14 per cent.224
Our analysis of long term trends suggests that Ergon Energy has forecast capex for this category at historically low levels, with the exception of the 2015−16 and 2016−17 years. Non-network capex is forecast to be lower in 2019−20 than in any year since 2003−04. However, non-network capex in 2015−16 is forecast to be higher than in any year of the 2010–15 regulatory control period. We therefore consider that Ergon Energy's forecast non-network capex program warrants further review to confirm the need for and timing of the proposed expenditure, with particular focus on the 2015−16 and 2016−17 years.
We have assessed forecast expenditure in each category of non-network capex. Analysis at this level has been used to inform our view of whether forecast capex is reasonable relative to historical rates of expenditure in each category, and to identify trends in the different category forecasts which may warrant further review.225 Figure B.8 shows Ergon Energy's actual and forecast non-network capex by sub-category for the period from 2008−09 to 2019−20.
224 Ergon Energy, Regulatory proposal, October 2014, p. 87.225 NER, cl. 6.5.7(e)(5).
95 Attachment 6 – Capital expenditure | Ergon Energy determination 2015–20

Figure B.8 Ergon Energy's non-network capex by category ($million, 2014−15)
0
10
20
30
40
50
60
70
80
90
100
2008-09 2009-10 2010-11 2011-12 2012-13 2013-14 2014-15 2015-16 2016-17 2017-18 2018-19 2019-20
$ million 2014-15
IT Fleet Buildings and property Plant and equipment
Source: Ergon Energy, Regulatory information notice, template 2.6; AER analysis. Excludes overheads.
Ergon Energy has forecast reductions in capex for the IT and plant and equipment categories in the 2015–20 regulatory control period. Expenditure in these categories is forecast to remain at historically low levels throughout the 2015–20 regulatory control period.
The Queensland Resources Council questioned the reasoning for Ergon Energy's forecast increase in non-network capex in the 2015−16 year.226 The significant spike in buildings and property capex in 2015−16, which continues in 2016−17, is driving the high level of non-network capex forecast for those years compared to later years of the 2015–20 regulatory control period. Ergon Energy has also forecast fleet capex to increase in the 2015−16 year, and then continue at historically high levels for the remainder of the 2015–20 regulatory control period. We therefore examined Ergon Energy's forecast buildings and property capex, as well as the fleet category, to confirm the need and timing of the forecast capex. Our conclusions on each of these categories of non-network capex are summarised below.
B.6.3 Buildings and property capex
Ergon Energy forecast capex of $231.5 million ($2014−15) for non-network buildings and property capex, excluding overheads.227 This includes capex for office furniture and equipment, as well as land and buildings. The forecast buildings and property
226 Queensland Resources Council, Submission to the AER, 30 January 2015, p. 7.227 Ergon Energy, Regulatory information notice, template 2,6; AER analysis.
96 Attachment 6 – Capital expenditure | Ergon Energy determination 2015–20

capex is at approximately the same level as actual and estimated capex in the 2010–15 regulatory control period.
Ergon Energy's buildings and property capex forecast is based on a bottom up approach to determining two programs of work: the major and minor programs of work, which align with its 'hub and spoke' model for non-network property sites.228
The major program of work accounts for capex of $123.0 million, the majority of Ergon Energy's forecast buildings and property expenditure. The major program is defined as including capital investments at Ergon Energy's major strategic locations (hubs) where the investment is greater than $5 million. Typically, major property projects are consolidated and delivered as a body of work across multiple financial years.229 In the 2015–20 regulatory control period, the major program includes investments at four sites:
South Street, Toowoomba
Searle Street, Maryborough
Garbutt, Townsville
Glenmore Road, Rockhampton.
The minor program of work captures all buildings and property capex not covered by the major program. It includes works performed at the 'spoke' depots in regional and remote locations. Typically, projects are delivered within one year, and are prioritised depending on asset need and risk.230
Ergon Energy has also included an individual property project to relocate its Rockhampton Operational Control Centre (OCC) and data centre to the redeveloped Glenmore Road site in Rockhampton. This is separate to the Glenmore Road redevelopment project proposed as part of the major program of work.
As discussed above, the profile of Ergon Energy's forecast non-network capex shows a spike in buildings and property capex in 2015−16, which continues in 2016−17. Ergon Energy's proposal recognised that a large percentage of buildings and property work is forecast towards the beginning of the 2015–20 regulatory control period. Ergon Energy submitted that this is due to a number of factors, including:231
two of the largest major projects at Townsville and Rockhampton are currently underway and scheduled to continue with further stages of development in the 2015–20 regulatory control period
the major property program shows large expenditures across a small number of sites, which influences the overall investment profile for non-network property capex
the time required to obtain shareholder approval for major investments (6 to 15 months) adds scheduling risk. Ergon Energy has therefore proposed that all
228 Ergon Energy, 07.08.24 - Property Services Capital Expenditure Forecast Overview, October 2014, p. 4.229 Ergon Energy, 07.08.24 - Property Services Capital Expenditure Forecast Overview, October 2014, pp. 4 and 6.230 Ergon Energy, 07.08.24 - Property Services Capital Expenditure Forecast Overview, October 2014, p. 13.231 Ergon Energy, 07.08.24 - Property Services Capital Expenditure Forecast Overview, October 2014, p. 5.
97 Attachment 6 – Capital expenditure | Ergon Energy determination 2015–20

major projects commence in the first two years of the 2015–20 regulatory control period to ensure any delays in project approval do not shift project delivery into subsequent regulatory periods.
We accept that the profile of Ergon Energy's buildings and property capex forecast is, to some extent, justified by the timing imperatives of specific projects. However, to the extent Ergon Energy has brought forward projects to address the scheduling risk associated with obtaining shareholder approvals, this has the effect of shifting the cost of this risk to consumers. We have therefore closely examined the need for and timing of property projects, in particular the proposed major projects, to ensure the program is prudent and efficient.
Major property projects
Ergon Energy has proposed four major property projects at Rockhampton, Townsville, Maryborough and Toowoomba.232 The major property projects are managed by Ergon Energy's Investment Review Committee through its incremental gated governance process. Ergon Energy identified a suite of documents which guide the overall management of the property portfolio, including its corporate property strategy, asset management plan, accommodation manual and business cases for individual projects.233 We examined the business cases and other supporting information submitted by Ergon Energy in support of the proposed major property projects, to assess whether they provided sufficient justification for the proposed expenditure.
In our view, the documentation submitted by Ergon Energy generally provided sufficient justification to support the need, costs and timing of the proposed projects. This documentation typically included, for each project:
a business case providing a description of the scope and need for investment, with supporting evidence relating to site assessments and condition reports
evidence that a suitable range of alternative options, including a 'do nothing' option, had been considered
evidence of a formal risk assessment performed as part of the options analysis process
evidence that tangible and intangible benefits have been identified and, where possible, quantified for all options considered
a comparison of the costs and benefits for each option considered
evidence of a financial analysis indicating that the highest NPV option has been selected, such that the preferred option is economically justified.
However, in assessing the proposed major project at Townsville, we found that while Ergon Energy had considered a 'do nothing' option of ongoing maintenance, it
232 Ergon Energy, 07.08.01 - Property Strategic Plan, 2014, pp. 6 and 7.233 Ergon Energy, 07.08.24 - Property Services Capital Expenditure Forecast Overview, October 2014, p. 9.
98 Attachment 6 – Capital expenditure | Ergon Energy determination 2015–20

excluded this option from its options ranking process.234 This contrasts to the options ranking process for other major projects.235
Ergon Energy's options rankings process is based on an assessment of the net present value (NPV) of each option considered. This takes into account the quantified costs and benefits of each option, including construction and lifecycle costs and realisable benefits such as revenue from related property disposals.236 The ranking of options by NPV provides evidence that the preferred option has the highest NPV of all options considered, and is therefore economically justified.
As noted above, Ergon Energy has excluded the 'do nothing' option as part of its options ranking process for the Townsville major property project.237 This is significant as, unlike the other major property projects proposed by Ergon Energy, the preferred option proposed for Townsville is not the highest NPV option. For this project, the 'do nothing' option (option E) is in fact the highest NPV option of all eight options evaluated.238 Ergon Energy's business case states that the do nothing option was assessed at earlier stages of the gated approval process, but was considered not to be prudent as it provided only a temporary resolution, resulting in larger costs at a later date.239 However, on the basis of Ergon Energy's 20 year NPV analysis of construction and lifecycle costs and benefits, this does not appear to be the case in present value terms.
In our view, it is not clear that the options evaluation process undertaken by Ergon Energy for the Townsville major property project necessarily supports the selection of the preferred option identified by Ergon Energy. We are therefore not satisfied that Ergon Energy's forecast capex for the Townsville property project is efficient, or that a prudent operator would necessarily proceed with Ergon Energy's preferred development option.
Further, we note that Ergon Energy's proposed Townsville project is stage two of the redevelopment of its Dalrymple Road depot in Garbutt. Stage one of the Garbutt redevelopment will be completed in the 2010–15 regulatory control period. In our view, in order to fully support the proposed stage two works in the 2015–20 regulatory control period, Ergon Energy's options analysis should be updated to consider the current development and 'do nothing' options assuming the successful completion of the stage one development. In this regard, we considered whether, leaving aside the concerns identified above, stage two of this project should proceed as an integral and necessary continuation of the stage one scope of work. In this regard, we note the advice provided by independent advisor Evans & Peck to Ergon Energy's Shareholding Ministers that:240
234 Ergon Energy, Garbutt Townsville_Assumptions and Calculations, Summary tab, row 20.235 For example, Ergon Energy, 07.08.31 South St Toowoomba Assumptions and Calculations, Summary tab, row
20.236 Ergon Energy, Garbutt Townsville_Assumptions and Calculations, NPVData tab.237 Ergon Energy, Garbutt Townsville_Assumptions and Calculations, Summary tab, row 20.238 Ergon Energy, Garbutt Townsville_Assumptions and Calculations, Summary tab, row 20.239 Ergon Energy, 07.08.13 Townsville Garbutt Redevelopment Part A G3, 15 January 2014, p. 13.240 Evans & Peck, 07.08.09 - Garbutt Site Redevelopment Review, May 2014, p. 5.
99 Attachment 6 – Capital expenditure | Ergon Energy determination 2015–20

Ergon Energy's Stage 1 redevelopment is a standalone improvement to its Garbutt property. It will improve efficiencies in logistics management, site safety through better traffic management and consolidation of staff into combined office accommodation. Stage 2 improves the workshops and completes the traffic management improvements. It is Evans & Peck's view that should the Stage 2 redevelopment not proceed, the Stage 1 redevelopment still achieves some of the improvements sought by Ergon Energy.
Ergon Energy's Shareholding Ministers provided approval to Ergon Energy to undertake stage one of the Garbutt redevelopment, but not stage two. The Shareholding Ministers conditionally approved stage two, subject to the confirmation of cost estimates and inclusion of the project in Ergon Energy's 2015–20 regulatory determination.241 We are therefore satisfied that stage two of the Garbutt redevelopment is not required to be completed as a necessary follow-on to the completion of stage one.
On this basis, and for the reasons discussed above, we consider that costs associated with the Garbutt redevelopment in Townsville should be excluded from the estimate of forecast capex for major property projects in the 2015–20 regulatory control period. We have included the costs of the remaining three major property projects in our estimate of forecast capex on the basis that, as noted above, Ergon Energy's regulatory proposal provides sufficient justification to support the need, timing and costs of these projects.
Minor property program
Ergon Energy forecast capex of $81.4 million ($2014−5) for its minor buildings and property program.242 The intent of the minor program of work is to ensure the portfolio of property assets remains fit for purpose by providing operationally efficient depots in a safe and responsible manner.
Ergon Energy has forecast the minor property program of work in two parts:
a series of specified location based projects founded upon a life cycle analysis of the non-network asset portfolio (making up approximately 80 per cent of the minor program)
several unspecified work categories based on historical trend.
Ergon Energy's forecast of minor property capex reflects a reduction of approximately 8 per cent from the 2010–15 regulatory control period.243
We reviewed Ergon Energy's forecasting methodology and governance arrangements for expenditure on minor property projects. Ergon Energy's portfolio of minor property works is optimised to target maximum benefit for minimal cost. This optimisation process produces the most efficient program of work for a given level of expenditure,
241 Ergon Energy, 07.08.10 - SHM Approval Gate 3 Townsville Garbutt 2014, 11 July 2014, p. 1.242 Ergon Energy, 07.08.24 - Property Services Capital Expenditure Forecast Overview, October 2014, p. 4.243 NER, cl. 6.5.7(e)(5).
100 Attachment 6 – Capital expenditure | Ergon Energy determination 2015–20

on the basis of an asset’s criticality, current condition and desired condition.244 Individual projects are subject to Ergon Energy's gated governance process.245
On the basis of our review of the business case for the minor property program,246 we are satisfied that Ergon Energy's forecast capex for minor property projects in the 2015–20 regulatory control period reasonably reflects the efficient costs of a prudent operator.
Property disposals
Ergon Energy's property strategic plan referred to the disposal of a number of non-network properties in the 2015–20 regulatory control period.247 Ergon Energy's business cases for the major property projects in Rockhampton, Townsville, Maryborough and Toowoomba all account for property disposals related to the development projects.248 However, in modelling its forecast revenues for the 2015–20 regulatory control period, Ergon Energy has not accounted for any property disposals in this period.249
We sought confirmation from Ergon Energy of its forecast property disposals in the 2015–20 regulatory control period. Ergon Energy advised that it had not specifically declared its forecast property disposals in modelling its regulatory proposal as the disposals were dependent on approval of the proposed capital program.250 As discussed above, we will make allowance for the Rockhampton, Maryborough and Toowoomba major property projects in our alternative estimate of forecast capex for the 2015–20 regulatory control period. We have therefore accounted for the property disposals related to these projects, valued at $13.2 million ($nominal)251 in modelling Ergon Energy's required revenues for the 2015–20 regulatory control period.
Conclusion
As discussed above, we are not satisfied that Ergon Energy's forecast non-network buildings and property capex reasonably reflects the efficient costs of a prudent operator. Specifically, it is not clear that the major property project proposed for Townsville is economically justified or should be undertaken by a prudent operator in
244 Ergon Energy, 07.08.15 - Property Minor Program Business Case, 31 October 2014, p. 9.245 Ergon Energy, 07.08.15 - Property Minor Program Business Case, 31 October 2014, p. 6.246 Ergon Energy, 07.08.15 - Property Minor Program Business Case, 31 October 2014.247 Ergon Energy, 07.08.01 - Property Strategic Plan, 2014, pp. 6−9.248 Ergon Energy, Glenmore Rd ROK NPV TOOL for BC financials V3.8.3 − (10 options) - V8.0, Data tab; Ergon
Energy, Garbutt Redevelopment_Gate 3 8 Options-v1.10, Option Lifecycle Benefits tab; Ergon Energy, Searle St MBH Redevelopment_Gate 2 8 Options-v1.10, Option Lifecycle Benefits tab; and Ergon Energy, South St TWB Redevelopment_Gate 2 8 Options-v1.10, Option Lifecycle Benefits tab.
249 Ergon Energy, 03.03.48 SCPTRM Data Model, Input tab.250 Ergon Energy, Response to Information Request AER ERGON 022, 6 February 2015, p. 6.251 Property disposals are identified as lifecycle benefits in the Options NPV spreadsheets for each project.
101 Attachment 6 – Capital expenditure | Ergon Energy determination 2015–20
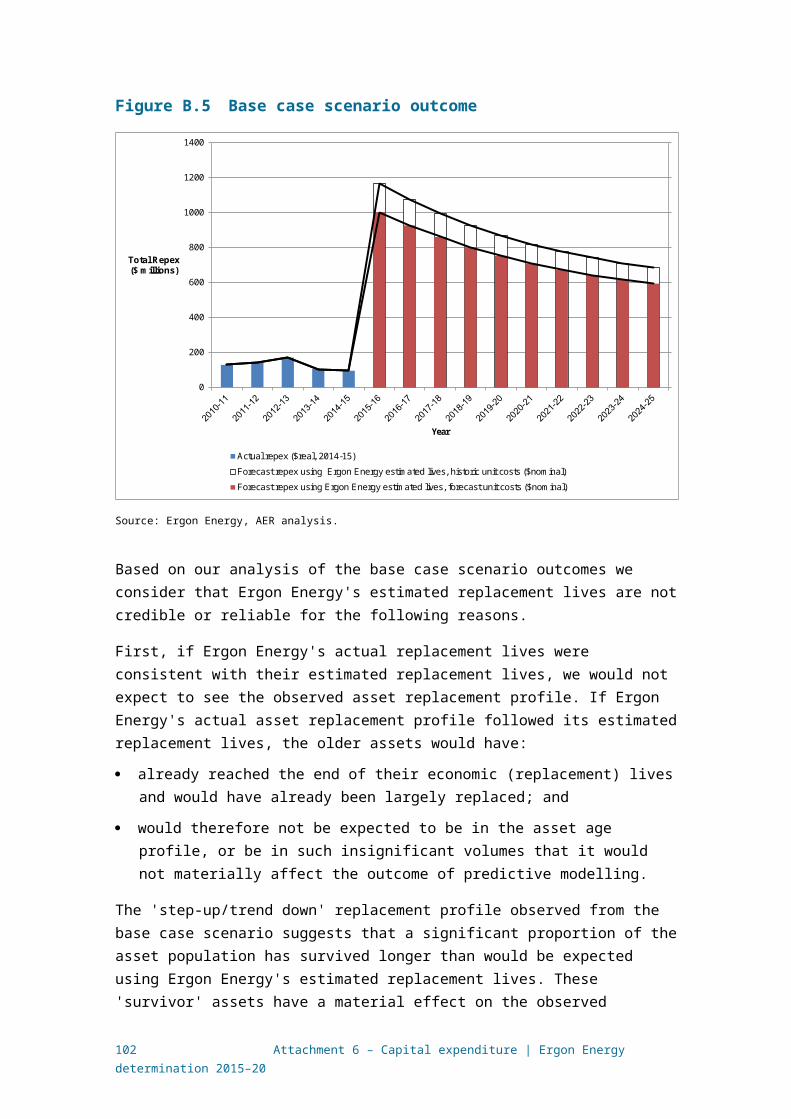
the 2015–20 regulatory control period. In determining our alternative estimate of non-network buildings and property capex, we have excluded the cost of this project from Ergon Energy's estimate of required buildings and property capex.
We are satisfied that forecast capex of $199.2 million ($2014−15), a reduction of $32.3 million ($2014−15) or 14 per cent from Ergon Energy's forecast, reasonably reflects the efficient costs that a prudent operator would require to meet the capex objectives.252 We will make an allowance for it in our estimate of total capex for the 2015–20 regulatory control period.
B.6.4 Fleet capex
Ergon Energy proposed capex of $213.7 million ($2014−15) for fleet assets in the 2015–20 regulatory control period.253 Ergon Energy's fleet assets are used to undertake construction and maintenance activities and to enable services to core functions such as customer service. Ergon Energy’s fleet assets include motor vehicles and other plant and equipment.254
Ergon Energy stated that it forecast its fleet capex using the results of a simulation model which forecasts the entry and exit of vehicles from its fleet. Ergon Energy stated that the model is a dynamic system model which is run separately for all vehicle types and caters for usage, ageing and accidents. The model is calibrated for the anticipated number of personnel and the different types of vehicles that are required to meet demand.255 Ergon Energy also stated that its fleet asset forecasts are based on replacing assets at an Optimum Replacement Point (ORP) and adjusted to manage cash flow to address the peaks and troughs in capital expenditure created by changed business demand and market capacity.256
Ergon Energy's forecast fleet capex for the 2015–20 regulatory control period is 34 per cent higher than the estimated expenditure of $159.7 million ($2014−15) for the 2010–2015 regulatory control period, with expenditure forecast to be flat across each year of the 2015–20 regulatory period.257 Ergon Energy's proposal included forecast fleet unit costs and quantities for the 2015–20 regulatory control period as well as fleet unit costs for 2013−14 and fleet quantities for 2013−14 and 2014−15.258 Our analysis showed:
in comparison to 2014−15 when Ergon Energy purchased 324 motor vehicles, total vehicle purchases are forecast to increase between 37 percent in 2015−16 to 42 per cent in 2018−19. The increase in forecast purchases of motor vehicles is even greater compared to 2013−14 when Ergon Energy purchased 281 vehicles.
252 NER, clauses .6.5.7(c)(1) and 6.5.7(c)(2).253 Ergon Energy, Regulatory information notice, template 2,6; AER analysis.254 Ergon Energy, Regulatory proposal, October 2014, Attachment 07.00.06 Ergon Energy Fleet Expenditure
Forecast Summary, p. 3.255 Ergon Energy, Regulatory proposal, October 2014, p. 110.256 Ergon Energy, Regulatory proposal, October 2014, Attachment 07.00.06 Ergon Energy Fleet Expenditure
Forecast Summary, p. 8.257 Ergon Energy, Regulatory information notice, template 2,6; AER analysis.258 Ergon Energy, Regulatory proposal, October 2014, Attachment 07.06.08 15 Year AER Plan (Jan 14), template
Fleet Capital Plan Table.
102 Attachment 6 – Capital expenditure | Ergon Energy determination 2015–20

significant increases in the forecast quantities for a large number of motor vehicles including 2WD commercial vehicles (60 per cent), 4WD commercial light vehicles (46 per cent), forklifts (75 per cent), passenger vehicles (80 per cent) and trailers – tipper (100 per cent) and trucks – medium rigid 8 to 16 tonne (service body) (133 per cent).
substantial increases in the forecast unit costs for a number of vehicles including 2WD commercial vehicles (25 per cent), 4WD commercial light vehicles (22 per cent), all-terrain vehicles (60 per cent) and trailers-box (between 25 and 39 per cent), and
a 50 per cent increase in the accident write-off allowance from 2013−14.
In summary, a number of fleet asset categories are forecast by Ergon Energy to increase in both quantity and unit cost for the 2015–20 regulatory control period. We therefore sought further information from Ergon Energy to justify the proposed level of fleet capex.259
We have reviewed Ergon Energy's revenue proposal and its response to our information request and consider that an alternative forecast capex of $160 million ($2014–15) reasonably reflects the efficient costs that a prudent operator would require to meet the capex criteria.260 In coming to this view, we noted the following in respect of Ergon Energy's planned fleet capex program:
Ergon Energy engaged the UMS Group (UMS) to review its fleet operation. UMS reported that based on annual capex and opex cost data for passenger vehicles, the total annual cost is lowest at year six where the average annual cost of the preceding year is at its minimum.261 This point is also consistent with the optimal replacement point. However, the UMS report recommends passenger vehicles be replaced in year four (where the curves representing the capex and opex costs intersect). Based on the data in UMS's report, its recommendation that passenger vehicles be replaced every four years results in an increase in passenger car capex by about a third, when compared to a six year replacement period.
This outcome is consistent with our analysis of Ergon Energy's optimal replacement age assumptions published in its fleet forecast expenditure summary document.262 Ergon Energy's proposed fleet capex assumes an optimal replacement age of four years for 2WD passenger and 4WD vehicles. This is less than the five and six year vehicle replacement criteria for similar vehicles for other Australian electricity service providers such as SA Power Networks, PowerCor,263 Ausgrid and Essential Energy as reported by SA Power Networks in its revenue proposal.264 Also, Ergon Energy's optimal replacement age for commercial trucks of eight years and trailers of 10 years is less than the reported replacement age for similar vehicles of 20
259 AER, Information request Ergon Energy 016, 13 January 2015.260 NER, cl. 6.5.7(c)(1).261 Ergon Energy, Regulatory proposal, October 2014, Attachment 07.06.03 Fleet Management & Operations Support
Project, Final Report December12, p. 70.262 Ergon Energy, Regulatory proposal, October 2014, Attachment 07.00.06 Ergon Energy Fleet Expenditure
Forecast Summary, p. 9.263 PowerCor has a four years replacement criteria for passenger vehicles.264 SA Power Networks, Regulatory Proposal, 20.26 PUBLIC - Strategic Fleet Plan 2015–2020, October 2015, p. 26.
103 Attachment 6 – Capital expenditure | Ergon Energy determination 2015–20
years for SA Power Networks, 15 years for PowerCor and 10 years for Ausgrid (15 years for trailers).265
The UMS report also shows that the forecast opex associated with passenger vehicles is assumed to double in about 10 years (from about $5,000 to $10,000), or about 7 per cent annual increase in nominal cost. Forecast CPI is 2.55 per cent per cent per annum for the 2015–20 regulatory period. Ergon Energy has not provided any evidence to support its forecast that opex on passenger vehicles will increase at an annual rate of about 4.5 per cent higher than inflation.266 Therefore, we consider the forecast increase in opex associated with passenger vehicles is not reasonably necessary to meet the capex criteria.
Ergon Energy’s estimated costs for Elevated Work Platforms for heavy commercial vehicles uses the highest estimated unit cost for all fleet assets of this type.
Ergon Energy responded to our question as to the basis for its statement that:267
Maintaining a local presence is seen as being important to our communities from a local employment perspective, and the location of our fleet vehicles is aligned with this requirement as well.
by stating that its customer research shows that "maintaining a local presence" is seen as being "important to its communities from a local employment perspective" (which is largely a repetition of the statement in question, not an explanation of its basis).268 The survey which was the basis for Ergon Energy's customer research asked respondents to choose between a five per cent decrease in their bill or maintaining local presence.269 Ergon Energy acknowledged that the five per cent price cut does not reflect the cost of local presence.270 On this basis, we consider Ergon Energy's claim that the communities it services consider it important that Ergon Energy maintain a local presence from a local employment perspective is not supported by evidence as the relationship between a five per cent price cut and the cost of maintaining a local presence has not been established. In any case, we consider that Ergon Energy's submissions in this regard do not establish that any increment in the level of fleet capex forecast so as 'to maintain a local presence' is necessary for Ergon Energy's overall capex forecast to reasonably reflect the capex criteria.
Ergon Energy's reported average staffing levels have fallen from 3,367 in 2010−11 to 2,391 in 2015−16 whilst its vehicle fleet size has decreased from 1,673 to 1,447 vehicles over the same period.271 This is an increase in the vehicle/staff ratio from 0.50 at the beginning of the 2010–2015 period to 0.61 at the commencement of the 2015–20 regulatory control period. This is a 22 per cent increase in the vehicle /staff ratio. Ergon Energy has advised us that its level of operational personnel is
265 SA Power Networks, Regulatory Proposal, 20.26 PUBLIC - Strategic Fleet Plan 2015–2020, October 2015, p. 26.266 Ergon Energy, Regulatory proposal, October 2014, Attachment 07.06.03 Fleet Management & Operations Support
Project, Final Report, December 12, p. 70.267 Ergon Energy, Regulatory proposal, October 2014, Attachment 07.00.06 Ergon Energy Fleet Expenditure
Forecast Summary, p. 5 and AER site visit.268 AER, Information request ERGON ENERGY 016, 13 January 2015, pp. 8−9.269 Ergon Energy, Regulatory proposal, October 2014, Attachment 07.00.06 Ergon Energy Fleet Expenditure
Forecast Summary, p. 5.270 Verbal advice provided by Ergon Energy to the AER during an onsite visit to Ergon Energy in February 2015.271 Ergon Energy, Revenue Proposal, Ergon Energy - 0C.02.01.02 QLD - RESET RIN 2015–2020 - Consolidated
Information - Public - October 2014, October 2014, Table 2.11.1.
104 Attachment 6 – Capital expenditure | Ergon Energy determination 2015–20

anticipated to remain fixed at current levels with no forecast increase.272 On this basis, we would expect Ergon Energy's proposed fleet expenditure for the 2015–20 regulatory control period to be lower than the 2010–15 regulatory control period.
Ergon Energy did not provide any evidence of its governance practices for fleet management. Fleet management decisions only require the Fleet Manager's approval, while the cost of the fleet is charged to other business units. On this basis, we consider that there appears to be a lack of management oversight of financial and operation outcomes for Ergon Energy's fleet assets that are not the responsibility of the Fleet Manager. We therefore consider the governance of Ergon Energy's fleet assets is unlikely to be effective or optimal.
There is a paucity of information in the setting of vehicle standards relating to vehicle and plant specifications which impact on capital costs, operating costs, depreciation, reliability/breakdown costs and vehicle safety and operational performance. We consider that vehicle standards result in higher than required fleet capex in some instances, in particular:
o the use of the Toyota Camry Hybrid at higher capital and operating costs than a conventional vehicle
o the use of high end 4WD models such as the Toyota Landcruiser with a capital cost almost twice that of an alternative such as a Mitsubishi 4WD, and
o the use of unnecessarily expensive vehicle marques for vans, such as Mercedes Benz when lower cost alternatives would be sufficient.
We acknowledge that Ergon Energy has reduced its fleet size during the 2010–2015 regulatory control period. However, we do not consider that its proposed fleet capex is required to efficiently and effectively satisfy the drivers of demand for fleet services (to undertake construction and maintenance activities and to enable support services to core functions) for the 2015–20 regulatory control period. We have formed this view despite Ergon Energy's view that:
reductions in fleet capex during the 2010–2015 regulatory control period resulted in less fleet replacements (less number of fleet purchased); and
this reduction was achieved by deferring the replacement beyond the due date (past the optimum replacement year) and there is a need to catch up during the 2015–20 regulatory control period when fleet assets will be replaced at the optimum replacement points leading to an increase in forecast fleet asset numbers.273
We consider that Ergon Energy's fleet capex should not be increased above its current levels. Our key reasons for this decision are summarised below:274
vehicle cost data in the UMS report suggests that Ergon Energy's optimal replacement age for its fleet assets is less than the actual or observed optimal
272 AER, Information request Ergon Energy 016, 13 January 2015.273 AER, Information request Ergon Energy 016, 13 January 2015, p. 9.274 AER, Information request Ergon Energy 016, 13 January 2015, p. 9.
105 Attachment 6 – Capital expenditure | Ergon Energy determination 2015–20
replacement age. This view is supported by benchmark analysis of the reported comparative replacement criteria for fleet assets of other electricity service providers, which shows that Ergon Energy's proposed fleet capex program assumes a higher frequency of fleet asset replacement than benchmark distributors
Ergon Energy’s estimated costs for Elevated Work Platforms for heavy commercial vehicles use the highest estimated unit cost of its forecasts for all fleet assets of this type
Ergon Energy has not justified its policy of maintaining a local presence in respect to the NER requirement that a forecast of required capital expenditure reasonably reflect the capex criteria275
Ergon Energy's vehicle/staff ratio has increased by about 22 per cent during the 2010–2015 regulatory control period and Ergon Energy has advised that its level of operation personnel is anticipated to remain fixed at current levels with no forecast increase for the 2015–20 regulatory control period. Such an outcome suggests that Ergon Energy has some capacity to not require an increase above current levels in its proposed increased fleet asset acquisition program for the 2015–20 regulatory control period without diminishing its ability to meet its fleet service requirements
maintaining a historical trend expenditure allowance for fleet capex is consistent with an environment where the business size, as measured by operational employee numbers, and service requirements have not materially changed, and
it appears that Ergon Energy may have over-specified its proposed fleet acquisition program because:
o there appears to be a lack of management oversight in respect to the achievement of optimised financial and operation outcomes for Ergon Energy's fleet assets that are not the responsibility of the Fleet Manager
o there is a paucity of information in the setting of vehicle standards in respect to how capital costs, operating costs, depreciation, reliability/breakdown cost and vehicle safety are assessed to form each vehicle's standard, and
o that vehicle standards are higher than required operation standards for some vehicles.
In summary, we are not satisfied that Ergon Energy's forecast fleet capex reasonably reflects the efficient costs that a prudent operator would require to meet the capex criteria.276 We consider that forecast capex of $160.0 million ($2014–15) reasonably reflects the required expenditure. This represents a reduction of 25 per cent from Ergon Energy's proposed fleet capex for the 2015–20 regulatory control period and is in line with its fleet service requirements and operational employee numbers. We will make an allowance for it in our estimate of total capex for the 2015–20 regulatory control period.
B.7 Demand management275 NER, cl. 6.5.7(c).276 NER, cl. 6.5.7(c)(1).
106 Attachment 6 – Capital expenditure | Ergon Energy determination 2015–20
Demand management refers to non-network strategies to address growth in demand and/or peak demand. Demand management can have positive economic impacts by reducing peak demand and encouraging the more efficient use of existing network assets, resulting in lower prices for network users, reduced risk of stranded network assets and benefits for the environment.
Demand management is an integral part of good asset management for network businesses. Service providers can seek to undertake demand management through a range of mechanisms, such as incentives for customers to change their demand patterns, operational efficiency programs, load control technologies, or alternative sources of supply (such as distributed or embedded generation and energy storage).
The current incentive frameworks and obligations in the NER are designed to encourage distributors to make efficient investment and expenditure decisions. However, the NER recognises that the planning and investment framework and the incentive regulation structure may not be sufficient by themselves to remove any bias towards network capital investment over non-network responses.
As such, the NER set out that distributors should examine non-network alternatives when developing network investments through the regulatory investment test for distribution (RIT-D) process. The RIT-D requires distributors to consult with stakeholders on the need for new capex projects and consider all credible network and non-network options as part of their planning processes. Its aim is to create a level playing field for the assessment of non-network options, such as demand-side management, against network options.
The NER also requires us to consider the extent to which a business has considered efficient and prudent non-network alternatives in our assessment of capex proposals.277 In addition, the NER requires us to develop and implement mechanisms to incentivise distributors to consider economically efficient alternatives to network solutions. As set out in our demand management incentive scheme attachment (attachment 12), we are continuing Ergon Energy's demand management innovation allowance.
B.7.1 Position
Our preliminary decision is that it is most appropriate to rely on the incentive framework, together with the requirements in the RIT-D and the distribution Annual Planning Report, to drive the efficient use of demand management. The benefits of capex deferral would be shared with consumers through the Capital Expenditure Sharing Scheme (CESS).
Accordingly, our alternative estimate of required capex does not include a generic reduction to overall system capex for potential for deferred capital needs through the use of demand management initiatives.
Our preliminary decision not to include a generic capex offset for possible future demand management activities does not impact on our consideration of the business
277 NER, cl. 6.5.7(3)(10).
107 Attachment 6 – Capital expenditure | Ergon Energy determination 2015–20

cases for specific demand management proposals, or the consideration of non-network alternatives within the RIT-D process. Where a specific capex/opex trade-off can be shown to meet the capex and opex criteria we will include the amounts in the forecasts. This approach is consistent with the capital expenditure factor that requires us to have regard to the extent to which the distributor has considered, and made provision for, efficient and prudent non-network alternatives.278
B.7.2 Ergon Energy's proposal on demand management
Ergon Energy proposed a 'non-network alternatives' step change of $17.5 million ($2012–13) to avoid augex through demand management. Our consideration of Ergon Energy's opex proposals for broad-based and other demand management programs is included in attachment 7.
B.7.3 Reasons for preliminary decision
Distributors are required to transparently consider non-network alternatives through the RIT-D process. Through the RIT-D process and other initiatives developed as part of the demand management innovation allowance, it is expected that some amount of system capex currently in the forecast will be efficiently deferred. We are therefore considering whether it is appropriate to estimate the amount of capex that may be efficiently deferred through the use of demand management initiatives and explicitly reduce the capex forecast by this amount.
If we were to include an additional generic reduction to system capex to take account of the potential for capex deferrals, we would also need to assess the efficient opex required to support this capex offset. Given that we do not currently have actual expenditure data from which to accurately calculate a capex/opex trade-off, our preliminary decision is to not include an explicit reference in the capex or opex forecasts for broad based demand management activities.
However, we welcome views on whether this is the most appropriate approach in providing incentives for the optimal amount of demand management. To the extent that stakeholders consider that the long term interests of consumers may be better promoted through explicit recognition of demand management and consequential adjustments to capex and opex, we seek views on the appropriate capex/opex trade-off that should be included.
278 NER, cl. 6.5.7(e)(10).
108 Attachment 6 – Capital expenditure | Ergon Energy determination 2015–20

C DemandThis appendix sets out our observations of forecast demand in Ergon Energy's network for the 2015–20 regulatory control period.279
Demand forecasts are fundamental to forecasting a service provider's capex and opex, and to our assessment of that forecast expenditure.280 Ergon Energy must deliver electricity to its customers and build, operate and maintain its network to manage expected changes in demand for electricity. When Ergon Energy invests in its network to meet demand and increases in electricity consumption, it incurs capex. In particular, the expected growth in demand is an important factor driving network augmentation expenditure and connections expenditure (growth capex).281 Ergon Energy uses demand forecasts in conjunction with network planning to determine the amount and timing of such expenditure. Ergon Energy also incurs opex in relation to the new assets it builds to meet demand.
System demand represents total demand in the Ergon Energy distribution network. This attachment considers demand forecasts in Ergon Energy's network at the system level. System demand trends give a high level indication of the need for expenditure on the network to meet changes in demand. Forecasts of increasing system demand generally signal an increased requirement for growth capex, and converse for forecasts of stagnant or falling system demand.282 Accurate, or at least unbiased, demand forecasts are important inputs to ensuring efficient levels of investment in the network. For example, overly high demand forecasts may lead to inefficient expenditure as service providers install unnecessary capacity in the network.
However, localised demand growth (spatial demand) drives the requirement for specific growth projects or programs. Spatial demand growth is not uniform across the entire network: for example, future demand trends would differ between established suburbs and new residential developments. Accordingly, there may also be a need to consider spatial demand forecasts as part of determining the requirement for growth capex for the 2015–20 regulatory control period.
Appendix C discusses this analysis in more detail.
C.1 AER position on system demand trends
279 In this attachment, 'demand' refers to summer maximum, or peak, demand (megawatts, MW) unless otherwise indicated.
280 NER, cll. 6.5.6(c)(3) and 6.5.7(c)(3).281 Sections B.2 and B.3 discuss our consideration of Ergon Energy's augex and connections expenditure.282 Other factors, such as network utilisation, are also important high level indicators of growth capex requirements.
109 Attachment 6 – Capital expenditure | Ergon Energy determination 2015–20

We are satisfied the system demand forecast in Ergon Energy's regulatory proposal for the 2015–20 regulatory control period reasonably reflects a realistic expectation of demand.283 However, in our final decision will take into account the updated AEMO forecasts that are scheduled to be published by July 2015.
We consider the forecasts in our decisions should reflect the most current expectations of the forecast period. Hence, we will consider updated demand forecasts and other information in the final decision to reflect the most up to date data. We expect Ergon Energy's revised proposal will provide revised forecasts as well as further information on the reconciliation of these forecasts with their own zone-substation forecasts.
Ergon Energy provided historical and forecast demand figures in their proposal and in the reset RINs.284 Ergon Energy has revised downwards its system‐wide maximum demand from previous forecast estimates after accounting for temperature variations, the revised economic growth, and the take‐up rate of air conditioning and solar PV systems. As we would expect, one result of this trend is the significant reduction in Ergon Energy's augex forecast for the 2015–20 regulatory control period compared to the 2010–15 regulatory control period (see appendix B).
The EMCa noted that during an onsite meeting, Ergon Energy advised that a reconciliation adjustment it made to the zone substation spatial forecasts based on the 50 per cent PoE demand scenario. This variation in approach is not documented in Ergon Energy's regulatory proposal or in its Corporation Initiated Augmentation285 expenditure forecast summary.
However, we also recognise that significant reductions have been imposed on the spatial demand forecasts to take account of the top-down system-wide forecast. As such, pending the AEMO’s updated demand forecasts that are due in July 2015, we are satisfied that on current forecasts, the augex forecast is based on a realistic expectation of demand.
Submissions from stakeholders suggest there is evidence demand will continue to stagnate, or even fall, in Ergon Energy's network for the 2015–20 regulatory period. We note stakeholders generally provided qualitative evidence, and did not suggest specific demand figures.
C.2 AER approachOur consideration of demand trends in Ergon Energy's network relied primarily on
comparing demand information from the following sources:
Ergon Energy's regulatory proposal
regional forecasts from AEMO where available
283 NER, cll. 6.5.6(c)(3) and 6.5.7(c)(3).284 Ergon Energy, Regulatory proposal: July 2015 to June 2020, October 2014.285 http://www.aer.gov.au/node/20186
110 Attachment 6 – Capital expenditure | Ergon Energy determination 2015–20

stakeholder submissions in response to Ergon Energy's regulatory proposal (as well as submissions made in relation to the Queensland distribution determinations more generally).
C.3 Ergon Energy's proposalErgon Energy has forecast an average annual growth in peak demand of around 0.3 per cent in the 2015−20 regulatory control period. This is broadly consistent with its growth in peak demand over the 2010−15 regulatory control period (Figure C.9). Ergon Energy’s forecast system maximum demand for the 2015−20 regulatory control period is based on the latest available data following the 2013 winter and 2013−14 summer season.
Figure C.9 Ergon Energy maximum demand (summer)
0
500
1000
1500
2000
2500
3000
3500
Demand(MW)
Actual
Forecast - Final distribution determination (May 2010)
Forecast - Regulatory proposal (Oct 2014)
Forecast - AEMO
AEMO forecasts still under development
Source: Ergon Energy, regulatory proposal.
Table C.8 Maximum system demand (summer) − Weather corrected (50 per cent PoE) (MW)
201 2016−17 2017−18 2018−19 2019−20 Average annual
111 Attachment 6 – Capital expenditure | Ergon Energy determination 2015–20

5−16 growth (2015−20)
Regulatory proposal (October 2014) 2 537 2 543 2 618 2 635 2 685 0.26%
Source: Ergon Energy, Regulatory proposal.
Ergon Energy uses a combination of bottom-up spatial forecasting for each individual zone substation, combined with an adjustment process to take into account the top-down system wide demand forecast. The individual substation forecasts are based on of Ergon Energy's knowledge and understanding of its customer base and its assessments of future growth in the communities supplied from each zone substation.286
Ergon Energy adjusts the aggregated zone substation (spatial) forecasts to reconcile to the system maximum demand forecast. At an onsite meeting, Ergon Energy advised that it increased the spatial forecasts by around 1-2 per cent in aggregate (i.e. the sum of the spatial forecasts before adjustment was lower than the system forecast determined from its econometric modelling).
We acknowledge that Ergon Energy has incorporated changes in the demand forecasting methodology recommended by us during the regulatory determination process for the 2010–15 regulatory control period.
Several stakeholders have submitted concerns that Ergon Energy's forecast demand forecasts for the 2015−20 regulatory control period are overly optimistic. The Energy Users Association of Australia (EUAA) indicated that the AER has identified falling demand in the 2010−15 period, yet Ergon Energy has forecast moderate growth.287
Both the CCP and the EUAA encouraged us to interrogate the forecasts of demand to ensure that they reflect declines in maximum demand arising from:
reduced energy use in response to higher electricity prices
increased uptake of solar photo-voltaic systems
subdued economic growth and weaker electricity demand from the manufacturing sector.288
The submissions call for us to adopt demand forecasts which reflects AEMO's flat demand outlook where it is expected that the record peak demand experienced in 2009 will not be reached again until after 2020.289 As noted previously, our final decision will take account of the most recent AEMO forecasts that are due by July 2015.
286 EMCa, Review of Proposed Network Augmentation and Replacement Capital Expenditure in Ergon Energy's Regulatory Proposal 2015−20, 20 March 2015, p. 44
287 Energy Users Association of Australia (EUAA), submission to the Australian Energy Regulator, 30 January 2015.288 CCP, Submission on Ergon Energy's regulatory proposal, p. 13.289 CCP, Submission on Ergon Energy's regulatory proposal, p. 13; EUAA, Submission on Ergon Energy's regulatory
proposal, p. 19.
112 Attachment 6 – Capital expenditure | Ergon Energy determination 2015–20

C.4 AEMO forecastsThe Australian Energy Market Operator (AEMO) is scheduled to release a
Transmission Connection Point (CP) Forecasting Report for Queensland by July 2015. Our final decision will take these updated CP forecasts into account.
Our final decision will take account of the updated AEMO forecasts that are due by July 2015. We expect that Ergon Energy's revised proposal will take account of these revised forecasts and provide further information on the reconciliation of these forecasts with their own zone-substation forecasts.
113 Attachment 6 – Capital expenditure | Ergon Energy determination 2015–20

D Real material cost escalationReal material cost escalation is a method for accounting for expected changes in
the costs of key material inputs to forecast capex. The materials input cost model submitted by Ergon Energy includes forecasts for changes in the prices of commodities such as copper, aluminium, steel, oil and wood rather than the prices of physical inputs themselves (e.g. poles, cables, transformers) used to provide network services. Ergon Energy has also escalated construction costs in its forecast.
D.1 PositionWe are not satisfied that Ergon Energy's proposed real material cost escalators
(leading to cost increases above CPI) which form part of its total forecast capex reasonably reflect a realistic expectation of the cost inputs required to achieve the capex objectives over the 2015–20 regulatory control period.290 We consider that zero per cent real cost escalation is reasonably likely to reflect the capex criteria including that it is likely to reasonably reflect a realistic expectation of the cost inputs required to achieve the capex objectives over the 2015–20 regulatory control period. We have arrived at this conclusion on the basis that:
the degree of the potential inaccuracy of commodities forecasts is such that we consider that zero per cent real cost escalation is likely to provide a more reliable estimation for the price of input materials used by Ergon Energy provide network services
there is little evidence to support how accurately Ergon Energy's materials escalation model forecasts reasonably reflect changes in prices paid by Ergon Energy for physical assets in the past and by which we can assess the reliability and accuracy of its forecast materials model. Without this supporting evidence, it is difficult to assess the accuracy and reliability of Ergon Energy's material input cost escalators model as a predictor of the prices of the assets used by Ergon Energy to provide network services, and
Ergon Energy did not provide any supporting evidence to show that it has considered whether there may be some material exogenous factors that impact on the cost of physical inputs that are not captured by the material input cost models used by Ergon Energy.
Our approach to real materials cost escalation does not affect the proposed application of labour and construction cost escalators which apply to Ergon Energy's standard control services capital expenditure. We consider that labour and construction cost escalation as proposed by Ergon Energy is likely to more reasonably reflect a realistic expectation of the cost inputs required to achieve the capex criteria given these are direct inputs into the cost of providing network services.291
D.2 Ergon Energy's proposal
290 NER, cl. 6.5.7(a).291 NER, cl. 6.5.7(c)(3).
114 Attachment 6 – Capital expenditure | Ergon Energy determination 2015–20

Ergon Energy applied cost escalators to reflect changes in labour, materials and contractors.292 Ergon Energy engaged consultants Jacobs SKM to provide advice and recommendations regarding appropriate escalation rates.293 Real cost escalation indices for the following material cost drivers were calculated for Ergon Energy by Jacobs SKM:294
aluminium
copper
steel,
oil and
construction costs.
Table D.9 outlines Ergon Energy's real materials cost escalation forecasts.
Table D.9 Ergon Energy's real materials cost escalation forecast—inputs (real indices)
2015–16 2016–17 2017–18 2018–19 2019–20
Aluminium 1.041 1.023 1.019 1.019 1.023
Copper 0.990 0.991 0.999 1.001 1.006
Steel 1.009 0.982 0.996 1.003 1.010
Oil 0.920 0.995 0.982 0.990 1.012
Construction Cost Index1 1.058 1.082 1.104 1.128 1.152
Source: Ergon Energy, Regulatory proposal, Attachment 06.02.02 – Jacobs: Cost Escalation Factors 2015-2020,
Table 21, October 2014.1 Cumulative real escalation (Source: Ergon Energy, Regulatory proposal, Attachment 06.02.02 – Jacobs:
Cost Escalation Factors 2015−20, Table 1, October 2014.)
Jacobs SKM stated that in order to aggregate the input cost drivers for Ergon Energy's network asset categories; it assigned appropriate weightings for the relative contribution of each of the input cost drivers and economic indicator to each asset category.295 Table D.2 shows the real material only cost escalation factors for the nominated Ergon Energy asset categories.
292 Ergon Energy, Regulatory proposal, November 2014, p. 109.293 Ergon Energy, Regulatory proposal, November 2014, p. 109 and Attachment 06.02.02 – Jacobs: Cost Escalation
Factors 2015−20. 294 Ergon Energy, Regulatory proposal, Appendix 20 Material cost escalation factors Jacobs SKM, p. 31, November
2014.295 Ergon Energy, Regulatory proposal, Appendix 20 Material cost escalation factors Jacobs SKM, November 2014,
p. 2.
115 Attachment 6 – Capital expenditure | Ergon Energy determination 2015–20

Table D.10 Real material cost escalation factors for Ergon Energy's asset categories
2015–16 2016–17 2017–18 2018–19 2019–20
Asset category
Overhead Subtransmission Lines
1.014 1.005 1.008 1.010 1.014
Underground Subtransmission Cables
0.993 1.000 1.002 1.003 1.007
Overhead Distribution Lines
1.000 0.998 1.000 1.003 1.008
Underground Distribution Cables
1.000 1.006 1.004 1.005 1.009
Distribution Equipment 0.995 0.998 0.999 1.000 1.004
Substation Bays 1.001 1.004 1.004 1.005 1.008
Substation Establishment 1.022 1.022 1.021 1.021 1.021
Distribution Substation Switchgear
0.995 0.998 0.999 1.000 1.004
Zone Transformers 0.997 0.996 0.999 1.002 1.007
Distribution Transformers 1.000 1.000 1.002 1.004 1.008
Low Voltage Services 1.021 1.010 1.009 1.010 1.013
Metering 0.992 0.999 0.998 0.999 1.002
Communications - Pilot Wires 1.000 1.000 1.000 1.000 1.000
Street Lighting 0.998 0.998 0.999 1.000 1.001
Control Centre - SCADA 1.000 1.000 1.000 1.000 1.000
Buildings 1.022 1.022 1.021 1.021 1.021
Source: Ergon Energy, Regulatory proposal, Attachment 06.02.02 – Jacobs: Cost Escalation Factors 2015−20,
October 2014, Table 22A.
D.3 Assessment approachWe assessed Ergon Energy's proposed real material cost escalators for the
purpose of assessing its proposed total capex forecast against the National Electricity Rules (NER) requirements. We must accept Ergon Energy's capex forecast if we are satisfied it reasonably reflects the capex criteria.296 Relevantly, we must be satisfied those forecasts reasonably reflect a realistic expectation of cost inputs required to achieve the capex objectives.297
296 NER, cl. 6.5.7(c).297 NER, cl. 6.5.7(c)(3).
116 Attachment 6 – Capital expenditure | Ergon Energy determination 2015–20

We have applied our approach as set out in our Expenditure Guideline to assess the input price modelling approach to forecast materials cost.298 In the Expenditure Guideline Explanatory Statement we stated that we had seen limited evidence to demonstrate that the commodity input weightings used by service providers to generate a forecast of the cost of material inputs have produced unbiased forecasts of the costs the service providers paid for manufactured materials.299 We considered it important that such evidence be provided because the changes in the prices of manufactured materials are not solely influenced by the changes in the raw materials that are used.300 As a result, the price of manufactured network materials may not be well correlated with raw material input costs. We expect service providers to demonstrate that their proposed approach to forecast manufactured material cost changes is likely to reasonably reflect changes in raw material input costs.
In our assessment of Ergon Energy's proposed material cost escalation, we:
reviewed the Jacobs SKM report commissioned by Ergon Energy301
reviewed the materials input cost approach used by Ergon Energy
reviewed the approach to forecasting manufactured material costs in the context of electricity service providers mitigating such costs and producing unbiased forecasts, and
considered submissions on this issue.
D.4 Reasons We are not satisfied that Ergon Energy's forecast is based on a sound and robust
methodology for the reasons outlined below. We therefore consider that it does not reasonably reflect the capex criteria.302 This criteria includes that the total forecast capex reasonably reflects a realistic expectation of cost inputs required to achieve the capex objectives.303 Accordingly, we have not accepted it as part of our alternative estimate in our preliminary decision on total forecast capex. We are satisfied that zero per cent real cost escalation is reasonably likely to reflect the capex criteria and this has been taken into account into our alternative estimate.
Materials input costs
Ergon Energy's materials input cost proposal does not demonstrate how and to what extent material inputs have affected the cost of inputs such as cables and transformers. In particular, it has provided no supporting evidence to substantiate how accurately Ergon Energy's materials escalation forecasts reasonably reflected changes
298 AER, Better Regulation − Explanatory Statement Expenditure Forecast Assessment Guideline, November 2013, pp. 50-51.
299 AER, Better Regulation − Explanatory Statement Expenditure Forecast Assessment Guideline, November 2013, p. 50.
300 AER, Better Regulation − Explanatory Statement Expenditure Forecast Assessment Guideline, November 2013, p. 50.
301 Ergon Energy, Regulatory proposal, November 2014, Appendix 20 Material cost escalation factors Jacobs SKM.302 NER, cl. 6.5.7(c).303 NER, cl. 6.5.7(c)(3).
117 Attachment 6 – Capital expenditure | Ergon Energy determination 2015–20

in prices it paid for assets in the past to assess the reliability of forecast materials prices.
In our Expenditure Guideline, we requested that service providers demonstrate that their proposed approach to forecast materials cost changes reasonably reflected the change in prices they paid for physical inputs in the past. Ergon Energy's proposal does not include supporting data or information which demonstrates movements or interlink-ages between changes in the input prices of commodities and the prices Ergon Energy paid for physical inputs. Ergon Energy's material cost input proposal assumes a weighting of commodity inputs for each asset class but does not provide information which explains the basis for the weightings or that the weightings applied have produced unbiased forecasts of the costs of Ergon Energy's assets. For these reasons, there is no basis on which we can conclude that the forecasts are reliable.
Materials input cost forecasting
Ergon Energy has used its consultants' reports to estimate cost escalation factors in order to assist in forecasting future operating and capital expenditure. These cost escalation factors include commodity inputs related to capital expenditure. The consultants have adopted a high level approach hypothesising a relationship between these commodity inputs and the physical assets purchased by Ergon Energy. Neither the consultants' report nor Ergon Energy have adequately explained or quantified this relationship, particularly in respect to movements in the prices between the commodity inputs and the physical assets and the derivation of commodity input weightings for each asset class.
We recognise that active trading or futures markets to forecast prices of assets such as transformers are not available and that in order to forecast the prices of these assets a proxy forecasting method needs to be adopted. Nonetheless, that forecasting method must be reasonably reliable to estimate the prices of inputs used by service providers to provide network services. Ergon Energy has not provided any supporting information that indicates whether the forecasts have taken into account any material exogenous factors which may impact on the reliability of material input costs. Such factors may include changes in technologies which affect the weighting of commodity inputs, suppliers of the physical assets changing their sourcing for the commodity inputs, and the general volatility of exchange rates.
Materials input cost mitigation
We consider that there is potential for Ergon Energy to mitigate the magnitude of any overall input cost increases. This could be achieved by:
potential commodity input substitution by the electricity service provider and the supplier of the inputs. An increase in the price of one commodity input may result in input substitution to an appropriate level providing there are no technically fixed proportions between the inputs. Although there will likely be an increase in the cost of production for a given output level, the overall cost increase will be less than the
118 Attachment 6 – Capital expenditure | Ergon Energy determination 2015–20

weighted sum of the input cost increase using the initial input share weights due to substitution of the now relatively cheaper input for this relatively expensive input.
We are aware of input substitution occurring in the electricity industry during the late 1960's when copper prices increased, potentially impacting significantly on the cost of copper cables. Electricity service provider's cable costs were mitigated as relatively cheaper aluminium cables could be substituted for copper cables. We do recognise that the principle of input substitutability cannot be applied to all inputs, at least in the short term, because there are technologies with which some inputs are not substitutable. However, even in the short term there may be substitution possibilities between operating and capital expenditure, thereby potentially reducing the total expenditure requirements of an electricity service provider.304
the substitution potential between opex and capex when the relative prices of operating and capital inputs change.305 For example, Ergon Energy has not demonstrated whether there are any opportunities to increase the level of opex (e.g. maintenance costs) for any of its asset classes in an environment of increasing material input costs.
the scale of any operation change to the electricity service provider's business that may impact on its capex requirements, including an increase in capex efficiency, and
increases in productivity that have not been taken into account by Ergon Energy in forecasting its capex requirements.
By discounting the possibility of commodity input substitution throughout the 2015−20 regulatory control period, we consider that there is potential for an upward bias in estimating material input cost escalation by maintaining the base year cost commodity share weights.
Forecasting uncertainty
The NER requires that an electricity service provider's forecast capital expenditure reasonably reflects a realistic expectation of cost inputs required to achieve the capex objectives.306 We consider that there is likely to be significant uncertainty in forecasting commodity input price movements. The following factors have assisted us in forming this view:
recent studies which show that forecasts of crude oil spot prices based on futures prices do not provide a significant improvement compared to a ‘no-change’ forecast for most forecast horizons, and sometimes perform worse307
304 NER, cl. 6.5.7(e)(7).305 NER, cl. 6.5.7(e)(6).306 NER, cl. 6.5.7(c)(3).307 R. Alquist, L. Kilian, R. Vigfusson, Forecasting the Price of Oil, Board of Governors of the Federal Reserve
System, International Finance Discussion Papers, Number 1022, July 2011 (also published as Alquist, Ron, Lutz Kilian, and Robert J. Vigfusson, 2013, Forecasting the Price of Oil, in Handbook of Economic Forecasting, Vol. 2, ed. by Graham Elliott and Allan Timmermann (Amsterdam: North Holland), pp. 68−69 and pp. 427–508) and International Monetary Fund, World Economic Outlook — Recovery Strengthens, Remains Uneven, Washington, April 2014, pp. 25−31.
119 Attachment 6 – Capital expenditure | Ergon Energy determination 2015–20
evidence in the economic literature on the usefulness of commodities futures prices in forecasting spot prices is somewhat mixed. Only for some commodities and for some forecast horizons do futures prices perform better than ‘no change’ forecasts;308 and
the difficulty in forecasting nominal exchange rates (used to convert most materials which are priced in $US to $AUS). A review of the economic literature of exchange rate forecast models suggests a “no change” forecasting approach may be preferable to the forward exchange rate produced by these forecasting models.309
Strategic contracts with suppliers
We consider that electricity service providers can mitigate the risks associated with changes in material input costs by including hedging strategies or price escalation provisions in their contracts with suppliers of inputs (e.g. by including fixed prices in long term contracts). We also consider there is the potential for double counting where contract prices reflect this allocation of risk from the electricity service provider to the supplier, where a real escalation is then factored into forecast capex. In considering the substitution possibilities between operating and capital expenditure,310 we note that it is open to an electricity service provider to mitigate the potential impact of escalating contract prices by transferring this risk, where possible, to its operating expenditure.
Cost based price increases
Allowing individual material input costs that constitute cost escalation reflects more cost based price increases. We consider this cost based approach reduces the incentives for electricity service providers to manage their capex efficiently, and may instead incentivise electricity service providers to over forecast their capex. In taking into account the revenue and pricing principles, we note that this approach would be less likely to promote efficient investment.311 It also would not result in a capex forecast that was consistent with the nature of the incentives applied under the CESS and the STPIS to Ergon Energy as part of this decision.312
Selection of commodity inputs
The limited number of material inputs included in Ergon Energy's material input escalation may not be representative of the full set of inputs or input choices impacting
308 International Monetary Fund, World Economic Outlook — Recovery Strengthens, Remains Uneven, Washington, April 2014, p. 27, Chinn, Menzie D., and Olivier Coibion, The Predictive Content of Commodity Futures, Journal of Futures Markets, 2014, Volume 34, Issue 7, p. 19 and pp. 607-636 and T. Reeve, R. Vigfusson, Evaluating the Forecasting Performance of Commodity Futures Prices, Board of Governors of the Federal Reserve System, International Finance Discussion Papers, Number 1025, August 2011, pp. 1 and 10.
309 R. Meese, K. Rogoff, (1983), Empirical exchange rate models of the seventies: do they fit out of sample?, Journal of International Economics, 14, B. Rossi, (2013), Exchange rate predictability, Journal of Economic Literature, 51(4), E. Fama, (1984), Forward and spot exchange rates, Journal of Monetary Economics, 14, K. Froot and R. Thaler, (1990), Anomalies: Foreign exchange, the Journal of Economic Perspectives, Vol. 4, No. 3, CEG, Escalation factors affecting expenditure forecasts, December 2013, and BIS Shrapnel, Real labour and material cost escalation forecasts to 2019/20, Australia and New South Wales, Final report, April 2014.
310 NER, cl. 6.5.7(e)(7).311 NEL, s. 7.312 NER, cl. 6.5.7(e)(8).
120 Attachment 6 – Capital expenditure | Ergon Energy determination 2015–20

on changes in the prices of assets purchased by Ergon Energy. Ergon Energy's materials input costs may also be biased to the extent that they may include a selective subset of commodities that are forecast to increase in price during the 2015−20 regulatory control period.
Commodities boom
The relevance of material input cost escalation post the 2009 commodities boom experienced in Australia when material input cost escalators were included in determining the approved capex allowance for electricity service providers is also relevant. We consider that the impact of the commodities boom has subsided and as a consequence the justification for incorporating material cost escalation in determining forecast capex has also diminished.
D.5 Review of independent consultant's reportsA number of businesses we are currently undertaking an assessment of their
revenue requirements have included reports on material cost escalation in their submission. A number of these businesses313 have commissioned reports by Competition Economists Group (CEG).314 We have also received submissions from TransGrid and Jemena Gas Networks that included consultant's reports on materials escalation from SKM and BIS Shrapnel respectively. We have considered the relevance of these submissions to the issues relevant for Ergon Energy in order to arrive at a position that takes into account all available information. Our views on these reports are set out below. Overall, these reports lend further support to our position to not accept Ergon Energy's proposed materials cost escalation.
CEG report commissioned by SA Power Networks CEG provided the following quote from the International Monetary Fund (IMF) in
respect of futures markets:315
While futures prices are not accurate predictors of future spot prices, they nevertheless reflect current beliefs of market participants about forthcoming price developments.
This supports our view that there is a reasonable degree of uncertainty in the modelling of material input cost escalators to reliably and accurately estimate the prices of assets used by service providers to provide network services. Whilst the IMF may conclude that commodity futures prices reflect market beliefs on future prices, there is no support from the IMF that futures prices provide an accurate predictor of future commodity prices.
In respect of forecasting electricity service providers future costs, CEG stated that:316
313 Including ActewAGL, Ausgrid, Essential Energy, SA Power Networks and TasNetworks.314 CEG, Escalation factors affecting expenditure forecasts, December 2013 and CEG Materials cost escalation
factors: a report for SA Power Networks, August 2014.315 CEG Materials cost escalation factors: a report for SA Power Networks, August 2014, pp. 5−6.316 CEG Materials cost escalation factors: a report for SA Power Networks, August 2014, p.11.
121 Attachment 6 – Capital expenditure | Ergon Energy determination 2015–20

There is always a high degree of uncertainty associated with predicting the future. Although we consider that we have obtained the best possible estimates of the NSPs’ future costs at the present time, the actual magnitude of these costs at the time that they are incurred may well be considerably higher or lower than we have estimated in this report. This is a reflection of the fact that while futures prices and forecasts today may well be a very precise estimate of current expectations of the future, they are at best an imprecise estimate of future values.
This statement again is consistent with our view about the degree of the precision and accuracy of futures prices in respect of predicting electricity service providers future input costs.
CEG also acknowledged that its escalation of aluminium prices are not necessarily the prices paid for aluminium equipment by manufacturers. As an example, CEG referred to producers of electrical cable who purchase fabricated aluminium which has gone through further stages of production than the refined aluminium that is traded on the LME. CEG also stated that aluminium prices can be expected to be influenced by refined aluminium prices but these prices cannot be expected to move together in a ‘one-for-one’ relationship.317
GEG provided similar views for copper and steel futures. For copper, CEG stated that the prices quoted for copper are prices traded on the LME that meet the specifications of the LME but that there is not necessarily a 'one-for-one' relationship between these prices and the price paid for copper equipment by manufacturers.318 For steel futures, CEG stated that the steel used by electricity service providers has been fabricated, and as such, embodies labour, capital and other inputs (e.g. energy) and acknowledges that there is not necessarily a 'one-for one' relationship between the mill gate steel and the steel used by electricity service providers.319
We note, as emphasised by CEG, there is likely to be significant value adding and processing of the raw material before the physical asset is purchased.
CEG has provided data on historical indexed aluminium, copper, steel and crude oil actual (real) prices from July 2005 to December 2013 as well as forecast real prices from January 2014 to January 2021 which were used to determine its forecast escalation factors.320 For all four commodities, the CEG forecast indexed real prices showed a trend of higher prices compared to the historical trend. Aluminium and crude oil exhibited the greatest trend variance. Copper and steel prices were forecast to remain relatively stable whist aluminium and crude oil prices were forecast to rise significantly compared to the historical trend.
CEG report commissioned by ActewAGL, Ausgrid, Endeavour Energy, Essential Energy and TasNetworks
317 CEG Materials cost escalation factors: a report for SA Power Networks, August 2014, p. 13.318 CEG Materials cost escalation factors: a report for SA Power Networks, August 2014, p. 13.319 CEG Materials cost escalation factors: a report for SA Power Networks, August 2014, p. 16.320 CEG Materials cost escalation factors: a report for SA Power Networks, August 2014, pp. 15, 17 and 20.
122 Attachment 6 – Capital expenditure | Ergon Energy determination 2015–20

CEG was commissioned by Ausgrid, Endeavour Energy, Essential Energy, ActewAGL and TasNetworks to estimate cost escalation factors.321 In its report to these service providers, CEG has provided further information to support our position to not accept Ergon Energy's proposed materials cost escalation.
CEG acknowledged that forecasts of general cost movements (e.g. consumer price index or producer price index) can be used to derive changes in the cost of other inputs used by electricity service providers or their suppliers separate from material inputs (e.g. energy costs and equipment leases etc.).322 This is consistent with the Post-tax Revenue Model (PTRM) which reflects at least in part movements in an electricity service provider's intermediary input costs.
CEG acknowledged that futures prices will be very unlikely to exactly predict future spot prices given that all manner of unexpected events can occur.323 This is consistent with our view that there are likely to be a significant number of material exogenous factors that impact on the price of assets that are not captured by the material input cost assessment used by Ergon Energy.
Figures 1 and 2 of CEG’s report respectively show the variance between aluminium and copper prices predicted by the London Metals Exchange (LME) 3 month, 15 month and 27 month futures less actual prices between July 1993 and December 2013.324 Analysis of this data shows that the longer the futures projection period, the less accurate are LME futures in predicting actual commodity prices. Given the next regulatory control period covers a time span of 60 months we consider it reasonable to question the degree of accuracy of forecast futures commodity prices towards the end of this period.
Figures 1 and 2 also show that futures forecasts have a greater tendency towards over-estimating of actual aluminium and copper prices over the 20 year period (particularly for aluminium). The greatest forecast over-estimate variance was about 100 per cent for aluminium and 130 per cent for copper. In contrast, the greatest forecast under-estimate variance was about 44 per cent for aluminium and 70 per cent for copper.
SKM report SKM cautioned that there are a variety of factors that could cause business
conditions and results to differ materially from what is contained in its forward looking statements.325 This is consistent with our view that there are likely to be a significant number of material exogenous factors that impact on the cost of assets that are not captured by Ergon Energy's material input costs.
SKM stated it used the Australian CPI to account for those materials or cost items for equipment whose price trend cannot be rationally or conclusively explained by the movement of commodities prices.326
321 CEG, Escalation factors affecting expenditure forecasts, December 2013.322 CEG, Escalation factors affecting expenditure forecasts, December 2013, p. 3.323 CEG, Escalation factors affecting expenditure forecasts, December 2013, pp. 4−5.324 CEG, Escalation factors affecting expenditure forecasts, December 2013, pp. 5−6. 325 SKM, TransGrid Commodity Price Escalation Forecast 2013/14 − 2018/19, 9 December 2013, p. 4.326 SKM, TransGrid Commodity Price Escalation Forecast 2013/14 − 2018/19, 9 December 2013, p. 8.
123 Attachment 6 – Capital expenditure | Ergon Energy determination 2015–20

In its modelling of the exchange rate, SKM has in part adopted the longer term historical average of $0.80 USD/AUD as the long term forecast going forward.327 This is consistent with our view that longer term historical commodity prices should be considered when reviewing and forecasting future prices. In general, we consider that long term historical data has a greater number of observations and as a consequence is a more reliable predictor of future prices than a data time series of fewer observations.
SKM stated that the future price position from the LME futures contracts for copper and aluminium are only available for three years out to December 2016 and that in order to estimate prices beyond this data point, it is necessary to revert to economic forecasts as the most robust source of future price expectations.328 SKM also stated that LME steel futures are still not yet sufficiently liquid to provide a robust price outlook.329
SKM stated that in respect to the reliability of oil future contracts as a predictor of actual oil prices, futures markets solely are not a reliable predictor or robust foundation for future price forecasts. SKM also stated that future oil contracts tend to follow the current spot price up and down, with a curve upwards or downwards reflecting current (short term) market sentiment.330 SKM selected Consensus Economics forecasts as the best currently available outlook for oil prices throughout the duration of the next regulatory control period.331 The decision by SKM to adopt an economic forecast for oil rather than using futures highlights the uncertainty surrounding the forecasting of commodity prices.
BIS Shrapnel report BIS Shrapnel has forecast prices of gas service provider related materials to
increase, in part due to movements in the exchange rate. BIS Shrapnel are forecasting the Australian dollar to fall to US$0.77 from mid−2016 to mid−2018332. This is significantly lower than the exchange rate forecasts by SKM of between US$0.91 to US$0.85 from 2014−15 to 2018−19.333 CEG did not publish its exchange rate forecasts in its report but state that for the purposes of the report it sourced forward rates from Bloomberg until 2023.334 BIS Shrapnel stated that exchange rate forecasts are not authoritative over the long term.335
We consider the forecasting of foreign exchange movements during the next regulatory control period to be another example of the potential inaccuracy of modelling for material input cost escalation.
327 SKM, TransGrid Commodity Price Escalation Forecast 2013/14 − 2018/19, 9 December 2013, p. 9.328 SKM, TransGrid Commodity Price Escalation Forecast 2013/14 − 2018/19, 9 December 2013, p. 12.329 SKM, TransGrid Commodity Price Escalation Forecast 2013/14 − 2018/19, 9 December 2013, p.16.330 SKM, TransGrid Commodity Price Escalation Forecast 2013/14 − 2018/19, 9 December 2013, p. 18.331 SKM, TransGrid Commodity Price Escalation Forecast 2013/14 − 2018/19, 9 December 2013, p. 20.332 BIS Shrapnel, Real Labour and Material Cost Escalation Forecasts to 2019/20 - Australia and New South Wales,
April 2014, p. 6.333 SKM, TransGrid Commodity Price Escalation Forecast 2013/14 − 2018/19, 9 December 2013, p. 10.334 SKM, TransGrid Commodity Price Escalation Forecast 2013/14 − 2018/19, 9 December 2013, p. 9.335 BIS Shrapnel, Real Labour and Material Cost Escalation Forecasts to 2019/20 - Australia and New South Wales,
April 2014, p. A-7.
124 Attachment 6 – Capital expenditure | Ergon Energy determination 2015–20

In its forecast for general materials such as stationary, office furniture, electricity, water, fuel and rent, BIS Shrapnel assumed that across the range of these items, the average price increase would be similar to consumer price inflation and that the appropriate cost escalator for general materials is the CPI.336 This treatment of general business inputs supports our view that where we cannot be satisfied that a forecast of real cost escalation for a specific material input is robust, and cannot determine a robust alternative forecast, zero per cent real cost escalation is reasonably likely to reflect the capex criteria and under the PTRM the electricity service provider's broad range of inputs are escalated annually by the CPI.
Comparison of independent expert's cost escalation factors
To illustrate the potential uncertainty in forecasting real material input costs, we have compared the material cost escalation forecasts derived by the consultants as shown in Table D.11 .
Table D.11 Real material input cost escalation forecasts (per cent)
2015–16 (%)
2016–17 (%)
2017–18 (%)
2018–19 (%)
2019–20 (%)
Aluminium
CEG
SKM
BIS Shrapnel
Range (low to high)
2.9
4.69
1.4
1.4 to 4.69
2.1
4.88
5.6
4.88 to 5.6
1.7
3.09
3.9
3.09 to 3.9
1.5
4.42
11.0
1.5 to 11.0
1.5
2.97
-6.5
-6.5 to 1.5
Copper
CEG
SKM
BIS Shrapnel
Range (low to high)
-0.9
-0.17
-0.9
-0.9 to 0.17
-1.0
0.17
-1.5
-1.5 to 0.17
-0.2
-1.15
0.3
-1.15 to 0.3
-0.3
-0.16
9.3
-0.3 to 9.3
-0.2
-1.45
-8.7
-8.7 to -0.2
Steel
CEG
SKM
BIS Shrapnel1
Range (low to high)
3.1
2.84
5.1
2.84 to 5.1
0.5
2.45
1.0
1.0 to 2.45
0.1
-0.35
-0.2
-0.35 to 0.1
0.0
0.38
8.0
0.3 to 8.0
0.1
-1.11
-8.9
0.1 to -8.9
336 BIS Shrapnel, Real Labour and Material Cost Escalation Forecasts to 2019/20 - Australia and New South Wales, April 2014, p. 48.
125 Attachment 6 – Capital expenditure | Ergon Energy determination 2015–20

Oil
CEG
SKM
BIS Shrapnel2
Range (low to high)
1.6
-5.11
1.4
-5.11 to 1.6
1.3
-0.79
-1.1
-1.1 to 1.3
1.1
0.74
-0.2
-0.2 to 1.1
1.0
1.85
6.5
1.85 to 6.5
1.1
0.51
-6.2
-6.2 to 1.1
Source: SA Power Networks, Revenue proposal, Attachment 20.3, CEG Materials cost escalation factors: a report
for SA Power Networks, August 2014, pp. 15, 17, and 19, SKM, TransGrid Commodity Price Escalation
Forecast 2013/14 − 2018/19, 9 December 2013, p. 2 and BIS Shrapnel, Real Labour and Material Cost
Escalation Forecasts to 2019/20 - Australia and New South Wales, April 2014, p. iii.1 Asian market price as BIS Shrapnel believes the Asia market is more appropriate.337
2 BIS Shrapnel have forecast plastics prices based on price changes in Nylon-11 and HDPE (Polyethylene).
BIS Shrapnel state that Castor Oil is the key raw material of Nylon-11 and because it does not have any
historical data on Castor Oil, it has approximated Nylon-11 by using HDPE growth rates. HDPE
(Polyethylene) prices are proxied by BIS Shrapnel using Manufacturing Wages, General Materials, and
Thermoplastic Resin prices. BIS Shrapnel state that Thermoplastic Resin is primarily driven by Crude Oil.338
As Table D.11 shows, there is considerable variation between the consultant’s commodities escalation forecasts. The greatest margin of variation is 9.6 per cent for copper in 2018-19, where CEG has forecast a real price decrease of 0.3 per cent and BIS Shrapnel a real price increase of 9.3 per cent. BIS Shrapnel’s forecasts exhibit the greatest margin of variation but there also considerable variation between CEG and SKM’s forecasts. These forecast divergences between consultants further demonstrate the uncertainty in the modelling of material input cost escalators to reliably and accurately estimate the prices of intermediate outputs used by service providers to provide network services. This supports our view that Ergon Energy's forecast real material cost escalators do not reasonably reflect a realistic expectation of the cost inputs required to achieve the capex objectives over the 2015–20 regulatory control period.339
D.6 Conclusions on materials cost escalationWe are not satisfied that Ergon Energy has demonstrated that the weightings
applied to the intermediate inputs have produced unbiased forecasts of the movement in the prices it expects to pay for its physical assets. In particular, Ergon Energy has not provided sufficient evidence to show that the changes in the prices of the assets they purchase are highly correlated to changes in raw material inputs.
CEG, in its reports to electricity service providers, identified a number of factors which are consistent with our view that Ergon Energy's input costs proposal has not demonstrated how and to what extent material inputs are likely to affect the cost of assets. CEG stated that futures prices are unlikely to exactly predict future spot prices 337 BIS Shrapnel, Real Labour and Material Cost Escalation Forecasts to 2019/20 - Australia and New South Wales,
April 2014, p. 40.338 BIS Shrapnel, Real Labour and Material Cost Escalation Forecasts to 2019/20 - Australia and New South Wales,
April 2014, p. iii.339 NER, cl. 6.5.7(a).
126 Attachment 6 – Capital expenditure | Ergon Energy determination 2015–20

given that all manner of unexpected events can occur.340 CEG also stated that while futures prices and forecasts today may well be a very precise estimate of current expectations of the future, they are at best an imprecise estimate of future values.341
Recent reviews of commodity price movements show mixed results for commodity price forecasts based on futures prices. Further, nominal exchange rates are in general extremely difficult to forecast and based on the economic literature of a review of exchange rate forecast models, a “no change” forecasting approach may be preferable.
We are not satisfied that a forecast of real cost escalation for materials is robust. We consider that in the absence of a robust alternative forecast, then real cost escalation should not be applied in determining a service provider's required capital expenditure. We accept that there is uncertainty in estimating real cost changes but we consider the degree of the potential inaccuracy of commodities forecasts is such that there should be no escalation for the price of input materials used by Ergon Energy to provide network services.
In previous AER decisions, namely our final decisions for Envestra's Queensland and South Australian networks, we took a similar approach. This was on the basis that as all of Envestra's real costs are escalated annually by CPI under its tariff variation mechanism, CPI must inform the AER's underlying assumptions about Envestra's overall input costs. Consistent with this, we applied zero real cost escalation and by default Envestra's input costs were escalated by CPI in the absence of a viable and robust alternative. Likewise, for Ergon Energy we consider that in the absence of a well-founded materials cost escalation forecast, escalating real costs annually by the CPI is the better alternative that will contribute to a total forecast capex that reasonably reflects the capex criteria.
The CPI can be used to account for the cost items for equipment whose price trend cannot be conclusively explained by the movement of commodities prices. This approach is consistent with the revenue and pricing principles of the NEL which provide that a regulated network service provider should be provided with a reasonable opportunity to recover at least the efficient costs it incurs in providing direct control network services.342
D.7 Labour and construction escalatorsOur approach to real materials cost escalation does not affect the application of
labour and construction cost escalators, which will continue to apply to standard control services capital and operating expenditure.
We consider that labour and construction cost escalation more reasonably reflects a realistic expectation of the cost inputs required to achieve the opex and capex objectives.343 We consider that real labour and construction cost escalators can be
340 CEG, Escalation factors affecting expenditure forecasts, December 2013, pp. 4–5.341 CEG, Escalation factors affecting expenditure forecasts, December 2013, p. 13.342 NEL, s. 7(2).343 NER, cll. 6.5.6(c)(3) and.6.5.7(c)(3).
127 Attachment 6 – Capital expenditure | Ergon Energy determination 2015–20

more reliably and robustly forecast than material input cost escalators, in part because these are not intermediate inputs and for labour escalators, productivity improvements have been factored into the analysis (refer to attachment 7 − opex attachment).
Construction costs can be forecast with greater precision because the drivers (construction and manufacturing wages, plant equipment and other fabricated metal products, and plant and equipment hire) are reasonably transparent and can be predicted with some degree of accuracy.
Further details on our consideration of labour cost escalators are discussed in attachment 7.
128 Attachment 6 – Capital expenditure | Ergon Energy determination 2015–20

E Predictive modelling approach and scenarios
This section provides a guide to our repex modelling process. It sets out:
the background to the repex modelling techniques
discussion of the data required to apply the repex model
detail on how this data was specified
description of how this data was collected and refined for inclusion in the repex model
the outcomes of the repex model under various input scenarios
This supports the detailed and multifaceted reasoning outlined in appendix A.
E.1 Predictive modelling techniquesIn late 2012 the AEMC published changes to the National Electricity and Gas Rules.344 In light of these rule changes we undertook a “Better Regulation” work program, which included publishing a series of guidelines setting out our approach to regulation under the new rules.345
The Expenditure Guideline describes our approach, assessment techniques and information requirements for setting efficient expenditure allowances for distributors.346 It lists predictive modelling as one of the assessment techniques we may employ when assessing a distributor's repex. We first developed and used our repex model in our 2009 review of the Victorian electricity distributors' 2011–15 regulatory proposals and have also used it subsequently.347
The technical underpinnings of the repex model are discussed in detail in the Replacement expenditure model handbook.348 At a basic level, the model predicts the volume of a distributor's assets that may need to be replaced over each of the next 20 years. This prediction is made by looking at the age of assets already in commission, and the time at which, on average, these assets would be expected to be replaced. The unit cost of replacing the assets is used to provide an estimate of replacement expenditure. The data used in the model is derived from the distributor’s regulatory information notice (RIN) responses and from the outcomes of the unit cost and replacement life benchmarking across all distribution businesses in the NEM. These processes are described below.
344 AEMC, Rule Determination, National Electricity Amendment (Economic Regulation of Network Service Providers) Rule 2012, 29 November 2012.
345 See AER Better regulation reform program web page at http://www.aer.gov.au/Better-regulation-reform-program.346 AER, Expenditure Forecast Assessment Guideline for Electricity Distribution, November 2013; AER, Expenditure
Forecast Assessment Guideline for Electricity Transmission, November 2013.347 AER, Determinations for 2011–15 for CitiPower, Jemena, Powercor, SP AusNet, and United Energy.348 AER, Electricity network service providers, Replacement expenditure model handbook, November 2013.
129 Attachment 6 – Capital expenditure | Ergon Energy determination 2015–20

E.2 Data specification processOur repex model requires the following input data on a distributor's network assets:
the age profile of network assets currently in commission
expenditure and replacement volume data of network assets
the mean and standard deviation of each asset’s replacement life (replacement life)
Given our intention to apply unit cost and replacement life benchmarking techniques, we defined the model’s input data around a series of prescribed network asset categories. We collected this information by issuing, in March 2014, two types of RINs:
1. "Reset RINs" which we issued to distributors requiring them to submit this information with their upcoming regulatory proposal
2. "Category analysis RINs" which we issued to all/other distributors in the NEM.
The two types of RIN requested the same historical asset data for use in our repex modelling. The Reset RIN also collected data corresponding to the distributors proposed forecast repex over the 2015–20 regulatory control period. In both RINs, the templates relevant to repex are sheets 2.2 and 5.2.
For background, we note that in past determinations, our RINs did not specify standardised network asset subcategories for distributors to report against. Instead, we required the distributors to provide us data that adhered to broad network asset groups (e.g. poles, overhead conductors etc.). This allowed the distributor discretion as to how its assets were subcategorised within these groups. The limited prescription over asset types meant that drawing meaningful comparisons of unit costs and replacement lives across distributors was difficult.349
Our changed approach of adopting a standardised approach to network asset categories provides us with a dataset suitable for comparative analysis, and better equips us to assess the relative prices of capital inputs as required by the capex criteria.350
When we were formulating the standardised network assets, we aimed to differentiate the asset categorisations where material differences in unit cost and replacement life existed. Development of these asset subcategories involved extensive consultation with stakeholders, including a series of workshops, bilateral meetings and submissions on data templates and draft RINs.351
E.3 Data collection and refinement
349 The repex model has been applied in the Victorian 2011–15 and Aurora Energy 2012–17 distribution determinations; AER, Electricity network service providers Replacement expenditure model handbook, November 2013.
350 NER, cl. 6.5.7(e)(6).351 See AER Expenditure forecast assessment guideline—Regulatory information notices for category analysis
webpage at http://www.aer.gov.au/node/21843.
130 Attachment 6 – Capital expenditure | Ergon Energy determination 2015–20

The new RINs represent a shift in the data reporting obligations on distributors. Given this is the first period in which the distributors have had to respond to the new RINs, we undertook regular consultation with the distributors. This consultation involved collaborative and iterative efforts to refine the datasets to better align the data with what the AER requires to deploy our assessment techniques. We consider that the data refinement and consultation undertaken after the RINs were received, along with the extensive consultation carried out during the Better Regulation process provide us with reasonable assurance of the data's quality for use in this part of our analysis.
To aid distributors, an extensive list of detailed definitions was included as an appendix to the RINs. Where possible, these definitions included examples to assist distributors in deciding whether costs or activities should be included or excluded from particular categories. We acknowledge that, regardless of how extensive and exhaustive these definitions are, they cannot cater for all possible circumstances. To some extent, distributors needed to apply discretion in providing data. In these instances, distributors were required to clearly document their interpretations and assumptions in a “basis of preparation” statement accompanying the RIN submission.
Following the initial submissions, we assessed the basis of preparation statements that accompanied the RINs to determine whether the data submitted complied with the RINs. We took into account the shift in data reporting obligations under the new RINs when assessing the submissions. Overall, we considered that the repex data provided by all distributors was compliant. We did find a number of instances where the distributors’ interpretations did not accord with the requirements of the RIN but for the purpose of proceeding with our assessment of the proposals, these inconsistencies were not substantial enough for a finding of non-compliance with the NEL or NER requirements.352
Nonetheless, in order that our data was the most up to date and accurate, we did inform distributors, in detailed documentation, where the data they had provided was not entirely consistent with the RINs, and invited them to provide updated data. Refining the repex data was an iterative process, where distributors returned amended consolidated RIN templates until such time that the data submitted was fit for purpose.
E.4 Benchmarking repex asset dataAs outlined above, we required the following data on distributors' assets for our
repex modelling:
age profile of network assets currently in commission
expenditure, replacement volumes and failure data of network assets
the mean and standard deviation of each asset’s replacement life.
All NEM distributors provided this data in the Reset RINs and Category analysis RINs under standardised network asset categories.
352 NER, cl. 6.9.1.
131 Attachment 6 – Capital expenditure | Ergon Energy determination 2015–20

To inform our expenditure assessment for the distributors currently undergoing revenue determinations,353 we compared their data to the data from all NEM distributors. We did this by using the reported expenditure and replacement volume data to derive benchmark unit costs for the standardised network asset categories. We also derived benchmark replacement lives (the mean and standard deviation of each asset’s replacement life) for the standardised network asset categories.
In this section we explain the data sets we constructed using all NEM distributors' data, and the benchmark unit costs and replacement lives we derived for the standardised network asset categories.
E.4.1 Benchmark data for each asset category
For each standardised network asset category where distributors provided data we constructed three sets of data from which we derived the following three sets of benchmarks:354
benchmark unit costs
benchmark means and standard deviations of each asset’s replacement life (referred to as "uncalibrated replacement lives" to distinguish these from the next category)
benchmark calibrated means and standard deviations of each asset’s replacement life.
Our process for arriving at each of the benchmarks was as follows. We calculated a unit cost for each NEM distributor in each asset category in which it reported replacement expenditure and replacement volumes. To do this:
We determined a unit cost for each distributor, in each year, for each category it reported under. To do this we divided the reported replacement expenditure by the reported replacement volume.
Then we determined a single unit cost for each distributor for each category it reported under. We first inflated the unit costs in each year using the CPI index.355 We then calculated a single unit cost. We did this by first weighting the unit cost from each year by the replacement volume in that year. We then divided the total of these expenditures by the total replacement volume number.
We formulated two sets of replacement life data for each NEM distributor:
The replacement life data all NEM distributors reported in their RINs.
The replacement life data we derived using the repex model for each NEM distributor. These are also called calibrated replacement lives. The repex model derives the replacement lives that are implied by the observed replacement practices of a distributor. That is, based on the data a distributor reported in the
353 NSW, ACT, SA and QLD distribution network service providers—Ausgrid, Endeavour Energy, Essential Energy, ActewAGL, SA Power Networks, Energex and Ergon Energy.
354 We did not derive benchmark data for some standardised asset categories where no values were reported by any distributors, or for categories distributors created outside the standardised asset categories.
355 We took into account whether the distributor reported on calendar or financial year basis.
132 Attachment 6 – Capital expenditure | Ergon Energy determination 2015–20

RIN on its replacement expenditure and volumes over the most recent five years, and the age profile of its network assets currently in commission. The calibrated lives the repex model derives can differ from the replacement lives a distributor reports.
We derived the benchmarks for an asset category using each of the three data sets above. That is, we derived a set of benchmark unit costs, benchmark replacement lives, and benchmark calibrated replacement lives for an asset category. To differentiate the two sets of benchmarked replacement lives, we refer to the benchmarks based on the calibration process as 'benchmarked calibrated replacement lives' and those based on replacement lives reported by the NEM distributors as 'benchmarked uncalibrated replacement lives'. We applied the method outlined below to each of the three data sets.
We first excluded Ausgrid's data, since it reported repex values as direct costs and overheads. Therefore these expenditures were not comparable to all other NEM distributors which reported replacement expenditure as direct costs only. We then excluded outliers by:356
calculating the average of all values for an asset category
determining the standard deviation of all values for an asset category
excluding values that were outside plus or minus one standard deviation from the average.
Using the data set excluding outliers we then determined the:
Average value:
o benchmark average unit cost
o benchmark average mean and standard deviation replacement life
o benchmark average calibrated mean and standard deviation replacement life.
One quartile better than the average value:
o benchmark first quartile unit cost (below the mean)
o benchmark third quartile uncalibrated mean replacement life (above the mean)
o benchmark third quartile calibrated mean replacement life (above the mean).
'Best' value:
o benchmark best (lowest) unit cost
356 For the benchmarked calibrated replacement lives we performed two additional steps on the data prior to this. We excluded any means where the distributor did not report corresponding replacement expenditure. This was because zero volumes led to the repex model deriving a large calibrated mean which may not reflect industry practice and may distort the benchmark observation. We also excluded any calibrated mean replacement lives above 90 years. Although the repex model can generate these large lives, observations of more than 90 years exceed the number of years reportable in the asset age profile.
133 Attachment 6 – Capital expenditure | Ergon Energy determination 2015–20

o benchmark best (highest) uncalibrated mean replacement life
o benchmark best (highest) calibrated mean replacement life.357
E.5 Repex model scenariosAs noted above, our repex model uses an asset age profile, expected replacement
life information and the unit cost of replacing assets to develop an estimate of replacement volume and expenditure over a 20 year period.
The asset age profile data provided by the distributors is a fixed piece of data. That is, it is set, and not open to interpretation or subject to scenario testing.358 However, we have multiple data sources for replacement lives and unit costs, being the data provided by the distributors, data that can be derived from their performance over the last five years, and benchmark data from all distributors across the NEM. The range of different inputs allows us to run the model under a number of different scenarios, and develop a range of outcomes to assist in our decision making.
We have categorised three broad input scenarios under which the repex model may be run. These are explained in greater detail within our Replacement expenditure model handbook.359 They are:
(1) The Base scenario – the base scenario uses inputs provided by the distributor in their RIN response. Each distributor provided average replacement life data as part of this response. As the distributors did not explicitly provide an estimate of their unit cost, we have used the observed historical unit cost from the last five years and the forecast unit cost from the upcoming regulatory control period in the base scenario.
(2) The Calibrated scenario – the process of “calibrating” the expected replacement lives in the repex model is described in our repex handbook.360 The calibration involves determining a replacement life and standard deviation that matches the distributor's recent historical level of replacement (in this case, the five years from 2010–11 to 2014–15). The calibrated scenario benchmarks the business to its own observed historical replacement practices.
(3) The Benchmarked scenarios – the benchmarked scenarios use unit cost and replacement life inputs from the category analysis benchmarks. These represent
357 We did not determine quartile or best values for the standard deviation and calibrated standard deviation replacement lives. This is because we used the benchmark average replacement lives (mean and standard derivation) for comparative analysis between the distributors. However, the benchmark quartile and best replacement life data was for use in the repex model sensitivity analysis. The repex model only requires the mean component of an asset's replacement life as an input. The repex model then assumes the standard deviation replacement life of an asset is the square root of the mean replacement life. The use of a square root for the standard deviation is explained in more detail in our Replacement expenditure model handbook; AER, Electricity network service providers, Replacement expenditure model handbook, November 2013.
358 It has been necessary for some service providers to make assumptions on the asset age profile to remove double counting. This is detailed at the end of this appendix.
359 AER, Electricity network service providers, Replacement expenditure model handbook, November 2013.360 AER, Electricity network service providers, Replacement expenditure model handbook, November 2013, pp. 20–
21.
134 Attachment 6 – Capital expenditure | Ergon Energy determination 2015–20

the observed costs and replacement behaviour from distributors across the NEM. As noted above, we have made observations for an “average”, “first or third quartile” and “best performer” for each repex category, so there is no single "benchmarked" scenario, but a series of scenarios giving a range of different outputs.
The model also takes account of different wooden pole staking/stobie pole plating rate assumptions (see section E.3 for more information on this process). A full list of the scenario outcomes is provided in Figure E.7 and E.2 below.
Figure E.7 Repex model outputs – replacement lives
Replacement lives
Base case (RIN) $4,357,227.30
Calibrated lives $711,120.96
Benchmarked uncalibrated average $4,678,159.48
Benchmarked uncalibrated third quartile $3,222,039.89
Benchmarked uncalibrated best $2,943,203.42
Benchmarked calibrated average $566,461.35
Benchmarked calibrated third quartile $429,320.40
Benchmarked calibrated best $279,425.36
Source: AER analysis, using forecast unit cost.
Figure E.8 Repex model outputs − unit costs
Unit cost
Benchmarked average $736,494.36
Benchmarked first quartile $517,036.88
Benchmarked best $387,504.77
Source: AER analysis, using calibrated replacement lives.
Data assumptions
Certain data points were not available for use in the model. For unit costs, this arose either because the service provider did incur any expenditure on an asset category in the 2010–15 regulatory control period (used to derive historical unit costs) or had not proposed any expenditure in the 2015–20 regulatory control period (used to derive forecast unit costs). If both these inputs were not available, we used the benchmarked average unit cost as a substitute input.
In addition, we did not use a calibrated asset replacement life where the service provider did not replace any assets during the 2010–15 regulatory control period. This
135 Attachment 6 – Capital expenditure | Ergon Energy determination 2015–20

is because the calibration process relies on replacement volumes over the five year period to derive a mean and standard deviation, and using a value of zero may not be appropriate for this purpose. In the first instance, we substituted these values with the average calibrated replacement life of the broad asset group to which the asset subcategory belonged. Where this was not available, we used the benchmarked calibrated replacement life or the base case replacement life from the service provider.
Un-modelled repex
As detailed in our repex handbook, the repex model is most suitable for asset categories and groups with a moderate to large asset population of relatively homogenous assets. It is less suitable for assets with small populations or those that are relatively heterogeneous. For this reason, we chose to exclude certain data from the modelling process, and did not use predictive modelling to directly assess these categories. We decided to exclude SCADA repex from the model for this reason. Expenditure on pole top structures was also excluded, as it is related to expenditure on overall pole replacement and modelling may result in double counting of replacement volumes. Other excluded categories are detailed in appendix A.3 of this preliminary decision.
E.6 The treatment of staked wooden poles and plated stobie poles
The staking of a wooden pole is the practice of attaching a metal support structure (a stake or bracket) to reinforce an aged wooden pole.361 The practice has been adopted by distributors as a low-cost option to extend the life of a wooden pole. These assets require special consideration in the repex model because, unlike most other asset types, they are not installed or replaced on a like for like basis. To understand why this requires special treatment, we have described below the normal like-for-like assumption used in the repex model, why staked poles do not fit well within this assumption, and how we adapt the model inputs to take account of this.
E.6.1 Like-for-like repex modelling
Replacement expenditure is normally considered to be on a like-for-like basis. When an asset is identified for replacement, it is assumed that the asset will be replaced with its modern equivalent, and not a different asset. For example, conductor rated to carry low voltage will be replaced with conductor of the same rating, not conductor rated for high voltage purposes.
The repex model predicts the volume of old assets that need to be replaced, not the volume of new assets that need to be installed. This is simple to deal with when an asset is replaced on a like-for-like basis—the old asset is simply replaced by a new 361 The equivalent practice for stobie poles is known as "plating", which similarly provides a low cost life extension.
SA Power Networks carries out this process. We applied the same process for modelling SA Power Networks' stobie pole plating data as we have for staked wooden poles. However, for simplicity, this section only refers to the staking process.
136 Attachment 6 – Capital expenditure | Ergon Energy determination 2015–20

asset of the same kind. It follows that the volume of assets that needs to be replaced where like-for-like replacement is appropriate match the volume of new assets to be installed. The cost of replacing the volume of retired assets is the unit cost of the new asset multiplied by the volume of assets that need to be replaced.
E.6.2 Non-like-for-like replacement
Where old assets are commonly replaced with a different asset, we cannot simply assume the cost of the new asset will match the cost of the old asset's modern equivalent. As the repex model predicts the number of old assets that need to be replaced, it is necessary to make allowances for the cost of a different asset in determining the replacement cost. In running the repex model, the only category where this was significant was wooden poles (or stobie poles for SA Power Networks).
Staked and unstaked wooden poles
The life of a wooden pole may be extended by installing a metal stake to reinforce its base. Staked wooden poles are treated as a different asset in the repex model to unstaked poles. This is because staked and unstaked poles have different expected lives and different costs of replacement.
When a wooden pole needs to be replaced, it will either be staked or replaced with a new pole. The decision on which replacement type will be carried out is made by determining whether the stake will be effective in extending the pole's life, and is usually based on the condition of the pole base. If the wood at the base has deteriorated too far, staking will not be effective, and the pole will need to be replaced. If there is enough sound wood to hold the stake, the life of the pole can be extended, and a stake can be installed. Consequently, there are two possible asset replacements (and two associated unit costs) that may be made by the distributor—a new pole to replace the old one or nailing a stake the old pole.
The other non-like-for-like scenario related to staking is where an in-commission staked pole needs to be replaced. Staking is a one-off process. When a staked pole needs to be replaced, a new pole must be installed in its place. The cost of replacing an in-commission staked pole is the cost of a new pole.
Unit cost blending
We use a process of unit cost blending to account for the non-like-for-like asset categories.
For unstaked wooden poles that need to be replaced, there are two appropriate unit costs: the cost of a new pole; and the cost of staking an old pole. We have used a weighted average between the unit cost of staking and the unit cost of pole replacement to arrive at a blended unit cost.362 We ran the model under a variety of
362 For example, if a distributor replaces a pole with a new pole 50 per cent of the time, and stakes the pole the other 50 per cent of the time, the blended unit cost would be a straight average of the two unit costs. If the mix was 60:40, the unit cost would be weighted accordingly.
137 Attachment 6 – Capital expenditure | Ergon Energy determination 2015–20

different weightings – including the observed staking rate of the business and observed best practice from the distributors in the NEM.
For SA Power Networks (stobie plating) and Ergon Energy, we adopted their own observed plating/staking ratio, respectively. Energex, however, exhibited a staking ratio of 24 per cent. This is lower than peer urban networks such as Ausgrid and ActewAGL, and, indeed, lower than Ergon Energy's staking rate of 46 per cent on its predominantly rural network. Energex does not appear to achieve significantly longer lives on its poles than these three service providers (the weighted calibrated replacement life of its pole assets group is 56 years, while the figure for Ausgrid is 59 years). By contrast, Essential Energy, which also has a low staking rate, achieves longer lives than the other service providers (the weighted calibrated replacement life of its pole assets group is 66 years). As such, it appears that Energex predominantly chooses to replace its wooden poles earlier than other distributors, and does not utilise staking to the same extent. We consider that Energex's staking rate is lower than would be expected, given the age at which its assets reach replacement age and the practices of its peers. Consequently, we have applied in our modelling a benchmarked rate equivalent to Ausgrid's staking rate of 47 per cent.
For staked wooden poles being replaced, in the first instance, we used historical data from the distributors on the proportion of different voltage staked wooden poles being replaced to approximate the volume of each new asset going forward.363 The unit cost of replacing a staked wooden pole is a weighted average based on the historical proportion of pole types replaced. Where historical data was not available, we used the asset age data to determine what proportion of the network each pole category represented, and used this information to weight the unit costs.
E.7 Calibrating staked wooden polesSpecial consideration also has to be given to staked wooden poles when finding
replacement lives. This is because historical volumes of replacements are used in calibration. The RIN responses provide us with information on the volume of new assets installed over the last five years. However, the model predicts the volume of old assets being replaced − so an adjustment needs to be made for the calibration process to function correctly. We sought this information directly from the distributors. It should be noted that staking of wooden poles is a relatively recent activity, and we have not observed a large number of historical replacements of these assets by the distributors.
For SA Power Networks' stobie pole plating, we did not apply the calibration process. This is because SA Power Networks has only carried out the plating process for the past ten years. SA Power Networks submits that the average replacement life of a plated stobie pole is around 20 years. Given it has no assets in commission that have reached this age, this asset is not suitable for calibration. We have utilised the base case replacement life submitted by SA Power Networks in all iterations of the model.
363 Poles with different maximum voltages have different unit costs. An assumption needs to be made to determine, for example, how many new ">1kv poles" and how many new "1kv-11kv" need to be installed to replace the staked wooden poles.
138 Attachment 6 – Capital expenditure | Ergon Energy determination 2015–20

Wooden pole asset adjustment (Ergon Energy)
Ergon Energy reported its staked wooden poles twice in its asset age profile: once as "staking of a wooden pole" and a second time under one of the six wooden pole categories. This resulted in the double counting of its wooden poles. Using the data "as is" in the repex model would result in the double counting of these assets. Consequently, we made an adjustment to Ergon Energy's wooden pole data to net out the double counted assets.
The adjustment required involves subtracting the total number of staked poles from the total number of wooden poles in commission. We decided to do carry out this adjustment proportionally across the wooden pole asset base. We also assumed that no new pole installed after 1985 would have required staking (or the number would be negligible) so the adjustment would be applied to the pre-1985 asset base.
To make this adjustment, the total number of wooden poles in commission (with an installation date of 1985 or before) was calculated. Then we found the proportion of the total that each category of wooden poles made up in each year. The total number of staked poles was multiplied by these proportions to give an adjustment figure. This figure was then subtracted from the asset age profile.
Our approach allocates the adjustment across each year of the age profile, rather than attempting to make targeted adjustments at particular years, or bias the adjustment in favour of older poles. Given the expected lives of wooden poles (50+ years), it is likely that a greater number of the stakings were carried out on the older poles in the asset base than newer poles (that is, a pole that is over 50 years old is more likely to be staked than a pole that is under 50). Assuming this is correct, applying a constant allocation of the staking to all pre-1985 poles may result in a greater number of newer poles being netted out and fewer old poles being netted out than we would expect in practice. Under this circumstance, we would expect the repex model to calculate a greater volume of replacements than it would if the adjustments were distributed with an asymmetric bias towards older poles. Consequently, the approach does not disadvantage Ergon Energy, as it is not likely to result in an underestimation of their replacement requirements, and is more likely to skew in favour of replacement.
139 Attachment 6 – Capital expenditure | Ergon Energy determination 2015–20

F Contingent projects For the 2015–20 regulatory control period, Ergon Energy proposed two contingent projects. The two nominated contingent projects are Aquis Great Barrier Reef Resort development (Aquis development) and a general contingent project for large customer connections.
Generally, contingent projects are significant network augmentation projects that are reasonably required to be undertaken in order to achieve the capex objectives. However, unlike other proposed capex projects, the need for the project and the associated costs are not sufficiently certain. Consequently, expenditure for such projects does not form a part of our assessment of the total forecast capex that we approve in this determination. Such projects are linked to unique investment drivers (rather than general investment drivers such as expectations of load growth in a region) and are triggered by a defined ‘trigger event’. The occurrence of the trigger event must be probable during the relevant regulatory control period.364
If, during the regulatory control period, the distributor considers that the trigger event has occurred, then it may apply to us. At that time, we will assess whether the trigger event has occurred and the project meets the threshold. If satisfied of both, we would determine the efficient incremental revenue which is likely to be required in each remaining year of the regulatory control period as a result of the contingent project, and amend the revenue determination accordingly.365
F.1 PositionWe are not satisfied that Ergon Energy's two proposed contingent projects meet
the NER criteria for contingent projects. In particular:
We are not satisfied that the Aquis development project is reasonably required to be undertaken in order to achieve the capex objectives.366 We consider that Ergon Energy has relied upon an inflated demand forecast and has not fully explored options to defer the proposed project into future regulatory control periods. Further we are not satisfied that the trigger events satisfy the NER criteria.367 Finally, we note that this does not meet the threshold for a contingent project.
We do not consider that the general contingent project for large customer connections satisfies the definition of a contingent project, because no actual project has been identified.
F.2 Assessment approach
364 NER, cl. 6.6A.1(c)(5).365 NER, cl. 6.6A.2.366 NER, cl. 6.6A.1 (b)(4).367 NER, cl. 6.6A.1 (b)(4); 6.6A.1(c)(5).
140 Attachment 6 – Capital expenditure | Ergon Energy determination 2015–20

We reviewed each of Ergon Energy's proposed contingent projects against the NER requirements.368 In considering Ergon Energy's proposed contingent projects we had regard to:
Ergon Energy's regulatory proposal, including attachments and supporting material
Submissions.369
We considered whether:
the proposed contingent project is reasonably required to be undertaken in order to achieve any of the capex objectives.370
the proposed contingent project capital expenditure is not otherwise provided for in the capex proposal.371 (Most relevantly, a distributor must include forecast capex in its revenue proposal which it considers is required in order to meet or manage expected demand for standard control services over the regulatory control period.372)
the proposed contingent project capital expenditure reasonably reflects the capex criteria, taking into account the capex factors.373 Importantly this requires the expenditure to be efficient.
the proposed contingent project capital expenditure exceeds the defined threshold.374
the trigger events are appropriate. This includes having regard to the need for the trigger event:
o to be reasonably specific and capable of objective verification.375
o to be a condition or event which, if it occurs, makes the project reasonably necessary in order to achieve any of the capex objectives.376
o to be a condition or event that generates increased costs or categories of costs that relate to a specific location rather than a condition or event that affects the transmission network as a whole.377
o is described in such terms that it is all that is required for the revenue determination to be amended.378
o is probable during the 2015–20 regulatory control period but the inclusion of capex in relation to it (in the total forecast capex) is not appropriate because either it is not sufficiently certain that the event or condition will occur during
368 NER, cl. 6.6A.1.369 The AER received submissions on contingent projects from electricity generators and the Energy Users
Association of Australia.370 NER, cl. 6.6A.1 (b)(1).371 NER, cl. 6.6A.1 (b)(2)(i).372 NER, cl. 6.5.7(a)(1).373 NER, cl. 6.6A.1(b)(2)(ii).374 NER, cl. 6.6A.1(b)(2)(iii).375 NER, cl. 6.6A.1(c)(1).376 NER, cl. 6.6A.1(c)(2).377 NER, cl. 6.6A.1(c)(3)378 NER, cl. 6.6A.1(c)(4).
141 Attachment 6 – Capital expenditure | Ergon Energy determination 2015–20
the regulatory control period or if it may occur after that period or not at all; or (and assuming it meets the threshold) the costs associated with the event or condition are not sufficiently certain.379
We also considered the interaction between the total forecast capex that we approve and projects proposed as contingent projects. This interaction reflects the ways that a distributor may recover its expenditure on capex. As set out in attachment 6, we have approved an estimate of total forecast capex that Ergon Energy requires for the regulatory control period. Our assessment of what a service provider needs includes consideration of the foreseeable increases in demand across the network during the regulatory control period and to some extent, assessing the probability of a range of projects. Where a distributor has proposed a project in its revenue proposal and that project is provided for in the total forecast capex which we accept, it cannot also be included as a contingent project.380 Further, to the degree that the approved capex forecast included an allowance for increased demand across the network, we need to consider whether the project is already covered by this forecast.
F.3 Ergon Energy's proposalErgon Energy proposed two contingent projects in its revenue proposal. Table F.12
lists Ergon Energy's proposed contingent projects, proposed trigger events and estimated costs. These contingent projects are set out more fully below.
Table F.12 Ergon Energy's proposed contingent projects
Project Proposed trigger event Estimated cost (nominal)
Aquis development
Ergon Energy enters into a connection agreement with the Aquis development at any time during the 2015−20 regulatory control period.
$51.4 million
General contingent project for large customer connections
Ergon Energy Enters into a connection agreement for a large customer connection, and
where:
the project required a material amount of shared network augmentation during the 2015−20 regulatory control period,
the capital expenditure is required to meet the capital expenditure objectives and
the capital expenditure for this network augmentation was not included in the capital expenditure forecasts for the ARR for the 2015−20 regulatory control period.
Not identified
Source: Ergon Energy, Regulatory proposal, October 2014.
F.3.1 Aquis development
379 NER, cl. 6.6A.1(c)(5).380 NER, cl. 6.6A.1(b)(2)(i).
142 Attachment 6 – Capital expenditure | Ergon Energy determination 2015–20

Ergon Energy stated that the need for the augmentation in relation to the Aquis development project arises from land development and load growth in the area.381 Ergon Energy stated that the timing of augmentation need is uncertain due to the uncertainty around the resort development approvals.382
Ergon Energy advised that a Hong Kong based property developer is seeking government approval to establish a major tourist resort, Aquis development, near Yorkeys Knob, and Ergon Energy has had ongoing discussions with the developer.383 Ergon Energy advised that there are uncertainties around development approval. The current publicly announced timetable is to commence construction in 2016. The electrical supply would be required four years from the start of construction, i.e. 2020 if the development proceeds as publicly announced. Ergon Energy quoted advice from the developer’s engineering consultant GHD on the load estimate for the new resort as follows:384
Stage 1 (2014-2018) diversified MD 15.9 MW + 1.4MW
Stage 2 (2020-2024) diversified MD 11.8 MW.
The total demand for the development is estimated at 29.1MW, which Ergon Energy submitted already takes into account demand reduction measures such as gas cooking/hot water and centralised chilled water.
Ergon Energy stated that this development would trigger the need for major capacity augmentation in Cairns northern beaches area since the Kamerunga substation would not have the spare capacity to meet the demand for this area. If the resort construction starts in mid of 2016, the network capacity augmentation work would be required within the next regulatory control period.385
Ergon Energy identified a range of solutions to meet potential demand growth. These include:386
recently completed 22kV feeder work that has increased Kamerunga substation firm capacity by 12 MVA through inter-zone substation load transfer
installation of cooling fans on Powerlink's Kamerunga substation transformers and Ergon Energy advised it is in discussion with Powerlink on this solution
deploy demand management solutions to defer load growth
local peak lopping generators
network augmentation options, including building new zone substations and augmenting existing ones.
Ergon Energy submitted that its preferred option is to use a combination of:
non-network solutions to defer the need for major network augmentation; and
381 Ergon Energy, 07.09.16 Contingent Projects.382 Ergon Energy , 07.09.16 Contingent Projects.383 Ergon Energy, 07.09.16 Contingent Projects.384 Ergon Energy, response to information request AER Ergon 062(3), p. 3.385 Ergon Energy, 07.09.16 Contingent Projects.386 Ergon Energy, Recommended Works Report for Cairns Northern Beaches Supply Reinforcement.
143 Attachment 6 – Capital expenditure | Ergon Energy determination 2015–20

establish a new Smithfield 132/22kV substation with two 63MVA transformers if the Aquis development proceeds to construction.
The nominal cost of the preferred option includes $51.4 million of capital works. The major component of Smithfield zone substation work would include:387
Smithfield 132/22kV substation establishment (estimated cost $15.9 million)
Kamerunga-Smithfield 132kV dual circuit underground line construction (estimated cost $30.0 million)
develop 22kV feeders from Smithfield substation (estimated cost $4.7 million); and
Kamerunga, install AFLC injection plant (estimated cost $0.8 million).
The largest capital component is the dual circuit 132kV cables. Ergon Energy stated that environmental constraints excluded the option to build overhead lines at a lower cost. Ergon Energy submitted that the proposed work satisfies the N-1 planning criteria with the duplication of 132kV assets including lines, busbars and power transformers. Ergon Energy stated that these duplications are necessary to meet its Service Safety Net obligations.388 The Queensland Government Distribution Authority issued to Ergon Energy sets out its required Service Safety Net Targets.
Trigger event
Ergon Energy has proposed the following trigger event for this proposed contingent project:389
Ergon Energy enters into a connection agreement with the Aquis development at any time during the 2015−20 regulatory control period.
F.3.2 General contingent project for large customer connections
Ergon Energy proposed a general contingent project, to cover large customer connections. These are large customer connections that are unknown to Ergon Energy at this time, but which it considers could result in a material amount of shared network augmentation during the 2015−20 regulatory control period. Ergon Energy provided the example of a resources company seeking a connection for a new mining development.390
Trigger Event
Ergon proposed that the trigger event for the general contingent project for large customer connections be:391
entering into a connection agreement for a large customer connection, and
387 Ergon Energy, Recommended Works Report for Cairns Northern Beaches Supply Reinforcement.388 Ergon Energy, Recommended Works Report for Cairns Northern Beaches Supply Reinforcement.389 Ergon Energy, 07.09.16 Contingent Projects.390 Ergon Energy, 07.09.16 Contingent Projects.391 Ergon Energy, 07.09.16 Contingent Projects.
144 Attachment 6 – Capital expenditure | Ergon Energy determination 2015–20

where:
o the project required a material amount of shared network augmentation during the 2015−20 regulatory control period,
o the capital expenditure is required to meet the capital expenditure objectives and
o the capital expenditure for this network augmentation was not included in the capital expenditure forecasts for the ARR for the 2015−20 regulatory control period.
F.4 Reasons for preliminary decisionWe do not accept Ergon Energy's proposed contingent projects are contingent projects in accordance with the NER.392
We are not satisfied that the Aquis development project is reasonably required to be undertaken in order to achieve the capex objectives.393 We consider that Ergon has relied upon an overstated demand forecast that does not reflect a realistic expectation of demand and that Ergon Energy has not fully explored options for deferring the proposed project into future regulatory control periods, as a prudent operator would do. Further we are not satisfied that the trigger events satisfy the NER criteria.394
We do not consider that the general contingent project for large customer connections satisfies the definition of a contingent project, because no actual project has been identified. In the event that this hurdle is satisfied, we do not consider we have been provided any information that can be relied upon to determine whether it reasonably meets the capex criteria − again because no particular project or expenditure has been identified.
F.4.1 Aquis development
Ergon Energy submitted that the proposed Aquis development would trigger the need for major capacity augmentation in Cairns northern beaches area as the existing Powerlink substation (Kamerunga) would not have the spare capacity to meet the increased demand. In particular, if the resort construction starts in mid-2016, Ergon Energy considers that network capacity augmentation work would be required within the next regulatory control period. We consider Ergon’s Recommended Works Report has not adequately justified the need for construction of the new zone substation because:395
it does not reflect a realistic expectation of the demand forecast and cost inputs required to achieve the capital expenditure objectives.
it does not reflect the efficient costs of achieving the capital expenditure objectives
392 Ergon Energy, 07.09.16 Contingent Projects.393 NER, cl. 6.6A.1 (b)(1).394 NER, cll. 6.6A.1 (b)(4); 6.6A.1(c).395 NER, cl. 6A.6.7(c).
145 Attachment 6 – Capital expenditure | Ergon Energy determination 2015–20

it does not reflect the costs that a prudent operator would require to achieve the capital expenditure objectives.
Demand Forecasts
We do not consider that Ergon Energy's proposal reflects a realistic expectation of the demand forecasts for the following reasons:
It overstates the demand growth in the Cairns Northern Beaches area in its Recommended Works Report. Ergon Energy's load forecast submitted in the reset RIN shows substantially lower forecast, which leads to at least 11MVA capacity available for the resort development.
The forecast has not taken into account of the effectiveness of possible work that would uprate Kamerunga Substation by installing transformer cooling systems.
The forecast has not taken into account the resort’s participation in DM responses in an event of supply capacity constraint.
It is unclear if Ergon Energy and Powerlink conducted adequate joint planning to identify potential lower cost solutions within Powerlink’s network.
Based on these considerations and detailed analysis of information provided by Ergon Energy, , we consider that Ergon Energy would likely to have adequate capacity to supply the Stage 1 demand of the resort through a range of measures as stated above. Given that stage 2 demand would occur in 2020−2024 at the earliest, Ergon Energy would have adequate lead time to carry out major capacity augmentation work in the 2020−25 regulatory control period should the need eventuate.
Powerlink’s Kamerunga 132/22kV substation currently supplies the Cairns northern beaches area. Ergon Energy provided information, as set out in Table , on the aggregated historical and forecast load for the Kamerunga substation.396
Table F.2 (T53) Substation & Northern Beaches Load (MVA)
11/12
12/13
13/14
14/15
15/16
16/17
17/18
18/19
19/20
20/21
21/22
22/23
T53 Kamerunga Substation (MVA)
59.3 67.1 71.6 74.0 76.6 79.5 79.5 81.5 81.8 85.1 86.6 89.1
Cairns Northern Beaches 22kV Feeders Aggregate Load (MVA)
23.4 36.1 37.4 38.8 40.3 41.7 43.3 44.9 46.6 48.3 50.1 52.0
Source: Recommended Works Report for Cairns Northern Beaches Supply Reinforcement, Section 1.
396 Recommended Works Report for Cairns Northern Beaches Supply Reinforcement, Section 1 and in response to AER information requests.
146 Attachment 6 – Capital expenditure | Ergon Energy determination 2015–20

However, we note this forecast is significantly higher than the forecast Ergon Energy provided in its RIN. The forecast is set out in table F.3.
Table F.3 Kamerunga (T53) Substation & Northern Beaches Load (MVA)
Forecasting elements 2013−14
2014−15
2015−16
2016−17
2017−18
2018−19
2019−20
Substation Rating 100 100 100 100 100 100 100
Raw Adjusted MD 54.5
Weather Corrected MD 10% POE 60.0 63.5 64.0 64.3 64.4 66.9 69.5
Weather Corrected MD 50% POE 56.6 59.3 58.8 59.3 59.8 60.9 62.1
Source: reset RIN Table 5.4.1 for non-coincident demand in MVA.
We consider that the forecast contained in Ergon Energy's RIN is the most recently prepared forecast and so consider it the appropriate basis for examining the need for this project. We note this updated information indicates that forecast demand is now significantly lower than previously forecast. In addition, we note that Ergon Energy has recently completed 22kV feeder work that allows 12MVA of load transfer capacity from Kamerunga substation (T53) onto the neighbouring Cairns North (T093) and Cairns (T51) substations. This has effectively increased the Kamerunga substation supply capacity to 73.3 MVA397.
On the basis of the information provided by Ergon Energy, we consider that Kamerunga substation has adequate capacity to meet the local load growth through the next regulatory control period (excluding the additional load from the new resort development).The total demand for the resort development is estimated at 29.1MW. Factoring in this additional demand, we do accept that there is likely to be a material capacity shortage in this area once stage 2 has progressed. However, as noted above, stage 2 is not scheduled to be undertaken in the 2015−20 regulatory control period.
Finally, we note that Ergon Energy included DM (opex) of $2.89 million in the project cost but it has not provided a detailed plan for DM activities for the area.398 Based on Ergon Energy’s past DM work, we consider that this expenditure could lead to up to 4MVA in demand reduction. The impact of the DM opex has not been factored into the demand forecast and so the demand forecast does not represent a reasonable expectation of the network demand.
Prudent and efficient costs
In conducting its option assessment, Ergon Energy estimated the cost of several options on the same basis and concluded that its preferred option has the lowest cost. Despite this process, we consider that Ergon Energy has not sufficiently explored other potential distribution augmentations to enable additional inter-zone substation load transfer. In particular, alternative distribution network augmentation work may lead to
397 Recommended Works Report for Cairns Northern Beaches Supply Reinforcement, section 1.4.1398 Report ND369 - Recommended Works Report - Cairns Northern Beaches Supply Reinforcement, p. 8.
147 Attachment 6 – Capital expenditure | Ergon Energy determination 2015–20

overall lower network cost through deferring the construction of a new major zone substation. On this basis we are not satisfied that this project reasonably reflects the capex criteria, because we are not satisfied that it is the project with the highest NPV. A prudent and efficient operator would choose the project option with the highest NPV. We invite Ergon Energy to provide additional information to support its options analysis and its selection of the preferred option in its revised regulatory proposal.
Contingent Project threshold
The NER requires that a contingent project must exceed $30 million or 5 per cent of the annual revenue requirement for the first year of the regulatory control period, whichever is greater.399 Our preliminary decision is to approve an annual revenue requirement of $1165.0 million in the first year of the 2015−20 regulatory control period. Therefore the threshold would be $58.25 million or higher. The capital cost of the project is estimated to be $51.44 million and does not meet this threshold.
Further, we consider that Ergon Energy has not factored in the amount of any capital contribution that they may levy upon the developer in accordance with their connections policy.400 Should a substantial capital contribution be required, this would further reduce the materiality of the proposed contingent project.
Trigger event
We consider that the proposed trigger event is insufficient to meet the NER requirement set out in clause 6.6A.1(c). This is because Ergon Energy’s connection agreement would define the connection outcomes but is unlikely to define the capital works that Ergon Energy needs to deliver. Therefore it would not necessarily make "the undertaking of the proposed contingent project reasonably necessary”. For example, the finalised connection agreement may require substantially less network supply capacity, leading to further deferment of the need for major augmentation work.
Based on these considerations, we recommend that the trigger event should be:
Ergon Energy enters into a connection agreement with the Aquis development within the regulatory control period 2015−20 and, prior to the entry into that connection agreement:
o if the scope of proposed work is materially different from the work proposed in its completed 2008 RIT, Ergon Energy completed a new RIT-D; and
o Ergon Energy’s latest assessment demonstrates that the diversified demand of Aquis development would exceed the available spare capacity at Kamerunga Substation after taking into account of all other cost effective capacity augmentation and demand reduction options; and
o Ergon Energy Board approves the project subject to the AER amending the revenue determination pursuant to the NER.
399 NER, cl. 6.6A.1(b)(2)(iii).400 Ergon Energy, Regulatory proposal, Attachment 09.01.01 Ergon Energy Connection Policy.
148 Attachment 6 – Capital expenditure | Ergon Energy determination 2015–20

Ergon Energy has completed a RIT-D in December 2008 based on load growth in the area (excluding the resort). This proposed augmentation work in the RIT-D is substantially the same as is proposed for the contingent project. However, we consider that Ergon Energy would need to complete a new RIT-D should it propose a solution that is substantially different from the previous RIT-D at a later date. This is required such that the occurrence of this condition is all that is required for the distribution determination to be amended under clause 6.6A.2.
Second, we also consider the augmentation should only proceed if the development would add new demand that exceeds the available spare capacity of the networks. Given the uncertainty around the development, potential load reduction through demand management as well as other factors affecting the demand growth in the area, it is not reasonable to assume the development will trigger a major augmentation need.
F.4.2 General contingent project for large customer connections
Ergon Energy stated that this contingent project is to cover customer connections that are unknown to Ergon Energy at this time, but which would result in a material amount of shared network augmentation during the 2015−20 regulatory control period. No additional information is provided, because at this stage no specific customer connections have been identified.401
We do not consider that a specific project has been proposed and as such, we are unable to assess that project against the criteria contained in the NER.402 For example to approve a contingent project, we need to be satisfied that it is reasonably required to be undertaken in order to achieve any of the capital expenditure criteria, which are:
the efficient costs of achieving the capital expenditure objectives
the costs that a prudent operator would require to achieve the capital expenditure objectives
a realistic expectation of the demand forecast and cost inputs required to achieve the capital expenditure objectives.
Ergon Energy has provided no cost information and so we have no basis on which to be satisfied that this program reasonably reflects the capex criteria. Accordingly, we do not approve this contingent project. Further, it appears that a necessary pre-condition for the inclusion of a contingent project is that a specific project must be identified and that the costs of undertaking the project must be quantified. As such, the contingent projects provision in the NER should not be used to cover the expenditure that may arise from a more general program of works. We consider this position is supported by the AEMC in their rule change proposal.
The ENA previously advanced a view that the NER should clarify that that the contingent project regime should only apply only to capex related solely to an individual
401 Apart from the Aquis development, which Ergon Energy has submitted as a contingent project.402 NER, cl. 6.6A.1.
149 Attachment 6 – Capital expenditure | Ergon Energy determination 2015–20
project and not capex that is related to more than one identifiable project.403 The AEMC considered that no such clarification was necessary—the AEMC appears to have considered the drafting clear. The AEMC stated that:404
With respect to limiting contingent projects to capex for an individual project and not capex related to more than one identifiable project, the Commission considers it is unnecessary to specify this in the NER. The NER provides that the contingent project needs to be assessed and the associated trigger event defined in the regulatory determination, which determines the scope of the contingent project.
We do not consider that Ergon Energy's proposal falls within the intended application of the contingent project clauses of the NER.
403 Response to Draft Determination, Economic Regulation of Network Service Providers, (Reference ERC0134 & ERC0135), October 2012, p. 43.
404 AEMC, Rule Determination National Electricity Amendment (Economic Regulation of Network Service Providers) Rule 2012, p. 202.
150 Attachment 6 – Capital expenditure | Ergon Energy determination 2015–20

G Overheads: Confidential appendix
151 Attachment 6 – Capital expenditure | Ergon Energy determination 2015–20