capital & counties properties plc annual report & accounts ... · empress state building*...
TRANSCRIPT

Cap
ital & C
oun
ties Properties P
LC A
nnual Report & A
ccounts 2011
Capital & Counties Properties PLC
Annual Report & Accounts 2011

Sir Terry Farrell has kindly drawn the sketches below which feature throughout the report.
Left to right: St Paul’s Church, Covent Garden; The Market Building, Covent Garden; Four Villages and a 21st Century High Street concept for the Earls Court Masterplan; Olympia façade and Piccadilly Arcade, The Great Capital Partnership
1 www.capitalandcounties.com
Capital & Counties Properties PLC (Capco) is one of the largest listed property investment and development companies in central London. Our landmark estates held directly or through joint ventures are valued at £1.6 billion. We aim to unlock the potential for significant value through entrepreneurial asset management and deliver superior and long-term returns to our shareholders. 2010 was a transformational year for the Group following listing. 2011 continued this positive momentum with advantageous acquisitions, new lettings in Covent Garden, the submission of planning applications for Earls Court and securing resolution to grant planning consent for Seagrave Road. Capco aims to maintain this success in the coming year.
Ian Hawksworth Chief Executive
ou
r fina
nc
ial statem
ents
Ho
w w
e go
vern o
ur bu
siness
un
dersta
nd
ing
ou
r busin
esso
ur bu
siness perfo
rma
nc
e
Our financial statements
71 Directors’ responsibilities72 Independent Auditors’ report73 Financial statements78 Notes to the accounts114 Investment and development properties116 Consolidated underlying
profit statement117 The demerger118 Financial covenants119 Historical record120 Board and advisers121 Dividends122 Glossary124 Shareholder information
understanding Our business
02 About Capco 04 Operational highlights06 Our portfolio08 Chairman’s statement10 Chief Executive’s review12 Our business model and strategy13 Key performance indicators14 Principal risks and uncertainties
Our business perfOrmance
18 Operating review18 – Covent Garden26 – Earls Court and Olympia34 – The Great Capital Partnership
and China38 Financial review44 Corporate responsibility
HOw we gOvern Our business
50 Board of Directors52 Corporate governance report59 Audit Committee report61 Directors’ remuneration report69 Directors’ report
in tHis repOrt
Positive momentum

A focus on prime central London
Dominant holdings concentrated in large estates
Active asset management and selective redevelopment potential
Rental resilience and capital value appreciation
A prudent capital structure
An experienced and incentivised management team
Find more information at www.capitalandcounties.com
Positive operating and financial performance
*Total property return
14.8%
*Total shareholder return
23.6%
*Total return
12.7%
Net asset value per share
166 pence
Loan to value (LTV)
29%
Property valuation uplift on a like-for-like basis
9.2%
ABOuT CAPCO
2011 HIGHLIGHTS
* Key performance indicators, for more information see page 13.
understanding our business
2

3 www.capitalandcounties.com
ou
r busin
ess perform
an
ce
Ho
w w
e go
vern o
ur bu
siness
ou
r fina
nc
ial statem
ents
un
dersta
nd
ing
ou
r busin
ess
Property values
Covent Garden £808m
Earls Court and Olympia £574m
Earls Court £195m Olympia £121m Seagrave Road £116m Empress State Building* £103m Other £39m
The Great Capital Partnership* £241m* Capco’s share.
Asset snapshot
Covent GardenEarls Court
and OlympiaThe Great Capital
Partnership Square feet (net) 834,000 1,760,000 683,000Occupancy 97.5% N/A 81.9%Passing rent £32.5m £7.2m* £10.5mEBITDA N/A £18.5m N/A* Empress State Building (Capco share)
35%
15%
50%
TOTAL PROPERTY VALUE
£1.6 billion

understanding our business
4
A year of growth and value creation
OPERATIONAL HIGHLIGHTS
January 2011 February March April May June July August September October November December January 2012 February
Burberry Brit opens on King Street
the first standalone burberry brit store in the uK begins to establish covent garden’s King street as a new destination in london for contemporary luxury retail
Covent Garden takes surrender of Ponti’s lease
capco gains control of 4,000 sq ft of prominent space in the north Hall of the market building to make way for two new retail brands and a new food concept
Equity issue to fund acquisition of new properties in Covent Garden
following a successful equity issue which raised over £100 million, capco acquires Kings court (comprising five properties). in addition, 11 James street and 35 King street are acquired. these properties offer short-term asset management opportunities and mid-term development potential
Planning applications for the Earls Court and West Kensington Opportunity Area and Seagrave Road schemes submitted
outline planning applications to transform the earls court site into four urban villages and a 21st century High street are submitted to the london borough of Hammersmith & fulham (lbHf) and the royal borough of Kensington & chelsea (rbKc). a detailed planning application for the seagrave road site is also submitted to lbHf
Planning consent granted for Balthazar and the London Film Museum
westminster city council resolves to grant planning consent for the proposals to redevelop the flower cellars in covent garden
The Mayor of London adopts the London Plan
in the mayor’s planning framework for london, earls court is identified as a strategic opportunity area
The Great Capital Partnership sells 26-40 Kensington High Street
capco’s share of these retail units which include tK maxx, wagamama, urban outfitters and virgin active totals £31.25 million, 11 per cent ahead of the december 2010 book value
Sir Terry Farrell’s Masterplan launched
the proposal to transform 77 acres in earls court, including seagrave road, into a vibrant, new london neighbourhood is unveiled at mipim and launched in london with community, stakeholder, media and analyst briefings

5 www.capitalandcounties.com
ou
r busin
ess perform
an
ce
Ho
w w
e go
vern o
ur bu
siness
ou
r fina
nc
ial statem
ents
un
dersta
nd
ing
ou
r busin
ess
January 2011 February March April May June July August September October November December January 2012 February
West Hall tops out at Olympia
as part of the planned enhancements to olympia, £20 million was invested in the redevelopment of the west Hall transforming it into a two-storey, 97,000 sq ft exhibition facility and making the internal space easier to access and more flexible for exhibitors
Joint venture with the Kwok Family Interests announced
the proposals for the seagrave road site receive a boost with a conditional 50:50 joint venture with the ‘Kwok family interests’ – major shareholders of sun Hung Kai properties limited, one of the largest and most reputable real estate companies in Hong Kong
Resolution to grant for the Seagrave Road scheme
the proposal to create 808 new homes based around an 81m long garden square is endorsed by lbHf
Second round of consultation on the SPD
lbHf, rbKc and the greater london authority (gla) consult on the preferred option of the supplementary planning document (spd) for the earls court and west Kensington opportunity area
Launch of Covent Garden Living
new residential brand covent garden living launches with the Henrietta, delivering 4 high-spec apartments situated on the historic piazza bringing the district back to its roots as london’s original high-end neighbourhood
New retailers and restaurants for Covent Garden announced
fragrance house Jo malone and luxury denim label 7 for all mankind sign leases for units on King street. Jamie’s union Jacks will improve the restaurant offering in the market building
Rugby Ralph Lauren opens on King Street
after a competitive bid for the space, rugby, another uK first, launches on King street in covent garden

understanding our business
6
Prime assets with ageographic advantage
OuR PORTFOLIO

7 www.capitalandcounties.com
ou
r busin
ess perform
an
ce
Ho
w w
e go
vern o
ur bu
siness
ou
r fina
nc
ial statem
ents
un
dersta
nd
ing
ou
r busin
ess
Our assets are concentrated around three main estates in central London with a combined value of £1.6 billion.
Covent Garden
The Great Capital Partnership (Capco share 50%)
Earls Court and Olympia
Empress State Building (Capco share 50%)
Capco Head Office
Additional principal land ownerships in Earls Court
Transport for London
London Borough of Hammersmith
& Fulham

understanding our business
8
CHAIRMAN’S STATEMENT
Delivering strong performance
a year Of prOgressThe Board is committed to delivering market-leading total returns to shareholders. We aim to achieve this by combining value creation through capital value and income growth and adopting an innovative and entrepreneurial approach to managing the Group’s assets. The portfolio of high potential, central London estates and a prudent balance sheet provide the platform to deliver this commitment.
covent gardenIn 2011 we enhanced Covent Garden through a series of tenancy changes and acquisitions in the latest phase of its repositioning, which resulted in a strong increase in the valuation of the estate. This expansion was supported by the successful equity issue in May last year which raised £100 million, together with a £300 million refinancing in November.
earls court and OlympiaThe exhibition business performed in line with expectations in 2011. The development of Olympia’s West Hall, already open for business, has increased the venue’s ability to host simultaneous shows.
Total return
12.7%Total property values
£1.6 billion
NAV per share
166 penceIan Durant, Chairman
Capco is well positioned to maintain its momentum following a year of progress and value creation in 2011. Strong total returns were generated by energetic and profitable activity in line with the strategy articulated at the time of establishing Capco as an independent company in 2010. Carefully targeted acquisitions and the drive towards creative regeneration have established a solid platform from which to continue to create value from Capco’s assets.
Total property return
14.8%

ou
r busin
ess perform
an
ce
Ho
w w
e go
vern o
ur bu
siness
ou
r fina
nc
ial statem
ents
un
dersta
nd
ing
ou
r busin
ess
9 www.capitalandcounties.com 9
The proposals for Earls Court reached several milestones, in particular the launch of Sir Terry Farrell’s Masterplan and the submission of planning applications for Seagrave Road and the wider scheme. These illustrate Capco’s vision for Earls Court which has been formally identified in the Mayor’s London Plan as an Opportunity Area with the capacity for large-scale development.
In February 2012 a resolution to grant planning consent for Seagrave Road was received, which followed the agreement of a conditional joint venture in relation to the site with the Kwok Family Interests in December. These successes will allow the Group to pursue, in partnership, the development of more than 800 homes at Seagrave Road.
the great capital partnership and chinaThe Great Capital Partnership and the Group’s investments in China have continued to perform well, allowing us to take the opportunity to realise capital to be recycled into the Group’s core activities.
results and dividends Capco delivered another year of strong performance in 2011, with a total return of 12.7 per cent underpinned by a rise in EPRA adjusted, diluted NAV per share from 148 pence to 166 pence. This was largely driven by the positive revaluation of the investment properties, which increased 9.2 per cent on a like-for-like basis, outperforming IPD capital values which rose 1.2 per cent. The share price increased 23 per cent in 2011 which compares favourably to the 11 per cent fall in the FTSE Real Estate Index.
The Directors are proposing a final dividend of 1.0 pence per share, bringing the total dividend paid and payable for 2011 to 1.5 pence per share.
future OppOrtunitiesFollowing considerable progress in 2011, the Covent Garden team continues to implement asset management opportunities whilst considering ways in which to expand the estate’s footprint that will enhance long-term value.
Our immediate priorities for the Earls Court Masterplan are to secure planning consents across the wider area and to conclude the commercial transactions with the London Borough of Hammersmith & Fulham (LBHF)
and Transport for London (TfL). We look forward to working closely with the Kwok Family Interests to take forward the Seagrave Road project.
For more detail on our activities and future plans for our estates, please see pages 18 to 37 in this report.
cOmmitment tO cOrpOrate respOnsibility (cr)Capco employs people with a diverse range of experience and expertise. Our entrepreneurial culture encourages a creative and holistic approach to place-making, which takes into consideration our impact on the environment and on the local communities where our estates are based. CR has become embedded into the fabric of our day-to-day work. For more about the specific initiatives that illustrate our strategy, please see our dedicated CR section on pages 44 to 49.
gOvernanceThe Board has taken particular care to establish an open culture in which debate and management accountability are emphasised. We encourage our people to be passionate about the estates in their stewardship but to maintain a high degree of objectivity about the use of, and the risk-adjusted returns available from, the Group’s capital. A strong corporate governance structure underpins this culture.
A full description of the activities of the Board and its Committees during the year is contained in the Corporate Governance report from pages 52 to 58. During the year the Board has increasingly focused on considering the Group’s options for evolving its strategy beyond the goals set out at the time of establishing Capco as an independent entity in 2010; and reviewing planning and commercial decisions and critical timelines – all within the context of effective risk management.
Following an external board effectiveness evaluation in 2010, an internal review was undertaken this year. The Board recognises the benefits that increased gender diversity would bring and accordingly a search for an additional Non-executive Director is underway and a description of the ongoing recruitment process is set out on page 58.
I am pleased to report that in December, Capco shares were classified as ‘domestic’ for trading purposes on the Johannesburg Stock Exchange, where the Company has a
secondary listing. This means that investors in South Africa are now able to trade shares in Capco on the Johannesburg Stock Exchange without the previous restrictions on foreign holdings under South African exchange control limits.
Regarding shareholder engagement, I remain committed to meeting our shareholders and the Executive team has a comprehensive programme of investor briefings.
OutlOOkCapco’s success in 2011 is the result of our strategy of focusing on specific central London prime assets where the Group has a dominant position. This has allowed the Group to benefit from the distinct, strategic capital and economic characteristics of a specialist central London non-REIT property company.
I am in no doubt that London will benefit enormously from the Queen’s Diamond Jubilee celebrations and as the host city for the Olympics this year, and am proud that Earls Court will be an integral part of the Olympics experience having been chosen as an official venue.
I believe the future for Capco is positive, and look ahead to 2012 with optimism tempered by caution regarding the macroeconomic climate. We look forward to making further progress on realising London’s most significant urban place-making initiatives for many years at Earls Court and Seagrave Road. We are also confident of seeing further value creation at Covent Garden.
Finally, I would like to thank the Executive Directors and all staff for their hard work and commitment during the past year. I am confident that they are committed to meeting the challenges of the year ahead.
Ian DurantChairman
29 February 2012

understanding our business
10
Progressing the business at an ambitious pace
CHIEF ExECuTIVE’S REVIEW
Ian Hawksworth, Chief Executive
The transformation of Covent Garden into one of the most vibrant retail and leisure destinations in London continues to create value and attract new brands, whilst the recent resolution to grant planning consent for our Seagrave Road development is an important milestone in our progress with the Earls Court Masterplan following the submission of our planning applications in June. I am confident that Capco’s place-making vision, creative teams and central London-focused assets will provide considerable opportunities in both the retail and residential markets during 2012.
Driven by our ambitions to be a creative place-maker, our focused strategy has allowed us to make great progress against our objectives both at Group level and in our estates.
Capco has had an active and successful 2011. We undertook a £100 million equity placing, raised £300 million of new debt facilities to extend the Group’s debt maturity profile, acquired £113 million of properties to expand Covent Garden, released £103 million from The Great Capital Partnership and China, submitted planning applications covering over 11 million square feet for the Earls Court Masterplan and Seagrave Road, and agreed a strategic joint venture for Seagrave Road with the shareholders of one of Hong Kong’s largest and most reputable real estate companies. Our activities have led to strong value creation for our shareholders, with net asset value per share rising 11.7 per cent and the share price increasing 23 per cent.
This performance reflects the strategic positioning of Capco in dominant estates with particular exposure to the central London retail and residential markets. Central London continues to attract a deep pool of occupiers and investors from around the world, and our strategy is focused on transforming districts to meet this demand.
Operating and financial perfOrmanceThe value of our properties increased strongly over 2011, with a rise of 9.2 per cent in capital values on a like-for-like basis, compared to the uK IPD capital value index which rose 1.2 per cent.
covent gardenCapco has transformed Covent Garden into one of the most exciting retail, leisure and residential districts in London. The estate is now valued at £808 million, with an increase in like-for-like property values of 9.2 per cent during 2011 driven by like-for-like ERV growth of 8.8 per cent.
We delivered the 2012 ERV target of £40 million 18 months ahead of schedule. On the back of this, we have set a challenging but achievable target of £50 million for 2013, as we aim to close the gap in rental values between Covent Garden and other parts of prime central London.
In May we raised £100 million through an equity issue. The proceeds allowed the Group to extend its footprint in the estate from 750,000 square feet to over 830,000 square feet, with several important new acquisitions.

ou
r busin
ess perform
an
ce
Ho
w w
e go
vern o
ur bu
siness
ou
r fina
nc
ial statem
ents
un
dersta
nd
ing
ou
r busin
ess
11 www.capitalandcounties.com
market value
dec-11 £m
market value
dec-10 £m
market value
change2,3
ervchange2
initial Yield
equivalent Yield
Covent Garden 808 640 9.2% 8.8% 3.77% 5.25%
The Great Capital Partnership1 241 260 9.8% 11.4% 3.93% 5.05%
Empress State1 103 103 – – 6.69% 6.18%
Total non-exhibition properties 1,152 1,003 8.4% 8.4%
EC&O Venues 471 378 10.9%
Total investment properties 1,623 1,381 9.2%
1 Represents Capco’s 50 per cent share. 2 Like-for-like. 3 Valuation change takes account of amortisation of lease incentives, capital expenditure and fixed head leases.
Alongside the continued focus on the retail and food and beverage mix, Capco is seeking to return the estate to its roots as London’s original luxury address. The four high-specification apartments at The Henrietta, located on the corner of Henrietta Street and the Piazza, were recently brought to market and are of a quality consistent with the best high-end residential developments in London.
For more details see pages 18 to 25.
earls court and OlympiaEarls Court and Olympia, excluding Empress State, increased in value by 10.9 per cent during 2011, reflecting the investment in all parts of the estate.
The Group has made significant progress in the past 12 months in respect of its holdings in Earls Court. Sir Terry Farrell’s Masterplan, launched in March, based around his vision of ‘Four urban Villages and a 21st Century High Street’, provides a blueprint for a multi-billion pound investment in both the local community and London as a whole. In June the Group submitted outline planning applications for the whole scheme, and a detailed application for a residential scheme at Seagrave Road – a total of 11 million square feet of new space across 77 acres. The Seagrave Road project received a resolution to grant consent in February 2012.
The Group’s interests at Earls Court have been revalued from £138 million to £195 million, implying a valuation of £8.6 million per acre across the Group’s 23 acres at Earls Court. The independent valuer has changed the basis of valuation to a land valuation having regard for redevelopment potential in light of the progress through the planning process, and
this marks a change from the previous existing use basis. Seagrave Road increased in value during 2011 by £11 million to £116 million and in December a 50:50 conditional joint venture for the site was agreed with the Kwok Family Interests at £131 million. Our events business at Earls Court and Olympia performed well in a challenging market, with EBITDA falling only 2 per cent to £18.5 million. We invested £20 million in the West Hall redevelopment at Olympia. Earls Court is an official Olympic venue, hosting the volleyball tournament this summer.
For more details see pages 26 to 33.
the great capital partnershipThe refocusing of The Great Capital Partnership (GCP) into a core of Regent Street and Piccadilly holdings has resulted in strong ERV and valuation growth. The disposal of properties in Kensington and midtown realised £48 million, which the Group has recycled into its core activities at Covent Garden and Earls Court. The sale of further properties this year will allow this capital recycling to continue in 2012.
chinaThe strong domestic economy and continued appreciation of Chinese RMB against the uS dollar benefited the Group’s investments in China. The fund manager, Harvest Capital Partners, has completed the sale of a number of the funds’ underlying investments. A total of £55 million has been realised for the Group from these disposals reflecting a substantial profit.
For more details on GCP and China see pages 34 to 37.
OppOrtunities and OutlOOkThe Queen’s Diamond Jubilee celebrations and the Olympics will place a spotlight on London in 2012, allowing it to demonstrate its attractions to a global audience. This should benefit the Group which is focused on landmark locations across the capital, although the operational challenges of these events for a central London business should not be underestimated.
Covent Garden is now a destination of choice for flagship retail brands. The team is focused on capitalising upon this to deliver the £50 million ERV target for the end of 2013. Further conversions of office space to high-quality apartments will unlock additional value.
The immediate focus for the Earls Court Masterplan remains on obtaining planning consents, together with concluding land transactions with TfL and LBHF. The relationship with the Kwok Family Interests will develop during the course of the year as Seagrave Road becomes a development project.
At EC&O Venues, there is likely to be some short-term impact at Earls Court, due to the uncertainty caused by the Masterplan.
Following the successful disposal of properties from GCP and in China, further opportunities for reinvestment and capital recycling back into the core business will be pursued.
Capco is well positioned to maintain its momentum as the strong performance of London real estate is expected to continue. The macroeconomic headwinds demonstrate some of the more visible risks we face, and hence we remain focused on executing our strategy across the business as we believe this will best deliver market-leading total returns to our shareholders. I am confident that our place-making vision, creative teams and central London-focused assets will provide considerable opportunity in both the retail and residential markets during 2012.
Ian HawksworthChief Executive
29 February 2012

understanding our business
12
OuR BuSINESS MODEL AND STRATEGy
Unlocking value and generating long-term returns
business mOdelWith a focus on central London, be an entrepreneurial place-maker delivering long-term value to our shareholders by bringing new life to districts creatively, commercially and responsibly,
benefiting Londoners and visitors as well as the Group’s customers
estate strategiesunderpinning our returns-focused Group Strategy are estate strategies to ensure we invest in the
right projects and plans to deliver profitable growth
covent gardenMaximise the estate’s potential as a world-class retail, leisure and residential district driving ITZA, ERV and NRI growth
ec&O venuesInvest in the enhancement of Olympia and maximise its utilisation by transitioning shows currently held at Earls Court
the earls court masterplanunlock value through securing planning consent for a residential-led, mixed use scheme. Agree land deals with our partners and consider options to create further value from the scheme
seagrave roadunlock value through securing planning consent for the residential-led scheme and successfully develop this joint venture with our partner
gcp and chinaTo maximise value of retained assets whilst gradually recycling capital to the core business
see pages 18 to 25 see page 29 see pages 30 to 32 see page 33 see pages 34 to 37
grOup strategyTo unlock value through growth in capital value and rental levels across the estates, generating superior,
long-term returns for our shareholders, through the following priorities:
active asset management
planning and development
activities
Opportunistic acquisitions and
disposals
prudent capital structure
active engagement with communities

13 www.capitalandcounties.com
ou
r busin
ess perform
an
ce
Ho
w w
e go
vern o
ur bu
siness
ou
r fina
nc
ial statem
ents
un
dersta
nd
ing
ou
r busin
ess
Measuring our success
KEy PERFORMANCE INDICATORS
Description
Total property return is calculated as capital growth including gains and losses on disposal plus rents received less associated costs, including ground rent. This metric ensures comparability to the IPD Total Return All Property Index.
Total return is the growth in the EPRA adjusted, diluted NAV per share plus dividends per share during the period.
Outperformance over a three year period, versus a comparator group of the eight largest constituents of the FTSE 350 Real Estate Index, is identified as a key measure of the success of Capco’s strategy.
Total shareholder return is the increase in the price of an ordinary share plus dividends during the period.
The Group’s total shareholder return is benchmarked against the total shareholder return of a comparator group of the eight largest constituents of the FTSE 350 Real Estate Index.
As a key metric for long-term equity-based compensation for the Group’s employees, total shareholder return aligns incentives with shareholder interest.
Target
1.5% pa outperformance since listing. 2.5% pa outperformance on a rolling three year basis.
4.0% pa outperformance on a rolling three year basis.
Performance
As shown, the Group has outperformed by 6.7 per cent in 2011. Since demerger, the Group’s central London properties have outperformed its benchmark by 5.1 per cent annualised.
Capco’s calculated return for the year of 12.7 per cent was well ahead of the comparator group.
The Group generated a total shareholder return of 23.6 per cent during the period significantly outperforming the comparator group.
A number of other indicators of performance are considered by the Board either at a Group level (including underlying earnings per share) or specifically relevant to each estate, for example ERV at Covent Garden and EBITDA at Earls Court & Olympia. These are discussed further in the asset-specific operating reviews in the Financial Review.
All three key performance indicators are directly linked to Executive Directors’ remuneration. These three indicators are carefully aligned with the Group’s strategy of unlocking value and delivering market-leading total returns over the longer term. Total Property Return, underlying earnings per share and net asset value are linked to annual bonuses available to certain of the Group’s employees.
TOTAL PROPERTY RETURN
14.8%
Comparator Capco2011
0
3
6
9
12
15
18
14.8%
8.1%
TOTAL RETURN
12.7%
Comparator Capco2011
0
3
6
9
12
15
18
12.7%
11.2%
TOTAL SHAREHOLDER RETURN
23.6%
Comparator Capco2011
-10
0
10
20
30
(8.1)%
23.6%
part of executive directors’ 2011 bonus part of executive directors’ long term incentive, togetHer witH specific annual nav targets
part of executive directors’ long term incentive

understanding our business
14
The Board has overall responsibility for Group risk management. It reviews principal risks and uncertainties regularly, together with the actions taken to mitigate them. The Board has delegated responsibility for assurance for the risk management process and the review of mitigating controls to the Audit Committee.
Executive Directors together with Senior Management from every division and corporate function of the business complete a Group risk register. Risks are considered in terms of their impact and likelihood from both a financial and reputational perspective. Risks are assessed both gross and net of mitigating controls. Review meetings are held to ensure consistency of response and adequacy of grading. Detailed risk registers are reviewed twice yearly and upon any material change in the business with a full risk review undertaken annually, at which point it is also reviewed in detail by the Audit Committee with new or emerging risks considered by the Committee as appropriate. This allows the Audit Committee to monitor the most important controls and prioritise risk management and internal audit activities accordingly.
On the following pages are the principal risks and uncertainties from across the business. These are not exhaustive, the Group monitors a number of additional risks and adjusts those considered ‘principal’ as the risk profile across the business changes.
PRINCIPAL RISKS AND uNCERTAINTIES
Delivering strategic priorities through effective risk management
reports to board on its work
and conclusions
reports to audit committee on its
findings and recommendations
bOard
Overall responsibility for risk framework and
internal control
Ongoing review of their effectiveness
audit cOmmittee
monitors and reviews risk and internal control
framework
seniOr management
team
compiles group risk register
considers and challenges mitigating controls
calibrates and scores responses
risk OrganisatiOnal structure

15 www.capitalandcounties.com
ou
r busin
ess perform
an
ce
Ho
w w
e go
vern o
ur bu
siness
ou
r fina
nc
ial statem
ents
un
dersta
nd
ing
ou
r busin
ess
1. corporate risksimpact: The Group’s ability to maintain its reputation, revenue and value could be damaged by corporate risks.
risk impact potential mitigation factors
Responding to regulatory and legislative challenges.
Reduced flexibility and increased cost base.
Sound governance and internal policies with appropriately skilled resource with support from external advisers as appropriate.
Responding to reputational, communication and governance challenges.
Reputational damage and increased costs.
Appointment of experienced individuals with clear responsibility and accountability. Clear statements of corporate and social responsibility, skilled Executive and Non-executive Directors, with support from external advisers as appropriate.
Inability to implement strategy or correctly allocate capital.
Constraints on growth and reduced profitability.
Regular strategic reviews and monitoring of performance indicators.
Corporate level oversight of capital allocation. Detailed capital planning and financial modelling. Maintain adequate cash and available facilities together with conservative leverage.
Adequacy of partner evaluation and management of key suppliers.
Reduced profitability and reputational damage.
Appropriate due diligence and consultation.
Non-REIT status brings heightened tax exposure and a potential competitive disadvantage when bidding for new assets.
Competitive disadvantage. Focus on assets and estates where skills can be applied to create enhanced value.
Risk associated with attracting and retaining staff. Inability to execute business plan. Succession planning, performance evaluations, training & development, long-term incentive rewards. Sound systems and processes to effectively capture and manage information.
Failure to comply with health and safety or other statutory regulations or notices.
Loss or injury to employees, tenants or contractors and resultant reputational damage.
Comprehensive health and safety procedures in place across the Group and monitored regularly. External consultants undertake annual audits in all locations. Safe working practices well established, including staff communication and training.
Further information surrounding Corporate risks can be found within the Corporate Governance report on pages 52 to 58, the Corporate Responsibility report on pages 44 to 49 and the Financial Review on pages 38 to 43.
understanding our business
16
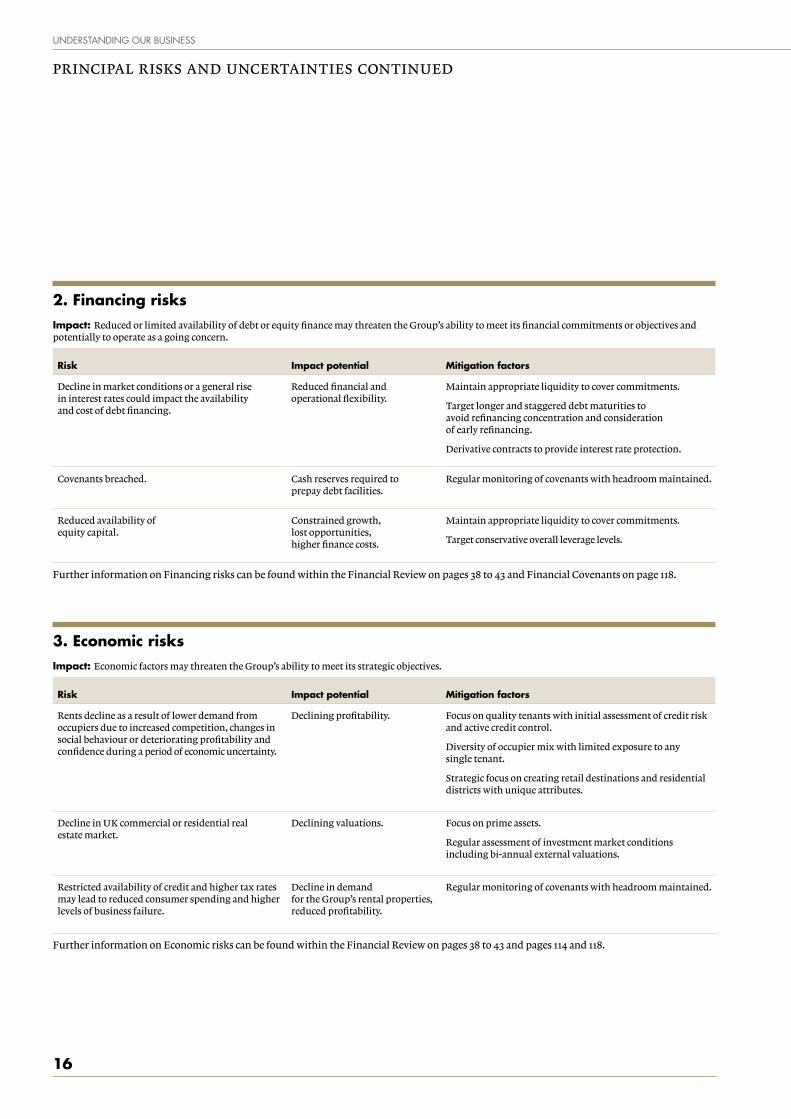
2. financing risksimpact: Reduced or limited availability of debt or equity finance may threaten the Group’s ability to meet its financial commitments or objectives and potentially to operate as a going concern.
risk impact potential mitigation factors
Decline in market conditions or a general rise in interest rates could impact the availability and cost of debt financing.
Reduced financial and operational flexibility.
Maintain appropriate liquidity to cover commitments.
Target longer and staggered debt maturities to avoid refinancing concentration and consideration of early refinancing.
Derivative contracts to provide interest rate protection.
Covenants breached. Cash reserves required to prepay debt facilities.
Regular monitoring of covenants with headroom maintained.
Reduced availability of equity capital.
Constrained growth, lost opportunities, higher finance costs.
Maintain appropriate liquidity to cover commitments.
Target conservative overall leverage levels.
Further information on Financing risks can be found within the Financial Review on pages 38 to 43 and Financial Covenants on page 118.
3. economic risksimpact: Economic factors may threaten the Group’s ability to meet its strategic objectives.
risk impact potential mitigation factors
Rents decline as a result of lower demand from occupiers due to increased competition, changes in social behaviour or deteriorating profitability and confidence during a period of economic uncertainty.
Declining profitability. Focus on quality tenants with initial assessment of credit risk and active credit control.
Diversity of occupier mix with limited exposure to any single tenant.
Strategic focus on creating retail destinations and residential districts with unique attributes.
Decline in uK commercial or residential real estate market.
Declining valuations. Focus on prime assets.
Regular assessment of investment market conditions including bi-annual external valuations.
Restricted availability of credit and higher tax rates may lead to reduced consumer spending and higher levels of business failure.
Decline in demand for the Group’s rental properties, reduced profitability.
Regular monitoring of covenants with headroom maintained.
Further information on Economic risks can be found within the Financial Review on pages 38 to 43 and pages 114 and 118.
PRINCIPAL RISKS AND uNCERTAINTIES CONTINuED
17 www.capitalandcounties.com
ou
r busin
ess perform
an
ce
Ho
w w
e go
vern o
ur bu
siness
ou
r fina
nc
ial statem
ents
un
dersta
nd
ing
ou
r busin
ess
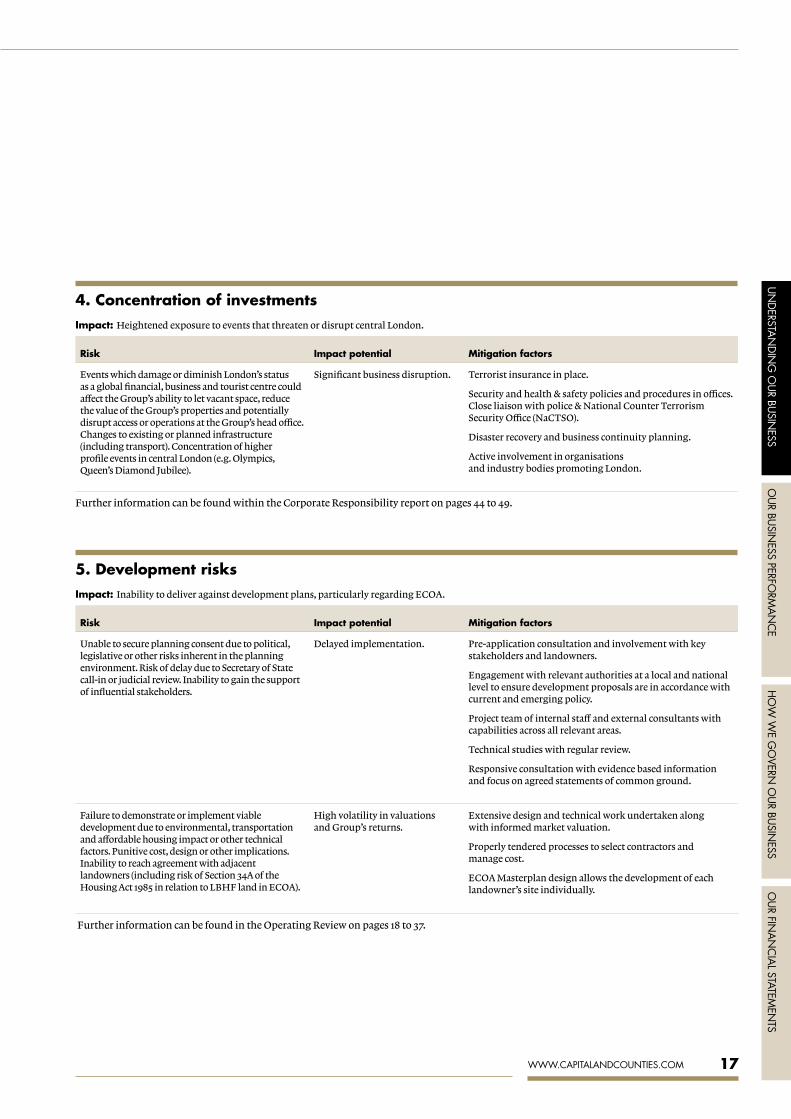
4. concentration of investmentsimpact: Heightened exposure to events that threaten or disrupt central London.
risk impact potential mitigation factors
Events which damage or diminish London’s status as a global financial, business and tourist centre could affect the Group’s ability to let vacant space, reduce the value of the Group’s properties and potentially disrupt access or operations at the Group’s head office. Changes to existing or planned infrastructure (including transport). Concentration of higher profile events in central London (e.g. Olympics, Queen’s Diamond Jubilee).
Significant business disruption. Terrorist insurance in place.
Security and health & safety policies and procedures in offices. Close liaison with police & National Counter Terrorism Security Office (NaCTSO).
Disaster recovery and business continuity planning.
Active involvement in organisations and industry bodies promoting London.
Further information can be found within the Corporate Responsibility report on pages 44 to 49.
5. development risksimpact: Inability to deliver against development plans, particularly regarding ECOA.
risk impact potential mitigation factors
unable to secure planning consent due to political, legislative or other risks inherent in the planning environment. Risk of delay due to Secretary of State call-in or judicial review. Inability to gain the support of influential stakeholders.
Delayed implementation. Pre-application consultation and involvement with key stakeholders and landowners.
Engagement with relevant authorities at a local and national level to ensure development proposals are in accordance with current and emerging policy.
Project team of internal staff and external consultants with capabilities across all relevant areas.
Technical studies with regular review.
Responsive consultation with evidence based information and focus on agreed statements of common ground.
Failure to demonstrate or implement viable development due to environmental, transportation and affordable housing impact or other technical factors. Punitive cost, design or other implications. Inability to reach agreement with adjacent landowners (including risk of Section 34A of the Housing Act 1985 in relation to LBHF land in ECOA).
High volatility in valuations and Group’s returns.
Extensive design and technical work undertaken along with informed market valuation.
Properly tendered processes to select contractors and manage cost.
ECOA Masterplan design allows the development of each landowner’s site individually.
Further information can be found in the Operating Review on pages 18 to 37.
our business performance
18
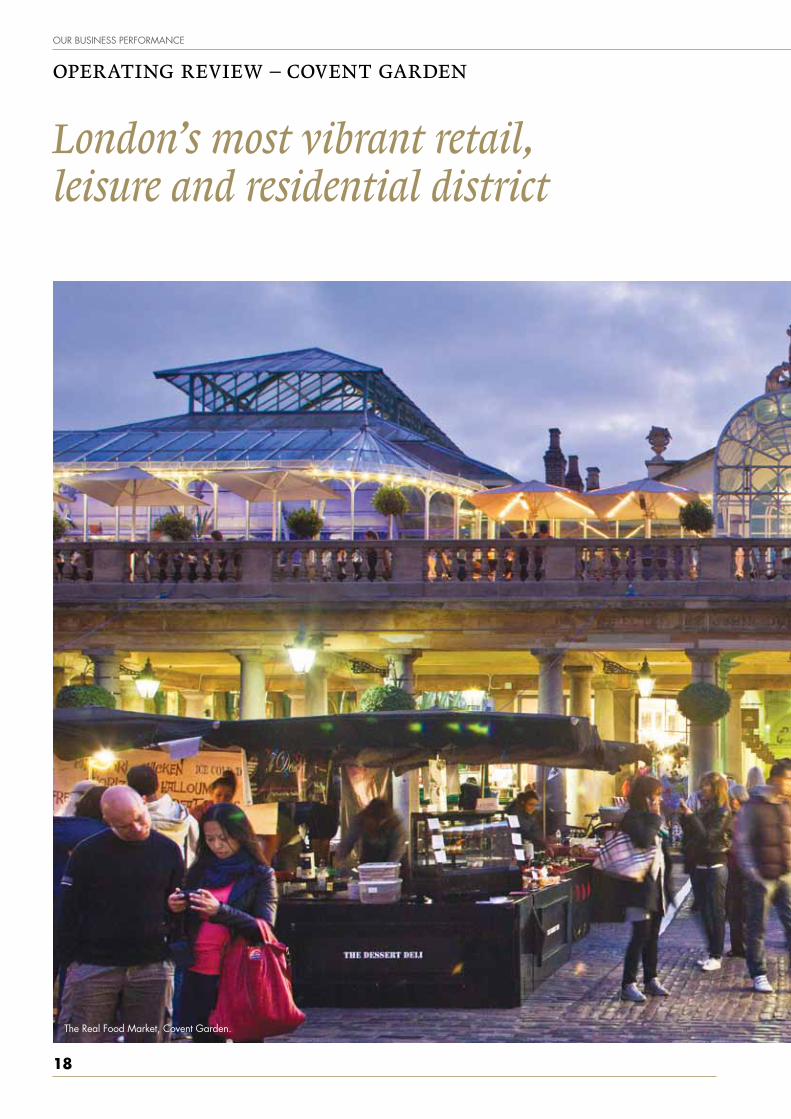
OPERATING REVIEW – COVENT GARDEN
the real food market, covent garden.
London’s most vibrant retail, leisure and residential district

19 www.capitalandcounties.com
ou
r busin
ess perform
an
ce
Ho
w w
e go
vern o
ur bu
siness
ou
r fina
nc
ial statem
ents
un
dersta
nd
ing
ou
r busin
ess

our business performance
20
Capco has transformed Covent Garden into a vibrant retail, leisure and residential district. The neighbourhood’s new take on luxury mixes premium retailers with one-off craft stalls, street theatre with the Royal Ballet and world-class brands with emerging designers to create an atmosphere unlike anywhere else in London.
OPERATING REVIEW – COVENT GARDEN CONTINuED
Highlights
– Achieved £40m ERV target
– Acquisitions Kings Court (5 properties on King Street) 35 King Street 11 James Street 1a Henrietta Street (property swap)
– Refinancing to provide £300 million debt facility
– Ownership expanded to over 830,000 sq ft
– Property value of £808 million
Strategy
– Grow ERV to £50 million by the end of 2013
– Drive passing rent
– Expand the contemporary luxury offer
– Transform the food and dining offer
– Extend the residential portfolio
– Grow the estate boundaries through tactical acquisitions
2010 2011
10
20
30
40
50
COVENT GARDEN ERV
£45.8m 8.8% (LfL)
£37.5m
£45.8m
2010 2011
10
20
30
40
50
COVENT GARDEN NET RENTAL INCOME
£27.8m 5.3% (LfL)
£25.7m£27.8m
2010 20110
200
400
600
800
1,000
COVENT GARDEN CAPITAL VALUE
£808m 9.2% (LfL)
£640m
£808m

21 www.capitalandcounties.com
ou
r busin
ess perform
an
ce
Ho
w w
e go
vern o
ur bu
siness
ou
r fina
nc
ial statem
ents
un
dersta
nd
ing
ou
r busin
ess
The Covent Garden team
covent garden is being repositioned as a desirable place to live in central london with the launch of covent garden living. the high-end residential brand offers stylish spaces moments from the shops, restaurants, opera, theatres and buzz of covent garden. the Henrietta’s three lateral apartments and duplex penthouse offer a total of 8,000 sq ft of high-specification space for sale with a quality to match the standards found in Knightsbridge, chelsea and mayfair. work has progressed on the second scheme in russell chambers, the russell, and planning consent was recently granted for the conversion of 1a Henrietta street, the beecham. all three buildings offer enviable positions on the piazza. it is anticipated that covent garden living will provide over 50 apartments for sale and rent in the coming years.
Covent Garden is one of the most vibrant, well-loved and well-known districts of London. Located in the heart of the West End, it attracts over 44 million customer visits a year who come for a unique shopping experience, al fresco dining and a wide range of entertainment in a historic, traffic-free setting.
The Covent Garden estate represents 50 per cent of Capco’s gross assets and showcases its creative place-making strategy, which is realised through focused asset management, investment and development.
Since it acquired the Covent Garden estate in 2006, Capco has transformed the area by introducing 45 new, high-quality retailers and occupiers.
The completion and marketing of four residential apartments at The Henrietta marks the launch of the Covent Garden Living brand and offers the estate the potential to reconnect with its 17th century residential roots.
The opening of Europe’s largest Apple store in August 2010 signalled a milestone in the transformation of Covent Garden into a more high-end retail, leisure and residential destination. 2011 has seen a series of acquisitions, a significant shift in consumer demographics and a raft of new innovative brands taking space in and around the Grade-II listed Market Building.
In the 17th century Covent Garden was London’s ultimate luxury residential address – in the 21st century it is again
COVENT GARDEN
the Henrietta show flat.

our business performance
22
Our Covent Garden holdings and key 2011 lettings
the Henrietta new, luxury residential brand covent garden living launches with four high-specification apartments on Henrietta street
7
LONG ACRE
FLORAL ST
KING ST
ST MA
RTINS LA
NE
GARRICK ST
UPPER ST M
ARTIN
S LAN
E
RUSSELL ST
HENRIETTA ST TAVISTOCK ST
EAST PIA
ZZA
WEST PIA
ZZA
SOU
THA
MPTO
N ST
BEDFO
RD ST
WELLIN
GTO
N ST
JAM
ES ST
BOW
ST
MAIDEN LANE
COVENTGARDEN
ST PAULʼS
CHURCH
KINGS
COURT
ROYAL OPERA
HOUSE
JACK WO
LFSKIN
PAN
DORA
ENTRA
NCE
JIGSAW
ENT
ENT.
ENT.
ENT.
ENT.
ENT.
ENT.
ENTRANCE
WAGAMAMA
JUBILEE HALL MARKET
PENHALIGONʼS
TUTTO
NS
STARBU
CKS
BELUSH
IʼS BO
SWELLS
DIRTY
MA
RTINI
LONDONʼS TRANSPORT
MUSEUMCOVENT GARDEN
MARKET
CHARLES
H FOX
PRIMA
CAFE
OFFICE
OFFICE
BETSEY
JOHN
SON
KIRK
ORIG
INA
LSTHE
LONG ACRE
BAR
ASH HA
IR
SALO
N
CLOS M
AGG
IORE
NAVA
JO JO
ES
BAR &
RESTAURA
NT
DESTIN
Y
ENT.
OLIVER
SWEEN
EY
VACA
NT
VILEBREQU
IN
LEGEN
DS
SHO
ES
ENTRA
NCE
& GA
RAGE
WHISTLES
REPLAY
RABEA
NCO
AUBIN
& W
ILLS
TED BA
KER
NICO
LE
FARH
ITHE
SAN
CTUARY
DU
NE
APPLE
BURBERRY BRIT
LYLE &
SCOTT
RUG
BY RALPH
LAUREN
JO MALONE
NAT WEST
(FIRST RESIDENTIAL
CONVERSION)
PORTERS
CAFE D
ELICIOU
S
WA
LKABO
UT
ROH
AN
OFFICE
TON
I & G
UY
THE M
APLE LEA
F PUB FIELD &
TREKCAFFÈ NERO
THE NORTH FACE
OFFICE
JEWEL BA
R
KURT GEIGER
SKECHERS
BOOTS
MONSOON
QU
IKSILVER
ORIG
INA
L
PENQ
UIN
BUILD
A BEA
R
DISNEY
ACCESSORIZE
MAXWELLS
SUNGLASS
HUT
FRED PERRY
OFFICES
OASIS
BEN SHERM
ANSCRIBBLER CARDS
PRETTY GREEN
FRED PERRY
PAPERCHASE
MOLTON
BROWNGODIVA
EAST
CAPRICE
HO
LDIN
GS
LONDON FILM
MUSEUM
(WINTER 2011)
BYRON
BURGERS
BUREAU DE
CHANGE
VACA
NT
THE SUSSEX
STRINGFELLOWS
LK BENN
ETT
JAC
K WILLS
BARBO
UR
DISHOOM
RETA
IL
DUO
RETAIL
SPECIALISED
RETAIL
RELAX
LONG MARTIN
SUDAMELVITA
JOULES
DESA
EILEEN
FISHER
JAEGER LONDON
COS
GAP KIDS
GA
P
ECCO
MU
JI
VODA
FON
EU
GG
BOO
TS
TIE RACK
KAREN MILLEN
WHITE
LION PUB
THE NAGS
HEAD PUB
GEOXENT.
PAUL SMITH
DUNE
BERTIE
FOSSIL GIFTS
BODY SHOP
SWAROVSKI
TRUE RELIGION
PAUL SM
ITH
KATE SPADE
VACAN
TJON
ES
AGN
ES B
PAUL &
JOE
OFFIC
E
OFFIC
E LAM
B & FLA
G
TREVOR SORBIE
BELLA ITALIA
SNAP
PYSN
APS
SIM
URG
HORA
SALO
N
JON
ESSH
OES
THE GARRICK CLUB
WATERSTONES
STREADS
FAITHCONNEXION
ENT.
ENT.
STAN
FORD
S BOO
KS
AMADEUS
HOUSE
NEXT
REISS
ROSE & CROWN
NOWHERE
DEPI COOL
ROBERT IRVING BURNS
VACA
NT
PALM
COU
RT
THE ESSEX
SERPENT
MU
FFINSKIS
ENTRA
NCE
ENTRA
NCE
CG N
EWS
BELLA ITA
LIA
PARA
MO
& RO
CK
SATYA
JEWELRYA
ND
REW
BARTO
N
SALO
N
MAXWELLʼS
RESTAURANT HQ
PATISSERIE
VALERIE
VACANT
RUSH HAIR
OFFICE
CAFFÈ
NERO
ALL BAR
ONE
GNC HEALTH
THE LADY
MAGAZINE
AUSTRA
LIA SH
OP
LA PERLA
AD
ELPHI
THEATRE
VACA
NT
THE ICECREAMISTS
DA PO
LPO
VACANT
NICHO
LSON
SEARCH
HU
NG
ARIA
N CU
LTURA
L
CENTRE
CORPU
S CHRISTI
CATHO
LIC CHU
RCH
BISTRO 1
ESSENSUALS
ELLIS BRIGHAM
HUDSON HOUSEKAFENEO
BRAVISSIMO
LINGERIE
SOPHIEʼS
STEAKHOUSE
CHARLES
DICKENS
COFFEE
TREADW
ELLS
BOO
KS
SOFRA
RESTAURA
NT
BE AT ONE
PUB
COVEN
T
GA
RDEN
CA
FE
ORSO
RESTAURANT
LA
AN
ABELA
MOUNTAIN
WAREHOUSE
COTSWOLD
OUTDOOR
FLIGHT
CENTRE
ENT.
MANOROM
TOO
TRESPASS VACANT
THE
EXETER
CAFEENT.ENT.
ENT.
THA
I PIN
MA
NO
ROM
INTERN
ET CAFE
GO
URMET
BURGER KITCHEN
COVEN
T GA
RDEN
GRILL
VACA
NT
OFFICE
FIRE & STO
NE
HEN
RYʼS
RULES WOOLLEY PAU
ADVERTISINGPROFILE
OFFICE
OFFICE
DWG
CAFE 26
SNACK TIME
STRADA
BELLA
ITALIA
CAFE ROUGE
COTE
BOU
LEVARD
BRASSERIE
PJS BAR
& GRILL
COACH
& HORSES
HOPE &
GREEN
WOOD
CAFE
SORR
ISO
SAGAR
NELL O
F
OLD DRURY
HI SUSH
I
TASTE
OF INDIA
THE O
PERA
TAVER
N
PJʼS B
AR
GRILL
SAN
FRANCESCO
REST.
BREAK
POIN
T
MA
RQU
ESS
OF A
NG
LESEY
CORA
L
THE GLOBE
PASTA BROWN
BT
OFFIC
E
EMERG
ENCY SERVICES
ZIZZI
LA BALLERINA
KASTNER &
OVEN
S CAFE
YSC BUILDING
MASALA
ZON
E
ZARA
BERTORELLI
HAWES
& CURTIS
CAFE DES AMIS
ALL SAINTS
PIZZA EXPRESS
STARBUCKS
BOW STREET
MAGISTRATES
COURT
BOUG
IEZVACAN
T
BOUTEA
REGUS
LLOYDS TSB
PIZZA
HUT
STA TRAVELPASTA BROWN
TESCO
BEDFORD ST. OFFICES
ADVENTURE
MLS BUSINESS CENTRE
PAUL CAFE
HSBC
KATHM
AN
DU
DIN
ER
OFFICE
OAKLEY
ROUN
DHO
USE
CAFE
PAST
A
CYBE
RCA
NDYSN
OG
BITE
LE G
ARRI
CK
WIN
E BA
R
TOBIKO
EURO
PEAN
FASH
ION
STUD
IO
UN
ITED N
UD
E
NIGEL
HALL
NIG
EL
HA
LL
THE TIN
TIN
SHO
P
CAM
PER
RADLEY
MU
LBERRY
H&
M
JAN
E
NO
RMA
N
LESNEREIDES
REISSGARDEN
PHARMACY
RUSSELL &
BROM
LEY
MARKS & SPEN
CER
HOBBS
CALVIN KLEIN
MASSIM
O
DUTTI
HOSS
INTRO
PIA
TIME 2
JAMIEʼSITALIAN
CANTINALAREDO
BILLʼS
PRODUCE
THE WHITE
COMPANY
TWENTY 8
TWELVE
PRETTY
BALLERINA
ACADEMY
OF FLOWERS
BAN
AN
A
REPUBLIC
MIN
ISTRY OF W
AXIN
G
& BRO
W BA
R
MLS BUSINESS CENTRE
OFFICE
MO
SS BROS
THE SU
IT
COM
PAN
Y
HAC
KETT
BEALE &
CO
CA
RLUCCIO
S
AFRIC
A BO
OK CEN
TRE
2
4
51
65
7
14
OPERATING REVIEW – COVENT GARDEN CONTINuED
existing
acquisitions: Kings court (5 properties) 35 King street 11 James street 1a Henrietta street (property swap)
Jo malone global fragrance and skincare brand agrees a lease on King street
4
Oliver sweeney upmarket footwear and accessories label oliver sweeney opens on King street
6
7 for all mankind luxury denim label agrees a lease on King street
5
rugby ralph lauren rugby ralph lauren opens its first and only store in europe on King street
1
vilebrequin french luxury swimwear specialist vilebrequin opens on King street
3
burberry brit the biggest burberry brit store in the world, and the first in the uK, opens on King street
2
3

23 www.capitalandcounties.com
ou
r busin
ess perform
an
ce
Ho
w w
e go
vern o
ur bu
siness
ou
r fina
nc
ial statem
ents
un
dersta
nd
ing
ou
r busin
ess
g-shock west casio watch concept g-shock west agrees a lease to open in the market building
10
LONG ACRE
FLORAL ST
KING ST
ST MA
RTINS LA
NE
GARRICK ST
UPPER ST M
ARTIN
S LAN
E
RUSSELL ST
HENRIETTA ST TAVISTOCK ST
EAST PIA
ZZA
WEST PIA
ZZA
SOU
THA
MPTO
N ST
BEDFO
RD ST
WELLIN
GTO
N ST
JAM
ES ST
BOW
ST
MAIDEN LANE
COVENTGARDEN
ST PAULʼS
CHURCH
KINGS
COURT
ROYAL OPERA
HOUSE
JACK WO
LFSKIN
PAN
DORA
ENTRA
NCE
JIGSAW
ENT
ENT.
ENT.
ENT.
ENT.
ENT.
ENT.
ENTRANCE
WAGAMAMA
JUBILEE HALL MARKET
PENHALIGONʼS
TUTTO
NS
STARBU
CKS
BELUSH
IʼS BO
SWELLS
DIRTY
MA
RTINI
LONDONʼS TRANSPORT
MUSEUMCOVENT GARDEN
MARKET
CHARLES
H FOX
PRIMA
CAFE
OFFICE
OFFICE
BETSEY
JOHN
SON
KIRK
ORIG
INA
LSTHE
LONG ACRE
BAR
ASH HA
IR
SALO
N
CLOS M
AGG
IORE
NAVA
JO JO
ES
BAR &
RESTAURA
NT
DESTIN
Y
ENT.
OLIVER
SWEEN
EY
VACA
NT
VILEBREQU
IN
LEGEN
DS
SHO
ES
ENTRA
NCE
& GA
RAGE
WHISTLES
REPLAY
RABEA
NCO
AUBIN
& W
ILLS
TED BA
KER
NICO
LE
FARH
ITHE
SAN
CTUARY
DU
NE
APPLE
BURBERRY BRIT
LYLE &
SCOTT
RUG
BY RALPH
LAUREN
JO MALONE
NAT WEST
(FIRST RESIDENTIAL
CONVERSION)
PORTERS
CAFE D
ELICIOU
S
WA
LKABO
UT
ROH
AN
OFFICE
TON
I & G
UY
THE M
APLE LEA
F PUB FIELD &
TREKCAFFÈ NERO
THE NORTH FACE
OFFICE
JEWEL BA
R
KURT GEIGER
SKECHERS
BOOTS
MONSOON
QU
IKSILVER
ORIG
INA
L
PENQ
UIN
BUILD
A BEA
R
DISNEY
ACCESSORIZE
MAXWELLS
SUNGLASS
HUT
FRED PERRY
OFFICES
OASIS
BEN SHERM
ANSCRIBBLER CARDS
PRETTY GREEN
FRED PERRY
PAPERCHASE
MOLTON
BROWNGODIVA
EAST
CAPRICE
HO
LDIN
GS
LONDON FILM
MUSEUM
(WINTER 2011)
BYRON
BURGERS
BUREAU DE
CHANGE
VACA
NT
THE SUSSEX
STRINGFELLOWS
LK BENN
ETT
JAC
K WILLS
BARBO
UR
DISHOOM
RETA
IL
DUO
RETAIL
SPECIALISED
RETAIL
RELAX
LONG MARTIN
SUDAMELVITA
JOULES
DESA
EILEEN
FISHER
JAEGER LONDON
COS
GAP KIDS
GA
P
ECCO
MU
JI
VODA
FON
EU
GG
BOO
TS
TIE RACK
KAREN MILLEN
WHITE
LION PUB
THE NAGS
HEAD PUB
GEOXENT.
PAUL SMITH
DUNE
BERTIE
FOSSIL GIFTS
BODY SHOP
SWAROVSKI
TRUE RELIGION
PAUL SM
ITH
KATE SPADE
VACAN
TJON
ES
AGN
ES B
PAUL &
JOE
OFFIC
E
OFFIC
E LAM
B & FLA
G
TREVOR SORBIE
BELLA ITALIA
SNAP
PYSN
APS
SIM
URG
HORA
SALO
N
JON
ESSH
OES
THE GARRICK CLUB
WATERSTONES
STREADS
FAITHCONNEXION
ENT.
ENT.
STAN
FORD
S BOO
KS
AMADEUS
HOUSE
NEXT
REISS
ROSE & CROWN
NOWHERE
DEPI COOL
ROBERT IRVING BURNS
VACA
NT
PALM
COU
RT
THE ESSEX
SERPENT
MU
FFINSKIS
ENTRA
NCE
ENTRA
NCE
CG N
EWS
BELLA ITA
LIA
PARA
MO
& RO
CK
SATYA
JEWELRYA
ND
REW
BARTO
N
SALO
N
MAXWELLʼS
RESTAURANT HQ
PATISSERIE
VALERIE
VACANT
RUSH HAIR
OFFICE
CAFFÈ
NERO
ALL BAR
ONE
GNC HEALTH
THE LADY
MAGAZINE
AUSTRA
LIA SH
OP
LA PERLA
AD
ELPHI
THEATRE
VACA
NT
THE ICECREAMISTS
DA PO
LPOVACANT
NICHO
LSON
SEARCH
HU
NG
ARIA
N CU
LTURA
L
CENTRE
CORPU
S CHRISTI
CATHO
LIC CHU
RCH
BISTRO 1
ESSENSUALS
ELLIS BRIGHAM
HUDSON HOUSEKAFENEO
BRAVISSIMO
LINGERIE
SOPHIEʼS
STEAKHOUSE
CHARLES
DICKENS
COFFEE
TREADW
ELLS
BOO
KS
SOFRA
RESTAURA
NT
BE AT ONE
PUB
COVEN
T
GA
RDEN
CA
FE
ORSO
RESTAURANT
LA
AN
ABELA
MOUNTAIN
WAREHOUSE
COTSWOLD
OUTDOOR
FLIGHT
CENTRE
ENT.
MANOROM
TOO
TRESPASS VACANT
THE
EXETER
CAFEENT.ENT.
ENT.
THA
I PIN
MA
NO
ROM
INTERN
ET CAFE
GO
URMET
BURGER KITCHEN
COVEN
T GA
RDEN
GRILL
VACA
NT
OFFICE
FIRE & STO
NE
HEN
RYʼS
RULES WOOLLEY PAU
ADVERTISINGPROFILE
OFFICE
OFFICE
DWG
CAFE 26
SNACK TIME
STRADA
BELLA
ITALIA
CAFE ROUGE
COTE
BOU
LEVARD
BRASSERIE
PJS BAR
& GRILL
COACH
& HORSES
HOPE &
GREEN
WOOD
CAFE
SORR
ISO
SAGAR
NELL O
F
OLD DRURY
HI SUSH
I
TASTE
OF INDIA
THE O
PERA
TAVER
N
PJʼS B
AR
GRILL
SAN
FRANCESCO
REST.
BREAK
POIN
T
MA
RQU
ESS
OF A
NG
LESEY
CORA
L
THE GLOBE
PASTA BROWN
BT
OFFIC
E
EMERG
ENCY SERVICES
ZIZZI
LA BALLERINA
KASTNER &
OVEN
S CAFE
YSC BUILDING
MASALA
ZON
E
ZARA
BERTORELLI
HAWES
& CURTIS
CAFE DES AMIS
ALL SAINTS
PIZZA EXPRESS
STARBUCKS
BOW STREET
MAGISTRATES
COURT
BOUG
IEZVACAN
T
BOUTEA
REGUS
LLOYDS TSB
PIZZA
HUT
STA TRAVELPASTA BROWN
TESCO
BEDFORD ST. OFFICES
ADVENTURE
MLS BUSINESS CENTRE
PAUL CAFE
HSBC
KATHM
AN
DU
DIN
ER
OFFICE
OAKLEY
ROUN
DHO
USE
CAFE
PAST
A
CYBE
RCA
NDYSN
OG
BITE
LE G
ARRI
CK
WIN
E BA
R
TOBIKO
EURO
PEAN
FASH
ION
STUD
IO
UN
ITED N
UD
E
NIGEL
HALL
NIG
EL
HA
LL
THE TIN
TIN
SHO
P
CAM
PER
RADLEY
MU
LBERRY
H&
M
JAN
E
NO
RMA
N
LESNEREIDES
REISSGARDEN
PHARMACY
RUSSELL &
BROM
LEY
MARKS & SPEN
CER
HOBBS
CALVIN KLEIN
MASSIM
O
DUTTI
HOSS
INTRO
PIA
TIME 2
JAMIEʼSITALIAN
CANTINALAREDO
BILLʼS
PRODUCE
THE WHITE
COMPANY
TWENTY 8
TWELVE
PRETTY
BALLERINA
ACADEMY
OF FLOWERS
BAN
AN
A
REPUBLIC
MIN
ISTRY OF W
AXIN
G
& BRO
W BA
R
MLS BUSINESS CENTRE
OFFICE
MO
SS BROS
THE SU
IT
COM
PAN
Y
HAC
KETT
BEALE &
CO
CA
RLUCCIO
S
AFRIC
A BO
OK CEN
TRE
13
12
10
9
7
11
rabeanco Hong Kong-based leather handbag designer rabeanco opens its first uK store on long acre
14
links of london official jeweller for the london 2012 olympic games opens in the market building
11
ladurée parisian patisserie ladurée opens its first ever stand-alone tea salon in the market building facing King street
12
sunglass Hut leading international sunglasses retailer sunglass Hut opens on the corner of long acre and James street
13
8
brora High-end scottish cashmere brand brora opens in the historic market building
8
Jamie’s union Jacks Jamie oliver and chef chris bianco sign a lease to bring wood fired flat breads and british flavours to the market building
9

our business performance
24
Operating perfOrmanceIn May, the Group raised £100 million through a capital raise which funded the acquisition of Kings Court, a 71,900 square feet portfolio which includes five properties bridging King Street and Floral Street. The estate was further expanded during 2011 through the acquisitions of 35 King Street, 11 James Street and, through an £18 million property swap, 1a Henrietta Street.
Overall, Capco now owns 52 buildings, comprising 334 lettable units and over 830,000 square feet of lettable space in Covent Garden. The overall estate was valued at £808 million as at 31 December 2011, an increase of 9.2 per cent on a like-for-like basis since 31 December 2010.
In 2011, 78 rent reviews and lettings were negotiated which secured £8 million of passing rent, an 8.8 per cent increase above December 2010 ERV. This has driven an 8.8 per cent like-for-like increase in ERV over the year to £45.8 million.
The estate is operating at near-full occupancy – the EPRA occupancy rate at 31 December 2011 was 97.5 per cent (up from 97.1 per cent in December 2010) adjusted for units under offer and held for development. Tenant demand is strong despite a challenging year for retailers and consumers throughout the uK. The Group’s proactive, on-site team continues to secure vacant possession of high-profile and strategic units to further reposition Covent Garden as London’s most shoppable area. During 2011, 13 retailers opened new stores across the estate, including Rugby Ralph Lauren, Burberry Brit, Vilebrequin, Oliver Sweeney, Links of London and Brora.
The area’s food and beverage offering was enhanced by ‘restaurant in residence’ Canteen which introduced contemporary British cuisine and design during its temporary
tenure from September 2011 until February 2012. upmarket Parisian patisserie Ladurée transformed the high-profile corner unit on the North Piazza facing King Street into its first ever stand-alone tea salon in May.
Footfall on a rolling 12 month basis as at December 2011 was 44 million. Capco’s active asset management and leasing strategy to establish a higher end mix of occupiers in the Market Building and surrounding streets has resulted in a shift in consumer demographics, attracting higher spending visitors. In 2011, 89 per cent of domestic visitors to Covent Garden were classified as ABC1, and internal measures of average spend are indicating increases for both domestic and international consumers.
The Henrietta’s four residential apartments offer a total of 8,000 square feet of newly converted space for sale. Work has commenced on the second scheme, The Russell, which will create 14,300 square feet of residential space. Planning consent has been granted for a further six apartments, The Beecham, and a flagship unit on the south west corner of the Piazza. A planning application has been submitted for a further seven apartments at 30-32 Southampton Street. It is anticipated that the Covent Garden Living brand will provide over 50 high-end and luxury apartments for sale and rent in the coming years.
Capco, through its Covent Garden team, has actively engaged with, and become part of, the local community since the initial acquisition in 2006. With offices now based in Floral Street, the team has built strong relationships with the Covent Garden Area Trust (CGAT), residents’ associations, Westminster City Council and the wider business community, supporting key district initiatives and garnering support for new innovative developments.
future priOritiesCapco’s priority for Covent Garden is to achieve its ERV target of £50m by December 2013 through investment, development and proactive and creative asset management capturing as much of this as soon as possible within passing rent. This will be delivered through expansion of the contemporary luxury retail offer and a transformation of the food and dining mix. The team will focus on securing new lettings across the estate, especially on King Street. Russell Street is set to be transformed by the iconic Balthazar restaurant and bakery from Manhattan.
Looking ahead the aim is to extend the residential portfolio, grow the estate through tactical acquisitions and continue to enhance the Covent Garden environment by investing in improvements to its buildings and the public realm.
OPERATING REVIEW – COVENT GARDEN CONTINuED

25 www.capitalandcounties.com
ou
r busin
ess perform
an
ce
Ho
w w
e go
vern o
ur bu
siness
ou
r fina
nc
ial statem
ents
un
dersta
nd
ing
ou
r busin
ess
King Street, building momentum through effective asset management
Covent Garden’s home for contemporary luxury brands, King Street is one of London’s most exciting new retail opportunities.
Acquisitions this year’s acquisitions of the five properties in Kings court and the adjacent 35 King street for £85.5 million, illustrate capco’s commitment to expand this new destination for contemporary luxury and deliver the zoning plan for this part of the estate. the acquisitions present immediate short-term asset management opportunities and exciting mid-term development potential. the new lettings to date have driven an average itZa growth of 52 per cent since 2008.
new tenants and enhanced public realm on King street.
Signingsin april, the largest burberry brit store in the world (and the only one in europe) opened on the corner of King street and the north piazza next to the flagship apple store. rugby ralph lauren, another ‘uK first’, subsequently opened in september, followed by french swimwear brand vilebrequin and footwear and accessories label oliver sweeney. recent signings include luxury denim label 7 for all mankind and upmarket fragrance brand Jo malone.
KING STREET

our business performance
26
Transforming an exhibition venue into four villages and a 21st century high street
OPERATING REVIEW – EARLS COuRT AND OLyMPIA
earls court cgi.

27 www.capitalandcounties.com
ou
r busin
ess perform
an
ce
Ho
w w
e go
vern o
ur bu
siness
ou
r fina
nc
ial statem
ents
un
dersta
nd
ing
ou
r busin
ess

our business performance
28
OPERATING REVIEW – EARLS COuRT AND OLyMPIA CONTINuED
Capco aims to generate value from Earls Court and Olympia through: maintaining a robust exhibition business and migrating shows to an improved Olympia; securing planning consent for Sir Terry Farrell’s Masterplan; finalising land assembly and development rights; establishing the development framework and strategy to take Earls Court forward post-planning and realising Seagrave Road with our joint venture partners. Over the following six pages we report on the progress made against each of these strategic elements during 2011.
Highlights
– Valuation of Earls Court and Olympia interests up 10.9% (LfL) to £471 million
– Sir Terry Farrell’s Masterplan unveiled in March
– Planning applications for The Earls Court Opportunity Area and Seagrave Road submitted in June
– Conditional joint venture for Seagrave Road agreed with the Kwok Family Interests
– Exclusivity agreement secured with LBHF in July
– LBHF resolves to grant planning permission for the Seagrave Road scheme in February 2012
– West Hall completed creating 97,000 sq ft of modern exhibition space
– EC&O Venues 2011 EBITDA resilient at £18.5 million
Strategy
– Secure planning consent for the Earls Court Masterplan
– Take forward Seagrave Road development in partnership with the Kwok Family Interests
– Finalise land assembly and future development rights
– Consolidate the exhibition business into an enlarged and improved Olympia
2010 20110
5
10
15
20
EBITDA PERFORMANCE
£18.5m 2.1%
£18.9m £18.5m
2010 20110
40
80
120
160
200
EARLS COURTCAPITAL VALUE UPLIFT
£55m 39.3% (LfL)
£138m
£195m
2010 20110
20
40
60
80
100
120
SEAGRAVE ROADVALUATION
£116m 6.2%
£104m£116m
29 www.capitalandcounties.com
ou
r busin
ess perform
an
ce
Ho
w w
e go
vern o
ur bu
siness
ou
r fina
nc
ial statem
ents
un
dersta
nd
ing
ou
r busin
ess
EC&O VENuES
Operating perfOrmanceEC&O Venues is Capco’s world-class conference, exhibitions and events business now comprising Olympia and the two exhibition halls at Earls Court. Following the recent sale of The Brewery, this now represents 1.3 million square feet of prime conference and events space.
The EC&O Venues business demonstrated resilience during 2011, particularly in light of the uncertainty caused by the planning process at Earls Court. EBITDA was £18.5 million,
down 2 per cent from 2010. 37 new exhibitions were contracted to the venues in 2011 which helped to offset the loss of other shows, and 15 new shows have already been confirmed for 2012. New exhibitions contracted in 2011 included Landscape, the London Pet Show and the Ideal Home Show At Christmas which welcomed more than 80,000 visitors – making it the biggest new uK exhibition in 20 years.
The valuation of Olympia increased 4 per cent during the year to £121 million. This partly reflects the completion of the West Hall in Olympia which provides 97,000 square feet of modern, flexible space to complement the existing Grand and National Halls and the Olympia Two Building. The closure of the weekday District Line service at Olympia has been managed through the retention of services supporting certain exhibitions as well as improvements to the West London Line, now running more frequently. The Brewery, which was operated by EC&O Venues, was sold on 9 February 2012.
A number of shows across both venues have secured substantial increases in visitor figures year-on-year. At Olympia, Top Drawer, the biannual retail trade event, increased its retailer attendance at the autumn 2011 show by 12 per cent year-on-year. Similarly the Speciality & Fine Food Fair attracted over 8,000 visitors,
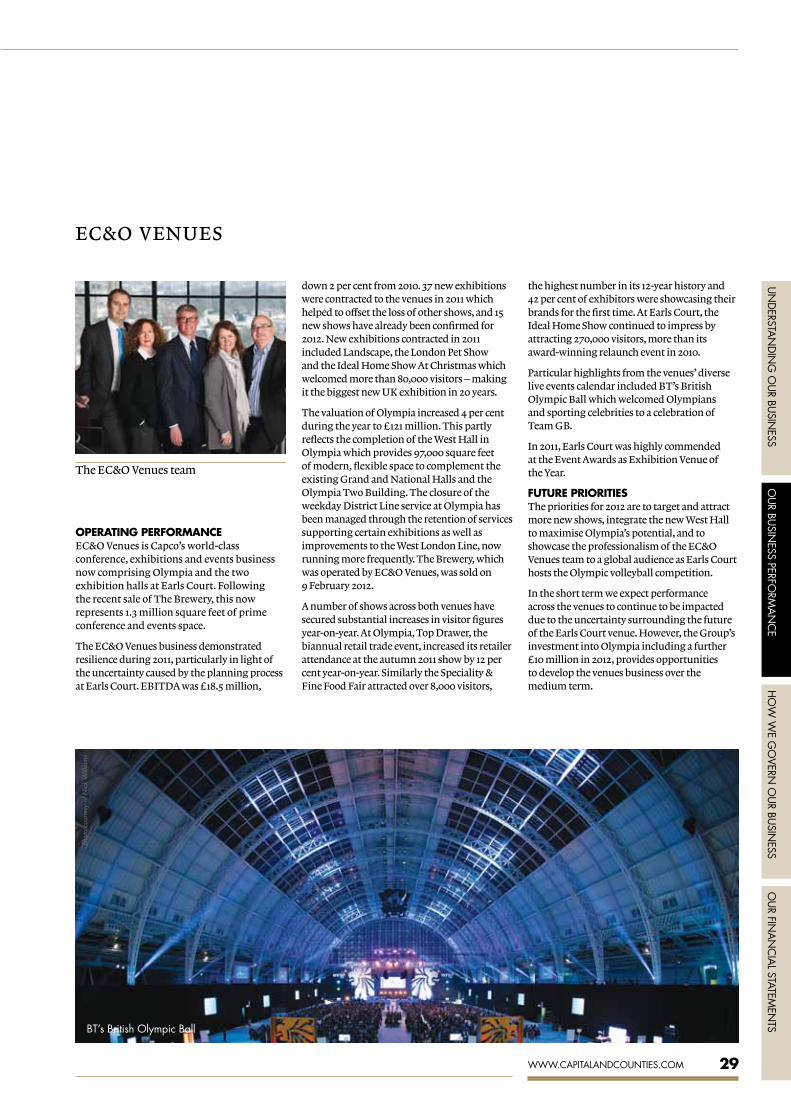
The EC&O Venues team
the highest number in its 12-year history and 42 per cent of exhibitors were showcasing their brands for the first time. At Earls Court, the Ideal Home Show continued to impress by attracting 270,000 visitors, more than its award-winning relaunch event in 2010.
Particular highlights from the venues’ diverse live events calendar included BT’s British Olympic Ball which welcomed Olympians and sporting celebrities to a celebration of Team GB.
In 2011, Earls Court was highly commended at the Event Awards as Exhibition Venue of the year.
future priOritiesThe priorities for 2012 are to target and attract more new shows, integrate the new West Hall to maximise Olympia’s potential, and to showcase the professionalism of the EC&O Venues team to a global audience as Earls Court hosts the Olympic volleyball competition.
In the short term we expect performance across the venues to continue to be impacted due to the uncertainty surrounding the future of the Earls Court venue. However, the Group’s investment into Olympia including a further £10 million in 2012, provides opportunities to develop the venues business over the medium term.
bt’s british olympic ball
Phot
o co
urte
sy o
f Nic
k W
illia
ms

our business performance
30
THE EARLS COuRT MASTERPLAN
Gary yardley, Investment Director
I am delighted with the progress we have made on the Earls Court Masterplan this year and the highlight was securing resolution to grant planning consent for Seagrave Road. This reflects the strength of the wider scheme, with all the benefits it brings to London and the local area. We are confident that we are making positive steps towards securing the broader consent and finalising the respective land transactions with LBHF and TfL.
The ECOA team
Earls Court is a rare opportunity in London: the potential for significant regeneration in a central London location. The site is bordered by established, high-value residential addresses, including Chelsea, Kensington, Holland Park and Fulham. Established transport infrastructure including three Tube stations, a London Overground station and access to the A4 provide unrivalled connectivity. The residential developments that benefit most from the regeneration effect are those that create a strong sense of place by investing in areas such as community facilities and the quality of their public realm. Capco’s strong focus on place-making, in support of Sir Terry Farrell’s Masterplan, offers the potential for substantial long-term value creation in Earls Court.
The valuation of Capco’s interests in Earls Court as at December 2011 reflects the progress made towards realising this potential, with the valuation basis now a land valuation having regard for redevelopment potential, a change from the previous basis of existing use as operational assets. As at December 2011, the valuation has increased to £195 million, a rise of 39 per cent, reflecting a value of £8.6 million per acre versus £6.1 million per acre at December 2010.
In June 2011, outline planning applications were submitted for the redevelopment of a 70 acre site, the Earls Court and West Kensington Opportunity Area (ECOA), alongside a detailed application in respect of the 7.5 acre Seagrave Road site. The applications set out the proposals for transforming this huge tract of land into a new London district based on Sir Terry Farrell’s Masterplan to create ‘Four
earls court cgi.
OPERATING REVIEW – EARLS COuRT AND OLyMPIA CONTINuED

31 www.capitalandcounties.com
ou
r busin
ess perform
an
ce
Ho
w w
e go
vern o
ur bu
siness
ou
r fina
nc
ial statem
ents
un
dersta
nd
ing
ou
r busin
ess
4
1
3
2
1 earls court villagewelcoming, elegant and grand, somewhere to spend time, enjoy city life and the High street.
2 west brompton villagea leafy, relaxed and tranquil neighbourhood with homes, facilities and open spaces that are perfect for families.
3 west kensington villagea dynamic, commercial quarter which attracts innovation and enterprise.
4 north end villagewith its vibrant street life, varied and green setting and range of good quality homes, this village will revitalise north end road.
21st century High streetthe boutiques, cafes and delis of the High street will create an urban buzz for the neighbourhood, connecting the four villages.
seagrave roada new, high-quality, mixed tenure residential neighbourhood set around a central garden square.
urban Villages and a 21st Century High Street’. Changes to the applications were made earlier this year reflecting comments received from the public consultations and reviews by statutory bodies including the Greater London Authority (GLA). The amendments further embed the development into the existing area and increase sensitivity to the local environment, covering an area of 10.1 million square feet, a reduction of approximately 0.3 million square feet of space from the overall Masterplan.
As the ECOA straddles the boundary between two local authorities, planning applications
were submitted to both the Royal Borough of Kensington & Chelsea (RBKC) and the London Borough of Hammersmith & Fulham (LBHF). These outline planning applications are typically used for large-scale, strategic sites, and seek consent for the amount of development, the uses of the development (for example residential, office space, cultural, retail) and guidelines for future architecture and landscaping.
In July, the ECOA was recognised by the Mayor of London’s Replacement London Plan as an Opportunity Area with great potential
for large-scale urban regeneration, and in February 2012 the Seagrave Road scheme, which will deliver the major residential component of West Brompton Village, was given a resolution to grant consent by LBHF.
Negotiations continue with Transport for London (TfL) in respect of the extension of Capco’s existing long leasehold interests at Earls Court, as well as commercial agreements covering TfL and LBHF’s land in the ECOA. Capco entered into an exclusivity agreement with LBHF in July, giving the parties 12 months to agree the commercial transaction.

our business performance
32
Key milestones
January 2011 February March April May June July August September October November December January 2012 February
Sir Terry Farrell’s Masterplan launched at MIPIM
Sir Terry Farrell’s Masterplan launched in London with stakeholder, media and analyst briefings
LBHF, RBKC and the GLA consult on options for the Supplementary Planning Document (SPD)
Planning applications submitted for ECOA (outline application) and Seagrave Road (detailed application)
Architectural Review announces that Sir Terry Farrell’s Masterplan concept has been awarded the Regeneration and Masterplanning prize for the Future Project Awards
A payment of £15 million was made to LBHF, £10 million of which is refundable should a transaction not be concluded.
As an interested party, Capco was notified that LBHF received an application for judicial review of the exclusivity agreement and the Court will hear this application in June. The request for judicial review has no bearing on the planning applications for the Earls Court Masterplan or for Seagrave Road, and should not delay the discussions with LBHF or TfL.
cOnsultatiOnThe proposals for the ECOA are a result of close collaboration with the other landowners, TfL and LBHF, informed by a collection of world-class architects led by Sir Terry Farrell.
As this is one of the largest and most important developments in London, the local community has been consulted about the proposals for two and a half years through a comprehensive community engagement programme. Over 1,000 people who live in the area attended seven public exhibitions at the Earls Court Exhibition Centre in March and June 2011. Comments and feedback from these exhibitions and from the forum on Capco’s innovative, award-winning community website www.myearlscourt.com have helped shape the evolution of Sir Terry Farrell’s Masterplan. The engagement programme and updates to myearlscourt.com will continue through the
planning and development process and into the future during construction and through to eventual occupation.
The extensive consultation exercise has led to the ECOA being established across planning policy at regional, local and site-specific levels. As well as the Mayor of London’s Replacement London Plan covering regional strategy, both RBKC and LBHF include the area within their Core Strategy plans for development within their boroughs. The Greater London Authority (GLA) and both councils have further considered proposals for comprehensive development within a joint document specific to the ECOA, the Supplementary Planning Document (SPD), for which second round consultation concluded in December. LBHF is undertaking a consultation regarding the inclusion of the estates, which is currently ongoing.
Among the positive reactions to the ECOA Masterplan proposals, there have been concerns voiced by some residents of the West Kensington and Gibbs Green estates. Capco is committed to working with all local residents and stakeholders, and with LBHF, making the area work for everybody.
empress stateCapco has a 50 per cent stake in this landmark office which is adjacent to the ECOA. The 31 storey tower is the highest building in LBHF. Fully renovated in 2003, the entire building is
let to the Metropolitan Police Authority on a long lease which expires in June 2019. The lease is subject to annual RPI increases subject to a collar, with 5 per cent being applied at the 2011 review. Capco’s share of NRI for 2011 was £7.1 million.
In the medium-term, opportunities to extend or review the existing lease will be considered or alternatively the property may be suitable for a residential conversion in line with the plans for the ECOA.
future priOrities Although the EC&O estate has benefited from a year of great momentum, the Board remains mindful of the risks surrounding planning processes of this scale, including applications for judicial review. In mitigation, the planning process has been followed scrupulously and an extensive level of consultation with the local community, local authorities and the GLA has been undertaken throughout the process. In terms of Section 34A, no details have at present been brought forward by the Government, however these proposals will continue to be monitored.
During 2012 the key focus remains to secure planning consents for the Earls Court Masterplan. The Group will seek to conclude land transactions with LBHF and TfL consolidating future development rights and take forward the Seagrave Road project in partnership with the Kwok Family Interests.
OPERATING REVIEW – EARLS COuRT AND OLyMPIA CONTINuED

33 www.capitalandcounties.com
ou
r fina
nc
ial statem
ents
Key milestones
January 2011 February March April May June July August September October November December January 2012 February
The Mayor adopts the London Plan which identifies ECOA as a strategic Opportunity Area for London
LBHF adopts its Core Strategy, again identifying ECOA as a strategic area for the borough
2nd stage consultation launched on preferred option for the SPD (in line with Sir Terry Farrell’s Masterplan) and Case for Regeneration
Conditional Joint Venture for Seagrave Road agreed with the Kwok Family Interests
LBHF consults on the inclusion of the estates
Resolution to grant for the Seagrave Road scheme
the seagrave road site is located to the south of the earls court exhibition halls and will deliver the major residential component of sir terry farrell’s west brompton village. in line with aspirations for the wider earls court development, the project will be integrated into the surrounding area, revitalising seagrave road, lillie road and west brompton station. the scheme, providing 1 million square feet (gross external area) will replace the existing car park, and will deliver a high-quality, mixed-tenure residential neighbourhood comprising a total of 808 new homes and a range of amenities. the gross development costs (excluding land) for the scheme of approximately £300 million will be spread over three phases,
limiting the peak capital requirement (excluding land) to approximately £100 million.
in december 2011 a 50:50 conditional joint venture with the Kwok family interests was agreed, signalling an important milestone in capco’s proposals to create new homes and jobs for the area. completion of the joint venture is primarily conditional upon receipt of an unfettered planning consent following the resolution to grant consent received in february 2012. the site would be acquired by the joint venture at a price of £131 million, which compares to the valuation as at 31 december 2011 of £116 million, unchanged from June 2011, but an increase of 6 per cent from december 2010.
ou
r busin
ess perform
an
ce
un
dersta
nd
ing
ou
r busin
essH
ow
we g
overn
ou
r busin
ess
West Brompton village begins to take shape on Seagrave Road
SEAGRAVE ROAD
seagrave road cgi.

our business performance
34
OPERATING REVIEW – THE GREAT CAPITAL PARTNERSHIP AND CHINA
Creating value, recycling capital
the Jermyn street entrance to the piccadilly arcade.

35 www.capitalandcounties.com
ou
r busin
ess perform
an
ce
Ho
w w
e go
vern o
ur bu
siness
ou
r fina
nc
ial statem
ents
un
dersta
nd
ing
ou
r busin
ess

our business performance
36
Capco’s other investments principally consist of the Group’s share in The Great Capital Partnership (GCP), a 50:50 joint venture with Great Portland Estates plc, and two property investment funds in China. Both portfolios focus on delivering superior, total returns to shareholders and have generated substantial capital for reinvestment back into Capco’s core business.
OPERATING REVIEW – THE GREAT CAPITAL PARTNERSHIP AND CHINA
HighlightsThe Great Capital Partnership
– Strong valuations of assets
– Sales of £48 million achieved 10% in excess of valuation
– Resilient occupancy levelsChina
– Disposals of China I and China II funds
– £55 million returned from disposals to date
– £20 million to be delivered over next two years
StrategyThe Great Capital Partnership
– Disciplined recycling of capital from mature assets
China
– Liquidating remaining assets from China I fund
2010 20110
20
40
60
80
100
GCP OCCUPANCY
81.9% 15.4%
97.3%
81.9%
2010 20110
5
10
15
20
GCP ERV
£14m 11.4% (LfL)
£14.8m £14.0m
2010 20110
50
100
150
200
250
300
GCP CAPITAL VALUE
£241m 9.8% (LfL)
£260m£241m

37 www.capitalandcounties.com
ou
r busin
ess perform
an
ce
Ho
w w
e go
vern o
ur bu
siness
ou
r fina
nc
ial statem
ents
un
dersta
nd
ing
ou
r busin
ess
GCP comprises a number of strategically-located properties in London’s West End. These provide asset management, refurbishment and development opportunities which deliver strong recurrent income and capital recycling potential.
The Group’s Chinese investments, managed by Harvest Capital Partners, have been focused on several mixed use, residential and retail developments in central China.
Operating perfOrmancethe great capital partnershipOverall, GCP properties have continued to perform well. Compared to the uK as a whole, occupier demand for office and retail accommodation in central London remains robust. For this reason ERV growth has been maintained, increasing by 11.4 per cent like-for-like to £14.0 million. Values also rose, by 9.8 per cent on a like-for-like basis for the same period to £241 million. However, net rental income on a like-for-like basis was down 7.3 per cent to £10.1 million following the disposals.
In line with Capco’s strategy to recycle capital from mature property assets back into the Group’s core businesses, GCP has continued to dispose of properties, a process that began in 2010. £48 million (Capco’s share) has been realised in 2011, with a further £27 million in 2012 to date. All are part of the Group’s successful programme of disciplined capital recycling that has taken advantage of continuing investor appetite for central London property assets.
Contracts have been exchanged to sell a portfolio of properties located on and around Regent Street to Great Portland Estates for a price of £150 million (Capco’s share £75 million). This represented a premium of 5.4 per cent to the December 2011 valuation. The sale is subject to consent from the freeholder (The Crown Estate) and the banking syndicate. It will trigger the prepayment of some of the outstanding debt so net proceeds to the Group are expected to be in the range of £30 – £35 million.
chinaThe Group’s investments in China, managed by Harvest Capital Partners, have been highly profitable returning capital to the Group of £55 million during the year. The balance is due to be returned over the next two years. The sale of the China II fund produced a return on capital in excess of 60 per cent.
future priOrities Having realised over £100 million from these two portfolios in 2011, the focus will remain on continuing to realise capital profitably to recycle into the core business. The immediate focus will be on closing the GCP transactions.
£103 million of capital has been released from sales within gcp and china, capitalising on the demand for prime real estate assets.
– 26-40 Kensington High street (included tK maxx, wagamama, urban outfitters, virgin active)
– 67-75 Kingsway
– china i and china ii
Disposals
GCP AND CHINA
26–40 Kensington High street

our business performance
38
FINANCIAL REVIEW
Valuation surplus continues to drive Total Return
The results for the year reflect the Group’s asset management strategy supported by the continued strength of the central London property market. As a result, the Group has generated strong returns with a pre-tax profit of £161.9 million, compared to £132.5 million for the previous year.
Like-for-like capital values increased 9.2 per cent. With little movement in yield across the year, this can be attributed to ERV growth and a step change in value achieved in the second half of the year on the Group’s investments at Earls Court.
Net rental income remained consistent with that of the prior year at £69 million, although this masks a number of significant acquisitions and disposals.
In May, the Group completed a placing of 62.1 million new ordinary shares at a price of 162 pence per share to fund acquisition opportunities at Covent Garden. This placing generated gross proceeds of £100.6 million, and increased the number of ordinary shares in issue to 683.9 million. As the capital raise was structured as a placing at market value, no adjustment to prior year comparatives has been made.
In November, the Group concluded a refinancing at Covent Garden, securing a £300 million debt facility to refinance an existing loan of £223 million due to mature in 2013. This extended maturity of the debt to October 2016, with a further two year extension available at the Group’s option subject to meeting certain financial covenants.
financial pOsitiOnEPRA net assets (adjusted, diluted) increased by £220 million or 18 pence per share since 31 December 2010, a rise of 11.7 per cent. The significant factors were the capital raising completed in May, generating £97 million net of expenses, and the continued revaluation gains recorded on the Group’s property portfolio in 2011, most notably at Earls Court which excluding the Empress State building (also reported within this segment) gave rise to a like-for-like return of 10.9 per cent. Covent Garden’s like-for-like performance was also strong with property values up 9.2 per cent.
Summary consolidated balance sheet:
2011 £m
2010 £m
Investment and development property 1,616.8 1,377.6
Investments 19.5 66.3
Net debt (463.7) (476.1)
Other assets and liabilities (69.5) (84.4)
IFRS net assets 1,103.1 883.4
Fair value of derivative financial instruments 36.4 53.9
Deferred tax on exceptional items 4.9 (12.5)
unrecognised surplus on trading properties 1.0 1.1
EPRA adjusted net assets 1,145.4 925.9
EPRA adjusted, diluted net assets per share (pence) 166 148
Soumen Das, Finance Director
The momentum in the operating business during 2011 has been reflected in strong results for the year. Capital has been recycled into the Group’s core activities whilst fresh capital has been raised through the equity issue and debt refinancing. Our prudent balance sheet and committed facilities position the Group well for the year ahead.
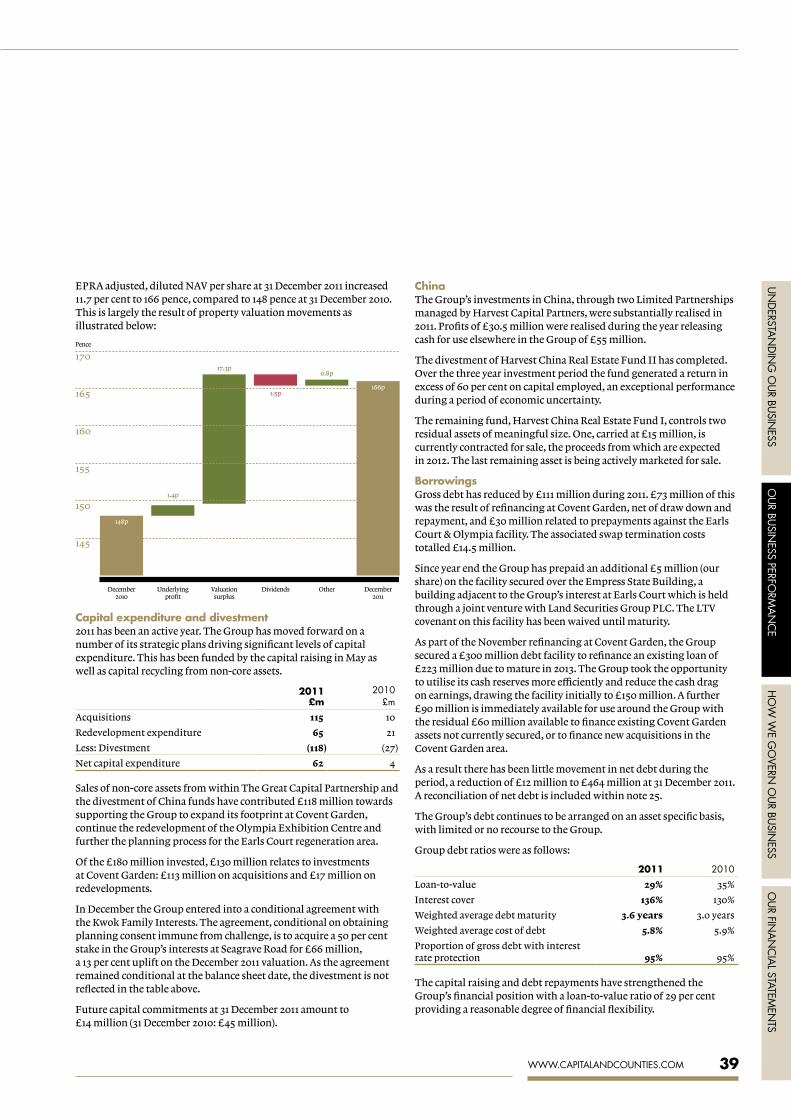
39 www.capitalandcounties.com
ou
r busin
ess perform
an
ce
Ho
w w
e go
vern o
ur bu
siness
ou
r fina
nc
ial statem
ents
un
dersta
nd
ing
ou
r busin
ess
EPRA adjusted, diluted NAV per share at 31 December 2011 increased 11.7 per cent to 166 pence, compared to 148 pence at 31 December 2010. This is largely the result of property valuation movements as illustrated below:
140
145
150
155
160
165
170
December2010
Pence
December2011
Underlyingprofit
Valuationsurplus
Dividends Other
17.3p
1.4p
1.5p
0.8p
166p
148p
capital expenditure and divestment2011 has been an active year. The Group has moved forward on a number of its strategic plans driving significant levels of capital expenditure. This has been funded by the capital raising in May as well as capital recycling from non-core assets.
2011 £m
2010 £m
Acquisitions 115 10
Redevelopment expenditure 65 21
Less: Divestment (118) (27)
Net capital expenditure 62 4
Sales of non-core assets from within The Great Capital Partnership and the divestment of China funds have contributed £118 million towards supporting the Group to expand its footprint at Covent Garden, continue the redevelopment of the Olympia Exhibition Centre and further the planning process for the Earls Court regeneration area.
Of the £180 million invested, £130 million relates to investments at Covent Garden: £113 million on acquisitions and £17 million on redevelopments.
In December the Group entered into a conditional agreement with the Kwok Family Interests. The agreement, conditional on obtaining planning consent immune from challenge, is to acquire a 50 per cent stake in the Group’s interests at Seagrave Road for £66 million, a 13 per cent uplift on the December 2011 valuation. As the agreement remained conditional at the balance sheet date, the divestment is not reflected in the table above.
Future capital commitments at 31 December 2011 amount to £14 million (31 December 2010: £45 million).
chinaThe Group’s investments in China, through two Limited Partnerships managed by Harvest Capital Partners, were substantially realised in 2011. Profits of £30.5 million were realised during the year releasing cash for use elsewhere in the Group of £55 million.
The divestment of Harvest China Real Estate Fund II has completed. Over the three year investment period the fund generated a return in excess of 60 per cent on capital employed, an exceptional performance during a period of economic uncertainty.
The remaining fund, Harvest China Real Estate Fund I, controls two residual assets of meaningful size. One, carried at £15 million, is currently contracted for sale, the proceeds from which are expected in 2012. The last remaining asset is being actively marketed for sale.
borrowingsGross debt has reduced by £111 million during 2011. £73 million of this was the result of refinancing at Covent Garden, net of draw down and repayment, and £30 million related to prepayments against the Earls Court & Olympia facility. The associated swap termination costs totalled £14.5 million.
Since year end the Group has prepaid an additional £5 million (our share) on the facility secured over the Empress State Building, a building adjacent to the Group’s interest at Earls Court which is held through a joint venture with Land Securities Group PLC. The LTV covenant on this facility has been waived until maturity.
As part of the November refinancing at Covent Garden, the Group secured a £300 million debt facility to refinance an existing loan of £223 million due to mature in 2013. The Group took the opportunity to utilise its cash reserves more efficiently and reduce the cash drag on earnings, drawing the facility initially to £150 million. A further £90 million is immediately available for use around the Group with the residual £60 million available to finance existing Covent Garden assets not currently secured, or to finance new acquisitions in the Covent Garden area.
As a result there has been little movement in net debt during the period, a reduction of £12 million to £464 million at 31 December 2011. A reconciliation of net debt is included within note 25.
The Group’s debt continues to be arranged on an asset specific basis, with limited or no recourse to the Group.
Group debt ratios were as follows:
2011 2010
Loan-to-value 29% 35%
Interest cover 136% 130%
Weighted average debt maturity 3.6 years 3.0 years
Weighted average cost of debt 5.8% 5.9%
Proportion of gross debt with interest rate protection 95% 95%
The capital raising and debt repayments have strengthened the Group’s financial position with a loan-to-value ratio of 29 per cent providing a reasonable degree of financial flexibility.
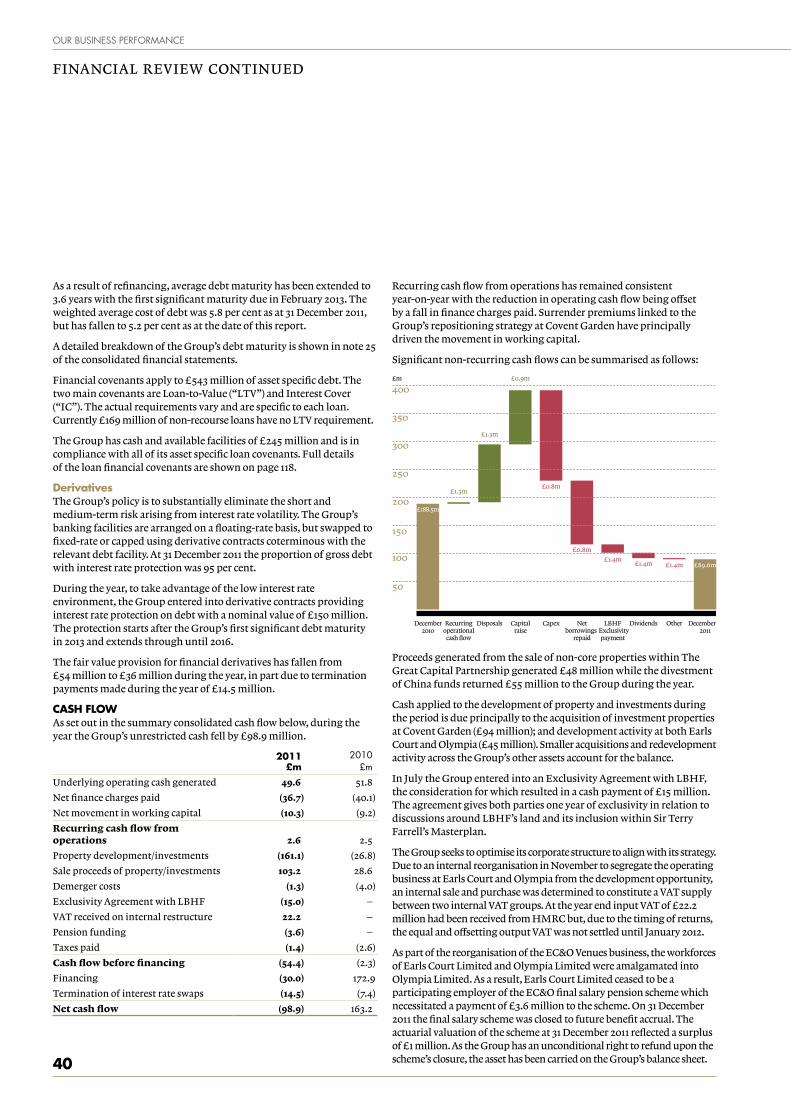
our business performance
40
FINANCIAL REVIEW CONTINuED
Recurring cash flow from operations has remained consistent year-on-year with the reduction in operating cash flow being offset by a fall in finance charges paid. Surrender premiums linked to the Group’s repositioning strategy at Covent Garden have principally driven the movement in working capital.
Significant non-recurring cash flows can be summarised as follows:
0
50
100
150
200
250
300
350
400
December2010
£m
December 2011
DisposalsRecurringoperational
cash flow
Capitalraise
Capex Netborrowings
repaid
LBHF Exclusivity
payment
Dividends Other
£0.9m
£1.3m
£1.3m
£0.8m
£0.8m
£1.4m£1.4m£1.4m
£188.5m
£89.6m
Proceeds generated from the sale of non-core properties within The Great Capital Partnership generated £48 million while the divestment of China funds returned £55 million to the Group during the year.
Cash applied to the development of property and investments during the period is due principally to the acquisition of investment properties at Covent Garden (£94 million); and development activity at both Earls Court and Olympia (£45 million). Smaller acquisitions and redevelopment activity across the Group’s other assets account for the balance.
In July the Group entered into an Exclusivity Agreement with LBHF, the consideration for which resulted in a cash payment of £15 million. The agreement gives both parties one year of exclusivity in relation to discussions around LBHF’s land and its inclusion within Sir Terry Farrell’s Masterplan.
The Group seeks to optimise its corporate structure to align with its strategy. Due to an internal reorganisation in November to segregate the operating business at Earls Court and Olympia from the development opportunity, an internal sale and purchase was determined to constitute a VAT supply between two internal VAT groups. At the year end input VAT of £22.2 million had been received from HMRC but, due to the timing of returns, the equal and offsetting output VAT was not settled until January 2012.
As part of the reorganisation of the EC&O Venues business, the workforces of Earls Court Limited and Olympia Limited were amalgamated into Olympia Limited. As a result, Earls Court Limited ceased to be a participating employer of the EC&O final salary pension scheme which necessitated a payment of £3.6 million to the scheme. On 31 December 2011 the final salary scheme was closed to future benefit accrual. The actuarial valuation of the scheme at 31 December 2011 reflected a surplus of £1 million. As the Group has an unconditional right to refund upon the scheme’s closure, the asset has been carried on the Group’s balance sheet.
As a result of refinancing, average debt maturity has been extended to 3.6 years with the first significant maturity due in February 2013. The weighted average cost of debt was 5.8 per cent as at 31 December 2011, but has fallen to 5.2 per cent as at the date of this report.
A detailed breakdown of the Group’s debt maturity is shown in note 25 of the consolidated financial statements.
Financial covenants apply to £543 million of asset specific debt. The two main covenants are Loan-to-Value (“LTV”) and Interest Cover (“IC”). The actual requirements vary and are specific to each loan. Currently £169 million of non-recourse loans have no LTV requirement.
The Group has cash and available facilities of £245 million and is in compliance with all of its asset specific loan covenants. Full details of the loan financial covenants are shown on page 118.
derivativesThe Group’s policy is to substantially eliminate the short and medium-term risk arising from interest rate volatility. The Group’s banking facilities are arranged on a floating-rate basis, but swapped to fixed-rate or capped using derivative contracts coterminous with the relevant debt facility. At 31 December 2011 the proportion of gross debt with interest rate protection was 95 per cent.
During the year, to take advantage of the low interest rate environment, the Group entered into derivative contracts providing interest rate protection on debt with a nominal value of £150 million. The protection starts after the Group’s first significant debt maturity in 2013 and extends through until 2016.
The fair value provision for financial derivatives has fallen from £54 million to £36 million during the year, in part due to termination payments made during the year of £14.5 million.
casH flOwAs set out in the summary consolidated cash flow below, during the year the Group’s unrestricted cash fell by £98.9 million.
2011 £m
2010 £m
underlying operating cash generated 49.6 51.8
Net finance charges paid (36.7) (40.1)
Net movement in working capital (10.3) (9.2)
Recurring cash flow from operations 2.6 2.5
Property development/investments (161.1) (26.8)
Sale proceeds of property/investments 103.2 28.6
Demerger costs (1.3) (4.0)
Exclusivity Agreement with LBHF (15.0) –
VAT received on internal restructure 22.2 –
Pension funding (3.6) –
Taxes paid (1.4) (2.6)
Cash flow before financing (54.4) (2.3)
Financing (30.0) 172.9
Termination of interest rate swaps (14.5) (7.4)
Net cash flow (98.9) 163.2

41 www.capitalandcounties.com
ou
r busin
ess perform
an
ce
Ho
w w
e go
vern o
ur bu
siness
ou
r fina
nc
ial statem
ents
un
dersta
nd
ing
ou
r busin
ess
Financing cash flows included the capital raising in May 2011 which generated £97 million, net of expenses. This was offset by the refinancing at Covent Garden, resulting in a cash outflow of £77 million, and Earls Court & Olympia debt prepayments of £30 million.
Dividends paid of £9.6 million reflect the final dividend payment made in respect of the 2010 financial year and the interim dividend in respect of 2011. A total of 1.5 pence per share was paid during the year.
financial perfOrmanceunderlying earningsThe Group has presented an underlying calculation of profit before tax and adjusted earnings per share figures in addition to the amounts reported under IFRS. Like the EPRA adjusted earnings measure, these amounts exclude the effects of gains and losses associated with investment property valuations, fair value movements on financial derivatives, but also exclude certain exceptional items. The Directors regard this presentation to provide useful information on the underlying performance of the business.
Summary consolidated income statement:
2011 £m
2010 £m
Net rental income 69.0 69.0
Other income 0.8 0.1
Gain on revaluation and sale of investment and development property 123.3 134.6
Profit on sale of available for sale investments 30.5 –
Administration expenses (22.2) (23.9)
Net finance costs (35.2) (46.3)
Other items (4.3) (1.0)
Taxation (8.2) (0.9)
IFRS profit for the year 153.7 131.6
Adjustments:
Gain on revaluation and sale of investment and development property (123.3) (134.6)
Profit on sale of available for sale investments (30.5) –
Change in fair value of derivative financial instruments (14.1) 0.3
Exceptional finance costs 14.5 7.1
Demerger costs – 5.3
Remeasurement of deferred consideration 4.2 (0.7)
Other adjustments (0.8) 0.6
Taxation on non-underlying items 5.8 (0.4)
Underlying profit after tax 9.5 9.2
Underlying earnings per share (pence) 1.4 1.5
underlying profit after tax increased from £9.2 million to £9.5 million and underlying earnings per share decreased from 1.5 pence to 1.4 pence.
net rental incomeLike-for-like net rental income was £65.9 million, an increase of 2.2 per cent. At the headline level the Group’s net rental income remained consistent with the prior year at £69.0 million. This masks the impact of acquisitions at Covent Garden, an increase of £1.4 million, and disposals within The Great Capital Partnership, a reduction of £1.8 million.
The annualised impact of acquisitions at Covent Garden in 2011 is expected to be £3 million. The annualised impact on net rental income attributable to disposals within The Great Capital Partnership in 2011 is expected be to £2.1 million. The properties contracted for sale from The Great Capital Partnership so far in 2012 represent a further £3.9 million.
0
10
20
30
40
50
60
70
80
2010
£m
LfL +2.2%
2011CoventGarden
EC & O GCP Nonlike-for-like
£0.9m£1.3m
£0.8m£1.4m£69.0m £69.0m
At Covent Garden, net rental income increased by £2.1 million to £27.8 million an increase of 5.3 per cent on a like-for-like basis. This increase was largely the result of acquisitions, £1.4 million, and new lettings which achieved an increase of £0.9 million. A property swap completed in February, which comprised the disposal of a property on the periphery of the estate for a strategic piazza facing freehold interest, had an adverse impact of £0.5 million.
The Great Capital Partnership generated net rental income of £11.0 million (our share), a decrease of £2.6 million, 7.3 per cent on a like-for-like basis due to the continued strategy of disposing of non-core mature properties in support of the Group’s core investments. Void costs increased by £0.5 million during the year, the result of exercising break clauses to facilitate redevelopment and sale. Disposals achieved in 2010 and 2011 reduced recurring net rental income by £1.8 million.
Earls Court & Olympia, which includes the Group’s interest in the Empress State Building, increased by £1.1 million, 3.1 per cent on a like-for-like basis to £30.2 million. This increase is attributable to new shows and increased take-up at Olympia. The index-linked lease on the Empress State Building continues to deliver annual increases linked to RPI which, excluding a one-off adjustment of £0.3 million in 2011, resulted in an increase of five per cent for the year. Subsequent to the balance sheet date, the Group has disposed of its interests in The

our business performance
42
FINANCIAL REVIEW CONTINuED
Brewery, an operating business based in the City of London, which contributed £0.8 million to net rental income in 2011.
Historically the Venues business has controlled a number of properties that were reported within its EBITDA which contributed £1.2 million to net rental income in 2011. As a result of the internal reorganisation and the closure of the Earls Court & Olympia defined benefit pension scheme referred to above, £0.9 million was included within the EC&O segmental result but not the Venues EBITDA. Therefore EBITDA of the Venues business fell by £0.4 million to £18.5 million in the year to 31 December 2011.
Lease incentives of £1.1 million were included within net rental income for the year.
property valuationProperty valuation gains of £123.3 million (2010: £134.6 million) include unrealised gains of £119.4 million and realised gains of £3.9 million.
With little movement in yields, valuation gains in 2011 have been predominantly income driven. Covent Garden experienced like-for-like ERV growth of 8.8 per cent, while ERV within The Great Capital Partnership increased by 11.4 per cent on a like-for-like basis reflecting the positive sentiment in the central London property market.
Fees and other costs relating to acquisitions account for the majority of the revaluation losses of £7.2 million recorded on acquisitions during the year.
A step change in the valuation basis of the Group’s interests at Earls Court was achieved in the second half of the year. under International Financial Reporting Standards the Group’s valuers are required to consider the highest and best use when valuing investment and development properties carried at fair value. The highest and best use valuation of the Earls Court exhibition halls at 31 December 2011 was considered to be a land value having regard for redevelopment potential. This contributed to a like-for-like revaluation surplus of 10.9 per cent recorded on investment properties held at Earls Court & Olympia which attributed a land value of £8.6 million per acre to the site. This reflects the Group’s efforts toward achieving planning consents on the ECOA which are discussed further in the Operating Review.
The Group’s trading properties were impaired by £0.1 million (2010: £0.1 million) where the fair value was determined to be less than original cost. In aggregate the Group’s trading properties have an unrealised valuation surplus of £1 million at 31 December 2011 which has not been recognised in the financial statements.
administration expensesunderlying administration expenses increased by £3.6 million to £22.2 million. This was in line with expectation and is attributed to increased head count and establishment costs, the result of becoming a standalone business in May 2010.
net finance costsExcluding gains and losses on the change in fair value of derivatives and one-off costs incurred on the termination of interest rate swaps, underlying net finance costs for the year of £34.8 million have decreased by £4.1 million. This reduction reflects the full year impact of prepayments in 2010 together with prepayments of £30 million
made during 2011. The November refinancing at Covent Garden further reduced average debt levels during the latter part of the year.
taxationThe net tax charge for the year ended 31 December 2011 was £8.2 million.
The tax charge on underlying profits is £2.4 million reflecting an underlying tax rate of 20 per cent. The underlying tax rate is lower than the standard rate of uK corporation tax of 26 per cent (28 per cent in 2010) due to capital allowances.
The tax rate on underlying profit is expected to trend toward the uK corporation tax rate in the medium term. The standard rate of corporation tax will be 23 per cent from 2014.
Contingent tax, the amount of tax that would become payable on a theoretical disposal of all investment properties held by the Group, is nil (2010: £10.4 million). The contingent tax position is arrived at after allowing for Group loss relief.
derivative valuationDue to the macroeconomic factors during the year, longer term interest rates have fallen in excess of 1 per cent. Shorter term rates however remain reasonably stable year-on-year although LIBOR has risen. With an average debt maturity of 3.6 years the contraction in long-term rates has had little overall impact at a Group level.
The valuation movement of £14.1 million arose in part from the termination payments made during the year of £14.5 million.
exceptional itemsIn addition to revaluation surpluses on investment and development property and fair value movements on derivative financial instruments, exceptional items which have been removed from the calculation of underlying profit include:
– Finance charges totalling £14.5 million which were recorded on the termination of interest rate swaps arising on debt repayments and prepayments of £252 million, £223 million in relation to the Group’s refinancing at Covent Garden in November and £30 million in relation to the facility secured over Earls Court & Olympia;
– As part of the Group’s 2009 acquisition of the non-controlling interest’s share in Earls Court & Olympia, a deferred consideration payment becomes due based on a number of factors including a potential redevelopment of the site and the outcome of the planning process. With the Group having submitted its planning application in June relating to the full Earls Court regeneration area, the provision has been remeasured resulting in an exceptional charge of £4.2 million;
– Following divestment of the Group’s interests in China, profits of £30.5 million have been realised. These have been treated as exceptional given their non-recurring nature;
– Other income comprises exceptional credits of £0.8 million. These relate to a non-recurring VAT claim settled with HM Revenue & Customs and a non-refundable deposit received by the Group, taken to income as a result of an incompleted transaction.
financial strategyOur policy is to optimise the Group’s weighted average cost of capital by using an appropriate mix of debt and equity. The Group follows

43 www.capitalandcounties.com
ou
r busin
ess perform
an
ce
Ho
w w
e go
vern o
ur bu
siness
ou
r fina
nc
ial statem
ents
un
dersta
nd
ing
ou
r busin
ess
a secured debt strategy as it believes this gives better access to borrowings and at lower overall costs.
The Group’s borrowings are secured against large pools of assets. Importantly, the recent refinancing at Covent Garden provides flexibility to fund expenditure elsewhere in the Group.
The Group’s financial structure is monitored with reference to guidelines approved by the Board.
Group Treasury operates a formal treasury policy covering all aspects of treasury activity including funding, counterparty exposure limits, management of interest rate risk, currency and liquidity risks. The Board receives regular reports on compliance with these policies, which are reviewed on an annual basis.
south african listingThe Group maintains a secondary listing on the JSE Limited which is classified as an “inward” listing.
Institutional investors who received Capco shares upon demerger were initially given a two year exemption to allow time to realign their portfolios. The exemption was due to expire in May 2012. During 2011 the Group applied to the South African authorities for an extension which was granted for a further 12 month period.
However, in a major new policy on exchange control introduced by the South African National Treasury, as of December 2011 all inward shares have been reclassified as “domestic” shares for trading purposes. This reclassification means that the previous limits on holding Capco shares under exchange control regulations have been removed for South African institutional investors in the Group, if those shares were acquired on the JSE. In addition Capco is now eligible for certain JSE indices.
At 31 December 2011, 21 per cent of the Group’s shares were held on the South African register.
Headline earnings per share, a JSE measure, stood at 2 pence per share for the year to 31 December 2011.
going concernEconomic conditions remain challenging, however the Group has a prudent balance sheet and sufficient cash and available facilities
to meet both its ongoing and foreseeable future commitments. The Group recently refinanced a significant amount of its debt secured over Covent Garden, extending its weighted average debt maturity. With sufficient headroom against financial covenants and a significant pool of unsecured assets there continues to be a reasonable expectation that the Company and the Group have adequate resources to continue in operational existence for the foreseeable future.
Accordingly, the Directors continue to adopt the going concern basis in preparing the 2011 annual report and accounts.
dividendsThe Company intends to grow its dividend as the success of its asset plans is reflected in underlying profit, whilst taking into account future commitments and providing for the financial flexibility required to maximise long-term shareholder value.
The Board has recommended a final dividend of 1.0 pence per share taking the total dividend for the year to 1.5 pence per share. Subject to approval at the Company’s Annual General Meeting the dividend will be paid on 21 June 2012 to shareholders on the register at 18 May 2012.
Subject to approval at the Company’s Annual General Meeting, the Board intends to offer an optional scrip dividend scheme which will apply to the 2011 final dividend. The scrip dividend scheme will give shareholders the right to elect to receive new ordinary shares in the Company instead of future cash dividends. At the Directors’ discretion, the scrip dividend scheme may also be offered in respect of any future final or interim dividends.
Soumen DasFinance Director
29 February 2012
2011 epra performance measures
measure definition of measure
Adjusted earnings Recurring earnings from core operational activity £48.0m
Adjusted earnings per share Adjusted diluted earnings per weighted number of ordinary shares 7.3p
Adjusted net assets Net asset value adjusted to exclude fair value movements on interest rate swaps £1,145m
Adjusted net assets per share
Adjusted diluted net assets per share 166p
Triple net assets Adjusted net assets amended to include the fair value of financial instruments and debt £1,118m
Triple net assets per share Diluted triple net assets per share 162p
Net initial yield Annualised rental income less non-recoverable costs as a percentage of market value plus assumed purchasers’ costs
4.1%
Topped-up initial yield Net initial yield adjusted for the expiration of rent free periods 4.4%
Occupancy ERV of occupied space as a percentage of ERV of combined portfolio 94.3%

our business performance
44
At the heart of Capco’s business activities
intrOductiOnCorporate Responsibility is at the heart of Capco’s business activities, central to our role as a place-maker and to our working practices.
We are a young company and as we grow we aim to build a reputation for being responsible and ethical in all aspects of our business. Many of the goals we have set have been met and I am satisfied with the progress we have made in promoting sustainable place-making and with the benefits our education programme provides to young people.
Ian Henderson CBEChairman of the Corporate Responsibility Committee
29 February 2012
The two threads of Corporate Responsibility that run through our business are environment and community. These broad themes have a material impact on the areas where our assets are based.
With regard to our environmental strategy, an example of our innovation is the recently launched Carbon Voyage Scheme at EC&O Venues. This provides solutions for freight and delegate travel aimed at reducing costs and carbon emissions.
Of particular note in our community strategy is the Covent Garden Business Enterprise challenge in which a total of 550 young people worked to design a product that could be sold in the Apple Market and developed their business skills in the process.
CORPORATE RESPONSIBILITy
Ian Henderson, Chairman of the Corporate Responsibility Committee
We value the feedback received from our stakeholders on environmental and community issues and these views influence the design of our future strategy. The opinions of our employees are taken into consideration when determining the direction of our human resources strategy.
gOvernanceThe CR Committee, which is chaired by Ian Henderson, ensures that CR initiatives are firmly aligned with corporate strategy. The implementation of strategy is driven by the CR Executive Committee, which is chaired by HR and CR Director, Jill Pett. Capco also has a Charity Committee, chaired by Ian Durant.
Capco’s Business Code of Practice and company policies set out long-term commitments to high standards of social, ethical and environmental practices. They also frame the CR annual objectives which are set and reviewed every year.
prOgressIn last year’s Annual Report we set out our CR objectives for 2011 and we are pleased that we have made progress against our goals.
We have set ourselves stretching aims for the year ahead that will take our CR strategy forward into the next phase of our development.
In this section we report on progress made and future intentions.
I am satisfied with the progress we have made to promote sustainable place-making which enhances the environment and with the benefits our education programme provides to young people.
key
Some progress
Satisfactory progress
Good progress

45 www.capitalandcounties.com
ou
r busin
ess perform
an
ce
Ho
w w
e go
vern o
ur bu
siness
ou
r fina
nc
ial statem
ents
un
dersta
nd
ing
ou
r busin
ess
commitment made last year progress what we achieved in 2011 2012 objective
corporate cr strategy – embedded into the fabric of our day-to-day work
To develop and implement CR Policy across the Group, review every three years and seek full commitment from all members of staff.
CR initiatives aligned to corporate strategy by the Board CR Committee.
CR strategy is driven by the CR Executive Committee.
Continue to build engagement with the CR agenda across the Group.
To identify and manage CR-related risks through a formal and externally evaluated annual review.
CR-related risks are included in the Capco risk register and reviewed externally by Environ annually.
Further information on the risk management process is set out in the section beginning on page 14.
Any areas of concern are escalated to the Board.
Continue to manage potential risks with care, escalating concerns promptly where appropriate.
To maintain and enhance accreditations to CR related indices.
EC&O Venues was successfully recertified to the BS 8901 Sustainable Event Management System and has chaired the Association of Event Venues Sustainability Group which encourages best practice in the global events industry.
Capco’s accreditation in the FTSE4GOOD Index was retained with an 80 per cent rating.
Participate in the 2012 Carbon Disclosure Project index.
Measure our performance using the Global Reporting Initiative (GRI).
Maintain membership of FTSE4GOOD and consider membership of another leading index.
To implement sponsorship and charitable objectives that support the communities in which the Group invests, focusing on projects designed to assist in the development of young people.
This year the Group donated £118,217 to a number of charities, particularly those that benefit young people. Organisations that have benefited include Bedhead FC/Guy Mascolo Football Charity, Stoll (formerly Sir Oswald Stoll Foundation) and Interact Reading Service. We continued our partnership with the Duke of Edinburgh Award Scheme and will be working with the Scheme to extend our work with young people in London.
The EC&O Charitable Trust builds close relationships with EC&O’s immediate community and celebrates its 10th anniversary this year. To date, it has given approximately £200,000 to charitable causes within the London Borough of Hammersmith and Fulham and in the Royal Borough of Kensington and Chelsea.
Support initiatives in communities in which we invest. We particularly wish to help organisations that support the well-being and development of young people in London with an emphasis on homelessness, education, health and sport. We will participate in and support appropriate charities linked to the property industry and we will continue our long-standing involvement with associations that help injured service personnel.
environment – our creative and holistic approach to place-making protects the environment where our estates are based
To develop and refresh Capco’s Environmental Policy and Guide in support of the evolution of the business.
We have established an Environmental Committee which includes participants from across the business and is developing our environmental policy and ensuring consistency of implementation across the Group.
EC&O Venues has its own sustainability policy, which is promoted to its customers and subject to regular review. This can be viewed on the website at www.eco.co.uk/sustainability.
In 2011, EC&O Venues launched the first sustainable travel system of its kind worldwide in association with Carbon Voyage.
Produce a carbon footprint map for Capco.
Monitor and assess the success of EC&O Venues’ participation in the Carbon Voyage scheme.

our business performance
46
CORPORATE RESPONSIBILITy CONTINuED
commitment made last year progress what we achieved in 2011 2012 objective
To support and comply with the requirements of the Carbon Reduction Commitment (CRC) Energy Efficiency Scheme.
Our 2011 data has been approved as compliant. Continue to ensure our compliance and manage our participation in the CRC scheme.
Achieve a 5 per cent reduction in carbon emissions for 2011.
We achieved a reduction of 3 per cent against our target; this equated to a reduction in consumption of 8.2 per cent in terms of KW hours.
Aim for a 5 per cent reduction in consumption on a like-for-like basis against 2011 figures as a benchmark.
Review the existing Energy Performance Certificates for Covent Garden to assess existing performance levels and identify areas of concern.
undertake a pilot study at Covent Garden to prepare Display Energy Certificates for several buildings and review the findings.
Identify and maximise recycling opportunities, minimising the volume of landfill waste.
At Covent Garden we appointed a new refuse contractor, and aim to achieve zero landfill waste from the Market Building. All non-recyclable waste will be taken to an Energy Recovery Plant or Material Recycling Facility (MRF).
Waste segregation from our Covent Garden construction sites is being logged using online programme ‘Smartwaste’ to minimise landfill. At The Henrietta development we implemented robust segregation of waste, allowing 85 per cent to be recycled.
At our head office we have installed desk-side recycling boxes and recycling bins on each floor. Our recycling company uses an MRF site to maximise recycling opportunities. Any non-recyclable waste is used as fuel for energy recovery by incineration.
Aim to increase waste recycling from our Covent Garden tenants, produce reliable statistical data for ongoing monitoring and investigate options for rolling this out across our estate.
Continue to work closely with our contractors to minimise waste sent to landfill.
Develop and implement a process to monitor efficiently water usage, identifying and implementing measures to reduce consumption.
We have made limited progress in this area. Assess ways in which we can create efficiencies through improved monitoring and reduced consumption.
Continue to focus development initiatives on the regeneration of brown-field sites and the sensitive and appropriate renovation of existing properties.
During our development work at The Henrietta in Covent Garden, we preserved as much of the existing building as possible, including most of the structure, wall tiles and windows. Fireplaces were retained for use on future projects.
LED lighting was introduced in areas of The Flower Cellars development in Covent Garden to reduce electricity consumption.
The new West Hall at Olympia has one of the most efficient heavily loaded suspended floor slabs in the country, providing a saving of 15 per cent on its carbon footprint compared with other forms of construction.
Sustainability and the environment continue to sit at the heart of the Masterplan for the ECOA and leading environmental consultants Beyond Green are an integral part of the design team.
Minimise energy consumption and CO2 emissions during the design phase of the Seagrave Road development in line with the Mayor’s energy strategy. This will include using energy efficient building materials and creating a sustainable living environment.
Continue to review the inclusion of sustainable elements in our development programme to suit our occupiers.

47 www.capitalandcounties.com
ou
r busin
ess perform
an
ce
Ho
w w
e go
vern o
ur bu
siness
ou
r fina
nc
ial statem
ents
un
dersta
nd
ing
ou
r busin
ess
commitment made last year progress what we achieved in 2011 2012 objective
Health and safety – regular reporting and monitoring
To promote our Health & Safety (H&S) Policy across the organisation and to suppliers, to report and monitor its effectiveness and comply with the requirements of the Health and Safety at Work Directives.
The Group H&S Committee, which is chaired by the Investment Director and includes representatives from all parts of the business, meets twice a year.
The Capco Board and subsidiary Boards receive regular H&S reports.
In addition, each business holds its own meetings and promotes H&S with suppliers and contractors.
An internal audit of H&S procedures has been completed.
update the H&S Management Plan and further improve our H&S reporting across the Group.
local communities – we make a positive impact on the local communities where our assets are located
To engage comprehensively with the local communities where our assets are located.
earls courtThe EC&O Venues Directors host regular residents’ meetings at both Earls Court and Olympia and have a dedicated residents’ page on the website www.eco.co.uk in order to maintain ongoing dialogue with the community.
Four public consultation exhibitions for the ECOA Masterplan were held at the Earls Court Exhibition Centre in March 2011 and were attended by over 1,000 people who live in the area.
Following feedback from these exhibitions, changes were made to the Masterplan. A second series of exhibitions in June showcased these changes and unveiled the proposals for the Seagrave Road site. Over 400 people attended.
Award-winning project website www.myearlscourt.com continues to be used as an effective tool to engage with local communities, attracting over 20,000 unique visitors in 2011.
An education project with two local primary schools in Earls Court focused on the past, present and future of the area and environmental issues. year 6 at Fulham Primary School won a Research Award at Hammersmith & Fulham’s Children’s Parliament for their presentation on regeneration.
For the second year running, Capco sponsored the community arts event, The Earls Court Festival.
covent gardenThe Covent Garden team continues to build on its strong relationship with the Covent Garden Area Trust. Tenants and local community groups were engaged and updated on the public realm improvements and works to King Street and the Piazza.
The ‘Take Two’ education project was designed to engage 46 pupils from two schools in Camden and Westminster in crime and community safety issues through digital media. The Covent Garden Business Enterprise challenge benefited a total of 550 young people.
We also supported Citrus Saturday, an educational initiative by university College London for 13 and 14 year-olds that combined a business skills training programme with experience of selling citrus-themed food and drink at Covent Garden stalls.
We have always encouraged our contractors to employ local skills and at our Flower Cellars development over 90 per cent of labour was from London boroughs.
Continue to support community projects which specifically benefit young people in London and in the areas where our assets are located.

our business performance
48
commitment made last year progress what we achieved in 2011 2012 objective
To engage comprehensively with our shareholders.
Our Executive Directors, Chairman and Deputy Chairman engage regularly with shareholders and invite dialogue.
As an example the Executive Directors undertook 97 1:1 meetings with shareholders during 2011. In addition, members of the uK Shareholders Association were invited to a strategy briefing from the Chief Executive and Finance Director.
Continue to encourage shareholder involvement in business strategy and dialogue with the Executive Directors and Chairman.
To provide the highest quality of property management and customer service across the Group, where possible meeting fully the objectives of shoppers, occupiers and visitors, and to promote appropriate practices for the occupancy of our properties.
EC&O Venues received The Venue Team of the year award at the AEO Excellence Awards and was highly commended in the category of Exhibition Venue of the year at the Events Awards.
To further enhance our property management strategy for the benefit of all stakeholders.
capco people – we employ people with a diverse range of experience and expertise
To engage comprehensively with our staff.
Staff are kept abreast of any major developments through CEO business briefings.
Emails regarding community events are circulated to head office staff.
Launch corporate intranet site to improve internal communications.
Implement internal development programmes that will enhance the capability and performance of our people.
Introduce succession planning at all levels within the business.
To encourage employees to engage in CR initiatives and contribute 100 Group employee hours to supporting these projects.
To continue to develop Group staff as good corporate citizens whilst encouraging them to undertake their own charitable initiatives through the staff recognition fund.
In 2011 the Group gave £118,217 in charitable donations.
Employee fundraising of £2,100 was matched by the Capco staff recognition fund.
Over 100 Group employee hours were contributed to supporting Capco’s initiatives. In addition, Capco employees undertook a number of personal fundraising initiatives including triathlons, volunteering for Crisis at Christmas and cake sales.
Continue to encourage employees to engage in CR initiatives and contribute 120 Group employee hours to supporting these projects.
We will encourage individual fundraising activities of our people and their immediate families through the staff recognition fund.
CORPORATE RESPONSIBILITy CONTINuED

49 www.capitalandcounties.com
ou
r busin
ess perform
an
ce
Ho
w w
e go
vern o
ur bu
siness
ou
r fina
nc
ial statem
ents
un
dersta
nd
ing
ou
r busin
ess
Health and safetyAs explained on page 47, the reporting of urgent or serious matters is monitored by the Group Health & Safety Committee and the Board as necessary and performance is monitored by independent external advisers. With estimated combined visitor numbers of more than 50 million to EC&O and Covent Garden, there were 22 RIDDOR accidents reported for the year and no prohibition notices served. In respect of the 445 employees there were 4 reportable incidents.
peopleThe number of people employed across the Group at the year end totalled 445, of which 52 are based at head office. Our aim is to be the employer of choice in our sector. As a consequence of recruiting the best people with entrepreneurial flair, we have high performing staff who deliver Capco’s demanding business plan.
During 2012 we will be launching an internal people brand ‘MyCapco’ which will incorporate the following areas: performance, reward, learning and development, giving back and well-being. under this new internal brand we will be launching a number of people-related initiatives including a learning and development strategy.
Typically, we accelerate career development for individuals by giving them significant responsibility early in their careers. Our fast moving business requires high performance at all levels so we have introduced a new review process that measures performance in key skills and sets individual objectives that are clearly linked to Company strategy. We believe that high performance should be recognised and therefore bonus awards are linked to ratings received during the review process. Furthermore, as part of our remuneration strategy employees participate in our share schemes ensuring alignment to business strategy.
We value the well-being of our workforce and aim to encourage healthy and balanced lifestyles. Diversity is important to us and we recognise the business benefits of employing people with varied outlooks. The ratio of women to men within our Senior Management team is 1:1. Information on our approach to Board diversity can be found in the Governance section on page 53.
Our people are supported in their professional development through further academic study. We currently have a number of graduates working towards their final RICS APC assessment and two junior members of our Finance Team are working towards formal professional qualification.
Aware of the challenges that young people are facing entering the job market, we aim to provide work experience placements across the business.

How we govern our business
50
executive directOrs
ian HawkswOrtHcHief executive age 46
Ian leads Capco, shaping strategy and driving performance. He has over 20 years’ experience in large scale global real estate development, asset and corporate management, having been a senior director of both Hongkong Land and Liberty International. Ian is a Chartered Surveyor and a member of leading international industry bodies.
cOmmittee membersHipCorporate Responsibility Committee Nomination Committee
external appOintmentsAssociation of Foreign Investors in Real Estate Japan Residential Investment Company Limited
sOumen dasfinance directOr age 35
Soumen is an experienced corporate financier responsible for leading the finance function of Capco which includes reporting, treasury, corporate finance and tax. Formerly an executive director of uBS specialising in real estate, he joined Capco from Liberty International having coordinated the demerger.
gary yardleyinvestment directOr age 46
Gary has been a senior deal maker in the uK and European real estate market for over 20 years. He leads Capco’s real estate investment and development activities overseeing all real estate transactions. Previously Chief Investment Officer of Liberty International, Gary is a Chartered Surveyor and a former partner of King Sturge.
BOARD OF DIRECTORS
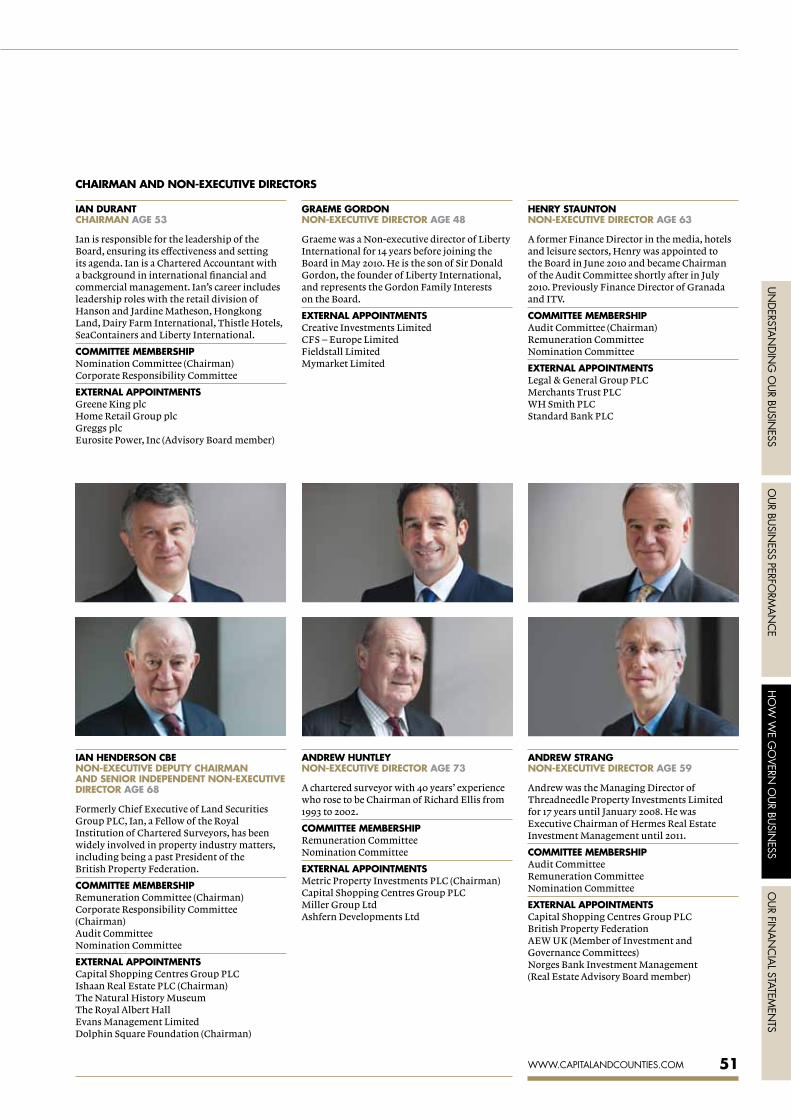
ou
r busin
ess perform
an
ce
Ho
w w
e go
vern o
ur bu
siness
ou
r fina
nc
ial statem
ents
un
dersta
nd
ing
ou
r busin
ess
51 www.capitalandcounties.com
ian durantcHairman age 53
Ian is responsible for the leadership of the Board, ensuring its effectiveness and setting its agenda. Ian is a Chartered Accountant with a background in international financial and commercial management. Ian’s career includes leadership roles with the retail division of Hanson and Jardine Matheson, Hongkong Land, Dairy Farm International, Thistle Hotels, SeaContainers and Liberty International.
cOmmittee membersHipNomination Committee (Chairman) Corporate Responsibility Committee
external appOintmentsGreene King plc Home Retail Group plc Greggs plc Eurosite Power, Inc (Advisory Board member)
graeme gOrdOnnOn-executive directOr age 48
Graeme was a Non-executive director of Liberty International for 14 years before joining the Board in May 2010. He is the son of Sir Donald Gordon, the founder of Liberty International, and represents the Gordon Family Interests on the Board.
external appOintmentsCreative Investments Limited CFS – Europe Limited Fieldstall Limited Mymarket Limited
Henry stauntOnnOn-executive directOr age 63
A former Finance Director in the media, hotels and leisure sectors, Henry was appointed to the Board in June 2010 and became Chairman of the Audit Committee shortly after in July 2010. Previously Finance Director of Granada and ITV.
cOmmittee membersHipAudit Committee (Chairman) Remuneration Committee Nomination Committee
external appOintmentsLegal & General Group PLC Merchants Trust PLC WH Smith PLC Standard Bank PLC
ian HendersOn cbenOn-executive deputy cHairman and seniOr independent nOn-executive directOr age 68
Formerly Chief Executive of Land Securities Group PLC, Ian, a Fellow of the Royal Institution of Chartered Surveyors, has been widely involved in property industry matters, including being a past President of the British Property Federation.
cOmmittee membersHipRemuneration Committee (Chairman) Corporate Responsibility Committee (Chairman) Audit Committee Nomination Committee
external appOintmentsCapital Shopping Centres Group PLC Ishaan Real Estate PLC (Chairman) The Natural History Museum The Royal Albert Hall Evans Management Limited Dolphin Square Foundation (Chairman)
andrew HuntleynOn-executive directOr age 73
A chartered surveyor with 40 years’ experience who rose to be Chairman of Richard Ellis from 1993 to 2002.
cOmmittee membersHipRemuneration Committee Nomination Committee
external appOintmentsMetric Property Investments PLC (Chairman) Capital Shopping Centres Group PLC Miller Group Ltd Ashfern Developments Ltd
andrew strangnOn-executive directOr age 59
Andrew was the Managing Director of Threadneedle Property Investments Limited for 17 years until January 2008. He was Executive Chairman of Hermes Real Estate Investment Management until 2011.
cOmmittee membersHipAudit Committee Remuneration Committee Nomination Committee
external appOintmentsCapital Shopping Centres Group PLC British Property Federation AEW uK (Member of Investment and Governance Committees) Norges Bank Investment Management (Real Estate Advisory Board member)
cHairman and nOn-executive directOrs

How we govern our business
52
Good corporate governance underpins Capco
CORPORATE GOVERNANCE
Ian Durant, Chairman
cHairman’s intrOductiOnIn my Chairman’s Statement I noted that a strong corporate governance structure underpins Capco’s culture. I have a personal interest in corporate governance and am a member of the corporate governance committee of the ICAEW and the 30% Club which encourages increased gender diversity on Boards. I am therefore pleased to introduce Capco’s 2011 Corporate Governance Report.
Good corporate governance underpins our organisation, providing a framework of controls and reporting on which the business operates. This report describes the operation of the Board and its Committees and explains how we applied the principles of good governance set out in the uK Governance Code last year.
The report provides information on the wide range of matters considered by the Board and Committees during the year. Of these, particular attention was given to Group strategy.
Board composition remains a key focus, and the report contains an update on our ongoing recruitment of a new Non-executive Director.
Our annual Board Evaluation has helped shape our agenda for 2012, and we set out some of the outcomes on page 55.
Capco is committed to maintaining high standards of corporate governance. This is demonstrated by our early adoption of two key provisions of the new uK Corporate Governance Code last year: annual re-election of Directors, and periodic external Board valuations. The Board will continue to monitor corporate governance developments and ensure that we maintain the high standards we have set ourselves.
We are committed to maintaining the high corporate governance standards we have set ourselves, and Board diversity is a key focus.
statement of compliance with the uk corporate governance codeThroughout 2011 the Company complied with all relevant provisions set out in the uK Corporate Governance Code, except that from 1 January 2011 to 4 February 2011 less than half the Board comprised independent Non-executive Directors. Following David Fischel’s decision to step down from the Board in February 2011, the Company became fully compliant with the Code.
provisionB.1.2
details of non-complianceFrom 1 January 2011 to 4 February 2011 less than half the Board comprised independent Non-executive Directors.
explanationThe Board appointed on demerger from Liberty International PLC was felt to offer continuity to shareholders and to remove the risk of introducing a number of new Directors to the Company within a short period of time. Immediately following the demerger a search was initiated for an additional independent Non-executive Director who would be appointed as Chairman of the Audit Committee. Following the appointment of Henry Staunton, and the resignation of David Fischel, the Company is now compliant with this provision.

ou
r busin
ess perform
an
ce
Ho
w w
e go
vern o
ur bu
siness
ou
r fina
nc
ial statem
ents
un
dersta
nd
ing
ou
r busin
ess
53 www.capitalandcounties.com
tHe bOard board compositionAs at 31 December 2011 the Board comprised the Chairman, three Executive Directors and five Non-executive Directors. The Non-executive Chairman is Ian Durant, the Chief Executive is Ian Hawksworth and the Deputy Chairman and Senior Independent Director is Ian Henderson.
board independenceThe uK Corporate Governance Code requires that, excluding the Chairman, at least half the Board should comprise Non-executive Directors determined to be independent. Since February 2011 the Board has comprised the Chairman, four independent Non-executive Directors, one non-independent Non-executive Director and three Executive Directors.
Board Independence
Executive Directors
3
Non-independent Non-executive Director
1
Chairman
1
Independent Non-executive Directors
4
The following table sets out which of the Directors the Board considers to be independent. Each independent Director has confirmed that there is no reason why they should not continue to be considered independent, and the Board is satisfied that they all remain independent in character and judgement.
name independent?
Ian Hawksworth No
Soumen Das No
Gary yardley No
Graeme Gordon No
Ian Henderson* yes
Andrew Huntley* yes
Henry Staunton yes
Andrew Strang* yes
4 4
* Each of these Non-executive Directors is considered to be independent as they met the Combined Code’s independence criteria on their appointment as Non-executive Directors of the Company’s former parent Liberty International PLC, and confirmed their continued independence on appointment as Directors of the Company.
board skillsInformation on the skills and experience of each Director can be found in their biographies on pages 50 and 51.
diversityThere is currently a lack of gender diversity on the Capco Board. The Board intends to make an appointment during 2012 that will strengthen Board Diversity. Following this appointment the percentage of female Directors is expected to be 10%. Additional information on Capco’s recruitment process for Non-executive Directors is set out on page 58.
Diversity is important to Capco across the Group. The Board recognises the benefits that diversity, including gender diversity, brings and has adopted a Board Diversity Policy. Additionally, the Chairman is a member of the 30% Club, committed to engaging on the topic to bring more women onto uK corporate boards.
We recognise the business benefits of employing people with varied outlooks. We are keen to develop female talent and the ratio of women to men within our Senior Management team is 1:1. Further information on our people practices, including our learning and development strategies, is contained in the Corporate Responsibility report on pages 44 to 49.
The Davies Review on Women on Boards recommended that companies should set out the percentage of women they aim to have on their Boards in 2013 and 2015. The Board does not feel that it would be appropriate to set
targets as all appointments must be made on merit, however gender and wider diversity issues will be taken into consideration when evaluating the skills, knowledge and experience desirable to fill each Board vacancy. We will report on Board Diversity each year from now on.
leadersHip structureThe Board is collectively responsible for the long-term success of the Company, and for its leadership, strategy, control and management.
The roles of the Chairman and Chief Executive are distinct and formally documented, with the Chairman being responsible for the leadership of the Board, ensuring its effectiveness and setting its agenda, and the Chief Executive for developing the Company’s strategic direction, implementing policies and strategies decided by the Board and managing the business in the most effective way possible.
Day-to-day management of the Group is delegated to the Executive Directors, subject to formal delegated authority limits, however certain matters have been reserved for consideration by the Board. These matters, which are reviewed annually, include: decisions on the composition of the Board, its Committees, Company strategy, significant funding decisions and corporate transactions, delegated authority limits and dividend policy.
The Board meets formally throughout the year with main meetings timed around the financial calendar, and additional meetings convened to consider specific matters as required. Attendance at meetings held during 2011 is shown in the table on page 55. If matters require approval at short notice, written approval is sought from all Directors.
Board papers are circulated several days in advance of meetings to ensure that Directors have sufficient time to consider their content prior to the meeting.
The Chairman also meets regularly with the Non-executive Directors without the Executive Directors being present.

How we govern our business
54
CORPORATE GOVERNANCE CONTINuED
tHe bOard in 2011In addition to regular reports from the Executive Directors, Company Secretary and Committee Chairmen, matters considered by the Board during the year included:
– Strategy
– 2011 and 2012 Budgets
– 2010 Annual Results and final dividend
– 2011 Interim Results and interim dividend
– 2011 AGM Resolutions
– Significant investment decisions including the Seagrave Road Development, land purchases, property acquisitions, disposals and leases
– Property valuations
– Interim management statements
– Risk governance
– 9.99% share placing
– Covent Garden refinancing
– The Bribery Act 2010
– Outcome of Board Evaluation
– Board Diversity
– Committees’ terms of reference and Schedule of matters reserved for Board decision
– Delegated authority limits
– Broker updates
– Changes to South African legislation
Regular informal Directors’ updates are also held. These meetings are often combined with site visits and are used to keep the Board updated on topical matters and Group progress. Four Directors’ updates were held during 2011 and topics included a planning update and a tour of the Masterplan Exhibition at Earls Court. The Directors’ updates also provide an opportunity for the Non-executive Directors to meet senior management.
Further information:
audit committee report – pages 59 and 60
risk management report – pages 14 to 17
remuneration committee – page 57
directors’ remuneration report – pages 61 to 68
nomination committee – page 58
cr committee – page 57
corporate responsibility report – pages 44 to 49
tHe bOardremit: Strategy; Leadership; Risk
audit cOmmitteeremit Oversees financial reporting; Monitors internal controls; Oversees risk management; Monitors internal and external auditors
remuneratiOn cOmmitteeremit Sets remuneration policy; Sets Executive Director Remuneration and incentives; Approves annual performance objectives
nOminatiOn cOmmitteeremit Recommends Board appointments; Succession planning; Board evaluation
cOrpOrate respOnsibility cOmmitteeremit Oversees corporate responsibility activities
leadersHip structure

ou
r busin
ess perform
an
ce
Ho
w w
e go
vern o
ur bu
siness
ou
r fina
nc
ial statem
ents
un
dersta
nd
ing
ou
r busin
ess
55 www.capitalandcounties.com
evaluatiOn prOcess
attendance at meetingsThe following table summarises Directors’ attendance at Board and Committee meetings held during 2011.
name board audit remuneration nomination cr
Ian Durant 9/9 – – 2/2 3/3
Ian Hawksworth 9/9 – – 2/2 3/3
Soumen Das 9/9 – – – –
Gary yardley 9/9 – – – –
Ian Henderson 9/9 4/4 3/3 2/2 3/3
David Fischel* 0/1 – – – –
Graeme Gordon 8/9** – – – –
Andrew Huntley 9/9 – 3/3 2/2 –
Henry Staunton*** 9/9 4/4 3/3 – –
Andrew Strang 9/9 4/4 3/3 2/2 –
9 4 3 2 3
* Resigned 4 February 2011.
** Graeme Gordon appointed Raymond Fine as his alternate in respect of the one meeting which he was unable to attend.
*** Henry Staunton was appointed to the Nomination Committee after the 2011 meetings.
board effectivenessboard performance and evaluation The Board conducts an annual evaluation of its own performance and that of its Committees and Directors. Following the externally facilitated review undertaken by Independent Audit Limited in 2010, it was felt that an internal review led by the Chairman and Company Secretary was appropriate for 2011. It is anticipated that an internal review will also be undertaken during 2012. Directors were asked to answer questions on a wide range of topics, and to highlight any areas they felt needed additional focus. The outcome of the review was positive, with the Board judged to be effective and open, however several areas have been identified for attention during 2012.
In addition to the Board evaluation, during the year the Senior Independent Director and Non-executive Directors conducted their first annual appraisal of the Chairman’s performance, and the Chairman undertook an appraisal of the Chief Executive’s performance.
Consideration of approach
Questionnaires prepared and issued to all Directors
Results collated
Interim Report presented to the Board for discussion
Action plan and process for reviewing progress agreed
key actions included – Appointment of Henry Staunton to Nomination Committee
– Increase Board diversity
– Improve planning of Committees’ annual agendas
– Develop Board succession plan
– Expand Non-executive Director development opportunities
Recommendation of Independent Audit Limited’s online Thinking Board to Nomination Committee and Board

How we govern our business
56
CORPORATE GOVERNANCE CONTINuED
typical nOn-executive directOr inductiOn and develOpmentOn appointment
– Individual meetings with the Chairman, Executive Directors and other senior staff
– Meetings with external and internal auditors
– Site visits
– Copies of Board and Committee papers, minutes and other important Company information provided
– External training
– Briefings
– Shareholders are offered the opportunity to meet new Directors
Ongoing – Training
– Periodic briefings from external advisers
– Able to take independent advice at the Company’s expense
– Have access to the advice and services of the Company Secretary
Through the Chairman, the Company Secretary is responsible for advising the Board on matters of corporate governance, and ensures good information flows within the Board and its Committees and between senior management and Non-executive Directors.
cOmmunicatiOn witH stakeHOldersOur policyThe Board is keen to ensure that our shareholders and potential investors have a good understanding of Capco’s business and performance, and that Directors are aware of any issues and concerns which shareholders may have. The Company communicates with stakeholders in a variety of ways.
corporate websiteOur corporate website www.capitalandcounties.com allows visitors to access Company information, annual reports and results presentations. The site also includes links to our business unit websites and contact details for shareholder queries. We are happy to answer queries by telephone or email ([email protected]).
annual general meeting The AGM allows the Chief Executive to update our shareholders on the progress of the business, and provides an opportunity for shareholders to pose questions to the Board, and meet senior executives. Shareholders are encouraged to vote on the resolutions put to the meeting, either in person at the meeting, online or by submitting a proxy card. We publish the results of the votes on all resolutions on our website following the meeting.
Our 2012 AGM will be held on 20 April 2012. The notice of Annual General Meeting will be issued to shareholders at least 20 working days before the meeting. Separate resolutions
will be proposed on each separate issue, and in accordance with the uK Corporate Governance Code, each of the Directors will offer themselves for re-election.
The Chairman and Chairmen of the Board Committees will be available at the AGM to meet shareholders and answer any questions. Should shareholders be unable to successfully resolve concerns following contact with the Chairman, Chief Executive or Finance Director, they may raise them through the Senior Independent Director.
shareholdersCommunication with the Company’s investors is a priority for the Board. The Company has an extensive investor relations programme, and during the year the Chief Executive and Finance Director held many meetings with the Company’s major shareholders to discuss the Group’s strategy and explain progress made across its estates. Numerous tours of the Group’s assets with investors and analysts were also held. The Chairman also writes to the Company’s major institutional shareholders each year and invites them to meet with him and the Senior Independent Director to discuss any matters they may wish to raise.
The Company has undertaken to consult with its major shareholders before implementing any significant changes to its remuneration structure.
During 2011 Board Directors also met with members of the uK Shareholders’ Association.
The Directors receive regular updates on the Company’s major shareholders, and receive
reports on shareholder feedback at each Board meeting. The Non-executive Directors are invited to attend the Company’s results presentations.
cOnflicts Of interestThe Chairman’s other business commitments are set out in his biography on page 51. During the year the Chairman was appointed as a Non-executive Director of Home Retail Group plc and Greggs plc. The Board remains satisfied that these commitments do not interfere with the performance of his duties as Chairman.
It is intended that the Deputy Chairman will be appointed as a Director of the supervisory Board of Capco’s joint venture in respect of the Seagrave Road development. He will receive no remuneration for this appointment. The Board considered this appointment carefully before confirming its approval and is satisfied that there is no conflict of interest and that the appointment will not compromise Mr Henderson’s independence.
On appointment, and each subsequent year, Non-executive Directors are required to confirm in writing that they have sufficient time to devote to the Company’s affairs. In addition they are required to seek prior approval from the Chairman before taking on any additional external commitments which may affect their time available to devote to the Company.
The Company’s Articles of Association permit the Board to authorise potential conflicts of a Director’s interests that may arise. The Board has adopted a procedure under which Directors must notify the Chairman of any potential conflicts. The Chairman then decides whether a conflict exists and recommends its authorisation by the Board where appropriate. A Director who had a conflict of interest would not be counted in the quorum or entitled to vote when the Board considered the matter in which the Director had an interest.
bOard cOmmitteesThe Board has established Audit, Remuneration, Nomination and Corporate Responsibility Committees. The terms of each Committee are available on the Company’s website www.capitalandcounties.com. The activity of each Committee is described on the following pages.

ou
r busin
ess perform
an
ce
Ho
w w
e go
vern o
ur bu
siness
ou
r fina
nc
ial statem
ents
un
dersta
nd
ing
ou
r busin
ess
57 www.capitalandcounties.com
cr committeeaudit committee remuneration committee
Members:Henry Staunton (Chairman) Ian Henderson Andrew Strang
The Audit Committee, reporting to the Board, has responsibility for overseeing the financial reporting process, monitoring the effectiveness of internal control, internal audit, risk management, the statutory audit and monitoring the independence of the statutory auditors and the provision of non-audit services. As at 31 December 2011 and the date of this report the Committee comprises three independent Non-executive Directors, and is chaired by Henry Staunton who is considered to have significant, recent and relevant financial experience.
The Audit Committee met four times during 2011. Attendance at these meetings is shown in the table on page 55. A full report from the Audit Committee is set out on pages 59 and 60.
Members:Ian Henderson (Chairman) Andrew Huntley Henry Staunton Andrew Strang
The Remuneration Committee has responsibility for setting Executive Director remuneration and bonuses, and oversight of senior staff’s remuneration. As at 31 December 2011 and the date of this report the Committee comprises four independent Non-executive Directors, and is chaired by Ian Henderson. The Committee is advised by independent consultants, Kepler Associates. The Committee met three times during 2011 and met twice early in 2012 to approve bonuses for 2011, review salaries and set targets for 2012. Attendance at the meetings held in 2011 is shown in the table on page 55.
Matters considered by the Committee during the year include:
– Committee terms of reference
– Institutional investor voting reports
– Share schemes and 2011 performance targets
– Awards of share options and matching shares
– Directors’ Remuneration Report
– Chairman and Chief Executive’s expenses
– Annual bonus structure and application across the Group
– Executive Directors’ remuneration and targets
– Market updates
A full Directors’ Remuneration Report is set out on pages 61 to 68.
Members:Ian Henderson (Chairman) Ian Hawksworth Ian Durant
The Corporate Responsibility Committee has responsibility for overseeing the Group’s activities in the area of corporate responsibility on behalf of the Board. As at 31 December 2011 and the date of this report, the Corporate Responsibility Committee comprised Ian Henderson (Chairman), Ian Durant and Ian Hawksworth. The Committee met three times during 2011. Attendance at these meetings is shown in the table on page 55.
Matters considered by the Committee during the year include:
– 2010 CR Report
– updates from the CR Executive Committee
– Briefing from environmental consultants
– Charitable donations and spend against budget
The Group’s corporate responsibility activities are described on pages 44 to 49.

How we govern our business
58
CORPORATE GOVERNANCE CONTINuED
nomination committee
Members:Ian Durant (Chairman) Ian Hawksworth Ian Henderson Andrew Huntley Henry Staunton Andrew Strang
The Nomination Committee has responsibility for making recommendations on Board appointments and succession to the Board. As at 31 December 2011 and the date of this report, the Nomination Committee comprised Ian Durant (Chairman), Ian Hawksworth, Ian Henderson, Andrew Huntley, Henry Staunton and Andrew Strang. The Nomination Committee met twice during the year. Attendance at these meetings is shown in the table on page 55.
Matters considered by the Committee during the year include:
– Non-executive Director time commitments
– Board Diversity and Diversity policy
– Board and Committee composition
– Proposed recruitment of Non-executive Director
– Chairman and Chief Executive performance reviews
– Board evaluation
During the search for an additional Non-executive Director the recruitment process has been as follows:
– The Committee discussed Board composition and determined that increased gender diversity was desirable.
– A shortlist of three executive search firms was drawn up and, after a selection process, The Zygos Partnership was engaged to assist with the recruitment process.
– A person specification for the role was prepared and a list of candidates identified.
– The Chairman and Chief Executive are meeting with shortlisted candidates and will report to the Committee before an appointment is recommended.
gOing cOncernA statement on going concern is set out on page 70.
dtr disclOsureThe disclosures required under DTR 7.2 of the Disclosure and Transparency Rules are contained in this report and the Audit Committee Report, except for information required under DTR 7.2.6 which is contained in the Directors’ Report on pages 69 and 70.
By order of the Board
Ian DurantChairman
29 February 2012

ou
r busin
ess perform
an
ce
Ho
w w
e go
vern o
ur bu
siness
ou
r fina
nc
ial statem
ents
un
dersta
nd
ing
ou
r busin
ess
59 www.capitalandcounties.com
The Audit Committee, reporting to the Board, has responsibility for overseeing the financial reporting process, monitoring the effectiveness of internal controls, internal audit, risk management, the statutory audit and monitoring the independence of the statutory auditors and the provision of non-audit services.
In addition to regular reports from the Financial Controller, matters considered by the Audit Committee each year include:
– Preliminary Results and Annual Report
– Representation letters
– Going Concern
– Management Accounts
– Corporate Governance Policies
– Valuers’ reports and valuations
– Internal Audit Plan and reports
– Taxation
– Risk management review
– Controls update
– External audit plan
– Reappointment of external auditors
– Accounting treatment of matters requiring the use of judgement and estimates
– Interim Results and Interim Management Statements
– Regulatory developments
During 2011 the Audit Committee also considered:
– The Bribery Act 2010
– Earls Court Development
– Disaster recovery and business continuity procedures
The Committee met privately during the year with both the external and internal auditors and Committee members attended a private meeting with the Company’s valuers. The Committee invites the Company’s Chairman, Chief Executive, Finance Director and Financial Controller to attend its meetings together with senior representatives of the external and internal auditors. Other senior management are invited to present such reports as are required for the Committee to discharge its responsibilities.
(a) external auditorsThe Committee has oversight of the relationship with the external auditors, with responsibility for developing, implementing and monitoring the Company’s policy on external audit, and for monitoring the auditors’ independence, objectivity and compliance with ethical, professional and regulatory requirements. Following a tender process in 2010 PricewaterhouseCoopers LLP (“PwC”) were appointed as Group auditors. The Committee monitored PwC’s performance during 2011 and is satisfied with the service received. The Committee has therefore recommended to the Board that PwC be reappointed in 2012.
(b) internal auditorsFollowing an assessment of the internal audit requirement from 2011 onwards, BDO LLP were appointed as internal auditor in place of CSC who had provided transitional services after the demerger in 2010. A five-year audit plan was developed which is aligned to areas highlighted in the Group risk register.
AuDIT COMMITTEE REPORT
Henry Staunton, Chairman of the Audit Committee
I am pleased to introduce Capco’s 2011 Audit Committee Report. The Audit Committee is confident that effective internal controls and risk management processes are in place. It was pleasing that the Board’s confidence in the Committee was reflected in the 2011 Board evaluation.

How we govern our business
60
AuDIT COMMITTEE REPORT CONTINuED
A particular focus for 2011 was a review of the systems and processes established during the year following the conclusion of the transitional services previously provided by CSC. The Committee also requested that a business unit review of The Brewery be undertaken. The work conducted by BDO since their appointment has included reviews of corporation tax compliance, VAT compliance, PAyE & NI, expenses, capital expenditure, health & safety, IT projects, the Bribery Act 2010, a business unit review of The Brewery, accounts payable and insurance.
(c) non-audit servicesThe Company has adopted a policy to ensure that the provision of non-audit services by the external auditors does not compromise its independence or objectivity. The term “non-audit services” does not include reference to any advice on tax. under the policy, Executive Directors may commission non-audit work with a cost not exceeding the lower of £50,000 or 15 per cent of the estimated annual level of the auditors’ fees at that time. Costs exceeding this limit must be approved in advance by the Audit Committee Chairman. In addition, the Executive Directors must give consideration to the preservation of auditor independence; and the external auditors are required to confirm that they are acting independently and must not audit their own work; make management decisions for the Company; create a mutuality of interest; develop close personal relationships with the Company’s personnel; or find themselves in the role of advocate for the Company.
The total fees paid and payable to PwC in 2011 were £370,000 of which £54,000 related to non-audit work. These fees primarily relate to corporate finance advisory services. The Committee is satisfied that the external auditors remain independent and objective.
(d) internal control and risk managementThe Board has overall responsibility for the Group’s risk management framework and system of internal control and the ongoing review of their effectiveness. A summary of the risk management framework is set out on page 14. The framework is designed to manage rather than eliminate risk, and can only provide reasonable, and not absolute, assurance against material misstatement or loss. The Audit Committee monitors and
reviews the Group’s internal controls and risk, and reports to the Board on its work and conclusions.
Ongoing processes for identifying, evaluating and managing the significant risks faced by the Group were in place throughout the year. These controls accord with the Turnbull guidance “Internal Control – Guidance for Directors on the Combined Code” and remained in place up to the date of the approval of this Annual Report. The procedures are reviewed by the Board on an annual basis.
The key elements of the Group’s day-to-day procedures and internal control framework are:
– Formal schedule of matters reserved for the Board
– Formal delegated authority limits
– Formal documentation of significant transactions
– The Executive Directors are closely involved in the day-to-day operations of the business and hold regular meetings with senior management to review all aspects of the business
– The Board received regular updates on strategy and project developments at the formal Board meetings and Directors’ updates
– A formal whistleblowing procedure is in place under which staff may raise matters of concern (no calls were received during the year).
Specific controls relating to financial reporting and consolidation processes include:
– Management structure with clear lines of responsibility and accountability, staffed by appropriate personnel
– A comprehensive system of budgeting and review. The Board and Audit Committee receive regular reports from the Finance Director which include forecasts and performance against budget and financial covenants
– The internal audit programme undertaken by BDO LLP. The Committee is satisfied that the internal audit services provided by BDO were independent and effective.
– Group Finance participates in the control self-assessment and policy compliance elements of the risk management framework and sets formal requirements
with business unit finance functions which specify the reports and approvals required. Group Internal Audit regularly reviews the effectiveness of internal controls and reports its findings to the Audit Committee.
An annual risk management review is undertaken to identify risks and review the effectiveness of mitigating controls. Reports on risks and controls are obtained from across the Group and used by a committee headed by the Finance Director to compile a Group risk register. The report is received by the Audit Committee, and the Committee Chairman makes a report to the Board.
The risk register is reviewed twice a year and upon any material change to the business. Any risks identified between these reviews will be logged. The Group’s principal risks and uncertainties are set out on pages 14 to 17.
(e) bribery act 2010In advance of the implementation of the Bribery Act 2010 on 1 July 2011, the Company undertook a review of its existing policies and potential risk areas. A new anti-corruption and bribery policy was adopted and issued to staff, and training was given to relevant employees. The anti-corruption and bribery policy can be viewed on the Company’s website www.capitalandcounties.com. The implementation of the new provisions was overseen by the Audit Committee, and two reviews of the arrangements were conducted by BDO with satisfactory outcomes.
Henry StauntonChairman of the Audit Committee
29 February 2012

61 www.capitalandcounties.com
ou
r busin
ess perform
an
ce
Ho
w w
e go
vern o
ur bu
siness
ou
r fina
nc
ial statem
ents
un
dersta
nd
ing
ou
r busin
ess
DIRECTORS’ REMuNERATION REPORT
This remuneration report has been prepared in line with the requirements of the Companies Act 2006, Schedule 8 of the Large and Medium sized Companies and Groups (Accounts and Reports) Regulations 2008 and the FSA Listing Rules. The audited information is set out in Tables a) to d) on pages 66 to 68. This report has been approved by the Board of Directors for submission to shareholders for their approval at the AGM.
1. remuneratiOn cOmmitteeThe Remuneration Committee (the ‘Committee’) is responsible for determining and recommending to the Board the policy for Executive remuneration, setting targets for the Company’s incentive schemes and determining the total individual remuneration package for each Executive Director. The full duties and responsibilities of the Committee are set out in the terms of reference of the Committee which can be viewed on the Company’s website: www.capitalandcounties.com
The members of the Committee at 31 December 2011 and at the date of this report were all independent Non-executive Directors. The Committee members are Ian Henderson (Committee Chairman), Andrew Huntley, Henry Staunton and Andrew Strang. In addition, the Company Chairman and Chief Executive are invited to attend Committee meetings and contribute except on matters relating to their own remuneration, and the Director of HR & CR also attends Committee meetings. Details of meeting attendance and a summary of the matters discussed during the year are contained in the Corporate Governance report on pages 52 to 58.
The Committee has appointed Kepler Associates as its independent remuneration adviser and has received advice on matters including remuneration structure, incentive design and target setting. Kepler provides no other services to the Company.
Ian Henderson, Chairman of the Remuneration Committee
We aim to align executive remuneration with value created for shareholders. In 2011, Capco delivered a total return to shareholders of 23.6%, some 81.6% since launch.
The graph above shows the Total Shareholder Return at 31 December 2011 of £100 invested in Capital & Counties Properties PLC at the start of the first day of trading in its shares following its demerger from Liberty International PLC (10 May 2010), compared to the FTSE 350 Real Estate Index. The Committee considers this benchmark to be the most appropriate for illustrating the Company’s performance.
75
100
125
150
175
200
10 May 2010 31 December 2010 31 December 2011
Capco FTSE 350 Real Estate Index

How we govern our business
62
2. remuneratiOn pOlicyThe key objectives of the Company’s Remuneration Policy are to:
– Strongly align executive remuneration with shareholders’ interests including the encouragement of Executives to acquire a meaningful holding of Capco shares
– underpin a pay-for-performance culture
– Support the retention, motivation and recruitment of talented people who are commercially astute and creative
Accordingly, the Committee aims to achieve an appropriate balance between fixed and variable remuneration, and between remuneration based on short-term and long-term performance. Fixed remuneration includes base salary, benefits and pension. Variable remuneration includes an annual bonus, a proportion of which is deferred in shares which may be matched subject to long-term performance (via the Matching Share Plan (MSP)), and annual awards under a Performance Share Plan (PSP) which rewards long-term performance.
DIRECTORS’ REMuNERATION REPORT CONTINuED
* Includes deferred bonus.
Note: elements of variable pay have been valued based on a target/median level of performance under the annual bonus/long-term incentive arrangements.
* Includes deferred bonus
Note: elements of variable pay have been valued on the basis of maximum payout under the annual bonus/long-term incentive arrangements.
Target Stretch
PSP
MSP
Fixed
Annual bonus*
Illustration of variation in Executive Director pay under di erent performance scenarios:
PSP
MSP
Fixed
Annual bonus*
The Remuneration Policy is aligned to the strategy and nature of the Company, and reflects the importance of total return and the long-term nature of Capco’s business.
Since listing in May 2010 Capco has established itself through the delivery of consistently strong levels of performance for its shareholders. Two years on, the Remuneration Committee believes it is timely to carry out a review of the Remuneration Policy and remuneration arrangements to ensure they continue to be appropriately aligned with the strategy and shareholders’ interests.
The Committee has considered whether any aspects of the Remuneration Policy could inadvertently encourage Executives to take inappropriate risks, and has concluded that the policy remains appropriate in this regard. The charts below highlight the relatively strong emphasis on variable pay within each Executive Director’s remuneration.
3. elements Of executive directOr remuneratiOnDetails of Executive Directors’ 2011 emoluments and their interests in each incentive plan are provided in tables a) to d) on pages 66 to 68. A description of each key element of the remuneration package is provided below.
(1) base salary and benefitsThe Committee reviews Executive Directors’ base salaries with reference to other property companies (including the constituents of the long-term incentive plans’ comparator group), companies of a similar size, and each Executive’s performance and contribution during the year. The Committee’s policy is to place appropriate emphasis on the performance-related elements of remuneration, while ensuring base salary remains appropriately competitive. Executive Director salary levels will be considered as part of the overall review of remuneration. When setting Executive Director pay, the Committee also considers the remuneration and overall conditions of all employees.
The Company provides Executive Directors with benefits which include private healthcare, life insurance and a cash car allowance.

63 www.capitalandcounties.com
ou
r busin
ess perform
an
ce
Ho
w w
e go
vern o
ur bu
siness
ou
r fina
nc
ial statem
ents
un
dersta
nd
ing
ou
r busin
ess
(2) pensionThe Company operates a defined contribution pension scheme with a Company contribution of 24 per cent of base salary for Executive Directors. The Executive Directors may elect to be paid some or all of this entitlement in cash.
(3) annual bonusExecutive Directors may earn bonuses depending on the Company’s financial performance (50 per cent) and their own individual performance (50 per cent), as illustrated above.
The financial performance element for the year ended 31 December 2011 was based on absolute NAV growth per share, Total Property Return relative to the IPD Total Return All Property Index and adjusted EPS. The Committee has decided that these measures remain appropriate for 2012. In determining the annual targets for these measures in 2011, the Committee recognised the medium-term nature of the Company’s strategy, particularly with regard to its land holdings at Earls Court, and the extent to which this would be reflected in these measures on a 12-month horizon. In respect of the year ended 31 December 2011, the Committee noted the Company’s strong performance against each of the targets, and accordingly the maximum awards were made in respect of the financial performance element.
The individual performance element for the year ended 31 December 2011 was based on the achievement of various corporate objectives. The individual targets for the Executive Directors encompassed all relevant aspects of the business including specific business objectives relating to Capco’s assets, financial goals and CR matters. The Executive Directors
summary of executive director bonuses 2011
executive director cashdeferred
shares total
Ian Hawksworth 337,500 337,500 675,000
Soumen Das 225,000 225,000 450,000
Gary yardley 300,000 300,000 600,000
were each considered to have delivered a very strong performance, particularly the establishment of the conditional Joint Venture in respect of Seagrave Road, the £100m share placing to fund the acquisition of new properties in Covent Garden, the £300m refinancing of the Covent Garden portfolio and the submission of planning applications for the Earls Court and West Kensington Opportunity Area and Seagrave Road. Accordingly the maximum award was made in respect of the individual performance element.
The maximum bonus opportunity for Executive Directors is 150 per cent of annual salary with a bonus of 75 per cent of salary payable for achieving target levels of performance. 50 per cent of any bonus earned is payable in cash and 50 per cent is deferred in Capco shares for three years, under the Matching Share Plan (MSP), subject to risk of forfeiture should an Executive leave the Company.
(4) matching share plan (msp)There is an opportunity for Executives to earn up to one matching share for each deferred share awarded under the arrangements above, based on performance over three years. Details of the performance conditions are provided in the long-term incentive performance conditions section below. For 2010 (the inception year of Capco), Executives were invited to invest up to 150 per cent of
salary in the Company’s shares during the first 12 months of inception in return for the opportunity to receive up to two shares for each share purchased, subject to three year performance. At the discretion of the Committee the initial investment period could be extended to 24 months. Due to the extended restricted periods to which the Company was subject this discretion was exercised during the year. The initial higher matching level is intended to help ‘kick-start’ the plan by ensuring Executives are highly motivated to drive the long-term performance of Capco. Ian Hawksworth and Gary yardley have now reached the maximum investment under these arrangements.
(5) performance share plan (psp)Executives are eligible to receive awards under the PSP at the discretion of the Committee. Each year participants may be granted market value share options of up to 300 per cent of salary or up to 150 per cent of salary in shares or nil-cost options which vest subject to three year performance. Details of the performance conditions are provided in the next section. In exceptional circumstances the Committee can make awards of market value share options of up to 400 per cent of salary or up to 200 per cent of salary in nil-cost options. In 2011 the Committee made awards of 150 per cent of salary in nil-cost options to Executive Directors.
annual bOnus financial perfOrmance individual perfOrmance
summary Of annual bOnus structure
up to 50% of maximum up to 50% of maximum

How we govern our business
64
DIRECTORS’ REMuNERATION REPORT CONTINuED
The Committee is exploring ways of structuring future awards under the long-term incentive arrangements in a potentially more tax efficient manner for participants. The Committee will ensure that any changes are cost neutral to Capco.
4. lOng-term incentive perfOrmance cOnditiOnsThe performance conditions are the same for both the MSP and PSP and comprise two measures:
Three-year relative Total Return (TR, growth in Net Asset Value per share plus dividends) and three-year relative Total Shareholder Return (TSR, increase in price of an ordinary share plus dividends). Awards are weighted equally, i.e. 50 per cent on performance against each of these measures. For 2010 and 2011 awards, the performance conditions are illustrated below. Performance is measured
relative to a comparator group which comprises the eight largest FTSE 350 property companies, also listed below.
tr and tsr comparator group
Great Portland Estates British Land
Shaftesbury Hammerson
Derwent London Land Securities
CSC Segro
The Committee believes long-term relative performance provides an appropriately objective and relevant measure of Capco’s success which is strongly aligned with shareholders’ interests.
The Committee will review the continued appropriateness of the comparator companies and performance target calibration at the beginning of each performance cycle and intends to use the same comparator group and targets for 2012 awards.
The vesting schedules for each of the TSR and TR performance conditions are illustrated below.
In order for any awards to vest, the Committee must satisfy itself that the TR and TSR figures are a genuine reflection of underlying financial performance. In assessing the extent to which the performance conditions have been met, the Committee will consult with its independent remuneration adviser. The calculation of the returns will be reviewed by the Company’s auditors as appropriate.
5. directOrs’ sHareHOldingsThe beneficial interests in the shares of the Company for each Director who served during the period are set out in note 41 on page 113.
The Executive Directors are required to achieve a shareholding in the Company equivalent to 150 per cent of base salary within three years of the demerger, other than
50% is based on relative Total Return 50% is based on relative Total Shareholder Return
Median
100%
33%
Median +4% p.a.
% v
estin
g
3-year TSR outperformance
Median
100%
33%
Median +2.5% p.a.
% v
estin
g
3-year TR outperformance
Median
100%
33%
Median +4% p.a.
% v
estin
g
3-year TSR outperformance
Median
100%
33%
Median +2.5% p.a.
% v
estin
g
3-year TR outperformance
summary of executive directors’ interests in shares and share schemes
executive director shares helddeferred nil cost
share options1
share options awarded
under psp2
matching share plan nil
cost options2
matching share awards2 total
Ian Hawksworth 479,069 205,535 2,170,390 594,431 564,826 4,014,251
Soumen Das 136,346 137,023 1,450,096 199,715 210,000 2,133,180
Gary yardley 427,972 182,698 1,930,272 558,322 477,158 3,576,422
Total 1,043,387 525,256 5,550,758 1,352,468 1,251,984 9,723,853
1 Subject to three year holding period.
2 Subject to performance conditions.
The Executive Directors have interests in a total of 9,723,853 shares.

65 www.capitalandcounties.com
ou
r busin
ess perform
an
ce
Ho
w w
e go
vern o
ur bu
siness
ou
r fina
nc
ial statem
ents
un
dersta
nd
ing
ou
r busin
ess
Soumen Das who is required to achieve a holding equivalent to 100 per cent. Ian Hawksworth and Gary yardley have each met the shareholding requirement. The current individual shareholdings are illustrated in the chart below.
non-executive directors’ annual fees as at 31 december 2011:
basic feecommittee
fees Other total
G.J. Gordon 40,000 – – 40,000
I.J. Henderson 40,000 20,000 10,000 70,000
A.J.M. Huntley 40,000 10,000 – 50,000
H.E. Staunton 40,000 15,247 – 55,247
A.D. Strang 40,000 15,000 – 55,000
Former director:
D.A. Fischel* 6,667 – – 6,667
non-executive directors’ dates of appointment and unexpired terms:
date of appointment
date of letter of
appointmentunexpired
term
G.J. Gordon 23 Feb 2010 9 June 2011 3 months
I.J. Henderson 23 Feb 2010 9 June 2011 3 months
A.J.M. Huntley 23 Feb 2010 9 June 2011 3 months
H.E. Staunton 2 June 2010 7 June 2010 15 months
A.D. Strang 23 Feb 2010 9 June 2011 3 months
Former director:
D.A. Fischel* 23 Feb 2010 8 March 2010 –
* Resigned 4 February 2011. Fee was pro-rated for length of service.
6. executive directOrs’ service cOntracts and terminatiOn prOvisiOnsThe service contracts of Executive Directors are approved by the Remuneration Committee and are one-year rolling contracts. The current contracts commenced on 17 May 2010. The service contract may be terminated by either party giving one year’s notice to the other. It is the Company’s policy that termination payments should not exceed the Director’s current salary and benefits for the notice period. Any annual bonus payment in respect of the year of termination is subject to the discretion of the Committee. MSP and PSP vesting is also at the discretion of the Committee and accordingly any awards will normally lapse unless the individual is considered a ‘good leaver’. In the case of a good leaver, payments are pro-rated for time and
(% of salary)
IanHawksworth
GaryYardley
SoumenDas
0
50
100
150
200
250
300
Actual holding as a % of base salary.Deferred bonus share awards.Shareholding guideline.
Executive Director shareholdings as at 31 December 2011
remain subject to outstanding performance conditions. In the event of a change of control of the Company, MSP and PSP awards will generally vest. Except in certain cases which were set out in full in the Company’s prospectus dated 12 March 2010, vesting will be pro-rated for time and remain subject to performance conditions, however the Committee has discretion to allow awards to vest in full in such circumstances if it deems this to be fair and reasonable.
summary of executive directors’ service contracts
datenotice period
Ian Hawksworth 17 May 2010 12 months
Soumen Das 17 May 2010 12 months
Gary yardley 17 May 2010 12 months

How we govern our business
66
DIRECTORS’ REMuNERATION REPORT CONTINuED
7. cHairman and nOn-executive directOr service cOntracts and remuneratiOnThe Chairman has been appointed for an initial term which will expire at the 2013 AGM. The Chairman’s annual base fee was £200,000 together with an annual car allowance of £18,000, although this has been varied such that a proportion is paid into a SIPP arrangement. During the first three years of acting as Chairman he will also receive a supplement of 15 per cent of his base fee in lieu of any pension contributions. Also, the Company made a matching award of deferred shares comprising 200 per cent of the number of invested shares in respect of each Capco share he purchased within the first 12 months of inception of Capco (up to 150 per cent of his base fee.) This represented a 1:1 match, grossed up on the basis of an income tax rate of 50 per cent. The
(a) directors’ emoluments
name
salary and service
contract remuneration
£
benefits in kind
£
annual bonus
£Other*
£
directors’ fees
£
aggregate emoluments
2011 £
aggregate emoluments
2010 £
2011pension
contributions£
Chairman
Ian Durant1 – 2,235 – 64,533 183,467 250,235 152,369 –
Executive Directors
Ian Hawksworth 2 450,000 2,235 337,500 99,000 – 888,735 756,619 27,000
Soumen Das 2 300,000 2,235 225,000 77,500 – 604,735 457,981 12,500
Gary yardley 2 400,000 2,235 300,000 90,000 – 792,235 677,109 24,000
Non-executive Directors
Ian Henderson – – – – 70,000 70,000 45,320 –
Graeme Gordon – – – – 40,000 40,000 25,897 –
Andrew Huntley – – – – 50,000 50,000 32,372 –
Henry Staunton – – – – 55,247 55,247 28,179 –
Andrew Strang – – – – 55,000 55,000 35,609 –
Former Director:
David Fischel – – – – 6,667 6,667 29,135 –
Total 1,150,000 8,940 862,500 331,033 460,381 2,812,854 2,240,590 63,500
* ‘Other’ comprises cash payments made in lieu of pension contributions, contributions to SIPP arrangements and car allowances.
1 The terms of the Chairman’s remuneration were varied during the year such that a proportion was paid into a SIPP arrangement and a cash payment was made in lieu of pension contributions. These amounts are included in ‘Other’ above.
2 As permitted by their service contracts, the Executive Directors have elected to receive a cash payment in lieu of pension contributions. A proportion of these payments has been paid into SIPP arrangements. These amounts are included in ‘Other’ above and ‘2011 Pension Contributions’ have been reduced accordingly.
The benefits in kind provided to the Chairman and Executive Directors comprise medical insurance.
8. external nOn-executive directOrsHipsThe Company’s policy is to allow Executive Directors to retain fees received for serving as a Non-executive Director of a company outside the Capco Group. During the period Ian Hawksworth received a fee of £24,167 in respect of his Non-executive Directorship of AIM-listed Japan Residential Investment Company Limited. No other Executive Director currently serves as a Non-executive Director elsewhere.
Signed on behalf of the Board
Ian HendersonChairman of the Remuneration Committee
29 February 2012
Chairman’s award carries no performance conditions and will vest on the third anniversary of inception of Capco, subject to him continuing in office.
The remuneration of the Non-executive Directors is determined by the Board as a whole, with regard to market comparatives. The basic annual fee for Non-executives is £40,000 with an additional £5,000 for membership of a committee and an additional £10,000 for chairing a committee and for the Senior Independent Director role. The fees were last reviewed early in 2012, and no changes were made.
The Non-executive Directors do not receive any pension, bonus or long-term incentive benefits from the Company. The letters of appointment of the Non-executive Directors have no notice period and are reviewed by the Board annually.

67 www.capitalandcounties.com
ou
r busin
ess perform
an
ce
Ho
w w
e go
vern o
ur bu
siness
ou
r fina
nc
ial statem
ents
un
dersta
nd
ing
ou
r busin
ess
(b) Outstanding awards made under performance share plan1
nameyear
grantedOption price
(pence)
Held at 1 January
2011
granted during
the year
exercised during the
year
Held at 31 december
2011exercisable
between
Ian Hawksworth 2010 103.87 1,732,935 – 1,732,935 28/05/13 – 27/05/20
Ian Hawksworth 2011 157.73 – 19,019 – 19,019 21/03/14 – 20/03/21
Ian Hawksworth 2011 NIL – 418,436 – 418,436 21/03/14 – 20/03/21
Soumen Das 2010 103.87 1,155,290 – 1,155,290 28/05/13 – 27/05/20
Soumen Das 2011 157.73 – 19,019 – 19,019 21/03/14 – 20/03/21
Soumen Das 2011 NIL – 275,787 – 275,787 21/03/14 – 20/03/21
Gary yardley 2010 103.87 1,540,387 – 1,540,387 28/05/13 – 27/05/20
Gary yardley 2011 157.73 – 19,019 – 19,019 21/03/14 – 20/03/21
Gary yardley 2011 NIL – 370,886 – 370,866 21/03/14 – 20/03/21
5,550,758
1 Subject to performance conditions that apply to awards made under the PSP and MSP, as set out on page 64.
The market price of Capital & Counties Properties PLC shares on 31 December 2011 was 184.6p and during the year the price varied between 142.8p and 203.7p.
(c) matching share plan(i) deferred sharesThe following awards of deferred nil cost options made to Executive Directors in respect of annual bonus are outstanding:
nameyear
granted
market price on date of
grant
Option price
(pence)
Held at 1 January
2011
granted during the
year
exercised during the
year
Held at december
2011exercisable
between
Ian Hawksworth 2011 £1.60 NIL – 205,535 – 205,535 18/03/14 – 17/03/21
Soumen Das 2011 £1.60 NIL – 137,023 – 137,023 18/03/14 – 17/03/21
Gary yardley 2011 £1.60 NIL – 182,698 – 182,698 18/03/14 – 17/03/21
Total 525,256
(ii) matched deferred shares1
The following awards of matching nil cost options made to Executive Directors following their award of deferred nil-cost options in respect of annual bonus are outstanding:
nameyear
granted
market price on date of
grant
Option price
(pence)
Held at 1 January
2011
granted during the
year
exercised during the
year
Held at december
2011exercisable
between
Ian Hawksworth 2011 £1.60 NIL – 205,535 – 205,535 18/03/14 – 17/03/21
Soumen Das 2011 £1.60 NIL – 137,023 – 137,023 18/03/14 – 17/03/21
Gary yardley 2011 £1.60 NIL – 182,698 – 182,698 18/03/14 – 17/03/21
525,256
1 Subject to performance conditions that apply to awards made under the PSP and MSP, as set out on page 64.

How we govern our business
68
DIRECTORS’ REMuNERATION REPORT CONTINuED
(iii) matching of directors’ investment1The following awards of matching nil cost options made to Executive Directors following their purchase of ordinary shares in the Company are outstanding:
nameyear
granted
Option price
(pence)
Held at 1 January
2011
granted during the
year
exercised during the
year
Held at december
2011exercisable
between
Ian Hawksworth 2011 NIL – 386,066 – 386,066 21/12/14 – 20/12/21
Ian Hawksworth 2011 NIL – 2,830 – 2,830 22/12/14 – 21/12/21
Soumen Das 2011 NIL – 62,692 – 62,692 03/06/14 – 04/06/21
Gary yardley 2011 NIL – 354,870 – 354,870 21/12/14 – 20/12/21
Gary yardley 2011 NIL – 18,020 – 18,020 21/12/14 – 20/12/21
Gary yardley 2011 NIL – 2,734 – 2,734 22/12/14 – 21/12/21
827,212
The following awards of matching shares made to Executive Directors following their purchase of ordinary shares in the Company are outstanding:
namedate
granted
weighted average share price of
invested sharesnumber
awardedexpected
vesting date
Ian Hawksworth 01/09/10 £1.17 564,826 10/05/13 – 06/08/13
Soumen Das 01/09/10 £1.07 210,000 18/05/13 – 07/06/13
Gary yardley 01/09/10 £1.11 477,158 19/05/13 – 03/08/13
1,251,984
(d) awards made under the chairman’s matching arrangementsThe following awards of matching shares made to the Chairman are outstanding:
namedate
granted
weighted average share price of
invested sharesnumber
awardedexpected
vesting date
Ian Durant 01/09/10 £1.13 529,536 10/05/13
529,536
1 Subject to performance conditions that apply to awards made under the PSP and MSP, as set out on page 64.

69 www.capitalandcounties.com
ou
r busin
ess perform
an
ce
Ho
w w
e go
vern o
ur bu
siness
ou
r fina
nc
ial statem
ents
un
dersta
nd
ing
ou
r busin
ess
DIRECTORS’ REPORT
The Directors present their Annual Report, and the audited financial statements for the year ended 31 December 2011.
principal business activities The Group manages and develops a portfolio of property investments concentrated in West London and the West End.
business reviewInformation fulfilling the requirements of the Business Review is contained within the following sections of the Annual Report:
– the Chairman’s statement on pages 8 and 9;
– the Chief Executive’s review on pages 10 to 11;
– Our business model and strategy on page 12;
– Key performance indicators on page 13;
– Principal risks and uncertainties on pages 14 to 17;
– the Operating Review on pages 18 to 37;
– the Financial Review on pages 38 to 43;
– the Corporate Responsibility review on pages 44 to 49.
directOrsThe Directors of the Company who held office during the year were as follows:
chairman:I.C. Durant
executive directors:I.D. Hawksworth S. Das G.J. yardley
non-executive directors:I.J. Henderson G.J. Gordon A.J.M. Huntley H.E. Staunton A.D. Strang D.A. Fischel (resigned 4 February 2011)
G.R. Fine acted as G.J. Gordon’s permanent alternate between 1 January 2011 and 27 September 2011 when the role was discontinued.
Biographies of each Director can be found on pages 50 and 51 and details of each Director’s interests in the Company’s shares are set out on page 113.
The powers of the Directors are determined by uK legislation and the Company’s Articles of Association together with any specific authorities that shareholders may approve from time to time.
The rules governing the appointment and replacement of Directors are contained in the Company’s Articles and uK legislation. In compliance with the uK Corporate Governance Code, at the 2012 Annual General Meeting all the Directors will retire from office and will offer themselves for re-election.
cOmpensatiOn fOr lOss Of OfficeThe Company does not have any agreements with any Executive Director or employee that would provide compensation for loss of office or employment resulting from a takeover except that provisions of the Company share schemes may cause options and awards to vest on a takeover. The terms of appointment of the Non-executive Directors provide for a payment equal to their basic annual fee in the event of change of control in recognition of the additional time involved in such an event.
directOrs’ cOnflicts Of interestThe Company has procedures in place for managing conflicts of interests. Should a Director become aware that they, or a connected party, have an interest in an existing or proposed transaction with the Group, they should notify the Company Secretary before the next meeting or at the meeting. Directors have a continuing obligation to update any changes to these conflicts.
directOrs’ indemnities and insuranceIn accordance with the Company’s Articles, the Company has indemnified the Directors to the full extent allowed by law. The Company maintains Directors’ and Officers’ liability insurance which is reviewed annually.
articles Of assOciatiOnChanges to the Articles of Association must be approved by shareholders in accordance with the Companies Act 2006.
dividendsThe Directors have proposed the following dividends:
Interim Dividend paid on 20 September 2011
0.5 p per ordinary share
Proposed Final Dividend to be paid on 21 June 2012
1.0 p per ordinary share
Total dividend for 2011
1.5 p per ordinary share
The proposed final dividend will be paid on 21 June 2012 to shareholders whose names are on the register at 18 May 2012.
capital structureDetails of the Company’s issued ordinary share capital, including details of movements in the issued share capital during the year and authorities to issue or repurchase shares, are shown in note 31 to the financial statements on page 104. Each share carries the right to one vote at general meetings of the Company.
There are no specific restrictions on the transfer of shares beyond those standard provisions set out in the Articles of Association. No shareholder holds shares carrying special rights with regard to control of the Company. Details of significant shareholdings are shown on page 70.
cHange Of cOntrOl prOvisiOnsThere are a number of agreements which take effect, alter or terminate upon a change of control of the Company. The only agreement considered significant is the £300m Covent Garden debt facility which would terminate following a change of control.
substantial sHareHOldingsThe significant holdings of voting rights in the share capital of the Company notified and disclosed in accordance with Disclosure and Transparency Rule 5, as at 28 February 2012, are shown on page 70.
emplOyeesThe Group employees are employed by C&C Management Services Limited, Earls Court & Olympia Limited, Olympia Limited and Tuttons Brasserie Limited. The Group’s employees are kept informed of its activities and financial performance through head office briefings at key points during the year and the circulation of corporate announcements and other relevant information to staff.
Certain of the Group’s employees are eligible to participate in discretionary annual bonus arrangements. These arrangements, which may include awards under the Group’s Performance Share Plan, help to develop employees’ interest in the Company’s performance. Full details of the Performance Share Plan are contained in note 38 to the accounts on pages 107 to 110.

How we govern our business
70
DIRECTORS’ REPORT CONTINuED
substantial shareholdings
shares held at time of last notification
percent held at time of last notification
nature of holding
date of last notification
BlackRock, Inc. 129,375,413 18.92% Indirect interest 05-Dec-2011
Gordon Family Interests 92,143,203 13.47% Direct interest 17-May-2011
Coronation Asset Management (pty) Limited 54,710,390 7.99% Direct interest 21-Feb-2012
Norges Bank 34,237,648 5.01% Direct interest 23-Sept-2011
Legal & General Investment Management Limited 24,034,330 3.51% Direct Interest 12-May-2010
The Company operates a non-discriminatory employment policy and full and fair consideration is given to applications for employment from disabled applicants where they have the appropriate skills and abilities, and to the continued employment of staff who become disabled.
The Company encourages the continuous development and training of its employees and the provision of equal opportunities for the training and career development of disabled employees.
Information relating to employees is given in note 8 on page 85. The Group provides retirement benefits for the majority of its employees. Details of the Group pension arrangements are set out in note 39 on pages 110 to 112.
tHe envirOnmentDetails of the Group’s Corporate Responsibility policy and its aims and activities are described on the Company’s website www.capitalandcounties.com. An overview of the Group’s Corporate Responsibility activity is set out on pages 44 to 49.
The Group recognises the importance of minimising the adverse impact of its operations on the environment and the management of energy consumption and waste recycling.
The Company strives continuously to improve its environmental performance. The environmental management system is regularly reviewed to ensure that the company maintains its commitment to environmental matters.
During the year the Group made charitable donations amounting to £118,217 (2010: £119,495). Further information on charitable donations can be found in the Corporate Responsibility report on page 48. There were no political donations made during the year.
creditOr payment pOlicyThe Group’s policy and practice is to pay creditors in accordance with agreed terms of business.
The ratio, expressed in days, between the amounts invoiced to the Company by its suppliers in the year ended 31 December 2011 and the amounts owed to its creditors as at 31 December 2011 was nil days (2010: nil).
Overseas brancH registerFor the purposes of its listing on the JSE, the Company maintains an overseas branch register in South Africa.
gOing cOncernEconomic conditions remain challenging, however the Group has a prudent balance sheet and sufficient cash reserves to meet both its ongoing and future commitments. The Group negotiated a new £300m debt facility to refinance its 2013 Covent Garden loan and has significant headroom against its financial covenants, as disclosed on page 118.
Having made due enquiries, the Directors have a reasonable expectation that the Company and the Group have adequate resources to continue in operational existence for the foreseeable future.
Accordingly they continue to adopt the going concern basis in preparing the annual report and accounts.
disclOsure tO auditOrsSo far as the Directors are aware, there is no relevant audit information of which the auditors are unaware and each Director has taken all reasonable steps to make himself aware of any relevant audit information and to establish that the auditors are aware of that information.
independent auditOrsThe auditors, PricewaterhouseCoopers LLP, have indicated their willingness to continue in office and a resolution seeking to reappoint them will be proposed at the forthcoming Annual General Meeting.
annual general meetingThe 2012 Annual General Meeting of the Company will be held from 11 am on 20 April 2012 . The Notice of the Meeting, together with an explanation of the business to be dealt with at the Meeting, is included as a separate document sent to shareholders who have elected to receive hard copies of Shareholder information and is also available on the Company’s website.
By Order of the Board
Ruth PaveyCompany Secretary
29 February 2012

71 www.capitalandcounties.com
ou
r busin
ess perform
an
ce
Ho
w w
e go
vern o
ur bu
siness
ou
r fina
nc
ial statem
ents
un
dersta
nd
ing
ou
r busin
ess
DIRECTORS’ RESPONSIBILITIES
STATEMENT OF DIRECTORS’ RESPONSIBILITIES The Directors are responsible for preparing the Annual Report, the Directors’ remuneration report and the financial statements in accordance with applicable law and regulations.
Company law requires the Directors to prepare financial statements for each financial year. Under that law the Directors have prepared the Group and Parent Company financial statements in accordance with International Financial Reporting Standards (IFRSs) as adopted by the European Union. Under company law the Directors must not approve the financial statements unless they are satisfied that they give a true and fair view of the state of affairs of the Group and the Company and of the profit or loss of the Group for that period. In preparing these financial statements, the Directors are required to:
(a) select suitable accounting policies and then apply them consistently;
(b) make judgements and accounting estimates that are reasonable and prudent;
(c) state whether applicable IFRSs as adopted by the European Union (EU) have been followed, subject to any material departures disclosed and explained in the financial statements; and
(d) prepare the financial statements on the going concern basis, unless it is inappropriate to presume that the Company will continue in business.
The Directors are responsible for keeping adequate accounting records that are sufficient to show and explain the Company’s transactions and disclose, with reasonable accuracy at any time, the financial position of the Company and the Group and enable them to ensure that the financial statements and the Directors’ remuneration report comply with the Companies Act 2006 and, as regards the Group financial statements, Article 4 of the IAS Regulation. They are also responsible for safeguarding the assets of the Company and the Group and hence for taking reasonable steps for the prevention and detection of fraud and other irregularities.
The Directors are responsible for the maintenance and integrity of the Company’s website. Legislation in the United Kingdom governing the preparation and dissemination of financial statements may differ from legislation in other jurisdictions.
Each of the Directors, whose names and functions are listed in the Governance section, confirm that, to the best of their knowledge:
(a) the Group financial statements, which have been prepared in accordance with IFRSs as adopted by the EU, give a true and fair view of the assets, liabilities, financial position and profit of the Group; and
(b) the Directors’ report contained in the Governance section of the Annual Report includes a fair review of the development and performance of the business and the position of the Group, together with a description of the principal risks and uncertainties that it faces.
Signed on behalf of the Board on 29 February 2012.
Ian Hawksworth Chief Executive
Soumen Das Finance Director

our financial statements
72
INDEPENDENT AUDITORS’ REPORT TO THE MEMBERS OF CAPITAL & COUNTIES PROPERTIES PLC
INDEPENDENT AUDITORS’ REPORT TO THE MEMBERS OF CAPITAL & COUNTIES PROPERTIES PLC (COMPANIES REGISTRATION NUMBER 7145051) We have audited the Group and Parent Company financial statements (the “financial statements”) of Capital & Counties Properties PLC for the year ended 31 December 2011 which comprise the Group and Company balance sheets, the consolidated income statement, the consolidated statement of comprehensive income, the Group and Company cash flow statements, the statement of changes in equity and the related notes. The financial reporting framework that has been applied in their preparation is applicable law and International Financial Reporting Standards (IFRSs) as adopted by the European Union and, as regards the Parent Company financial statements, as applied in accordance with the provisions of the Companies Act 2006.
RESPECTIVE RESPONSIBILITIES OF DIRECTORS AND AUDITORS As explained more fully in the Statement of Directors’ Responsibilities set out on page 71, the Directors are responsible for the preparation of the financial statements and for being satisfied that they give a true and fair view. Our responsibility is to audit and express an opinion on the financial statements in accordance with applicable law and International Standards on Auditing (UK and Ireland). Those standards require us to comply with the Auditing Practices Board’s Ethical Standards for Auditors.
This report, including the opinions, has been prepared for and only for the Company’s members as a body in accordance with Chapter 3 of Part 16 of the Companies Act 2006 and for no other purpose. We do not, in giving these opinions, accept or assume responsibility for any other purpose or to any other person to whom this report is shown or into whose hands it may come save where expressly agreed by our prior consent in writing.
SCOPE OF THE AUDIT OF THE FINANCIAL STATEMENTS An audit involves obtaining evidence about the amounts and disclosures in the financial statements sufficient to give reasonable assurance that the financial statements are free from material misstatement, whether caused by fraud or error. This includes an assessment of: whether the accounting policies are appropriate to the Group’s and the Parent Company’s circumstances and have been consistently applied and adequately disclosed; the reasonableness of significant accounting estimates made by the Directors; and the overall presentation of the financial statements. In addition, we read all the financial and non-financial information in the Annual Report & Accounts 2011 to identify material inconsistencies with the audited financial statements. If we become aware of any apparent material misstatements or inconsistencies we consider the implications for our report.
OPINION ON FINANCIAL STATEMENTS In our opinion:
– the financial statements give a true and fair view of the state of the Group’s and of the Parent Company’s affairs as at 31 December 2011 and of the Group’s profit and Group’s and Parent Company’s cash flows for the year then ended;
– the Group financial statements have been properly prepared in accordance with IFRSs as adopted by the European Union;
– the Parent Company financial statements have been properly prepared in accordance with IFRSs as adopted by the European Union and as applied in accordance with the provisions of the Companies Act 2006; and
– the financial statements have been prepared in accordance with the requirements of the Companies Act 2006 and, as regards the Group financial statements, Article 4 of the IAS Regulation.
OPINION ON OTHER MATTERS PRESCRIBED BY THE COMPANIES ACT 2006 In our opinion:
– the part of the Directors’ Remuneration Report to be audited has been properly prepared in accordance with the Companies Act 2006;
– the information given in the Directors’ Report for the financial year for which the financial statements are prepared is consistent with the financial statements; and
– the information given in the Corporate Governance Statement set out on pages 52 to 58 with respect to internal control and risk management systems and about share capital structures is consistent with the financial statements.
MATTERS ON WHICH WE ARE REQUIRED TO REPORT BY EXCEPTION We have nothing to report in respect of the following:
Under the Companies Act 2006 we are required to report to you if, in our opinion:
– adequate accounting records have not been kept by the Parent Company, or returns adequate for our audit have not been received from branches not visited by us; or
– the Parent Company financial statements and the part of the Directors’ Remuneration Report to be audited are not in agreement with the accounting records and returns; or
– certain disclosures of Directors’ remuneration specified by law are not made; or
– we have not received all the information and explanations we require for our audit; or
– a corporate governance statement has not been prepared by the Parent Company.
Under the Listing Rules we are required to review:
– the Directors’ statement, set out on page 70, in relation to going concern;
– the parts of the Corporate Governance Statement relating to the Company’s compliance with the nine provisions of the UK Corporate Governance Code specified for our review; and
– certain elements of the report to shareholders by the Board on Directors’ remuneration.
Mark Pugh (Senior Statutory Auditor) for and on behalf of PricewaterhouseCoopers LLP Chartered Accountants and Statutory Auditors London 29 February 2012
Notes:
(a) The maintenance and integrity of the Capital & Counties Properties PLC website is the responsibility of the Directors; the work carried out by the auditors does not involve consideration of these matters and, accordingly, the auditors accept no responsibility for any changes that may have occurred to the financial statements since they were initially presented on the website.
(b) Legislation in the United Kingdom governing the preparation and dissemination of financial statements may differ from legislation in other jurisdiction

73 www.capitalandcounties.com
ou
r busin
ess perform
an
ce
Ho
w w
e go
vern o
ur bu
siness
ou
r fina
nc
ial statem
ents
un
dersta
nd
ing
ou
r busin
ess
CONSOLIDATED INCOME STATEMENT FOR THE YEAR ENDED 31 DECEMBER 2011
Notes 2011
£m2010
£m
Revenue 2 108.4 113.7
Rental income 108.4 113.6
Rental expenses (39.4) (44.6)
Net rental income 2 69.0 69.0
Other income 3 0.8 0.1
Gain on revaluation and sale of investment and development property 4 123.3 134.6
Profit on sale of available for sale investments 5 30.5 –
Remeasurement of deferred consideration 30 (4.2) 0.7
Write down of trading property (0.1) (0.1)
Impairment of other receivables 6 – (1.6)
219.3 202.7
Administration expenses
Ongoing expenses (22.2) (18.6)
Demerger costs 7 – (5.3)
Operating profit 197.1 178.8
Finance costs 10 (36.5) (40.3)
Finance income 1.7 1.4
Other finance costs 10 (14.5) (7.1)
Change in fair value of derivative financial instruments 14.1 (0.3)
Net finance costs (35.2) (46.3)
Profit before tax 161.9 132.5
Current tax (2.5) (1.2)
Deferred tax (5.7) 0.4
REIT entry charge – (0.1)
Taxation 11 (8.2) (0.9)
Profit for the year 153.7 131.6
Earnings per share from continuing operations
Basic earnings per share 14 23.2p 21.2p
Diluted earnings per share 14 23.3p 21.2p
Weighted average number of shares 14 661.8m 621.9m
Adjusted earnings per share are shown in note 14.
Notes on pages 78 to 113 form part of these consolidated financial statements.

our financial statements
74
CONSOLIDATED STATEMENT OF COMPREHENSIVE INCOME FOR THE YEAR ENDED 31 DECEMBER 2011
Notes 2011
£m 2010
£m
Profit for the year 153.7 131.6
Other comprehensive income
Actuarial (losses)/gains on defined benefit pension schemes 39 (1.4) 1.4
Fair value gains on available for sale investments and other movements 6.3 21.5
Tax on items taken directly to equity 29 0.9 (0.4)
Other comprehensive income for the year 5.8 22.5
Total comprehensive income for the year 159.5 154.1
Notes on pages 78 to 113 form part of these consolidated financial statements.

75 www.capitalandcounties.com
ou
r busin
ess perform
an
ce
Ho
w w
e go
vern o
ur bu
siness
ou
r fina
nc
ial statem
ents
un
dersta
nd
ing
ou
r busin
ess
BALANCE SHEETS AS AT 31 DECEMBER 2011
Notes
Group2011
£m
Group 2010
£m
Company2011
£m
Company2010
£m
Non-current assets
Investment and development property 15 1,616.8 1,377.6 – –
Plant and equipment 16 1.2 1.0 – –
Investment in Group companies 17 – – 446.5 446.6
Available for sale investments 19 19.5 66.3 – –
Derivative financial instruments 23 0.4 – – –
Pension asset 39 1.0 – – –
Trade and other receivables 20 34.2 12.4 – 1.1
1,673.1 1,457.3 446.5 447.7
Current assets
Trading property 21 0.2 0.3 – –
Derivative financial instruments 23 0.6 – – –
Trade and other receivables 20 26.7 26.8 369.1 277.7
Cash and cash equivalents 22 89.6 188.5 – –
117.1 215.6 369.1 277.7
Total assets 1,790.2 1,672.9 815.6 725.4
Non-current liabilities
Borrowings, including finance leases 25 (534.6) (651.5) – –
Derivative financial instruments 23 (36.9) (53.9) – –
Pension deficit 39 – (2.0) – –
Deferred tax provision 29 (4.8) – – –
Other provisions 30 – (3.3) – –
(576.3) (710.7) – –
Current liabilities
Borrowings, including finance leases 25 (18.7) (13.1) – –
Derivative financial instruments 23 (0.5) – – –
Other provisions 30 (7.3) – – –
Trade and other payables 24 (82.4) (65.0) (0.4) (1.7)
Tax liabilities (1.9) (0.7) – –
(110.8) (78.8) (0.4) (1.7)
Total liabilities (687.1) (789.5) (0.4) (1.7)
Net assets 1,103.1 883.4 815.2 723.7
Equity
Share capital 31 170.9 155.4 170.9 155.4
Other components of equity 932.2 728.0 644.3 568.3
Capital and reserves 1,103.1 883.4 815.2 723.7
Notes on pages 78 to 113 form part of these consolidated financial statements.
These consolidated financial statements have been approved for issue by the Board of Directors on 29 February 2012.
Ian Hawksworth Chief Executive
Soumen Das Finance Director

our financial statements
76
STATEMENT OF CHANGES IN EQUITY FOR THE YEAR ENDED 31 DECEMBER 2011
2011
Notes
Sharecapital
£m
Share premium
£m
Merger reserve
£m
Revaluation reserve
£m
Other reserves
£m
Retained earnings
£m
Total equity
£m
Balance at 1 January 2011 155.4 89.1 141.4 33.0 0.5 464.0 883.4
Profit for the year – – – – – 153.7 153.7
Other comprehensive income:
Fair value gains on available for sale investments – – – 6.3 – – 6.3
Actuarial losses on defined benefit
pension schemes 39 – – – – – (1.4) (1.4)
Tax on items taken directly to equity 29 – – – – – 0.9 0.9
Total comprehensive income for the year ended 31 December 2011 – – – 6.3 – 153.2 159.5
Transactions with owners
Ordinary shares issued 15.5 6.0 75.1 – – – 96.6
Merger reserve realised1 – – (20.3) – – 20.3 –
Realise revaluation reserves on available for sale investments – – – (28.5) – – (28.5)
Fair value of share-based payments – – – – 1.7 – 1.7
Dividends paid 13 – – – – – (9.6) (9.6)
Total transactions with owners 15.5 6.0 54.8 (28.5) 1.7 10.7 60.2
Balance at 31 December 2011 170.9 95.1 196.2 10.8 2.2 627.9 1,103.1
1 Represents qualifying consideration received by the Company following capital raising in May 2011. The residual balance taken to the merger reserve does not currently meet the criteria for qualifying consideration as it forms part of a linked transaction.
2010
Notes
Sharecapital
£m
Sharepremium
£m
Mergerreserve
£m
Revaluationreserve
£m
Capital contribution
£m
Other reserves
£m
Retained(losses)
/earnings£m
Total equity
£m
Balance at 1 January 2010 497.5 89.1 87.6 15.7 – – (597.2) 92.7
Profit for the year – – – – – – 131.6 131.6
Other comprehensive income:
Fair value gains on available for sale investments and other movements – – – 21.5 – – – 21.5
Actuarial gains on defined benefit pension schemes 39 – – – – – – 1.4 1.4
Tax on items taken directly to equity 29 – – – – – – (0.4) (0.4)
Total comprehensive income for the year ended 31 December 2010 – – – 21.5 – – 132.6 154.1
Transactions with owners
Capital reduction (342.0) – – – – – 342.0 –
Capital reorganisation and pro forma restatement2 – – 53.8 (4.2) 696.7 – (107.0) 639.3
Capital contribution realised – – – – (696.7) – 696.7 –
Share redemption (0.1) – – – – – – (0.1)
Fair value of share-based payments – – – – – 0.5 – 0.5
Dividends paid 13 – – – – – – (3.1) (3.1)
Total transactions with owners (342.1) – 53.8 (4.2) – 0.5 928.6 636.6
Balance at 31 December 2010 155.4 89.1 141.4 33.0 – 0.5 464.0 883.4
Notes on pages 78 to 113 form part of these consolidated financial statements.
2 On demerger from Liberty International a number of reserves were realised and pro forma adjustments (made in comparative periods to reflect the application of merger accounting principles) reversed. Debt waivers granted to the Group by Liberty International were reflected as a capital contribution reserve prior to being realised in retained earnings.

77 www.capitalandcounties.com
ou
r busin
ess perform
an
ce
Ho
w w
e go
vern o
ur bu
siness
ou
r fina
nc
ial statem
ents
un
dersta
nd
ing
ou
r busin
ess
STATEMENTS OF CASH FLOWS FOR THE YEAR ENDED 31 DECEMBER 2011
Notes
Group2011
£m
Group 2010
£m
Company2011
£m
Company2010
£m
Cash generated from operations 34 38.0 38.6 (91.4) 3.4
Interest paid (38.4) (41.4) – –
Interest received 1.7 1.3 4.1 –
Taxation (1.3) 1.0 0.3 (0.3)
Cash flows from operating activities – (0.5) (87.0) 3.1
Cash flows from investing activities
Purchase and development of property (161.1) (26.8) – –
Sale of property 48.2 28.1 – –
REIT entry charge paid (0.1) (3.6) – –
Sale of available for sale investments 55.0 0.5 – –
Pension funding (3.6) – – –
Exclusivity agreement with LBHF (15.0) – – –
VAT received on internal restructure1 22.2 – – –
Cash flows from investing activities (54.4) (1.8) – –
Cash flows from financing activities
Issue of shares 96.6 – 96.6 –
Issue of redeemable shares – 0.1 – 0.1
Redemption of redeemable shares – (0.1) – (0.1)
Cash transferred to restricted accounts 22 – (6.0) – –
Borrowings drawn 25 145.8 6.0 – –
Borrowings repaid 25 (259.4) (68.0) – –
Funding from Capital Shopping Centres Group 25 – 244.0 – –
Purchase of derivatives (3.4) – – –
Termination of swaps (14.5) (7.4) – –
Equity dividends paid 13 (9.6) (3.1) (9.6) (3.1)
Cash flows from financing activities (44.5) 165.5 87.0 (3.1)
Net (decrease)/increase in unrestricted cash and cash equivalents (98.9) 163.2 – –
Unrestricted cash and cash equivalents at 1 January 182.5 19.3 – –
Unrestricted cash and cash equivalents at 31 December 22 83.6 182.5 – –
1 VAT received on an internal property transfer was deemed to be a VAT supply. Input VAT was received prior to the balance sheet date whilst output VAT was not settled until January 2012.
Notes on pages 78 to 113 form part of these consolidated financial statements.

our financial statements
78
NOTES TO THE ACCOUNTS
1 PRINCIPAL ACCOUNTING POLICIES General information The Capital & Counties Properties PLC Group demerged from its former parent company, Liberty International PLC (subsequently renamed Capital Shopping Centres Group PLC), with effect from 7 May 2010. Shares in Capital & Counties Properties PLC were admitted to dealings on the London and Johannesburg Stock Exchanges in May 2010. The Group’s assets principally comprise investment properties at Covent Garden; Earls Court & Olympia; a 50 per cent interest in the Empress State building; and a 50 per cent interest in The Great Capital Partnership, a joint venture focused predominantly on London’s West End.
Capital & Counties Properties PLC was incorporated and registered in England and Wales on 3 February 2010 under the Companies Act as a public company limited by shares with registration number 7145051. The registered office of the Company is 15 Grosvenor Street, London, W1K 4QZ, United Kingdom. The principal activity of the Company is to act as the ultimate parent company of Capital & Counties Properties PLC Group, whose principal activity is the development and management of investment property.
Basis of preparation The Group’s consolidated financial statements are prepared in accordance with International Financial Reporting Standards (“IFRS”), as adopted by the European Union, International Financial Reporting Interpretations Committee (“IFRIC”) interpretations and with those parts of the Companies Act 2006 applicable to companies reporting under IFRS. The Company’s financial statements for the comparative period cover the period from incorporation, therefore references appearing in these financial statements to the year ended should, for the comparative period, be read as being for the period ended. The Directors have taken advantage of the exemption offered by Section 408 of the Companies Act 2006 not to present a separate income statement or statement of changes in equity for the Parent Company.
The consolidated financial statements have been prepared under the historical cost convention as modified for the revaluation of properties, available for sale investments and financial assets held for trading.
Standards and guidelines relevant to the Group that were in issue and endorsed at the date of approval of the consolidated financial statements but not yet effective and have not been adopted early: IFRS 7 ‘Financial Instruments: Disclosures’ (amendment) IAS 32 ‘Financial Instruments: Presentation’ (amendment)
The assessment of amendments issued but not effective are not anticipated to have a material impact on the financial statements.
During 2011, the following accounting standards and guidance were adopted by the Group: IAS 24 ‘Related Party Disclosures’ (revised) IAS 32 ‘Financial Instruments: Presentation’ (amendment) IFRS 1 ‘First-time Adoption of International Financial Reporting Standards’ (amendment) IFRIC 14 ‘Prepayments of a Minimum Funding Requirement’ (amendment) IFRIC 19 ‘Extinguishing Financial Liabilities with Equity Instruments’
Collectively, together with the International Accounting Standards Board’s annual improvements, these pronouncements either had no impact on the consolidated financial statements or resulted in changes to presentation and disclosure only.
2010 Group reconstruction All Capital & Counties Properties PLC Group companies which were owned and controlled by Liberty International PLC prior to the demerger were transferred under the new ultimate parent company, Capital & Counties Properties PLC, prior to 7 May 2010. The introduction of this new ultimate holding company constituted a group reconstruction.
The transaction fell outside the scope of IFRS 3 ‘Business Combinations’. Accordingly, following the guidance regarding the selection of an appropriate accounting policy provided in IAS 8 ‘Accounting Policies, Changes in Accounting Estimates and Errors’, the transaction has been accounted for in these financial statements using the principles of merger accounting with reference to UK Generally Accepted Accounting Practice (UK GAAP). This policy, which does not conflict with IFRS, reflects the economic substance of the transaction.
Amounts due to former subsidiary undertakings of Liberty International PLC which were not demerged, were waived prior to demerger. In order to achieve uniformity, debt waivers received were treated as a capital contribution rather than an extinguishment of debt.
Therefore, although the Group reconstruction did not become unconditional until 7 May 2010, the comparative financial statements have been presented as if the Group structure had always been in place. For further details on the demerger refer to page 117.
Going concern basis The Directors are satisfied that the Group has the resources to continue in operational existence for the foreseeable future, for this reason the consolidated financial statements are prepared on a going concern basis.
Basis of consolidation These accounts include the consolidation of the following limited partnerships: Capital & Counties CGP, Capital & Counties CGP 9, Capco CGP 2010 LP, EC Properties LP and Seagrave Road LP. The members of these qualifying partnerships have taken advantage of disclosure exemptions available in Statutory Instrument 2008/569 and therefore will not produce consolidated accounts at the partnership level.
The consolidated financial statements are prepared in British pounds sterling which is determined to be the functional currency of the Parent.
Subsidiaries Subsidiary undertakings are fully consolidated from the date on which the Group is deemed to govern the financial and operating policies of an entity, whether through a majority of the voting rights or otherwise. They cease to be consolidated from the date this control is lost.
All intragroup balances resulting from intragroup transactions are eliminated in full.
Any proportion of a subsidiary’s income statement and net assets not held by the Group are presented separately as non-controlling interests within these consolidated financial statements.
Joint ventures The Group’s interest in jointly controlled entities is accounted for using proportional consolidation. The Group’s share of the assets, liabilities, income and expenses is combined with the equivalent items in the consolidated financial statements on a line-by-line basis.

79 www.capitalandcounties.com
ou
r busin
ess perform
an
ce
Ho
w w
e go
vern o
ur bu
siness
ou
r fina
nc
ial statem
ents
un
dersta
nd
ing
ou
r busin
ess
1 PRINCIPAL ACCOUNTING POLICIES CONTINUED Investments in subsidiaries and joint ventures are reviewed at least annually for impairment. Where there exists an indication of impairment an assessment of the recoverable amount is performed. The recoverable amount is based on the higher of the investment’s continued value in use or its fair value less cost to sell; fair value is derived from the entities’ net asset value at the balance sheet date.
Estimation and uncertainty The preparation of consolidated financial statements in conformity with IFRS requires the use of estimates and assumptions that affect the reported amounts of assets and liabilities and the reported amounts of revenues and expenses. Although these estimates are based on management’s best knowledge of the amount, event or actions, actual results ultimately may differ from those estimates. The most significant area of estimation and uncertainty in the consolidated set of financial statements is in respect of the valuation of the property portfolio and investments, where external valuations are obtained. Other areas of estimation and uncertainty are included within the accounting policies below, the more significant being:
Revenue recognition Share-based payments Provisions Pensions Contingent liabilities and capital commitments Income tax Trade and other receivables Derivative financial instruments
Operating segments Management has determined the operating segments with reference to reports on divisional financial performance and position which are regularly reviewed by the Chief Executive, who is deemed to be the chief operating decision maker.
Foreign currencies Transactions in currencies other than the Company’s functional currency are recorded at the exchange rate prevailing at the transaction date. Foreign exchange gains and losses resulting from settlement of these transactions and from retranslation of monetary assets and liabilities denominated in foreign currencies are recognised in the income statement except for differences arising on the retranslation of available for sale investments which are recognised in other comprehensive income.
Revenue recognition Property rental income and exhibition income consists of gross income calculated on an accruals basis, together with services where the Group acts as principal in the ordinary course of business, excluding sales of investment properties. Rental income receivable is spread evenly over the period from lease commencement to lease expiry.
Lease incentive payments, including surrender premiums paid which can be directly linked to enhanced rental income, are amortised on a straight-line basis over the lease term. Upon receipt of a surrender premium for the early termination of a lease, the profit and non-recoverable outgoings relating to the lease concerned are immediately reflected in income.
Contingent rents, being those lease payments that are not fixed at the inception of a lease, for example increases arising on rent reviews, are recorded as income in the periods in which they are earned.
Rent reviews are recognised as income, based on management’s estimates, when it is reasonable to assume they will be received. Estimates are derived from knowledge of market rents for comparable properties determined on an individual property basis and updated for progress of negotiations.
Where revenue is obtained by the sale of properties, it is recognised when the significant risks and returns have been transferred to the buyer. This will normally take place on exchange of contracts unless there are conditions attached. For conditional exchanges, sales are recognised when these conditions are satisfied.
Interest income is accrued on a time basis, by reference to the principal outstanding and the effective interest rate.
Dividend income is recognised when the relevant Group company’s right to receive payment has been established.
Exceptional items Exceptional items are those items that in the Directors’ view are required to be separately disclosed by virtue of their size or incidence to enable a full understanding of the Group’s financial performance. These are excluded from the calculation of underlying earnings.
Income taxes Current tax is the amount payable on the taxable income for the year and any adjustment in respect of prior years. It is calculated using rates that have been enacted or substantively enacted by the balance sheet date.
In accordance with IAS 12, deferred tax is provided using the balance sheet liability method on temporary differences between the carrying amounts of assets and liabilities for financial reporting purposes and the tax bases of those assets and liabilities. However temporary differences are not recognised to the extent that they arise from the initial recognition of assets and liabilities (other than on a business combination) that at the time of the transaction affect neither accounting nor taxable profit and loss.
Deferred tax is determined using tax rates that have been enacted or substantially enacted by the balance sheet date and are expected to apply when the related deferred tax asset is realised or the deferred tax liability is settled.
Deferred tax assets are recognised only to the extent that management believes it is probable that future taxable profit will be available against which the temporary differences can be utilised. Deferred tax assets and liabilities are offset only when they relate to taxes levied by the same authority and the Group intends to settle them on a net basis.
Tax is included in the income statement except when it relates to items recognised in other comprehensive income, or directly in equity, in which case the related tax is also recognised in other comprehensive income or directly in equity.
Share-based payments The cost of granting share options and other share-based remuneration to employees and Directors is recognised through the income statement with reference to the fair value of the instrument at the date of grant. The income statement is charged over the vesting period of the options.
An option pricing model is used applying assumptions around expected yields, forfeiture rates, exercise price and volatility.
Own shares held in connection with employee share plans and other share-based payment arrangements are treated as treasury shares and deducted from equity.
Impairment of financial assets An annual review is conducted for financial assets to determine whether there is any evidence of a loss event as described by IAS 39. Where there is objective evidence of impairment the amount of any loss is calculated by estimating future cash flows or by using fair value where this is available through observable market prices.

our financial statements
80
NOTES TO THE ACCOUNTS CONTINUED
1 PRINCIPAL ACCOUNTING POLICIES CONTINUED Investment and development property Investment and development properties are owned or leased by the Group and held for long-term rental income and capital appreciation and exclude properties occupied by the Group.
The Group has chosen to use the fair value model. Properties are initially recognised at cost and subsequently revalued at the balance sheet date to fair value as determined by professionally qualified external valuers on the basis of market value after allowing for future transaction costs. The valuation is based upon assumptions including market rent or business profitability, future growth, anticipated maintenance costs, development costs and an appropriate discount rate where possible applying yields based on known transactions for similar properties and likely incentives offered to tenants. These assumptions conform with Royal Institution of Chartered Surveyors (“RICS”) valuation standards.
The fair value of properties is arrived at by adjusting the market value as above for directly attributable lease incentive assets and fixed head leases.
Properties held under leases are stated gross of the recognised finance lease liability.
The cost of development properties includes capitalised interest and other directly attributable outgoings, except in the case of properties and land where no development is imminent, in which case no interest is included. Interest is capitalised (before tax relief) on the basis of the average rate of interest paid on the relevant debt outstanding, until the date of practical completion.
When the Group redevelops an existing investment property for continued future use as an investment property, the property remains an investment property measured at fair value.
Gains or losses arising from changes in the fair value of investment and development property are recognised in the income statement of the period in which they arise. Depreciation is not provided in respect of investment properties including plant and equipment integral to such investment properties.
When the use of a property changes from that of trading property to investment property, such property is transferred at fair value, with any resulting gain being recognised as property trading profit.
Investment properties cease recognition as investment property either when they have been disposed of or when they cease to be held for the purpose of generating rental income or for capital appreciation. Where the Group disposes of a property at fair value in an arm’s length transaction the carrying value immediately prior to the sale is adjusted to the transaction price, offset by any directly attributable costs, and the adjustment is recorded in the income statement.
Leases Leases are classified according to the substance of the transaction. A lease that transfers substantially all the risks and rewards of ownership to the lessee is classified as a finance lease. All other leases are normally classified as operating leases.
Group as a lessee: In accordance with IAS 40, finance and operating leases of investment property are accounted for as finance leases and recognised as an asset and an obligation to pay future minimum lease payments. The investment property asset is included in the balance sheet at the lower of fair value and the present value of minimum lease payments, gross of the recognised finance lease liability. Lease payments are allocated between the liability and finance charges so as to achieve a constant financing rate.
Other finance leased assets are capitalised at the lower of the fair value of the leased asset or the present value of the minimum lease payments and depreciated over the shorter of the lease term and the useful life of the asset.
Rental expense under operating leases is charged to the income statement on a straight-line basis over the lease term.
Group as lessor: Assets leased out under finance leases are recognised as receivables at the amount of the Group’s net investment in the leases. Finance lease income is allocated to accounting periods so as to reflect a constant rate of return on the net investment.
Assets leased out under operating leases are included in investment property, with rental income recognised on a straight-line basis over the lease term.
Trading property Trading property comprises those properties that in the Directors’ view are expected to be disposed of within one year of the balance sheet date. Such properties are transferred from investment property at fair value which forms its deemed cost. Subsequently it is carried at the lower of cost and net realisable value.
Plant and equipment Plant and equipment consists of fixtures, fittings and other office equipment. Plant and equipment is stated at cost less accumulated depreciation and any accumulated impairment losses. Cost includes the original purchase price of the asset plus any attributable cost in bringing the asset to its working condition for its intended use. Depreciation is charged to the income statement on a straight-line basis over an asset’s estimated useful life to a maximum of five years.
Investment in Group companies Investment in Group companies, which is eliminated on consolidation, is stated in the Company’s separate financial statements at cost less impairment losses, if any. Impairment losses are determined with reference to the investment’s fair value less estimated selling costs. Fair value is derived from the subsidiary’s net assets at the balance sheet date. On disposal, the difference between the net disposal proceeds and its carrying amount is included in profit or loss.
Investments Available for sale investments, being investments intended to be held for an indefinite period, are initially recognised and subsequently measured at fair value.
Gains or losses arising from changes in the fair value of available for sale investments are included in other comprehensive income, except to the extent that losses are determined to be attributable to impairment, in which case they are recognised in the income statement.
Disposals are recorded upon distribution, at which time accumulated fair value adjustments are recycled from reserves to the income statement.
Trade and other receivables Trade and other receivables are initially recognised at fair value and subsequently measured at amortised cost. The Directors exercise judgement as to the collectability of the Group’s trade and other receivables and determine when it is appropriate to impair these assets. Factors such as days past due, credit status of the counterparty, historical evidence of collection and probability of deriving future economic benefit are considered.

81 www.capitalandcounties.com
ou
r busin
ess perform
an
ce
Ho
w w
e go
vern o
ur bu
siness
ou
r fina
nc
ial statem
ents
un
dersta
nd
ing
ou
r busin
ess
1 PRINCIPAL ACCOUNTING POLICIES CONTINUED Cash and cash equivalents Cash and cash equivalents are recognised at fair value. Cash and cash equivalents comprise cash on hand, deposits with banks and other short-term highly liquid investments with original maturities of three months or less.
Derivative financial instruments The Group uses non-trading derivative financial instruments to manage exposure to interest rate risk. These instruments have not been designated as qualifying for hedge accounting. They are initially recognised on the trade date at fair value and subsequently remeasured at fair value based on market price. Changes in fair value are recognised directly in the income statement.
Trade payables Trade payables are obligations for goods or services acquired in the ordinary course of business. Trade payables are recognised at fair value and subsequently measured at amortised cost until settled.
Dividend distribution Dividend distributions to shareholders are recognised as a liability once approved by shareholders.
Provisions Provisions are recognised when the Group has a current obligation arising from a past event and it is probable that the Group will be required to settle that obligation. Provisions are measured at the Directors’ best estimate of the expenditure required to settle that obligation at the balance sheet date.
Borrowings Borrowings are recognised initially at their net proceeds on issue and subsequently carried at amortised cost. Any transaction costs, premiums or discounts are capitalised and recognised over the contractual life using the effective interest method. In the event of early repayment all unamortised transaction costs are recognised immediately in the income statement.
Share capital Ordinary shares are classified as equity. Incremental costs directly attributable to the issue of ordinary shares are recognised as a deduction from equity, net of any tax effects.
Pensions The costs of the defined contribution scheme and the Group’s personal pension plans are charged against profits in the year in which they fall due.
Past service costs, current service costs and curtailment gains of the defined benefit scheme are recognised immediately in income. Actuarial gains and losses arising from experience adjustments and changes in actuarial assumptions are charged or credited to equity in other comprehensive income for the period in which they arise. The defined benefit obligation is calculated annually by independent actuaries using the projected unit credit method and applying assumptions which are agreed between the Group and its actuaries.
Contingent liabilities and capital commitments Contingent liabilities are not recognised due to lack of certainty with respect to measurement of the potential future liability. A description of the nature and, where possible, an estimate of the financial effect of contingent liabilities is disclosed.
Capital commitments are disclosed when the Group has a contractual future obligation which has not been provided for at the balance sheet date.

our financial statements
82
NOTES TO THE ACCOUNTS CONTINUED
2 SEGMENTAL REPORTING Management has determined the operating segments based on reports reviewed by the Chief Executive, who is deemed to be the chief operating decision maker. The principal performance measures have been identified as net rental income and net asset value.
For management and reporting purposes the Group is organised into five operating divisions being The Great Capital Partnership, Earls Court & Olympia, Covent Garden, China and Other. The Other segment primarily constitutes the business unit historically known as Opportunities and other head office companies. Due to actions taken by the fund manager who controls the divestment decisions pertaining to the Group’s interests in China, this segment has been presented separately as the segment’s results exceeds the quantitative threshold requiring separate disclosure. The Earls Court & Olympia segment also includes the Group’s interest in The Empress State Limited Partnership which holds the Empress State building adjacent to the Group’s property at Earls Court.
The Group’s operating segments derive their revenue primarily from rental income from lessees, with the exception of Earls Court & Olympia whose revenue primarily represents exhibition income.
Unallocated expenses are costs incurred centrally which are neither directly nor reasonably attributable to individual segments.
Reportable segments 2011
The Great Capital
Partnership£m
Earls Court & Olympia1
£m
CoventGarden
£mChina
£m Other
£m
Grouptotal£m
Revenue 13.3 59.2 35.9 – – 108.4
Rent receivable and exhibition income 12.5 59.2 32.8 – – 104.5
Service charge income 0.8 – 3.1 – – 3.9
Rental income 13.3 59.2 35.9 – – 108.4
Service charge and other non-recoverable costs (2.3) (29.0) (8.1) – – (39.4)
Net rental income 11.0 30.2 27.8 – – 69.0
Other income – 0.4 – – 0.4 0.8
Gain on revaluation and sale of investment and
development property 25.3 46.3 51.2 – 0.5 123.3
Profit on sale of available for sale investments – – – 30.5 – 30.5
Remeasurement of deferred consideration – (4.2) – – – (4.2)
Write down of trading property – – – – (0.1) (0.1)
Segment result 36.3 72.7 79.0 30.5 0.8 219.3
Unallocated costs
Administration expenses (22.2)
Operating profit 197.1
Net finance costs2 (35.2)
Profit before tax 161.9
Taxation (8.2)
Profit for the year 153.7
Summary balance sheet
Total segment assets3 253.5 616.4 827.6 19.6 5.7 1,722.8
Total segment liabilities3 (130.2) (248.8) (302.2) – (5.9) (687.1)
123.3 367.6 525.4 19.6 (0.2) 1,035.7
Unallocated net assets2 67.4
Net assets 1,103.1
Other segment items:
Capital expenditure (1.4) (46.4) (131.7) – – (179.5)
Depreciation – – (0.2) – – (0.2)
1 Empress State represents £7.1 million of the £30.2 million net rental income for Earls Court & Olympia.
2 The Group operates a central treasury function which manages and monitors the Group’s finance income and costs on a net basis and a majority of the Group’s cash balances.
3 Total assets and total liabilities exclude loans between and investments in Group companies.

83 www.capitalandcounties.com
ou
r busin
ess perform
an
ce
Ho
w w
e go
vern o
ur bu
siness
ou
r fina
nc
ial statem
ents
un
dersta
nd
ing
ou
r busin
ess
2 SEGMENTAL REPORTING CONTINUED 2010
The Great Capital
Partnership£m
Earls Court& Olympia1
£m
CoventGarden
£mChina
£m Other
£m
Grouptotal£m
Revenue 16.1 57.7 38.9 – 1.0 113.7
Rent receivable and exhibition income 14.9 57.7 36.2 – 0.6 109.4
Service charge income 1.2 – 2.7 – 0.3 4.2
Rental income 16.1 57.7 38.9 – 0.9 113.6
Rent payable – – (1.0) – – (1.0)
Service charge and other non-recoverable costs (2.5) (28.6) (12.2) – (0.3) (43.6)
Net rental income 13.6 29.1 25.7 – 0.6 69.0
Other income – – – – 0.1 0.1
Gain on revaluation and sale of investment and
development property 33.5 23.3 77.8 – – 134.6
Remeasurement of deferred consideration – 0.7 – – – 0.7
Write down of trading property – – – – (0.1) (0.1)
Impairment of other receivables – – – – (1.6) (1.6)
Segment result 47.1 53.1 103.5 – (1.0) 202.7
Unallocated costs
Administration expenses (23.9)
Operating profit 178.8
Net finance costs2 (46.3)
Profit before tax 132.5
Taxation (0.9)
Profit for the year 131.6
Summary balance sheet
Total segment assets3 273.1 503.2 659.0 66.3 – 1,501.6
Total segment liabilities3 (128.6) (273.4) (382.0) – (7.1) (791.1)
144.5 229.8 277.0 66.3 (7.1) 710.5
Unallocated net assets2 172.9
Net assets 883.4
Other segment items:
Capital expenditure (1.1) (22.7) (7.5) – – (31.3)
Depreciation – – (0.1) – – (0.1)
1 Empress State represents £6.5 million of the £29.1 million net rental income for Earls Court & Olympia.
2 The Group operates a central treasury function which manages and monitors the Group’s finance income and costs on a net basis and a majority of the Group’s cash balances.
3 Total assets and total liabilities exclude loans between and investments in Group companies.
The Group’s geographical segments are set out below. This represents where the Group’s assets and revenues are predominantly domiciled.
Revenue represents income from tenants and total assets primarily constitute investment property.
Revenue Total assets Capital expenditure2011
£m 2010
£m 2011
£m 2010
£m 2011
£m 2010
£m
Central London 108.4 112.7 1,770.4 1,606.3 179.5 31.3
Other – 1.0 19.8 66.6 – –
108.4 113.7 1,790.2 1,672.9 179.5 31.3

our financial statements
84
NOTES TO THE ACCOUNTS CONTINUED
3 OTHER INCOME
2011
£m 2010
£m
Dividend income – 0.1
Non-recurring income 0.8 –
Other income 0.8 0.1
4 GAIN ON REVALUATION AND SALE OF INVESTMENT AND DEVELOPMENT PROPERTY
2011
£m 2010
£m
Gain on revaluation of investment and development property 119.4 133.3
Gain on sale of investment property 3.9 1.3
Gain on revaluation and sale of investment and development property 123.3 134.6
5 PROFIT ON SALE OF AVAILABLE FOR SALE INVESTMENTS
2011
£m 2010
£m
Profit on sale of available for sale investments 30.5 –
Profit on sale of available for sale investments represents part divestment from Harvest China Real Estate Fund I and divestment in full from Harvest China Real Estate Fund II following property disposals made by the funds.
6 IMPAIRMENT OF OTHER RECEIVABLES Impairment of other receivables of £1.6 million arose in 2010 following an impairment review of loan notes receivable by the Group. The impairment charge was calculated with reference to the market value of certain property assets that the Group would have priority over in the event of default. There was no impairment in 2011.
7 DEMERGER COSTS Demerger costs included within administration expenses in 2010 were those costs and fees that were directly related to the Group’s demerger from Liberty International. These included inter alia legal and professional fees, listing fees and costs associated with the establishment of the Company’s head office. These were treated as exceptional items and were not included in the calculation of underlying earnings.

85 www.capitalandcounties.com
ou
r busin
ess perform
an
ce
Ho
w w
e go
vern o
ur bu
siness
ou
r fina
nc
ial statem
ents
un
dersta
nd
ing
ou
r busin
ess
8 EMPLOYEE INFORMATION
a) Employee costs
Group2011
£m
Group2010
£m
Wages and salaries 20.2 17.8
Social security costs 1.7 1.9
Other pension costs 0.9 0.9
Share-based payments 1.5 0.4
24.3 21.0
b) Employee numbers Total number of people (including Executive Directors) employed
Group2011
Group2010
Covent Garden Restaurants Group 88 78
Earls Court & Olympia 286 288
Capco head office & Covent Garden 69 50
Total headcount at 31 December 443 416
Average number of people (including Executive Directors) employed Group2011
Group2010
Covent Garden Restaurants Group 83 82
Earls Court & Olympia 300 303
Capco head office & Covent Garden 62 36
Total average headcount 445 421
9 AUDITORS’ REMUNERATION
2011 £’000
2010£’000
Remuneration to the principal auditor in respect of audit fees:
Statutory audit of the Company and consolidated accounts 117 174
Remuneration to the principal auditor in respect of other services:
Statutory audit of subsidiary accounts 143 80
Statutory audit of the pension funds 7 –
Other services pursuant to legislation 35 70
Corporate finance advisory services 46 62
Taxation advisory services 14 6
Other services 8 –
370 392
Remuneration to other auditors comprises:
Statutory audit of UK subsidiaries – 157
Tax services to UK subsidiaries 59 99

our financial statements
86
NOTES TO THE ACCOUNTS CONTINUED
10 FINANCE COSTS
2011
£m 2010
£m
Finance costs:
On bank overdrafts and loans 36.6 40.7
Amortisation of issue costs 0.8 0.1
On obligations under finance leases 0.8 0.3
Gross finance costs 38.2 41.1
Interest capitalised on developments (1.7) (0.8)
Finance costs 36.5 40.3
Costs of termination of derivative financial instruments1 14.5 7.1
Other finance costs 14.5 7.1
1 Treated as exceptional and therefore excluded from the calculation of underlying earnings.
Interest is capitalised, before tax relief, on the basis of the average rate of interest paid of 5.9 per cent (2010 – 5.9 per cent) on the relevant debt, applied to the cost of developments during the year.
11 TAXATION
2011
£m 2010
£m
Current income tax: Current income tax charge 2.5 2.2
Adjustments in respect of previous years – 0.1
Current income tax on profits excluding exceptional items 2.5 2.3
Deferred income tax:
On investment and development property 14.1 8.4
On accelerated capital allowances 0.4 (1.7)
On exceptional losses (11.6) –
On derivative financial instruments 3.3 (9.6)
On non-exceptional items (0.5) –
On exceptional items – 2.5
Deferred income tax on profits 5.7 (0.4)
REIT entry charge – 0.1
Current tax credit on exceptional items – (1.1)
Total tax expense reported in the income statement 8.2 0.9

87 www.capitalandcounties.com
ou
r busin
ess perform
an
ce
Ho
w w
e go
vern o
ur bu
siness
ou
r fina
nc
ial statem
ents
un
dersta
nd
ing
ou
r busin
ess
11. TAXATION CONTINUED Factors affecting the tax charge for the year The tax assessed for the period is £8.2 million which is lower than the standard rate of corporation tax in the United Kingdom.
The differences are explained below:
2011
£m2010
£m
Profit before tax 161.9 132.5
Profit on ordinary activities multiplied by the standard rate in the UK of 26.5% (2010 – 28%) 42.9 37.1
UK capital allowances not reversing on sale (0.6) (1.5)
Revaluation surplus not recognised in deferred tax (15.8) (37.7)
Prior year corporation tax items – 0.1
Expenses disallowed, net of capitalised interest 0.5 1.5
REIT– corporation tax exemption on qualifying properties pre exit from REIT Regime – (0.5)
REIT– deferred tax movement in year post exit from REIT Regime – 19.4
REIT– entry charge – 0.1
Utilisation of losses (brought)/carried forward (11.0) 1.9
Non-taxable items (8.1) –
Deferred tax arising on exit from REIT Regime – (19.1)
Reduction in deferred tax following cut in corporate tax rate 0.3 (0.4)
Total tax expense reported in the income statement 8.2 0.9
As a result of exiting the UK REIT Regime, a deferred tax charge of £19.4 million was recognised in 2010 on investment properties and is disclosed in the tax reconciliation above as ‘REIT – deferred tax movement in year post exit from REIT Regime’. This charge was offset by a corresponding credit disclosed above under ‘Deferred tax arising on exit from REIT Regime’.
Further amendments to the UK Corporation Tax system were announced in the March 2011 Budget which included changes to the main rates of UK Corporation Tax. The main rate of corporation tax decreased from 28 per cent to 26 per cent from 1 April 2011. The Budget will reduce the main rate of corporation tax from 26 per cent to 25 per cent from 1 April 2012. It proposes to make further reductions to the main rate of 1 per cent per annum to 23 per cent by 1 April 2014. The decrease in tax rate to 25 per cent has been substantively enacted for the purposes of IAS 12 and therefore has been reflected in these financial statements.
12 PROFIT/(LOSS) FOR THE PERIOD ATTRIBUTABLE TO SHAREHOLDERS OF CAPITAL & COUNTIES PROPERTIES PLC Profit of £2.8 million is dealt with in the accounts of the holding Company in respect of the year (2010 – losses of £1.6 million). No income statement or statement of changes in equity is presented for the Company as permitted by Section 408 Companies Act 2006.
13 DIVIDENDS
Group and Company 2011
£m2010
£m
Ordinary shares
Prior year final dividend paid of 1.0p per share (2010 – £nil) 6.2 –
Interim dividend paid of 0.5p per share (2010 – 0.5p) 3.4 3.1
Dividends paid 9.6 3.1
Proposed final dividend of 1.0p per share (2010 – 1.0p) 6.8 6.2
Details of the shares in issue are given in note 31.

our financial statements
88
NOTES TO THE ACCOUNTS CONTINUED
14 EARNINGS PER SHARE AND NET ASSETS PER SHARE 2011 2010
(a) Earnings per share Earnings
£mShares1
million Pence per
shareEarnings
£m Shares1 million
Pence pershare
Basic earnings 153.7 661.8 23.2 131.6 621.9 21.2
Dilutive effect of share option awards2 1.7 4.0 0.5 1.2
Dilutive effect of contingently issuable shares2 – 0.6 – –
Dilutive effect of matching nil cost options2 – 1.9 – –
Diluted earnings 155.4 668.3 23.3 132.1 623.1 21.2
Basic earnings 153.7 131.6
Adjustments:
Gain on revaluation and sale of investment and development property (123.3) (134.6)
Write down of trading property 0.1 0.1
Fair value movement on derivative financial instruments (14.1) 0.3
Costs of termination of derivative financial instruments 14.5 7.1
Current tax adjustments (0.3) (0.3)
Deferred tax adjustments 17.4 (2.9)
EPRA adjusted earnings 48.0 661.8 7.3 1.3 621.9 0.2
Exceptional other income (0.8) –
Profit on sale of available for sale investments (30.5) –
Remeasurement of deferred consideration 4.2 (0.7)
Write down of trading property (0.1) (0.1)
Impairment of other receivables – 1.6
Demerger costs – 5.3
Current tax adjustments 0.3 (0.8)
Deferred tax adjustments (11.6) 2.5
REIT entry charge – 0.1
Underlying earnings 9.5 661.8 1.4 9.2 621.9 1.5
1 Weighted average number of shares in issue during the period.
2 Further information on these items can be found in note 38 Share-based payments.
Headline earnings per share is calculated in accordance with Circular 3/2009 issued by the South African Institute of Chartered Accountants (SAICA), a requirement of the Group’s JSE listing. This measure is not a requirement of IFRS.
2011 2010
Earnings
£mShares1
million Pence per
shareEarnings
£m Shares million
Pence pershare
Basic earnings per share 153.7 661.8 23.2 131.6 621.9 21.2
Adjustments:
Gain on revaluation and sale of investment
and development property (123.3) (134.6)
Profit on sale of available for sale investments (30.5) –
Impairment of other receivables – 1.6
Demerger costs – 5.3
Current tax adjustments – (0.7)
Deferred tax adjustments 13.1 9.2
Headline earnings 13.0 661.8 2.0 12.4 621.9 2.0
Dilutive effect of share options awards2 1.7 4.0 0.5 1.2
Dilutive effect of contingently issuable shares2 – 0.6 – –
Dilutive effect of matching nil cost options2 – 1.9 – –
Diluted headline earnings 14.7 668.3 2.2 12.9 623.1 2.1
1 Weighted average number of shares in issue during the period.
2 Further information on these items can be found in note 38 Share-based payments.

89 www.capitalandcounties.com
ou
r busin
ess perform
an
ce
Ho
w w
e go
vern o
ur bu
siness
ou
r fina
nc
ial statem
ents
un
dersta
nd
ing
ou
r busin
ess
14 EARNINGS PER SHARE AND NET ASSETS PER SHARE CONTINUED 2011 2010
b) Net assets per share
Netassets
£m Shares1
million
NAV pershare
(pence)
Net assets
£m Shares1
million
NAV pershare
(pence)
Net assets attributable to owners of the Group 1,103.1 683.9 161.3 883.4 621.8 142.1
Adjustments:
Effect of dilution on exercise of options2 – 4.4 – 2.2
Effect of dilution on issue of contingently issuable shares2 – 0.6 – –
Effect of dilution on issue of matching nil cost options2 – 1.9 – –
Diluted NAV 1,103.1 690.8 159.7 883.4 624.0 141.6
Fair value of derivative financial instruments 36.4 53.9
Unrecognised surplus on trading properties 1.0 1.1
Deferred tax adjustments 4.9 (12.5)
EPRA adjusted, diluted NAV 1,145.4 690.8 165.8 925.9 624.0 148.4
Fair value of derivative financial instruments (36.4) (53.9)
Deferred tax adjustments 9.2 12.5
EPRA adjusted, diluted NNNAV 1,118.2 690.8 161.9 884.5 624.0 141.7
1 Number of shares in issue at the year end.
2 Further information on these items can be found in note 38 Share based payments.
15 INVESTMENT AND DEVELOPMENT PROPERTY
Group Freehold
£m Leasehold
£mTotal
£m
At 1 January 2010 623.7 616.8 1,240.5
Additions from acquisitions 10.3 – 10.3
Additions from subsequent expenditure 6.9 14.1 21.0
Disposals (16.0) (11.5) (27.5)
Gain on valuation 72.4 60.9 133.3
At 1 January 2011 697.3 680.3 1,377.6
Reclassification (15.0) 15.0 –
Additions from acquisitions 114.5 – 114.5
Additions from subsequent expenditure 28.2 36.8 65.0
Disposals (59.7) – (59.7)
Gain on valuation 29.4 90.0 119.4
At 31 December 2011 794.7 822.1 1,616.8
Group 2011
£m 2010
£m
Balance sheet carrying value of investment and development property 1,616.8 1,377.6
Adjustment in respect of tenant incentives 14.9 9.6
Adjustment in respect of head leases (8.9) (6.8)
Market value of investment and development property 1,622.8 1,380.4
Included within investment and development properties is £1.7 million (2010 – £0.8 million) of interest capitalised on developments and redevelopments in progress.
The fair value of the Group’s investment and development properties as at 31 December 2011 was determined by independent external valuers Jones Lang LaSalle for Earls Court & Olympia (excluding Empress State), and CB Richard Ellis for the remainder of the Group’s investment and development property. The valuation conforms with the Royal Institution of Chartered Surveyors (“RICS”) Valuation Standards, and was arrived at by reference to market transactions for similar properties. Fees paid to valuers are based on fixed price contracts.
The main assumptions underlying the valuations are in relation to market rent or business profitability, taking into account forecast growth rates and yields based on known transactions for similar properties and likely incentives offered to tenants.
Valuations are based on what is determined to be the highest and best use. The Group’s investment at Earls Court, and Seagrave Road, a car park supporting Earls Court, have been valued as a site with development potential.
There are certain restrictions on the realisability of investment property when a credit facility is in place. Also see disclosures in note 25.

our financial statements
90
NOTES TO THE ACCOUNTS CONTINUED
16 PLANT AND EQUIPMENT 2011 2010
Group Cost£m
Accumulateddepreciation
£mNet£m
Cost £m
Accumulated depreciation
£m Net£m
At 1 January 1.3 (0.3) 1.0 1.2 (0.2) 1.0
Additions 0.5 – 0.5 0.1 – 0.1
Disposals (0.1) – (0.1) – – –
Charge for the year – (0.2) (0.2) – (0.1) (0.1)
At 31 December 1.7 (0.5) 1.2 1.3 (0.3) 1.0
Plant and equipment includes fixtures, fittings and other office equipment.
17 INVESTMENT IN GROUP COMPANIES
Company 2011
£m 2010
£m
At 1 January 446.6 –
Impairment (0.1) –
Additions – 446.6
At 31 December 446.5 446.6
Investments in Group companies are carried at the lower of cost or net book value. An impairment test is performed on an annual basis. An impairment charge of £64,000 was recorded in the current year (2010 – £nil).
18 JOINT VENTURES 2011
The Great Capital
Partnership £m
The Empress State Limited Partnership
£m Total
£m
Summarised income statement
Gross rental income 12.5 7.1 19.6
Net rental income 11.0 7.1 18.1
Gain on revaluation and sale of investment and development property 25.3 – 25.3
Administration expenses (0.4) (0.1) (0.5)
Net finance costs (3.0) (2.8) (5.8)
Deferred tax (3.2) 0.7 (2.5)
Profit after tax 29.7 4.9 34.6
Summarised balance sheet
Investment and development property 245.8 102.5 348.3
Other non-current assets 0.7 – 0.7
Current assets 7.0 2.6 9.6
Partners’ loans1 96.5 – 96.5
Current liabilities (7.0) (10.4) (17.4)
Non-current liabilities (124.4) (75.0) (199.4)
Net assets 218.6 19.7 238.3
Capital commitments 0.4 – 0.4
1 Eliminates on consolidation.

91 www.capitalandcounties.com
ou
r busin
ess perform
an
ce
Ho
w w
e go
vern o
ur bu
siness
ou
r fina
nc
ial statem
ents
un
dersta
nd
ing
ou
r busin
ess
18 JOINT VENTURES CONTINUED 2010
The Great Capital
Partnership £m
The EmpressState LimitedPartnership
£mTotal
£m
Summarised income statement
Gross rental income 16.1 6.6 22.7
Net rental income 13.6 6.5 20.1
Gain on revaluation and sale of investment and development property 33.5 8.1 41.6
Administration expenses (0.4) (0.1) (0.5)
Net finance costs (5.8) (5.6) (11.4)
Deferred tax – (2.5) (2.5)
Profit after tax 40.9 6.4 47.3
Summarised balance sheet
Investment and development property 264.2 102.5 366.7
Other non-current assets 1.0 – 1.0
Current assets 7.9 2.7 10.6
Partners’ loans1 113.8 – 113.8
Current liabilities (6.8) (5.4) (12.2)
Non-current liabilities (124.2) (85.0) (209.2)
Net assets 255.9 14.8 270.7
Capital commitments 1.2 – 1.2
1 Eliminates on consolidation.
Joint ventures are accounted for in the Group accounts using proportional consolidation. The Group’s share of the assets, liabilities, income and expenditure shown above are included in the consolidated financial statements on a line-by-line basis. All joint ventures are held with other joint venture investors on a 50:50 basis.
Joint ventures comprise The Great Capital Partnership (“GCP”) and The Empress State Limited Partnership (“ESLP”).
GCP was established in 2007 with our partner, Great Portland Estates plc, to own, manage and develop a number of central London properties. GCP’s properties are located in central London’s prime property markets, with the largest concentration being in the West End around Piccadilly and Regent Street. All major decisions are taken by the Board of GCP’s General Partner, through which the Group shares in the overall strategic control of the estate. GCP has a 31 March year end reporting date. The proportionate share of the results of GCP have been included in the Group accounts for the period ended 31 December.
ESLP owns and manages the Empress State Building adjacent to the Group’s property at Earls Court in central London. The partnership was established in 2008 with our partner, Land Securities Group PLC. All major decisions are taken by the Board of ESLP’s General Partner, through which the Group shares strategic control.
19 AVAILABLE FOR SALE INVESTMENTS
Group2011
£m
Group2010
£m
Harvest China Real Estate Fund I 19.5 33.8
Harvest China Real Estate Fund II – 32.5
Available for sale investments 19.5 66.3
The Group has a 20 per cent limited partnership interest in Harvest China Real Estate Fund I, which has interests in a number of real estate projects in China. The divestment of the Group’s 50 per cent interest in Harvest China Real Estate Fund II completed in 2011 with the sale of the fund’s real estate projects. Harvest China Real Estate Fund II was dissolved on 22 December 2011.
Whilst the Group was a limited partner in both funds, it had no interest or voting power in the General Partner which controls the partnership and which makes all the investment and distribution decisions. These investments are carried at fair value based on the market value of the underlying properties.
The total cost of these investments was £9.3 million (2010 – £33.3 million).

our financial statements
92
NOTES TO THE ACCOUNTS CONTINUED
20 TRADE AND OTHER RECEIVABLES
Group2011
£m
Group 2010
£m
Company 2011
£m
Company2010
£m
Amounts falling due after more than one year
Loan notes receivable 3.4 3.4 – –
Other receivables1 15.4 – – 1.1
Prepayments and accrued income 15.4 9.0 – –
Trade and other receivables 34.2 12.4 – 1.1
Amounts falling due within one year
Rents receivable 15.2 10.2 – –
Amounts owed by subsidiary undertakings – – 369.1 277.2
Tax recoverable – – – 0.3
Loan notes receivable – 2.9 – –
Other receivables2 2.9 5.2 – 0.2
Prepayments and accrued income 8.6 8.5 – –
Trade and other receivables 26.7 26.8 369.1 277.7
1 Includes £15 million exclusivity payment with LBHF.
2 Includes exhibition trade receivables.
Amounts owed by subsidiary undertakings are unsecured, repayable on demand and, for amounts falling within formalised loan agreements, interest bearing.
Included within prepayments and accrued income are tenant lease incentives of £14.9 million (2010 – £9.6 million).
21 TRADING PROPERTY
Group 2011
£m
Group2010
£m
Undeveloped sites 0.2 0.3
Trading property 0.2 0.3
The estimated replacement cost of trading properties based on market value amounted to £1.2 million (2010 – £1.4million). During the year impairment charges of £0.1 million (2010 – £0.1 million) were recorded against trading property.
22 CASH AND CASH EQUIVALENTS
Group 2011
£m
Group2010
£m
Cash at hand 20.6 12.7
Cash on short-term deposit 63.0 169.8
Unrestricted cash and cash equivalents 83.6 182.5
Restricted cash 6.0 6.0
Cash and cash equivalents 89.6 188.5
Restricted cash relates to amounts placed on deposit in accounts which are subject to withdrawal conditions.

93 www.capitalandcounties.com
ou
r busin
ess perform
an
ce
Ho
w w
e go
vern o
ur bu
siness
ou
r fina
nc
ial statem
ents
un
dersta
nd
ing
ou
r busin
ess
23 DERIVATIVE FINANCIAL INSTRUMENTS
Derivative assets held for trading
Group2011
£m
Group2010
£m
Amounts falling due after more than one year
Interest rate collars 0.4 –
Derivative financial instruments 0.4 –
Amounts falling due within one year
Interest rate options 0.6 –
Derivative financial instruments 0.6 –
Derivative liabilities held for trading
Amounts falling due after more than one year
Interest rate swaps (36.9) (52.9)
Interest rate options – (1.0)
Derivative financial instruments (36.9) (53.9)
Amounts falling due within one year
Interest rate swaps (0.5) –
Derivative financial instruments (0.5) –
24 TRADE AND OTHER PAYABLES
Group2011
£m
Group 2010
£m
Company2011
£m
Company2010
£m
Amounts falling due within one year
Rents received in advance 21.9 22.0 – –
Accruals and deferred income 28.0 26.5 0.4 1.7
Trade payables 0.4 – – –
Other payables1 9.3 14.2 – –
Other taxes and social security 22.8 2.3 – –
Trade and other payables 82.4 65.0 0.4 1.7
1 Includes sundry payables and amounts due to joint venture partners.

our financial statements
94
NOTES TO THE ACCOUNTS CONTINUED
25 BORROWINGS, INCLUDING FINANCE LEASES 2011
Group
Carryingvalue
£mSecured
£mUnsecured
£m
Fixed rate £m
Floating rate £m
Fairvalue
£m
Amounts falling due within one year
Bank loans and overdrafts 11.5 11.5 – – 11.5 11.5
Loan notes 2017 6.0 6.0 – – 6.0 6.0
Borrowings, excluding finance leases 17.5 17.5 – – 17.5 17.5
Finance lease obligations 1.2 1.2 – 1.2 – 1.2
Amounts falling due within one year 18.7 18.7 – 1.2 17.5 18.7
Amounts falling due after more than one year
Bank loans 2013 270.0 270.0 – – 270.0 270.0
Bank loan 2016 145.3 145.3 – – 145.3 145.3
Bank loan 2017 111.6 111.6 – – 111.6 111.6
Borrowings, excluding finance leases 526.9 526.9 – – 526.9 526.9
Finance lease obligations 7.7 7.7 – 7.7 – 7.7
Amounts falling due after more than one year 534.6 534.6 – 7.7 526.9 534.6
Total borrowings 553.3 553.3 – 8.9 544.4 553.3
Cash and cash equivalents (89.6)
Net debt 463.7
2010
Group
Carryingvalue
£mSecured
£mUnsecured
£m
Fixed rate £m
Floating rate £m
Fairvalue
£m
Amounts falling due within one year
Bank loans and overdrafts 6.2 6.2 – – 6.2 6.2
Loan notes 2017 6.0 6.0 – – 6.0 6.0
Borrowings, excluding finance leases 12.2 12.2 – – 12.2 12.2
Finance lease obligations 0.9 0.9 – 0.9 – 0.9
Amounts falling due within one year 13.1 13.1 – 0.9 12.2 13.1
Amounts falling due after more than one year
Bank loan 2012 124.3 124.3 – – 124.3 124.3
Bank loans 2013 409.7 409.7 – – 409.7 409.7
Bank loan 2017 111.6 111.6 – – 111.6 111.6
Borrowings, excluding finance leases 645.6 645.6 – – 645.6 645.6
Finance lease obligations 5.9 5.9 – 5.9 – 5.9
Amounts falling due after more than one year 651.5 651.5 – 5.9 645.6 651.5
Total borrowings 664.6 664.6 – 6.8 657.8 664.6
Cash and cash equivalents (188.5)
Net debt 476.1

95 www.capitalandcounties.com
ou
r busin
ess perform
an
ce
Ho
w w
e go
vern o
ur bu
siness
ou
r fina
nc
ial statem
ents
un
dersta
nd
ing
ou
r busin
ess
25 BORROWINGS, INCLUDING FINANCE LEASES CONTINUED
Analysis of movement in net debt for the year ended 31 December 2011
Cash andcash
equivalents£m
Current borrowings
£m
Non-current
borrowings£m
Netdebt£m
Balance at 1 January 2011 188.5 (13.1) (651.5) (476.1)
Borrowings repaid (259.4) – 259.4 –
Borrowings drawn down 145.8 – (145.8) –
Other net cash movements 14.7 – – 14.7
Other non-cash movements – (5.6) 3.3 (2.3)
Balance at 31 December 2011 89.6 (18.7) (534.6) (463.7)
Analysis of movement in net debt for the year ended 31 December 2010
Cash andcash
equivalents£m
Current borrowings
£m
Non-current
borrowings£m
Netdebt£m
Balance at 1 January 2010 19.3 (71.0) (655.4) (707.1)
Funding from Capital Shopping Centres Group 244.0 – – 244.0
Borrowings repaid (68.0) – 68.0 –
Borrowings drawn down 6.0 (6.0) – –
Other net cash movements (12.8) – – (12.8)
Other non-cash movements – 63.9 (64.1) (0.2)
Balance at 31 December 2010 188.5 (13.1) (651.5) (476.1)
The market value of investment and development property secured as collateral against borrowings is £1,431.7 million (2010 – £ 1,370.8 million).
The fair values of financial assets and liabilities have been established using the market value, where available. For those instruments without a market value, a discounted cash flow approach has been used.
The maturity profile of gross debt (excluding finance leases) is as follows:
Group2011
£m
Group2010
£m
Wholly repayable within one year 17.5 12.2
Wholly repayable in more than one year but not more than two years 270.0 125.0
Wholly repayable in more than two years but not more than five years 145.3 409.1
Wholly repayable in more than five years 111.6 111.5
544.4 657.8
Certain borrowing agreements contain financial and other conditions that, if contravened, could alter the repayment profile. See disclosures regarding financial covenants on page 118.

our financial statements
96
NOTES TO THE ACCOUNTS CONTINUED
26 FINANCE LEASE OBLIGATIONS
Group 2011
£m
Group2010
£m
(a) Minimum lease payments under finance leases fall due
Not later than one year 1.2 0.9
Later than one year and not later than five years 4.7 3.6
Later than five years 29.3 22.6
35.2 27.1
Future finance charges on finance leases (26.3) (20.3)
Present value of finance lease liabilities 8.9 6.8
(b) Present value of minimum finance lease obligations
Not later than one year 1.2 0.9
Later than one year and not later than five years 3.8 3.6
Later than five years 3.9 2.3
8.9 6.8
Finance lease liabilities are in respect of leasehold investment property. Certain leases provide for payment of contingent rent, usually a proportion of net rental income, in addition to the rents above.
Finance lease liabilities are effectively secured obligations, as the rights to the leased asset revert to the lessor in the event of default.
27 OPERATING LEASES The Group earns rental income by leasing its investment properties to tenants under operating leases.
In the United Kingdom standard commercial leases vary considerably between markets and locations but typically are for a term of five to 15 years at market rent with provisions to review to market rent every five years.
The future minimum lease amounts receivable under non-cancellable operating leases are as follows:
Group 2011
£m
Group2010
£m
Not later than one year 65.5 66.2
Later than one year and not later than five years 203.5 213.4
Later than five years 225.9 242.7
494.9 522.3
The income statement includes £0.1 million (2010 – £0.1 million) recognised in respect of expected increased rent resulting from outstanding reviews where the actual rent will only be determined on settlement of the rent review.
The future minimum lease amounts payable under non-cancellable operating leases are as follows:
Group 2011
£m
Group2010
£m
Not later than one year 0.5 0.2
Later than one year and not later than five years 1.2 1.7
Later than five years – –
1.7 1.9

97 www.capitalandcounties.com
ou
r busin
ess perform
an
ce
Ho
w w
e go
vern o
ur bu
siness
ou
r fina
nc
ial statem
ents
un
dersta
nd
ing
ou
r busin
ess
28 FINANCIAL RISK MANAGEMENT The Group is exposed to a variety of risks arising from the Group’s operations: market risk (including interest rate risk, foreign exchange risk, and market price risk), liquidity risk and credit risk.
The majority of the Group’s financial risk management is carried out by Group Treasury under policies approved by the Board of Directors. The policies for managing each of these risks and the principal effects of these policies on the results for the year are summarised below.
Market risk (a) Interest rate risk Interest rate risk comprises both cash flow and fair value risks.
Cash flow interest rate risk is the risk that the future cash flows of a financial instrument will fluctuate due to changes in market interest rates. Fair value risk is the risk that the fair value of financial instruments will fluctuate as a result of changes in market interest rates.
The Group’s interest rate risk arises from borrowings issued at variable rates that expose the Group to cash flow interest rate risk, whereas borrowings issued at fixed interest rates expose the Group to fair value interest rate risk.
Bank debt is typically at floating rates linked to LIBOR.
It is Group policy, and often a requirement of our lenders, to eliminate substantially all short and medium-term exposure to interest rate fluctuations in order to establish certainty over medium-term cash flows by using floating to fixed interest rate swaps. Swaps have the economic effect of converting borrowings from floating to fixed rates. Interest rate collars protect the Group by capping the maximum interest rate paid at the collar’s ceiling but sacrifices the profitability of interest rate falls below a certain floor. Interest rate swaptions provide the Group with the right but not the obligation to enter into an interest rate swap on a specific future date at a set rate.
As a consequence, the Group is exposed to market price risk in respect of the fair value of its fixed rate derivative financial instruments, as discussed in the financial review on pages 38 to 43.
The table below shows the effects of derivative contracts that are linked to the borrowings profile of the Group:
Fixed2011
£m
Floating 2011
£m
Fixed2010
£m
Floating2010
£m
Borrowings 8.9 544.4 6.8 657.8
Derivative impact (nominal value of derivative contracts) 515.1 (515.1) 624.7 (624.7)
Borrowings profile net of derivative impact 524.0 29.3 631.5 33.1
Interest rate protection 94.6% 95.0%
Group policy is to ensure that interest rate protection is within the range of 75 per cent to 100 per cent.
The weighted average rate of interest rate swaps currently effective is 4.5 per cent (2010 – 4.8 per cent).
The approximate impact of a 50 basis point shift upwards in the level of interest rates would have a positive impact on the movement in fair value of derivative financial instruments recognised in the income statement of £10.0 million (2010 – £9.8 million). The approximate impact of a 50 basis point shift downwards in the level of interest rates would have a negative impact on the movement in fair value of derivative financial instruments recognised in the income statement of £10.0 million (2010 – £9.8 million). In practice, a parallel shift in the yield curve is highly unlikely. However, the sensitivity analysis above is a reasonable illustration of the possible effect from the changes in slope and shifts in the yield curve that may actually occur and represents management’s assessment of possible changes in interest rates. Because the fixed rate derivative financial instruments are matched by short-term floating rate debt, the overall effect on Group cash flow of such a movement would be very small.
(b) Foreign exchange risk The Group’s largest exposure to foreign exchange movements is in respect of its investments in the Chinese investment fund which is denominated in US dollars. The Group’s policy is generally not to hedge foreign currency exposures that are less than 15 per cent of its net assets. Foreign currency exposures in excess of this amount, as far as practicable, will be hedged by borrowing in foreign currencies and through entering into cross-currency interest rate swaps and forward exchange contracts.
The approximate impact of a 10 per cent strengthening of sterling against the US dollar would have decreased the net gain taken directly to equity for the year ended 31 December 2011 by £1.8 million (2010 –£6.0 million). The approximate impact of a 10 per cent weakening of sterling against the US dollar would have increased the net gain taken directly to equity for the year ended 31 December 2011 by £2.0 million (2010 –£6.6 million). This represents management’s assessment of possible changes in exchange rates.

our financial statements
98
NOTES TO THE ACCOUNTS CONTINUED
28 FINANCIAL RISK MANAGEMENT CONTINUED (c) Market price risk The financial results are subject to movements in the value of underlying investment properties, interest rates and economic sentiment.
A one percent increase in the valuation of investment and development property would increase the valuation of investment and development property in the income statement by £16.2 million. A one per cent decrease in the valuation of investment and development property would decrease the gain on revaluation of investment and development property in the income statement by £16.2 million. For further information on covenant positions on investment and development property refer to page 118.
Liquidity risk Liquidity risk is managed to ensure that the Group is able to meet future payment obligations when financial liabilities fall due. Liquidity analysis is intended to provide sufficient headroom to meet the Group’s operational requirements and investment commitments. The Group’s treasury policy also includes maintaining adequate cash, as well as maintaining adequate committed facilities.
A key factor in ensuring existing facilities remain available to the Group is the borrowing entities’ ability to meet the relevant facilities’ financial covenants. The Group has a process to monitor regularly both current and projected compliance with the financial covenants. A detailed analysis of the Group’s financial covenant position is set out on page 118.
The Group’s policy is to seek to minimise its exposure to liquidity risk by managing its exposure to interest rate risk and to refinancing risk. The Group seeks to borrow for as long as possible at the lowest acceptable cost.
The Group regularly reviews the maturity profile of its financial liabilities and will seek to avoid concentrations of maturities through the regular replacement of facilities and by staggering maturity dates. Refinancing risk may be reduced by reborrowing prior to the contracted maturity date, effectively switching liquidity risk for market risk. This is subject to credit facilities being available at the time of the desired refinancing.
The tables below set out the maturity analysis of the Group’s financial liabilities based on the undiscounted contractual obligations to make payments of interest and to repay principal. Where interest payment obligations are based on a floating rate the rates used are those implied by the par yield curve.
2011
Group
1 yr £m
Interest £m
Principal
Less than
1-2 yrs£m
Interest£m
Principal
Between2-5 yrs
£mInterest
£mPrincipal
Over 5 yrs
£m Interest
£m Principal
Totals£m
Interest£m
Principal
Asset-specific secured borrowings 14.1 11.5 9.5 270.0 23.7 150.0 3.2 112.0 50.5 543.5
Other secured borrowings – 6.0 – – – – – – – 6.0
Finance lease obligations – 1.2 – 1.0 – 1.9 – 4.8 – 8.9
Tax and other payables – 32.5 – – – – – – – 32.5
Interest rate derivatives payable 16.6 – 12.7 – 23.8 – 6.1 – 59.2 –
Interest rate derivatives receivable (3.8) – (3.2) – (9.8) – (2.5) – (19.3) –
26.9 51.2 19.0 271.0 37.7 151.9 6.8 116.8 90.4 590.9
2010
Group
1 yr £m
Interest £m
Principal
Less than1-2 yrs
£mInterest
£mPrincipal
Between2-5 yrs
£mInterest
£mPrincipal
Over 5 yrs
£m Interest
£m Principal
Totals£m
Interest£m
Principal
Asset-specific secured borrowings 12.8 6.2 12.4 125.6 23.4 409.1 10.9 112.0 59.5 652.9
Other secured borrowings – 6.0 – – – – – – – 6.0
Finance lease obligations – 0.9 – 0.9 – 1.8 – 3.2 – 6.8
Tax and other payables – 17.2 – – – – – – – 17.2
Interest rate derivatives payable 30.1 – 24.3 – 32.5 – 12.2 – 99.1 –
Interest rate derivatives receivable (5.2) – (7.5) – (18.7) – (9.6) – (41.0) –
37.7 30.3 29.2 126.5 37.2 410.9 13.5 115.2 117.6 682.9
Contractual maturities reflect the expected maturities of financial instruments.

99 www.capitalandcounties.com
ou
r busin
ess perform
an
ce
Ho
w w
e go
vern o
ur bu
siness
ou
r fina
nc
ial statem
ents
un
dersta
nd
ing
ou
r busin
ess
28 FINANCIAL RISK MANAGEMENT CONTINUED Credit risk Credit risk is the risk of financial loss if a tenant or counterparty fails to meet an obligation under a contract. Credit risk arises primarily from trade receivables relating to tenants but also from the Group’s undrawn commitments and holdings of assets such as cash deposits and loans with financial counterparties.
Credit risk associated with trade receivables is actively managed; tenants are managed individually by asset managers, who continuously monitor and work with tenants, anticipating and wherever possible identifying and addressing risks prior to default.
Prospective tenants are assessed through an internally conducted review process, including obtaining credit ratings and reviewing financial information. As a result deposits or guarantees may be obtained. The amount of deposits held as collateral at 31 December 2011 is £2.0 million (2010 – £1.7 million).
In relation to the Group’s exhibition income, receivables greater than 90 days are fully provided against. Additionally, specific provisions are made for trade receivables less than 90 days where active credit control highlights recoverability issues.
Due to the nature of tenants being managed individually by asset managers, it is the Group’s policy to calculate any impairment specifically on each contract.
The amounts of trade receivables presented in the balance sheet are net of allowances for doubtful receivables.
The ageing analysis of these trade receivables, past due but not impaired, is as follows:
Group2011
£m
Group2010
£m
Up to three months 15.5 9.8
Over three months – 0.4
Trade receivables 15.5 10.2
Also included within receivables are £3.4 million (2010 – £6.3 million) of loan notes. All loan notes have been reviewed for potential impairment and are considered to be receivable as at the year end.
In 2011 trade receivables impaired amounted to £0.3 million (2010 – £0.4 million), this is considered to be an immaterial amount and within budgeted levels given current economic conditions.
The credit risk relating to cash, deposits and derivative financial instruments is actively managed by Group Treasury. Relationships are maintained with a number of Tier 1 institutional counterparties, ensuring compliance with Group policy relating to limits on the credit ratings of counterparties (between BBB+ and AAA).
Excessive credit risk concentration is avoided through adhering to authorised limits for all counterparties.
Counterparty Credit rating Authorised
limit
Group2011
£m
Bank 1 AAA 150.0 30.0
Bank 2 A- 50.0 5.8
Bank 3 A- 50.0 3.5
Bank 4 A+ 75.0 47.8
Bank 5 A 50.0 2.4
Sum of five largest exposures 89.5
Sum of deposits and derivative assets 90.6
Five largest exposures as a percentage of total amount at risk 99%

our financial statements
100
NOTES TO THE ACCOUNTS CONTINUED
28 FINANCIAL RISK MANAGEMENT CONTINUED Classification of financial assets and liabilities The tables below set out the Group’s accounting classification of each class of financial assets and liabilities, and their fair values at 31 December 2011 and 31 December 2010.
The fair values of quoted borrowings are based on the bid price. The fair values of derivative financial instruments are determined from observable market prices or estimated using appropriate yield curves at 31 December each year by discounting the future contractual cash flows to the net present values.
2011
Carryingvalue
£mFair value
£m
(Loss)/gain to income statement
£m
Gainto other
comprehensiveincome
£m
Derivative financial instrument asset 1.0 1.0 (2.4) –
Total held for trading assets 1.0 1.0 (2.4) –
Cash and cash equivalents 89.6 89.6 – –
Other financial assets 61.9 61.9 – –
Total cash and receivables 151.5 151.5 – –
Available for sale investments 19.5 19.5 – 6.3
Total available for sale investments 19.5 19.5 – 6.3
Derivative financial instrument liabilities (37.4) (37.4) 16.5 –
Total held for trading liabilities (37.4) (37.4) 16.5 –
Borrowings (553.3) (553.3) – –
Other financial liabilities (96.4) (96.4) – –
Total loans and payables (649.7) (649.7) – –
2010
Carryingvalue
£mFair value
£m
Loss to income statement
£m
Gainto other
comprehensiveincome
£m
Cash and cash equivalents 188.5 188.5 – –
Other financial assets 39.2 39.2 – –
Total cash and receivables 227.7 227.7 – –
Available for sale investments 66.3 66.3 – 21.5
Total available for sale investments 66.3 66.3 – 21.5
Derivative financial instrument liabilities (53.9) (53.9) (0.3) –
Total held for trading liabilities (53.9) (53.9) (0.3) –
Borrowings (664.6) (664.6) – –
Other financial liabilities (71.0) (71.0) – –
Total loans and payables (735.6) (735.6) – –
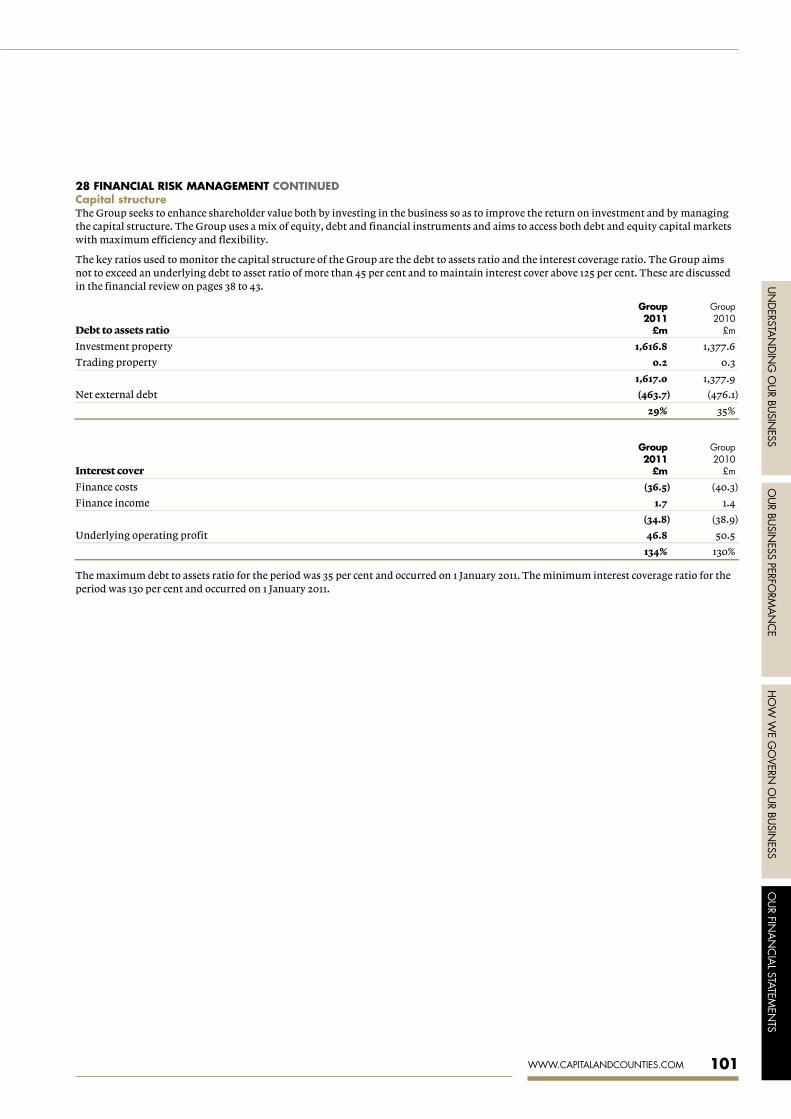
101 www.capitalandcounties.com
ou
r busin
ess perform
an
ce
Ho
w w
e go
vern o
ur bu
siness
ou
r fina
nc
ial statem
ents
un
dersta
nd
ing
ou
r busin
ess
28 FINANCIAL RISK MANAGEMENT CONTINUED Capital structure The Group seeks to enhance shareholder value both by investing in the business so as to improve the return on investment and by managing the capital structure. The Group uses a mix of equity, debt and financial instruments and aims to access both debt and equity capital markets with maximum efficiency and flexibility.
The key ratios used to monitor the capital structure of the Group are the debt to assets ratio and the interest coverage ratio. The Group aims not to exceed an underlying debt to asset ratio of more than 45 per cent and to maintain interest cover above 125 per cent. These are discussed in the financial review on pages 38 to 43.
Debt to assets ratio
Group2011
£m
Group2010
£m
Investment property 1,616.8 1,377.6
Trading property 0.2 0.3
1,617.0 1,377.9
Net external debt (463.7) (476.1)
29% 35%
Interest cover
Group2011
£m
Group2010
£m
Finance costs (36.5) (40.3)
Finance income 1.7 1.4
(34.8) (38.9)
Underlying operating profit 46.8 50.5
134% 130%
The maximum debt to assets ratio for the period was 35 per cent and occurred on 1 January 2011. The minimum interest coverage ratio for the period was 130 per cent and occurred on 1 January 2011.
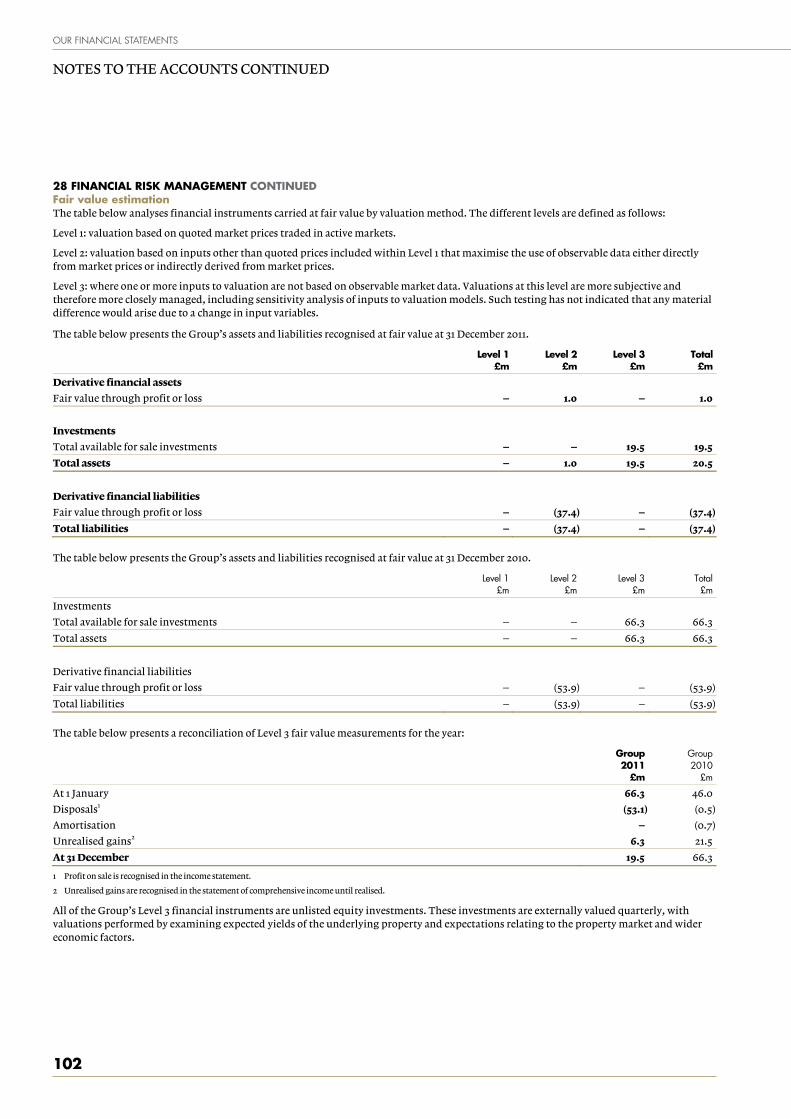
our financial statements
102
NOTES TO THE ACCOUNTS CONTINUED
28 FINANCIAL RISK MANAGEMENT CONTINUED Fair value estimation The table below analyses financial instruments carried at fair value by valuation method. The different levels are defined as follows:
Level 1: valuation based on quoted market prices traded in active markets.
Level 2: valuation based on inputs other than quoted prices included within Level 1 that maximise the use of observable data either directly from market prices or indirectly derived from market prices.
Level 3: where one or more inputs to valuation are not based on observable market data. Valuations at this level are more subjective and therefore more closely managed, including sensitivity analysis of inputs to valuation models. Such testing has not indicated that any material difference would arise due to a change in input variables.
The table below presents the Group’s assets and liabilities recognised at fair value at 31 December 2011.
Level 1
£mLevel 2
£m Level 3
£m Total
£m
Derivative financial assets
Fair value through profit or loss – 1.0 – 1.0
Investments
Total available for sale investments – – 19.5 19.5
Total assets – 1.0 19.5 20.5
Derivative financial liabilities
Fair value through profit or loss – (37.4) – (37.4)
Total liabilities – (37.4) – (37.4)
The table below presents the Group’s assets and liabilities recognised at fair value at 31 December 2010.
Level 1
£mLevel 2
£m Level 3
£m Total
£m
Investments
Total available for sale investments – – 66.3 66.3
Total assets – – 66.3 66.3
Derivative financial liabilities
Fair value through profit or loss – (53.9) – (53.9)
Total liabilities – (53.9) – (53.9)
The table below presents a reconciliation of Level 3 fair value measurements for the year:
Group 2011
£m
Group2010
£m
At 1 January 66.3 46.0
Disposals1 (53.1) (0.5)
Amortisation – (0.7)
Unrealised gains2 6.3 21.5
At 31 December 19.5 66.3
1 Profit on sale is recognised in the income statement.
2 Unrealised gains are recognised in the statement of comprehensive income until realised.
All of the Group’s Level 3 financial instruments are unlisted equity investments. These investments are externally valued quarterly, with valuations performed by examining expected yields of the underlying property and expectations relating to the property market and wider economic factors.

103 www.capitalandcounties.com
ou
r busin
ess perform
an
ce
Ho
w w
e go
vern o
ur bu
siness
ou
r fina
nc
ial statem
ents
un
dersta
nd
ing
ou
r busin
ess
29 DEFERRED TAX PROVISION Under IAS 12 “Income Taxes”, provision is made for the deferred tax assets and liabilities associated with the revaluation of investment properties at the corporate tax rate expected to apply to the Group at the time of use. For United Kingdom properties the relevant tax rate will be 25 per cent (2010 – 27 per cent).
The movements in the year in deferred tax (both recognised and unrecognised) mainly reflect the tax effect of property revaluation gains arising in the year as well as availability of Group losses previously not recognised. The recognised deferred tax liability on investment properties calculated under IAS 12 was £14.1 million at 31 December 2011 (2010 – nil). The IAS 12 calculation does not necessarily reflect the expected amount of tax that would be payable if the assets were sold. The Group estimates that calculated on a disposal basis, by reference to the properties’ original historic tax base costs, the tax liability on a sale at 31 December 2011 would be nil (2010 – £10.4 million). This is due to a number of factors including the availability of losses and indexation relief, the Group holding structure for certain properties and the application of the REIT provisions to disposals within 2 years of the demerger date (May 2010).
The tax basis of properties formerly within the REIT regime will be revised in May 2012 (the second anniversary of the demerger) from their original historic tax base cost to the value at the time of exit. If this latter tax basis had applied at 31 December 2011, the tax liability on a disposal basis would again have been nil.
Group
Acceleratedcapital
allowances£m
Fair value ofinvestment &development
properties£m
Derivativefinancial
instruments£m
Other temporary differences
£m
Grouplosses
£mTotal
£m
Provided deferred tax provision:
At 1 January 2010 14.5 (8.4) (2.9) (3.2) – –
Recognised in income (1.7) 8.4 (9.6) 2.5 – (0.4)
Recognised in other comprehensive income – – – 0.4 – 0.4
At 31 December 2010 12.8 – (12.5) (0.3) – –
Recognised in income 0.4 14.1 3.3 (0.5) (11.6) 5.7
Recognised in other comprehensive income – – – (0.9) – (0.9)
At 31 December 2011 13.2 14.1 (9.2) (1.7) (11.6) 4.8
Unrecognised deferred tax asset:
At 1 January 2011 – (43.3) (2.2) (0.1) (11.0) (56.6)
Movement in the year – 43.3 2.2 0.1 11.0 56.6
At 31 December 2011 – – – – – –
30 OTHER PROVISIONS
Group
Deferred consideration
£m Other
£mTotal
£m
Amounts falling due after more than one year
At 1 January 2010 3.8 0.2 4.0
Credited to the income statement
– remeasurement of deferred consideration (0.7) – (0.7)
At 31 December 2010 3.1 0.2 3.3
Extinguished during the year – (0.2) (0.2)
Reclassified to current liabilities (3.1) – (3.1)
At 31 December 2011 – – –
Amounts falling due within one year
At 1 January 2010 – – –
At 31 December 2010 – – –
Reclassified from non-current liabilities 3.1 – 3.1
Charged to income statement
– remeasurement of deferred consideration 4.2 – 4.2
At 31 December 2011 7.3 – 7.3
Deferred consideration is the amount payable on the 2009 acquisition of the non-controlling interests’ share in Earls Court & Olympia. The amount of deferred consideration payable is based on a number of factors including a potential redevelopment of the Earls Court & Olympia site, with the final details of such a redevelopment dependent on discussions with the owners of the adjacent land and the outcome of the planning permission process which is anticipated to conclude in 2012. The maximum potential payment is £20.0 million.

our financial statements
104
NOTES TO THE ACCOUNTS CONTINUED
31 SHARE CAPITAL AND SHARE PREMIUM
Group
Share capital
£m
Sharepremium
£m
Issued and fully paid:
At 31 December 2010 – 621,828,502 ordinary shares of 25p each 155.4 89.1
Shares issued: 62,100,000 ordinary shares of 25p each 15.5 6.0
At 31 December 2011 – 683,928,502 ordinary shares of 25p each 170.9 95.1
Company
Share capital
£m
Sharepremium
£m
Issued and fully paid:
At 31 December 2010 – 621,828,502 ordinary shares of 25p each 155.4 89.1
Shares issued: 62,100,000 ordinary shares of 25p each 15.5 6.0
At 31 December 2011 – 683,928,502 ordinary shares of 25p each 170.9 95.1
In May 2011, the Company completed a placing of 62.1 million new ordinary shares at a price of 162 pence per share. The placing generated gross proceeds of £100.6 million, £96.6 net of expenses.
Full details of the rights and obligations attached to the ordinary shares are contained in the Company’s Articles of Association. These rights include an entitlement to receive the Company’s Report and Accounts, to attend and speak at General Meetings of the Company, to appoint proxies and to exercise voting rights. Holders of ordinary shares may also receive dividends and may receive a share of the Company’s assets on the Company’s liquidation. There are no restrictions on the transfer of the ordinary shares. For information about the company’s capital structure at demerger, please see information on page 117.
At 28 February 2012, the Company had an unexpired authority to repurchase shares up to a maximum of 62,182,850 shares with a nominal value of £15.5 million, and the Directors had an unexpired authority to allot up to a maximum of 352,037,782 shares with a nominal value of £88.0 million of which 207,068,891 with a nominal value of £51.8 million can only be allotted pursuant to a fully pre-emptive rights issue.
32 CAPITAL COMMITMENTS At 31 December 2011, the Group was contractually committed to £14 million (2010 – £45 million) of future expenditure for the purchase, construction, development and enhancement of investment property. Of the £14 million committed, £13.3 million is committed 2012 expenditure. The Group’s share of joint venture commitments included within this amount was £0.4 million (2010 – £1.2 million).
33 CONTINGENT LIABILITIES As at 31 December 2011, the Group has no contingent liabilities (2010 – nil).

105 www.capitalandcounties.com
ou
r busin
ess perform
an
ce
Ho
w w
e go
vern o
ur bu
siness
ou
r fina
nc
ial statem
ents
un
dersta
nd
ing
ou
r busin
ess
34 CASH GENERATED FROM OPERATIONS
Notes
Group2011
£m
Group 2010
£m
Company2011
£m
Company2010
£m
Profit before tax 161.9 132.5 3.9 (2.7)
Adjustments for:
Gain on revaluation of investment and development property 4 (119.4) (133.3) – –
Gain on sale of investment property 4 (3.9) (1.3) – –
Profit on sale of available for sale investments 5 (30.5) – – –
Remeasurement of deferred consideration 4.2 (0.7) – –
Write down of trading property 0.1 0.1 – –
Impairment of other receivables – 1.6 – –
Depreciation 0.2 0.1 – –
Impairment of investment in Group company – – 0.1 –
Amortisation of lease incentives and other direct costs 0.5 2.5 0.8 –
Finance costs 10 36.5 40.3 – –
Finance income (1.7) (1.4) – –
Other finance costs 10 14.5 7.1 (4.1) –
Change in fair value of derivative financial instruments (14.1) 0.3 – –
Change in working capital:
Change in trading properties – (0.1) – –
Change in trade and other receivables (7.2) (3.9) (92.1) 4.4
Change in trade and other payables (3.1) (5.2) – 1.7
Cash generated from operations 38.0 38.6 (91.4) 3.4

our financial statements
106
NOTES TO THE ACCOUNTS CONTINUED
35 PRINCIPAL SUBSIDIARY UNDERTAKINGS The principal subsidiary undertakings, all of which are included in the consolidated accounts, are shown below. A full list of Group companies will be included in the Company’s next annual return in accordance with Section 410 of the Companies Act 2006.
Company and principal activity Class of share capital % held
Capital & Counties Limited (holding Company) and its subsidiary undertakings: Ordinary shares of 25p each 100
Seagrave Road GP Limited* acting as General Partner of Seagrave Road LP (property) Ordinary shares of £1 each 100
EC Properties GP Limited* acting as General Partner of EC Properties LP (property) Ordinary shares of £1 each 100
Covent Garden Restaurants Limited (holding Company) and its principal subsidiary undertaking: Ordinary shares of £1 each 100
Tuttons Brasserie Limited (restaurant) Ordinary shares of £1 each 100
C&C Properties UK Limited (property) Ordinary shares of £1 each 100
Capital & Counties CG Limited* acting as General Partner of Capital & Counties CGP (property) Ordinary shares of £1 each 100
Capital & Counties CG 9 Limited* acting as General Partner of Capital & Counties CGP 9 (property) and its principal subsidiary undertaking: Ordinary shares of £1 each 100
Capco Floral Place Limited (property) Ordinary shares of £1 each 100
Capco CG 2010 Limited* acting as General Partner of Capco CGP 2010 LP (property) Ordinary shares of £1 each 100
Capvestco Limited (property and financing) (Jersey) and its principal subsidiary undertaking: Ordinary shares of £1 each 100
Capvestco China Limited (Investments) (Jersey) Ordinary shares of £1 each 100
C&C Properties (Jersey) Limited (financing) (Jersey) Ordinary shares of £1 each 100
Capital & Counties Asset Management Limited (investment management) Ordinary shares of £1 each 100
EC Properties Limited* (holding Company) and its principal subsidiary undertaking: “A” Ordinary shares of £0.01 each 100
“B” Ordinary shares of £0.01 each 100
Martineau Properties Limited (property) Ordinary shares of £1 each 100
Earls Court & Olympia Group Limited* (financing) and its principal subsidiary undertaking: Ordinary shares of £1 each 100
Earls Court and Olympia Limited (venues) and its principal subsidiary undertakings: Ordinary shares of £1 each 100
Earls Court Limited (venues) Ordinary shares of £1 each 100
Olympia Limited (venues) Ordinary shares of £1 each 100
The Brewery by EC&O Limited (venues) Ordinary shares of £1 each 100
C&C Management Services Limited (services) Ordinary shares of £1 each 100
Capco Group Treasury Limited (treasury management) Ordinary shares of £1 each 100
* Shareholdings in companies marked * are held by intermediate subsidiary undertakings.
The companies listed above are those subsidiary undertakings whose results or financial position, in the opinion of the Directors, principally affected the figures in the Company’s annual accounts.
Companies are incorporated and registered in England and Wales unless otherwise stated.

107 www.capitalandcounties.com
ou
r busin
ess perform
an
ce
Ho
w w
e go
vern o
ur bu
siness
ou
r fina
nc
ial statem
ents
un
dersta
nd
ing
ou
r busin
ess
36 RELATED PARTY TRANSACTIONS Transactions between the Company and its subsidiaries, which are related parties, have been eliminated on consolidation for the Group.
Significant transactions between the Parent Company and its subsidiaries are shown below:
Subsidiary Nature of transaction 2011
£m 2010
£m
Capital & Counties Limited Assignment of investment on demerger – 444.4
Capital & Counties Asset Management Limited Assignment of investment on demerger – 1.1
C&C Management Services Limited Assignment of investment on demerger – 1.0
Capco Group Treasury Limited Assignment of loan on demerger – 281.3
Capricorn Capital (Jersey) Limited Acquisition and subsequent redemption of preference shares 89.4 –
Capco Group Treasury Limited Interest 4.1 2.7
Significant balances outstanding between the Parent Company and its subsidiaries are shown below:
Amounts owed by subsidiaries
Amounts owed to subsidiaries
2011
£m2010
£m 2011
£m2010
£m
Subsidiary
Capco Group Treasury Limited 369.1 277.2 – –
The amount due from Capco Group Treasury Limited is unsecured, interest bearing at the Bank of England base rate plus one per cent and repayable on demand.
Key management compensation1 2011
£m 2010
£m
Salaries and short-term employee benefits 2.8 2.2
Pensions and other post-employment benefits 0.1 0.2
Share-based payments 1.4 0.5
4.3 2.9
1 The Directors of Capital & Counties Properties PLC have been determined to be the only individuals with authority and responsibility for planning, directing and controlling the activities of the Company.
37 DIRECTORS’ EMOLUMENTS The details of individual Directors’ remuneration and pension benefits as set out in the tables contained in the Directors’ remuneration report on pages 61 to 68 form part of these financial statements.
38 SHARE-BASED PAYMENTS The Group operates a number of share-based payment schemes relating to employee benefits and incentives. All schemes are equity settled, as such the cost recognised relates to the fair value of equity instruments determined at the grant date of the instruments. The expense is recognised on a straight-line basis over the vesting period based on Group estimates of the number of shares that are expected to vest.
Reconciliations of movements in incentive schemes are given in the tables on pages 108 to 110.

our financial statements
108
NOTES TO THE ACCOUNTS CONTINUED
38 SHARE-BASED PAYMENTS CONTINUED Share Option Scheme Market value options to subscribe for ordinary shares may be awarded under the Capital & Counties Properties PLC Performance Share Plan.
Exercise is subject to appropriately challenging performance conditions determined by the Remuneration Committee at the time of grant. For awards made in 2010 and 2011, awards are subject to performance conditions relating to:
(a) the Company’s total return (“TR”) over three consecutive financial years (the “TR Performance Period”) relative to the median of the TRs over the equivalent period of Capital Shopping Centres Group PLC, Land Securities Group PLC, British Land Company plc, Hammerson plc, Segro plc, Derwent London plc, Great Portland Estates plc and Shaftesbury plc (the “Comparator Group”); and
(b) the Company’s total shareholder return (“TSR”) over a period of three years (the “TSR Performance Period”) relative to the median of the TSRs over the same period of the Comparator Group.
One half of each award will be subject to the TR performance condition and the other half to the TSR performance condition.
TR is the growth in the adjusted, diluted net asset value per ordinary share plus dividends per ordinary share paid during the TR performance period. In calculating TR for a company which is not a REIT, any provision for contingent capital gains tax will be added back. For full vesting to be achieved, the target is median +2.5 per cent per annum.
TSR is the increase in the price of an ordinary share plus the value of any dividends paid during the TSR performance period re-invested in ordinary shares. For full vesting to be achieved, the target is median +4 per cent per annum.
For performance at median, 33 per cent of an award will vest. For intermediate performance above median, vesting will be on a straight-line basis from 33 per cent to 100 per cent.
In order for any awards to vest, the Committee must satisfy itself that TR and TSR performance figures are a genuine reflection of underlying financial performance.
Where events occur which cause the Committee to consider that the performance conditions have become inappropriate or impractical, the Committee may amend, relax or waive such conditions as it deems appropriate, provided that the conditions after the changes are not materially tougher or easier to achieve than was intended at the outset.
During any performance period, the Committee may, at its discretion, remove from the Comparator Group a company which has ceased to be quoted or to exist or the relevance of which as a comparator has, in the opinion of the Committee, significantly diminished. The Committee may also, at its discretion, add to the Comparator Group (whether to replace a removed member or otherwise) if it believes that such addition will enhance the relevance of the Comparator Group.
The options have a vesting period of three years and a maximum contractual life of ten years. In general options are forfeited if the employee leaves the Group before the options vest.
A schedule to the PSP was approved by HMRC as a CSOP scheme on 15 March 2011, therefore the company now makes a proportion of awards as approved options.
Share options outstanding at 31 December 2011 were exercisable between 103.87 pence and 176.33 pence and have a weighted average remaining contractual life of 9.2 years.
The total expense recognised in the income statement in respect of share options for the year ended 31 December 2011 was £1.7 million (2010 – £0.5 million).
Market Value Option Awards Year of grant 2010 2010 2010 2010 2011 2011
Exercise price (pence) 103.87 113.27 115.93 125.40 157.73 176.33
Outstanding at 1 January 2011 6,857,395 22,071 43,129 325,956 – –
Awarded during the year – – – – 1,785,495 355,632
Forfeited during the year (162,943) – – – (48,990) –
Vested during the year – – – – – –
Exercised during the year – – – – – –
Outstanding at 31 December 2011 6,694,452 22,071 43,129 325,956 1,736,505 355,632
Exercisable:
from 2013 2013 2013 2013 2014 2014
to 2020 2020 2020 2020 2021 2021
Conditional awards of free shares, which may be awarded as nil cost options, may also be awarded under the Performance Share Plan.

109 www.capitalandcounties.com
ou
r busin
ess perform
an
ce
Ho
w w
e go
vern o
ur bu
siness
ou
r fina
nc
ial statem
ents
un
dersta
nd
ing
ou
r busin
ess
38 SHARE-BASED PAYMENTS CONTINUED The following awards of nil cost options were made during 2011:
Nil cost options awards Year of Grant 2011
Exercise price (pence) Nil
Outstanding at 1 January 2011 –
Awarded during the year 1,065,109
Forfeited during the year –
Vested during the year –
Exercised during the year –
Outstanding at 31 December 2011 1,065,109
Fair value of share-based payments The fair value of share options are calculated using the Black-Scholes option pricing model. Inputs to the model for options awarded during the year are as follows:
Option grant date 28 May
20106 Aug2010
20 Aug2010
7 Sept2010
21 Mar 2011
21 Mar 2011
22 Dec 2011
Weighted average share price
Exercise price at grant date 103.87 113.27 115.93 124.4 157.73 0 176.33
Expected option life in years 5 years 5 years 5 years 5 years 5 years 5 years 4 years
Risk-free rate 1.19%
to 2.29%0.81%
to 1.77%0.81%
to 1.77%0.91%
to 1.92%1.54%
to 2.49% 1.54%
to 2.49%0.34%
to 0.77%
Expected volatility 35% 35% 35% 35% 30% 30% 27%
Expected dividend yield* 1.1% 1.1% 1.1% 1.1% 1.1% 1.1% 0.9%
Value per option 13p 15p 14p 19p 21p 75p 30p
* Expected dividend yield is based on public pronouncements about future dividend levels, all other measures are based on historical data.
Matching Share Plan Under the Capital & Counties Properties PLC Matching Share Plan, deferred shares may be awarded as part of any bonus. Awards may also be made as nil cost options.
The release of deferred share awards is not dependent on the achievement of any further performance conditions other than that participants remain employed by the Group for a specified time, typically three years, from the date of the award. Awards of nil cost options were made in 2011. The fair value of share awards will be determined by the market price of the shares at the grant date. The weighted average share price during the year was 172p (2010 – 127.1p).
Deferred Shares – nil cost options Year of Grant 2011
Exercise price (pence) Nil
Outstanding at 1 January 2011 –
Awarded during the year 525,256
Forfeited during the year –
Vested during the year –
Exercised during the year –
Outstanding at 31 December 2011 525,256
Under the Matching Share Plan, awards which may be awarded as nil cost options, may also be made in respect of certain shares purchased by Directors or in respect of awards of the deferred shares or nil cost options described above made under the Company’s annual bonus scheme. The matching share award comprises the same number of shares as are purchased or deferred except in certain circumstances where the matching awards may comprise or be increased to 200 per cent of the number of shares purchased or deferred.
Vesting of matching shares and matching nil cost options is subject to appropriately challenging performance conditions. Vesting of matching shares will occur on the later of the third anniversary of grant and the date on which the performance outcome is finally determined. The matching nil cost options have a vesting period of three years and a maximum contractual life of ten years. The performance conditions that apply to the awards of matching shares made in 2011 are the same as those that apply to the awards of options made under the Performance Share Plan during 2010 and 2011.
Matching shares and matching nil cost options generally lapse if the Director leaves the Company or sells any of the related purchased or deferred shares.

our financial statements
110
NOTES TO THE ACCOUNTS CONTINUED
38 SHARE-BASED PAYMENTS CONTINUED Matching Share Scheme – Share Awards Year of grant 2011 2010
Outstanding at 1 January 2011 1,251,984 –
Awarded during the year – 1,251,984
Forfeited during the year – –
Vested during the year – –
Outstanding at 31 December 2011 1,251,984 1,251,984
All MSP awards made in 2011 were made as nil cost options.
Matching Share Plan – nil cost options Year of Grant 2011
Exercise price (pence) Nil
Outstanding at 1 January 2011 –
Awarded during the year 1,352,468
Forfeited during the year –
Vested during the year –
Exercised during the year –
Outstanding at 31 December 2011 1,352,468
The Chairman does not participate in the Partnership Share Plan or Matching Share Plan, however for any shares purchased within 12 months of the demerger and with a value of 150 per cent of his base fee, the Company made a 1:1 matching award of deferred shares on a gross of tax basis. The Chairman’s matching share award carries no performance conditions and will vest on the third anniversary of the date of demerger subject to the Chairman remaining in office for three years and having retained ownership of his invested shares. The Chairman invested more than 150 per cent of his base fee in the Company’s shares during 2010, and accordingly an award of 529,536 deferred shares was made to him on 1 September 2010.
39 PENSIONS (a) Current pension arrangements Earls Court & Olympia group (“EC&O”) has a hybrid pension scheme comprising an ongoing money purchase section and a final salary section which closed to new members in 2000, and closed to future benefit accrual on 31 December 2011. The final salary section is a funded defined benefit scheme which is contracted out of State Second Pension.
The Group’s current policy is largely to provide future retirement benefits through defined contribution arrangements.
(b) Pension costs (i) Defined benefit scheme Amounts are recognised in the income statement in respect of EC&O’s pension scheme (the “Scheme”).
Amounts recognised in respect of the Scheme Included in income statement within: 2011
£m 2010
£m
Current service cost Administration expenses 0.2 0.3
Curtailment gain Administration expenses (0.6) –
Interest cost Interest payable 0.7 0.7
Expected return on the Scheme’s assets Interest payable (0.9) (0.7)
(0.6) 0.3
Amounts recognised in the statement of other comprehensive income 2011
£m 2010
£m
Actuarial loss/(gain) on defined benefit scheme 1.4 (1.4)
Cumulative actuarial loss on defined benefit scheme 3.5 2.1
Whilst the actuarial gains and losses in respect of the Scheme are dealt with in the statement of other comprehensive income, the difference between the notional interest cost on the Scheme’s liabilities and the expected return on the Scheme’s assets is included in the Group’s net interest cost.
For the year ended 31 December 2011 this amounts to a credit of £0.2 million (2010 – nil). Of the current service cost for the year, £0.2 million (2010 – £0.3 million) has been included in administration expenses.

111 www.capitalandcounties.com
ou
r busin
ess perform
an
ce
Ho
w w
e go
vern o
ur bu
siness
ou
r fina
nc
ial statem
ents
un
dersta
nd
ing
ou
r busin
ess
39 PENSIONS CONTINUED
Amounts recognised in the consolidated balance sheet 2011
£m 2010
£m
Fair value of Scheme’s assets 15.1 11.4
Present value of Scheme’s liabilities (14.1) (13.4)
Gain/(deficit) in the Scheme 1.0 (2.0)
Related deferred tax asset 0.8 0.6
Net pension asset/(liability) 1.8 (1.4)
Movements in the fair value of Scheme’s assets 2011
£m2010
£m
At 1 January 11.4 10.0
Expected return on Scheme’s assets 0.9 0.7
Actuarial (losses)/ gains (0.8) 0.6
Employer contributions paid 3.8 0.2
Member contributions paid 0.1 0.1
15.4 11.6
Benefits paid (0.3) (0.2)
Scheme’s assets at 31 December 15.1 11.4
The weighted average asset allocations for the year end were as follows:
Asset category: 2011
%2010
%
Equities 70 79
Index-linked gilts 12 9
Corporate bonds 17 12
Cash 1 –
Total 100 100
Movements in the fair value of Scheme’s liabilities 2011
£m2010
£m
At 1 January 13.4 13.4
Current service cost 0.3 0.3
Interest cost 0.7 0.7
Past service cost – –
Curtailment gain (0.6) –
Actuarial loss/ (gain) 0.6 (0.8)
14.4 13.6
Benefits paid (0.3) (0.2)
Scheme’s liabilities at 31 December 14.1 13.4

our financial statements
112
NOTES TO THE ACCOUNTS CONTINUED
39 PENSIONS CONTINUED The main economic assumptions used to calculate the present value of the Scheme’s liabilities at 31 December were as follows:
2011 %
(per annum)
2010%
(per annum)
Discount rate 4.70 5.40
Rate of inflation (based on RPI) 2.70 3.20
Earnings increases 4.20 4.70
Increases to pensions in payment (LPI 5%) 2.70 3.20
Increases to deferred pensions before payment 2.70 3.20
Expected return on Scheme’s assets 6.10 6.90
2011
£m 2010
£m
Actual return on Scheme’s assets in the year 1.4 1.3
Mortality assumptions are based on standard tables provided by the Institute of Actuaries using insurance company data updated from time to time to reflect current trends. The standard tables used by the Scheme in both the current and comparative periods are the SI PXA (Year of Birth), CMI (1.25%). The table makes allowance for future improvements in longevity based on the year of birth of each member.
2011 2010
The mortality assumptions used in this valuation were:
Life expectancy at age 65 (current age 45) – Male 88.8 88.8
Female 91.0 91.0
Life expectancy at age 65 (current age 65) – Male 86.9 86.9
Female 89.0 89.0
To develop the expected long-term rate of return on assets assumption for the Scheme, the company considered the current level of expected returns on risk-free investments (primarily government bonds), the historical level of the risk premium associated with the other asset classes in which the portfolio is invested and the expectations for future returns of each asset class. The expected annual return for each asset class was then weighted based on the target asset allocation to develop the expected long-term rate of return on assets assumption for the portfolio.
This resulted in the selection of the 4.7 per cent assumption as at 31 December 2011 (2010 – 5.4 per cent).
History of experience gains and losses for the year to 31 December:
2011 2010 2009 2008 2007
Present value of Scheme’s liabilities (£m) (14.1) (13.4) (13.4) (10.8) (11.2)
Fair value of Scheme’s assets (£m) 15.1 11.4 10.0 8.0 10.1
Surplus/(deficit) 1.0 (2.0) (3.4) (2.8) (1.1)
Experience adjustment on Scheme liabilities 0.1 0.3 0.1 (0.1) 0.2
Changes in assumptions used to value Scheme liabilities (0.6) 0.4 (1.9) 1.4 (1.0)
Experience adjustment on Scheme liabilities/assets (0.8) 0.6 1.3 (3.1) (0.1)
The Group has no significant exposure to any other post-retirement benefit obligations.
The estimated contribution expected to be paid to the Scheme during 2012 is nil.
(ii) Defined contribution arrangements The pension charge in respect of other schemes is the actual contributions paid. These amounted to £0.5 million (2010 – £0.5 million).

113 www.capitalandcounties.com
ou
r busin
ess perform
an
ce
Ho
w w
e go
vern o
ur bu
siness
ou
r fina
nc
ial statem
ents
un
dersta
nd
ing
ou
r busin
ess
40 EVENTS AFTER THE REPORTING PERIOD On 5 January 2012, the Group prepaid £5 million (our share) on the debt facility secured over the Empress State Building, incurring swap termination charges of £0.3 million.
On 9 February 2012, the Group disposed of its investment in The Brewery by EC&O Limited. Consideration of £2 million was deferred for a period not exceeding 10 years with minimum payments of £0.2 million per year. The net asset value of The Brewery by EC&O Limited at the date of disposal was £0.4 million.
On 17 February 2012 the Council for the London Borough of Hammersmith & Fulham resolved to grant detailed planning permission for the Group’s plans to redevelop the Seagrave Road car park in Earls Court, West London. Completion of the conditional joint venture with the Kwok Family Interests is expected to conclude upon expiry of the three month statutory period which follows finalisation of the Section 106 agreement.
Since 31 December 2011, The Great Capital Partnership has sold further non-core properties, raising total proceeds of £54 million (£27 million Capco’s share). The market value of these properties as at 31 December 2011 was £42.5 million.
On 29 February 2012, The Great Capital Partnership announced it had exchanged contracts to sell £150 million (£75 million Capco’s share) of properties to Great Portland Estates plc subject to Crown and banking consent. The market value of these properties as at 31 December 2011 was £142.4 million.
41 DIRECTORS’ INTERESTS (a) In shares in Capital & Counties Properties Group companies As at 31 December 2011 the number of ordinary shares of the Company in which the Directors were beneficially interested were:
2011 2010
Chairman:
I.C. Durant 290,230 290,230
Executive:
I.D. Hawksworth 479,069 284,621
S. Das 136,346 105,000
G.J. Yardley 427,972 240,160
Non-Executive:
I.J. Henderson 37,601 12,601
G.J. Gordon 30,450,061 2,305,268
A.J.M. Huntley 75,000 50,000
A.D. Strang – –
H.E. Staunton 150,000 50,000
Former Director D.A. Fischel 549,3221 549,322
1 Beneficial interest held at date of resignation 4 February 2012.
(b) Share dealings No Director had any dealings in the shares of any Group company between 31 December 2011 and 29 February 2012, being a date less than one month prior to the date of the notice convening the Annual General Meeting.
Other than as disclosed in these accounts, no Director of the Company had a material interest in any contract (other than service contracts), transaction or arrangement with any Group company during the year ended 31 December 2011.
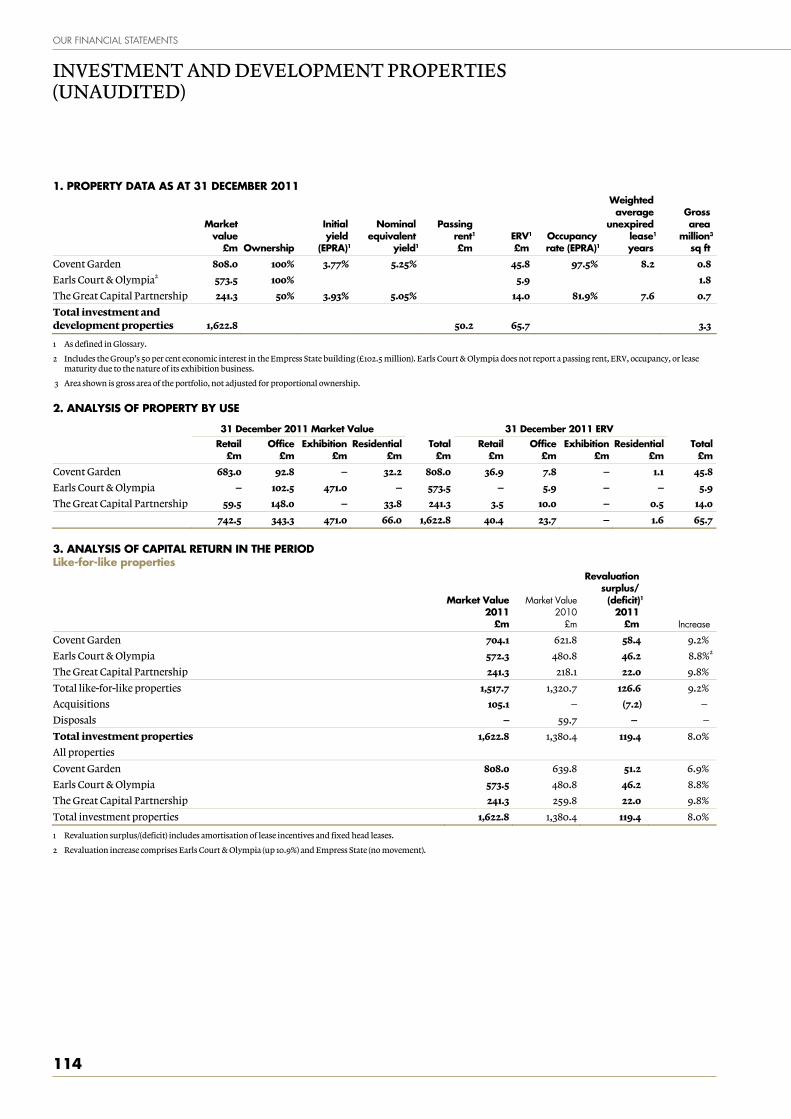
our financial statements
114
INVESTMENT AND DEVELOPMENT PROPERTIES (UNAUDITED)
1. PROPERTY DATA AS AT 31 DECEMBER 2011
Market value
£m Ownership
Initial yield
(EPRA)1
Nominal equivalent
yield1
Passing rent1
£m ERV1
£m Occupancy rate (EPRA)1
Weighted average
unexpired lease1
years
Gross area
million3
sq ft
Covent Garden 808.0 100% 3.77% 5.25% 45.8 97.5% 8.2 0.8
Earls Court & Olympia2 573.5 100% 5.9 1.8
The Great Capital Partnership 241.3 50% 3.93% 5.05% 14.0 81.9% 7.6 0.7
Total investment and development properties 1,622.8 50.2 65.7 3.3
1 As defined in Glossary.
2 Includes the Group’s 50 per cent economic interest in the Empress State building (£102.5 million). Earls Court & Olympia does not report a passing rent, ERV, occupancy, or lease maturity due to the nature of its exhibition business.
3 Area shown is gross area of the portfolio, not adjusted for proportional ownership.
2. ANALYSIS OF PROPERTY BY USE
31 December 2011 Market Value 31 December 2011 ERV
Retail
£mOffice
£m Exhibition
£mResidential
£mTotal
£mRetail
£mOffice
£mExhibition
£m Residential
£mTotal
£m
Covent Garden 683.0 92.8 – 32.2 808.0 36.9 7.8 – 1.1 45.8
Earls Court & Olympia – 102.5 471.0 – 573.5 – 5.9 – – 5.9
The Great Capital Partnership 59.5 148.0 – 33.8 241.3 3.5 10.0 – 0.5 14.0
742.5 343.3 471.0 66.0 1,622.8 40.4 23.7 – 1.6 65.7
3. ANALYSIS OF CAPITAL RETURN IN THE PERIOD Like-for-like properties
Market Value 2011
£m
Market Value 2010
£m
Revaluation surplus/ (deficit)1
2011 £m Increase
Covent Garden 704.1 621.8 58.4 9.2%
Earls Court & Olympia 572.3 480.8 46.2 8.8%2
The Great Capital Partnership 241.3 218.1 22.0 9.8%
Total like-for-like properties 1,517.7 1,320.7 126.6 9.2%
Acquisitions 105.1 – (7.2) –
Disposals – 59.7 – –
Total investment properties 1,622.8 1,380.4 119.4 8.0%
All properties
Covent Garden 808.0 639.8 51.2 6.9%
Earls Court & Olympia 573.5 480.8 46.2 8.8%
The Great Capital Partnership 241.3 259.8 22.0 9.8%
Total investment properties 1,622.8 1,380.4 119.4 8.0%
1 Revaluation surplus/(deficit) includes amortisation of lease incentives and fixed head leases.
2 Revaluation increase comprises Earls Court & Olympia (up 10.9%) and Empress State (no movement).

115 www.capitalandcounties.com
ou
r busin
ess perform
an
ce
Ho
w w
e go
vern o
ur bu
siness
ou
r fina
nc
ial statem
ents
un
dersta
nd
ing
ou
r busin
ess
4. ANALYSIS OF INCOME IN THE PERIOD Like-for-like properties
2011 £m
2010£m Change
Covent Garden 25.7 24.4 5.3%
Earls Court & Olympia 30.1 29.2 3.1%
The Great Capital Partnership 10.1 10.9 (7.3)%
Like-for-like properties 65.9 64.5 2.2%
Acquisitions 2.0 – –
Disposals 0.9 4.5 –
Like-for-like capital 0.2 – –
Total investment properties 69.0 69.0 –
All properties
Covent Garden 27.8 25.7 8.2%
Earls Court & Olympia 30.2 29.1 3.8%
The Great Capital Partnership 11.0 13.6 (19.1)%
Other – 0.6 –
Total investment properties 69.0 69.0 –

our financial statements
116
CONSOLIDATED UNDERLYING PROFIT STATEMENT (UNAUDITED) FOR THE YEAR ENDED 31 DECEMBER 2011
2011
£m 2010
£m
Net rental income 69.0 69.0
Other income – 0.1
69.0 69.1
Administration expenses (22.2) (18.6)
Operating profit 46.8 50.5
Finance costs (36.5) (40.3)
Finance income 1.7 1.4
Net finance costs (34.8) (38.9)
Write down of trading property (0.1) (0.1)
Profit before tax 11.9 11.5
Tax on adjusted profit (2.4) (2.3)
Underlying earnings (used for calculation of underlying earnings per share) 9.5 9.2
Underlying earnings per share (pence) 1.4 1.5

117 www.capitalandcounties.com
ou
r busin
ess perform
an
ce
Ho
w w
e go
vern o
ur bu
siness
ou
r fina
nc
ial statem
ents
un
dersta
nd
ing
ou
r busin
ess
THE DEMERGER
Introduction The Capital & Counties Properties PLC Group (“the Group”) demerged from its former parent company, Liberty International PLC (subsequently renamed Capital Shopping Centres Group PLC), with effect from 7 May 2010. Capital & Counties Properties PLC has a premium listing on the official list of the UKLA, and a secondary listing on the JSE Limited. Shares in Capital & Counties Properties PLC were admitted to dealings on the London and Johannesburg Stock Exchanges in May 2010.
2010 historic financial information The demerger documents and pro forma information were prepared (as is required in such situations) to illustrate the Group’s financial performance and its position as if the demerged Group and capital structure had existed at 1 January 2010. On such pro forma basis, taking into account a cash transfer from Liberty International of £244 million, the Group’s net assets as at 1 January 2010 were £731 million. This represented an adjusted pro forma net asset value per share of 127 pence.
Capital structure On demerger the Group’s parent company Capital & Counties Properties PLC issued 621.8 million 80 pence ordinary shares to the former Liberty International shareholders, on a one-for-one basis, who were registered holders of ordinary shares at close on 7 May 2010.
As consideration, stock transfer certificates pertaining to the Group’s now subsidiary undertakings were registered in the name of Capital & Counties Properties PLC. Shares issued in consideration for investments in subsidiary undertakings represent a share-for-share exchange under S612 of the Companies Act 2006. Qualifying for relief under S612 sheltered the Group from recognising share premium on the difference between the nominal value of the shares issued and the fair value of the assets received with this premium instead being taken to a Merger Reserve. In addition, the Group assumed all intragroup debt owed by its now subsidiary undertakings to Liberty International. Shares attributed to these assets did not qualify for relief therefore the difference between the nominal value of shares issued and the fair value of the assets received was credited to the Company’s Share Premium Reserve.
Upon demerger a number of reserves were realised and pro forma adjustments, which had been made for comparability as discussed above, were then reversed.
Finally, on 18 May 2010 a capital reduction became effective. The reduction in capital was effected by reducing the nominal value of each ordinary share on issue from 80 pence per share to 25 pence per share, creating distributable reserves for the Company and reducing its capital account by £342 million.
2010 demerger share values
Base cost of post-demerger shares for UK capital gains tax purposes UK tax resident shareholders should read Part (A) of Part VI of the Liberty International PLC Circular dated 12 March 2010 (pages 55 to 56 inclusive) in full. Shareholders who are in any doubt about their tax position or how to use the share values in this circular should consult their own professional tax advisers.
Following the demerger, UK shareholders will need to apportion the base cost for UK capital gains tax purposes of their pre-demerger Liberty International PLC shares between their post-demerger Capital & Counties Properties PLC shares and their post-demerger Capital Shopping Centres Group PLC shares. The apportionment is made by reference to the value of Capital & Counties Properties PLC and Capital Shopping Centres Group PLC shares on 10 May 2010 (in accordance with the provisions of Section 272 of the Taxation and Chargeable Gains Act 1992), and so the base cost will be split Capital & Counties Properties PLC 25.7198% and Capital Shopping Centres Group PLC 74.2802%.
The share prices on the London Stock Exchange on 10 May 2010 being the relevant date were: Capital & Counties Properties PLC 119.25 pence; and Capital Shopping Centres Group PLC 344.40 pence.
South African capital gains tax on demerger South African tax resident shareholders should read Part (B) of Part VI of the Liberty International PLC Circular dated 12 March 2010 (pages 57 to 58 inclusive) in full. Shareholders who are in any doubt about their tax position or how to use the share values in this announcement should consult their own professional tax advisers.
For shareholders who hold their shares on capital account, on 10 May 2010, there will be a part disposal for South African capital gains tax purposes of the South African shareholders’ pre-demerger Liberty International PLC shares.
A South African shareholder’s capital gain or loss on this part disposal is calculated as proceeds from the issue of shares by Capital & Counties Properties PLC, less a proportion of the capital gains tax base cost of the Liberty International PLC ordinary shares held by them. Proceeds for the part disposal will be calculated as the opening share price of Capital & Counties Properties PLC on 10 May 2010 multiplied by the number of shares issued (in accordance with the provisions of paragraph 76A of the Eighth Schedule to the Income Tax Act, Act 58 of 1962, as amended). The amount of the capital gains tax base cost of the Liberty International PLC shares which is apportioned to the part disposal will be calculated by taking account of the opening share price of Capital & Counties Properties PLC on 10 May 2010 as a proportion of the value of the closing share price of Liberty International PLC shares on 7 May 2010.
The relevant prices on the Johannesburg Stock Exchange were: Liberty International PLC Rand 51.50 on 7 May 2010; and Capital & Counties Properties PLC Rand 14.35 on 10 May 2010.
The information contained above is correct to the best knowledge and belief of Capital & Counties Properties PLC but does not constitute tax advice. Capital & Counties Properties PLC does not accept any liability which may arise from use of the information contained above. Each shareholder is solely responsible for the information he or she provides to tax authorities and other official bodies. If uncertain, shareholders (including shareholders outside the United Kingdom and South Africa) should consult their own appropriate professional adviser.

our financial statements
118
FINANCIAL COVENANTS
Financial covenants on non-recourse debt excluding joint ventures
Maturity
Loan outstanding at
31 January 20121
£m LTV
covenant
Loan to 31 December
2011 Market Value2
Interest cover
covenant
Interest cover3
reported
EC&O Venues6 2013 94.3 N/A N/A 150% 214%
Covent Garden London5, 7 2016 150.0 70% 36% 130% 212%
Covent Garden London5, 8 2017 112.0 70% 45% 120% 165%
Total 356.3
Financial covenants on joint venture non-recourse debt
Maturity
Loan outstanding
at 31 January 20121, 4
£m LTV
covenant
Loan to 31 December
2011 Market Value2
Interest cover
covenant
Interest cover3
reported
The Empress State Partnership9 2013 69.2 N/A N/A 120% 148%
The Great Capital Partnership10 2013 112.5 70% 47% 120% 132%
Total 181.7
1 The loan values are the actual principal balances outstanding at 31 January 2012, which take into account any principal repayments made in January 2012. The balance sheet value of the loans includes any unamortised fees.
2 The loan to 31 December 2011 Market Value provides an indication of the impact of the 31 December 2011 property valuations on the LTV covenants. The actual timing and manner of testing LTV covenants varies and is loan specific.
3 Based on latest certified figures, calculated in accordance with loan agreements, which have been submitted between 31 December 2011 and 31 January 2012. The calculations are loan specific and include a variety of historic, forecast and in certain instances a combined historic and forecast basis.
4 50 per cent of the debt is shown which is consistent with accounting treatment and the Group’s economic interest.
5 There are two separate loans on the Covent Garden properties.
6 Loan facility provided by Irish Bank Resolution Corporation Limited.
7 Loan facility provided by a consortium of six banks with BNP Paribas acting as agent.
8 Loan facility provided by NyKredit Realkredit A/s.
9 Loan facility provided by a consortium of three banks with Eurohypo AG acting as agent. LTV covenant removed until maturity.
10 Loan facility provided by a consortium of four banks with Eurohypo AG acting as agent.

119 www.capitalandcounties.com
ou
r busin
ess perform
an
ce
Ho
w w
e go
vern o
ur bu
siness
ou
r fina
nc
ial statem
ents
un
dersta
nd
ing
ou
r busin
ess
HISTORICAL RECORD
Income Statement 2011 2010 2009Pro Forma
2009
Net rental income 69.0 69.0 78.1 79.2
Other income 0.8 0.1 1.5 1.5
Gain/(loss) on revaluation and sale of investment and development property 123.3 134.6 (128.8) (140.7)
Non-recurring income/(costs) 26.2 (6.3) (8.5) (12.4)
Administration expenses (22.2) (18.6) (14.5) (18.5)
Operating profit/(loss) 197.1 178.8 (72.2) (90.9)
Net finance costs (35.2) (46.3) (77.8) (36.1)
Profit/(loss) before tax 161.9 132.5 (150.0) (127.0)
Taxation (8.2) (0.9) (1.1) (1.4)
Non-controlling interests – – 19.6 19.6
Profit/(loss) for the year 153.7 131.6 (131.5) (108.8)
Balance Sheet
Investment & development property 1,616.8 1,377.6 1,240.5 1,240.5
Other non-current assets 56.3 79.7 61.5 61.5
Cash and cash equivalents 89.6 188.5 19.3 263.3
Other current assets 27.5 27.1 22.4 22.4
Total assets 1,790.2 1,672.9 1,343.7 1,587.7
Non-current borrowings (534.6) (651.5) (655.4) (655.4)
Other non-current liabilities (41.7) (59.2) (64.5) (9.5)
Current borrowings (18.7) (13.1) (71.0) (71.0)
Other current liabilities (92.1) (65.7) (460.1) (120.9)
Total liabilities (687.1) (789.5) (1,251.0) (856.8)
Net assets 1,103.1 883.4 92.7 730.9
Basic earnings per share (pence) 23.2 21.2 (21.1) (17.5)
Underlying earnings per share (pence) 1.4 1.5 2.4 2.0
Basic net assets per share (pence) 161.3 142.1 14.9 117.5
EPRA adjusted, diluted NAV (pence) 165.8 148.4 24.6 127.0
Dividend per share (pence) 1.5 1.5 N/A N/A

our financial statements
120
BOARD AND ADVISERS
Chairman Ian Durant
Executive Directors Ian Hawksworth, Chief Executive Soumen Das, Finance Director Gary Yardley, Investment Director
Non-executive Directors Ian Henderson (Deputy Chairman and Senior Independent Director) Graeme Gordon Andrew Huntley Henry Staunton Andrew Strang
Company Secretary Ruth Pavey
Registered Office 15 Grosvenor Street London W1K 4QZ Telephone: 020 3214 9150 Fax: 020 3214 9151
Registered Number 7145051
Websites: www.capitalandcounties.com
www.myearlscourt.com
www.eco.co.uk
www.coventgardenlondonuk.com
www.coventgardenliving.com
Auditors PricewaterhouseCoopers LLP
Solicitors Linklaters LLP Webber Wentzel (South Africa)
Brokers and Financial Advisers Bank of America Merrill Lynch Rothschild UBS Limited
SA Sponsor Merrill Lynch South Africa (Pty) Limited

121 www.capitalandcounties.com
ou
r busin
ess perform
an
ce
Ho
w w
e go
vern o
ur bu
siness
ou
r fina
nc
ial statem
ents
un
dersta
nd
ing
ou
r busin
ess
DIVIDENDS
The Directors of Capital & Counties Properties PLC have proposed a final dividend per ordinary share (ISIN GB00B62G9D36) of 1.0 pence payable on 21 June 2012.
Dates The following are the salient dates for payment of the proposed final dividend:
Sterling/Rand exchange rate struck: 2 May 2012
Sterling/Rand exchange rate and dividend amount in Rand announced: 3 May 2012
Ordinary shares listed ex-dividend on the JSE, Johannesburg: 14 May 2012
Ordinary shares listed ex-dividend on the London Stock Exchange: 16 May 2012
Record date for final dividend in UK and South Africa: 18 May 2012
Dividend payment date for shareholders: 21 June 2012
South African shareholders should note that, in accordance with the requirements of Strate, the last day to trade cum-dividend will be 11 May 2012 and that no dematerialisation of shares will be possible from 14 May to 18 May 2012 inclusive. No transfers between the UK and South Africa registers may take place from 2 May to 18 May 2012 inclusive.
Subject to approval at the Company’s Annual General Meeting, the Board intends to offer an optional scrip dividend scheme which will apply to the 2011 final dividend.
The above dates are proposed and subject to change.

our financial statements
122
GLOSSARY
Capco Capco represents Capital & Counties Properties PLC (also referred to as “the Company”) and all its subsidiary companies, together referred to as “the Group”.
Capital Shopping Centres Group or CSC Capital Shopping Centres Group represents Capital Shopping Centres Group PLC (formerly Liberty International PLC) and all its subsidiary companies.
Diluted figures Reported amounts adjusted to include the effects of potential shares issuable under employee incentive arrangements.
ECOA The Earls Court and West Kensington Opportunity Area.
EPRA European Public Real Estate Association, the publisher of Best Practice Recommendations intended to make financial statements of public real estate companies in Europe clearer, more transparent and comparable.
EPRA adjusted, diluted NAV The net assets as at the end of the year including the excess of the fair value of trading property over its cost and excluding the fair value of financial instruments, deferred taxation on revaluations and diluting for the effect of those shares potentially issuable under employee share schemes divided by the diluted number of shares at year end.
EPRA adjusted, diluted NNNAV EPRA diluted NAV adjusted to reflect the fair value of derivatives and to include deferred taxation on revaluations.
EPRA adjusted earnings per share Profit for the year excluding gains or losses on the revaluation and sale of investment and development property, write down on trading property, changes in fair value of financial instruments and associated close-out costs and the related taxation on these items divided by the weighted average number of shares in issue during the period.
ERV (estimated rental value) The external valuers’ estimate of the Group’s share of the current annual market rent of all lettable space net of any non-recoverable charges, before bad debt provision and adjustments required by International Financial Reporting Standards regarding tenant lease incentives.
GPE Great Portland Estates plc. The Group’s joint venture partner in The Great Capital Partnership.
Gross income The Group’s share of passing rent plus sundry non-leased income.
Interest cover ratio (ICR) Net rental income less administration costs divided by the net finance cost excluding the change in fair value of derivatives and any exceptional finance costs.
Interest rate swap A derivative financial instrument enabling parties to exchange interest rate obligations for a predetermined period. These are used by the Group to convert floating rate debt to fixed rates.
Initial yield (EPRA) Annualised net rent (after deduction of revenue costs such as head rent, running void, service charge after shortfalls and empty rates) on investment properties expressed as a percentage of the gross market value before deduction of theoretical acquisition costs, consistent with EPRA’s net initial yield.
IPD Investment Property Databank Ltd, producer of an independent benchmark of property returns.
ITZA In Terms of Zone A. ITZA is a method of calculating the floor area of a retail unit with relation to the frontage and first 20 feet/6.1 metres of depth and the value relating to that floor area.
Kwok Family Interests Conditional joint venture partner and major shareholder in a large listed Hong Kong real estate developer.
LBHF The London Borough of Hammersmith & Fulham.
Liberty International Liberty International represents Liberty International PLC (subsequently renamed Capital Shopping Centres Group PLC) and all its subsidiary companies.
LIBOR London Interbank Offer Rate
Like-for-like properties Investment properties which have been owned throughout both periods without significant capital expenditure in either period, so income can be compared on a like-for-like basis. For the purposes of comparison of capital values, this will also include assets owned at the previous balance sheet date but not necessarily throughout the prior period.
Loan-to-value (LTV) LTV is the ratio of attributable debt to the market value of an investment property.
Net rental income The Group’s share of gross rental income less ground rents, payable service charge expenses and other non-recoverable charges, having taken due account of bad debt provisions and adjustments to comply with International Financial Reporting Standards regarding tenant lease incentives.
Nominal equivalent yield Effective annual yield to a purchaser on the gross market value, assuming rent is receivable annually in arrears, and that the property becomes fully occupied and that all rents revert to the current market level (ERV) at the next review date or lease expiry.
Occupancy rate (EPRA) The ERV of let and under offer units expressed as a percentage of the ERV of let and under offer units plus ERV of un-let units, excluding units under development.
Passing rent The Group’s share of contracted annual rents receivable at the balance sheet date. This takes no account of accounting adjustments made in respect of rent-free periods or tenant incentives, the reclassification of certain lease payments as finance charges or any irrecoverable costs and expenses, and does not include excess turnover rent, additional rent in respect of unsettled rent reviews or sundry income such as from car parks etc. Contracted annual rents in respect of tenants in administration are excluded.
Pro forma The pro forma basis as outlined on page 140 of the Group’s prospectus dated 12 March 2010.
REIT Real Estate Investment Trust.

123 www.capitalandcounties.com
ou
r busin
ess perform
an
ce
Ho
w w
e go
vern o
ur bu
siness
ou
r fina
nc
ial statem
ents
un
dersta
nd
ing
ou
r busin
ess
Section 34A Housing Act 1985 An amendment to the 1985 Act to enable tenants to take control of the management of their properties. The amendment establishes a procedure enabling an organised group of tenants to require a local authority to transfer their homes to a housing association or similar body registered with the Tenant Services Authority (the social housing regulator). Tenants may form such a body and seek the transfer of the property to that body. The legislation only applies to social rented tenants of local authorities. It does not apply to tenants of housing associations even where the ultimate owner may be a local authority. Section 34A requires implementation by regulations yet to come into effect. These regulations will be enacted by the Department of Communities and Local Government. No regulations have yet been made.
Tenant (or lease) incentives Any incentives offered to occupiers to enter into a lease. Typically incentives are in the form of an initial rent-free period and/or a cash contribution to fit-out the premises. Under International Financial Reporting Standards the value of incentives granted to tenants is amortised through the income statement on a straight-line basis over the lease term.
Total property return Capital growth including gains and losses on disposals plus rent received less associated costs, including ground rent.
Total return The growth in EPRA adjusted, diluted NAV per share plus dividends per share during the period.
Total shareholder return The increase in the price of an ordinary share plus dividends during the period assuming re-investment in ordinary shares.
Underlying profit Profit for the year excluding impairment charges, net valuation gains/losses (including profits/losses on disposals), net refinancing charges and swap termination costs.
Weighted average unexpired lease term The unexpired lease term to lease expiry weighted by ERV for each lease.

our financial statements
124
SHAREHOLDER INFORMATION
Registrars All enquiries concerning shares or shareholdings, including notification of change of address, queries regarding loss of a share certificate and dividend payments should be addressed to:
For shareholders registered in the UK: Capita Registrars The Registry, 34 Beckenham Road, Beckenham, Kent, BR3 4TU Telephone: 0871 664 0300 (calls cost 10p per minute plus network extras; lines are open 8.30 am – 5.30 pm Monday – Friday) Telephone outside UK: +44 (0)20 8639 3399 (outside UK) Fax: 020 8639 2342 Email: [email protected] www.capitaregistrars.com
For shareholders registered in South Africa: Computershare Investor Services (Pty) Ltd 70 Marshall Street, Johannesburg, 2001, South Africa Postal address: PO Box 61051, Marshalltown, 2107, South Africa Telephone: +27 86 110 0933 Fax: +27 11 688 5217 www.computershare.com
Payment of dividends If you are a shareholder and wish to have your dividends paid directly into a bank or building society, please complete a mandate form which is available from the appropriate registrar.
Share price information The latest information on the Capital & Counties Properties PLC share price is available on the Company’s website www.capitalandcounties.com. The shares are traded on the LSE with LSE code CAPC, ISIN GBOOB62G9D36. The shares are traded on the JSE under the abbreviated name CAPCO and JSE code CCO.
Web-based enquiry service for shareholders Shareholders registered in the UK can register at www.capitashareportal.com to access a range of online services including:
– Online proxy voting
– Electing to receive shareholder communications electronically
– Viewing your holding balance, indicative share price and valuation
– Viewing any transaction on your holding including any dividend payments you have received
– Updating your address details or registering a bank mandate to have your dividends paid directly to your bank account
– Accessing a wide range of shareholder information, including downloadable forms.
To register to use this service, you will need your investor code (IVC), which can be found on your share certificate(s).
Share dealing services The Company’s shares can be traded through most banks, building societies and stockbrokers. Additionally, UK shareholders may trade their shares using the online and telephone dealing service that Capita Registrars provide. To use this service, shareholders should contact Capita: within the UK 0871 664 0364 (calls cost 10p per minute plus network extras; lines are open 8.30 am – 5.30 pm Monday to Friday); from Ireland: 1 890 946 375; or from outside UK: +44 20 3367 2686 or you can log on to www.capitadeal.com.
Electronic communication In December 2011, letters were sent to shareholders currently receiving hard copies of communications requesting that they opt-in to continue receiving hard copies of communications, and would otherwise be defaulted to electronic communications.
All of the Group’s annual results, interim results and interim management statements will be published on the Company’s website www.capitalandcounties.com. If you are a shareholder and wish to elect to receive electronic communications, please contact the appropriate registrar.
Shareholders who wish to receive hard copies of shareholder information may revoke a previous instruction to receive electronic communications at any time.
ShareGift ShareGift is a charity share donation scheme for shareholders who may wish to dispose of a small quantity of shares where the market value makes it uneconomical to sell on a commission basis. Further information can be found on its website www.sharegift.org or by calling them on 020 7930 3737.
Boiler room scams In recent years, many companies have become aware that their shareholders have received unsolicited phone calls or correspondence concerning investment matters.
These are typically from overseas based ‘brokers’ who target UK shareholders, offering to sell them what often turn out to be worthless or high risk shares in US or UK investments. These operations are commonly known as ‘boiler rooms’. These ‘brokers’ can be very persistent and extremely persuasive, and a 2006 survey by the Financial Services Authority (FSA) has reported that the average amount lost by investors is around £20,000.
It is not just the novice investor that has been duped in this way; many of the victims had been successfully investing for several years. Shareholders are advised to be wary of any unsolicited advice, offers to buy shares at a discount or offers of free company reports. If you receive any unsolicited investment advice:
– Make sure you get the correct name of the person and organisation
– Check that they are properly authorised by the FSA before getting involved by visiting www.fsa.gov.uk/register/
– Do not provide any personal details to callers e.g. bank details or full address.
– If they are not properly authorised, report the matter to the FSA either by calling 0300 500 5000 or visiting www.moneymadeclear.fsa.gov.uk
– If the calls persist, hang up.
The FSA advise that, if it sounds too good to be true, it probably is.
If you deal with an unauthorised firm, you will not be eligible to receive payment under the Financial Services Compensation Scheme. The FSA can be contacted by completing an online form at www.fsa.gov.uk/pages/doing/regulated/law/alerts/overseas.shtml
Details of any share dealing facilities that the Company endorses will be included in Company mailings.
More detailed information on this or similar activity can be found on the CFEB website www.moneymadeclear.fsa.gov.uk.

Printed by Park Communications on FSC® certified paper.Park is an EMAS certified CarbonNeutral ® Company and its Environmental Management System is certified to ISO14001.100% of the inks used are vegetable oil based, 95% of press chemicals are recycled for further use and, on average 99% of any waste associated with this production will be recycled.This document is printed on Heaven 42 and Munken Polar; both papers contain 100% virgin fibre sourced from well-managed, sustainable, FSC certified forests. The pulp is bleached using both elemental chlorine free (ECF) and totally chlorine free (TCF) processes.Design and production by Black Sun Plc www.blacksunplc.com

Cap
ital & C
oun
ties Properties P
LC A
nnual Report & A
ccounts 2011
Capital & Counties Properties PLC 15 Grosvenor Street, London W1K 4QZ Telephone +44 (0)20 3214 9150 [email protected] www.capitalandcounties.com